Post Syndicated from LastWeekTonight original https://www.youtube.com/shorts/ipjz8u0QwAA
Beyond the Score: Using AI to Translate CVEs into Real-World Business Risk
Post Syndicated from Rapid7 original https://www.rapid7.com/blog/post/ai-beyond-the-score-translating-cves-into-real-business-risk
Security leaders rarely struggle to gather data, but they often struggle to turn that data into something clear and meaningful for the business. In a typical week, a CISO might receive a report listing hundreds or even thousands of vulnerabilities, most of them accompanied by CVSS scores that make the entire list look urgent, while also managing the wider set of operational, regulatory, and strategic demands that already come with the role.
That difficulty becomes more obvious when the same information has to be carried into the boardroom, where the questions are rarely about CVE IDs or exploit counts in isolation. What leadership wants to understand is whether the organization’s revenue, uptime, legal exposure, or broader resilience could be affected, and how quickly those risks need to be addressed.
This is where many security programs lose momentum, because the technical view of severity does not always line up neatly with the business view of consequence. Bridging that gap has traditionally been slow, manual work, which is one reason AI is starting to matter more in vulnerability management: it can help translate technical findings into business context that is clearer, faster to act on, and easier for leadership to understand.
Why CVSS alone does not reflect real-world business risk
For years, the industry has relied on CVSS as a quick way to judge urgency, and while the framework does account for factors such as attack vector, attack complexity, and other attack requirements, the score is still calculated in isolation and often misses the conditions that shape real risk inside an organization. A CVSS 9.8 vulnerability affecting a legacy printer in a segmented branch office may look critical on paper, but it is unlikely to carry the same business impact as a 7.5 vulnerability affecting an internet-facing database that holds sensitive customer data.
One of the long-standing weaknesses of static scoring is that it tells you how severe a flaw may be in theory, but not how much disruption it could cause in your own environment, how exposed the affected asset is, or how closely it is tied to a revenue-generating or business-critical process. That is where AI becomes more useful, because it can add the missing context that helps security teams judge not just how serious a vulnerability looks, but how much it matters in practice.
Machine learning models can now process a much broader set of inputs, including attacker activity, exploit availability, internal network topology, and the business value attached to the asset or process involved. Rather than leaving teams with a static queue of scores, that creates a live view of risk shaped by reachability, exposure, and business consequence, making it easier to separate technical severity from actual organizational risk.
How AI helps connect vulnerabilities to business impact
One of the more practical ways AI can improve vulnerability management is by helping security teams connect technical findings to the parts of the business they actually affect. A vulnerability tied to an obscure IP address may not mean much on its own, but the picture changes quickly when that asset is identified as part of a regional payment system, a customer-facing portal, or a supply chain application the business depends on. That kind of asset attribution has traditionally taken time, context, and manual investigation. AI can help shorten that process by linking technical findings to business function much more quickly.
Instead of relying only on severity scores or yesterday’s alerts, AI can weigh a broader set of signals, including exploit activity, attacker behavior, asset exposure, and internal topology, which gives security teams a more grounded way to judge where risk is most likely to become operationally significant. The benefit is not simply speed, but a clearer picture of which vulnerabilities are most likely to affect revenue, uptime, or business continuity if they are left unresolved.
At the leadership level, this same approach can help turn a large volume of technical output into something more usable. Rather than forcing CISOs to manually translate thousands of low-level alerts into board-facing language, AI can support that reporting by summarizing likely business impact, highlighting where exposure is growing, and making it easier to explain how remediation work is reducing financial and operational risk.
Two vulnerabilities, two very different business outcomes
To see how this plays out in practice, it helps to compare two vulnerabilities that might appear similarly urgent in a standard scanner, but look very different once business context is added.
Vulnerability A: The ghost in the machine
A scanner flags a CVSS 9.8 critical remote code execution flaw in an aging media server. On paper, that score suggests immediate attention. Once more context is added, the picture changes. The asset sits on a segmented guest Wi-Fi VLAN, has no path to the corporate core, and has not been linked to in-the-wild exploitation for more than two years. In practical terms, the business impact is low. The issue still needs to be addressed, but it is unlikely to justify urgent remediation ahead of higher-consequence exposures.
Vulnerability B: The quiet threat
-
A second finding carries a lower CVSS 7.2 high severity score, but affects a common web framework running on the organization’s primary customer portal. When AI correlates that vulnerability with asset and business context, the risk profile changes quickly. The portal is identified as a critical business process, estimated to support $250,000 in transactions per hour, while external signals point to growing exploit interest around the same framework. In that case, the business impact is far more serious. What looks like a lower-priority technical issue becomes a potential source of revenue disruption measured in millions per day.
This is where AI-assisted prioritization becomes useful. It helps teams move beyond the assumption that the highest score always deserves the fastest response and instead focus on the vulnerabilities most likely to create operational or financial harm. In practice, that means spending less time working through a queue in score order and more time reducing the exposures that matter most to the business.
How AI helps CISOs explain vulnerability risk in business terms
When security leaders can move beyond reporting how many patches were deployed and begin showing how exposure is changing in financial or operational terms, the conversation becomes much more useful. A reduction in mean time to remediate may matter to a security team, but it carries more weight at the leadership level when it is tied to a lower likelihood of downtime, reduced regulatory exposure, or less risk to a revenue-generating service.
When vulnerability data is tied to business context, it becomes easier to justify automation, tooling, or headcount based on their contribution to resilience, continuity, and measurable risk reduction, rather than on activity alone. At that level, the conversation is less about severity scores and more about what is exposed, what it could affect, and where action matters most.
One of the more practical benefits of AI is that it can help security teams explain risk in a way leadership can act on. Instead of adding another layer of technical output, it can support clearer reporting on why one issue matters more than another, what is most likely to affect the business, and where action should come first.
As attack surfaces expand and exploit timelines continue to shrink, the gap between technical findings and business understanding will only become harder to manage. Organizations that can connect those two views more effectively will be in a much stronger position to prioritize the right work, explain risk more clearly, and make vulnerability management a more meaningful part of business decision-making.
How Samsung achieved real-time pricing with AWS Lambda Response Streaming
Post Syndicated from Vijay Naik original https://aws.amazon.com/blogs/architecture/how-samsung-achieved-real-time-pricing-with-aws-lambda-response-streaming/
This post is co-authored with Sathish Kumar and Christopher Chan from Samsung ecommerce.
In high-traffic ecommerce, achieving real-time pricing is critical to prevent price inconsistency. Pricing inconsistency creates cart shock and erodes trust. This isn’t broken software, it’s a symptom of architectural latency that you can address using AWS Lambda Response Streaming and Amazon CloudFront for systems aggregating data from multiple backend sources.
In this post, we walk through the legacy architecture challenges, the stateless streaming solution, key implementation patterns, and performance results—a pattern you can apply if you’re building high-traffic APIs that aggregate data from multiple backend sources.
Samsung.com is Samsung’s primary direct-to-consumer channel, selling smartphones, TVs, appliances, and accessories, each with multiple variants, offers, and regional pricing. This complexity makes real-time price accuracy especially important.
Samsung’s All Deals and Product Finder pages showcase these products during high-traffic events like Black Friday. To maintain low latency for these high-density Product Listing Pages (PLPs) and comparison tables, the legacy infrastructure relied on asynchronous caching, which introduced a desynchronization gap where the cached price drifted from the authoritative pricing engine.
Problem: Legacy middleware caching created a 1-hour desynchronization gap between the authoritative pricing engine and customer-facing pages.
Our approach: We dismantled the stateful Data Aggregation (DA) architecture and built a real-time Bulk Arbitration Engine (a stateless orchestration layer that queries the Pricing Engine directly at request time) using AWS Lambda Response Streaming and Amazon CloudFront edge caching.
Challenge: The Data Aggregation trap
When product listing pages need to display pricing for over 30 item combinations simultaneously, the latency of calling the Pricing Engine for each item combination individually becomes untenable. To solve this, we built a backend for frontend (BFF) service to do a “Data Aggregation. This DA service was designed to decouple the frontend from the heavy Pricing Engine.
It relied on a scheduled Cron Worker that ran hourly to fetch the entire product catalog. The worker would then precompute prices for every possible permutation of products and store them in a local cache.
While this improved read speeds, it created two significant failures:
1. The Permutation Explosion – The DA service had to precompute every combination just in case a customer viewed it.
- The Math: 30 products × (Variants × Offers × Add-ons) = Thousands of records per page
- Storage Impact: Cache grew exponentially with each new product variant added
- Waste: Most precomputed combinations were never requested
2. The Synchronization Lag – Because the Cron job ran only once per hour, price changes (for example, flash sales) lagged significantly. Customers continued to see old prices until the next scheduled sync.
- Business Impact: Flash sales showed incorrect old pricing until the next run time
- Customer Trust: Cart shock when checkout price differed from product page price
- Competitive Disadvantage: Competitors with real-time pricing gained market share
Legacy Data Aggregation architecture
Architecture diagram showing the legacy Data Aggregation layer between the Pricing Engine and CloudFront CDN.
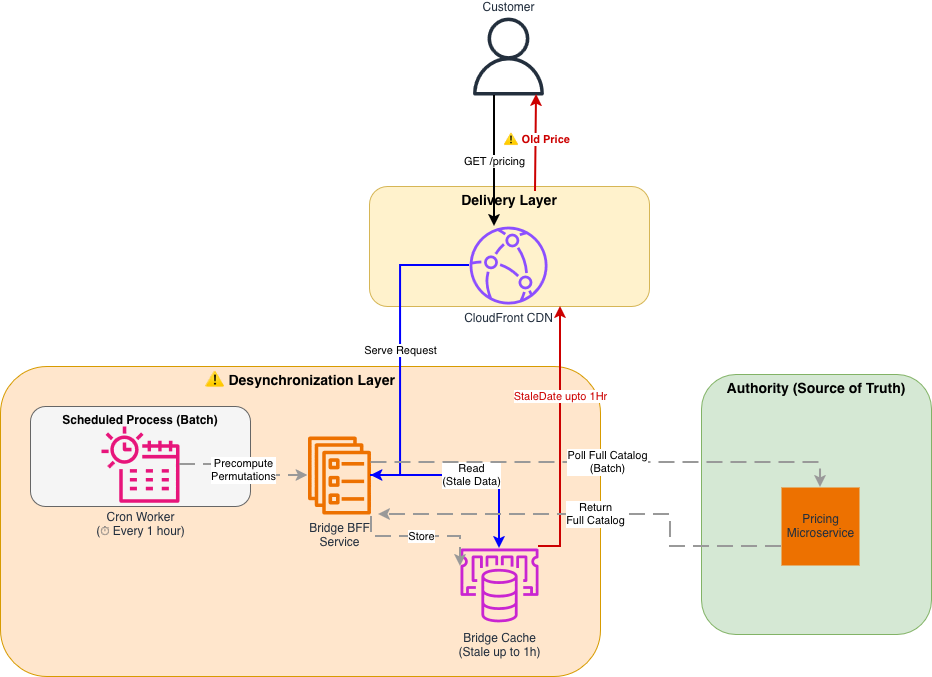
Figure 1: Legacy Data Aggregation (DA) Architecture The legacy system relied on a scheduled Cron job, creating a distinct “Desynchronization Layer” between the Authority (Pricing) and the Customer. Precomputation of all product permutations consumed significant storage and compute resources.
The solution: Stateless streaming architecture
Intermediate layers storing data will eventually diverge from the source, so we collaborated with our AWS Technical Account Manager (TAM) and service teams to architect a new solution: the Bulk Arbitration Engine, a stateless orchestration layer that queries the Pricing Engine directly at request time.
The new architecture follows a Pass-Through pattern:
1. Client Request: The browser requests prices for 30 specific SKUs using a single HTTP GET request.
2. Streaming Orchestration: An AWS Lambda function fans out these 30 requests to the Pricing Engine in parallel.
3. Immediate Response: As the Pricing Engine returns data, the Lambda streams it immediately to the client without buffering.
Why Lambda Response Streaming?
We evaluated several alternatives before settling on this approach:
- Traditional request-response pattern (buffered) – A standard Lambda invocation buffers the full response before returning it to the client, which negates the latency benefit of parallel fan-out. For 30 concurrent SKU lookups, this added seconds of wait time.
- EC2 with improved caching – This was the legacy approach. Caching layers will eventually drift from the source of truth, which was the core problem we needed to solve.
- Lambda Response Streaming – This was the only option that let us fan out requests in parallel, stream results as they arrived (reducing time-to-first-byte), and remain fully stateless with no intermediate cache to maintain or invalidate.
New stateless streaming architecture

Architecture diagram showing the stateless streaming solution with CloudFront connected directly to Lambda.
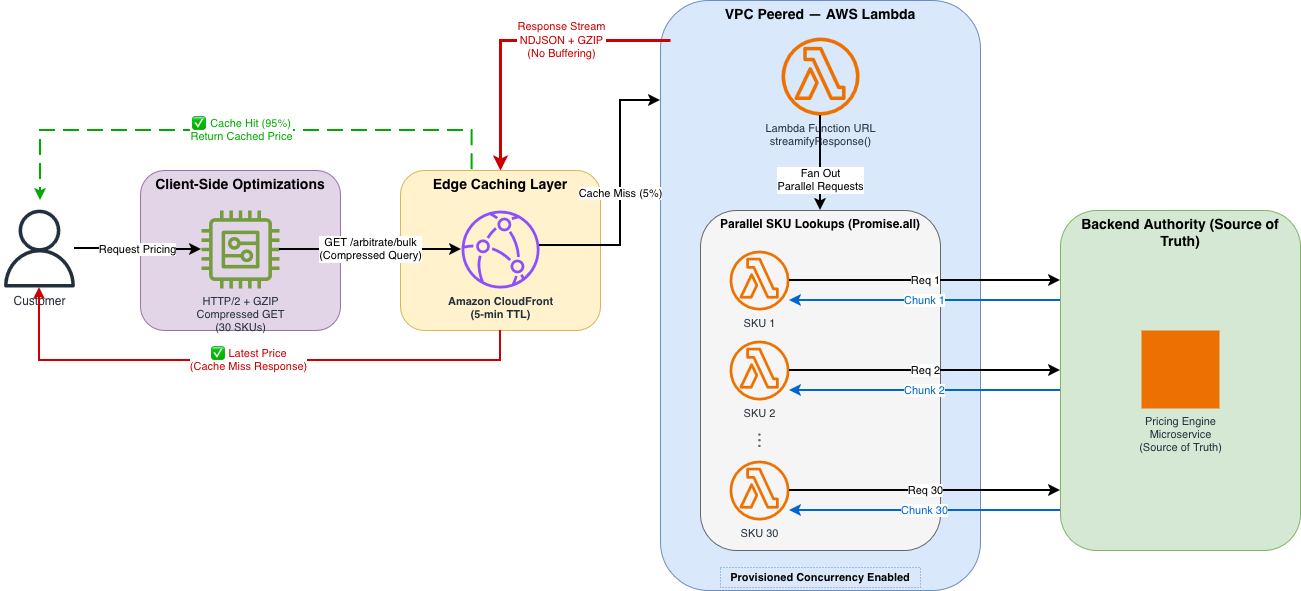
Figure 2: Stateless Streaming Architecture The new architecture eliminates the middleware cache. A high-performance stream connects the user directly to the pricing source of truth. CloudFront edge locations cache the response for 95% of traffic, while remaining requests go directly to Lambda for real-time pricing.
Implementation walkthrough
Transitioning to this new architecture required solving two specific technical constraints regarding CDN behavior and cold starts. We implemented the solution in three steps.
Step 1: Implementing the streaming handler
The core of our solution is the Node.js Lambda handler wrapped in awslambda.streamifyResponse(). This allows us to pipe data through a transformation and compression stream directly to the client as it becomes available.
We used a custom NDJSONTransform to convert pricing objects into newline-delimited JSON (NDJSON), allowing the browser to parse and render each price as it arrives rather than waiting for the complete response.
Helper function to fan-out the requests in parallel:
The handler also uses helper functions for parsing the compressed query string (parseCompressedQueryString), fetching individual SKU prices with connection pooling (fetchPricingForSKU), and flushing metrics to Amazon CloudWatch (flushMetrics).
Key implementation details:
awslambda.streamifyResponse()wraps the handler so it streams data in real time instead of waiting for the full response from the pricing engine.NDJSONTransformconverts objects to newline-delimited JSON (one object per line)- GZIP (GNU zip) compression with
Z_BEST_SPEED(Level 1) prioritizes speed over compression ratio pipeline()handles error propagation and stream cleanup- Response headers include Cache-Control for CloudFront caching
Step 2: Compressing the request data into a GET request
We needed to send complex request data (30 SKUs, context metadata) to the API.
Constraint: CloudFront and standard HTTP specs treat POST requests as non-idempotent, meaning they are not cacheable by default.
Our approach: We developed a dense, compressed query string format to fit the complex request data into a standard GET request. Format: g=group1(p=SKU-A:1:p=SKU-B:2)…
This allowed us to strictly use GET requests, keeping the request URI within standard length limits (~800 bytes) while carrying the same data as a 3-4KB JSON body.
Client-Side Code: Building the Compressed Query String
On page load, the client calls fetchPricingStream with up to 30 SKUs and an onChunk callback that updates each product’s DOM (Document Object Model) element as pricing chunks arrive. Helper functions handle updating individual price elements, displaying variant information, and gracefully degrading with a user-friendly message if pricing is temporarily unavailable.
Step 3: Configuring CloudFront for uncacheable requests
To allow CloudFront to cache these complex GET requests effectively, we configured a precise Cache Policy that includes all query strings and specific headers.
The CloudFront distribution itself is configured with HTTPS-only viewer protocol, the cache policy and origin request policy as shown in the preceding section, and points to the Lambda as its origin through HTTPS.
Cache policy highlights:
- 5-minute default TTL balances freshness and cache efficiency
- Query strings included in cache key (different SKU combos = separate cache entries)
- Header allowlisting allows custom pricing variants
- Automatic GZIP compression reduces bandwidth
- 5–30 minute TTL range provides flexibility for different content
Performance optimization results
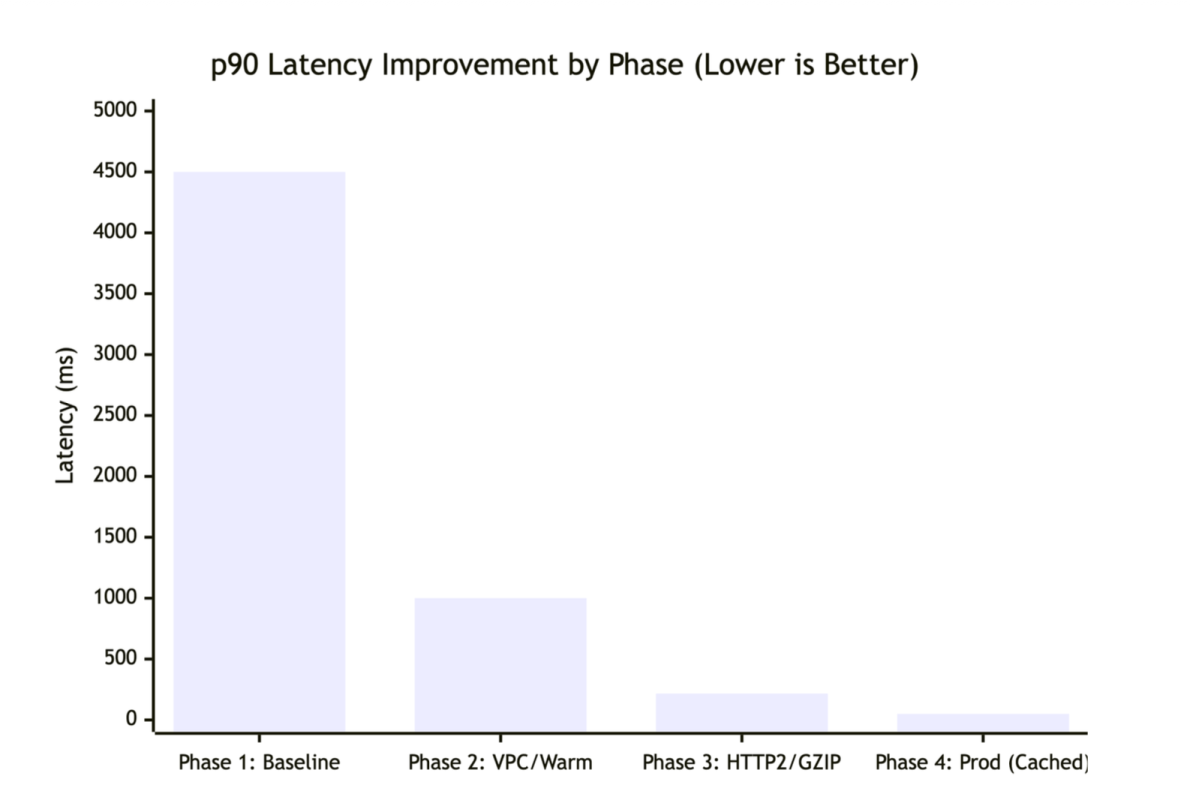
We optimized the system through four distinct phases, testing each configuration with K6 load test scripts (500 concurrent users, 30 items per request) to simulate high-traffic events like Black Friday.
Phase 1: The baseline (Global VPN)
We tested our initial proof-of-concept with the default network configuration, where all outbound traffic (including requests to AWS services like Lambda) was routed through a global VPN, forcing traffic onto the public network and back into the AWS backbone, adding unnecessary network hops and delays. The Lambda used a standard buffered response with no compression. The results were suboptimal (4,500ms P90) because connection overhead dominated the request.
- DNS resolution: approximately 50 ms
- TCP handshake: approximately 100 ms
- TLS negotiation: approximately 150 ms
- Total connection overhead: approximately 300 ms per call
This overhead created a massive bottleneck for latency before business logic even ran.
Phase 2: Amazon VPC Peering and warm starts
To remove the network penalty, we acted on two fronts:
- First: Moved the Lambda inside an Amazon Virtual Private Cloud (Amazon VPC) peered directly to the pricing origin, cutting DNS and TLS overhead to near zero for internal calls.
- Second: Enabled Provisioned Concurrency for Lambda to remove the 500–1000 ms cold start latency.
With these changes, P90 latency dropped to 1,000 ms, a 4.5x improvement, but still not real-time enough.
Phase 3: HTTP/2 and GZIP compression
The remaining bottleneck was the sheer size of the data transfer. We targeted two optimizations:
- HTTP/2 Multiplexing: Enabled HTTP/2 multiplexing to reuse a single TCP connection for the 30 parallel SKU lookups, saving seconds of cumulative handshake time.
- GZIP Compression: Applied GZIP compression (Level 1 / Z_BEST_SPEED), which reduced the response size by 76 percent (170KB → 40KB).
These two optimizations brought P90 latency down to 218 ms.
Phase 4: Production (edge caching)
In the final phase, we layered CloudFront edge caching on top of the optimized Lambda. Because we had successfully converted our request data to a GET request (Step 2), we could now cache the computed prices for 95 percent of incoming traffic.The final P90 latency landed at 50 ms.In practice, the 95 percent cache hit ratio means only 1 in 20 requests actually invokes the Lambda function; the rest are served directly from CloudFront edge locations closest to the customer. During peak events like Black Friday, this translates to millions of requests served at edge speed without touching the origin, keeping both latency and compute costs minimal.
Performance metrics table
| Metric | Phase 1 (Baseline) | Phase 2 (VPC) | Phase 3 (HTTP/2) | Phase 4 (Production) |
|---|---|---|---|---|
| P50 Latency | 1,670 ms | 501 ms | 176 ms | 35 ms |
| P90 Latency | 4,500 ms | 1,000 ms | 218 ms | 50 ms |
| P99 Latency | 5,100 ms | 2,400 ms | 500 ms | 150 ms |
| Cache Hit Ratio | <1% | <1% | <1% | 95% |
| Response Size | 170 KB | 170 KB | 40 KB | 40 KB |
| Concurrent Users | 500 | 500 | 500 | 500 |
| P90 Improvement vs Baseline | 1x | 4.5x | 20x | 90x |
The following chart shows P90 latency improvements across each optimization phase.
Latency improvements across four optimization phases.
K6 load test configuration:
Resilience, scale, and security considerations
Beyond latency, we designed the system to handle failure gracefully, scale under load, and protect data in transit.
Batching limits
The 30-item limit per request is intentional. If a page requires more (for example, 50 items), the client logic splits them into multiple parallel batches.–We chose 30 because of the following:
- Lambda execution time under 5 seconds
- Prevents timeout issues during high latency
- Balances parallel requests vs. Lambda concurrency limits
- Typical product listing pages show 20–30 items
Partial failures
The streaming architecture is resilient. If pricing for one item fails, the stream doesn’t crash; it continues processing the remaining items, so the user still sees a mostly complete page.
Partial failure handling:
Data protection
- While constructing the query string on the client exposes the request structure, this data (SKUs, variants) is already public. The actual pricing logic and business rules remain securely protected within the Pricing Engine.
- Data in transit encrypted with TLS 1.3.
- Amazon VPC endpoint connection to pricing engine (no internet exposure).
- No sensitive data logged (PII, pricing algorithms excluded).
- CloudTrail logs API calls for audit trail.
Conclusion
Stale pricing forces engineering teams to choose between freshness and scale. With the Data Aggregation pattern, we attempted to maintain both but compromised on data integrity due to the lag inherent in scheduled synchronization.By using AWS Lambda Response Streaming and Amazon CloudFront, we removed the need for a synchronization layer entirely. The result is a system that delivers the 50 ms latency required for a smooth user experience while supporting price consistency between the product page and checkout.
Beyond performance, this architecture significantly reduced operational footprint: compute fleet shrank from over 100 auto-scaled instances during peak events to only 5–10 Lambda functions, lowering maintenance and operational costs. This outcome was the result of close collaboration between Samsung’s ecommerce engineering team, our AWS Technical Account Manager (TAM), and the Lambda and CloudFront service teams, who helped architect the solution, review design decisions, and guide Samsung through production readiness. This technique applies to similar high-traffic data aggregation scenarios: product catalogs, inventory systems, recommendation engines, or services that combine multiple backend responses in real-time.
To get started, identify your highest-latency aggregation endpoints, evaluate whether your request data can be converted to cacheable GET requests and implement Lambda Response Streaming for a single endpoint before migrating your full API
Resources: – AWS Lambda Response Streaming documentation – Lambda Response Streaming tutorial – Amazon CloudFront Developer Guide – CloudFront cache policies
Learn more
For more on the concepts and technologies discussed in this post:
- Introducing AWS Lambda Response Streaming – The AWS Compute blog post that introduces the streaming pattern used in this solution
- Tutorial: Creating a Response Streaming Lambda Function – Step-by-step tutorial to build your first streaming Lambda function
- CloudFront Best Practices – Best practices for configuring CloudFront distributions
- NDJSON Format – The newline-delimited JSON specification used for incremental response parsing
- Node.js Streams API – The Node.js streams documentation underpinning the Transform and Pipeline patterns
- Terraform AWS Provider – Infrastructure as code provider used for the CloudFront and WAF configurations
- AWS Prescriptive Guidance: Load Testing – AWS guidance on load testing tools including K6
About the authors
Stenberg: curl summer of bliss
Post Syndicated from jzb original https://lwn.net/Articles/1077946/
Daniel Stenberg has announced
that curl will not be accepting vulnerability reports from July 1
through August 3, unless the submitter has a paid support
contract. He is calling it the “curl summer of bliss”.
As previously mentioned, we have been under a huge pressure
for the last four months or so. Now we need some rest. We do not
expect this deluge to be over.[…] If you and your Open Source projects also want to participate
in the summer of bliss 2026: just do it and let us know! I would of
course encourage you to do so. To take care of yourself as a top
priority.
The project’s issue and pull-request trackers on GitHub will remain
open. The planned release date for curl 8.22.0 has been pushed back
two weeks to September 2, 2026.
Security updates for Monday
Post Syndicated from jzb original https://lwn.net/Articles/1077945/
Security updates have been issued by AlmaLinux (.NET 9.0), Debian (apache2, chromium, jpeg-xl, librabbitmq, and openssl), Fedora (apptainer, bind9-next, chezmoi, chromium, collectd, composer, dnsdist, gh, python-django5, python-python-multipart, varnish, varnish-modules, vmod-querystring, vmod-uuid, weasyprint, and xorg-x11-server-Xwayland), Mageia (cups, expat, libpng, libssh, memcached, nghttp2, openimageio, packages, proftpd, and radare2), Oracle (.NET 10.0, .NET 8.0, .NET 9.0, and firefox), Red Hat (postfix and valkey), and SUSE (afl, alloy, ansible-core, apache-pdfbox, chromedriver, chromium, cpp-httplib-devel, dpkg, elemental-operator, elemental-toolkit, enc, erlang, ffmpeg-7, firewalld, git-bug, golang-github-prometheus-prometheus, grafana, GraphicsMagick, graphite2, kernel, kernel-devel, lcms2, ldns, libsoup, libyang, libzypp, logback, mariadb, NetworkManager, openssh, openvswitch, perl-GD, perl-XML-LibXML, polkit, postgresql-jdbc, postgresql18, python, python-django, python-M2Crypto-doc, python-Pygments, python-pygments, python-requests, python313-Django6, qemu, rpcbind, samba, strongswan, tmux, uriparser, and xdg-dbus-proxy).
Growing the Cloudflare AI team with talent from Ensemble AI
Post Syndicated from Alex Reneau original https://blog.cloudflare.com/ensemble-ai-talent-joins-cloudflare/
Today, we’re excited to share that key members of the team at Ensemble AI are joining Cloudflare to help accelerate our work in AI infrastructure and make it easier for developers to run powerful AI models efficiently at scale.
Ensemble AI, founded in 2023 in San Francisco, has spent the last few years focused on one of the most important challenges in AI: making large models faster, smaller, and more cost-effective to serve, without sacrificing quality. The team has developed new approaches to model compression and efficient inference that are designed to reduce the memory, compute, and deployment overhead of large language models and multimodal architectures.
As AI becomes a core part of how developers build applications, the economics of inference matter more than ever. Models are getting larger; workloads are becoming more dynamic. And customers increasingly expect AI to be available everywhere: globally distributed, fast, reliable, and affordable. Bringing the Ensemble AI team into Cloudflare strengthens our ability to make that possible.
The team at Ensemble AI has focused on preserving the structure inside modern AI models while reducing the cost of running them. Instead of treating model efficiency as only a quantization or hardware problem, Ensemble has explored new model building blocks that can make neural networks more compact and efficient at the architectural level.
A core part of this work is NdLinear, a drop-in replacement for standard linear layers in transformer models that operates directly on multidimensional activations rather than flattening structure away. This enables models to preserve meaningful axes, such as heads, channels, spatial dimensions, or other structured representations, while reducing parameter count and compute. Ensemble has also developed NdLinear-LoRA, an efficient adaptation method designed to reduce the trainable parameters required for fine-tuning large models.
These approaches complement other efficiency techniques, including quantization and vector quantization. Together, they point toward a future where developers can run capable AI models with substantially lower memory, compute, and cost requirements.
Cloudflare Workers AI gives developers access to serverless GPU-powered inference on Cloudflare’s global network. As developers build more AI-native applications, the ability to serve models efficiently becomes a critical part of the platform.
Inference cost is one of the biggest barriers to scaling AI applications. Every improvement in model size, memory footprint, throughput, and GPU utilization can make AI more accessible to developers and more economical for customers. This is especially important as AI workloads expand beyond simple text generation into agents, multimodal models, personalization, fine-tuning, retrieval, and reinforcement learning.
We are deepening our investment in the core machine learning capabilities needed to make Workers AI faster, more flexible, and more cost-efficient. This builds on top of our existing work on improving model efficiency, including our inference engine Infire, tensor compression techniques like Unweight, and our platform for running extra large language models. The team will focus on improving the economics of serving large language models and other advanced AI architectures, with an emphasis on model efficiency, GPU utilization, and scalable deployment.
AI infrastructure is entering a new phase. Developers no longer need only access to models; they need infrastructure that can run models reliably, affordably, and close to users. They need the ability to experiment with different model sizes, fine-tuning approaches, and deployment patterns without being blocked by cost or operational complexity.
Cloudflare is uniquely positioned to help solve this. Our global network, developer platform, and serverless architecture give us the foundation to bring AI closer to where applications already run. The Workers AI Machine Learning Engineering team will help us improve the efficiency layer underneath that experience.
By combining Cloudflare’s global infrastructure with Ensemble’s work in model compression and efficient architectures, we can continue building a platform where developers can deploy AI applications with lower cost, better performance, and less operational overhead.
Together, we will continue building the infrastructure needed to make AI more efficient, accessible, and useful for developers everywhere. Our goal is simple: help developers run powerful AI workloads at global scale while improving the economics of inference across the Cloudflare platform. If you want to join us in our mission, check out our careers page.

Prelude to Revolution
Post Syndicated from The History Guy: History Deserves to Be Remembered original https://www.youtube.com/watch?v=Ebrt8ZeipwQ
AWS Weekly Roundup: AWS FinOps Agent in preview, Gemma 4 on Bedrock, Kiro Pro Max, and more (June 15, 2026)
Post Syndicated from Esra Kayabali original https://aws.amazon.com/blogs/aws/aws-weekly-roundup-aws-finops-agent-in-preview-gemma-4-on-bedrock-kiro-pro-max-and-more-june-15-2026/
This week, New York City is hosting AWS Summit, bringing together builders, customers, and AWS teams for a full day of announcements, demos, and technical sessions at the Javits Center. I wrote blog posts for some of the Summit launches, so I am excited to see them go live this week. I just won’t be watching from the Javits Center. I’ll be at a four-day music festival, following the launches on my phone while trying to figure out how to put up a tent. If you weren’t able to attend in person like me, the keynote livestream is available on June 17, with Dr. Swami Sivasubramanian, VP of Agentic AI, and Chet Kapoor, VP of Security Services and Observability, covering new capabilities across developer tools, AI infrastructure, and security.
Here’s what happened this week.
Headlines
How frontier teams are reinventing AI-native development — Swami published a detailed post this week drawing on data from experiments across hundreds of Amazon engineering teams. The findings are worth reading carefully if you are thinking about how to structure AI adoption on your own team.
A six-engineer team rebuilt the Amazon Bedrock inference engine in 76 days, a project originally scoped for 30 developers over 12 to 18 months. The median productivity gain across structured pilots with Amazon Stores teams was 4.5x in normalized deployment velocity, with some teams exceeding 10x. Perfect Order Experience went from a two-week feature cycle to shipping in an afternoon. WW Grocery cut design document creation from five days to a few hours.
The post distills these results into five practices for becoming a frontier team. First, invest in agent context: build steering files, coding standards, and structured repositories before writing production code. Second, expect an initial slowdown while workflows are restructured, and push through it. Third, maintain a steady backlog of well-scoped tasks so agents can run in parallel without constant supervision. Fourth, make intent explicit through structured specifications before code generation begins. Fifth, shift testing left so agents can self-correct before code reaches the pipeline.
The post closes with a note that commit velocity is only part of the picture, and that a follow-up will cover release management, operations, security operations, and EOL upgrades.
AWS FinOps Agent is now available in preview — AWS FinOps Agent is a new agent for FinOps practitioners and engineering teams that answers cost questions, surfaces optimization opportunities, investigates cost anomalies, and runs recurring FinOps workflows on a defined schedule. You can use it to query your AWS costs, generate cost reports for finance and engineering teams, and surface rightsizing, idle resource, and Savings Plans recommendations from AWS Cost Optimization Hub and AWS Compute Optimizer. The agent can open Jira tickets on your behalf based on those recommendations. When a cost anomaly is detected, FinOps Agent can automatically investigate the root cause and post findings to a Slack channel.
Last week’s launches
I’ll start with one I wrote this week, then cover the other launches that caught my attention:
- Amazon EC2 M9g and M9gd instances are now generally available — Powered by AWS Graviton5 processors and built on the sixth-generation AWS Nitro System, M9g instances deliver up to 25% better compute performance compared to Graviton4-based instances, with up to 35% faster performance for web applications, up to 35% for machine learning inference, and up to 30% for databases. Graviton5 is the first processor in the AWS fleet to support PCIe Gen6 and DDR5-8800 memory, and includes a 5x larger L3 cache compared to the previous generation. M9g and M9gd instances offer up to 15% higher network bandwidth and 20% higher Amazon EBS bandwidth on average across sizes compared to M8g. This release also introduces the Nitro Isolation Engine, an enhancement to the Nitro System that uses formal verification to provide mathematically proven isolation between virtual machines — establishing Nitro as the first formally verified cloud hypervisor. M9gd instances add up to 11.4 TB of NVMe SSD local storage with 30% higher IOPS compared to M8gd. Both instance types support Instance Bandwidth Configuration (IBC) for adjusting bandwidth allocation between EBS and VPC networking by up to 25%.
- Anthropic Claude Fable 5 on Amazon Bedrock — Claude Fable 5 launched on Amazon Bedrock on June 9, bringing extended asynchronous task execution, advanced vision capabilities across diagrams, charts, and PDFs, and proactive self-verification. Access requires opting into data sharing via the Data Retention API before invoking the model; Anthropic requires 30-day retention of inputs and outputs for Mythos-class models. Important note on availability: On June 12, Anthropic asked AWS to revoke access to Claude Fable 5 and Claude Mythos 5 for all users to support compliance with a US Government export control directive. All other models, including Opus 4.8, are unaffected. Read the Anthropic statement for details. AWS will share further updates as they become available.
- Gemma 4 models are now available on Amazon Bedrock — The Gemma 4 family from Google DeepMind is now available on Amazon Bedrock across three variants: Gemma 4 31B (dense, 256K-token context window, suited for reasoning and coding workloads), Gemma 4 26B-A4B (mixture-of-experts architecture, targeting cost- and latency-sensitive workloads), and Gemma 4 E2B (smallest variant, designed for low-latency interactive use cases). All three support native function calling, structured output, reasoning, response streaming, multimodal input across text, image, video, and audio, and more than 35 languages.
- Amazon OpenSearch Service launches MCP Apps for agentic observability — Amazon OpenSearch Service now supports MCP Apps, enabling observability workflows inside compatible agentic IDEs including Claude Desktop and VS Code. An AI agent in your local environment can investigate incidents using logs, traces, metrics, and alerts stored in OpenSearch domains, collections, and Amazon Managed Service for Prometheus. Each MCP App tool call returns a dual response: a text summary for the agent to reason over and an interactive visualization rendered in the same conversation thread. Available MCP App tools cover log, metrics, and trace investigation; service performance; topology; dynamic visualizations; agent health; cluster health; and instrumentation scoring.
Other AWS news
Here are some additional posts and updates you may find useful:
- AWS CLI v1 enters maintenance mode — When CLI v1 enters maintenance mode, the botocore and s3transfer dependencies will be vendored directly into the CLI v1 codebase rather than installed as separate packages. This means upgrading CLI v1 will no longer update the standalone botocore or s3transfer packages, and installing those packages independently will have no effect on the versions used by CLI v1. Environments with both CLI v1 and boto3 installed will contain separate copies of these libraries. New CLI v1 releases will be limited to critical bug fixes and security issues. The recommended path is to migrate to AWS CLI v2.
- AWS Workload Credentials Provider is now available — AWS has launched a new Workload Credentials Provider that enables workloads to obtain short-term AWS credentials without requiring long-term access keys. This supports credential management for applications running outside of AWS, giving teams a way to follow least-privilege access patterns for workloads in third-party or on-premises environments.
- Kiro Pro Max is now available — Kiro has introduced a new Pro Max tier, adding higher usage limits, access to the latest frontier models, and additional agentic capabilities for development teams. Kiro Pro Max is designed for professional developers who need sustained, high-volume use across coding, specification generation, and agent-driven tasks.
Upcoming AWS events
Check your calendar and sign up for upcoming AWS events:
- AWS Summits — AWS Summits are free in-person events covering cloud and AI. Coming up: New York City (June 17), Hong Kong (June 17), Shanghai (June 23-24), Japan (June 25), Washington, D.C. (June 30 – July 1), Taipei (July 15), and Bogotá (July 30).
- AWS Community Days — Community-led conferences planned and delivered by community leaders. Upcoming events include Montreal, Canada (June 20), Indianapolis, USA (June 24), Hangzhou, China (June 28), Bengaluru, India (July 11), and Yaoundé, Cameroon (July 25).
Visit the AWS Builder Center to meet other builders, contribute solutions, and find resources that help you keep building. You can also browse upcoming AWS-led in-person and virtual events, plus developer-focused sessions.
This post is part of our Weekly Roundup series. Check back each week for a quick roundup of interesting news and announcements from AWS!
Accelerate Incident Resolution with PagerDuty and AWS DevOps Agent
Post Syndicated from Shan Kandaswamy original https://aws.amazon.com/blogs/devops/accelerate-incident-resolution-with-pagerduty-and-aws-devops-agent/
When something breaks in production, you find out fast. Understanding why it broke, before the damage spreads, is the hard part. That is where Site Reliability Engineering (SRE) teams lose the most time.
Think about the last time you got paged at 2 a.m. The alert said something broke, not why. You open four or five dashboards, cross-reference deployment logs with AWS CloudTrail events, and scroll through metrics. Twenty or thirty minutes burn before the picture comes together. That manual correlation is where resolution time balloons.
What if the investigation started before you opened your first dashboard?
That’s the idea behind connecting the new native PagerDuty Capability Provider in AWS DevOps Agent. The two systems now talk directly over a built-in OAuth 2.0 connection. When a PagerDuty incident triggers, the DevOps Agent starts investigating while responders are still getting oriented. Connecting them takes a few fields in a console.
What AWS DevOps Agent does
AWS DevOps Agent is a frontier agent built to help engineering teams investigate and resolve production incidents faster. The DevOps Agent works as a first responder, conducting federated investigations across your observability stack, tracing incidents from code changes all the way through to cloud infrastructure impact, and producing detailed mitigation plans. Beyond reactive investigations, it also proactively recommends improvements to your observability, infrastructure, and deployment pipelines to help prevent recurring issues. Through the AWS DevOps Agent web app, you can observe investigations as they unfold, access findings, and steer the analysis in real time.
The central concept is the Agent Space. Think of it as the boundary that defines what your agent can access. Your AWS account serves as the primary source, and from there you layer on secondary capabilities from telemetry providers like Datadog, Dynatrace, New Relic, or Splunk; pipeline tools like GitHub and GitLab; communications from PagerDuty and Slack; and custom Model Context Protocol (MCP) servers for anything else. Every investigation the agent runs, it learns. It maps relationships between your resources such as load balancers to services, services to databases, and deployments to config changes. One team we’ve worked with had the agent map hundreds of infrastructure relationships, and that number keeps growing with each investigation it completes.
PagerDuty, of course, needs no introduction to anyone who’s been responsible for resolving critical, customer-impacting incidents. Engineering teams rely on it to detect, triage, resolve, and learn from incidents. The native PagerDuty Capability Provider in AWS DevOps Agent connects the two directly. PagerDuty incident events drive AWS DevOps Agent investigations automatically. Findings flow back to the originating PagerDuty incident record, including root cause analysis and recommended mitigation steps. They are also available in the AWS DevOps Agent console and web app, giving your whole team visibility into what the agent discovered.
There’s a second piece to this integration worth understanding. By adding the PagerDuty MCP Server as a capability and configuring an AWS DevOps Agent skill for working with PagerDuty, you enable AWS DevOps Agent to query PagerDuty’s institutional memory during investigations. This includes past incidents, diagnostics, resolution patterns, and operational context across both AWS and non-AWS environments. This PagerDuty MCP Server-based connection is separate from the Capability Provider event flow and requires its own setup (covered in Step 6 below). The result is investigations informed by both current signals and prior incident history.
Why this matters
These are practical, tangible changes for your team:
Faster time to root cause. When a PagerDuty incident triggers, AWS DevOps Agent kicks off an investigation automatically. No one has to sign in to another tool, step through a wizard, or remember to initiate anything. The investigation is already running by the time you acknowledge your alert.
Real contextual analysis. The agent correlates PagerDuty incident data with Amazon CloudWatch metrics, AWS CloudTrail logs, application topology, and deployment history, plus telemetry from whichever third-party observability providers you’ve connected, like Datadog, Splunk, New Relic, or Dynatrace. It connects dots that would otherwise take humans significant time to even start connecting.
Investigations start when an incident triggers. AWS DevOps Agent automatically conducts the deep-dive investigation behind the scenes. It reports back its root cause analysis and proposed mitigation steps into the originating PagerDuty incident, with a link to the AWS DevOps Agent web app for more details.
Less time playing detective, more time fixing things. That manual data correlation across four or five tools? The agent handles it. Your people can focus on actually resolving the issue instead of building the investigation timeline by hand.
Nothing extra to host. The native PagerDuty Capability Provider means you’re not standing up additional infrastructure. No servers to manage, no endpoints to maintain on your side.
How the integration works
The architecture is straightforward. Here’s the flow:
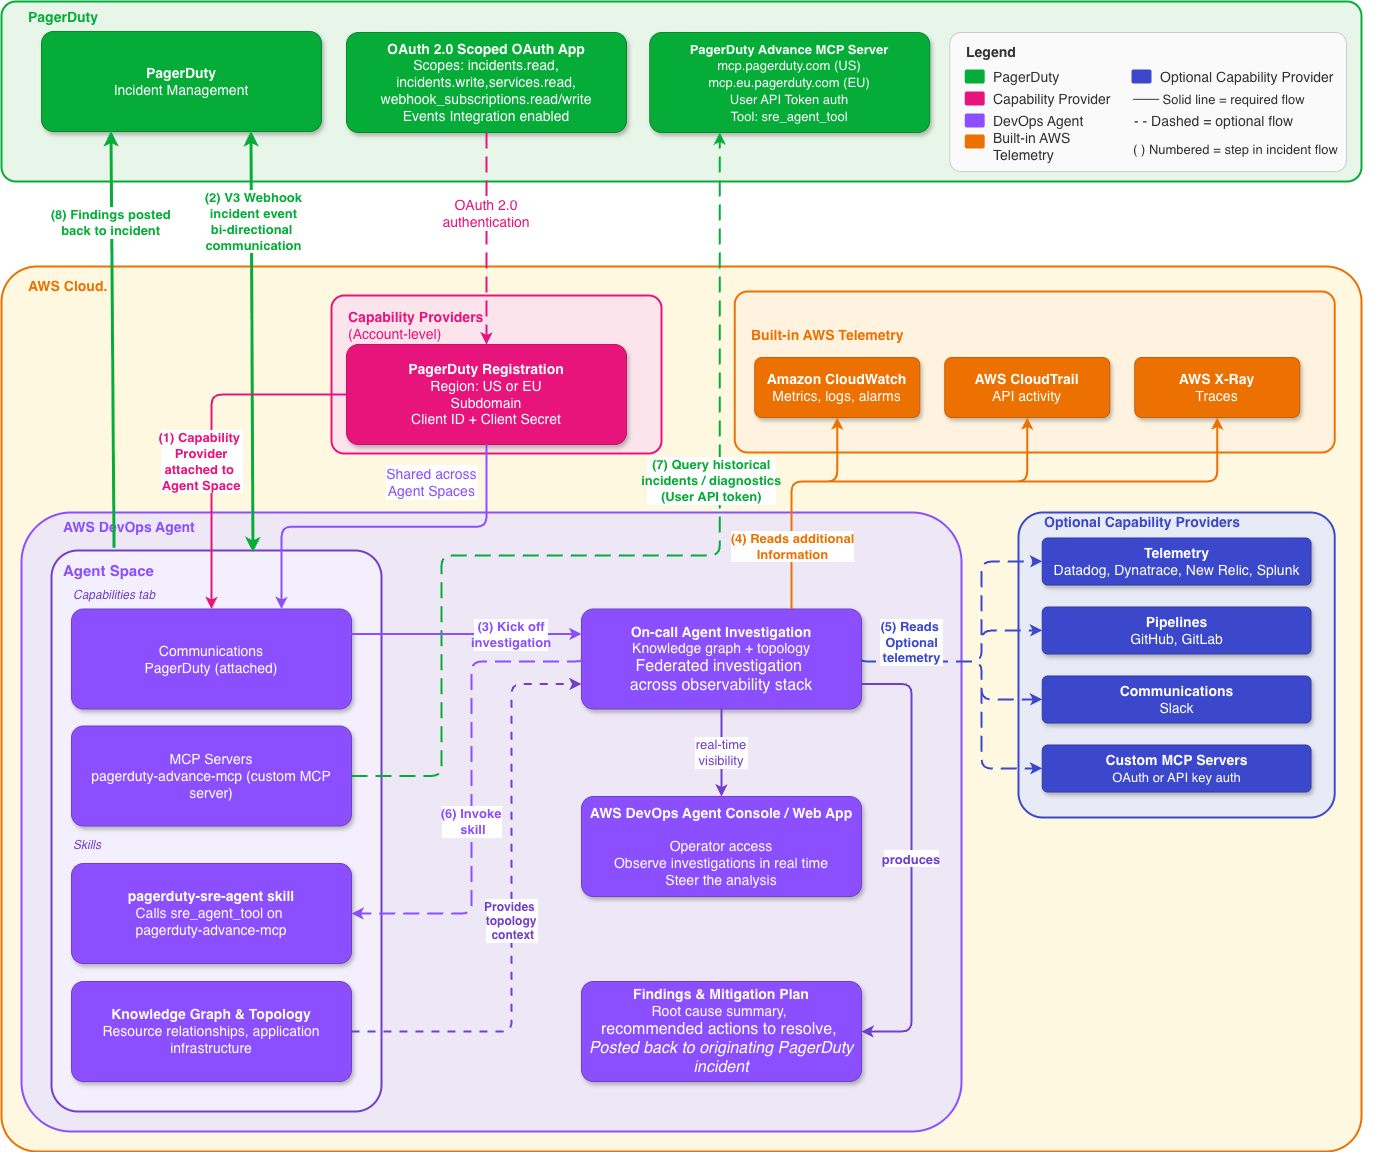
Figure 1: High-level architecture, native PagerDuty Capability Provider in AWS DevOps Agent.
AWS DevOps Agent and PagerDuty authenticate to each other using OAuth 2.0 Scoped OAuth. You register PagerDuty once at the AWS account level as a Capability Provider, and then add it to whichever Agent Spaces need it. Registration is shared across Agent Spaces in the account, so you don’t have to repeat the setup per team.
Once a PagerDuty incident triggers, AWS DevOps Agent picks up the event over the native connection and begins investigating:
- Receives the PagerDuty incident event (service, severity, and initial context) via the native Capability Provider connection
- If the PagerDuty MCP capability and AWS DevOps Agent skill are configured, queries PagerDuty for related historical incidents, past diagnostics, and resolution patterns to enrich the investigation
- Examines AWS resource topology and the relationships between your infrastructure components through its knowledge graph
- Reviews AWS CloudTrail logs for recent changes or anything that looks off
- Queries Amazon CloudWatch and connected telemetry providers (Datadog, Dynatrace, New Relic, Splunk) for relevant metrics and traces
- Cross-references deployment events from configured pipeline tools (GitHub, GitLab) against the incident timeline
- Synthesizes potential root causes from all the evidence it’s gathered
The agent builds up a comprehensive picture by introspecting AWS observability data, pulling from connected capability providers, and leveraging the topology mapping that creates a knowledge graph of your application infrastructure. Every investigation it runs expands its understanding of how your resources connect. It discovers relationships you might not have explicitly documented, building a richer map with each incident it works.
Beyond raw data, the agent produces detailed mitigation plans with specific actions to resolve the issue, validate the fix, and revert if needed. The agent posts its findings, root cause summary, and recommended next steps directly to the originating PagerDuty incident record, giving your on-call team actionable information without them having to go digging.
A quick note on security, because it matters. The native connection uses OAuth 2.0 Scoped OAuth with a minimum set of PagerDuty scopes (incidents.read incidents.write services.read webhook_subscriptions.read webhook_subscriptions.write). AWS DevOps Agent only supports the newer scoped OAuth flow; legacy PagerDuty OAuth with a redirect URI is not supported. For inbound events from PagerDuty, only V3 webhooks are supported. Earlier webhook versions won’t work. Traffic flows over HTTPS.
Getting it set up
Setup comes in four phases: register PagerDuty as a Capability Provider at the account level, attach it to your Agent Space, configure the PagerDuty MCP server and AWS DevOps Agent skill for working with PagerDuty to enrich investigations, and verify things work end to end.
What you’ll need
- An active AWS account with permissions to use AWS DevOps Agent
- AWS DevOps Agent enabled in a supported AWS Region. You’ll create an Agent Space, which needs two AWS Identity and Access Management (IAM) roles (one for Agent Space operations, one for web app functionality). Both can be auto-created during setup
- A PagerDuty account with permission to register OAuth apps, plus an Administrator role for Events Integration
- A PagerDuty Advance license and a PagerDuty User API token (for the MCP integration in Step 6)
- Your PagerDuty account subdomain (so if your PagerDuty URL is
https://your-company.pagerduty.com, the subdomain isyour-company) - An OAuth client ID and client secret from a PagerDuty app registered with OAuth 2.0 Scoped OAuth
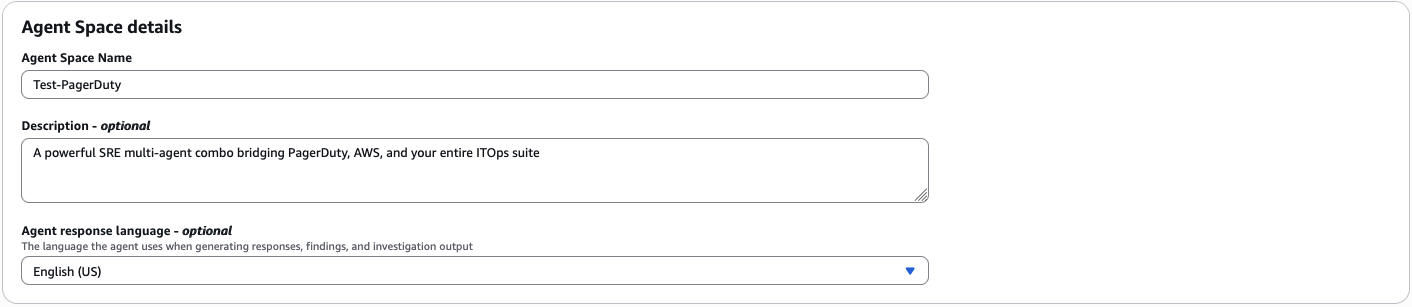
Step 1: Create your Agent Space
Stand up an Agent Space in the AWS DevOps Agent console. This defines the boundary for what the agent can reach into and investigate.
- Head to the AWS DevOps Agent console home page.
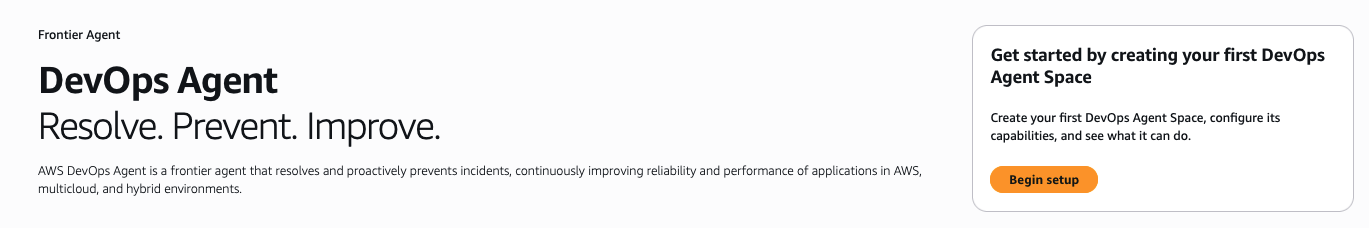
AWS DevOps Agent console home page.
- Create a new Agent Space with a name and a short description, usually scoped to a service or application team’s responsibilities
Creating a new Agent Space with a name and description.
- Create the Agent Space IAM roles (AWS DevOps Agent requires two IAM roles: one for Agent Space operations and another for its associated web app functionality). You can auto-create them during setup
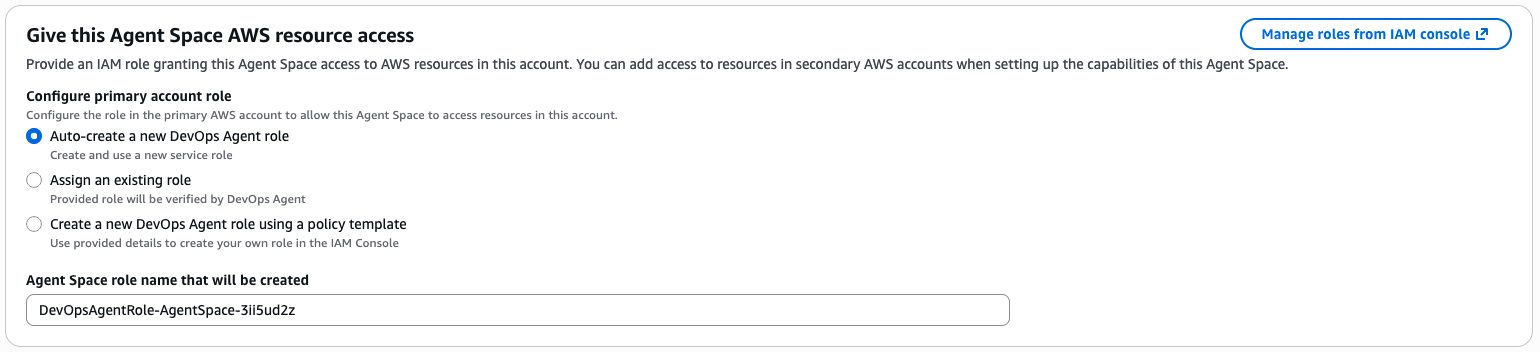
Configuring the two IAM roles required for the Agent Space.
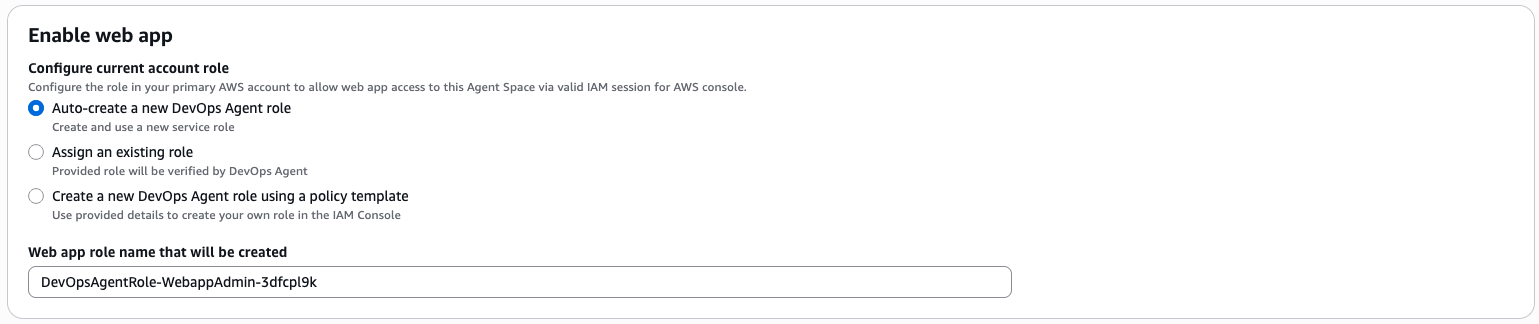
IAM roles can be auto-created during setup.
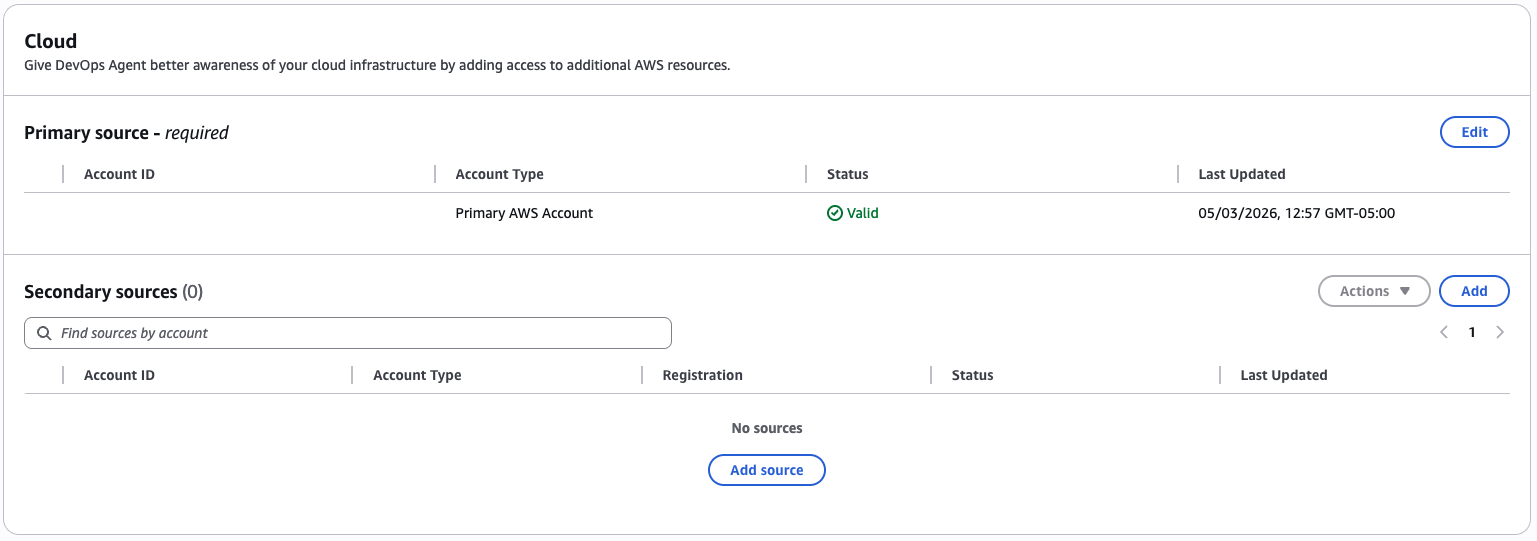
- Your primary source (the AWS account you’re creating the Agent Space in) is added automatically. If you need the agent to investigate resources in other accounts, add those as secondary sources
The AWS account is added automatically as the primary source.
Step 2: Add supporting capabilities
Out of the box, the agent connects to Amazon CloudWatch for metrics, logs, and alarms, and can investigate AWS CloudTrail API activity and AWS X-Ray traces through its read-only permissions. That said, most teams don’t live entirely inside AWS tooling, and that’s where third-party capability providers pull their weight. You can wire in external tools to give the agent a fuller picture of your world:
- Telemetry: Datadog, Dynatrace, New Relic, or Splunk, so the agent can pull metrics and traces beyond Amazon CloudWatch during investigations
- Pipelines: GitHub or GitLab, so it can correlate deployments and code changes with incidents
- Communications: Slack, for team coordination and investigation updates (PagerDuty is configured separately as a Capability Provider in Step 4)
- MCP Servers: Custom integrations via OAuth or API keys for anything else in your stack
You don’t need everything connected on day one. Start with what makes sense and add more as you go. Each new capability helps the agent discover more infrastructure relationships and investigate more effectively.
Step 3: Set up application topology
Help the agent understand what your application landscape looks like:
- Configure IAM roles to define the AWS topology scope for your Agent Space. The agent uses these permissions to determine which resources it can see and investigate
- Give the agent time to discover and map the relationships between your resources (it does this automatically as it runs investigations)
- Check the interactive topology visualization in the console and make sure your critical components are showing up correctly
- If you want the agent to focus on certain tags or resource subsets, add those instructions to your skills
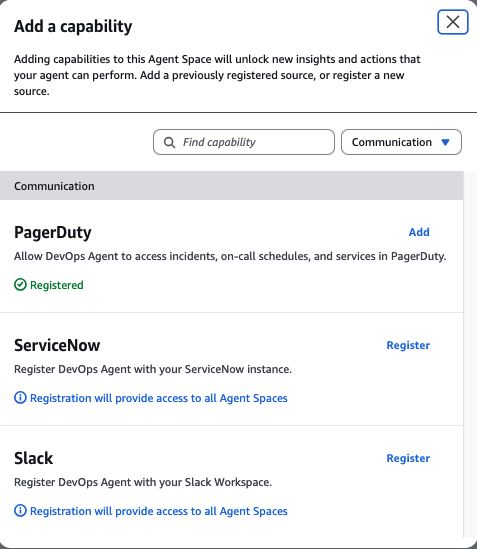
Step 4: Register PagerDuty as a Capability Provider
You register PagerDuty once at the AWS account level. From there, it’s shared across every Agent Space in the account.
First, create the OAuth app in PagerDuty:
- In a separate browser tab, sign in to PagerDuty and go to Integrations > App Registration
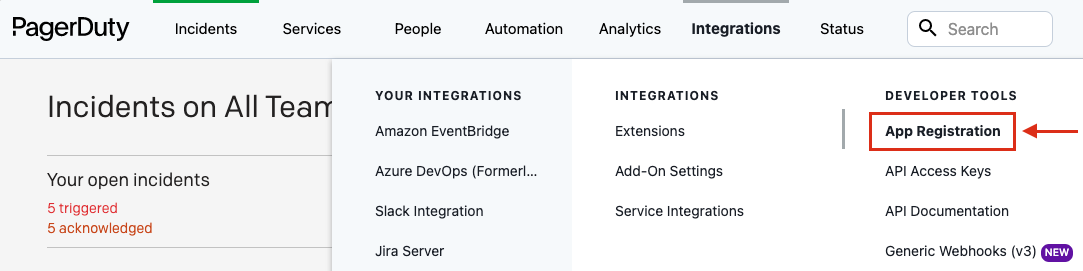
In PagerDuty, navigate to Integrations then App Registration.
PagerDuty App Registration page.
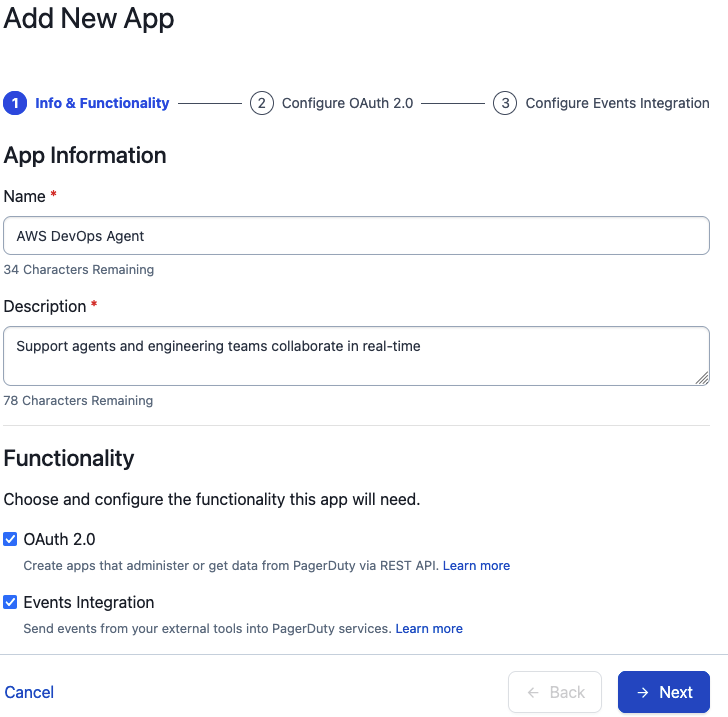
- Create a new app using OAuth 2.0 Scoped OAuth. AWS DevOps Agent does not support legacy PagerDuty OAuth with redirect URI
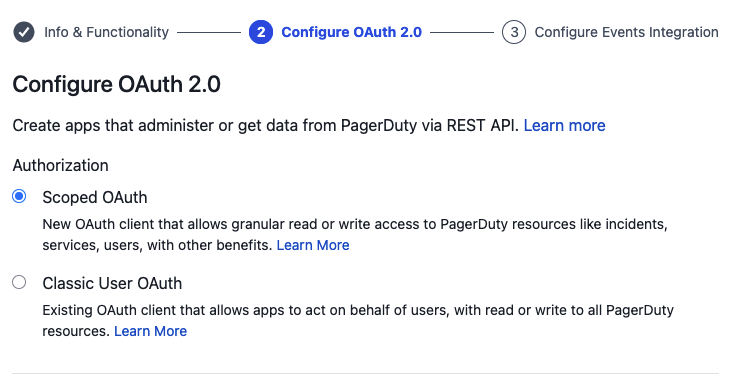
Create the app using OAuth 2.0 Scoped OAuth.
- Under Permissions, grant the minimum scopes:
incidents.readincidents.writeservices.readwebhook_subscriptions.readwebhook_subscriptions.write
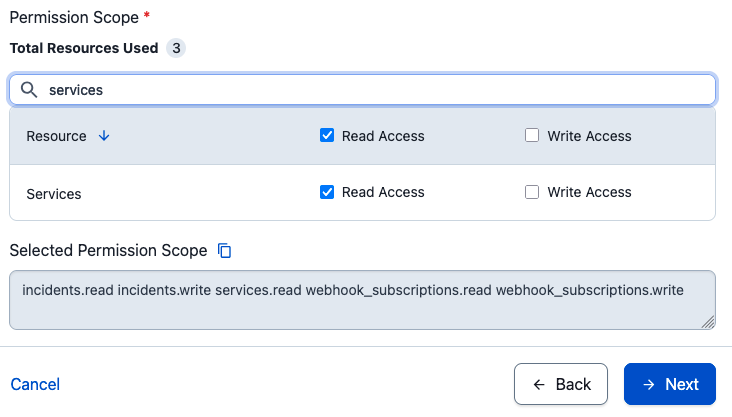
Granting the minimum required OAuth scopes.
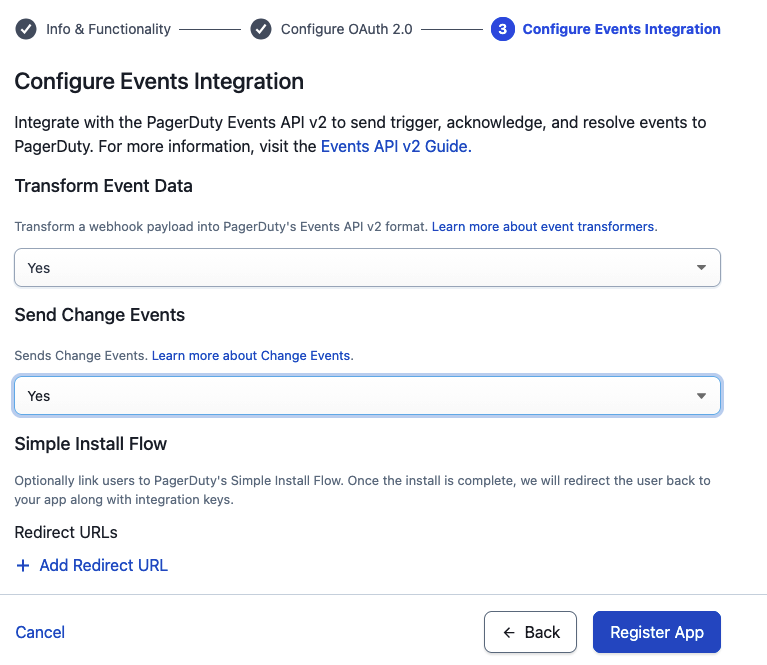
- Turn on Events Integration so AWS DevOps Agent and PagerDuty can talk in both directions
Turn on Events Integration for two-way communication.
- Copy your Client ID and Client Secret. You’ll paste them into the AWS console in a minute
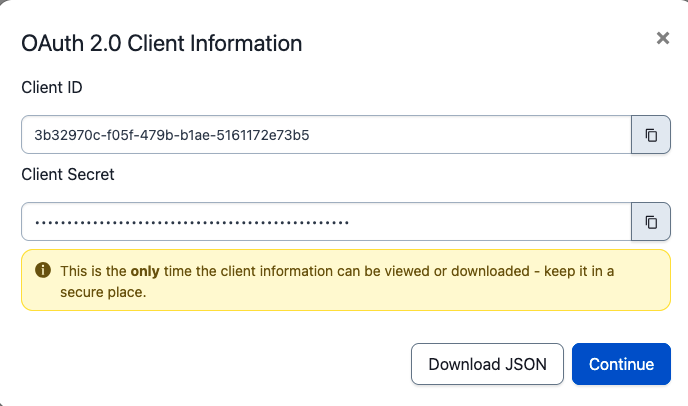
Copy the Client ID and Client Secret from PagerDuty.
Then, register PagerDuty in the AWS DevOps Agent console:
- In the AWS DevOps Agent console, open the Capability Providers page from the side navigation
- In the Available providers section, find PagerDuty under Communication and choose Register

Find PagerDuty under Communication and choose Register.
- On the Configure access in PagerDuty page, pick your PagerDuty region (US or EU) and enter your PagerDuty subdomain (if your PagerDuty URL is
https://your-company.pagerduty.com, the subdomain isyour-company) - Paste in the OAuth Client name, Client ID, and Client secret from PagerDuty. Confirm the minimum scopes (
incidents.readincidents.writeservices.readwebhook_subscriptions.readwebhook_subscriptions.write)
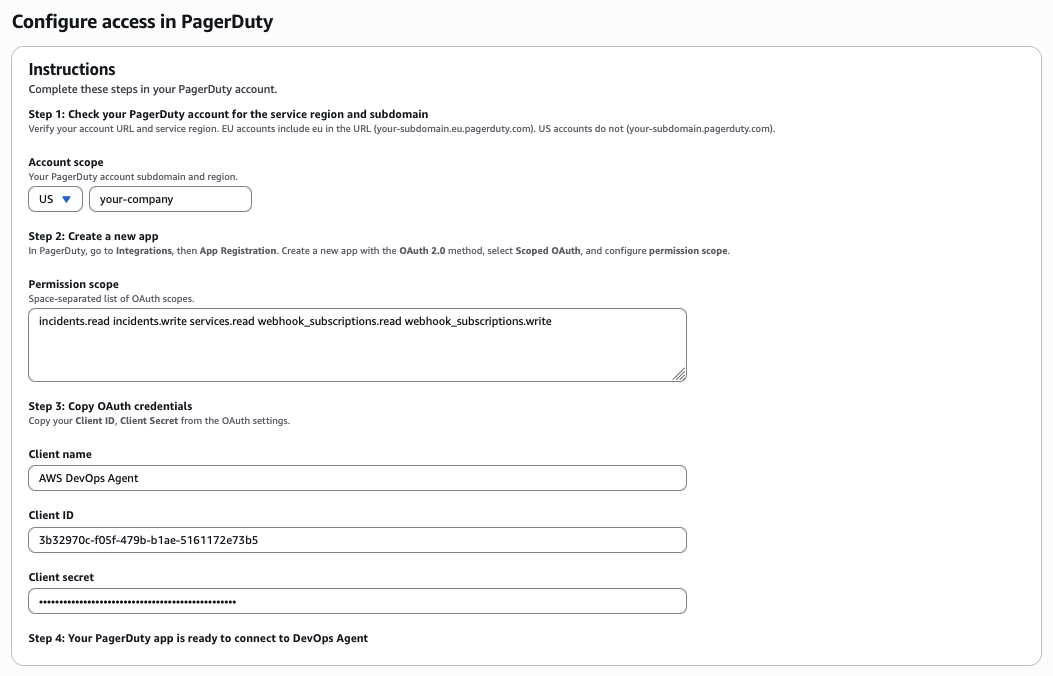
Enter your PagerDuty region, subdomain, and OAuth credentials.
- Review the configuration and choose Add
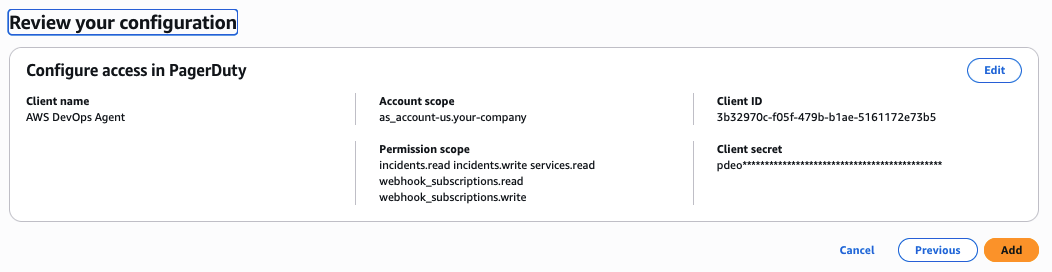
Review the configuration and choose Add.
Once registration goes through, PagerDuty shows up under the Currently registered section of the Capability Providers page.
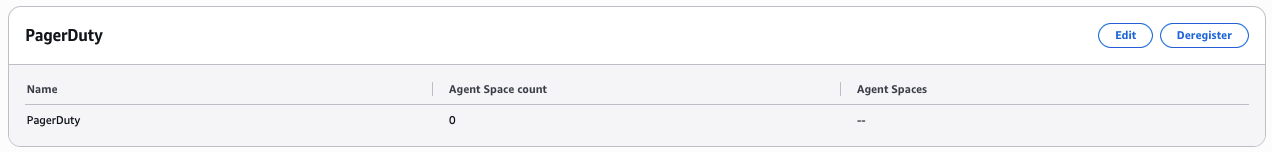
PagerDuty appears under Currently registered after registration.
Step 5: Add PagerDuty to your Agent Space
PagerDuty is registered at the account level. Now connect it to the Agent Space that needs it:
- In the AWS DevOps Agent console, pick your Agent Space
- Open the Capabilities tab
- In the Communications section, choose Add
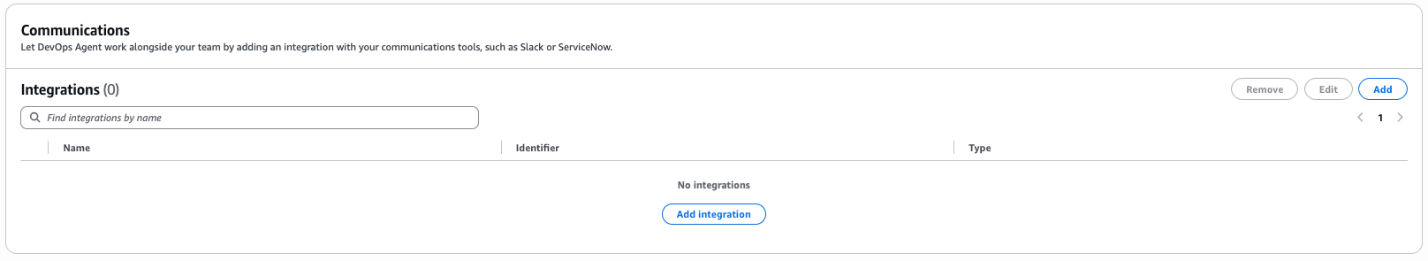
On the Capabilities tab, choose Add in the Communications section.
- Select PagerDuty from the list of available providers
Select PagerDuty from the list of available providers.
- Choose Associate service
To update OAuth credentials or remove PagerDuty from an Agent Space, see the AWS DevOps Agent documentation.
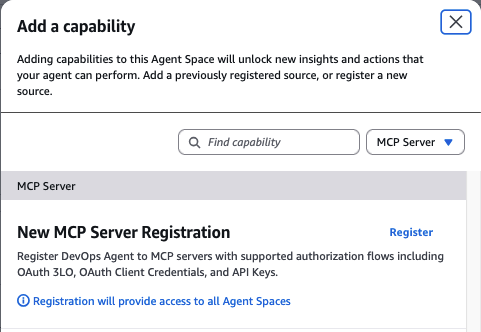
Step 6: Add PagerDuty MCP Server and configure the agent skill
The Capability Provider from the previous steps handles the event flow. When a PagerDuty incident triggers, AWS DevOps Agent investigates and posts findings back to the originating PagerDuty incident. To let the agent also pull context from PagerDuty during those investigations, you add two things: the PagerDuty MCP server as a custom MCP capability, and an AWS DevOps Agent skill for working with PagerDuty that tells the agent when and how to use it.
Prerequisites:
- PagerDuty Advance license
- A PagerDuty User API token (generate one at User Settings > API Access in PagerDuty)
Add the PagerDuty MCP server:
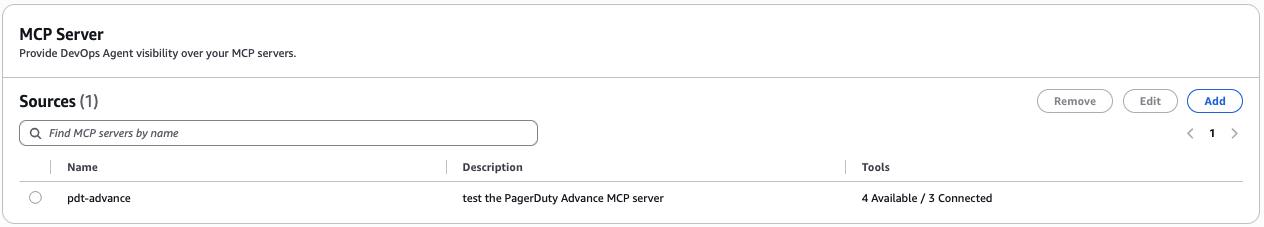
- In your Agent Space, go to Capabilities tab > MCP Servers
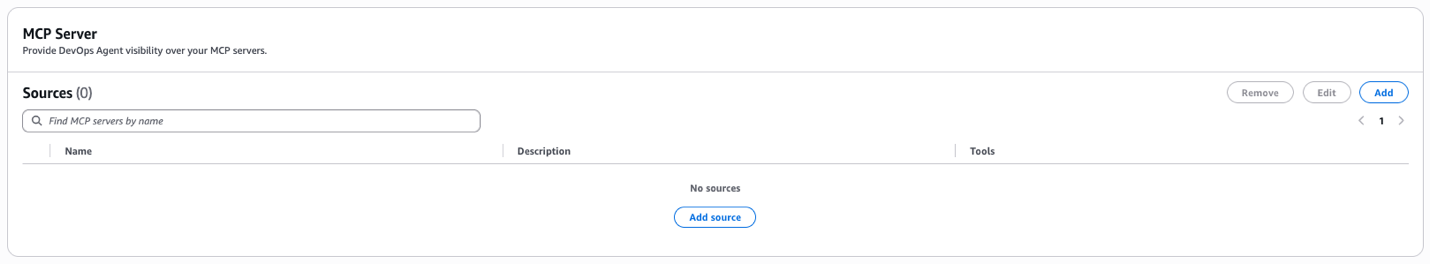
Open the MCP Servers section on the Capabilities tab.
- Add a new custom MCP server with the following configuration:
- Server URL:
https://mcp.pagerduty.com/mcp - For EU region PagerDuty accounts, use
https://mcp.eu.pagerduty.com/mcpinstead - Authentication: PagerDuty User API token in the format
Token token=<your-pagerduty-api-key>
- Server URL:
Add a new custom MCP server.
Configure the server URL and PagerDuty User API token.
Add the AWS DevOps Agent skill for working with PagerDuty:
The MCP server gives the agent access to PagerDuty tools. The skill tells the agent when and how to use them during investigations.
- In your Agent Space, choose Operator access to open the web app in a separate browser window

Choose Operator access to open the web app.
- In the Agent Space Operator web app, navigate to Knowledge and the Skills tab, then choose Add skill
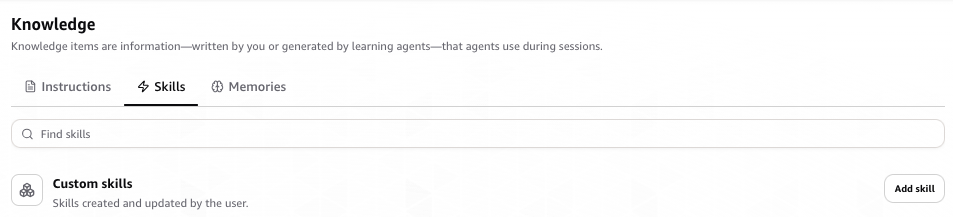
On the Skills page, choose Add skill.
- You can select Create skill to create a skill through a wizard, interactively chat with the agent to create a skill, or upload a skill zip file if you already have one
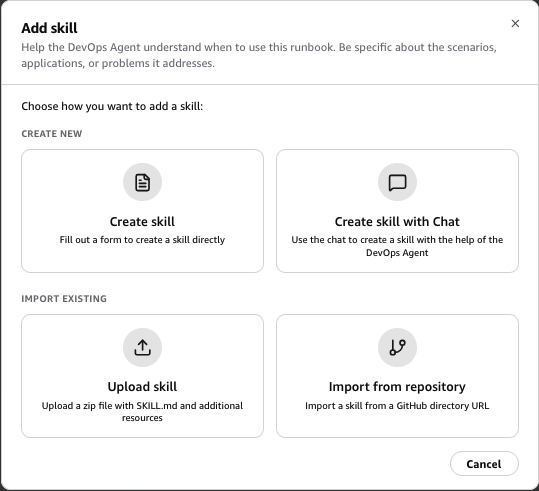
Choose how to create the skill.
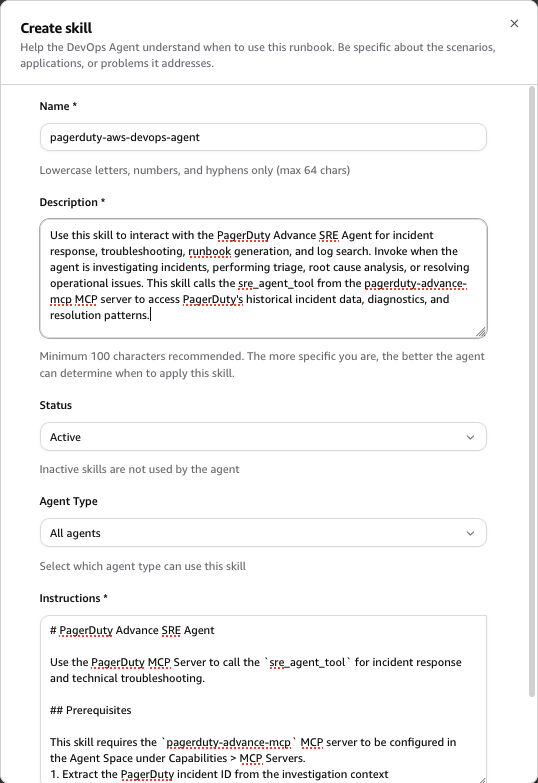
- Choose Create skill and fill out the skill instructions from the table below to create a skill
Fill out the skill instructions.
- You should see the pagerduty-aws-devops-agent skill added to the AWS DevOps Agent
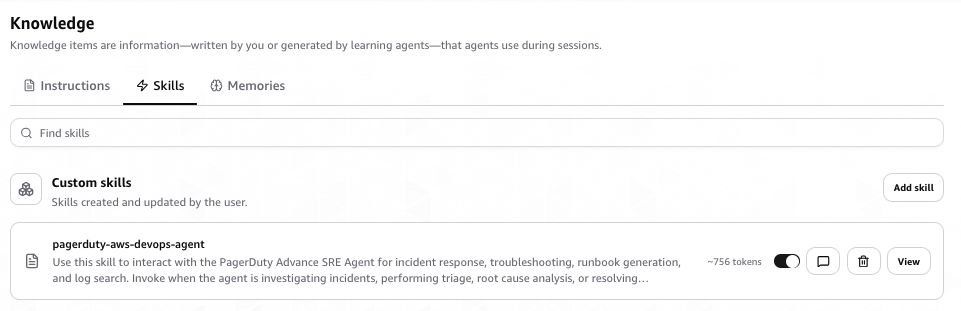
The pagerduty-aws-devops-agent skill added to AWS DevOps Agent.
Skill form instructions:
| Field | Value |
|---|---|
| Name | pagerduty-aws-devops-agent |
| Description | Use this skill to interact with the PagerDuty Advance SRE Agent for incident response, troubleshooting, runbook generation, and log search. Invoke when the agent is investigating incidents, performing triage, root cause analysis, or resolving operational issues. This skill calls the sre_agent_tool from the pagerduty-advance-mcp MCP server to access PagerDuty’s historical incident data, diagnostics, and resolution patterns. |
| Status | Active |
| Agent Type | Generic |
| Instructions | See the skill instructions code block below. |
Skill instructions (paste into the Instructions field):
# PagerDuty Advance SRE Agent

Use the PagerDuty MCP Server to call the `sre_agent_tool` for incident response and technical troubleshooting.

## Prerequisites

This skill requires the `pagerduty-advance-mcp` MCP server to be configured in the Agent Space under Capabilities > MCP Servers.

1. Extract the PagerDuty incident ID from the investigation context
2. Call the `sre_agent_tool` from the `pagerduty-advance-mcp` MCP server with:
   - `message`: a natural language question about the incident
   - `incident_id`: the PagerDuty incident ID
3. If follow-up queries are needed, continue calling `sre_agent_tool` with the same `incident_id` and a new `message`. Pass the `session_id` from the previous response to maintain conversation

## Tool Details

- **Tool name:** `sre_agent_tool`
- **MCP Server:** `pagerduty-advance-mcp`
- **Parameters:**
  - `message` (string, required) — natural language question about the incident
  - `incident_id` (string, required) — the PagerDuty incident ID
  - `session_id` (string, optional) — reuse from previous response for conversation continuity

## What the SRE Agent Can Help With

- Active incident analysis, triage, and resolution
- Root cause analysis and technical explanations
- Incident summaries and catch-ups
- Status updates for stakeholders
- Diagnostic checks and remediation recommendations
- Log interpretation and troubleshooting guidance
- Alert trigger analysis and explanations
- Change event analysis and impact assessment
- Playbook and runbook generation
- Past incident correlation and pattern recognition
- Service dependencies and related system analysis
- Real-time incident monitoring and alerting questions
Step 7: Test and validate
Before you call it finished, confirm things work end to end:
- Create a test incident in PagerDuty
- Confirm AWS DevOps Agent picks up the event and starts an investigation
- Watch the investigation move along in the AWS DevOps Agent console or web app
- Review the root cause summary, the mitigation plan, and the investigation findings
- Verify that root cause analysis and mitigation steps appear on the originating PagerDuty incident record. If you’ve also connected Slack, check that updates land in your configured channel
Start with a limited scope for your initial Agent Space. Focus on a single application or service first. Get comfortable with the integration, tune your configuration, and then expand from there.
Troubleshooting
A handful of things we’ve seen trip people up:
Registration fails with invalid credentials. Double-check that the Client ID and Client secret were copied from the right PagerDuty OAuth 2.0 Scoped OAuth app. Legacy PagerDuty OAuth apps (the ones configured with a redirect URI) aren’t supported. When credentials do need to change, deregister from the Capability Providers page and re-register with the new values, rather than trying to edit in place.
Webhook events don’t trigger an investigation. AWS DevOps Agent only supports PagerDuty V3 webhooks. If your PagerDuty subscription is still on an older webhook version, upgrade to V3. Full details live in Webhooks Overview in the PagerDuty developer documentation.
PagerDuty shows as registered, but isn’t active in an Agent Space. Registering at the account level and adding the provider to an Agent Space are two separate actions. On the Agent Space’s Capabilities tab, check that PagerDuty appears under Communications. If it doesn’t, add it there.
Region or subdomain mismatch. If your PagerDuty account is on the EU service region, make sure you picked EU during registration. The subdomain has to match the first label of your PagerDuty URL exactly (for example, your-company from https://your-company.pagerduty.com).
Conclusion
Most of what happens in the first several minutes of incident response is undifferentiated heavy lifting like opening dashboards, tailing logs, correlating deployments with AWS CloudTrail events. With the native PagerDuty Capability Provider in AWS DevOps Agent, investigations automatically begin by the time you’ve acknowledged your alert, giving your engineers a head start on root cause analysis before responders have finished triaging.
To get started, check out the AWS DevOps Agent documentation or reach out to your PagerDuty or AWS account team.
Resources
- AWS DevOps Agent Documentation
- Connecting PagerDuty to AWS DevOps Agent
- PagerDuty Webhooks Overview (V3)
- PagerDuty SRE Agent Showcase
- PagerDuty SRE Agent Knowledge Base
About the authors
 |
Shan KandaswamyShan is a Senior Partner Solutions Architect specializing in generative AI at AWS, dedicated to solving complex user challenges. He advocates for innovative AI solutions, distributed architecture, and serverless technologies, helping users harness the power of generative AI in their cloud journey. You can reach him on LinkedIn. |
 |
Laith Al-SaadoonLaith Al-Saadoon is a Principal AI Engineer at AWS. He created and launched AWS MCP Servers (30M+ PyPI downloads) and contributes to Strands Agents SDK — AWS’s open-source framework for building AI agents — along with other agentic AI open-source projects like Mem0 and Agno. He drives AWS’s autonomous software development and agentic AI strategy and builds production agentic systems that make agents work for the world’s largest companies. In his personal time, Laith enjoys the outdoors — fishing, photography, drone flights, and hiking with his wife. |
 |
Scott SchreckengaustScott Schreckengaust brings a biomedical engineering degree and decades of deep domain expertise in healthcare and life sciences to emerging technologies and AI. He’s spent his career building—from automating lab workflows and integrating enterprise systems to architecting full-stack software deployments in regulated environments. Now working as an AI engineer, Scott continues what he’s always done best: partner with customers to uncover their scientific and operational challenges, then engineer solutions that scale. His journey from the bench to the cloud reflects a consistent belief: the best technology is invisible—it just works. |
DORA Compliance Success Story: How PayNovus Strengthened Operational Resilience with Nebosystems & SecureVisio | InfoSec SEE 2026
Post Syndicated from Dora original https://nebosystems.eu/dora-compliance-with-securevisio-a-nebosystems-success-story/
The Digital Operational Resilience Act (DORA – Regulation EU 2022/2554) has introduced new requirements for financial entities across the European Union, placing operational resilience at the center of cybersecurity and risk management.
At InfoSec SEE 2026, Nebosystems and PayNovus presented a practical case study demonstrating how a financial institution approached DORA readiness through SecureVisio and Nebosystems’ SOC services.
Presented jointly by Nebosystems and PayNovus at InfoSec SEE 2026.
Watch the full conference presentation now:
The Challenge: Meeting the Requirements of DORA
DORA establishes a comprehensive framework designed to strengthen the resilience of financial institutions against cyber threats, technology disruptions and operational incidents.
Among the key areas addressed by the regulation are:
- ICT risk management;
- ICT incident management, classification and reporting;
- Digital operational resilience testing;
- Third-party ICT risk management;
- Continuous monitoring and information sharing.
Meeting these requirements often involves multiple stakeholders, complex processes and numerous security tools. Organizations must maintain visibility across their infrastructure, ensure regulatory alignment and establish efficient mechanisms for managing risks and responding to incidents.
For institutions operating in a highly regulated environment, achieving these objectives requires both technological capabilities and specialized expertise.
Nebosystems’ Approach
As a cybersecurity and compliance partner, Nebosystems supports organizations throughout their digital resilience journey by combining consulting expertise, managed security services, regulatory guidance and advanced cybersecurity technologies.
In the PayNovus project, Nebosystems followed a structured implementation methodology designed to align operational practices and technology capabilities with DORA requirements.
The engagement included three major phases:
1. Assessment and Gap Analysis
The project began with a comprehensive assessment of ICT assets, cybersecurity risks and existing operational processes.
Nebosystems worked closely with stakeholders to:
- Inventory critical ICT assets;
- Evaluate cybersecurity risks;
- Perform a gap analysis against DORA requirements;
- Map regulatory obligations to operational controls;
- Establish implementation priorities.
This phase created the foundation for a structured compliance and resilience program.
2. SecureVisio Implementation
To support operational and regulatory requirements, Nebosystems implemented SecureVisio, an integrated cybersecurity orchestration platform designed to unify critical security and compliance functions.
SecureVisio provides a centralized environment that combines:
- Asset management and CMDB capabilities;
- IT Governance, Risk, and Compliance (GRC);
- Threat and Vulnerability Management (TVM);
- Security Information and Event Management (SIEM);
- User and Entity Behavior Analytics (UEBA);
- Extended Detection and Response (XDR);
- Security Orchestration, Automation and Response (SOAR).
By consolidating these capabilities into a single platform, organizations gain improved visibility across their security ecosystem while reducing operational complexity.
During implementation, Nebosystems supported the deployment of centralized security management processes, automation workflows, risk registers and governance procedures necessary for ongoing compliance activities.
3. Continuous Monitoring and Operational Support
DORA requires continuous visibility and resilience capabilities. Nebosystems complements SecureVisio with managed SOC services, providing continuous monitoring, threat detection, incident response support and expert guidance. This helps organizations maintain an active security posture while supporting ongoing compliance efforts.
Business Outcomes
Organizations implementing SecureVisio together with Nebosystems’ SOC services can benefit from:
- Improved visibility across ICT assets, risks and compliance activities;
- Faster detection and response to security incidents;
- Reduced operational complexity through platform consolidation;
- Lower total cost of ownership compared to multiple standalone tools;
- Ongoing access to cybersecurity and compliance expertise;
- Enhanced readiness for evolving regulatory requirements.
Building Operational Resilience for the Future
The PayNovus case study presented at InfoSec SEE 2026 demonstrates how integrated technology, cybersecurity expertise and continuous monitoring can help financial institutions address DORA requirements while strengthening operational resilience. Through SecureVisio and Nebosystems’ SOC services, organizations gain a practical foundation for ICT risk management, incident response, resilience testing and ongoing compliance activities.
If your organization is preparing for DORA compliance, looking to enhance digital operational resilience, or seeking expert support for cybersecurity governance and security operations, Nebosystems can help.
Contact our team to learn more about:
- Security Operations Center (SOC) services;
- SecureVisio implementation and integration;
- Cybersecurity consulting and managed security services.
Discover how Nebosystems can help your organization navigate DORA requirements, strengthen cyber resilience and build a sustainable framework for digital operational resilience.
The FCC Wants to Eliminate Burner Phones
Post Syndicated from Bruce Schneier original https://www.schneier.com/blog/archives/2026/06/the-fcc-wants-to-eliminate-burner-phones.html
A proposed FCC rule would kill burner phones: phones whose accounts are not attached to a particular person.
The FCC plans to do this by legally forcing the country’s telecoms to store a wealth of personal information about essentially all phone customers, including a government issued identification number and their physical address, alarming privacy advocates and civil rights activists who compare the measures to those from authoritarian countries where it can be difficult to buy a mobile phone plan without giving up your identity.
The proposed change would drastically shake up how people obtain phone plans in the U.S., and have all sorts of privacy and cybersecurity knock-on effects. The FCC is proposing the data collection partly as a way to combat scammers, with telecoms being required to collect other information on business and foreign customers like the intended use case of their bulk phone plan purchase and their IP address. But the changes would mean telecoms collect data on all new and renewing customers, and the FCC provides a long list of other things that the collected data could help authorities with.
UK & Makerfield Election: Last Week Tonight with John Oliver (HBO)
Post Syndicated from LastWeekTonight original https://www.youtube.com/watch?v=RZL_TctrNco
S13 E15: Iran, FIFA & UK Elections: 6/14/26: Last Week Tonight with John Oliver
Post Syndicated from LastWeekTonight original https://www.youtube.com/watch?v=FsUNze_X-QA
Comic for 2026.06.15 – Pronouns
Post Syndicated from Explosm.net original https://explosm.net/comics/pronouns-4
New Cyanide and Happiness Comic
Tethys
Post Syndicated from xkcd.com original https://xkcd.com/3259/

The 7.1 kernel has been released
Post Syndicated from corbet original https://lwn.net/Articles/1077758/
Linus has released the 7.1 kernel.
“So it’s only Sunday morning back home, but it’s Sunday afternoon where
”
I am right now, so I’m doing the 7.1 release at the regular time –
just not in the regular timezone.
Significant changes in 7.1 include
the removal of support for some old 486-based architectures,
some new clone() flags making
process management easier,
BPF support for io_uring,
zero-copy-I/O support for the ublk user-space block
driver,
initial (incomplete) sub-scheduler support
in sched_ext,
more swapping improvements,
a completely rewritten NTFS
implementation,
and much more. See the LWN merge-window summaries (part 1, part 2) for details.
Upcoming Speaking Engagements
Post Syndicated from B. Schneier original https://www.schneier.com/blog/archives/2026/06/upcoming-speaking-engagements-57.html
This is a current list of where and when I am scheduled to speak:
- I’m giving a keynote at Cybernation 2026 in Berlin, Germany, on June 24, 2026.
- I’m speaking at the Potsdam Conference on National Cybersecurity at the Hasso Plattner Institut in Potsdam, Germany. The event runs June 24–25, 2026, and my talk will be the evening of June 24.
- I’m participating in a panel discussion at the Austrian Institute for International Affairs in Vienna on Thursday, June 25, 2026.
- I’m speaking at the Digital Humanism Conference in Vienna, Austria, on Friday, June 26, 2026.
- I’m giving a fireside chat for Epicenter Works, to be held at Kaffee Alt Wien in Vienna, Austria, on Friday, June 26, 2026.
- I’m participating (via Zoom) in a panel discussion at Quantum.Tech World in Boston, Massachusetts, USA, on Friday, June 26, 2026. The topic is “Q-Day’s Shortening Deadline: Immediate Solutions.”
- I’m speaking at Czech Technical University in Prague, Czechia, on Monday, June 29, 2026.
- I’m speaking at the Nuremberg Digital Festival in Nuremburg, Germany, on Wednesday, July 1, 2026.
- I’m speaking at CanSecWest 2026 in Vancouver, Canada. The conference runs September 30–October 1, 2026; the time of my talk is TBD.
The list is maintained on this page.
Comic for 2026.06.14 – Diss Track
Post Syndicated from Explosm.net original https://explosm.net/comics/diss-track
New Cyanide and Happiness Comic
Terry Pratchett Is England’s Funniest Writer
Post Syndicated from The Atlantic original https://www.youtube.com/shorts/_gEF6-3LPpI
Antropic Halts Access to Fable 5 and Mythos 5
Post Syndicated from Patrick Kennedy original https://www.servethehome.com/antropic-halts-access-to-fable-5-and-mythos-5/
Anthropic shut down access to Fable 5 and Mythos 5 due to an export control concern over the weekend in a wake-up call for the industry
The post Antropic Halts Access to Fable 5 and Mythos 5 appeared first on ServeTheHome.