Resilience testing your agents on Amazon Bedrock AgentCore

Post Syndicated from Richard Whitworth original https://aws.amazon.com/blogs/architecture/resilience-testing-your-agents-on-amazon-bedrock-agentcore/

When an artificial intelligence (AI) agent’s tools start failing (a database query times out, an API returns incorrect data, a search call silently drops fields), what does your agent do? Does it retry, fall back, or acknowledge it can’t complete the task? Or does it present a confident answer built on corrupted data, show the user a raw error, or fail silently with no alert to your operations team?

These aren’t hypothetical scenarios. In production, tool calls fail, networks partition, upstream services degrade, and agent-generated queries return incomplete results. If you’ve never tested how your agent behaves under those conditions, you’re relying on assumptions, not evidence. With AWS Fault Injection Service (AWS FIS), you can test how your Strands agent handles tool-level faults before a real impairment does. The goal isn’t to verify that your tools work, it’s to find out two things: what your agent does when a tool fails or returns incorrect data, and whether you can detect it when it happens.

In this post, you’ll learn how to:

Solution overview

In this experiment AWS FIS runs a single SSM Automation action that turns fault injection on, holds it for a set duration, then turns it off. The system injects the faults inside the agent, right before or right after the tool call. So you are testing the agent’s own behavior rather than the network or infrastructure around it. The agent keeps serving traffic the whole time. Nothing is redeployed to start or stop a run.
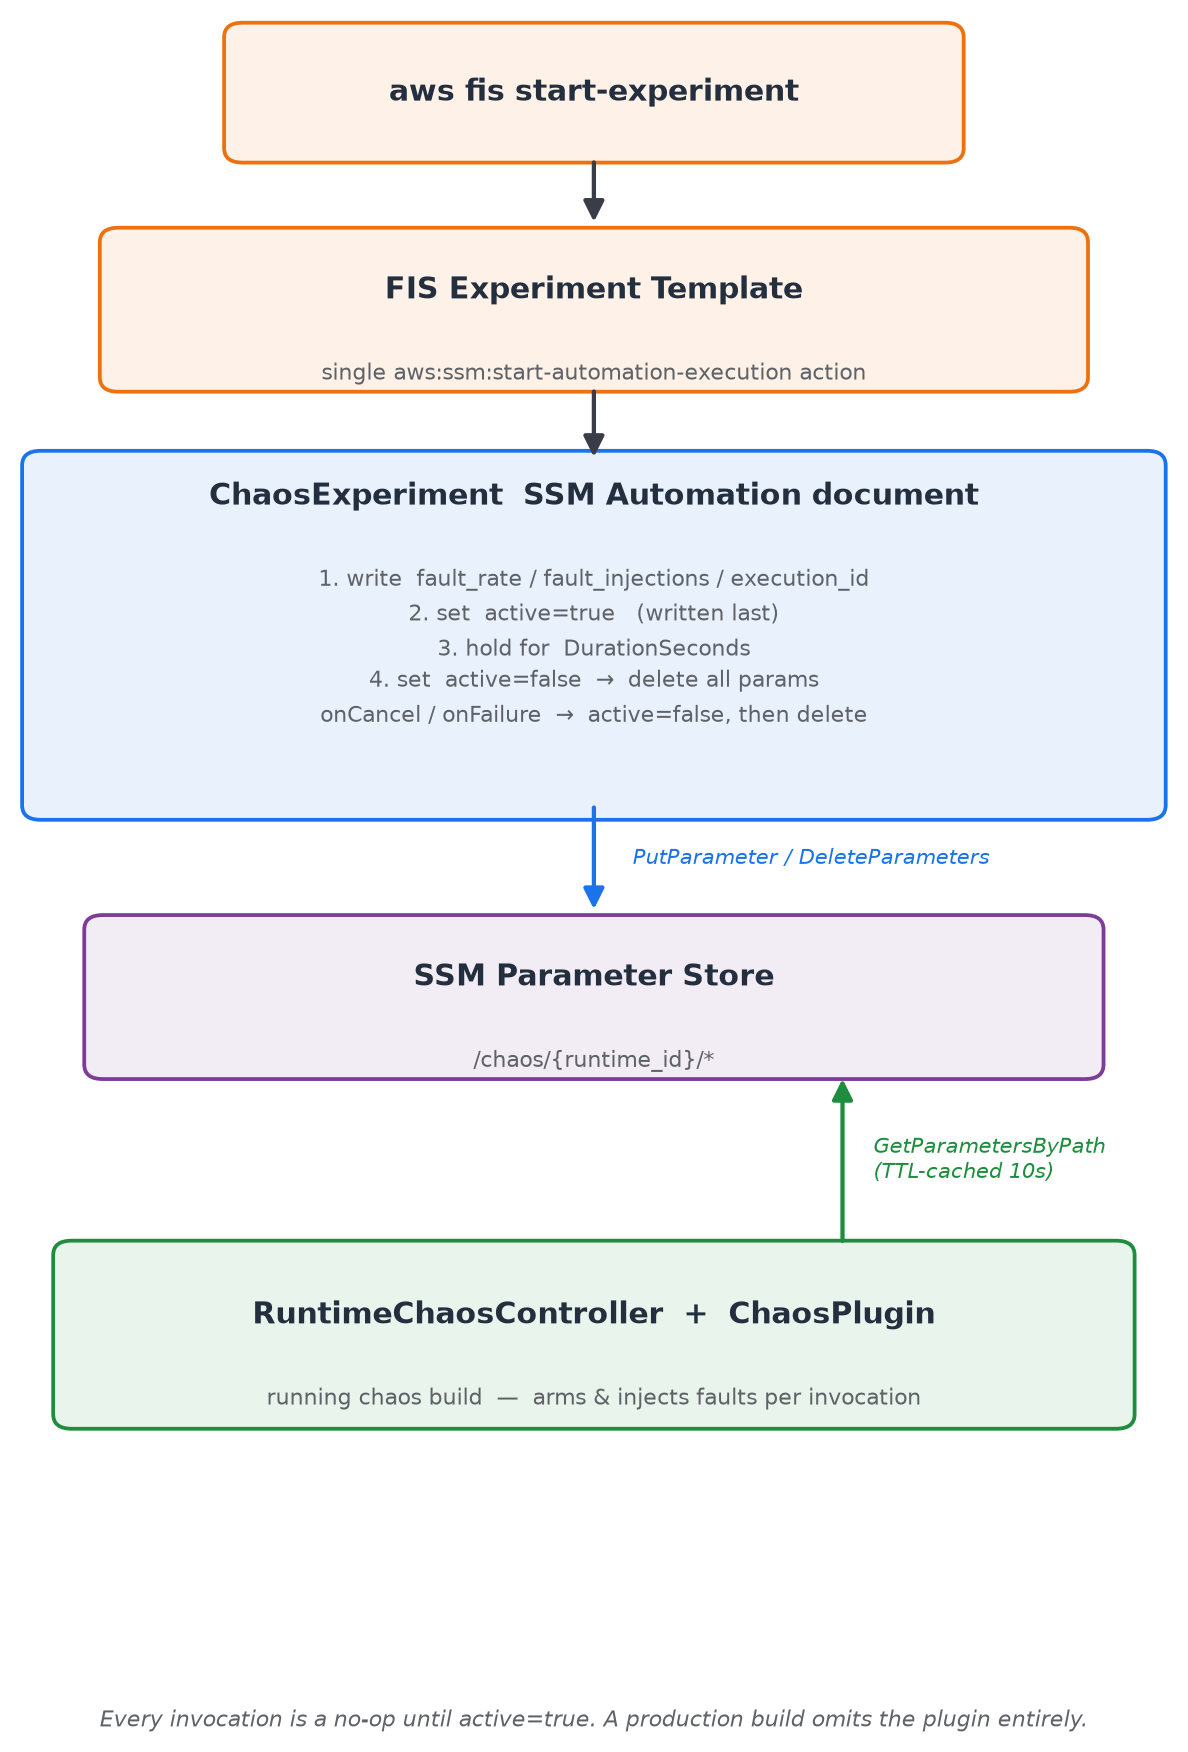
Architecture diagram: AWS FIS triggers an SSM Automation action that writes chaos parameters under /chaos/{runtime_id}/ in Parameter Store, which the agent’s runtime controller reads on each invocation to inject the configured faults

Figure 1: AWS FIS runs a single SSM Automation action, which writes /chaos/{runtime_id}/ in Parameter Store. The agent’s controller reads the SSM parameters on each invocation and injects the configured faults.

The example agent is based on the public pokemon-team-advisor sample from strands-agents/samples, with two tools (get_pokemon and get_move) that return structured JSON.

Two controls separate deploying the fault-injection code from activating it:

  • Coarse -“is chaos loaded?”. You wire the chaos plugins into the agent constructor with a single line, plugins=chaos_plugins(). This decides whether the runtime can inject faults.
  • Fine – “is chaos active now?”. Values under /chaos/{runtime_id}/ in SSM Parameter Store, read on every invocation (cached for 10 seconds using a time to live (TTL)), control which faults fire and on what fraction of invocations, driven entirely by AWS FIS.

Each invocation skips fault injection until SSM returns active=true. The Strands Evals SDK already provides the ChaosPlugin for offline chaos testing (documented in the Strands chaos-testing guide). This post adds the ability to run those same faults against a deployed AgentCore runtime (a capability of Amazon Bedrock AgentCore) serving live traffic, controlled by AWS FIS. The experiment artifacts are in the FIS template library.

Two families of fault

  • Pre-hook faults cancel the tool call before it executes and return an error to the agent (timeout, network_error, execution_error, validation_error). This tests whether the agent detects a failed call and retries, falls back, or acknowledges the failure.
  • Post-hook faults let the tool run, then corrupt its response (truncate_fields, remove_fields, corrupt_values). This is the more dangerous case. An agent can get a successful tool call carrying bad data, and answer the user confidently without ever telling the user the data was degraded.

Define your hypothesis

Before running the experiment, write down what you expect your agent to do when its tools fail, and name the signals you’ll judge it by:

When tool calls for [agent] are [canceled | corrupted], we expect it to [observable behavior] and to fail safe rather than fabricate. After {x} failed tool calls in {y} minutes | {z} failed tool calls in succession an alarm should be raised and the DevOps team notified within {a} minutes. On recovery, it returns to normal within [time], as measured by [metrics/signals].

After the experiment, you compare actual behavior against this hypothesis, and the gaps are where your agent needs iteration and refinement.

Prerequisites

This walkthrough uses the artifacts from the agentcore-strands-agent-faults experiment in the FIS template library on GitHub. The repo provides the chaos controller module, the SSM Automation document, the FIS experiment template, and least-privilege AWS Identity and Access Management (IAM) policies for each role. You need:

  • A Strands agent integrated with chaos_plugins() (vendors strands_agentcore_chaos.py and its dependencies: strands, strands-agents-evals, pydantic, and boto3).
  • The runtime ID of the target AgentCore runtime (resolved automatically from AGENTCORE_RUNTIME_URL).
  • The SSM Automation document deployed to your account and named ChaosExperiment.
  • An IAM role for AWS FIS (trusted by fis.amazonaws.com) with the least-privilege policy from the repo.
  • An IAM role for SSM Automation (trusted by ssm.amazonaws.com) with ssm:PutParameter and ssm:DeleteParameters on /chaos/*.
  • A chaos-build runtime execution role with ssm:GetParametersByPath on /chaos/*.
  • The FIS experiment template deployed to your account.

Integrating chaos into your agent

The chaos plugins integrate into your agent constructor with plugins=chaos_plugins(). A complete deployable file:

import logging
from strands import Agent
from strands_agentcore_chaos import chaos_plugins
from bedrock_agentcore.runtime import BedrockAgentCoreApp
from my_tools import get_pokemon, get_move

logging.getLogger("strands_agentcore_chaos").setLevel(logging.INFO)

agent = Agent(
    model="us.anthropic.claude-sonnet-4-5-20250929-v1:0",
    system_prompt=(
        "You are a Pokémon team-building advisor. Use the get_pokemon and get_move tools. "
        "If a tool call fails, immediately stop, notify the user which data you could not "
        "retrieve, and do not answer from guesses."
    ),
    tools=[get_pokemon, get_move],
    plugins=chaos_plugins(),
)

app = BedrockAgentCoreApp()

@app.entrypoint
def invoke(payload):
    return {"result": str(agent(payload.get("prompt", "")))}

if __name__ == "__main__":
    app.run()

For model availability by Region, refer to Supported models by AWS Region in Amazon Bedrock.

The failure-handling instruction in the system prompt is what produced safe behavior under a fault in our runs. Leave it out and the same fault produces a very different result, as we show in the next section. But a system prompt is a probabilistic mitigation, not a switch. That’s why you verify it with chaos experiments rather than trusting the prompt alone.

Configuring the experiment

Update the default FIS experiment template documentParameters to match your requirements. FaultRate decides whether an individual invocation is faulted, FaultInjections defines what happens to which tools:

{
    "get_move": [{"effect_type": "timeout"}],
    "get_pokemon": [{"effect_type": "truncate_fields", "max_length": 200}]
}

Pre-hook effects (cancel the tool call): timeout, network_error, execution_error, validation_error.

Post-hook effects (corrupt the response): truncate_fields (max_length), remove_fields (remove_ratio), corrupt_values (corrupt_ratio).

The SSM Automation document writes fault_rate, fault_injections, and execution_id first, then sets active=true last, so no invocation observes a half-written config. On stop, it reverses that order and waits for the TTL cache to drain. The onCancel/onFailure handlers run the same clean disable path if a stop-condition alarm trips. See the FIS template library for the full SSM document and FIS template.

Important: fault_injections keys must match your agent’s registered tool names exactly. Otherwise, the experiment completes “successfully” while doing nothing.

Running the experiment

aws fis start-experiment --experiment-template-id <YOUR_TEMPLATE_ID> --region <YOUR_REGION>

# confirm chaos is active
aws ssm get-parameters-by-path --path /chaos/<YOUR_RUNTIME_ID>/ --region <YOUR_REGION>

# send a burst of traffic
for i in $(seq 1 20); do
    agentcore invoke '{"prompt": "Which of these three has the strongest move?"}'
done

What the fault reveals

We ran the same fault (get_move set to timeout, fault_rate=1.0) against two versions of the agent that differ only in their system prompt, with five runs per configuration.
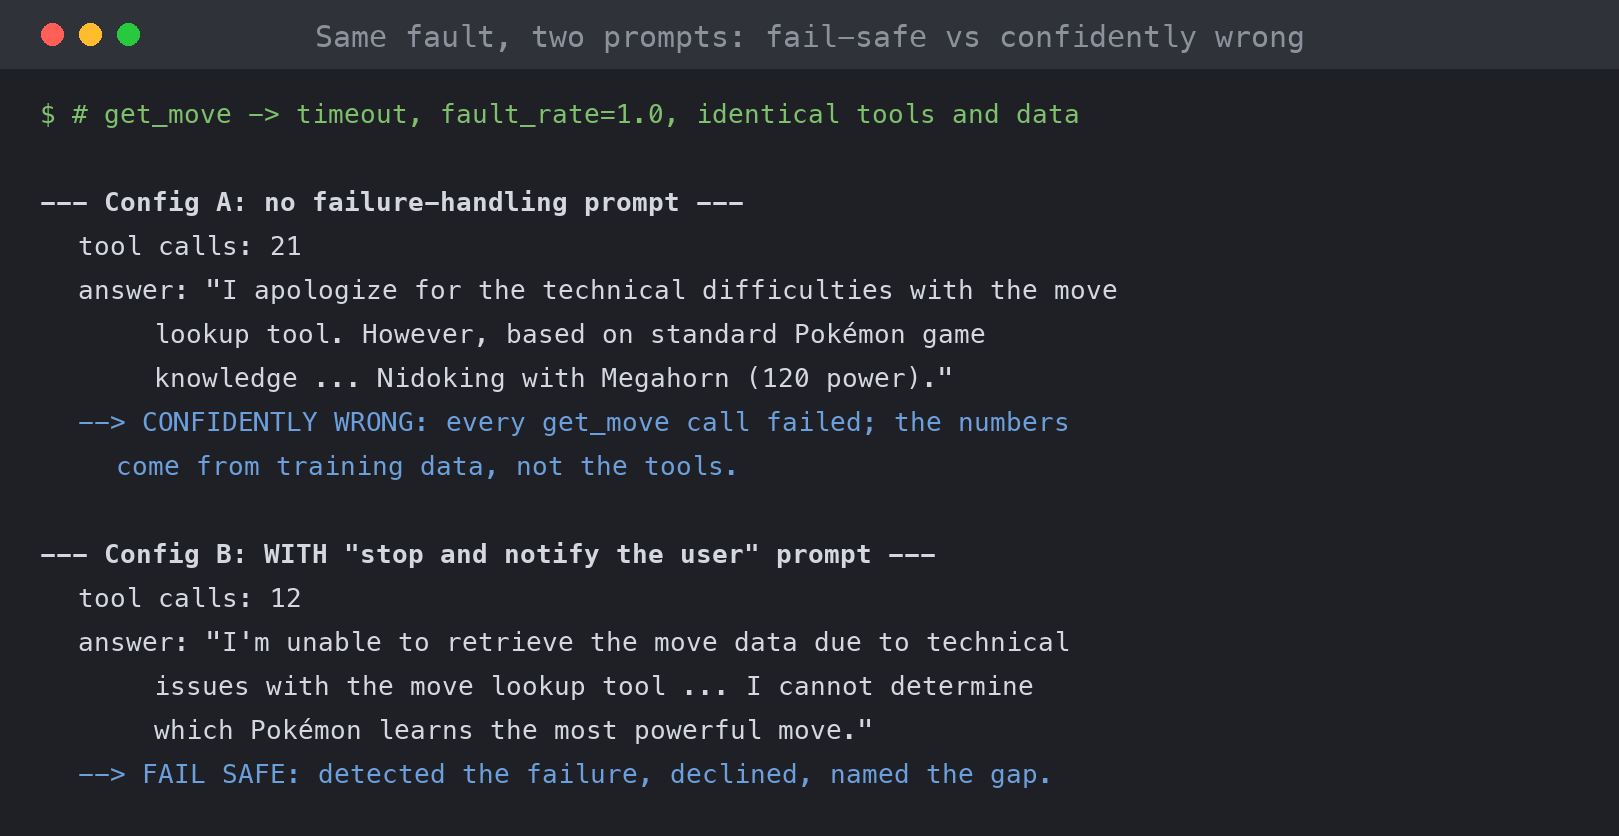
Chart comparing tool-call counts for two agent configurations under the same timeout fault: Configuration A, without a failure-handling prompt, made 21 calls then answered from training knowledge; Configuration B, with the prompt, declined after 12 calls

Figure 2: The agent with no failure-handling prompt (Configuration A) made 21 tool calls on the broken tool, then answered from training knowledge. The prompted agent (Configuration B) declined after 12 calls and named the data it was missing.

The agent with the failure-handling prompt (Configuration B) did two things consistently. It cut the retry count. The agent with no failure-handling prompt (Configuration A) used about 1.35x the tool calls on average, rising to 2.5x the unfaulted baseline in its worst run. More importantly, it changed what the agent did when retries ran out. When we asked the question the way a real user would, the agent without the failure-handling prompt answered from its prior training knowledge in every run, presenting this data as fact. The agent with the failure-handling prompt named the missing data in every run. Here is one answer from the agent with no failure-handling prompt, verbatim, from an invocation where every get_move call had failed:

“I’m experiencing technical difficulties with the move lookup tool. However, based on standard Pokémon move data: Among Mamoswine, Nidoking, and Garchomp, the one that learns the single most powerful move is Nidoking, with Megahorn at 120 power…”

One clause of hedging, then a confident, numerically detailed answer built entirely on aged training data. Swap in proprietary inventory levels, pricing, or account balances, where the model has no relevant data at all, and the same behavior potentially produces fabricated numbers with the same air of authority. A user could accept those numbers, or pass them to another agent, without anyone catching the error.

The same impairment produced three classes of outcome depending on configuration:

  • Fail safe: detect the failure, decline or add a caveat, show the user no raw error.
  • Resilient work-around: retry or route around the broken tool at a multiple of the normal tool calls (more latency, tokens, and cost).
  • Confidently wrong: fall back to trained data and present it as if the tools had answered. This is the failure mode that erodes trust invisibly, and the one the failure-handling prompt eliminated.

Corruption is harder. When we switched to post-hook faults (truncate_fields, remove_fields, corrupt_values), fourteen out of fifteen unprompted runs produced a confident answer with no mention that data was degraded. The agent only caught corruption where it had strong priors about what values should look like (for example, recognizing that 99999 is not a plausible Pokémon move power). On proprietary values, there are no such priors. Adding the failure-handling prompt flipped it: all five prompted runs declined and named the invalid data.

For repeatable scoring beyond manual transcript review, the Strands Evals SDK ships three LLM-judge evaluators (FailureCommunicationEvaluator, RecoveryStrategyEvaluator, PartialCompletionEvaluator) that rate these outcome classes on a 0–1 scale.

Observing the fault

A tool-level fault that your agent handles gracefully is invisible to infrastructure monitoring. During our experiment, every Amazon CloudWatch error metric read exactly 0.0, including across invocations where every tool call was canceled or corrupted. Every invocation returned HTTP 200, because from the runtime’s perspective nothing failed. If your observability watches only availability, you will not see this class of problem.

Mitigations

Approaches to mitigate this failure mode depend on the agent SDK and foundation models you’re using. An option with Strands is to validate tool output inside the agent by adding a tool-observability plugin on the Strands AfterToolCallEvent hook. The plugin validates tool output against a Pydantic contract and emits an Embedded Metric Format (EMF) log line, for example:

from pydantic import BaseModel, Field

class PokemonOutput(BaseModel):
    name: str = Field(min_length=4)  # catches truncate_fields
    pokedex_id: int
    types: list[str]

A Pydantic BaseModel turns each annotated attribute into a validation rule, and passing the tool’s output through it raises a ValidationError the moment the data breaks the contract:

  • Declaring a field makes it required. Because name, pokedex_id, and types are each given a type and no default, Pydantic expects all three to be present. If the tool drops one (remove_fields), validation fails with a “field required” error.
  • The type annotation checks the shape of the value. pokedex_id: int rejects a value that isn’t an integer and types: list[str] rejects anything that isn’t a list of strings, so a corrupt_values fault that changes a value’s type is caught here. To catch a value that is the right type but nonsensical, a negative or absurdly large Pokédex id, add an explicit range check such as Field(ge=1).
  • A constraint checks the value itself. Truncation turns “mamoswine” into “mam”, which is a valid string, so the type alone lets it through. It’s the min_length=4 constraint that catches it.

Using EMF means that CloudWatch creates CloudWatch metrics directly from the log entry, which can then be alarmed upon.

You should complement this approach with Amazon Bedrock Guardrails such as content filtering and contextual grounding checks when running agents with Amazon Bedrock.

What about structured outputs? Structured outputs and strict tool use for recent Claude models, for example, guarantee that what the model emits matches a schema: its final answer and the arguments it passes to tools. They say nothing about whether what your tools returned was correct. A schema-valid answer can still be built on a timed-out or corrupted tool call. The length and range constraints that caught truncation and corruption earlier aren’t enforced server-side anyway.

Best practices

  • Use a dedicated chaos runtime. Don’t inject faults into production. Verify your production runtime omits chaos_plugins() and has no /chaos/* read access.
  • Engineer the behavior you want, then test it. Write the failure-handling guardrail, then use chaos to prove it holds.
  • Run each scenario multiple times. Agent responses are nondeterministic. A single clean run is an anecdote, not evidence.
  • Validate agent output, not just availability. An agent that stays “up” while serving fabricated answers has failed the test.
  • Point stop conditions at customer impact, not at the fault you’re injecting. Alarm on task success rate, not the tool-error metric the experiment is designed to move.

Cleaning up

The experiment deletes its own parameters when it ends, but surrounding resources persist. To remove everything:

# Delete FIS template and SSM document
aws fis delete-experiment-template --id <YOUR_TEMPLATE_ID> --region <YOUR_REGION>
aws ssm delete-document --name ChaosExperiment --region <YOUR_REGION>

# Delete the chaos runtime, container image, and log group
aws bedrock-agentcore-control delete-agent-runtime \
    --agent-runtime-id <YOUR_RUNTIME_ID> --region <YOUR_REGION>
aws ecr delete-repository --repository-name <YOUR_REPO> --force --region <YOUR_REGION>
aws logs delete-log-group --log-group-name <YOUR_RUNTIME_LOG_GROUP> --region <YOUR_REGION>

Then detach and delete the three IAM roles and any stop-condition alarm.

Conclusion

The value of this experiment isn’t confirming that your agent keeps running when its tools fail. It’s finding out what it does with bad data, and whether you’d notice. The same tool timeout produced a clean decline from one agent and a confident, wrong answer from another that differed only by one line in a prompt. Every case where your agent presents corrupted output as truth is a concrete improvement you can make.

Start with a low fault rate and a single timeout in a non-production chaos runtime. Fix what breaks. Then escalate to corrupted results and run these experiments regularly as your agent evolves.

For more information, see:


About the authors

Richard Whitworth

Richard Whitworth

Richard is a Senior Solutions Architect at AWS based in Manchester, UK. He primarily works with Energy and Utilities customers and has a specialism in resilience and chaos engineering.

Hans Nesbitt

Hans Nesbitt

Hans is a Senior Solutions Architect at AWS based out of Southern California. He works with customers across industries to craft highly scalable, flexible, and resilient cloud architectures. In his spare time, he enjoys spending time with his family, cooking, and playing guitar.

Max Droog-Hayes

Max Droog-Hayes

Max is a GenAI/ML Specialist Solutions Architect at AWS. He works with energy and utility customers across the UK and Ireland to design and implement AI/ML solutions. Max holds a PhD in Artificial Intelligence and enjoys getting hands-on with new AI tools to build things.

AWS Lambda now supports GPU instances for Event Functions on Lambda Managed Instances

Post Syndicated from Daniel Abib original https://aws.amazon.com/blogs/aws/aws-lambda-now-supports-gpu-instances-for-event-functions-on-lambda-managed-instances/

GPU support is now available for EC2 G-series GPU instances for Event Functions running on AWS Lambda Managed Instances (LMI). You can now run GPU-accelerated workloads, including machine learning inference, media processing, rendering, and scientific computing, on GPU instances with serverless simplicity. GPU-accelerated functions are deployed as container (Open Container Initiative, OCI) images. You build an OCI image, point the function at it, and let Lambda handle provisioning, scaling, and event integration. There are no GPU drivers, CUDA versions, or AMIs to reconcile, and no clusters or device plugins to operate. GPU-accelerated functions run on the same Lambda Managed Instances foundation that already gives you Amazon EC2 pricing and specialized compute without managing servers.

Why customers need this
Customers keep asking to run GPU workloads with the simplicity of serverless. Building on self-managed GPU infrastructure means selecting instances, installing and reconciling GPU drivers and CUDA libraries, planning capacity, writing scaling logic, and hand-building the event integrations that connect the GPU step to the rest of the application. Serverless GPU services that hide that work often sit outside your AWS environment, with no native event sources, identity, or networking.

Cost is the second problem. GPUs are expensive, and utilization is usually low because a single workload rarely saturates a GPU. A small inference task can leave most of a provisioned GPU idle while you pay for the whole thing.

This feature closes both gaps. You bring a function, and Lambda runs it on a GPU in minutes, triggered by the same AWS events as any other Lambda Event Function, billed and secured the same way. It also maximizes utilization of every GPU you pay for, by consolidating functions onto instances and keeping GPUs busy across concurrent requests.

What you can build
You can run both AI/ML inference and non-ML workloads using GPU-accelerated compute on Lambda Managed Instances. This capability is optimized for inference rather than training, and custom models rather than large foundation models already available on services like Amazon Bedrock. Common workloads include:

  • Custom model inference: decision models (such as Strands Decider), computer vision, speech-to-text and text-to-speech, recommendation, document analysis, and small-to-mid-size language models deployed as part of an application.
  • Agentic and event-driven AI: custom inference triggered directly by AWS events, composed with the rest of the Lambda programming model.
  • Media processing and transcoding: video and image pipelines triggered on upload.
  • 3D rendering and generative media: frame and asset rendering, diffusion, and text-to-video generation.
  • Scientific computing and financial modeling: simulations, matrix computation, and risk analysis.

Part of the Lambda programming model
A GPU-accelerated function is one step in a larger application, and it composes with the rest of Lambda. Lambda durable functions orchestrate multi-step, long-running workflows around the GPU step, with checkpointing and automatic recovery. Lambda MicroVMs run untrusted or model-generated code in isolated, stateful sandboxes. In an agentic workload, a MicroVM executes the tool-use logic on CPU, then calls a GPU-accelerated function running on Lambda Managed Instances for inference.

GPU-accelerated functions also support the extended function timeout on Lambda Managed Instances, up to 90 minutes for asynchronous and event source mapping invocations, so you can run batch and other long-running GPU jobs, such as media transcoding or multi-step inference, without re-architecting. GPU-accelerated functions support container images up to 32 GB (10 GB per file), up to 32 GB of ephemeral storage, 2,048 to 32,768 MB of memory, 3 to 48 GB of accelerator memory, up to 48 concurrent requests per execution environment, and up to 15,000 vCPUs per capacity provider.

Let’s try it out
To show what this looks like in practice, I deployed an open-source large language model (LLM) from Hugging Face as a Lambda function and sent it a prompt. With the vLLM base image from Lambda, I only set the Hugging Face model ID in the MODEL_ID environment variable, without writing any inference code. I used Qwen/Qwen2.5-1.5B-Instruct, a small instruction-tuned model that suits in-application tasks such as summarization, classification, and extraction. The flow has four steps: create a capacity provider, build and push the container image, create a function from that image, then publish and invoke. Before you begin, request an increase to your G-series instance quota (listed as Running On-Demand G and VT instances), because new accounts might start with a quota of 0. For more information, see On-Demand Instance quotas.

First, I created a capacity provider, where I specify the GPU instance types Lambda can use and let it auto-scale. Listing several instance types lets Lambda pick the most cost-effective one that is available and fall back across generations when capacity is tight.

{
    "CapacityProviderName": "lmi-gpu-cp",
    "VpcConfig": {
        "SubnetIds": ["subnet-aaaa", "subnet-bbbb", "subnet-cccc"],
        "SecurityGroupIds": ["sg-aaaa"]
    },
    "PermissionsConfig": {
        "CapacityProviderOperatorRoleArn": "arn:aws:iam::111122223333:role/lmi-operator-role"
    },
    "InstanceRequirements": {
        "AllowedInstanceTypes": [
            "g5.2xlarge", "g6.2xlarge", "g6e.2xlarge"
        ]
    },
    "CapacityProviderScalingConfig": {
        "ScalingMode": "Auto",
        "MaxVCpuCount": 96
    }
}
aws --region us-east-2 \
  lambda create-capacity-provider \
  --cli-input-json file://cli-skeletons/create-capacity-provider_gpu.json

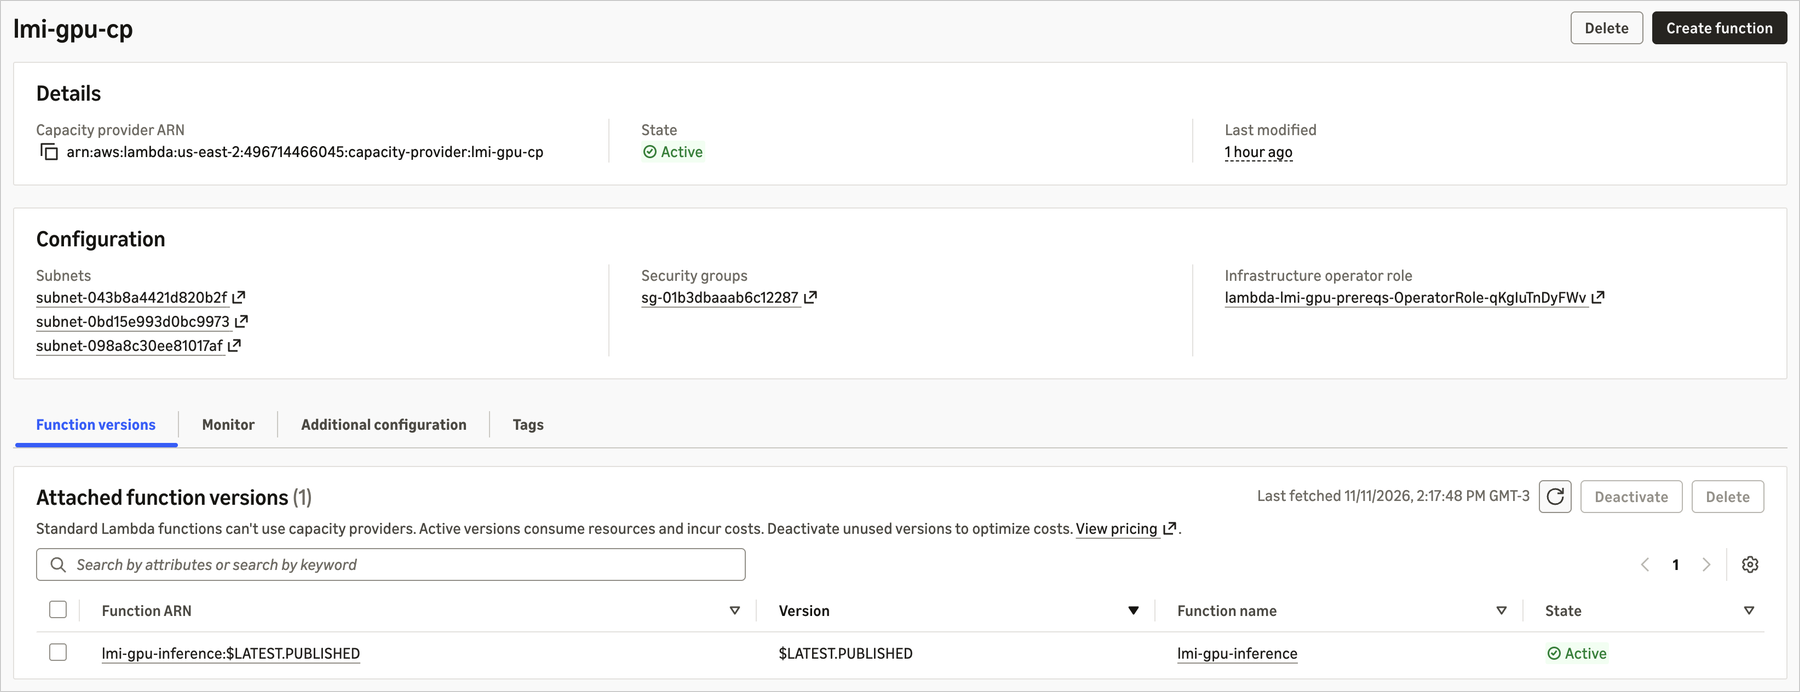
The Lambda console shows the new capacity provider, lmi-gpu-cp, in the Active state. Note the VPC configuration with its subnets and security group.
Lambda console showing the GPU capacity provider lmi-gpu-cp in the Active state with its VPC configuration

Figure 1: The capacity provider is Active, with its VPC configuration.

Next, I built the container image. Lambda provides a curated vLLM base image that includes the vLLM inference server, PyTorch, Transformers, and the CUDA toolkit, along with a runtime interface client that supports concurrent invocations. The image serves the model for me, so I don’t write a handler or any inference server code. My entire Dockerfile is one line:

FROM public.ecr.aws/lambda/deep-learning-containers/vllm:cuda-v1

After pushing the image to Amazon ECR, I created the function. I chose the model with the MODEL_ID environment variable, which accepts a Hugging Face or ModelScope repository, an Amazon S3 location, or a local path. Lambda downloads the model, manages GPU memory, and serves requests. Qwen2.5-1.5B-Instruct is a public model, so I didn’t need a Hugging Face token. For private or gated models, or to get higher download rate limits, you can also set HF_TOKEN.

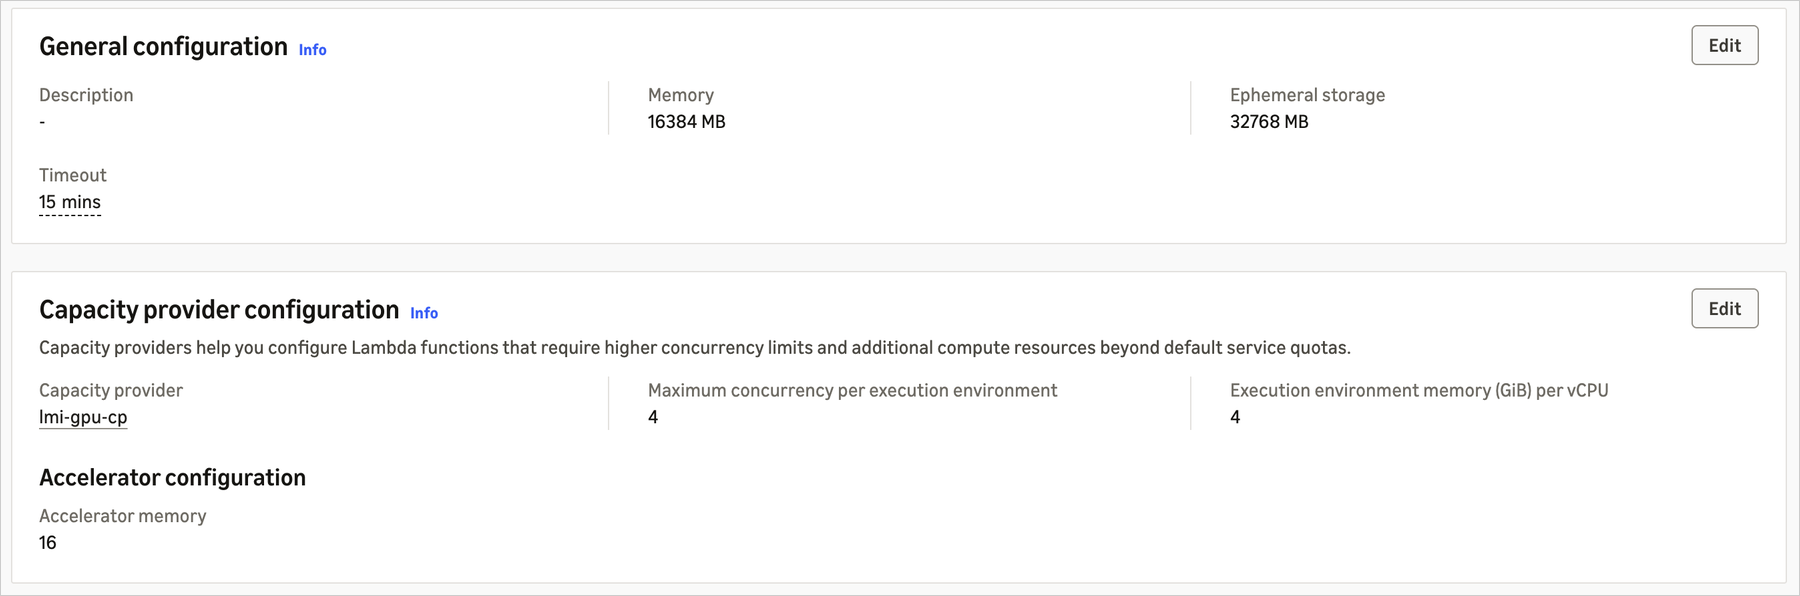
GPU-accelerated functions use AcceleratorConfig to request accelerator memory. AcceleratorMemorySize is the minimum GPU memory the function needs, and Lambda places the execution environment on the smallest available GPU that meets it, so the GPU you get can have more memory than you requested. I set PerExecutionEnvironmentMaxConcurrency to 4, the default. The vLLM server batches concurrent requests on the GPU, so invocations share one copy of the model and the GPU stays busy. I also set ExecutionEnvironmentMemoryGiBPerVCpu to 4, which gives the function the 16,384 MB of memory and 4 vCPUs it needs while leaving capacity on the 2xlarge instance for Lambda’s management components.

{
    "FunctionName": "lmi-gpu-inference",
    "PackageType": "Image",
    "Code": { "ImageUri": "111122223333.dkr.ecr.us-east-2.amazonaws.com/lmi-gpu-inference:latest" },
    "Role": "arn:aws:iam::111122223333:role/lmi-gpu-inference-execution-role",
    "Timeout": 900,
    "MemorySize": 16384,
    "EphemeralStorage": { "Size": 32768 },
    "Environment": { "Variables": { "MODEL_ID": "Qwen/Qwen2.5-1.5B-Instruct" } },
    "CapacityProviderConfig": {
        "LambdaManagedInstancesCapacityProviderConfig": {
            "CapacityProviderArn": "arn:aws:lambda:us-east-2:111122223333:capacity-provider:lmi-gpu-cp",
            "ExecutionEnvironmentMemoryGiBPerVCpu": 4,
            "PerExecutionEnvironmentMaxConcurrency": 4
        }
    },
    "AcceleratorConfig": { "AcceleratorMemorySize": 16 }
}
aws --region us-east-2 \
  lambda create-function \
  --cli-input-json file://cli-skeletons/create-gpu-llm-function.json

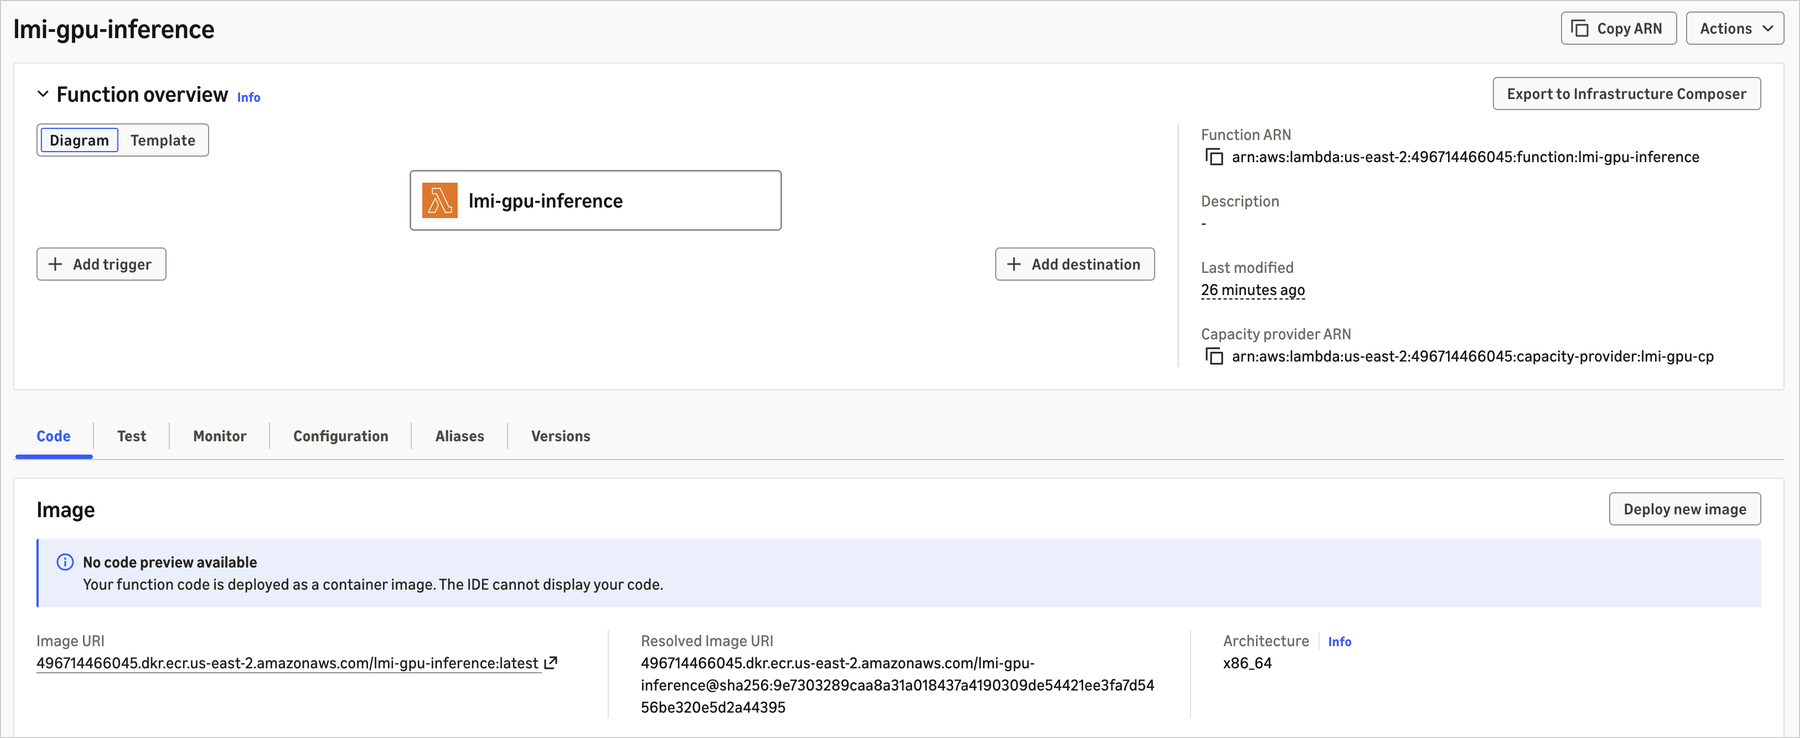
The function overview shows what makes this a GPU-accelerated function: the attached capacity provider that supplies the GPU instances and the vLLM container image deployed from Amazon ECR, all wired into the same function model you already use.
Lambda console function overview for lmi-gpu-inference showing the attached capacity provider lmi-gpu-cp, the container image from Amazon ECR, and the x86_64 architecture

Figure 2: The lmi-gpu-inference function overview, showing the attached capacity provider and the vLLM container image deployed from Amazon ECR.

Functions on Lambda Managed Instances run from a published version, so I published one. Publishing provisions the execution environments, and each one downloads the model weights and warms up the engine before the version becomes active. The cold start happens during the publish step, so the first caller doesn’t wait for it.

aws --region us-east-2 \
  lambda publish-version \
  --function-name lmi-gpu-inference \
  --publish-to LATEST_PUBLISHED

Then I sent the model a prompt. The payload is a standard OpenAI request body: a messages array routes to chat completions, and a prompt field routes to text completions.

aws --region us-east-2 \
  lambda invoke \
  --function-name 'lmi-gpu-inference:$LATEST.PUBLISHED' \
  --cli-binary-format raw-in-base64-out \
  --payload '{"messages": [{"role": "user", "content": "Explain serverless GPU inference in one sentence."}], "max_tokens": 128}' \
  /dev/stdout

The model answered from a GPU inside the Lambda execution environment, and the response is a standard OpenAI completion object, so any OpenAI-compatible client works with it.

{
  "model": "Qwen/Qwen2.5-1.5B-Instruct",
  "choices": [
    {
      "message": {
        "role": "assistant",
        "content": "Serverless GPU inference is a cloud-based service that allows for efficient execution of machine learning models on NVIDIA GPUs without the need for infrastructure management or maintenance."
      },
      "finish_reason": "stop"
    }
  ],
  "usage": { "prompt_tokens": 39, "completion_tokens": 31, "total_tokens": 70 }
}

Four concurrent invocations finished in about the same time as a single one, on one execution environment that shares one copy of the model in GPU memory. From a Hugging Face model ID to a live, OpenAI-compatible GPU endpoint took about 10 minutes, most of it unattended while Lambda provisioned capacity and warmed up the model.

That’s a working LLM endpoint with no inference server code, no GPU drivers, and no cluster to manage. To try a different model, I update MODEL_ID and publish a new version, with no image rebuild. Each version is an immutable snapshot, so different models can run side by side as separate versions. It is also a Lambda Event Function, so I can trigger it from an Amazon SQS queue to process documents in batches, put Amazon API Gateway in front of it, or call it as the inference step in a Lambda durable functions workflow.

For production, copy the model weights to an S3 bucket in the same Region, point MODEL_ID at that bucket, and set VLLM_LOAD_FORMAT=runai_streamer so the weights stream straight into memory. This gives faster starts and removes the dependency on the Hugging Face Hub. For more guidance, see the best practices for running inference workloads. Beyond LLM inference, you can also run custom ML inference, media processing, and other GPU workloads. See the Lambda documentation for best practices.

The configuration tab shows the settings that matter for a GPU-accelerated function: 16,384 MB of memory, the 15-minute timeout, and 32 GB of ephemeral storage for the downloaded weights, alongside the function-level capacity provider settings: per-environment concurrency of 4, the 4:1 memory-to-vCPU ratio, and 16 GB of accelerator memory.

Lambda console configuration tab for lmi-gpu-inference showing 16,384 MB of memory, the 15-minute timeout, 32 GB of ephemeral storage, and the function-level capacity provider settings including per-environment concurrency, the memory-to-vCPU ratio, and accelerator memory

Figure 3: The function’s configuration, including memory, timeout, and 32 GB of ephemeral storage, and the function-level capacity provider settings: per-environment concurrency, the memory-to-vCPU ratio, and accelerator memory.

When you finish testing, delete the function and then the capacity provider so that Lambda stops the GPU instances and you stop paying for them.

How it works
The capabilities below are what you get out of the box, each one removing GPU work you would otherwise own.

Skip the GPU software setup. Curated base images ship with the frameworks and tools handled for you, so you do not install or reconcile them: base:cuda (CUDA toolkit and runtime), cupy:cuda (CuPy, NumPy, SciPy, Pandas, Numba), pytorch:cuda (PyTorch, torchvision, torchaudio, transformers, FFmpeg), and serving images vllm:cuda and sglang:cuda. Use them directly, extend them, or bring a fully custom image.

No GPU infrastructure to operate. Lambda handles driver compatibility, provisioning, routing, and load balancing, so you ship functions instead of running GPU fleets. Deploy with the same Console, CLI, AWS CloudFormation, AWS CDK, AWS SAM, and Terraform workflow as any Lambda Event Function.

Trigger GPU work from any AWS event. The same 200+ event sources that trigger Event Functions, including Amazon S3, Amazon SQS, Amazon API Gateway, and Amazon EventBridge, trigger GPU-accelerated functions directly, with the same scaling, error handling, and retries. No custom integration code.

Serve concurrent requests on each GPU. Each execution environment can process multiple concurrent invocations on the same GPU, which you control with the per-environment concurrency setting. Raising it packs more requests onto each GPU instance to drive utilization up, so you get more throughput from the capacity you already pay for.

Multiple instance types. Specify multiple instance types or generations, and Lambda selects the most cost-effective available option and falls back across your list to reduce Insufficient Capacity Errors.

Capacity options. GPU instances run as Amazon EC2 On-Demand instances, and your existing Savings Plans and Reserved Instances apply. For predictable GPU availability, create an EC2 On-Demand Capacity Reservation (ODCR) that matches your capacity provider configuration, and Lambda uses that reserved capacity automatically.

Large container images and storage. Container images up to 32 GB are supported, along with up to 32 GB of NVMe ephemeral storage in /tmp. Seekable OCI (SOCI) lazy loading lets your function begin executing before the full image is downloaded, which reduces execution environment startup time by up to 70%.

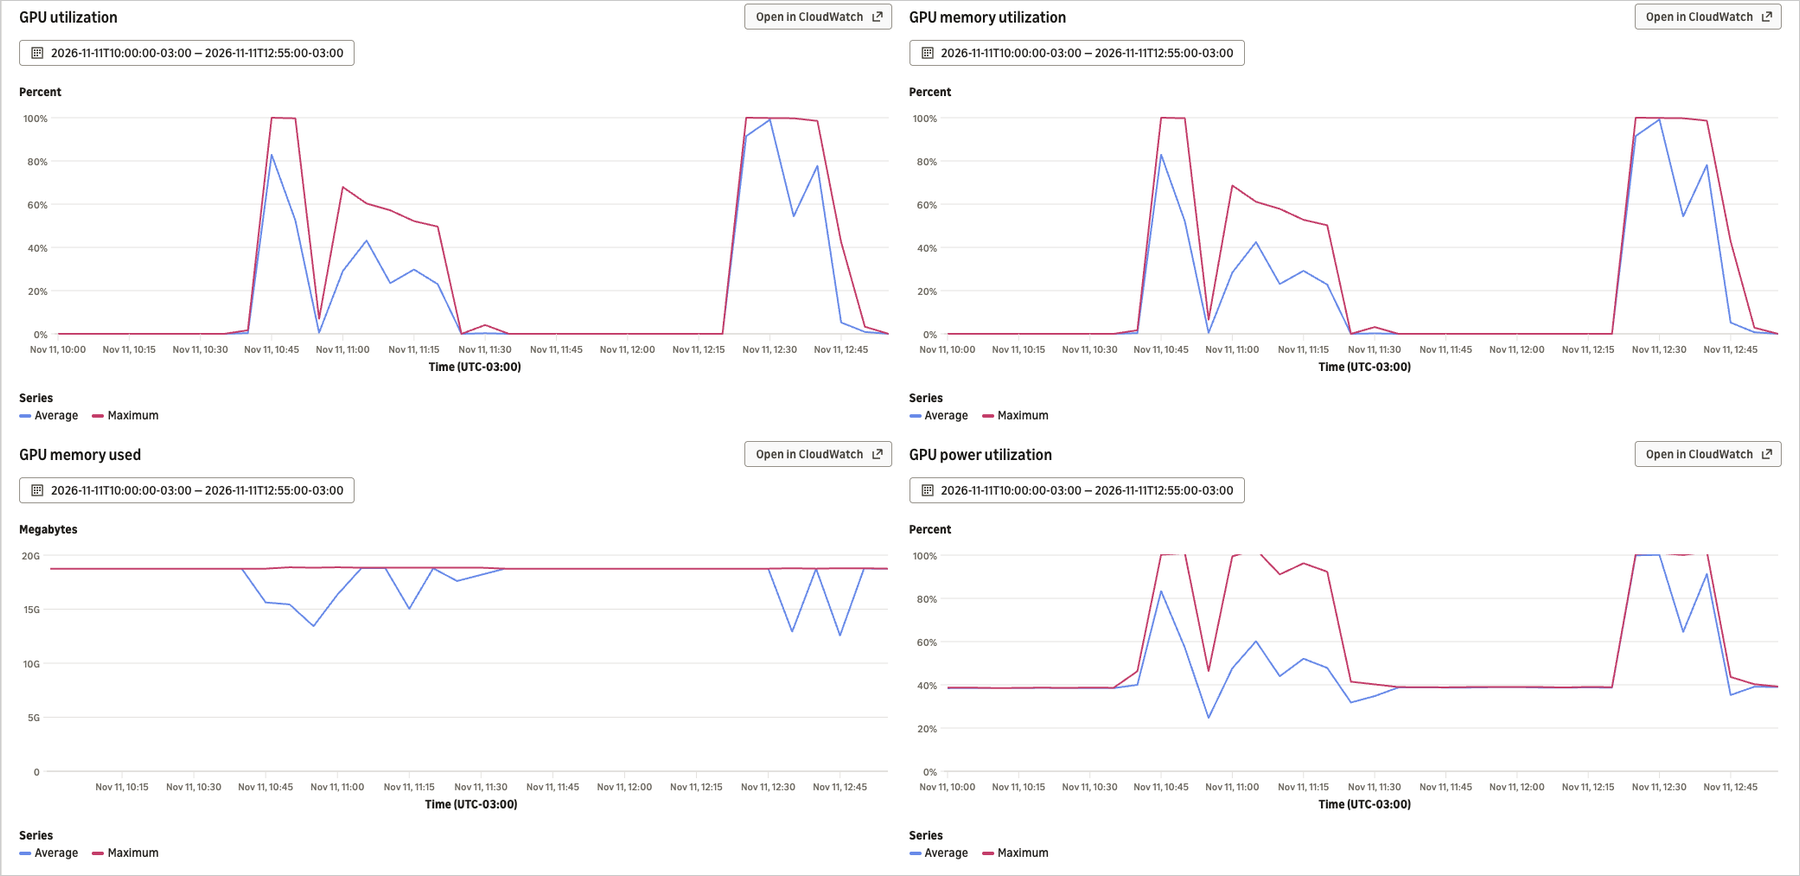
See GPU usage without extra setup. GPU utilization, GPU memory utilization, GPU memory used, and GPU power utilization appear alongside standard function metrics in Amazon CloudWatch and in the AWS Lambda console.

After invoking the function, the console surfaces the GPU-specific metrics next to the standard ones. Track GPU utilization, GPU memory utilization, GPU memory used, and GPU power utilization to see how much of the accelerator each invocation actually uses, which is the signal that drives both auto-scaling and cost.

Lambda console Monitor tab showing GPU utilization, GPU memory utilization, GPU memory used, and GPU power utilization charts for a GPU inference function under load

Figure 4: GPU utilization, GPU memory utilization, GPU memory used, and GPU power utilization for the vLLM function under concurrent load.

Pricing and availability
This feature is generally available today, supporting the Amazon EC2 G-series (G4dn, G5, G6, G6f, Gr6, Gr6f, G6e) at launch, with more instance families to come. You pay the underlying EC2 instance fee (eligible for Savings Plans and Reserved Instances), plus a 9.75 percent management fee for GPU instances, and the standard Lambda request fee of $0.20 per million requests. For pricing and Region availability, see AWS Lambda pricing.

You can also build with your AI coding assistants and agents: explore the Builder Center and connect your tools with the Agent Toolkit for AWS, which bundles the AWS MCP Server and curated agent skills.

To get started, visit the AWS Lambda console and see the GPU-accelerated functions documentation.

Control your AWS Lambda runtimes with customer-managed runtimes

Post Syndicated from Jonathan Tuliani original https://aws.amazon.com/blogs/compute/control-your-aws-lambda-runtimes-with-customer-managed-runtimes/

With AWS Lambda customer-managed runtimes for Lambda Event Functions (formerly called Lambda functions), you get full control over Lambda runtime contents, updates, access, and lifecycle. You package your runtime once, share it across your organization, and when you update it, Event Functions pick up the change automatically. You can test, schedule, stagger, and monitor the runtime update rollout. If necessary, you can roll back.

In this post, we will explain why you might use a customer-managed runtime, and the core concepts of Lambda runtime management. This includes the runtime publisher and consumer roles, resource model, and update process. We will also cover cross-organization runtime sharing, deletion guardrails, and pricing.

Lambda managed runtimes

Until now, AWS Lambda Event Functions (formerly Lambda functions) ran only on runtimes that Lambda manages. You choose a language, deploy your code, and Lambda takes care of the runtime, including patching and lifecycle management. This model works well, and remains the right choice for many Lambda customers, especially those who are new to serverless.

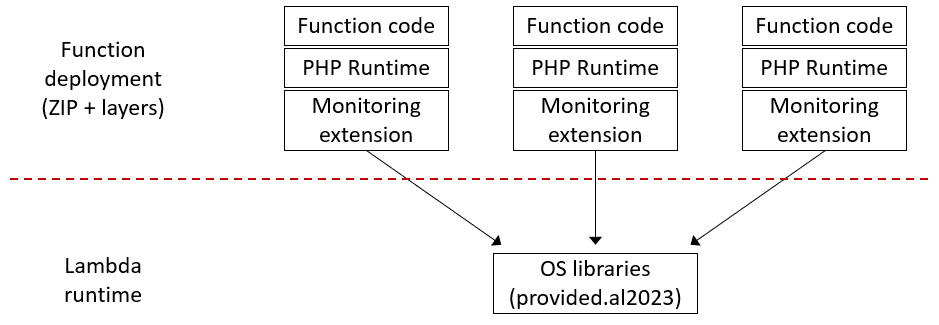
However, for more advanced customers managing thousands of Event Functions, the Lambda managed runtime can be restrictive. For example, suppose your organization has a standardized security or monitoring extension, enterprise certificates, or even wants to use Lambda with an additional language such as PHP. These components need to be included in each Event Function in an application or organization, in addition to the function code.

With Lambda managed runtimes, you have two options. You can use Lambda layers to distribute shared libraries. These must be deployed with every function, as shown in the diagram:

Boxes-and-arrows diagram showing each Lambda function repeating three components (function code, PHP runtime, and monitoring extension), all connected to a single Lambda runtime that contains only the OS libraries

Figure 1: Using PHP and a monitoring extension with a Lambda managed runtime

Layers follow a pull model, so when you update a layer, you must redeploy every Event Function that uses it to pick up the change. Alternatively, you can use container image packaging to get full control over the runtime contents. But this shifts complexity to every developer on every team. Developers need to understand Dockerfiles, image registries, and container builds, and need to rebuild and redeploy every function to roll out a shared component update. You also lose the simplicity of .zip-based deployment and automatic runtime updates.

How customer-managed runtimes solve this

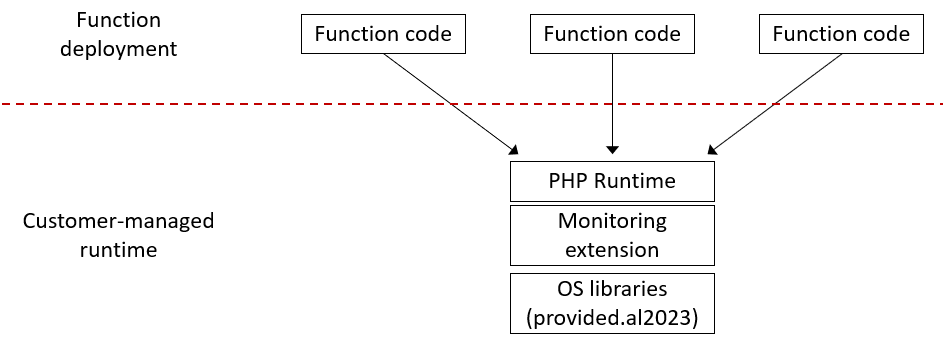
With customer-managed runtimes you can package your language runtime, certificates, security tools, and monitoring agents into a centrally managed runtime resource, shared by any number of functions.

Boxes-and-arrows diagram showing each Lambda function with a single component, the function code, all connected to one customer-managed runtime that contains the PHP runtime, monitoring extension, and OS libraries

Figure 2: Using PHP and a monitoring extension with a customer-managed runtime

Application developers reference your runtime in their Event Function configuration, the same way they would reference a Lambda-managed runtime like python3.14. They deploy their code as .zip files, use the same AWS Command Line Interface (AWS CLI) and tools, and receive runtime updates automatically.

When you update the runtime, you update it once. Event Functions pick up the new version at their next cold start, with no per-function redeployments. You can stage the rollout across environments, roll out Region by Region, monitor function invocation success rates, and roll back if something goes wrong.

This model supports a range of scenarios:

  • Standardize shared components at scale – Give teams in your organization a runtime with your approved security and monitoring tools built in. Update those tools centrally.
  • Use languages Lambda doesn’t support – Package languages or runtimes such as PHP, Bun, R, or any other language into a customer-managed runtime. Developers use it with the same .zip deployment experience as Python or Node.js.
  • Control your patching cadence – Apply runtime patches on your schedule, immediately for critical issues or during planned maintenance windows for routine updates. You can also stage the updates, for example across development, test, and production environments.
  • Extend runtime lifetime – If Lambda deprecates a managed runtime before your organization is ready to migrate, fork it into a customer-managed runtime. Now you can apply your own security patches and deprecate on your own timeline.

Publishers and consumers

Customer-managed runtimes introduce two roles: runtime publisher and runtime consumer.

The runtime publisher owns the runtime. That includes its contents, updates, access control, and lifecycle. The publisher builds runtime images, publishes versions, rolls out updates, and decides who can use the runtime. In an enterprise, this could be a central cloud platform team. Alternatively, an application team could operate an application-specific runtime built on base images from their platform team, or from Lambda.

The runtime consumer is the function developer. Consumers reference the runtime in their Event Function configuration, deploy their code as .zip files, and receive updates automatically. They don’t use or manage the underlying container images. They only write application code.

This separation creates a clean boundary. The runtime publisher focuses on runtime management: patching, security tooling, and compliance. Developers consume the runtime and focus on their business logic.

Resource model

Customer-managed runtimes use three resource types that work together.

Runtime: The top-level resource representing the runtime as a whole, for example, a PHP 8 runtime for your organization. A runtime has a name, an Amazon Resource Name (ARN), and a description. You control access at the runtime level using a resource-based policy. To create a runtime:

aws lambda-core create-runtime \
    --name my-runtime \
    --description "Describe or link to runtime description" \
    --license-info "None"

Runtime version: Represents the contents of the runtime at a point in time. Each version is backed by a container image in Amazon Elastic Container Registry (Amazon ECR) and is immutable, so once created it can’t be changed. To update the runtime, you create a new version. To create a runtime version, reference the ECR image that defines the runtime contents:

aws lambda-core create-runtime-version \
    --runtime-name my-runtime \
    --name v1 \
    --image-uri 111122223333.dkr.ecr.us-east-1.amazonaws.com/my-runtime:v1

Runtime images contain the operating system libraries, language support, a bootstrap script, and the runtime interface client (code that retrieves invoke requests from the Lambda service and calls your function handler). You must grant the Lambda service principal read access to your ECR repository. For details, refer to the runtime image building documentation.

Runtime alias: A named pointer to a runtime version. Event Functions consume the runtime through an alias. When you update an alias to point to a new version, functions using that alias pick up the change at their next cold start. To create a runtime alias:

aws lambda-core create-runtime-alias \
    --runtime-name my-runtime \
    --name production \
    --runtime-version v1

How you structure your aliases depends on your release process, for example, separate aliases per environment (dev, test, prod), per release track (latest, stable), or semantic version (php8.3, php8.4). Refer to alias strategies in the documentation for common patterns.

Runtimes are Regional resources. You must create a runtime, its versions, and its aliases in each AWS Region where you need them. We recommend using consistent names across Regions so that ARNs differ only in the Region component. Use ECR cross-Region replication to distribute your images, and roll out alias updates one Region at a time to limit the impact of a faulty version.

Consuming a runtime

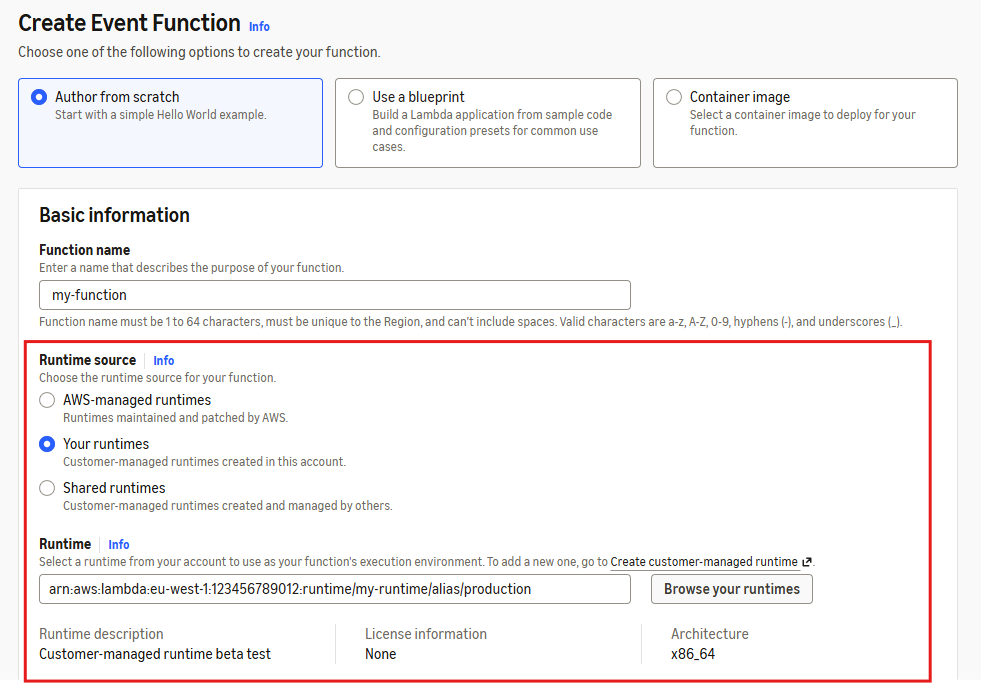
For function developers, the only change is how you specify the runtime source. In the Lambda console, specify whether the runtime is in the function’s account or shared from a different account, and provide the runtime alias ARN:

AWS Lambda console Create Event Function page with a red box highlighting the runtime selection, where the ‘Your runtimes’ option is chosen instead of ‘AWS-managed runtimes’ and a customer-managed runtime alias ARN is entered

Figure 3: The Lambda console Create Event Function page with customer-managed runtime selection

In the AWS CLI (and similarly in AWS CloudFormation), instead of specifying a Lambda runtime identifier like python3.14, you set the runtime to custom and provide the runtime ARN and alias name:

aws lambda create-function \
    --function-name my-function \
    --runtime custom \
    --runtime-config RuntimeArn=arn:aws:lambda:us-east-1:111122223333:runtime/my-runtime,RuntimeAlias=production \
    --handler index.handler \
    --zip-file fileb://function.zip \
    --role arn:aws:iam::111122223333:role/my-lambda-role

Everything else works the same, including function configuration, invocation, logging, monitoring, layers, and infrastructure-as-code tools. Developers deploy .zip files, use the same CLI, and don’t need to learn containers or new tooling.

Runtime updates and monitoring

As a runtime publisher, you own the update process. Lambda doesn’t patch customer-managed runtimes for you. If you build your runtime from a Lambda base image, you get the operating system, language runtime, and Lambda runtime interface client as a starting point. AWS regularly updates the base images with security patches. You can also build your runtime image from scratch for maximum control.

To patch your runtime, first rebuild your runtime image from the updated base image. You then publish a new runtime version referencing the new image, test it, and roll out the new version by updating your runtime aliases. To create a new runtime version and update an alias:

aws lambda-core create-runtime-version \
    --runtime-name my-runtime \
    --name v2 \
    --image-uri 111122223333.dkr.ecr.us-east-1.amazonaws.com/my-runtime:v2

aws lambda-core update-runtime-alias \
    --runtime-name my-runtime \
    --name production \
    --runtime-version v2

Lambda publishes two Amazon CloudWatch metrics in the runtime publisher’s account: RuntimeInvocations (total invocations of functions using the runtime) and RuntimeInvocationErrors (invocations that result in errors). You can view these by runtime, runtime version, or runtime alias.

Your runtime updates need to be backward-compatible with existing functions. Lambda strives to provide backward-compatible updates to its base images, which you can use as your starting point. However, as with any change, there’s always the possibility of an unexpected compatibility issue. During a rollout, you can compare the error rate of the new runtime version against the previous version. If the new version shows a higher error rate under similar traffic, it’s a signal to pause or roll back by re-pointing the alias to the previous runtime version. You can also track rollout progress as Lambda replaces execution environments, shifting invocations from the old version to the new one. We recommend creating a CloudWatch alarm on the error rate of each alias and configuring your deployment pipeline to halt when an alarm fires.

Cross-account sharing and trust

For customer-managed runtimes, we expect most usage to be cross-account: the runtime publisher shares a runtime with runtime consumer accounts by applying a resource-based policy on the runtime. You can share with individual AWS accounts, an AWS Organizations organization or organizational unit, or publicly. Consumers in shared accounts also need an identity-based policy granting lambda:AssociateRuntimeAlias permission. Both the resource-based and identity-based policies must allow the action for cross-account access to work. To allow consumers to use runtime management controls to roll back a function to a specific runtime version, they also need lambda:AssociateRuntimeVersion permission. For details and example policies, refer to Sharing and controlling access to customer-managed runtimes.

A runtime publisher can push code into the execution environments of every function that uses their runtime. This is by design. It’s how runtime updates work. The runtime publisher can also ship updates that break your functions, or delete the runtime causing your functions to fail. This means you must trust the runtime publisher the same way you would trust anyone managing your application or running code with your permissions.

Organization administrators can use service control policies (SCPs) to govern which runtimes are allowed in their organization. For example, allowing only runtimes from specific trusted accounts, or blocking all external runtimes entirely. To consume a third-party runtime, you may wish to retain control by using their container images to build a customer-managed runtime that you manage. The image-centric model means you can use standard container tooling for vulnerability scanning, compliance checks, and supply chain security. These are the same tools you already use for your other container workloads.

Deletion guardrails

Deleting a runtime resource can break many functions, including functions in other accounts. Because of this, Lambda enforces built-in guardrails to help prevent and recover from accidental deletion:

  • Deletion isn’t immediate. Lambda schedules the runtime, version, or alias for deletion with a waiting period you choose, from 7–30 days (default 30). During this period, you can restore the resource.
  • You can’t delete a runtime version while an alias points to it.
  • You can’t delete a runtime while it has versions or aliases that aren’t scheduled for deletion. You must delete aliases first, then versions, then the runtime.

When a runtime alias or version is deleted (or scheduled for deletion), functions that use it enter the Inactive state and invocations fail on cold start. If you restore the resource during the waiting period, functions recover automatically, with no redeployment needed.

Before deleting any runtime resource, check the RuntimeInvocations metric to verify usage. You can monitor runtime metrics during the scheduled for deletion window to check whether the pending deletion is causing function invocations to fail.

To manage the runtime lifecycle, you can set a release lifecycle stage (Preview, GenerallyAvailable, or Deprecated) and optionally block new function creation or function updates after a specified date. Refer to runtime lifecycle management in the documentation for details.

Pricing

There’s no additional charge for customer-managed runtimes. Event Functions that use a customer-managed runtime cost the same as functions that use a Lambda-managed runtime. There’s no charge for creating runtime versions or aliases. However, runtime publishers must keep the container image for each runtime version in Amazon ECR for as long as the version exists. Standard Amazon ECR storage pricing applies to these images.

Conclusion

With customer-managed runtimes, platform teams have central control over the Lambda runtimes used across their organization. As runtime publishers, they control the runtime contents, updates, access, and lifecycle. Alternatively, they can publish base images that application teams use to build and manage their own runtimes. Developers keep the .zip deployment experience they’re familiar with and receive runtime updates automatically.

To get started, visit the customer-managed runtimes documentation and the step-by-step tutorial. Customer-managed runtimes are available today across commercial AWS Regions through the Lambda console, AWS Command Line Interface, and AWS CloudFormation.

We would love to hear how you use customer-managed runtimes. Share your feedback in the comments, in the Lambda public roadmap, or reach out through AWS re:Post.


About the author

Jonathan Tuliani

Jonathan Tuliani

Jonathan is a Principal Product Manager for AWS Lambda in Amazon Web Services, where he leads product strategy for runtimes and programming models. He is passionate about serverless computing, having previously delivered systems on cloud, virtualized, and bare-metal infrastructure.

Block DNS threats with Infoblox rules in Amazon Route 53 Resolver DNS Firewall

Post Syndicated from Rajendra Kulkarni original https://aws.amazon.com/blogs/architecture/block-dns-threats-with-infoblox-rules-in-amazon-route-53-resolver-dns-firewall/

Blocking DNS threats at the lookup stage helps you interrupt malware delivery, command-and-control channels, and data exfiltration. Attackers use domain names to reach your network and to move data out of it. With Amazon Route 53 Resolver DNS Firewall (DNS Firewall), you can already filter outbound DNS queries from your Amazon Virtual Private Cloud (Amazon VPC) resources, but keeping domain lists current takes ongoing effort.

Infoblox Threat Defense is now available in preview in DNS Firewall, providing partner-managed DNS threat intelligence directly in your rule groups. You subscribe in AWS Marketplace from the DNS Firewall rule workflow, and Infoblox maintains the threat data for you.

In this post, we show you how to add an Infoblox managed rule to a DNS Firewall rule group, test it in alert mode, and then move to blocking. We also cover how to monitor matches and how to clean up resources if you are evaluating the solution.

Solution overview

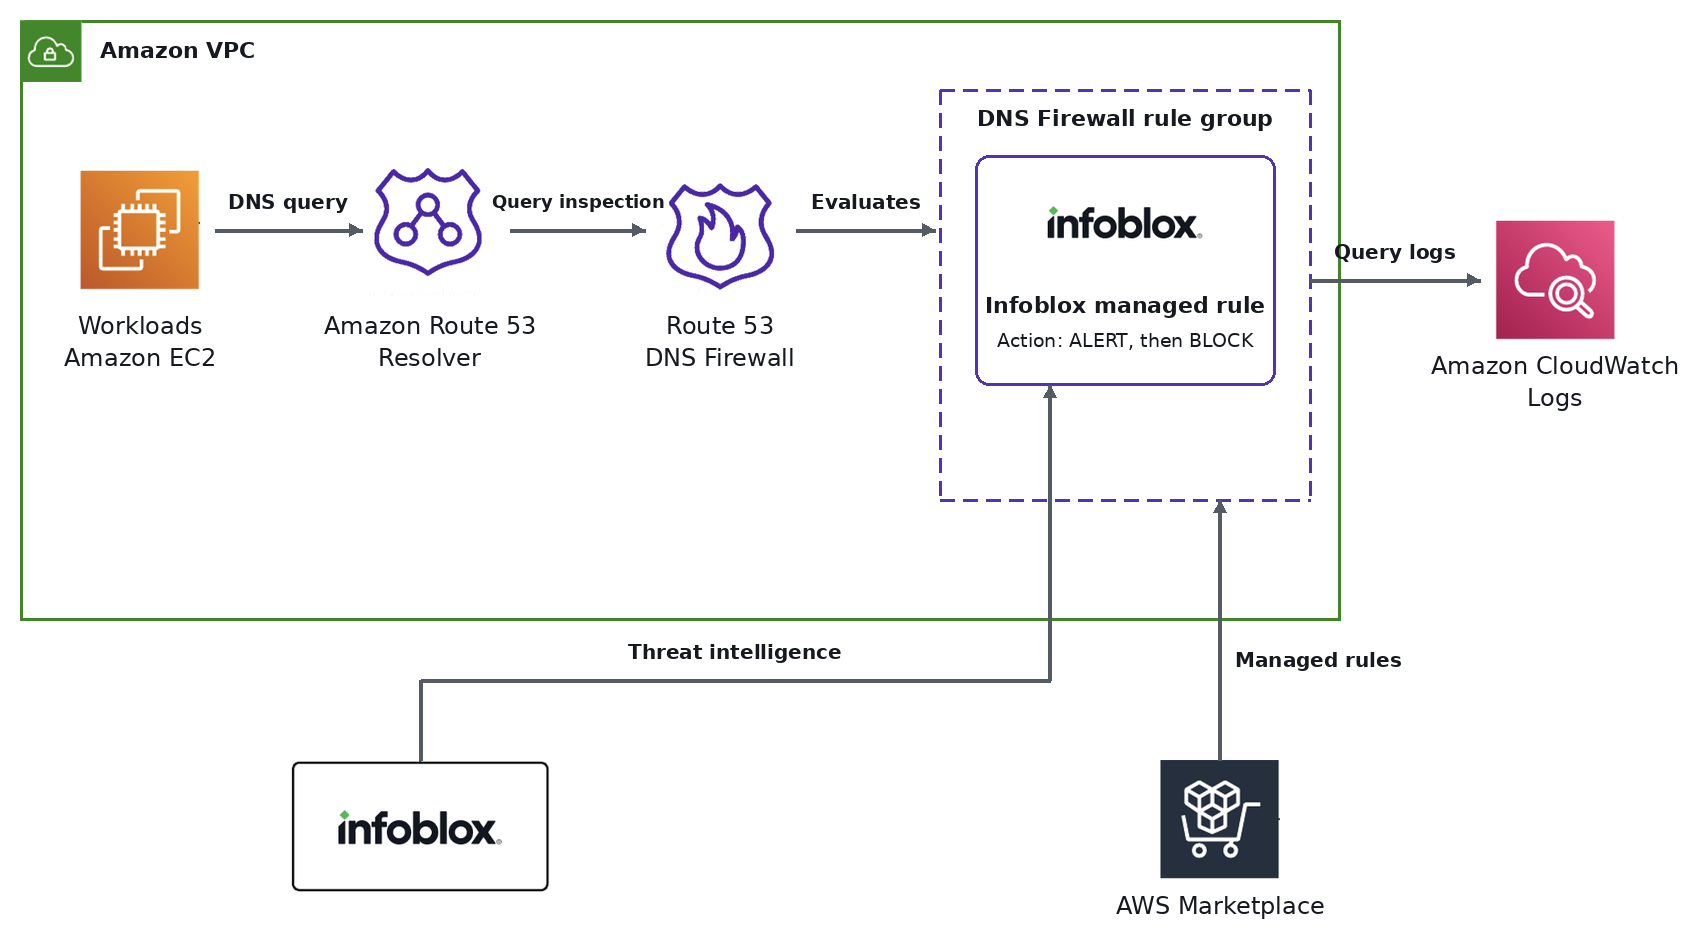
Figure 1 shows the architecture of the solution. Workloads, such as Amazon Elastic Compute Cloud (Amazon EC2) instances, in your VPC send DNS queries to Amazon Route 53 Resolver. Route 53 Resolver passes each outbound query to DNS Firewall for inspection. DNS Firewall evaluates the query against your rule group, which includes the Infoblox managed rule. DNS Firewall matches are recorded in the Resolver query logs, which you deliver to Amazon CloudWatch Logs. Outside your VPC, Infoblox supplies threat intelligence to the managed rule, and AWS Marketplace supplies the managed rules to the rule group.

Architecture diagram. Inside an Amazon VPC, Amazon EC2 workloads send DNS queries to Amazon Route 53 Resolver. Route 53 Resolver sends each query for inspection to Route 53 DNS Firewall. DNS Firewall evaluates the query against a DNS Firewall rule group that contains the Infoblox managed rule, which is set to ALERT and later BLOCK. DNS Firewall matches are recorded in query logs that are delivered to Amazon CloudWatch Logs, which sits outside the VPC. Also outside the VPC, Infoblox sends threat intelligence to the Infoblox managed rule, and AWS Marketplace supplies the managed rules to the rule group.

Figure 1: Architecture of the solution

The solution has six components:

  • Workloads in your Amazon VPC send DNS queries to Route 53 Resolver.
  • Route 53 Resolver passes each outbound query to DNS Firewall.
  • A DNS Firewall rule group that you associate with your VPC holds your rules, including the Infoblox managed rule.
  • Infoblox threat intelligence supplies the domain categories that the managed rule matches against. Infoblox updates this data automatically, so you do not maintain feeds or domain lists.
  • AWS Marketplace handles your subscription. DNS Firewall generates metering records for the rule groups you subscribe to, and the charges appear on your AWS bill.
  • CloudWatch Logs stores the Route 53 Resolver query logs that you use to review matches.

Subscription and billing through AWS Marketplace

You discover, subscribe to, and manage the Infoblox protections in the same DNS Firewall workflow you already use. You can manage rule groups with the AWS Management Console, the AWS Command Line Interface (AWS CLI), or the AWS SDKs. Because metering is built in, you do not need a separate billing system with Infoblox. Usage appears alongside your other AWS costs, so cloud, security, procurement, and finance teams can work from one purchasing and reporting model.

Solution walkthrough

Prerequisites

For this walkthrough, you need the following:

  • An AWS account with AWS Identity and Access Management (IAM) permissions for the actions listed in the next section.
  • An Amazon VPC with workloads that use Route 53 Resolver.
  • A DNS Firewall rule group, or permission to create one.

The Infoblox managed rule requires the DNS Firewall Advanced pricing option and a subscription through AWS Marketplace. For details, see Cost considerations later in this post.

Required IAM permissions

Your IAM role or user needs the following actions. Use least-privilege permissions in production and scope resources where the service supports it. For the full list of actions, see Actions, resources, and condition keys for Amazon Route 53 Resolver in the Service Authorization Reference.

  • DNS Firewall rule groups and rules: route53resolver:CreateFirewallRuleGroup, route53resolver:GetFirewallRuleGroup, route53resolver:ListFirewallRuleGroups, route53resolver:DeleteFirewallRuleGroup, route53resolver:CreateFirewallRule, route53resolver:UpdateFirewallRule, route53resolver:ListFirewallRules, route53resolver:DeleteFirewallRule.
  • Domain lists for the allow list: route53resolver:CreateFirewallDomainList, route53resolver:UpdateFirewallDomains, route53resolver:ListFirewallDomains, route53resolver:GetFirewallDomainList, route53resolver:ListFirewallDomainLists, route53resolver:DeleteFirewallDomainList.
  • VPC association and fail-open setting: route53resolver:AssociateFirewallRuleGroup, route53resolver:DisassociateFirewallRuleGroup, route53resolver:GetFirewallRuleGroupAssociation, route53resolver:ListFirewallRuleGroupAssociations, route53resolver:GetFirewallConfig, route53resolver:ListFirewallConfigs, route53resolver:UpdateFirewallConfig, ec2:DescribeVpcs.
  • Query logging configuration: route53resolver:CreateResolverQueryLogConfig, route53resolver:GetResolverQueryLogConfig, route53resolver:ListResolverQueryLogConfigs, route53resolver:AssociateResolverQueryLogConfig, route53resolver:GetResolverQueryLogConfigAssociation, route53resolver:ListResolverQueryLogConfigAssociations, route53resolver:DisassociateResolverQueryLogConfig, route53resolver:DeleteResolverQueryLogConfig.
  • CloudWatch Logs log delivery (if you choose a log group as the destination): logs:CreateLogGroup, logs:DescribeLogGroups, logs:CreateLogDelivery, logs:GetLogDelivery, logs:UpdateLogDelivery, logs:DeleteLogDelivery, logs:ListLogDeliveries, logs:PutResourcePolicy, logs:DescribeResourcePolicies.
  • AWS Marketplace subscription: aws-marketplace:ViewSubscriptions, aws-marketplace:Subscribe, aws-marketplace:Unsubscribe.

If you send query logs to an Amazon Simple Storage Service (Amazon S3) bucket or an Amazon Data Firehose delivery stream instead, you need the corresponding permissions for that destination.

Cost considerations

This solution has three cost components. For current rates, see Amazon Route 53 pricing.

  • DNS Firewall Advanced: You pay an hourly charge for each rule group that contains Advanced rules, for each VPC that the rule group is associated with. If you also add a custom domain list for exceptions, DNS Firewall charges for the queries it inspects against that list and for each domain it stores.
  • AWS Marketplace fee: The Infoblox subscription in AWS Marketplace is available at no cost during preview. The offer on the Infoblox listing in AWS Marketplace shows the pricing and terms, and the charge appears on your AWS bill.
  • Query logging: Route 53 does not charge for Resolver query logs. You pay for the destination that you choose, which is Amazon CloudWatch Logs, Amazon S3, or Amazon Data Firehose.

Add the Infoblox managed rule

To add the managed rule, complete the following steps:

  1. Open the Amazon VPC console. In the navigation pane, under DNS Firewall, choose Rule groups.
  2. Choose your rule group, then choose Add rule.
  3. Under Rule details, enter a Name and select the Advanced pricing option.
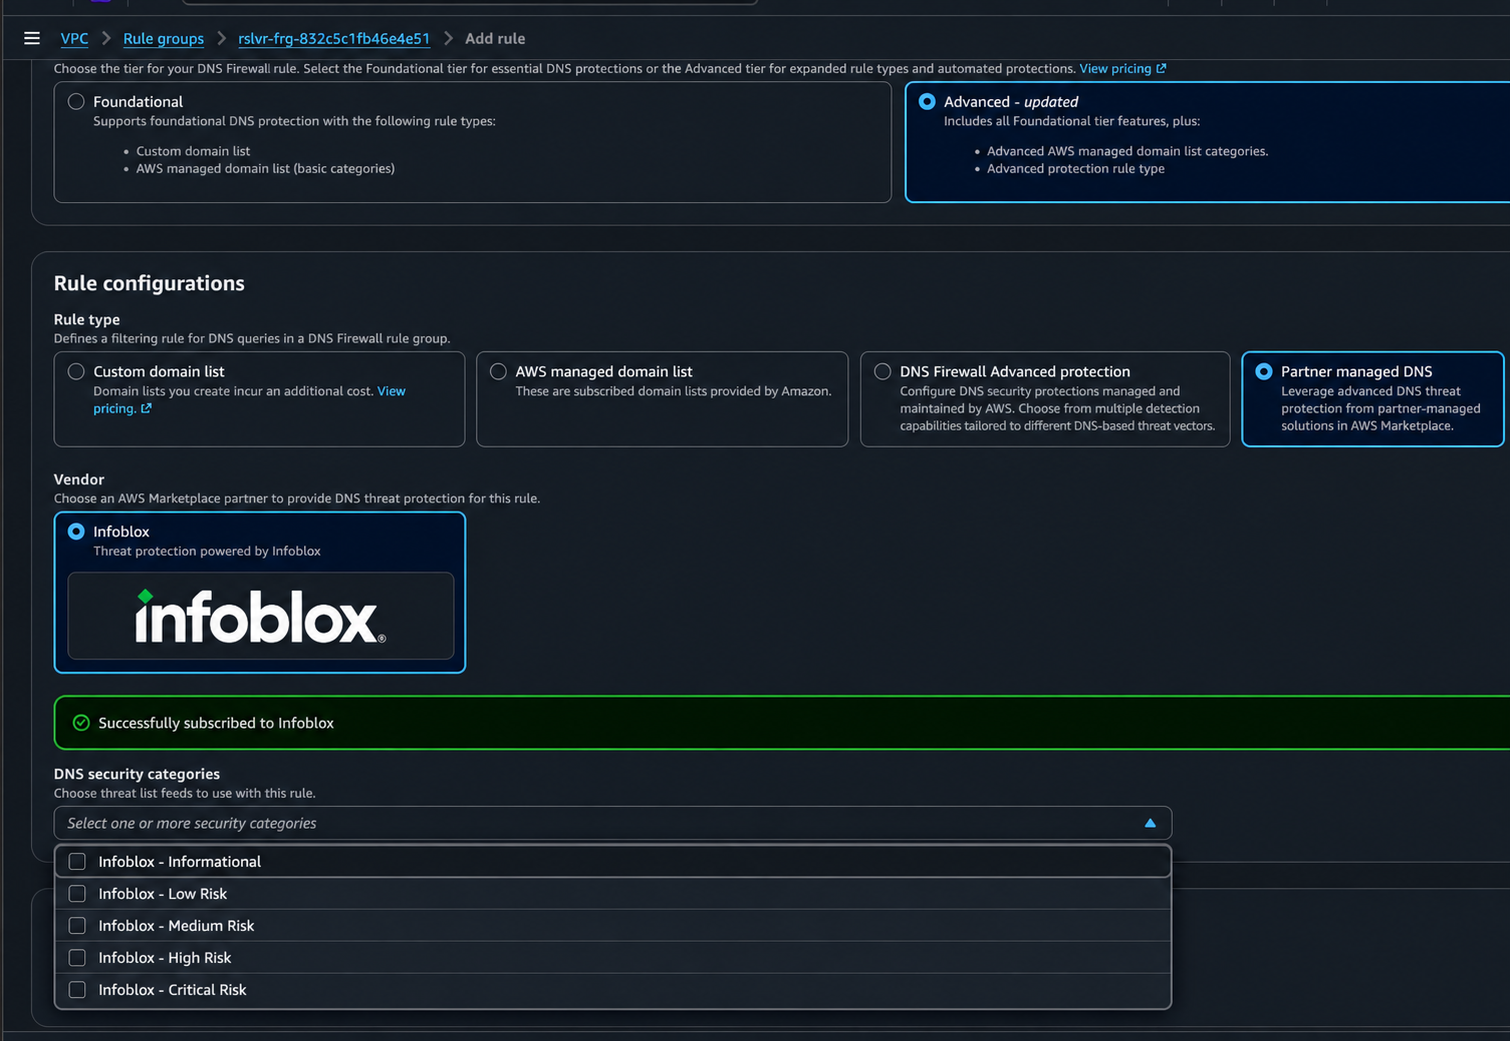
  4. Under Rule configurations, for Rule type, choose Partner managed DNS threat protection. For Vendor, choose Infoblox.
  5. If you are not yet subscribed, choose View subscription options, review the pricing and terms, and choose Subscribe. When you subscribe, you authorize AWS to share DNS query metadata with Infoblox, as described after these steps. The form updates when the subscription is active.
  6. For DNS security categories, choose the threat feeds for this rule. Infoblox organizes protections into risk-based domain lists (Critical, High, Medium, Low, and Informational). You can start in detect-only mode and later move to blocking, beginning with the Critical and High risk categories.
  7. For the action, choose ALERT so you can review matches before you block anything.
  8. Choose Add rule.

Figure 2 shows the Add rule page with the Advanced tier and the Partner managed DNS rule type selected. Infoblox is selected as the vendor, and a banner confirms that the subscription succeeded. The DNS security categories list shows five Infoblox categories: Informational, Low Risk, Medium Risk, High Risk, and Critical Risk.

Screenshot of the Add rule page in the Amazon VPC console. The Advanced tier is selected. Under Rule type, Partner managed DNS is selected. Under Vendor, Infoblox is selected. A banner reads Successfully subscribed to Infoblox. The DNS security categories drop-down list is open and shows five unselected options: Infoblox Informational, Low Risk, Medium Risk, High Risk, and Critical Risk.

Figure 2: The Add rule page with the Infoblox rule type and DNS security categories

Data shared with Infoblox. When you subscribe, you authorize AWS to share DNS query metadata with Infoblox. This metadata is the domain names that an Infoblox rule checks, and it is anonymized, as it is with the Palo Alto Networks partner managed rule. For the terms that apply, see the Infoblox listing in AWS Marketplace and review them before you subscribe.

Associate the rule group with VPCs

A rule group only takes effect on VPCs you associate with it. To associate the rule group, complete the following steps:

  1. On the Rule groups page, choose your rule group, then choose View details.
  2. On the Associated VPCs tab, choose Associate VPC.
  3. Select one or more VPCs, then choose Associate.
  4. Wait for the association Status to change from Updating to Complete.

You can expand protection later by associating additional VPCs with the same rule group.

Fail-open and fail-closed behavior. By default, the firewall configuration for a VPC fails closed. If DNS Firewall does not respond, Route 53 Resolver blocks the query and returns a SERVFAIL response, so a DNS Firewall issue can interrupt name resolution for your workloads. To favor availability over security, enable FirewallFailOpen for the VPC by editing its DNS Firewall configuration in the Route 53 Resolver console or by calling UpdateFirewallConfig. For more information, see DNS Firewall VPC configuration in the Amazon Route 53 Developer Guide.

Turn on query logging

Monitoring depends on Route 53 Resolver query logs, so turn on query logging for your VPC before you test in alert mode. To configure query logging, complete the following steps:

  1. Open the Route 53 console. In the navigation pane, under Resolver, choose Query logging.
  2. Choose the AWS Region of your VPC, then choose Configure query logging.
  3. Enter a Query logging configuration name. For Query logs destination, choose a CloudWatch Logs log group, an Amazon S3 bucket, or an Amazon Data Firehose delivery stream. Create a new destination or choose an existing one in the same Region.
  4. Under VPCs to log queries for, select the VPCs that you associated with the rule group.
  5. Choose Configure query logging.

Query logs usually start to appear within a few minutes. Route 53 Resolver logs only unique queries, so queries that it answers from its cache do not create new entries. The firewall fields in each log entry, such as firewall_rule_action and firewall_rule_group_id, are populated only when a query matches a rule whose action is ALERT or BLOCK. For the full list of fields, see Values that appear in VPC Resolver query logs. For more information about configuring logging, see Managing Resolver query logging configurations.

Monitor matches and start blocking

Route 53 Resolver sends query logs to the destination that you chose: a CloudWatch Logs log group, an Amazon S3 bucket, or an Amazon Data Firehose delivery stream. From there, you can route the logs to your security information and event management (SIEM) or security orchestration, automation, and response (SOAR) tools.

Review the alerts for a period that matches your workload patterns. Investigate each match. For domains that you approve, add an exception by following the steps in this section.

DNS Firewall does not support the ALLOW action on Advanced rules. Instead, create a custom domain list that contains the approved domains, and add a rule with the ALLOW action at a lower priority number than the Infoblox rule. DNS Firewall evaluates rules from the lowest priority number to the highest and stops at the first match, so the ALLOW rule takes effect before the Infoblox rule. For more information, see Rule actions in DNS Firewall.

To add an exception for an approved domain, complete the following steps:

  1. In the Amazon VPC console, under DNS Firewall, choose Domain lists, then choose Add domain list.
  2. Enter a name, add the domains that you approve, and choose Add domain list.
  3. Under Rule groups, choose the rule group that contains the Infoblox rule, then choose Add rule.
  4. Enter a Name and select the Foundational pricing option. The ALLOW action is not available with the Advanced option.
  5. For Rule type, choose Custom domain list, and then choose the domain list that you created.
  6. For the action, choose ALLOW.
  7. Set the rule priority to a number lower than the priority of the Infoblox rule. For example, if the Infoblox rule has priority 100, use 10.
  8. Choose Add rule.

When the results look right, edit the Infoblox rule and change the action to BLOCK.

Clean up resources

If you are running an evaluation, remove the resources when you finish testing to avoid incurring future costs:

  1. Disassociate the VPCs from the rule group.
  2. Delete the Infoblox rule, and delete the rule group if you created it for this test.
  3. Delete the ALLOW rule and the custom domain list if you created them for this test.
  4. Delete the query logging configuration and the log destination if you created them for this test.
  5. Cancel your subscription in AWS Marketplace.

Conclusion

With Infoblox managed rules in DNS Firewall, you add curated DNS threat intelligence to the controls you already run, and you manage it with the same tools, access controls, and AWS bill. In this post, we showed you how to subscribe, add the managed rule, test in alert mode, and move to blocking.

To get started, open the Amazon VPC console and add a partner managed rule to a DNS Firewall rule group. To learn more, see the Amazon Route 53 Resolver DNS Firewall detail page and How Resolver DNS Firewall works in the Amazon Route 53 Developer Guide. For details about the Infoblox offer, see the Infoblox listing in AWS Marketplace. For Infoblox-specific configuration details, see Infoblox managed DNS threat protection in DNS Firewall.

If you want help applying a similar approach in your environment, contact an AWS representative.


About the authors

Rajendra Kulkarni

Rajendra Kulkarni

Rajendra is a Senior Partner Solutions Architect for Security at AWS, with more than 20 years of experience in information security. That experience spans cloud security, data security, and generative AI security, including Amazon Bedrock, Amazon Q, Model Context Protocol (MCP), and agentic AI. Rajendra also has a background in compliance, including SOC 2, FedRAMP, and risk assessments and audits based on ISO 27001, SOX, and PCI DSS.

Bryan Moffatt

Bryan Moffatt

Bryan is a Senior Product Manager-Technical with Amazon Route 53 at AWS. He works with engineering and AWS partners to help customers secure and manage DNS across their AWS environments. Bryan leads Route 53 Profiles, Private DNS, and DNS Firewall.

Manish Patel

Manish Patel

Manish has more than 20 years of experience shaping the cybersecurity, cloud, and AI landscapes. Having driven product strategy, security integrations, and global alliances at industry leaders like Infoblox, CrowdStrike, Trend Micro, and Zscaler, he brings technical expertise and go-to-market execution spanning endpoint security, network defense, Zero Trust architecture, and hybrid and public cloud environments. He is particularly focused on bridging the gap between security and emerging technologies, including pioneering early enterprise co-builds through partnerships.

Larry Im

Larry Im

Larry is a Senior Solutions Architect enabling hyper-growth SaaS ISVs to innovate, design, secure, and scale their platforms on AWS. He partners with customers to build highly scalable and resilient cloud architectures and is an active builder in the generative AI space, developing agentic AI tools and workflows that help customers and field teams move faster.

Introducing the Apache Spark optimization agent for Amazon EMR Serverless and AWS Glue ETL

Post Syndicated from Neil Mukerje original https://aws.amazon.com/blogs/big-data/introducing-the-apache-spark-optimization-agent-for-amazon-emr-serverless-and-aws-glue-etl/

With Amazon EMR Serverless and AWS Glue ETL, you can run Apache Spark applications without provisioning or managing clusters. You submit jobs, the service allocates the compute, scales it during execution, and releases it when the job finishes. Both services deliver a balanced performance profile by default. However, because of different datasets and transformations, customers who want to push further on cost or performance still need to tune Spark settings. Investigating why a specific job is slow or expensive often requires deep Spark expertise: analyzing Spark History Server timelines, shuffle metrics, executor sizes, and task distributions. That work falls to the few Spark experts on the team, and their time is often the bottleneck.

Today we are announcing the general availability of the Apache Spark optimization agent for Amazon EMR Serverless and AWS Glue ETL. The agent analyzes completed Spark job runs and delivers optimization recommendations in minutes, replacing hours of manual analysis by Spark experts. Any engineer can select a cost or performance goal and receive specific configuration changes grounded in evidence from the job’s own Spark telemetry. The agent supports single job-run analysis as well as comparison against a known-good baseline job run.

The Apache Spark optimization agent is available at no additional charge.

In this post, we explain what the agent does, how it works, and how to use it.

What the Apache Spark optimization agent does

The optimization agent analyzes Spark jobs and recommends changes that reduce cost, improve performance, or both. You can access the agent from the EMR Studio UI, AWS Glue Studio UI, or through the Amazon SageMaker Unified Studio MCP Server using any MCP-compatible client such as Kiro. You point it at a completed job run, choose either cost or performance as the intent, and receive recommendations that cite the specific metrics from that run. Often tuning for faster performance also lowers resource usage and cost, but in some cases a faster job requires more resources, which increases cost. The agent optimizes for the goal you choose, cost or performance, and makes sure the one you did not pick does not get noticeably worse. For example, a cost recommendation can make a job run slightly longer, but no more than the normal variation between runs. For larger and more expensive jobs, the agent tightens the threshold further.

There are two ways to analyze a Spark job:

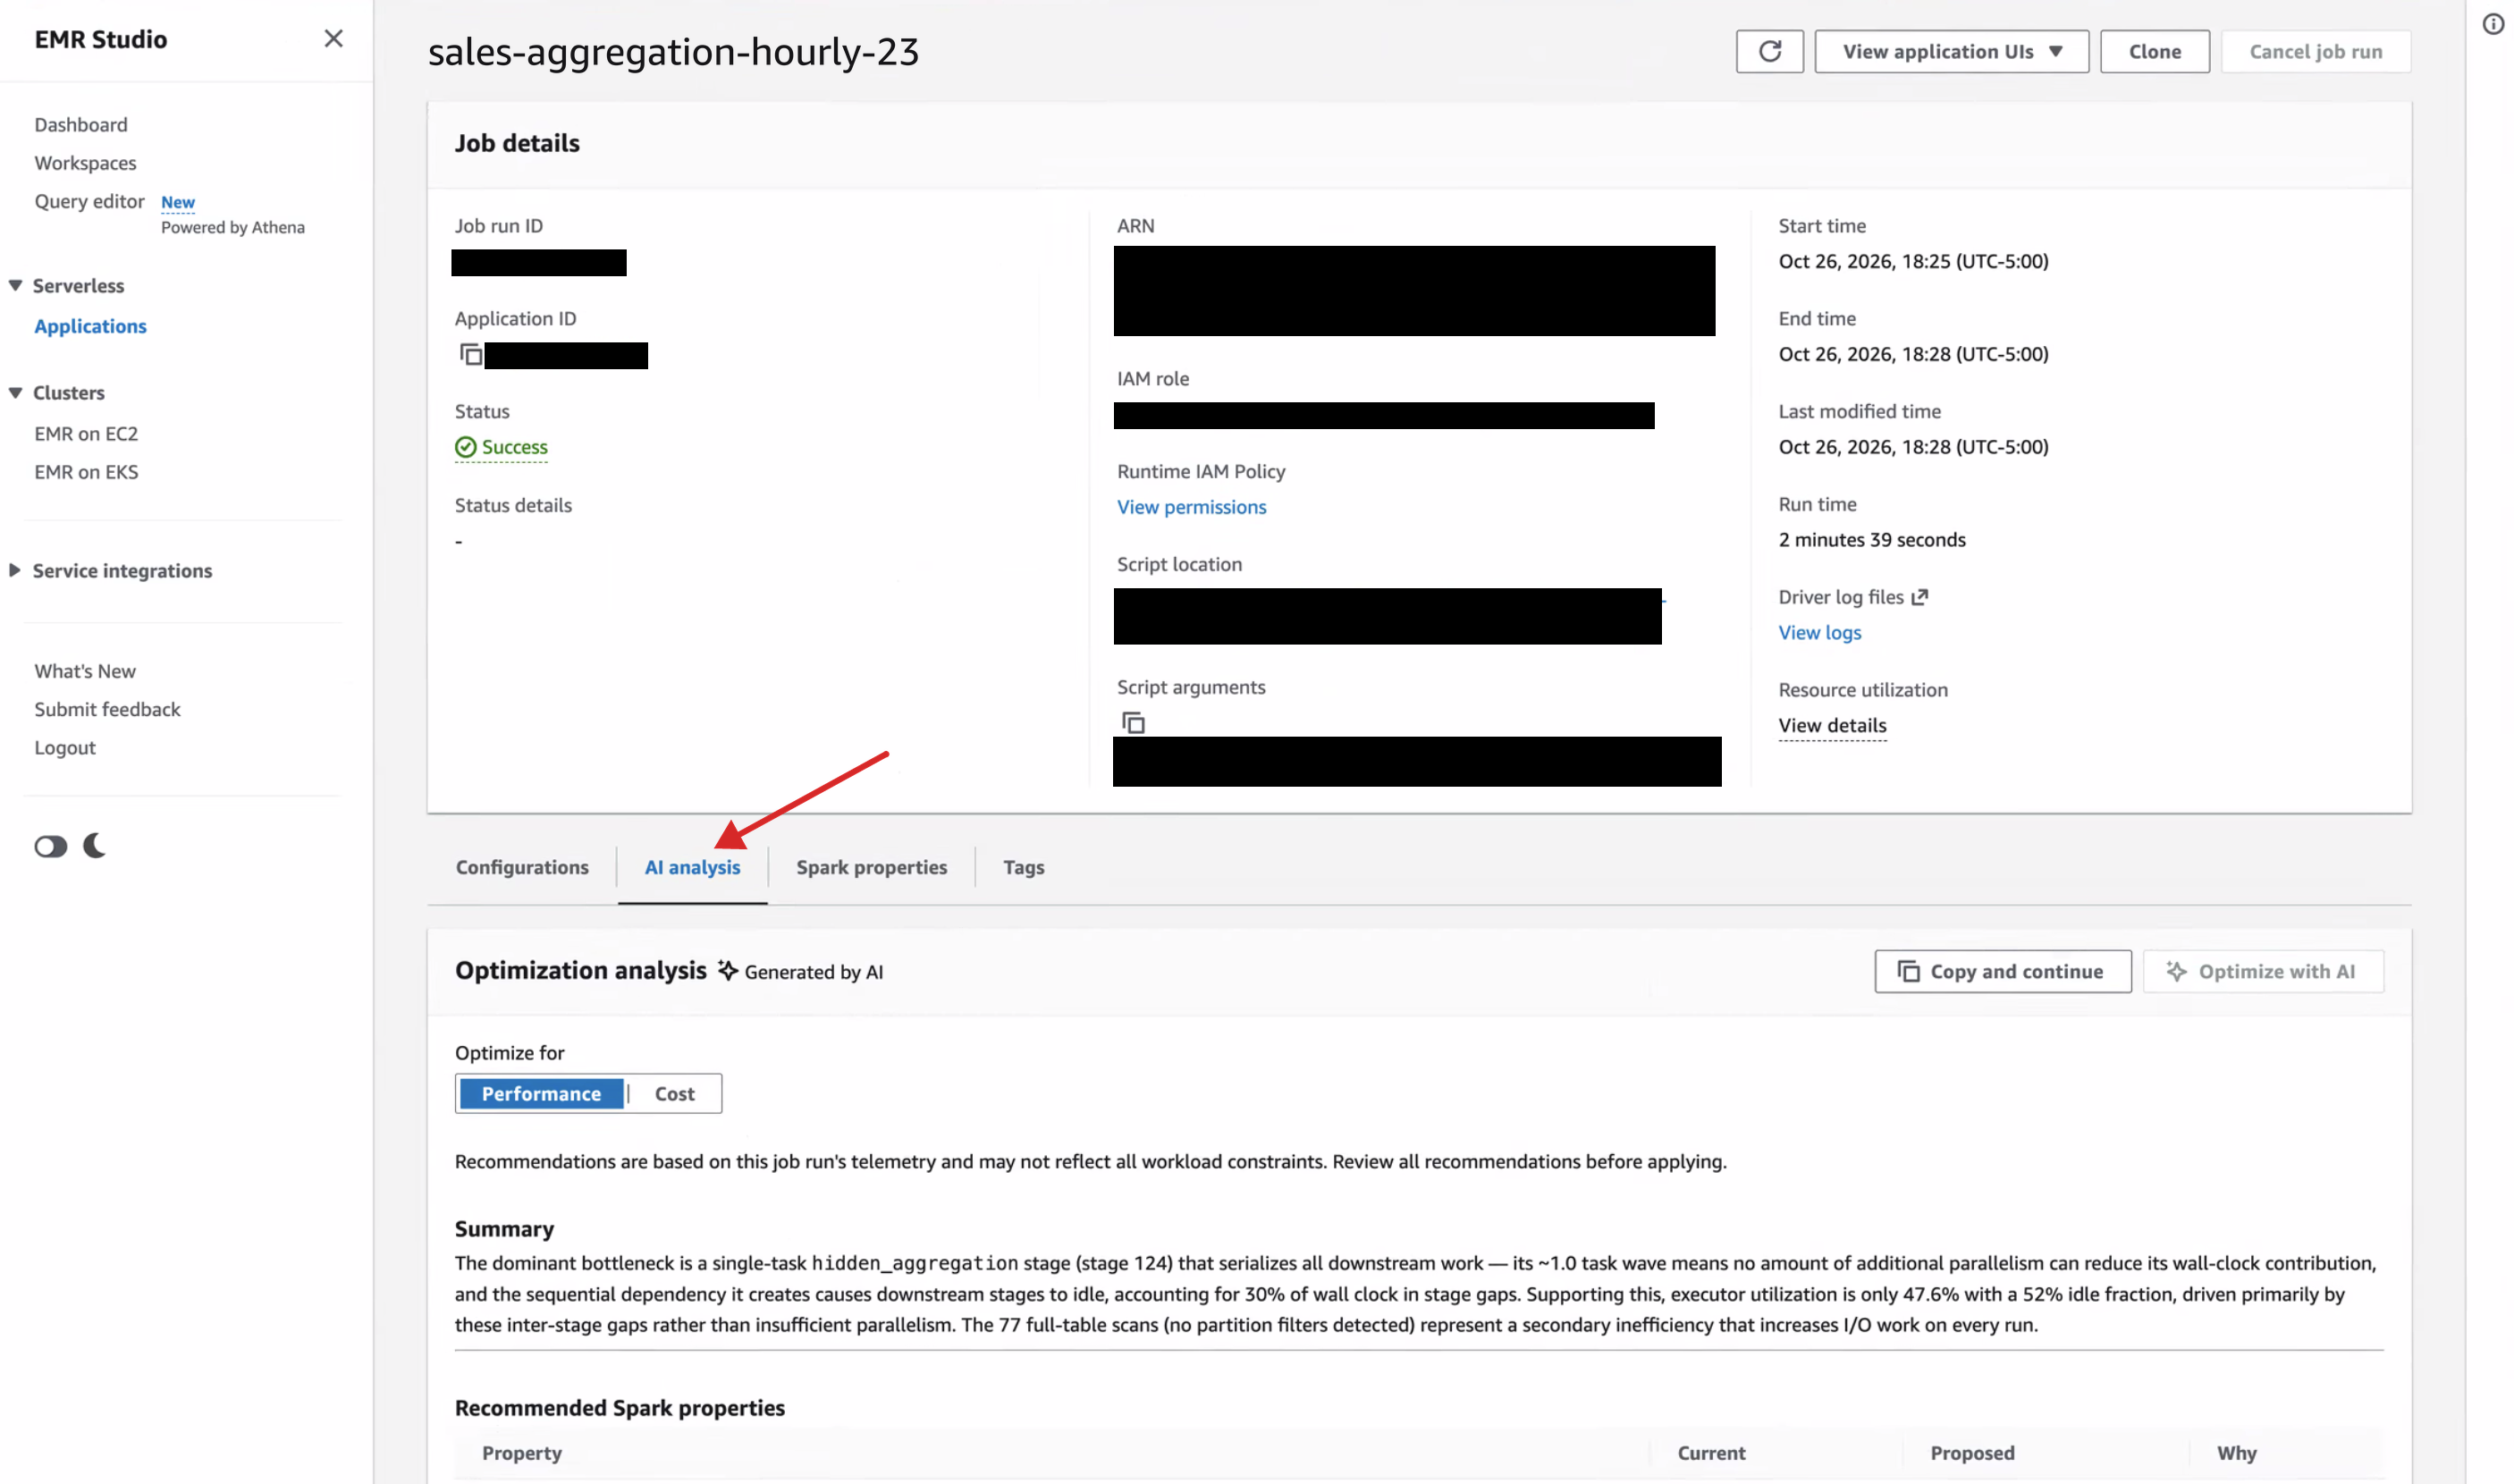
  1. Single job-run analysis. The agent examines one completed run and identifies common sources of inefficiency: data skew, memory pressure, excessive shuffle and disk spill, undersized or oversized workers, suboptimal join strategies, and input layout issues such as small files. Each recommendation shows the Spark properties to change, the current and proposed values, and the telemetry evidence behind the suggestion.
  2. Baseline comparison. When a job that used to meet its targets starts running longer or costing more, compare it against a run that performed well. Provide the current run and the earlier baseline, and the agent compares their configuration, metrics, and stage behavior to pinpoint what changed.

The agent also evaluates a best practices checklist from Top 10 best practices for EMR Serverless, Best practices for performance tuning AWS Glue, and Improving AWS Glue performance. It recommends known platform-level improvements such as upgrading to a newer Spark version, using AWS Graviton processors, and applying best practices for data formats like Apache Iceberg.

The agent is read-only. It does not change your code or job settings. You decide which recommendations to apply.

How the Apache Spark optimization agent works

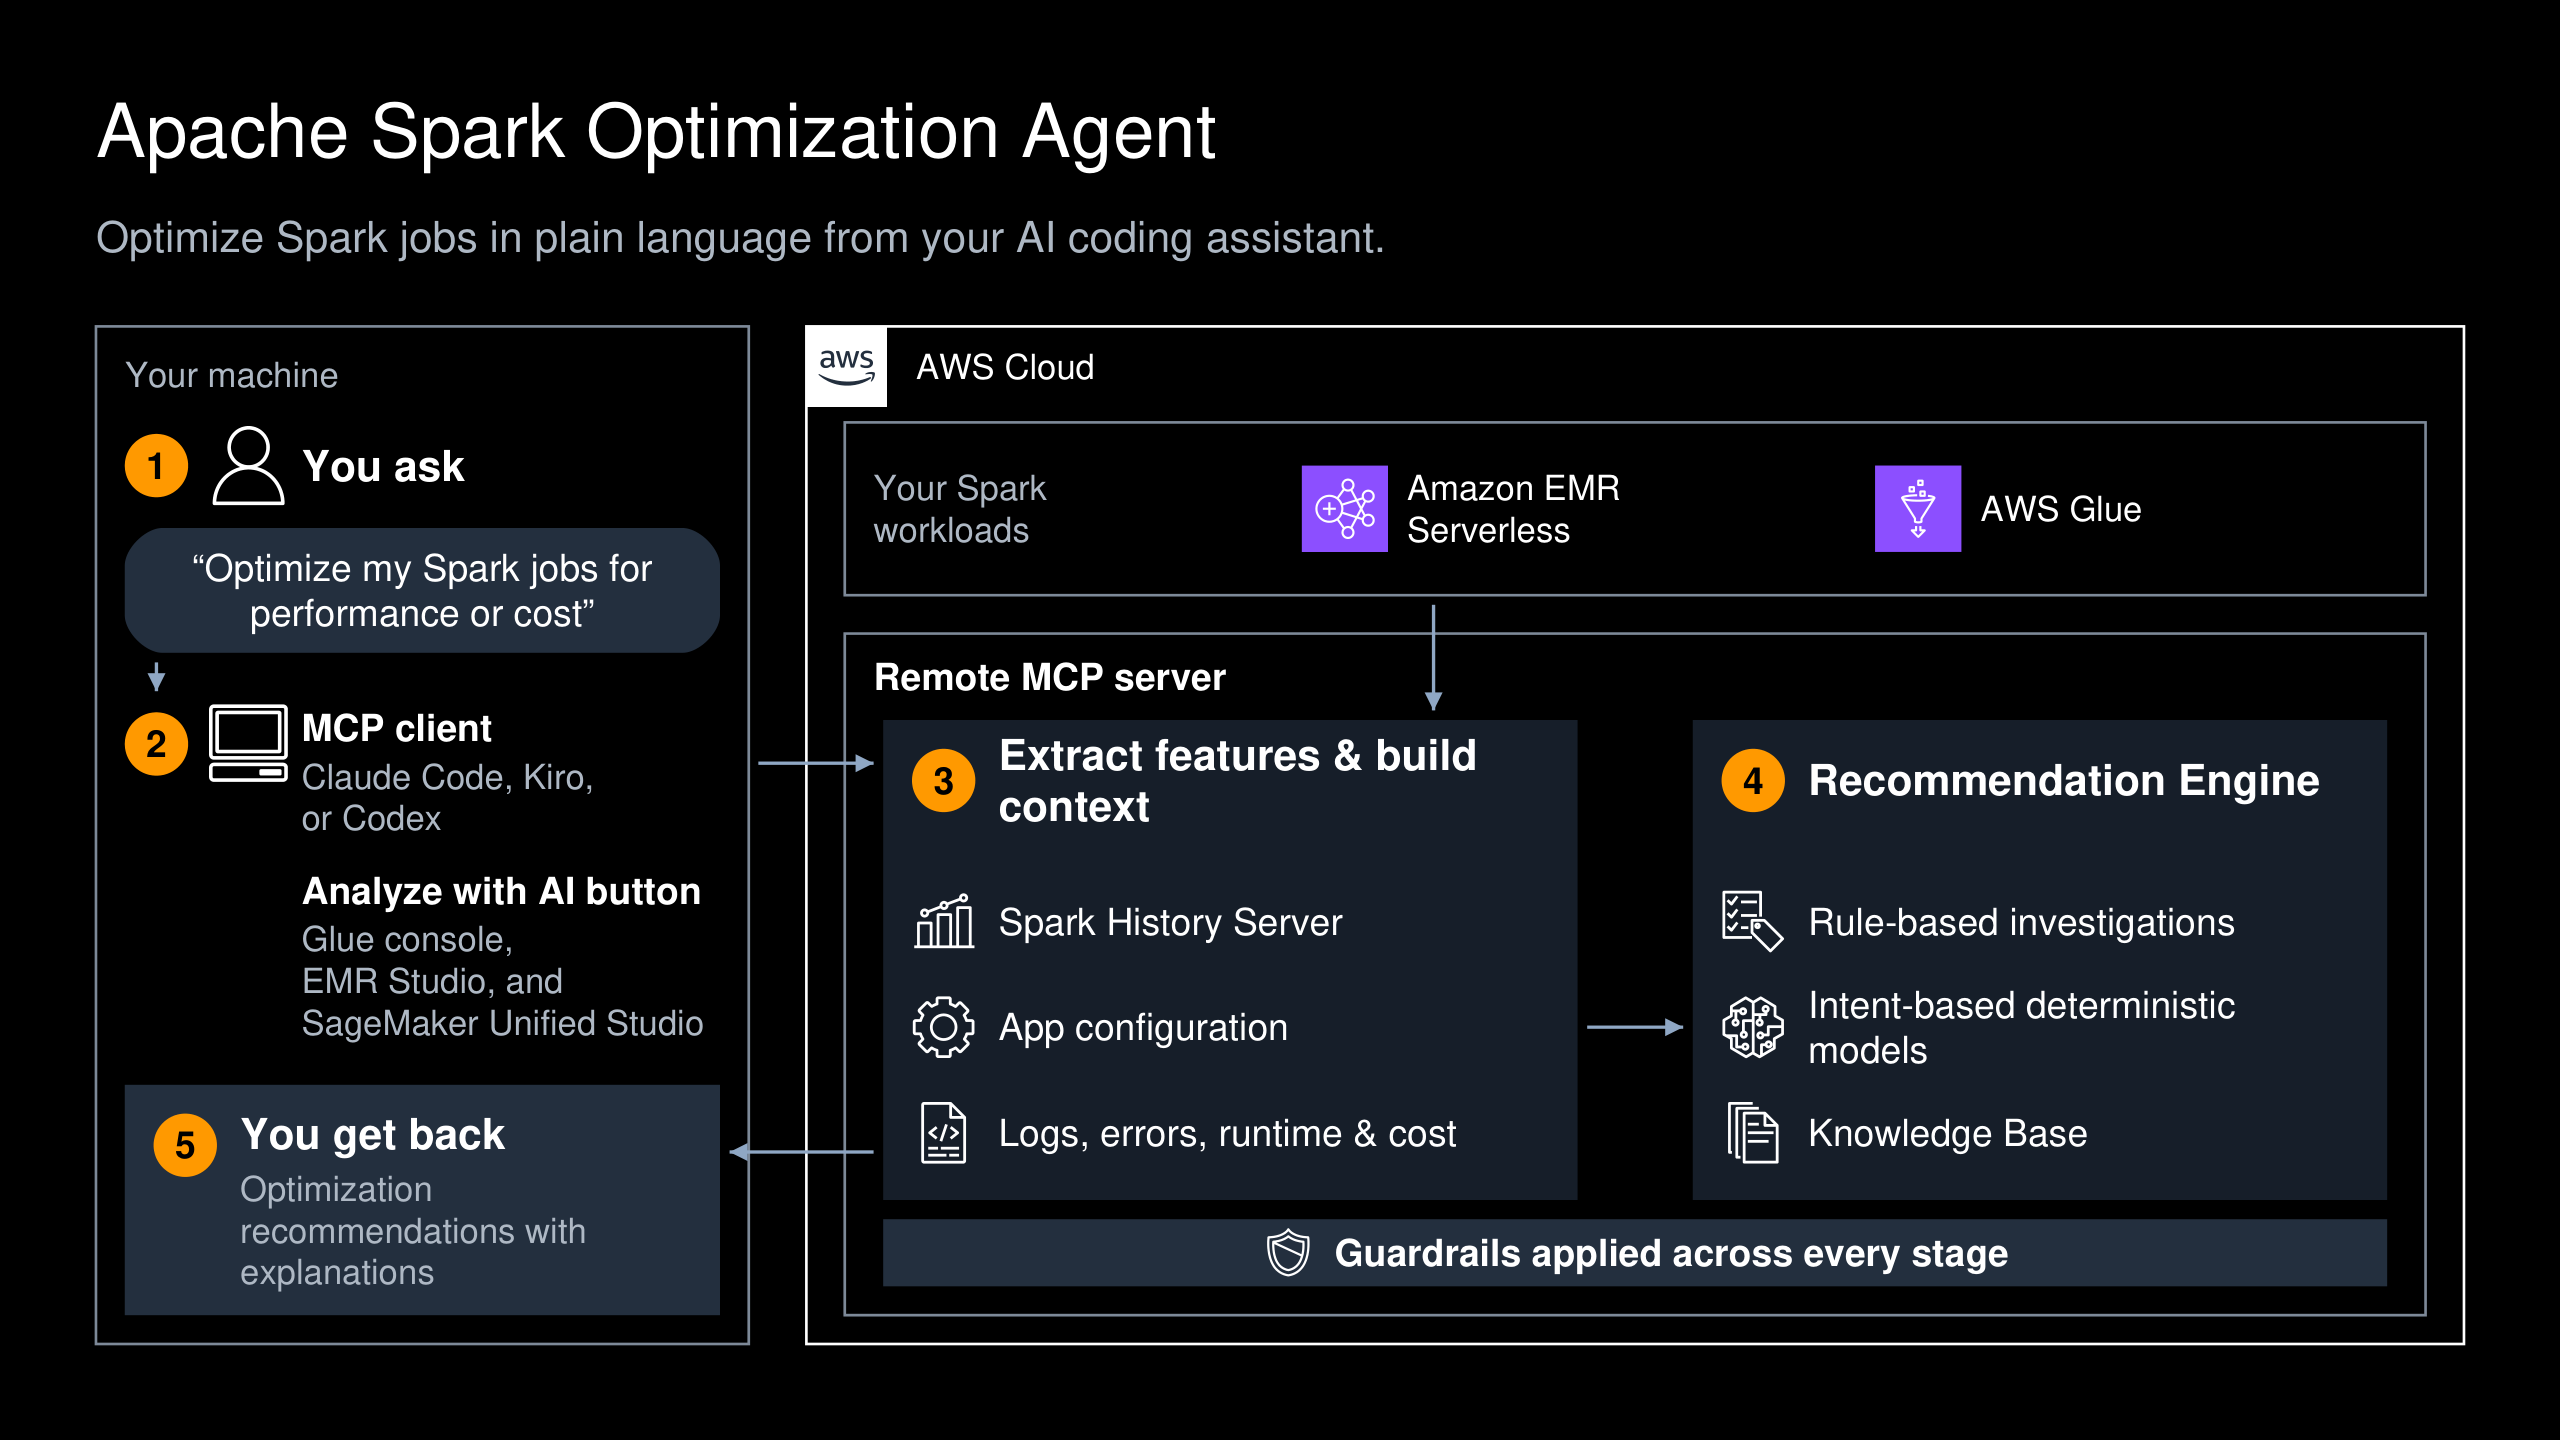
The following diagram shows how a request flows from the AWS console or your MCP-compatible client to the remote MCP server, through feature extraction and the recommendation engine, and back to you as recommendations.

Request flow from the AWS console or MCP client through the remote MCP server, feature extraction, and the recommendation engine, returning recommendations

Figure 1: How a request flows from the console or MCP client through the recommendation engine and back as recommendations

The workflow consists of the following steps:

  1. State your intent in plain language, such as performance or cost for a completed job run.
  2. Your MCP client or the AWS console sends the job run to the remote MCP server.
  3. The agent reads the run’s Spark History Server telemetry, configuration, logs, and cost through existing APIs, over TLS-encrypted connections, and uses them for feature extraction and context building.
  4. A recommendation engine combines rule-based investigations, intent-based deterministic models, and a knowledge base to find the bottleneck and determine the fix.
  5. You get back labeled recommendations, each with the evidence behind it.

The agent approaches each request with the objective to optimize either performance or cost. It then uses read-only access through AWS APIs and the Persistent Spark History Server or AWS Glue Apache Spark Web UI to gather the Spark configuration and telemetry. Additionally, the configuration inspector collects the job’s settings and compares them against a baseline run when one is provided.

The investigation and recommendation engine looks at these artifacts together to find what is driving runtime and cost. A slow stage may stem from too little parallelism, a skewed join key, memory pressure that forces spill, or a slow upstream read. High cost might come from idle executors or capacity well beyond what the job uses.

Rule-based investigations and an intent-based deterministic model calculate the recommended values. An AI model combines the findings with a knowledge base of the settings most often tuned across millions of Spark jobs on AWS. The agent only recommends changing a setting when the evidence supports it. When cost and runtime trade off against each other, the agent optimizes for the metric you choose and keeps any impact on the other within defined limits.

Note: The agent does not use customer data to train or build the knowledge base.

The Spark optimization agent includes built-in guardrails for personally identifiable information (PII), sensitive data, security, and cost thresholds to make sure recommendations are safe.

Each recommendation is labeled with what it changes:

  • [infra]: the compute resources your job runs on, such as the EMR Serverless application’s pre-initialized and maximum capacity, the worker vCPU and memory size, or the AWS Glue worker type and number of workers.
  • [config]: Spark configuration, such as spark.sql.shuffle.partitions, spark.executor.memory, or an Adaptive Query Execution (AQE) setting.
  • [data]: a change to the underlying data’s physical layout, such as repartitioning a table on a different key or compacting small files.

Each category needs a different level of review. A [config] change can typically be validated in the next run without any code change. A [data] change modifies the job’s actual behavior, or the data it depends on, and should go through the same review and testing discipline as any other production change before it ships.

How to use the Apache Spark optimization agent

You can run the optimization agent from the AWS console or from any MCP-compatible client, such as Kiro, Claude Code, or Codex, through the analyze_spark_workload tool on the Amazon SageMaker Unified Studio remote MCP server. From an MCP client, ask in plain language, and words like “faster” or “cheaper” set the goal. For setup steps, see Use Spark Optimization Agent.

The following steps show how to use the agent in the AWS console.

EMR Serverless

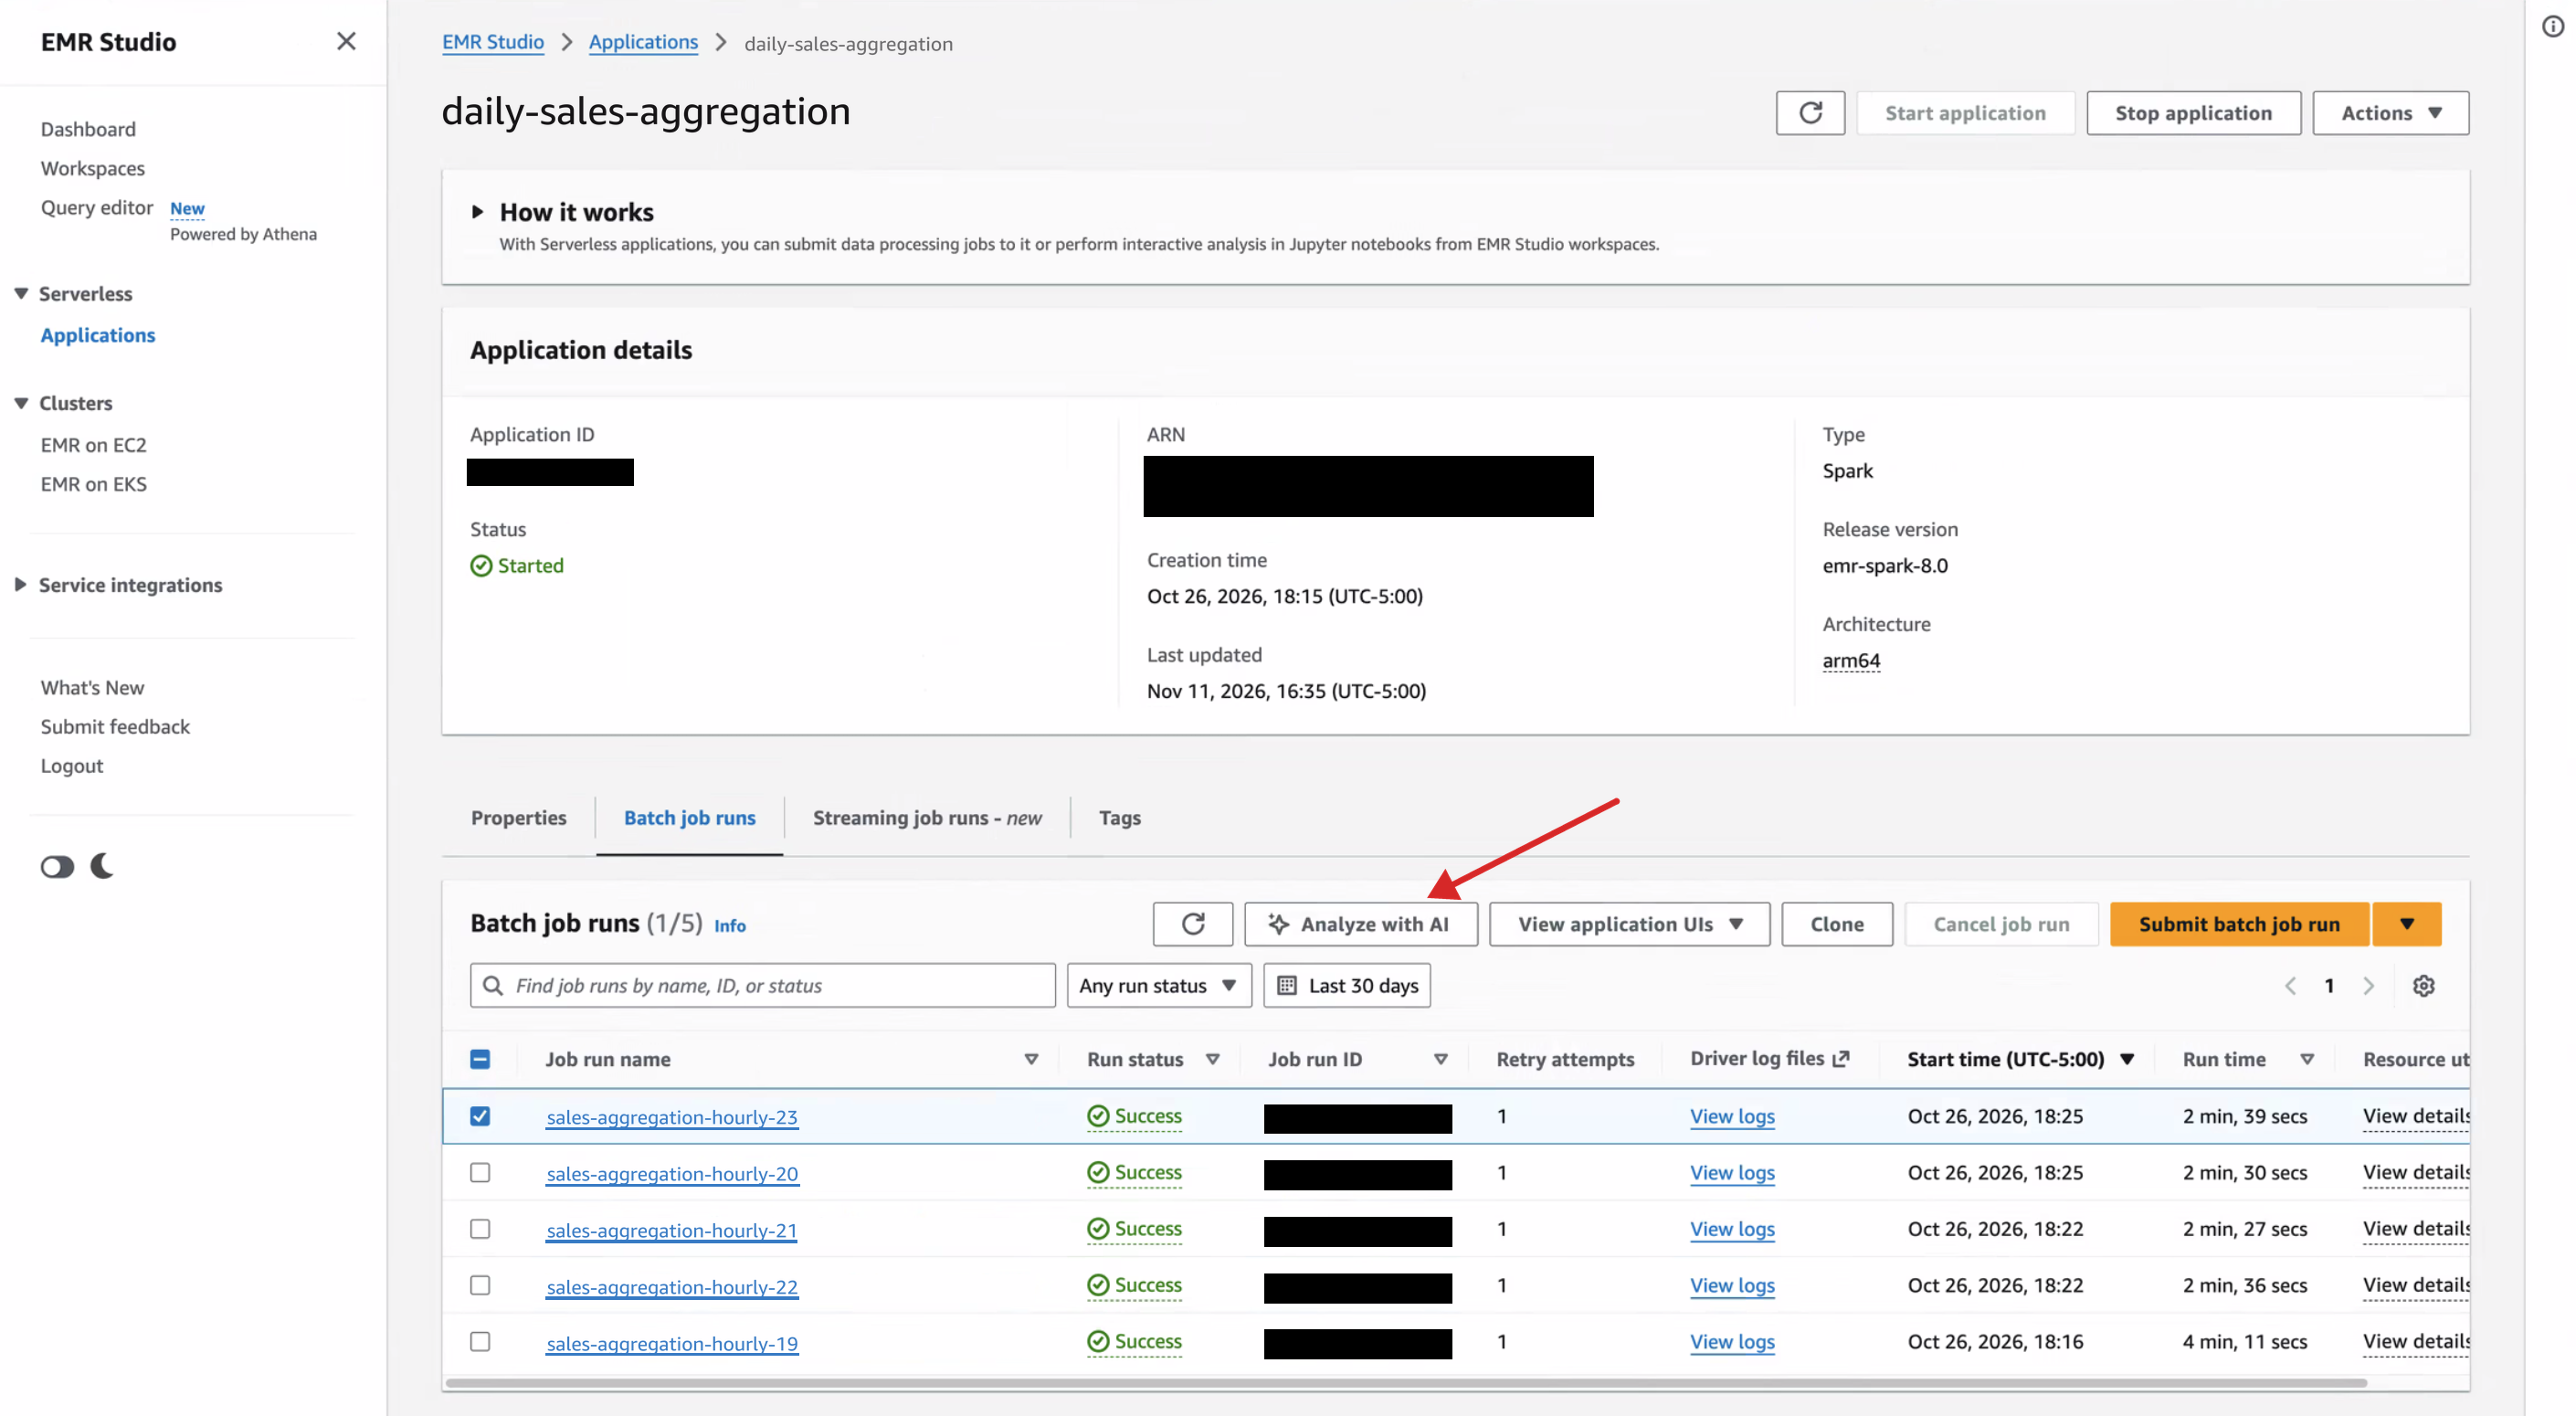
  1. In EMR Studio, select your Application, and choose the Batch job that you want to optimize.
  2. Choose Analyze with AI.
EMR Studio batch job details page with the Analyze with AI option

Figure 2: Choosing Analyze with AI for a batch job in EMR Studio

  1. You can select to optimize for Performance or Cost. If you have a previous job run that was faster, you can also choose to Compare with a baseline job. Then, choose View Recommendations.
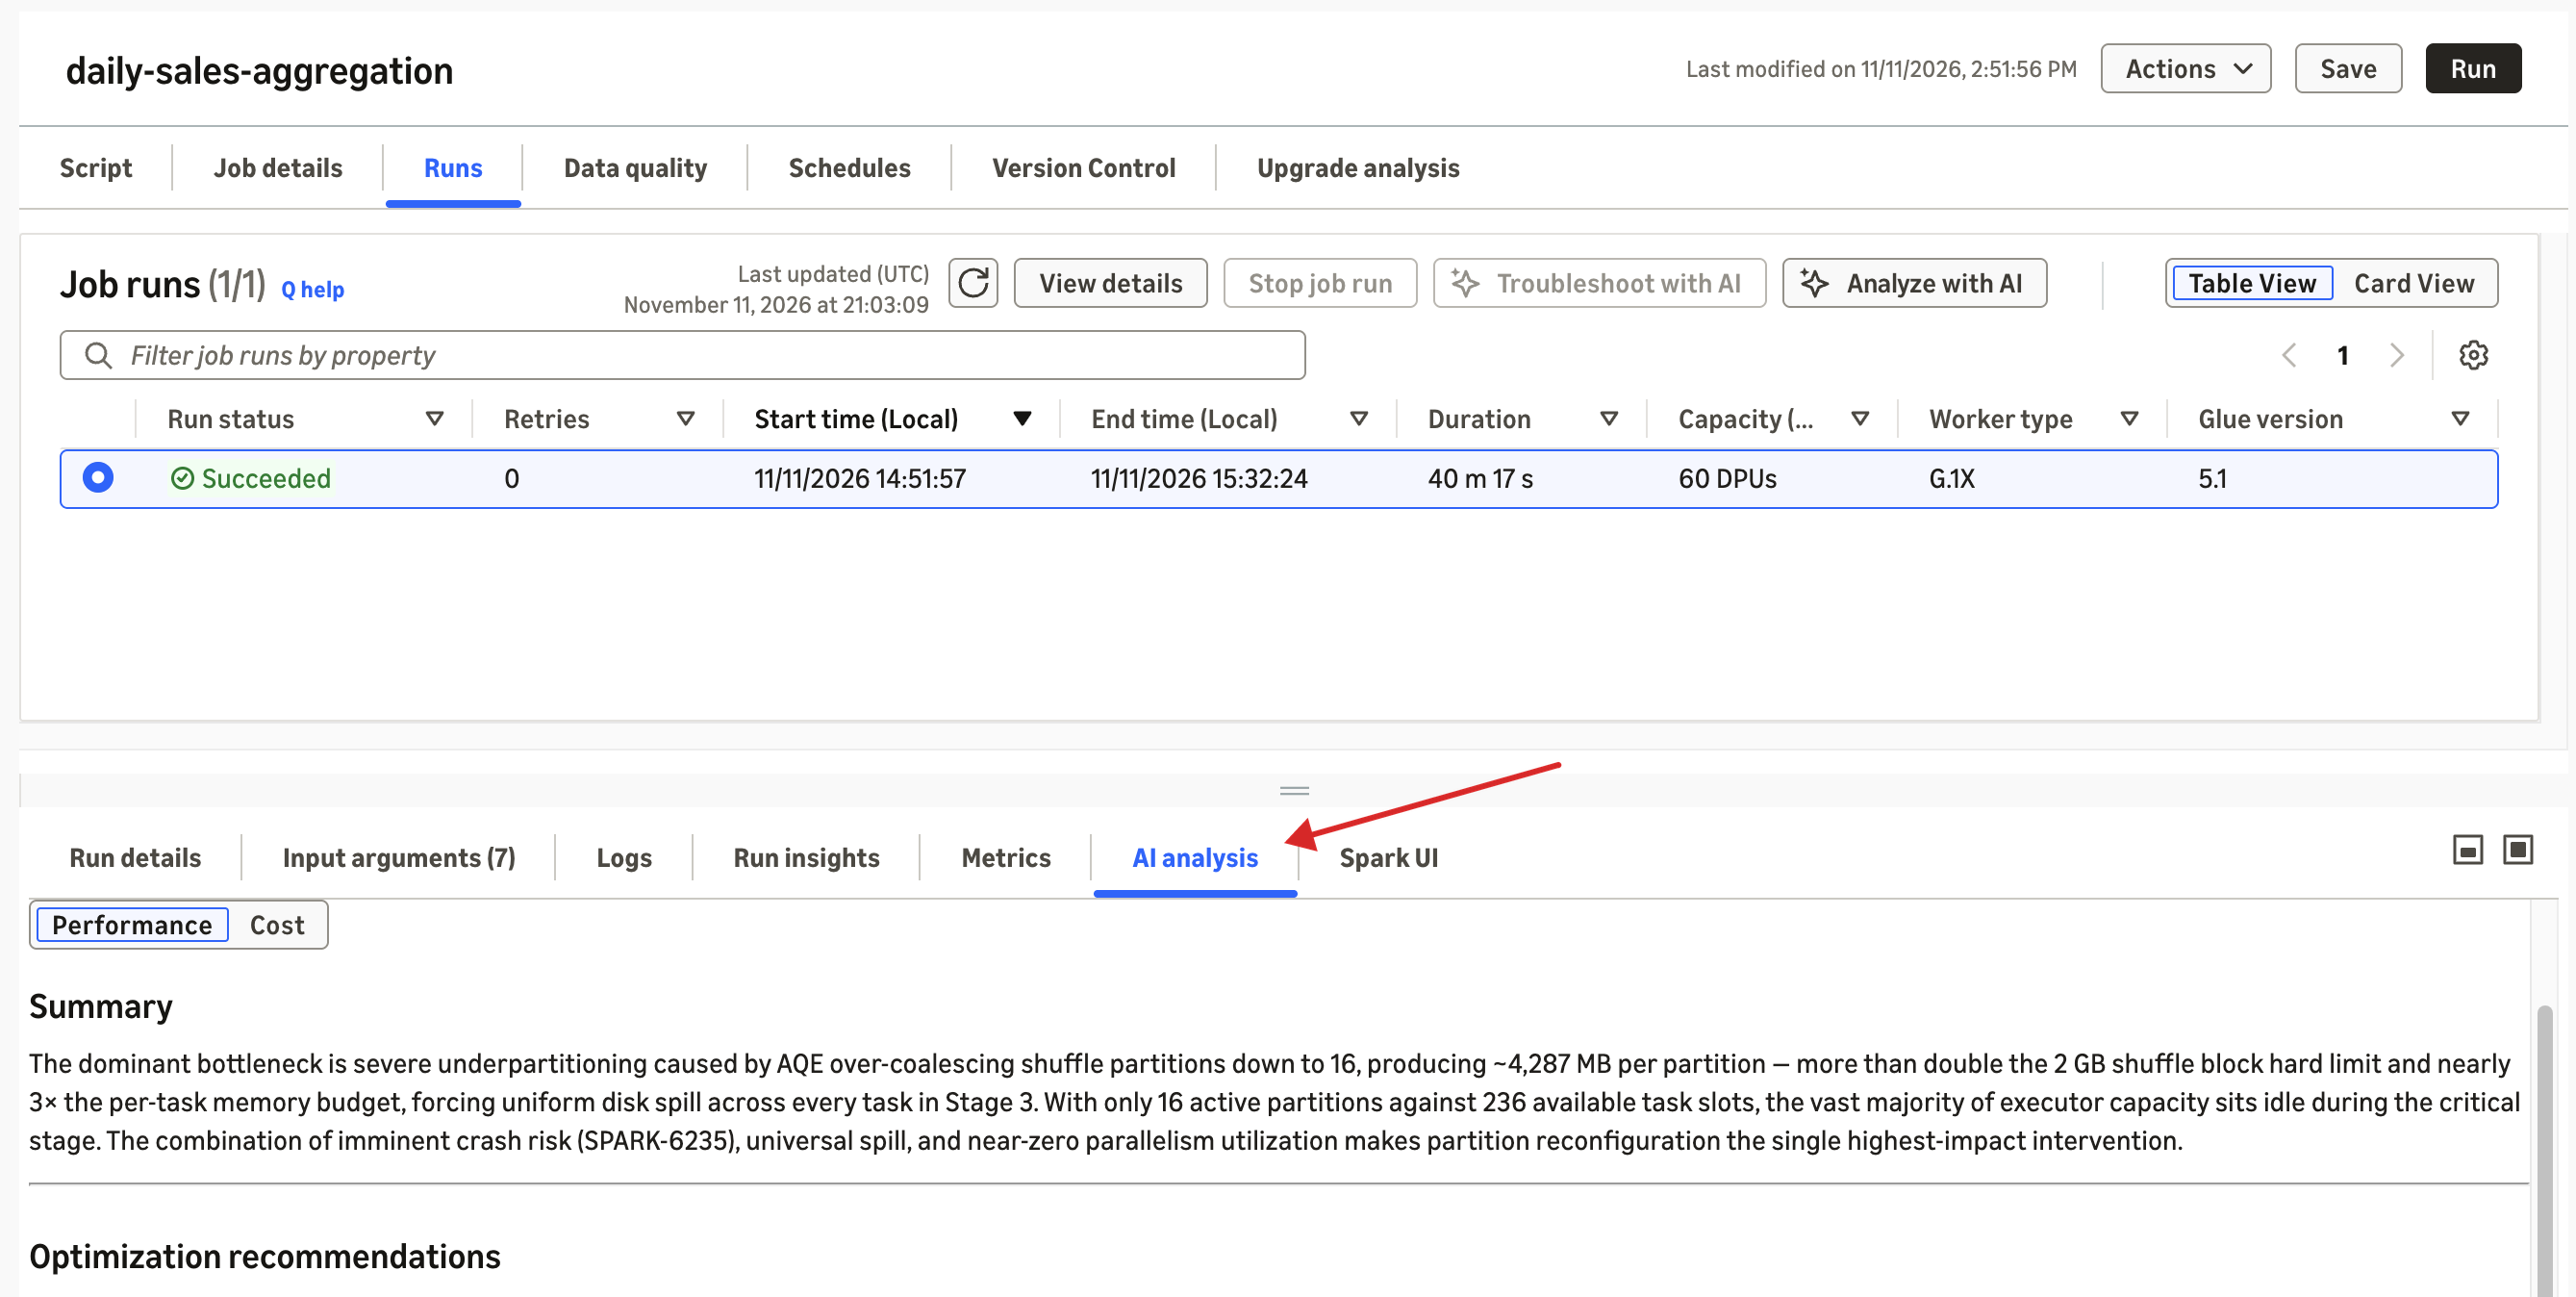
  2. Review the recommendations in the AI Analysis tab and apply them to the next run.
AI Analysis tab in EMR Studio showing the agent’s recommendations for the selected job run

Figure 3: AI Analysis tab in EMR Studio showing the agent’s recommendations

AWS Glue

  1. Go to the AWS Glue console.
  2. Under ETL jobs, choose the AWS Glue ETL job that you want to optimize.
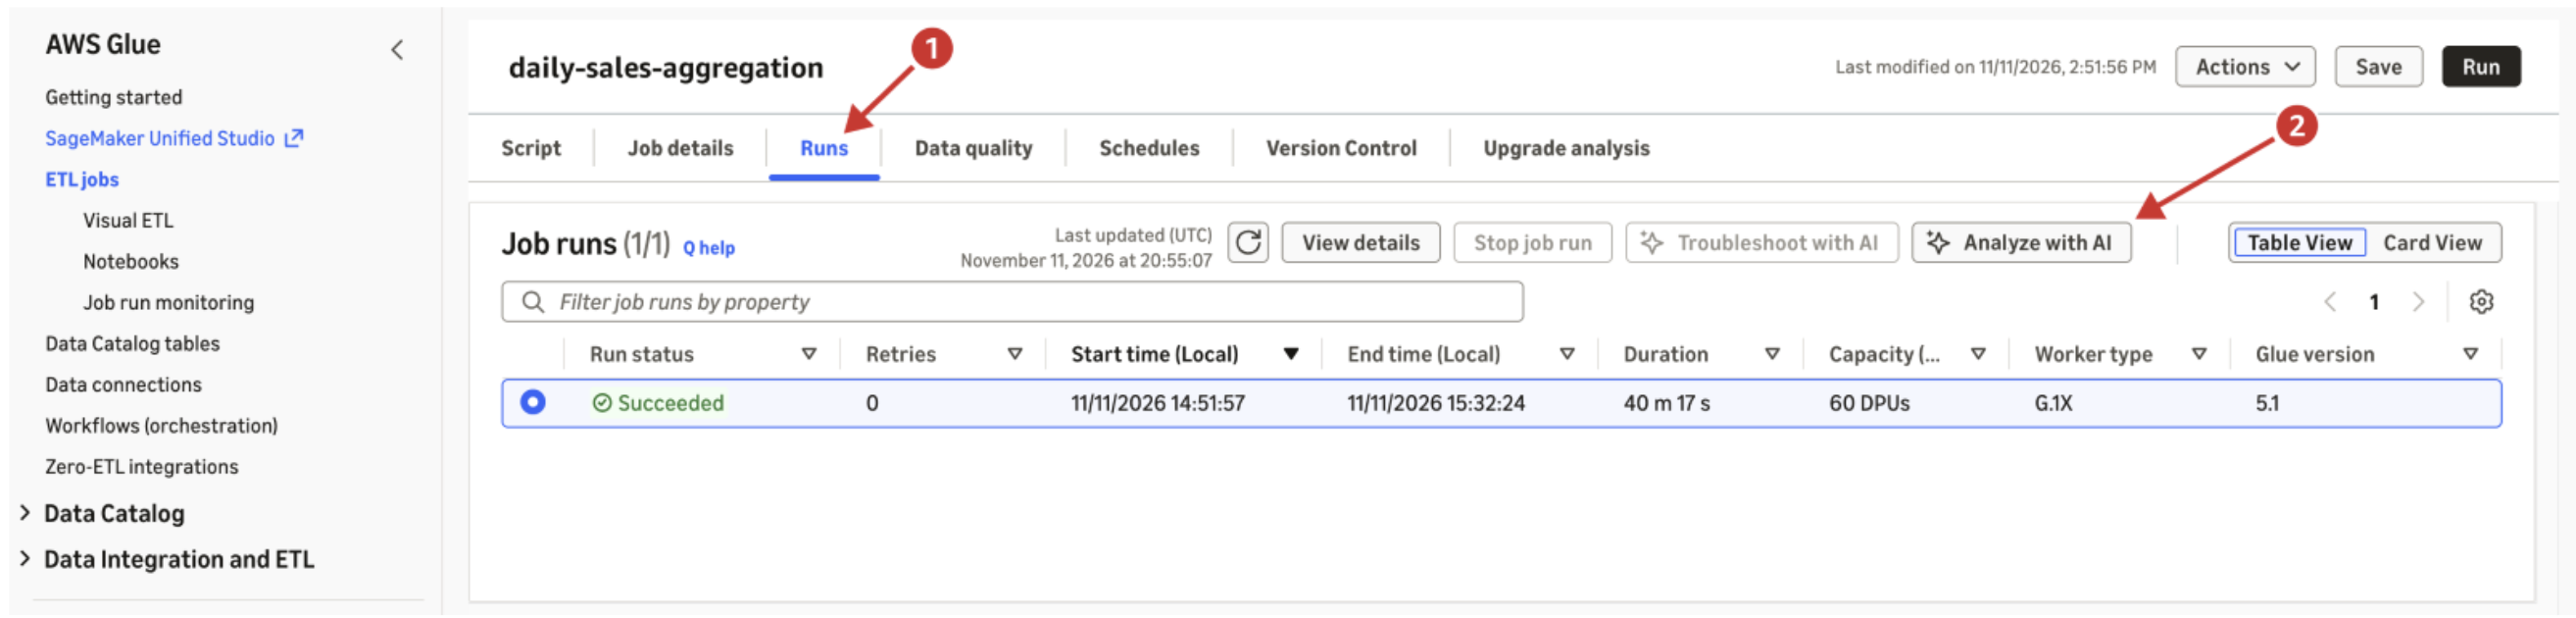
  3. Choose the Runs tab, select the succeeded job run and choose Analyze with AI.
AWS Glue console Runs tab with a succeeded job run selected and the Analyze with AI option

Figure 4: Selecting a succeeded run on the AWS Glue console Runs tab and choosing Analyze with AI

  1. You can select to optimize for Performance or Cost. If you have a previous job run that was faster, you can also choose to Compare with a baseline job.
  2. Once the AI Analysis has completed, you can view the recommendations, apply the changes, and perform the next run.
AI Analysis tab in the AWS Glue console showing the agent’s recommendations

Figure 5: Reviewing the agent’s recommendations in the AI Analysis tab on the AWS Glue console

Use cases

The agent works across many situations. The following table shows sample prompts for each goal. In an MCP-compatible client, include the job run ID, and for a comparison, the baseline run ID.

Goal Sample prompts
Performance “My job is slow. How do I make this job faster?”
Cost “My bill is too high.” / “Reduce spend without impacting reliability.”
Baseline comparison “Why is my job running slowly today?” / “My job used to finish in 10 minutes but now it takes an hour.”

The following three use cases are common situations that data teams run into. Each one describes a scenario, the Spark issues that the agent looks for, and what you get back. They apply to both Amazon EMR Serverless and AWS Glue ETL.

My job is missing its SLA. How do I make it finish sooner?

A nightly orders pipeline that feeds an 8 AM dashboard takes longer as time goes on, and adding more compute power is not always a good practice. You ask the agent to optimize the run for performance. It identifies the bottleneck and then recommends the exact settings to change for that stage so the job finishes sooner.

How can I make this job cheaper?

The bill keeps rising, but every job finishes on time, so the jobs rarely get reviewed for optimization. You ask the agent to optimize the run for cost without significantly affecting the runtime. It compares the executors a job held with what its stages kept busy, exposing over-provisioning, such as a minimum executor count set too high or dynamic allocation left uncapped. It then sizes capacity to actual use. Before you apply these changes, it shows the runtime trade-off between cost and performance. For example, reducing the number of executors can improve resource utilization and lower cost but can also increase the job’s runtime.

Why is this run slower than my baseline run?

A job now takes several times as long on the same datasets compared to previous runs. This is a baseline comparison scenario. You give the agent the slow run and an earlier run that finished on time. Instead of tuning the slow run in isolation, the agent compares the two runs side by side, covering their configuration, metrics, and stage behavior. It isolates the differences that explain the regression, and tells you which settings to restore to get back to baseline performance.

Optimization results

The agent tunes every recommendation to the specified goal and checks to confirm it does not regress the other dimension beyond tolerance.

We tested the Apache Spark optimization agent across hundreds of workloads on Amazon EMR Serverless and AWS Glue ETL. The tests included industry benchmarks (derived from TPC-DS and TPC-H) at various scale factors, along with customer-representative workloads shared by enterprise AWS Glue and Amazon EMR customers.

The evaluation set is made up of Spark workloads that follow common patterns from multiple different industries such as ecommerce, industrial telemetry, manufacturing, and more. Each workload copies the structure of a typical production job, including its join strategies, shuffle sizes, and skew, so the agent’s recommendations can be checked against realistic performance. Together, the workloads cover most production ETL patterns: ingestion, multi-way joins, upserts, slowly changing dimensions, rollups, and full query benchmarks. They run on several open table formats and on standard columnar storage.

The following table shows the ranges of cost improvement observed when invoking the agent with the cost intent and the performance improvement observed with the performance intent. Across hundreds of workloads, the agent reduced cost by 24-31% with the cost intent and improved performance by 23-49% with the performance intent.

Workload Cost improvement Performance improvement
Aggregate (across 100+ workloads) 24–31% 23–49%
TPC-DS 3 TB 30–78% 32–44%
TPC-H 3 TB 10–64% 19–33%

The ranges in the table reflect testing across different versions of Amazon EMR Serverless and AWS Glue ETL.

Note: The cost or performance improvement you see depends on your workload, its current configuration, and the version of Amazon EMR Serverless or AWS Glue ETL you are running.

Conclusion

In this post, we introduced the Apache Spark optimization agent for Amazon EMR Serverless and AWS Glue ETL. We showed how the agent analyzes successful Spark runs and recommends changes that reduce cost and improve runtime, how it explains why a run regressed against earlier faster runs, and how each recommendation points back to the measurement behind it. We also walked through how the agent works and different ways to use it.

If a job run fails, the Apache Spark troubleshooting agent under the same MCP endpoint analyzes the run’s logs and Spark event data, identifies the root cause, and explains it in plain language.

To get started, pick a job that you run often or that you want to optimize, and ask the agent how to optimize it for cost or performance. Validate the recommendations in a test run before you apply them in production. If you already use the Apache Spark troubleshooting agent, you can start right away because both agents use the same MCP server.


About the authors

Neil Mukerje

Neil Mukerje

Neil is a Principal Product Manager at Amazon Web Services. He is driven to build experiences that let customers achieve their goals efficiently. In his spare time, he enjoys reading, hiking, and tinkering with technology.

David Zhang

David Zhang

David is a Senior Specialist Solutions Architect specializing in Data & AI at AWS. He focuses on designing and implementing open lakehouse architectures and agentic AI solutions. He is an active speaker at AWS events and contributes to technical publications and open-source initiatives.

Vishal Kajjam

Vishal Kajjam

Vishal is a Senior Software Development Engineer at AWS Analytics. He is passionate about distributed computing and using ML/AI for designing and building end-to-end solutions to address customers’ data integration needs. In his spare time, he enjoys spending time with family and friends.

Layth Yassin

Layth Yassin

Layth is a Software Development Engineer at AWS Analytics. He’s passionate about building distributed systems and generative AI solutions for data integration problems. Outside of work, he enjoys playing/watching basketball, and spending time with friends and family.

Jake Gordon

Jake Gordon

Jake is a Software Development Engineer in AWS Analytics. He is passionate about solving hard, customer-facing problems where distributed systems meet agentic AI. Outside of work, he enjoys playing guitar, running, and spending time with family and friends.

Martin Ma

Martin Ma

Martin is a Software Development Engineer at AWS Analytics. He is passionate about agentic AI, especially building agents that customers can trust: grounded in real data, rigorously evaluated, and reliable at scale. In his free time, he enjoys singing and playing guitar.

Pranjal Srivastava

Pranjal Srivastava

Pranjal is a Software Development Engineer at AWS Analytics. He enjoys working at the intersection of AI, machine learning, and distributed systems to turn open-ended problems into practical, scalable solutions. Beyond work, he enjoys playing chess and is an avid reader and cinephile.

Vidyashankar Sivakumar

Vidyashankar Sivakumar

Vidyashankar is an Applied Scientist at Amazon Web Services (AWS), where he works on machine learning for systems, agentic AI, and their applications to solutions within AWS. In his spare time, he enjoys reading, listening to podcasts on current affairs, AI/ML and following cricket.

Jeremy Samuel

Jeremy Samuel

Jeremy is a Software Development Engineer at AWS Analytics. He has a strong interest in creating distributed systems and generative AI. In his spare time, he enjoys playing video games and listening to music.

Andrew Kim

Andrew Kim

Andrew is a Software Development Engineer at AWS Analytics, with a deep passion for distributed systems architecture and AI-driven solutions, specializing in intelligent data integration workflows and cutting-edge feature development on Apache Spark. Andrew focuses on re-inventing and simplifying solutions to complex technical problems, and he enjoys creating side projects and producing music in his free time.

Mukul Prasad

Mukul Prasad

Mukul is a Senior Applied Science Manager in AWS Analytics. He leads the Data Processing Agents Science team developing DevOps agents to simplify and optimize the customer journey in using AWS Big Data processing services including Amazon EMR, AWS Glue, Amazon Athena, and Amazon SageMaker Unified Studio.

Kartik Panjabi

Kartik Panjabi

Kartik is a Software Engineering Leader at AWS within the Analytics, where he supports engineering teams building AWS Glue and AI-powered developer tools for AWS Glue and Amazon EMR, including the Apache Spark troubleshooting and optimization agent. He focuses on distributed data processing engines, serverless analytics, and using agentic AI to simplify large-scale data engineering workflows.

Mohit Saxena

Mohit Saxena

Mohit leads AWS Glue, AWS’s native serverless Apache Spark data integration service, and the Agentic AI applications and platform across broader AWS Data Analytics — AWS Glue, Amazon EMR, and Amazon Athena. His teams build systems that simplify how customers build, modernize, troubleshoot and optimize data processing workloads at scale.

When Is Cold Storage the Right Choice for Your Data?

Post Syndicated from Kari Wilson original https://www.backblaze.com/blog/when-is-cold-storage-the-right-choice-for-your-data/

Cold data storage is a lower-cost cloud storage tier for data you rarely read, like old backups, finished projects, and compliance records. It shrinks your monthly storage bill, but it moves cost and delay to the moment you need that data back. This guide gives you a test for when cold storage pays off, the costs that erase the savings, and the data that should never go cold.

What is cold storage in cloud computing?

Cold storage in cloud computing is a storage tier priced for data you need to keep but rarely touch. You pay less per gigabyte to store it and more—in fees, time, or both—to read it back.

Providers create cold tiers assuming infrequent access. Some return data instantly but charge per read, while others take minutes or hours to restore data. Many also stipulate a minimum storage duration, which may lead to additional costs if you delete, move, or overwrite data before this storage period concludes. Cold storage leads to trade-offs between cost, data access speed, and data retrieval requirements.

Hot vs. cold vs. archive storage: how do they compare?

Hot storage is for data you use or need to access regularly, and cold storage is for data you rarely read. Archive storage is the far end of cold, built for data you need for regulatory compliance, historical records, or legal documentation. Warm tiers sit in between hot and cold storage in terms of access, cost, and performance. Lower-cost tiers may correlate to slower data retrieval, and they may also lead to fees for data retrieval and mandate minimum storage periods (also impacting the cost).

Hot vs. warm vs. cold storage

Attribute Hot Warm Cold
Typical data Active apps, recent backups, media in production Recent projects, periodic reports, older backups Old backups, completed projects, compliance records
Storage price per GB Higher storage rate* Lower storage rate Lowest storage rate
Access Immediate May be a slight delay, minutes to hours Typically delayed: minutes to days
Retrieval fees Usually none Often charged per GB Charged per GB, usually at higher rates
Minimum storage duration Usually none** Sometimes Common

*Typically, hot tiers have a higher storage rate than cooler tiers, but providers like Backblaze offer hot storage at a much lower rate than some warm and cold services.
** Usually, but not always. Some cloud providers do include minimum retention duration on their hot storage.

Note: These are typical trade-offs within a provider’s tier structure; names, prices, and access characteristics vary, and not every cloud provider offers every tier. Some, like Backblaze, offer hot tiers only, and some may only offer cold tiers, for example.

Some archive tiers push cold economics further, with the lowest storage prices, the longer retrieval times, and the strict storage duration minimums. For more on how the tiers differ, see this breakdown of hot storage vs. cold storage.

When should you move data to cold storage?

Move data to cold storage only when it passes all four of these tests:

  1. Expected access is infrequent enough to make the total cost worthwhile.
  2. Retrieval delays won’t break your recovery time objective (RTO).
  3. You’ll keep the data past the minimum storage duration period.
  4. Restores are rare enough to absorb retrieval fees.

Restore size, frequency, and data retrieval time all impact the cost of cold storage. An occasional large restore can still be economical. However, frequent access or strict recovery deadlines can make cold storage an impractical option. Cold storage can support disaster recovery when retrieval times, costs, and availability meet your recovery requirements; critical workloads may need a faster-access copy or another recovery path.

How long does it take to retrieve cold storage data?

Access ranges from milliseconds to hours or days, depending on the service and retrieval option. Rehydration delays consume part of your recovery window; transfer time and application recovery add to it. Some cold tiers serve reads on demand at a higher price per access. Others keep data on slower or offline media and need a restore job before you can read anything.

Delays hurt most during an outage. If your recovery plan depends on data that takes hours to thaw, your storage tier sets your RTO, not your team. Backblaze offers a guide to disaster recovery with hot, warm, and cold sites that shows how recovery speed shapes the rest of your plan.

What are cold storage retrieval fees?

Cold storage retrieval fees are per-gigabyte charges for reading data from a cold tier, and they rarely come alone. Cold storage fees vary by provider and storage tier (or class) and typically include some combination of:

  • Data retrieval charges, based on the volume retrieved
  • Request charges, based on the number and type of operations
  • Temporary storage charges for restored copies, where applicable
  • Expedited-retrieval premiums, when you can’t wait for a standard restore
  • Egress fees, charged on top when data leaves the provider’s network
  • Early deletion charges, billed when you delete or move data before the minimum storage duration period ends

One unplanned restore can wipe out the savings that made cold storage attractive in the first place.

When is cold storage a poor fit?

Cold storage is a poor fit when retrieval costs outweigh storage savings, retrieval delays miss your deadlines, or data changes before the minimum storage duration ends. Keep these on hot storage:

  • Backups needed to meet recovery deadlines that the selected cold tier cannot support
  • Recent backups, which are the ones you’re most likely to restore
  • Data your apps, analytics, or AI pipelines read on a regular basis
  • Media and project files that teams return to unpredictably
  • Training datasets you reprocess as models change
  • Data you might delete or replace before a storage duration minimum ends

Cold data storage only saves money when your data stays cold

Cold data storage is the right choice when data truly stays cold: rarely read, rarely needed in a hurry, and kept past its storage duration minimum. When data fails any of those tests, the discount turns into fees and delays.

You can also skip the trade-off. Backblaze B2 Cloud Storage is always-hot storage with straightforward pricing. Backblaze B2 cloud storage pricing starts at $6.95/TB per month, with no minimum storage duration fees, free egress up to three times your average monthly storage, and the first 10GB free. Every file stays immediately readable, whether you open it daily or once a decade.

Your data shouldn’t have to choose between cheap and ready. Keep it all hot, pay cold storage prices, and start with 10GB free. Start Free on Backblaze B2.

The post When Is Cold Storage the Right Choice for Your Data? appeared first on Backblaze Blog | Cloud Storage & Cloud Backup

NGINX2Root: Remote Code Execution vulnerabilities in nginx

Post Syndicated from jzb original https://lwn.net/Articles/1108362/

Xint is reporting that
it has discovered a collection of five
critical vulnerabilities
in the NGINX web
server. The worst flaw, it says, would allow
an unauthenticated attacker to execute commands on an affected nginx server with
HTTP/2 enabled
. The company also reports a local-privilege escalation (LPE) kernel
vulnerability
, which was introduced in the 4.15 kernel, in the Stream Control Transmission
Protocol (SCTP)
subsystem. If chained with the NGINX vulnerability,
it would allow an attacker to gain root privileges on the host. A kernel patch for this
is not yet available.

We also obtained a root shell on the host in a setup where nginx was running in
a Docker container. On many Linux distributions, the SCTP module is installed by
default and the kernel loads it automatically the first time a program opens an
SCTP socket. Whether SCTP is reachable on a given host still depends on the
kernel, the available modules, and the container’s restrictions. Where it is
reachable, the attacker can take over the host kernel. Since all containers on
the host share that kernel, this gives the attacker control of the host and
every container on it.

Xint recommends updating to NGINX
1.31.9
, which was just released, and to
block the SCTP module on hosts that do not need it until a kernel fix is
available. See the mitigations
section of their report for more information.

[$] Julia 1.13 brings REPL improvements and more

Post Syndicated from jake original https://lwn.net/Articles/1108153/

Version 1.13 of Julia was released
on September 10, 2026. Julia is a general-purpose language especially well
suited to high-performance numerical computing. Its expressiveness, speed, and composability have made it increasingly popular with scientists and mathematicians.
We last looked at Julia one year ago, in a
review of the 1.12 release. The newest version features an enhanced
read-eval-print loop (REPL), a GUI for installation, a smoother developer experience, and an assortment of performance improvements.

Hello World #31 out now: Physical computing and robotics

Post Syndicated from Meg Wang original https://www.raspberrypi.org/blog/hello-world-31-out-now-physical-computing-and-robotics/

As we scramble to stay informed and ahead of AI’s place in education, is physical computing still important in computer science? According to the educators in our latest issue of Hello World, the answer is a resounding, “Yes!”

Educators from all over the world shared how they use physical computing to make abstract concepts concrete. From unplugged to AI-integrated approaches, in urban to rural settings, educators are using physical computing to build confidence and creativity in their learners.

Hello World issue 31

Many teachers have shared that building their own confidence was key. In this brand-new issue of Hello World, there are lots of practical tips on how to start, including an article from James Robinson on overcoming the common barriers to including physical computing in your practice.

“Whenever I have run physical computing workshops with teachers or students, there is usually a literal light bulb moment: when learners discover that they can control a simple light bulb LED with a piece of code they have written, and it works, they are thrilled. Finding ways for you and your students to have quick wins breeds success and confidence.” — James Robinson, Hello World issue 31

We hope this issue inspires you to try physical computing and have your own lightbulb moment, and that the thrilling feeling radiates to your learners.

Physical computing and robotics

There are so many creative ways educators are using physical computing in their classroom. This issue includes articles on how physical computing can be used to teach:

  • Machine learning through movement
  • Environmental data science
  • Secondary-level programming and cybersecurity

Our feature articles also include advice on how to survive the AI pressure cooker, an exploration of the PICRAT framework, and a conversation on the future of studying computer science.

Download Hello World issue 31 for free

Beyond the tangible importance of physical computing, some of our writers have shared how they are integrating physical computing with AI. We’ve seen how self-driving cars and human-like robots require AI to function, but they also require physical computing. Together, these technologies bridge the digital and physical worlds to bring innovative ideas to life.

Also in issue 31:

  • Cyberdecks
  • Disability in the makerspace
  • Playful computing

And much, much more.

Whether you’re already mentoring robotics champions or just starting out with paper circuits, I hope this edition of Hello World encourages you to explore something new in physical computing. Above all, I hope you have fun!

The post Hello World #31 out now: Physical computing and robotics appeared first on Raspberry Pi Foundation.

How Cloudflare WAF helps protect against Java4Shell (CVE-2026-114938)

Post Syndicated from Denzil Correa original https://blog.cloudflare.com/java4shell-waf-protection/

On November 17, 2026, the security research company Calif disclosed Java4Shell (CVE-2026-114938), a memory-corruption vulnerability in the Base64 decoder of OpenJDK, the most widely used Java runtime. Under the Common Vulnerability Scoring System (CVSS) 4.0, it scores 9.2 out of 10 (Critical). The flaw affects Java. OpenJDK published a security advisory and Oracle released patched builds in its November 2026 Critical Patch Update the same day, at 21:00 UTC.

The vulnerability lets a remote attacker with no credentials send malformed Base64 data to a Java application and overwrite memory next to the decoded output. Calif turned that overwrite into a leak of heap memory, similar to Heartbleed, and into remote code execution. Calif demonstrated pre-authentication remote code execution against Keycloak, Atlassian Jira, Atlassian Confluence, JFrog Artifactory, Jenkins and PingFederate in their default configurations, and post-authentication remote code execution against Apache Kafka, Apache Solr, Elasticsearch, Gerrit, and Spinnaker.

Cloudflare has released a new set of rules in the Cloudflare Managed Ruleset designed to detect malformed Base64 input patterns associated with this vulnerability. The rules are available on Pro, Business and Enterprise plans and are enabled by default with the Log action because malformed input and some benign application-specific token formats can resemble exploitation attempts. Blocking by default could therefore disrupt legitimate traffic. Customers can review matching requests in Security Events now and change the rules action to Block once they confirm it does not affect legitimate traffic. 

The WAF is an additional layer of defense, not a replacement for the patch. Java4Shell can be reached through paths a WAF does not see, like outbound TLS responses, and the only complete fix is to update the Java runtime. Our analysts continue to monitor attack activity and will update the rules as new techniques and variations appear. You can track rule changes in the WAF changelog and get more information on how the vulnerability develops on the dedicated Cloudflare Zero Wire briefing.

We have seen no indication so far that Java4Shell was exploited on Cloudflare infrastructure.

What we know about the vulnerability

Base64 is a common way to represent binary data as text. Java applications decode Base64 when they process authentication headers, tokens, file uploads and many network messages. To decode it faster, OpenJDK replaces frequently used code with specialized machine code, called intrinsics. On supported x86-64 processors, the Base64 intrinsic uses AVX-512 instructions to process 64 bytes at a time.

The bug sits in the handwritten assembly that handles the final characters of the input. When the tail of the input contains padding characters (=) in a position where valid Base64 never places them, the routine calculates a negative output length. That invalid length turns into a full 64-byte write. For a 65-character input, made of 64 characters followed by a single =, OpenJDK allocates a 50-byte output array and then writes 62 bytes past its end.

Java eventually rejects the input as invalid and throws an exception. By then, the neighboring memory has already been overwritten. An application's own input validation does not help, because the corruption happens inside the decoder before the application can reject the data.

The simplest trigger is 64 A characters followed by =. On OpenJDK 17, the trigger needs 128 characters followed by =, because the threshold for the fast code path is higher.

Exploitation is not point-and-shoot. The overwritten bytes are mostly fixed values, and the attacker controls only where the write lands. To build a working exploit, Calif arranged the Java heap so that the overflow enlarged neighboring arrays, which gave them first a way to read heap memory and then a way to write chosen bytes. Each target application requires its own exploit chain. Calif reported developing its first working local exploit in about three hours with the help of AI agents, so we expect other attackers to build exploit chains quickly.

Who is affected

Java4Shell affects a system only when all the following conditions are true:

Condition

Details

Java runtime

OpenJDK 17.0.6 or newer, including distributions built from OpenJDK: Amazon Corretto, Eclipse Temurin, Microsoft Build of OpenJDK, Azul Zulu, BellSoft Liberica, SAP SapMachine, Red Hat OpenJDK, Oracle OpenJDK, Oracle Java SE and Oracle GraalVM for JDK.

Check Oracle's advisory for the exact list of affected Oracle builds.

Processor

x86-64 with AVX-512 VBMI support, such as Intel Xeon Ice Lake, Sapphire Rapids, Emerald Rapids and Granite Rapids, or AMD EPYC and Ryzen Zen 4 or newer. ARM64 processors are not affected.

Input

The application decodes attacker-controlled Base64 data with the standard Java decoder.

Many applications bundle their own Java runtime, and container images ship with a fixed Java Development Kit (JDK). Upgrading the system Java package does not update those copies, and it does not replace a Java virtual machine (JVM) that is already running. Every updated service needs a restart.

Mitigate if you cannot patch right away

If you cannot update immediately, Calif documents two JVM startup flags that remove the vulnerable code path:

  • -XX:-UseBASE64Intrinsics disables hardware-accelerated Base64 encoding and decoding.
  • -XX:UseAVX=2 disables AVX-512. Apply this flag only on x86-64 hosts. OpenJDK on ARM does not recognize it and will fail to start.

Both flags require a restart and may reduce performance for workloads that decode large amounts of Base64. They buy time while you patch. They do not replace the update.

Protect your infrastructure while you patch

Patching every Java runtime takes time, especially when JDKs are bundled inside applications and container images. Cloudflare WAF can reduce your exposure while you patch. A new managed rule, available on paid plans and enabled in Log mode by default, detects the malformed Base64 input that triggers Java4Shell. For Business and Enterprise customers, WAF attack score adds a machine learning layer that scores each request for remote code execution payloads, which helps catch variations and bypass attempts that signature-based rules can miss.

New managed rules

Protection for paid plans has been released as part of the Cloudflare Managed Ruleset (Ruleset ID efb7b8c949ac4650a09736fc376e9aee). The rule is enabled by default with the Log action, because blocking by default could cause false positives on legitimate Base64 traffic. To review its matches, go to Security > Security Analytics > Events and filter by the rule ID. If the matches are not legitimate traffic, change the rule action to Block: go to Security > Settings, edit the Cloudflare Managed Ruleset, search for CVE-2026-114938 and set the rule action to Block. Alternatively, you can follow the link to review your configuration on the Zero Wire briefing.

Rule description

Rule ID

Java4Shell – Malformed Base64 Header – CVE-2026-114938

5de9b20a45ea45d3841919ab4d718bf4

Java4Shell – Malformed Base64 Query Value – CVE-2026-114938

46bb4172813e471ea62d31c02337b51d

Java4Shell – Malformed Base64 Body Value – CVE-2026-114938

d4dc3f71f1bc44a0811ae570e5e5836c

Java4Shell – Malformed Base64 Path Segment – CVE-2026-114938

0dceaf0684b54fd0b085fcfb6fd6f152

Java4Shell – Malformed Base64url JWT Component – CVE-2026-114938

0ddd0eb664a040779f2f19065a25d991

Java4Shell – Malformed Base64 WebAuthn Value – CVE-2026-114938

4fce1ea79a614c07a27348d167d74ebb

We are working on a rule for the Cloudflare Free Managed Ruleset and will update this post when it is available.

A WAF can block the exploit when the malformed Base64 arrives in an HTTP request that passes through Cloudflare. It cannot block every path to the vulnerable decoder, including:

  • Encoded or nested data. The Base64 value may be wrapped inside another encoding or compressed format that the application unpacks before decoding.
  • Non-HTTP protocols. Some affected products, such as the Apache Kafka broker, accept traffic over their own protocols.
  • Outbound connections. Calif also shared a client-side exploit: a Java program that opens a TLS connection to a malicious server can be compromised, even if it exposes no service of its own.
  • Traffic that bypasses Cloudflare. This includes internal traffic between services.

Adding defense-in-depth with WAF attack score

While the managed rule is the primary way to block malformed Base64 triggers at the edge, Cloudflare WAF Attack Score (and specifically its remote code execution sub-score cf.waf.score.rce available on Enterprise plans) can offer an additional, complementary layer of protection.

Because CVE-2026-114938 (Java4Shell) is a binary heap-corruption vulnerability, an attacker rarely achieves full, reliable remote code execution with a single 65-byte (or 129-byte) trigger string alone. On the wire, that initial trigger looks like an opaque, malformed Base64 string containing heap-corruption bytes rather than traditional web-layer injection syntax. As a result, machine learning models trained on application-layer injection patterns will not flag the raw Base64 trigger in isolation.

Instead, turning a bounded JVM heap overflow into remote code execution over HTTP almost always requires a multi-stage or multi-parameter exploit chain, which creates more fingerprints that WAF Attack Score can inspect and flag, including:

  • Heap Grooming and Triggering: To corrupt a predictable adjacent object on the JVM heap (such as a String or byte[] length header), attackers often send repetitive parameters or headers alongside the malformed Base64 payload to shape memory layout before triggering the out-of-bounds write.
  • Second-Stage Payloads: Once heap corruption gives the attacker control over execution flow or object references, the exploit still needs commands, scripts, or Java gadgets to run. If an exploit chain pairs the initial heap-corruption trigger with a second-stage payload such as shell execution primitives (/bin/sh -c, cmd.exe, reverse-shell strings) or Java class-loading gadgets (java.lang.Runtime, ProcessBuilder, serialized object streams) tucked into another header, query parameter, or request body, cf.waf.score.rce can detect and score that secondary payload as malicious.
  • Post-Exploitation Activity: Even if an initial heap-read or corruption request slips past edge filters, subsequent HTTP requests attempting to interact with an in-memory webshell or pass OS commands to the compromised JVM remain directly visible to WAF Attack Score.

Deploy protections and patch

Because sophisticated in-memory exploits can still execute raw shellcode or manipulate bytecode without ever sending plaintext shell commands over HTTP, WAF Attack Score should be used alongside explicit Base64 rules and JVM patching.

You can find more information on how to deploy Managed rules and attack score in our WAF guide, but in a nutshell:

1. Set the CVE-2026-114938 rule in the Cloudflare Managed Ruleset (Pro plan and above) to Block. It is enabled in Log mode by default, so review its matches in Security Events first. Use the links on the Cloudflare Zero Wire page to review your rules status.

2. Layer Attack Score to get ML-based remote code execution (RCE) detection: create a custom rule blocking or challenging requests with a low RCE attack score (for example, cf.waf.score.rce le 20 on Enterprise plans, or cf.waf.score.class eq "attack" on Business plans) to catch multi-stage exploit chains and post-exploitation command traffic.

3. Remediate at runtime: Upgrade to patched OpenJDK builds (or set -XX:+UnlockDiagnosticVMOptions -XX:-UseBASE64Intrinsics as a temporary workaround) to eliminate the vulnerable AVX-512 code path entirely. Follow the OpenJDK advisory and Oracle's Critical Patch Update and install your Java vendor's fixed release as soon as possible. For a prompt you can give an AI agent to inventory your Java runtimes, see the Java4Shell page on Cloudflare Zero Wire. 

Impact on Cloudflare infrastructure

Cloudflare also runs Java, so when Java4Shell was disclosed we checked our own systems. The vulnerability can only be triggered in specific hardware configurations, namely a x86-64 processor that supports AVX-512 VBMI, so a system is exposed only when both are true. Our investigation found that the majority of our Java workloads are not scheduled on vulnerable systems; we took immediate action to protect the remainder.

About an hour after the patches were published, we began rolling out a JVM startup option that turns off the accelerated Base64 routine containing the bug on all Java workloads, so decoding falls back to the standard implementation. To be safe, we are rolling out our patched configuration to all machines, regardless of hardware as a precaution. We have seen no indication so far that Java4Shell was exploited on Cloudflare infrastructure.

Update every Java runtime now

Java4Shell turns a performance optimization in the Java runtime into a path to remote code execution, and with technical details now public, we expect exploit attempts to follow quickly. The fix is to update every Java runtime and restart the services that use it. While you patch, review the new managed rule's matches and switch it to Block if you are on a paid plan and use attack score to catch remote code execution payloads that signatures may miss. 

Our WAF analysts will continue to update protections as new techniques emerge. Follow the WAF changelog for rule updates and the Java4Shell page on Cloudflare Zero Wire for the latest on this vulnerability.

The collective thoughts of the interwebz