Tag Archives: AWS Fault Injection Service (FIS)

Testing application resilience with Amazon SQS and AWS Fault Injection Service

Post Syndicated from Richard Whitworth original https://aws.amazon.com/blogs/architecture/testing-application-resilience-with-amazon-sqs-and-aws-fault-injection-service/

When your application can no longer send or receive messages through an Amazon Simple Queue Service (Amazon SQS) queue, downstream processing can stall. The cause might be a misconfigured Identity and Access Management (IAM) policy, a network partition, a bad deployment, or a transient service event. Your application sees much the same thing regardless: SQS operations start failing. How your services handle those failures (failing fast on what won’t succeed, opening circuit breakers, buffering on the producer side) can be the difference between a brief disruption and a cascading outage.

If you’ve never tested those mechanisms under failure, you’re relying on assumptions. With AWS Fault Injection Service (AWS FIS), you can find out first. The goal isn’t to verify that SQS works, it’s to learn what your application does when SQS operations fail, and whether you’d notice. A resilience experiment tests your recovery mechanisms and your observability at once.

In this post, you’ll learn how to:

  • Structure a resilience experiment with a clear, measurable hypothesis and success criteria.
  • Use AWS FIS and AWS Systems Manager (SSM) Automation to simulate progressive access disruption to SQS queues.
  • Interpret Amazon CloudWatch metrics to determine whether your resilience mechanisms are working, distinguishing producer-side from consumer-side behavior.
  • Identify and fix gaps in your application’s failure handling.

Solution overview

In this experiment, you block your application’s access to SQS with a scoped deny resource policy, then restore access and observe recovery. The policy you apply rejects the data-plane operations your application depends on (sending, receiving, deleting, and changing message visibility, plus purging) while leaving queue management untouched. Disruption duration increases across four phases to surface different classes of failure. To learn more, see Control planes and data planes.

Important: Don’t deny sqs:*. In IAM policy evaluation, an explicit Deny overrides every Allow, including the automation’s own permission to remove the policy later. A deny covering sqs:SetQueueAttributes, sqs:AddPermission, and sqs:RemovePermission can lock the queue so that even the role that applied it can’t clean it up. Scope the deny to data-plane actions only. See Configuring the experiment for the safe policy shape, SQS troubleshooting: access denied, and this re:Post article on deny-policy lockout.

You can find the fault-injection code (the SSM Automation document, the FIS experiment template, and example IAM policies for both roles) in the FIS template library on GitHub.

Progressive experiment phases

Short disruptions can reveal whether your failure-handling mechanisms activate. Longer ones can expose systemic issues that might only appear under sustained failure.

Note: This experiment tests your application’s resilience patterns, not SQS itself. The scoped deny simulates what your application would experience during a network partition, a permission change, or another access disruption.

You can watch two distinct failure surfaces at once:

Producer side: The component that calls SendMessage. When sends are denied, you’re testing how the producer handles failed enqueues: does it fail fast, open a circuit breaker, buffer locally, or drop messages?

Consumer side: The component that calls ReceiveMessage and DeleteMessage. When receives are denied, you’re testing backlog growth during the outage and, on recovery, redelivery and whether a consumer working through the accumulated backlog keeps up or starts pushing messages toward the DLQ.

To isolate a consumer outage instead, where a bad deployment or scaling issue stops your consumers while producers keep sending, deny only sqs:ReceiveMessage and sqs:DeleteMessage. This can be done by editing the SSM Automation document.

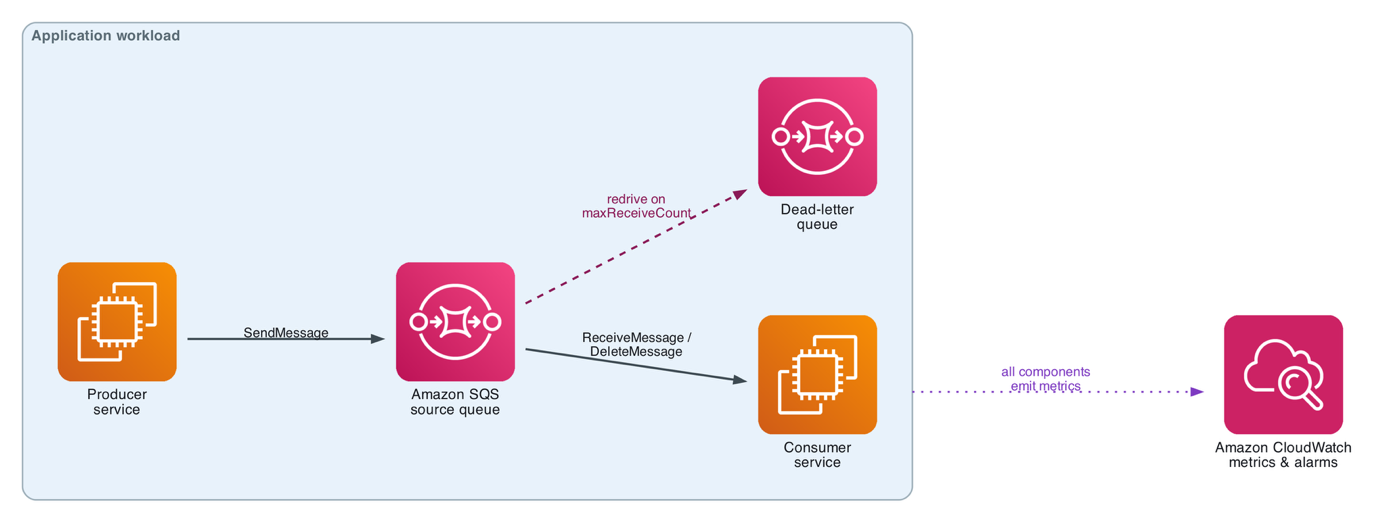
Producer service sends to an SQS queue, a consumer service reads from it, a dead-letter queue attaches to the source queue, and CloudWatch collects metrics

Architecture diagram: producer service → SQS queue → consumer service, with a dead letter queue attached to the source queue and CloudWatch collecting metrics from the producer, the consumer, and both queues.

A note on the example workload. The behaviors here (circuit breakers, local buffering, thread pools) assume long-running producer and consumer services rather than short-lived Lambda invocations.

Define your hypothesis

Start with one question: can you reason about what your system should do when SQS access disappears? That question, not whether this is your first experiment, determines what kind of hypothesis you write.

If you can, state the expectation and the metrics you’ll judge it by: When our application loses access to SQS for [duration], we expect [specific, observable behavior]. Our system will [recovery expectation] within [time] of access being restored, as measured by [metric(s)].

A team with resilience patterns already in place might write: When our order processing application loses access to SQS for 5 minutes, we expect the producer to open its circuit breaker within 30 seconds, fail fast, and buffer messages in local durable storage rather than dropping them. On recovery it will replay the buffer and return to normal processing rates within 2 minutes, as measured by NumberOfMessagesSent returning to baseline and ApproximateNumberOfMessagesVisible draining to near zero within 15 minutes.

If this is your first test or this failure mode has never been exercised, that isn’t a prerequisite. You don’t necessarily need to read the code and settings first, though a basic understanding of the implementation and its normal load helps you set guardrails that bound the test’s impact. Frame the hypothesis as discovery, stating what you’ll observe instead of what you predict:

Our order processing application has never been tested under SQS access loss. We’ll block access for 2 minutes and observe how the producer handles failed sends and whether the consumer recovers unaided, as measured by NumberOfMessagesSent, ApproximateNumberOfMessagesVisible, ApproximateAgeOfOldestMessage, and application error rates.

Either way, write it down before you proceed. The gaps between what you wrote and what happens are where your system needs work.

Prerequisites

The GitHub repo ships working examples. The following bullets note which file to start from. You’ll need:

  • An instrumented producer and consumer: the application under test. This is the one prerequisite with no example in the repo. The library ships the fault injection, not the workload. The observation tables in this post assume your application emits circuit-breaker state, failed-send and dropped-message counters, fallback-store writes, and duplicate-processing metrics. Without that instrumentation you’ll watch the queue metrics move and learn little about your application.
  • An IAM role for AWS FIS, trusted by fis.amazonaws.com and able to run the SSM Automation document (ssm:StartAutomationExecution and related, plus iam:PassRole). The repo provides both pieces: sqs-queue-impairment-tag-based-fis-role-iam-policy.json for the permissions and fis-iam-trust-relationship.json for the trust policy. Add the Amazon CloudWatch Logs permissions only if you enable experiment logging. See Logging for AWS FIS.
  • An IAM role for the SSM Automation document, able to read and modify the target queues’ policies (sqs:GetQueueAttributes, sqs:SetQueueAttributes, sqs:ListQueues, sqs:ListQueueTags). Start from sqs-queue-impairment-tag-based-ssm-automation-role-iam-policy.json and ssm-iam-trust-relationship.json in the repo. The example policy conditions the write on aws:ResourceTag/FIS-Ready, which helps prevent the automation from touching untagged queues. Keep that condition.
  • SQS queues tagged FIS-Ready: True. This scopes which queues the automation targets. Tag only non-production queues or use planned test windows.
  • A CloudWatch dashboard and alarms combining those application metrics with the queue metrics across the producer, consumer, and queue (see Monitoring strategy). The repo’s README includes an example put-metric-alarm command for a customer-impact alarm you can adapt as your stop condition.
  • A documented rollback plan in case the automation can’t remove the deny policy (if a deny ever locks out queue management, see the re:Post article on deny-policy lockout).

Important: Run these experiments in a non-production environment first. In production, confirm you have change management approvals.

Configuring the experiment

AWS Systems Manager Automation applies and removes the deny policy; AWS FIS orchestrates the sequence.

Systems Manager Automation document

The SSM Automation document follows four steps:

  1. getTargetQueues: finds SQS queues tagged with FIS-Ready: True. It calls ListQueues once, which returns at most 1,000 queue URLs, so in an account with more queues than that, add pagination or a QueueNamePrefix filter before you rely on it to find every tagged queue.
  2. applyDenyAllPolicyToQueues: adds a scoped deny statement to each queue’s resource policy. Deny only the data-plane actions your application uses, never the management actions, so the automation can remove its own statement during cleanup. If you adapt the automation, consider adding a validation step that refuses to apply any deny covering management actions. A lockout would then require changing both the policy and the validation.

Tip: You can make the deny self-expiring by adding a DateLessThan condition on aws:CurrentTime to the statement, so the deny stops applying at a set time even if the cleanup step never runs. See IAM condition operators for date and time.

  1. waitForDuration: sleeps for the specified impairment duration (ISO 8601 format, for example PT2M).
  2. removeDenyAllPolicyFromQueues: removes the FISTemporaryDeny statement, restoring normal access. The document routes onFailure and onCancel to this step so that an aborted run attempts to clean up, and the step raises if it can’t restore a policy rather than reporting success.

Choose your blast radius with Principal. "Principal": "*" denies the data plane to every caller: the application under test, but also any admin, canary, or other consumer of that queue. That faithfully simulates a service partition, but on a shared queue it impairs more than your app. To impair only the application, the more common “my app lost access” case, scope the deny to its IAM role:

"Principal": { "AWS": "arn:aws:iam::<account-id>:role/<application-role>" }

A role arn matches all sessions of that role, catching the app’s calls without applying the deny to other callers. On a shared queue, a principal-scoped deny also changes what you measure: queue-level metrics blend impaired and healthy traffic, so lean on your application’s client-side metrics and read recovery as a return to pre-event levels rather than to zero and back. Set the automation’s optional targetPrincipalArn parameter to scope the deny to one principal, or leave it empty to deny all. The rest of this post assumes the full-queue deny ("Principal": "*").

FIS experiment template

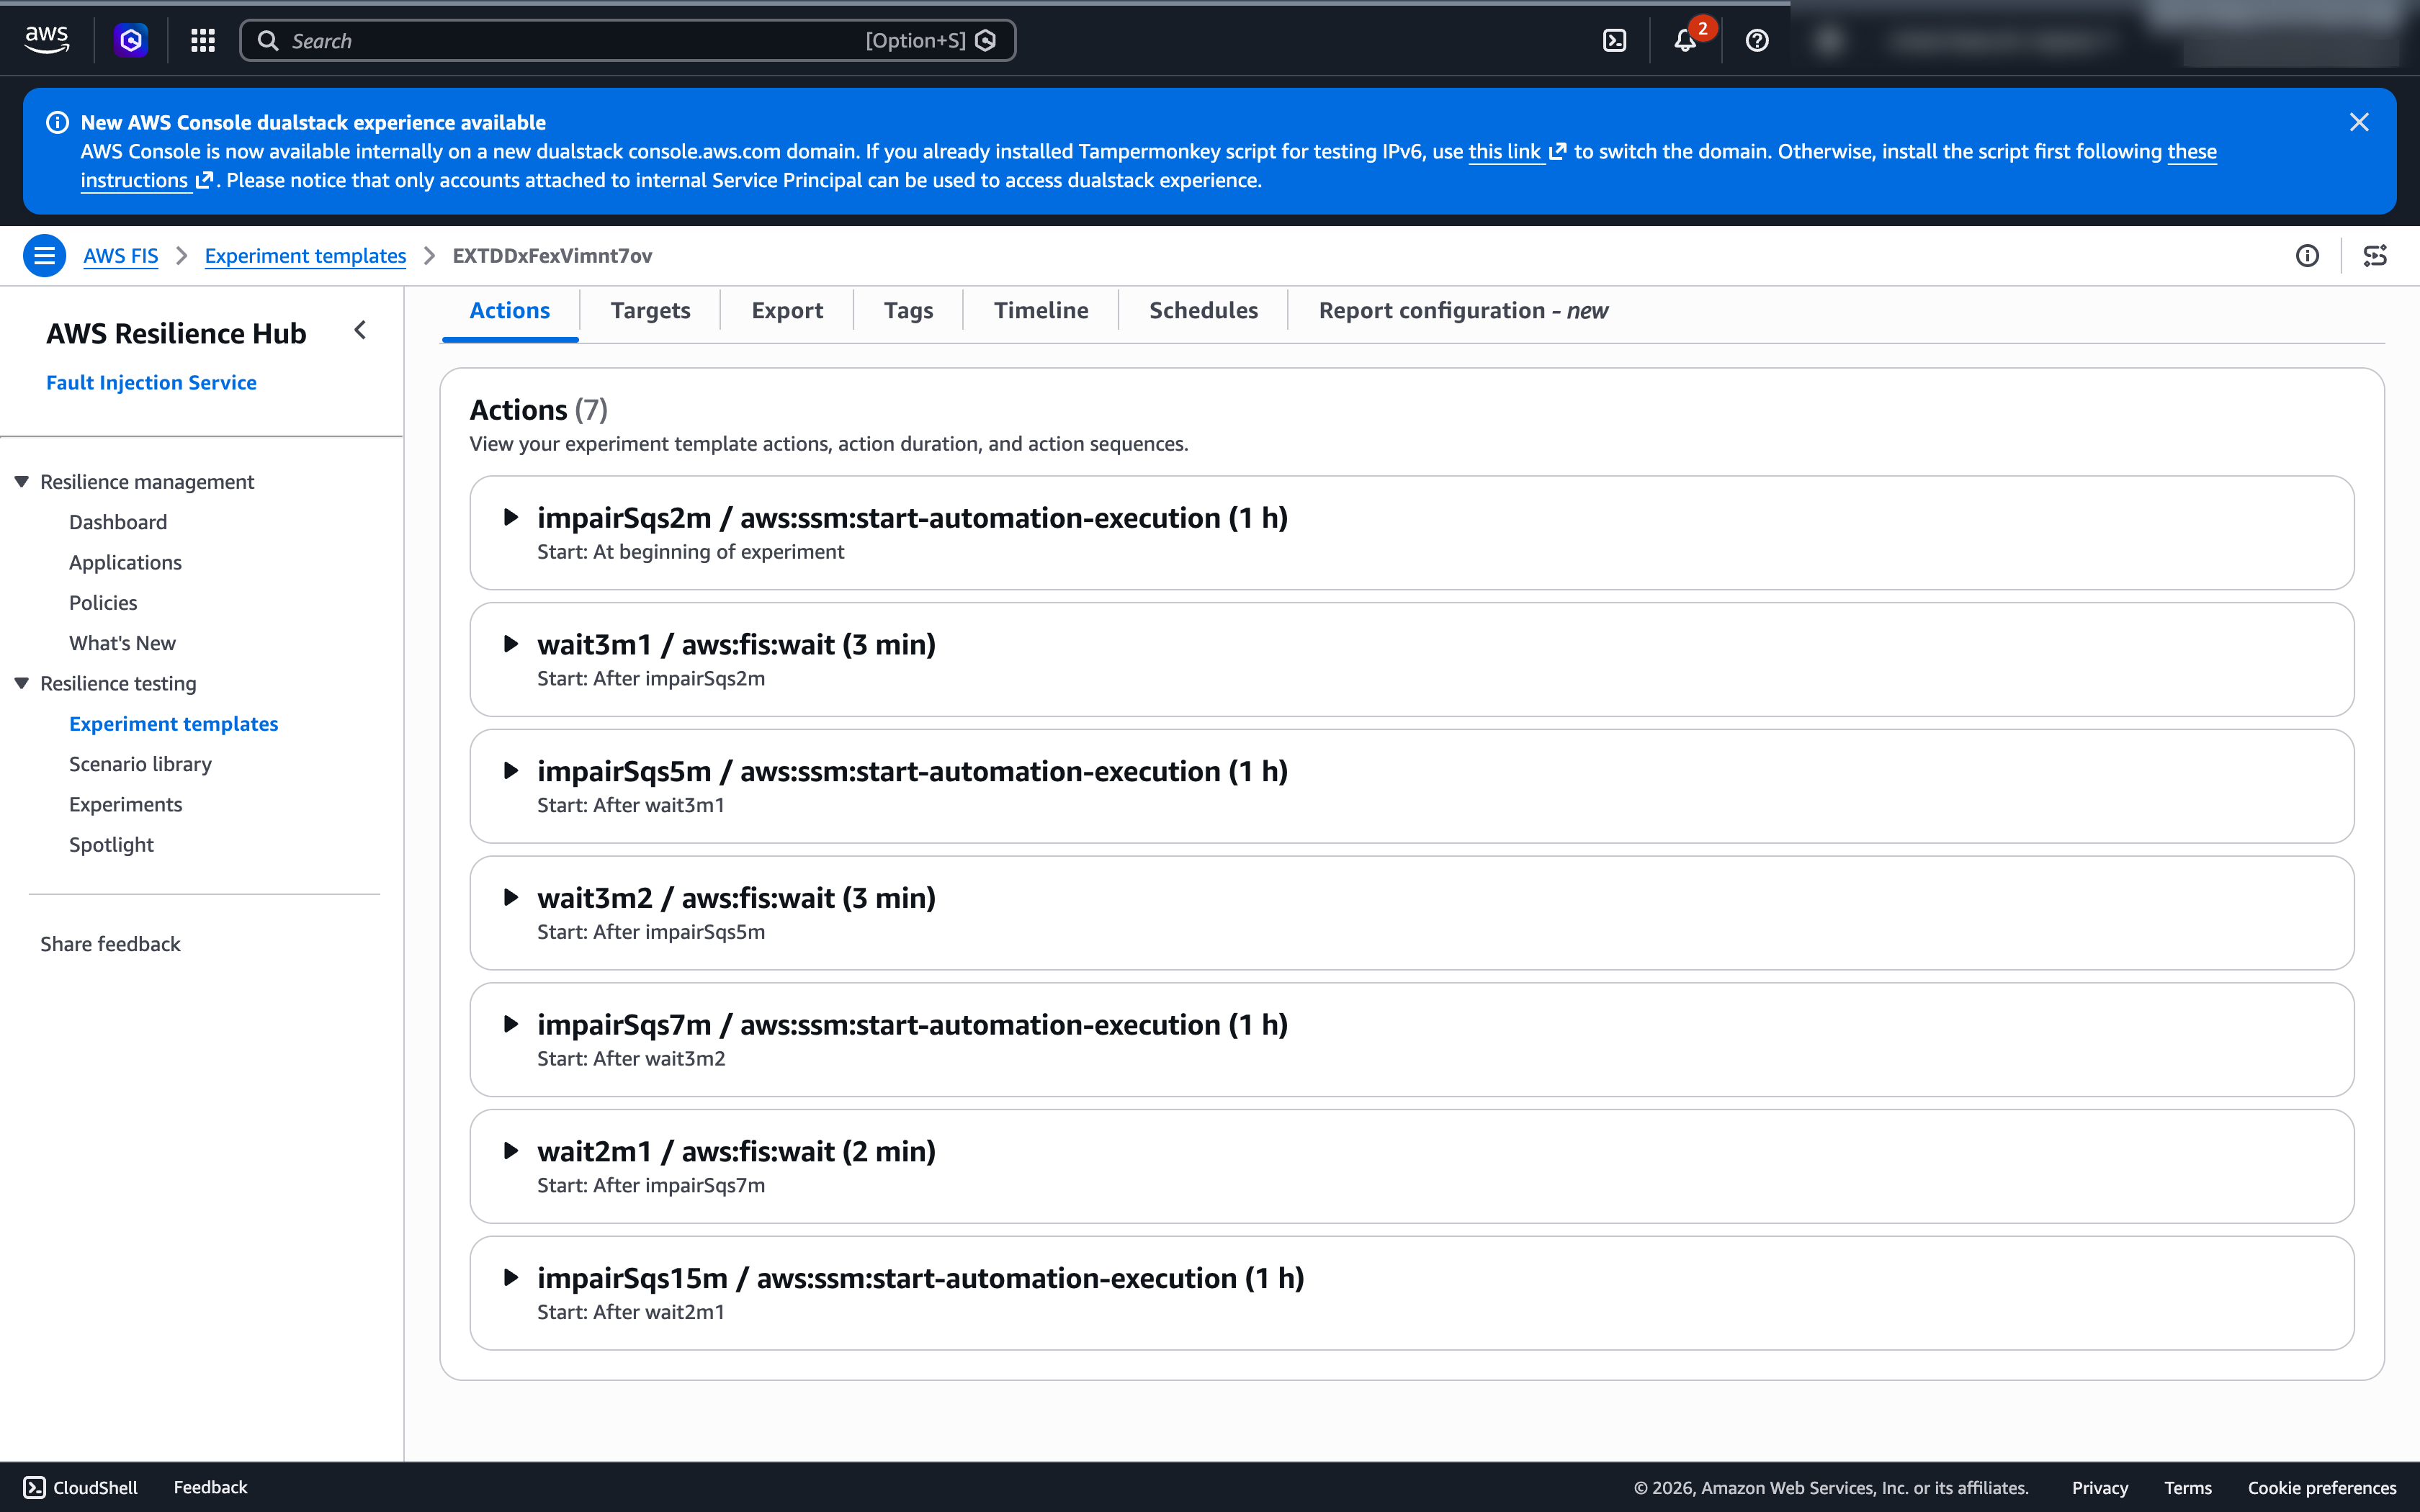
The FIS template chains the four impairment phases with recovery periods between each, calling the SSM Automation document with an increasing duration; startAfter fields enforce sequential execution. The escalation is the point. You watch cause and effect at increasing severity:

Phase Duration What this duration tends to surface
Impair 1 2 minutes Fail-fast behavior and circuit-breaker activation
Recover 3 minutes Buffered messages replay. Metrics return to baseline
Impair 2 5 minutes Backlog accumulation as the queue fills undrained
Recover 3 minutes Backlog burndown
Impair 3 7 minutes Thread-pool and memory pressure from sustained failure
Recover 2 minutes Recovery under a larger backlog. Whether the consumer keeps up
Impair 4 15 minutes Systemic limits under prolonged loss of access
The FIS experiment template with four impairment actions of 2, 5, 7, and 15 minutes chained by recovery waits

Figure: The FIS experiment template: four impairment actions (2, 5, 7, and 15 minutes) chained with recovery waits between them.

Stop conditions. A stop condition halts the experiment automatically if a specified CloudWatch alarm fires, an essential control for an escalating experiment. A triggered stop condition also unwinds what it can: FIS cancels the run, and the automation’s onCancel step removes the deny, restoring access. That rollback is a property of this experiment’s design, not of stop conditions in general: an action like EC2 instance termination does not support rollback, so check each action’s rollback behavior before relying on a stop condition to help limit damage. The library template ships with "stopConditions": [{"source":"none"}], because the right alarm depends on health signals the template can’t assume.

Metric choice matters: alarming on a queue metric like ApproximateAgeOfOldestMessage or NumberOfMessagesSent would be incorrect, as those are supposed to move during impairment. So, the alarm would trip in the first 2-minute phase and abort the run before the longer phases surface anything interesting. You’d be alarming on the effect you’re injecting.

Instead, tie the stop condition to a signal that should stay healthy if your resilience mechanisms are working. This would reflect real customer impact. If that signal degrades more than you’ll tolerate (error rates that don’t recover within the 2 minutes your hypothesis allows), your resilience has already failed and continuing risks further customer impact. Some metrics to consider alarming on:

  • An application error rate or transaction-success metric (a custom CloudWatch metric your app emits, for example failed orders per minute), the most direct measure of customer impact and independent of the SQS metrics you’re perturbing.
  • Load balancer 5xx count or target response time (for example HTTPCode_Target_5XX_Count on an Application Load Balancer), a good proxy when you don’t yet emit a business metric.
  • DLQ depth: ApproximateNumberOfMessagesVisible on the dead-letter queue crossing a threshold, which signals messages are failing permanently rather than only backing up recoverably.

See Stop conditions for AWS FIS for more information.

Deriving the threshold from your hypothesis. The preceding hypothesis expects recovery within 2 minutes of access being restored. That number is also your alarm. If failed orders per minute is your customer-impact metric and its baseline is near zero, set the alarm to failed orders per minute > 10 for 2 consecutive 1-minute periods: long enough that a spike while the circuit breaker opens shouldn’t abort the run, short enough that failing to recover inside your hypothesis window stops it. Design the alarm for how the metric behaves during failure rather than for the test: when the circuit breaker opens, a low-volume custom metric might stop emitting data points entirely. Tighten it as you approach production.

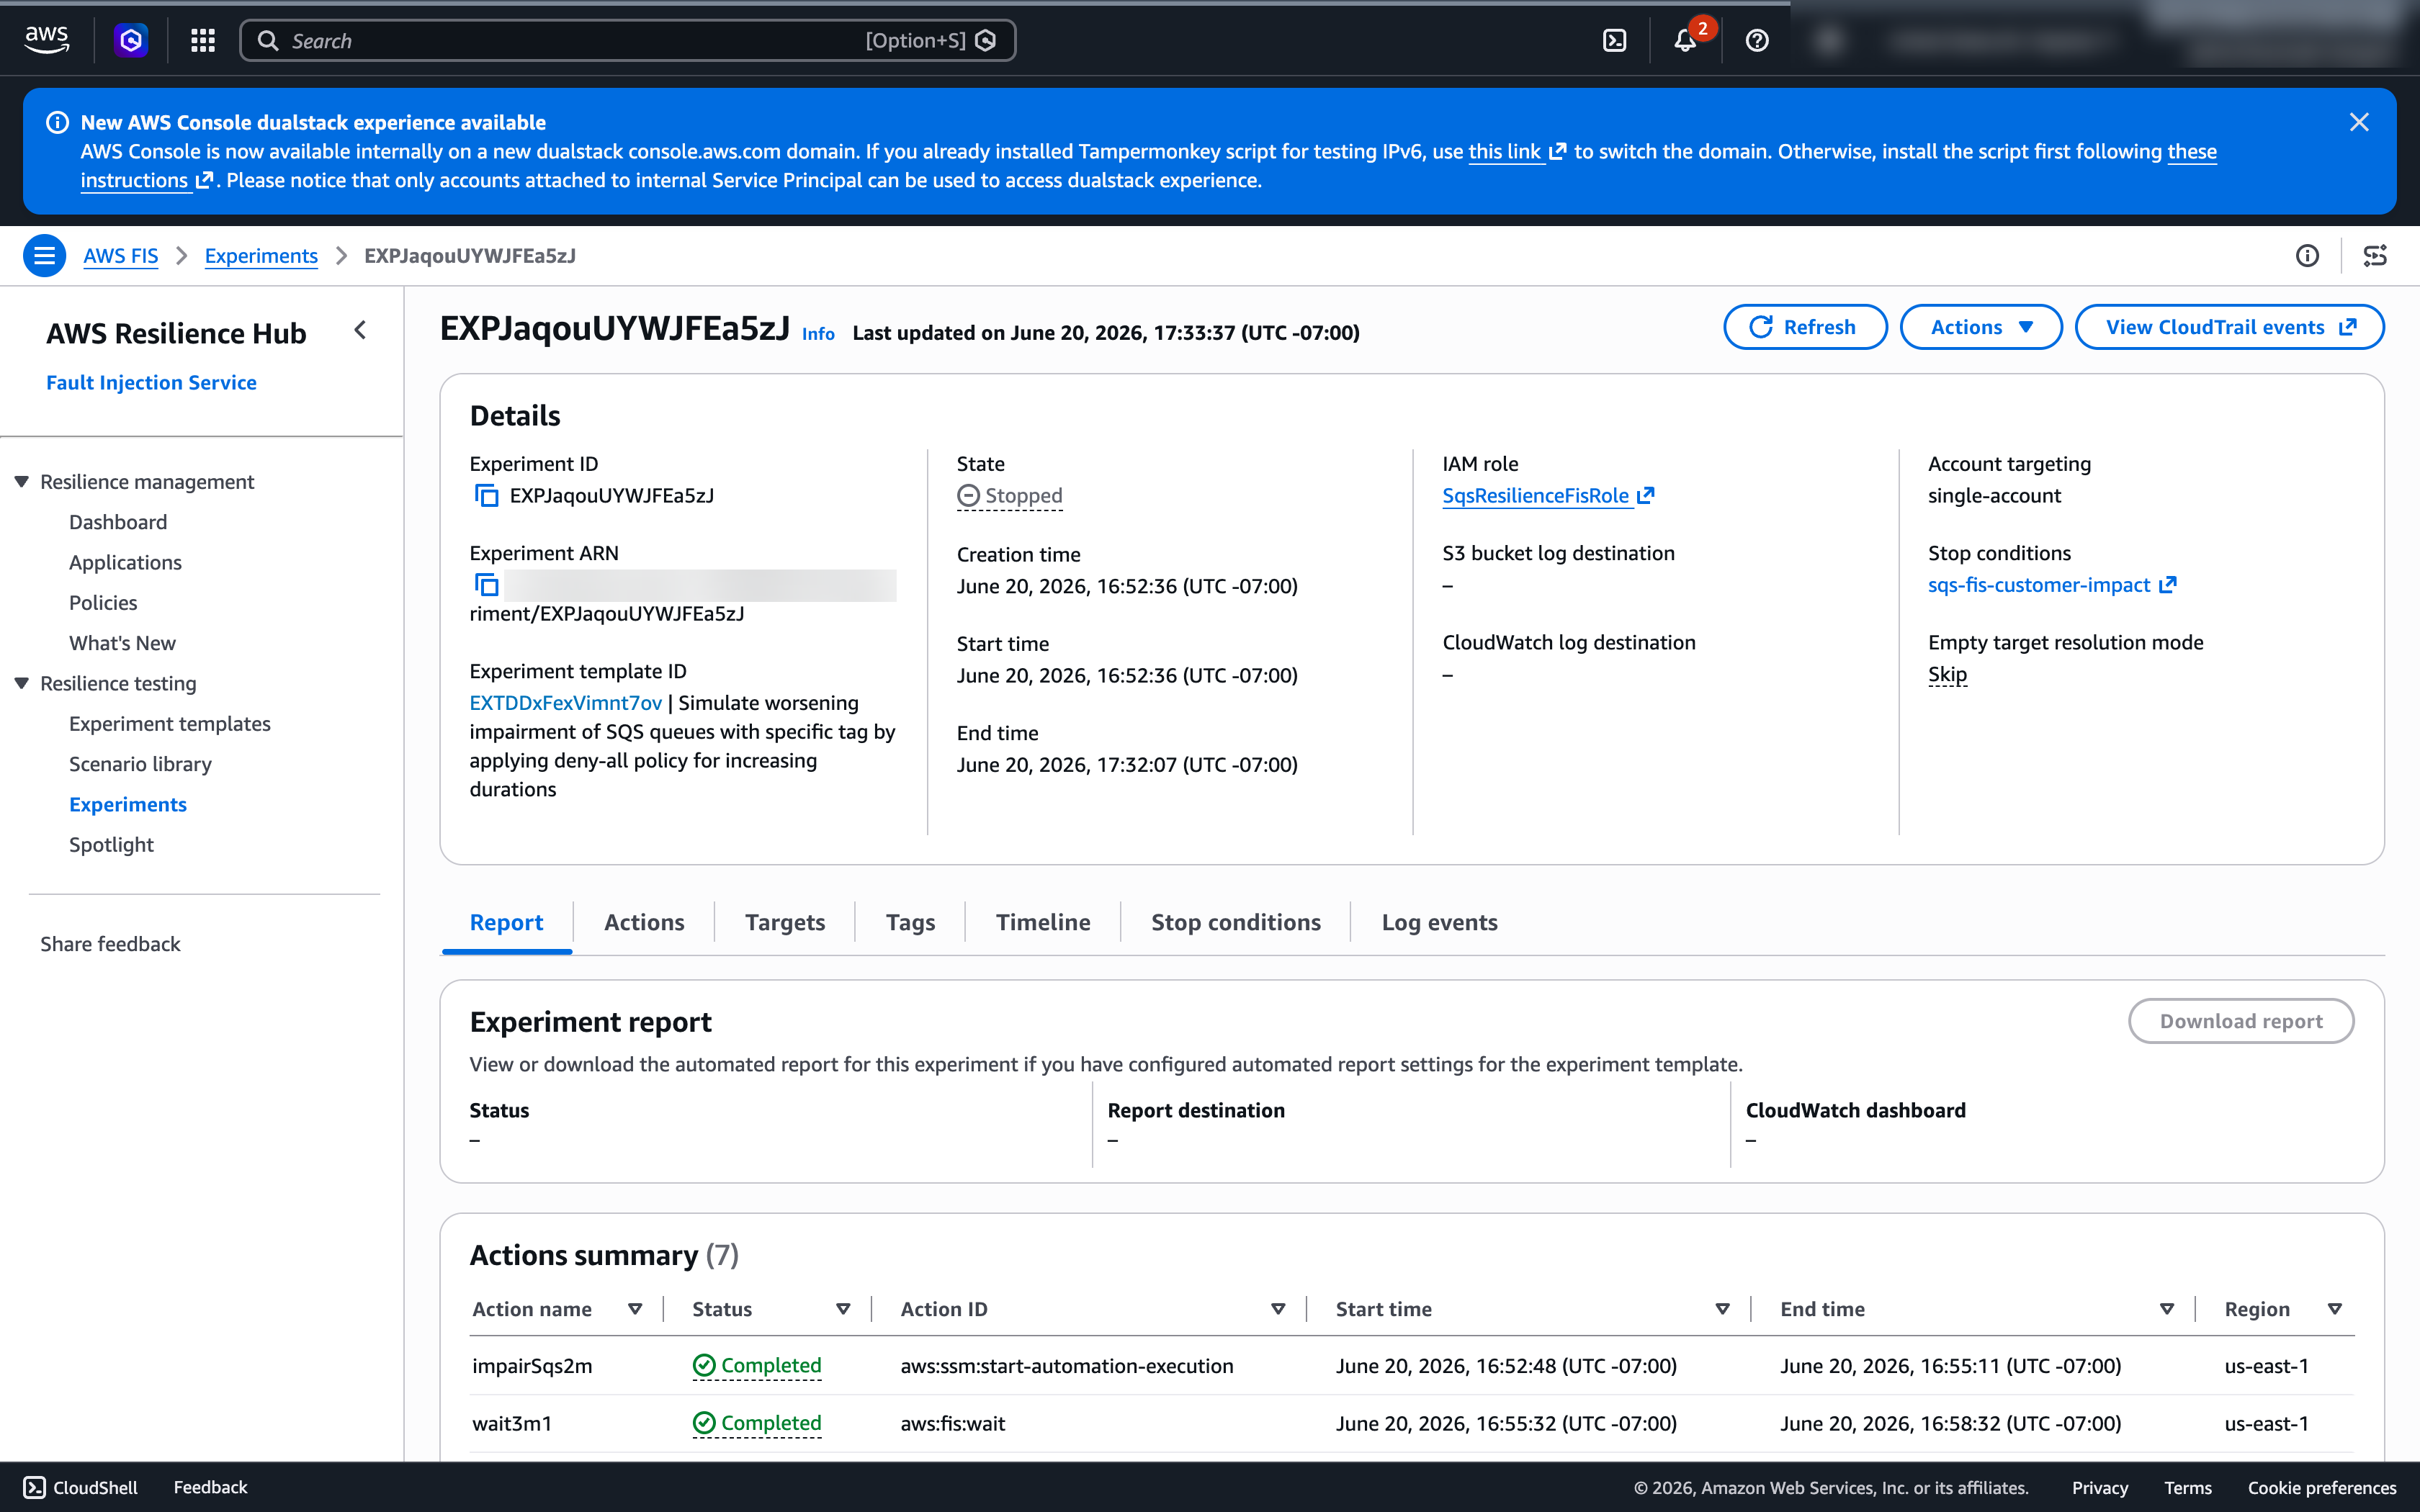
AWS FIS experiment in Stopped state after the customer-impact alarm breached and halted the run

Figure: When the customer-impact alarm breached, AWS FIS halted the experiment automatically (State: Stopped)

Running the experiment

To start the experiment with AWS FIS you can use the console or the AWS CLI:

aws fis start-experiment --experiment-template-id <YOUR_TEMPLATE_ID> --region <YOUR_REGION>

What to observe during impairment

During each phase, SQS operations return AccessDenied errors. Note what that does and doesn’t exercise: a 403 is non-retryable, so this experiment validates that your code recognizes it and stops, not your backoff path. To exercise retries and backoff, inject a retryable fault such as throttling or timeouts. The producer and the consumer fail differently, so watch them separately.

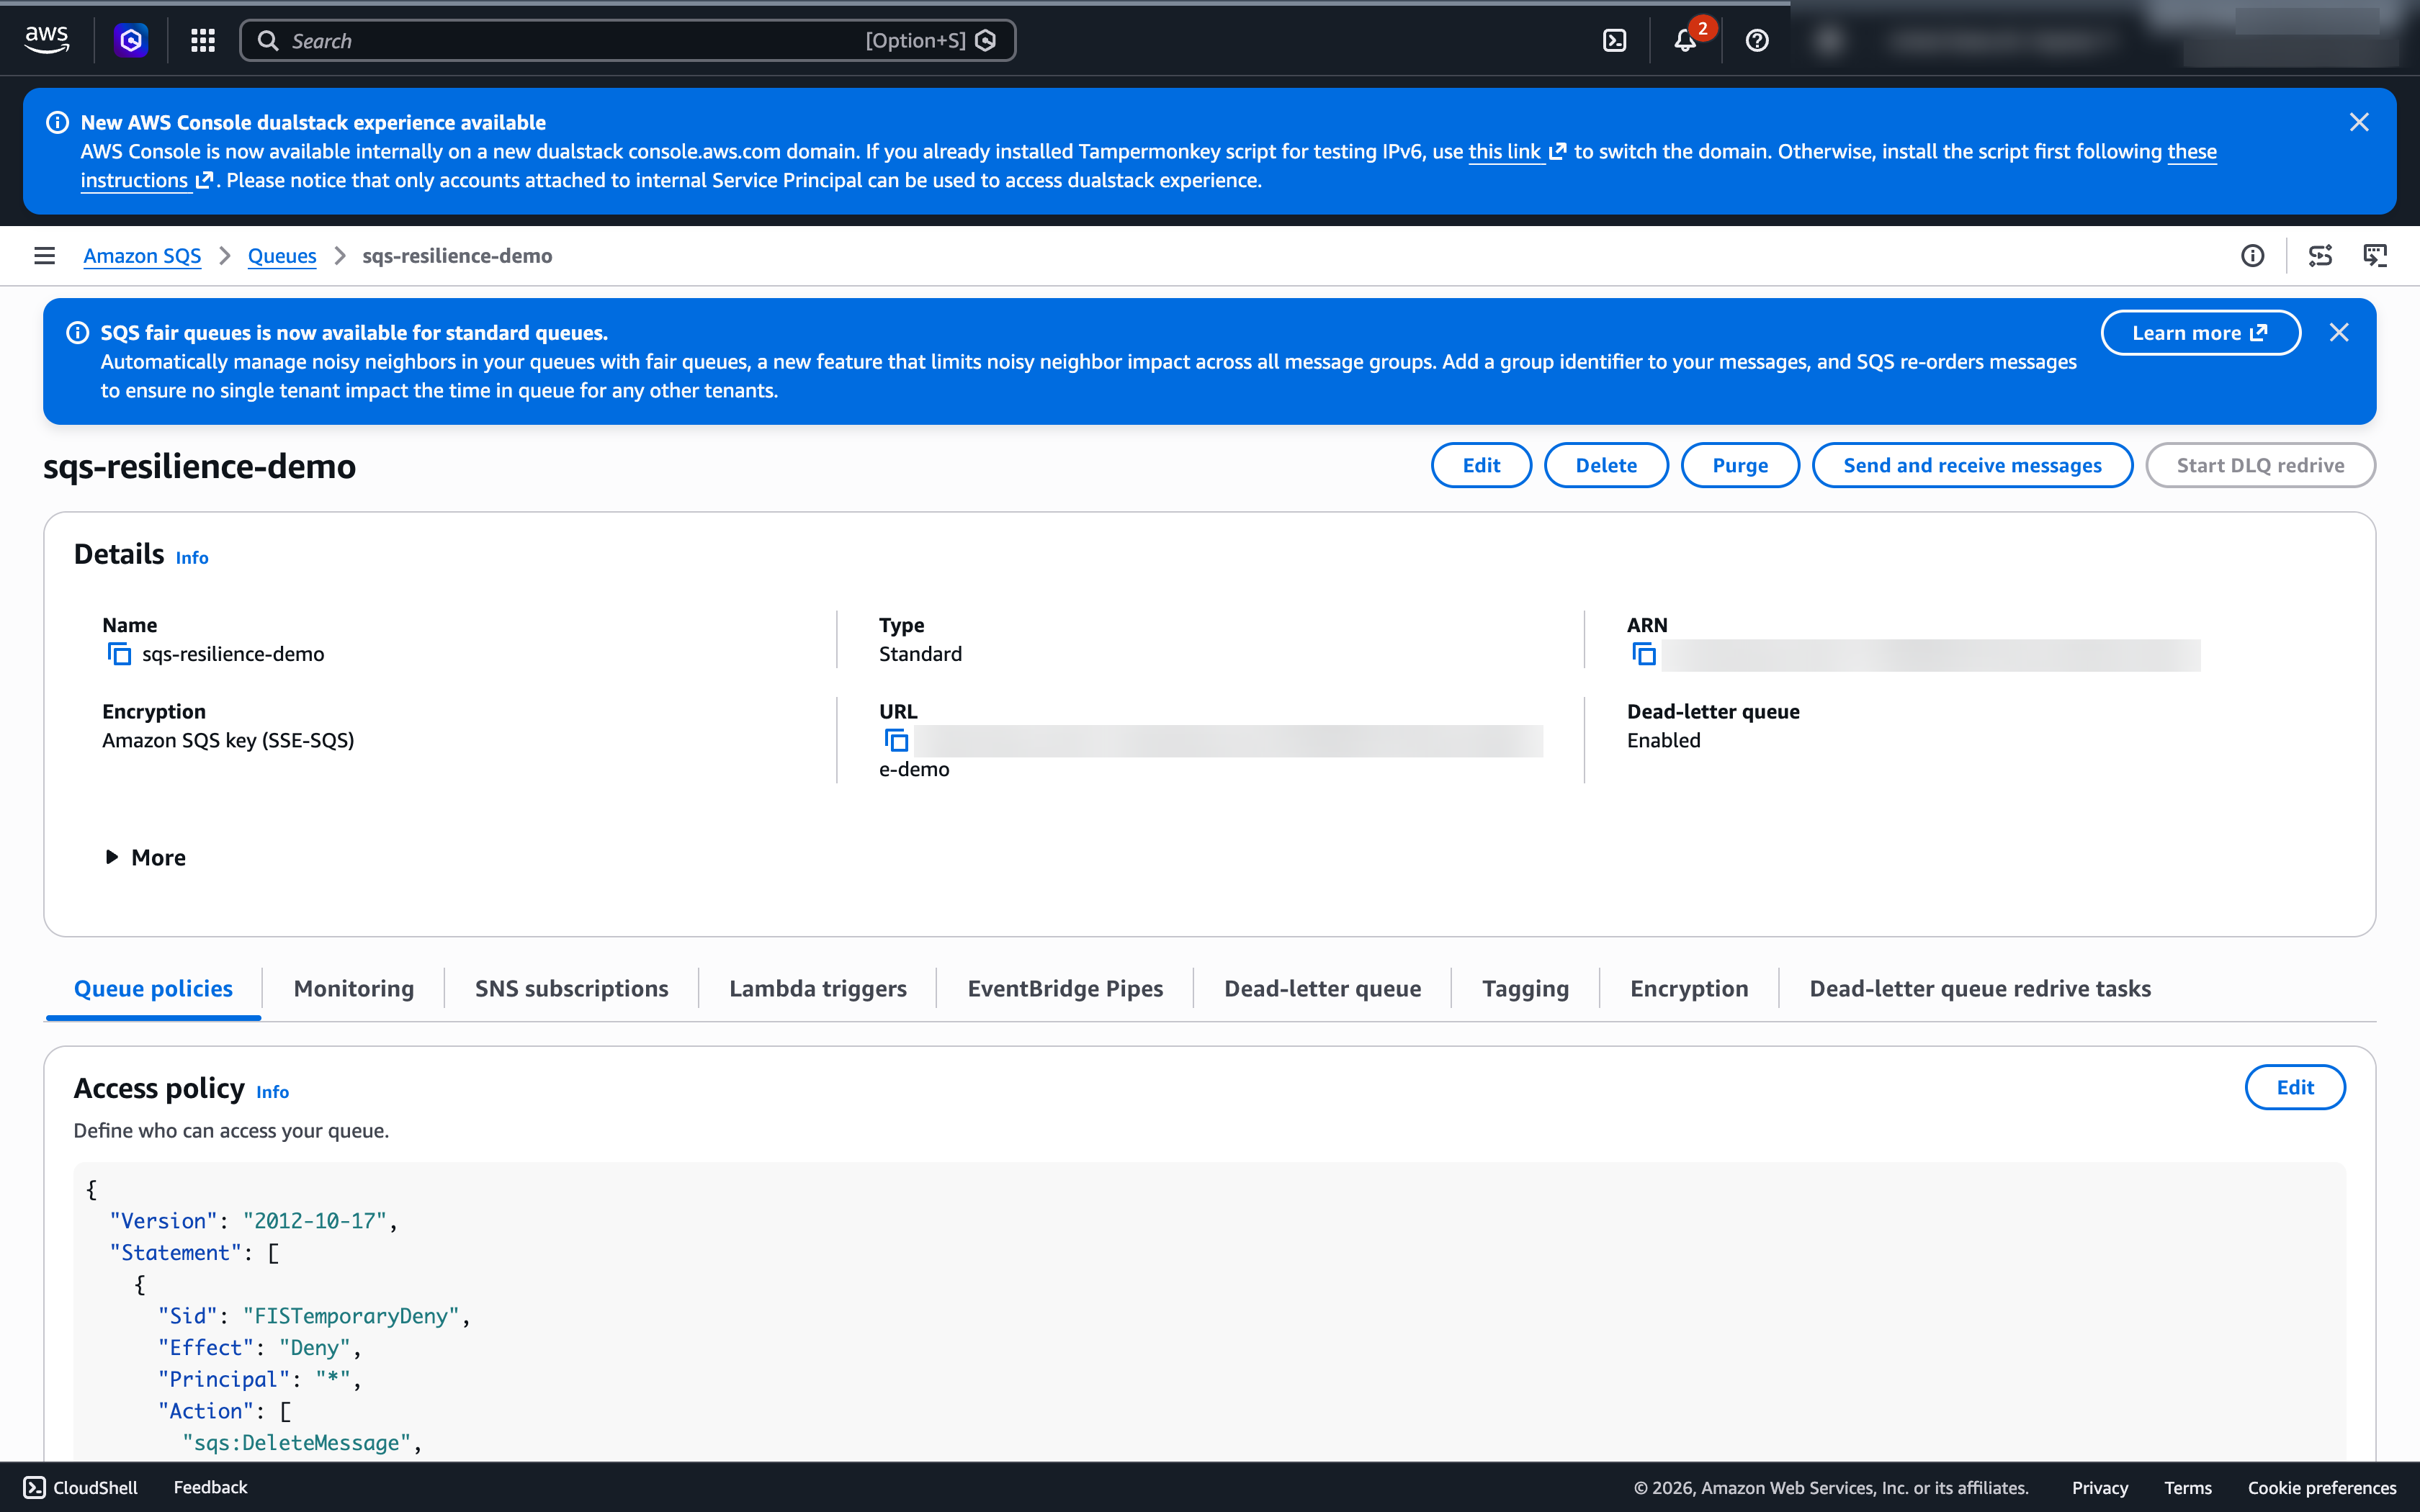
SQS queue access policy showing the scoped FISTemporaryDeny statement blocking SendMessage and ReceiveMessage

Figure: During impairment, the queue’s access policy carries the scoped FISTemporaryDeny statement; SendMessage and ReceiveMessage return AccessDenied while management actions still work.

Producer side (the component calling SendMessage):

Stage Healthy response Unhealthy response Signal to watch
First failed SendMessage Recognizes AccessDenied and fails fast Crashes, hangs, or blocks the calling thread NumberOfMessagesSent drops to ~0. Producer error rate rises
After 3 to 5 consecutive failures Circuit breaker opens. Sheds or buffers load Continues retrying indefinitely Circuit-breaker state metric. Producer CPU / threads / connections
Send gives up (non-retryable error, or retry budget exhausted) Fails fast and persists the payload to durable fallback storage, or alerts, does not silently drop Drops the message silently (permanent loss) Producer “failed send / dropped” counter. Fallback-store writes
Application state Stays responsive. Degrades gracefully Returns 500s to callers. Unbounded in-memory queueing Producer health checks, request latency
Resource usage Bounded by backoff and circuit breaker CPU/memory/connections climb (tight retry loops) Producer CPU, memory, connection-pool usage

Note: a producer that gives up on a send does not route anything to the DLQ.

Consumer side (the component calling ReceiveMessage / DeleteMessage):

Stage Healthy response Unhealthy response Signal to watch
First failed ReceiveMessage / DeleteMessage Backs off its poll loop rather than hammering. Any in-flight message returns to the queue after the visibility timeout Crashes or hangs the consumer loop NumberOfMessagesReceived / NumberOfMessagesDeleted drop
Backlog accumulates (consumers can’t drain) Backlog alarm fires. Scaling responds if keyed to queue depth (for example, backlog per worker) Backlog grows unbounded. Consumers idle-loop ApproximateNumberOfMessagesVisible stops draining (goes flat or climbs); ApproximateAgeOfOldestMessage climbs
Application state Idempotent processing. Safe to retry Duplicate side effects on redelivery Downstream idempotency / duplicate-write metrics
Resource usage Bounded by visibility timeout and backoff In-flight messages pile up. Consumer saturation ApproximateNumberOfMessagesNotVisible. Consumer CPU/memory

Don’t expect the DLQ to fill during impairment. Redrive is driven by maxReceiveCount: a message moves to the DLQ only after a consumer has received it that many times without deleting it. With ReceiveMessage denied, nothing is delivered, the receive count doesn’t increment, and nothing redrives. The DLQ depends on the very call that’s blocked, so it’s something to watch for during recovery, not during the outage.

Key CloudWatch metrics, and how to read them:

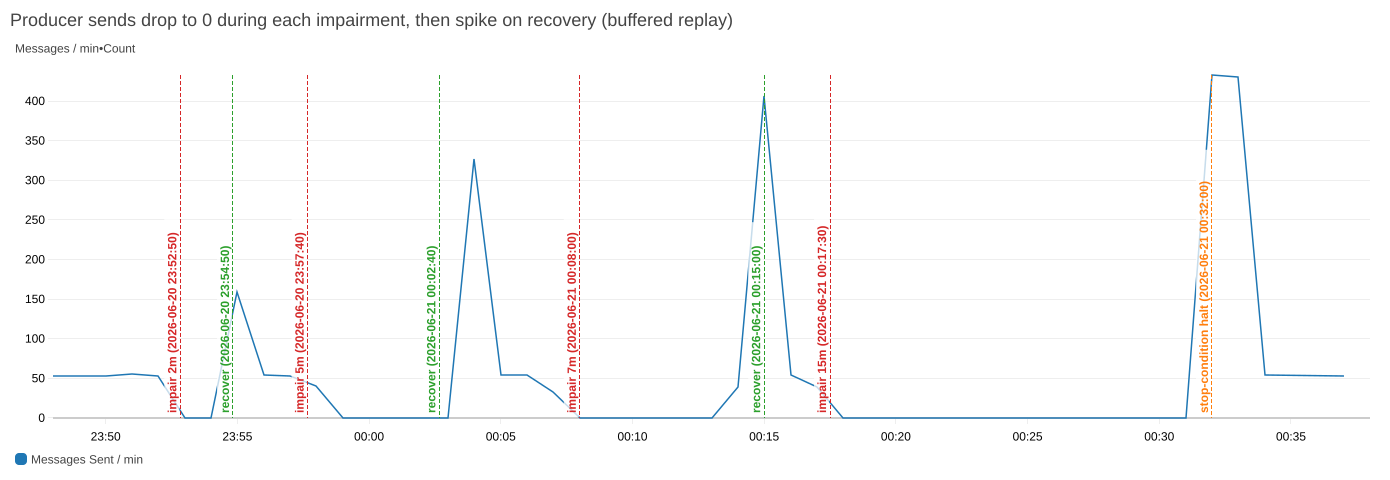
  • NumberOfMessagesSent: drops to zero when the deny policy takes effect and producers can no longer enqueue.
NumberOfMessagesSent dropping to zero during each impairment window and spiking on recovery, ending at the stop-condition halt

Figure: NumberOfMessagesSent drops to zero during every impairment window (red) and spikes on recovery (green) as buffered messages replay. The final phase ends at the stop-condition halt (orange).

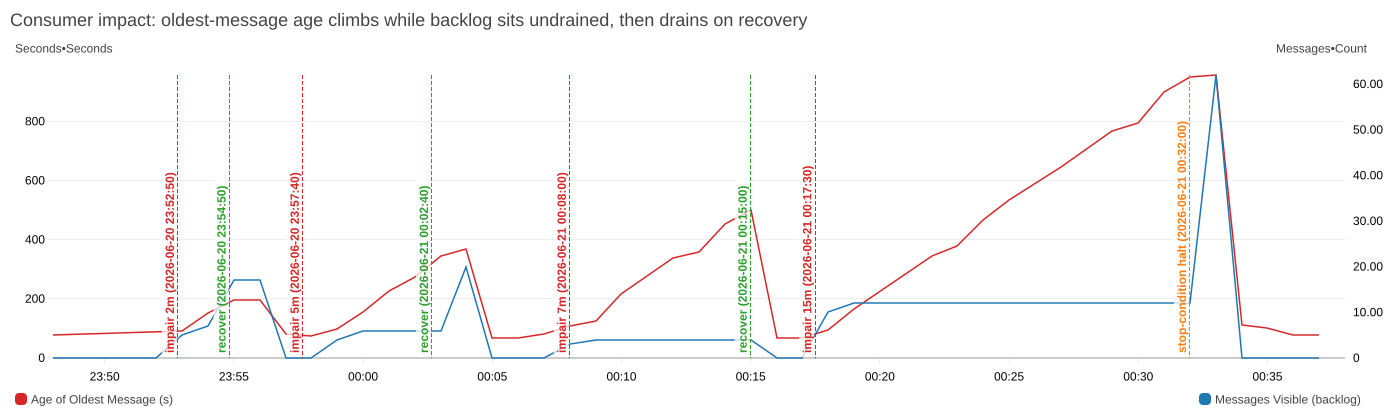
  • ApproximateNumberOfMessagesVisible: the current backlog of messages available for retrieval. During impairment this often stops changing, a signal that tells you something is wrong precisely because it goes flat (nothing is being sent or drained).
  • ApproximateAgeOfOldestMessage: increases as unprocessed messages age, but only if the queue already held a message when the deny took effect. On an empty queue it won’t climb, which is why you read it alongside the visible-message count.
ApproximateAgeOfOldestMessage climbing while the visible backlog stays undrained during the 15-minute phase, then both collapsing on recovery

Figure: Consumer-side impact: ApproximateAgeOfOldestMessage climbs while the visible backlog sits undrained during the 15-minute phase, then both collapse the moment access is restored.

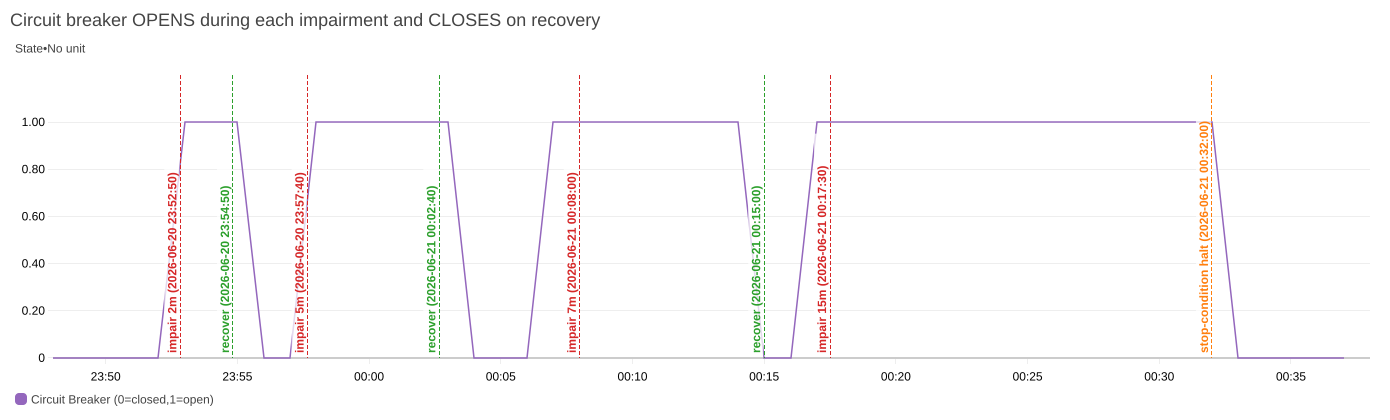
Application error rate: spikes initially, then stabilizes if circuit breakers engage.

Producer circuit breaker opening within seconds of each impairment and closing on recovery as a square wave

Figure: The producer’s circuit breaker opens (1) within seconds of each impairment and closes (0) on recovery, a clean square wave that lags each fault window slightly because it opens only after a few sustained failures.

Count-based metrics (NumberOfMessagesSent/Received/Deleted) reflect system-level activity and can include retries and duplicates, so treat them as trend indicators rather than exact unique-message counts.

What to observe during recovery

When the deny policy is removed, the producer and consumer recover on different timelines.

Producer side:

What to observe Healthy response Unhealthy response
Send resumes NumberOfMessagesSent climbs back to baseline. Circuit breaker half-opens, then closes within ~30 seconds Circuit breaker stays open (stale failure state). Manual restart needed
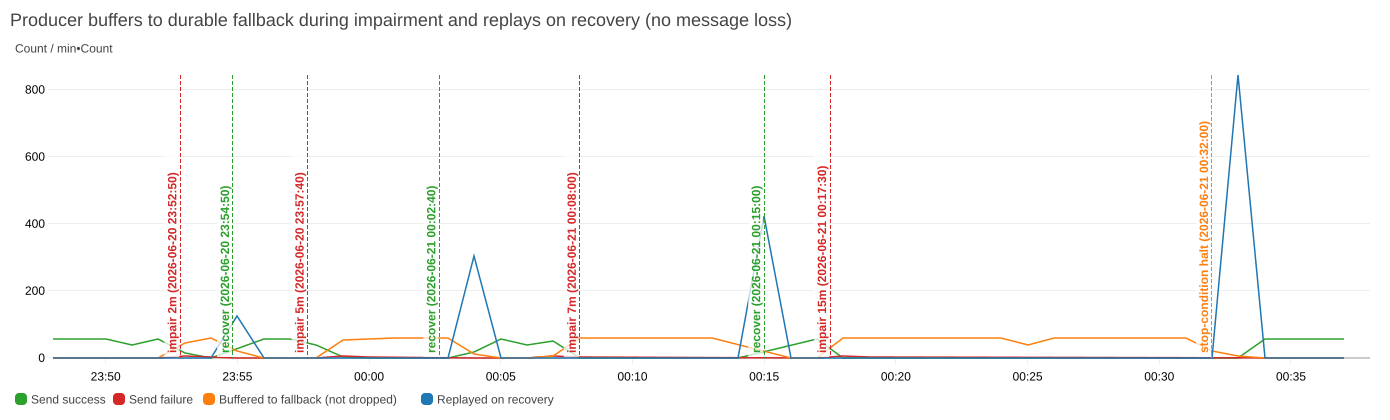
Buffered / fallback payloads Replayed from durable fallback storage and re-sent idempotently Lost permanently (if silently dropped during impairment)
Producer buffering to durable fallback storage during impairment and replaying the buffer on recovery

Figure: The producer buffers to durable fallback storage during impairment (no dropped messages) and replays the buffer on recovery: send success, buffered writes, and replays over the run.

Consumer side:

What to observe Healthy response Unhealthy response
Receive / delete resumes NumberOfMessagesReceived / NumberOfMessagesDeleted recover Consumers stay wedged. No auto-recovery
Backlog burndown ApproximateNumberOfMessagesVisible drains steadily; ApproximateAgeOfOldestMessage falls Drain stalls: the rate spikes, then drops to zero and stays there (consumer overwhelmed or stuck)
DLQ contents Genuinely-poison messages redriven and reprocessed in controlled batches within the DLQ retention period Reprocessed all at once (overwhelming downstream), or left to age out of the DLQ and be deleted

Recovery is when the DLQ can move. A consumer overwhelmed by the accumulated backlog can re-fail messages and push some to the DLQ. If healthy messages land there, your maxReceiveCount is too low or your consumer isn’t keeping up.

Analyzing results

After the experiment completes, compare what happened against your hypothesis. Focus on these questions:

  • Did your circuit breakers activate? Measure from the first AccessDenied to when your application stopped attempting SQS operations. Over your target (typically 30 seconds) means your detection threshold is too high.
  • Did your system preserve messages? Reconcile attempted sends against messages processed after recovery, plus the DLQ and producer-side fallback storage. If the numbers don’t add up you have message loss, and the gap tells you which side lost them.
  • Are the recovered messages still worth processing? Preservation and relevance are different questions. After a long outage, some buffered sends and backlogged messages represent requests the client has already given up on, and processing them spends recovery capacity acting on stale intent. Compare each message’s timestamp to the current time as you consume it, and drop or sideline anything no longer actionable, deliberately rather than by letting it age out. See REL05-BP04: Fail fast and limit queues.
  • How did recovery behave? Look at ApproximateNumberOfMessagesVisible after each recovery period. A healthy system drains steadily. If the drain stalls (the rate spikes, then drops to zero and stays there), your consumer is overwhelmed or stuck.
  • Did longer disruptions reveal new failure modes? Compare the 2-minute phase against the 15-minute one. What tends to surface only under sustained failure:
    • Thread pool exhaustion from accumulated retry threads.
    • Memory pressure from buffered messages.
    • Connection pool starvation.
    • DLQ messages aging out: messages that sit in the DLQ longer than its retention period are deleted (see Best practices).

Results that match your hypothesis are evidence your resilience mechanisms work. Results that don’t are your work list.

Best practices

The sections below cover the resilience patterns that turn the gaps this experiment surfaces into fixes: retry logic, circuit breakers, dead-letter queues, and monitoring.

Retry logic with exponential backoff

Don’t retry everything. Retry only errors that might succeed on a repeat, such as throttling, timeouts, and transient 5xxs, and fail fast on non-retryable ones like the AccessDenied (403) this experiment injects. For the errors worth retrying, use exponential backoff with jitter: each failure increases the wait exponentially (1s, 2s, 4s, 8s, and so on) with a random offset that prevents producers who failed together from retrying together and spiking a recovering dependency.

The AWS SDKs have configurable retry behavior built in, so configure it rather than rolling your own. See Timeouts, retries, and backoff with jitter.

Circuit breakers

A circuit breaker stops attempting operations after a threshold of consecutive failures, then lets a single test call through after a recovery timeout. That saves resources on calls that are likely to fail and gives the dependency room to recover. Choose the open-state behavior deliberately: shedding or buffering load is safer than silently switching to an alternate path, because fallback paths are exercised only during failures and tend to fail with them. See Using load shedding to avoid overload and Avoiding fallback in distributed systems.

Dead letter queues

Configure a DLQ for every queue. It’s a consumer-side safety net for poison messages, not a producer overflow buffer. Set maxReceiveCount to the number of processing attempts that make sense for your workload (typically 3 to 5). Because redelivery is what feeds a DLQ, every consumer must tolerate seeing a message twice. See Making retries safe with idempotent APIs. For what a large post-recovery backlog can do, see Avoiding insurmountable queue backlogs.

A DLQ has no depth limit. The constraint is the retention period, after which SQS deletes the message (default 4 days, maximum 14). Set the DLQ’s retention longer than the source queue’s to provide more investigation time before messages are deleted. For standard queues, note that the retention clock runs from the original enqueue time and does not reset on the move to the DLQ, so time in the source queue counts against it. (FIFO queues do reset it.) After the experiment, confirm messages were preserved rather than aged out.

Monitoring strategy

For what to emit and at what granularity, see Instrumenting distributed systems for operational visibility. Build a CloudWatch dashboard combining these across the producer, the consumer, and the queue:

Queue-level metrics: NumberOfMessagesSent, NumberOfMessagesReceived, NumberOfMessagesDeleted, ApproximateNumberOfMessagesVisible, ApproximateNumberOfMessagesNotVisible, and ApproximateAgeOfOldestMessage, read as described in what to observe during impairment.

Application-level metrics:

  • Error rates by type (distinguish AccessDenied from other failures), tagged by producer vs. consumer.
  • Circuit breaker state changes (open / closed / half-open transitions).
  • DLQ message count.
  • End-to-end message processing latency.

Alarm on ApproximateAgeOfOldestMessage exceeding your SLA threshold as a production alert, but not as an experiment stop condition, since the metric is supposed to rise during impairment. Use a customer-impact signal there instead (see Stop conditions).

Clean up your environment

  • Verify the deny policy is gone. Check each queue’s access policy on the console or run aws sqs get-queue-attributes --queue-url <URL> --attribute-names Policy. If FISTemporaryDeny is still there, retrieve the policy, delete the statement, and reapply with aws sqs set-queue-attributes.
  • Process messages that landed in your DLQs during the experiment.
  • Review CloudWatch metrics to confirm your queues have returned to normal operation.
  • Document your findings: What matched your hypothesis, what didn’t, and what you’re fixing.

Expand your resilience testing

Once the basics hold, extend the experiment:

Partial failure: Impair only a subset of your queues to test whether your application handles mixed healthy/unhealthy dependencies.

Note: Don’t run two impairment experiments against the same queue concurrently. The automation reads the policy, modifies it, and writes it back. Concurrent runs can overwrite each other and leave a stale deny behind. Target distinct queues, or run them in sequence.

Consumer-side only: Block only ReceiveMessage and DeleteMessage while allowing SendMessage, to simulate a consumer outage while producers keep filling the queue (the most common real-world scenario).

Combine with other failures: Run the SQS experiment alongside EC2 instance termination or network latency injection to test compound failure scenarios.

Explore AWS Resilience Hub: Use AWS Resilience Hub to assess your application’s resilience posture and get recommendations for improvement.

Using FIS scenarios

A scenario is an AWS-authored template bundling the actions, targets, and duration for a recognizable event, so you start from a reviewed definition instead of assembling actions yourself. While AWS provides multiple scenarios in the library, here are two that are a good place to start.

AZ Availability: Power Interruption induces the symptoms of losing power in one Availability Zone: zonal EC2, ECS, and EKS compute stops, new launches in that AZ fail, and subnet connectivity is lost. It’s the sharper test of the queue-based decoupling this post exercises, because producers and consumers lose capacity while the queue itself is not targeted. You learn whether surviving consumers absorb the backlog, whether Auto Scaling replaces capacity in the remaining AZs rather than retrying in the impaired one, and whether the backlog drains inside your hypothesis window. It defaults to 30 minutes of impairment plus 30 of recovery, twice this post’s longest phase.

AZ: Application Slowdown introduces additional latency between resources within a single Availability Zone (AZ). This latency creates many of the symptoms of an application slowdown, a partial disruption, sometimes known as a gray failure. It adds latency to network flows between target resources. Network flows represent the traffic between computing resources: the data packets carrying requests, responses, and other communications between your servers, containers, and services. The scenario can help to validate observability setups, tune alarm thresholds, discover application sensitivity to slowdowns, and practice critical operational decisions like AZ evacuation.

Scenarios carry the same obligations: write the hypothesis first and set the stop condition on a customer-impact metric rather than one the scenario is designed to move. Your derived threshold works unchanged. Copy a scenario into your own template to narrow the targets or change the duration. See Working with the AWS FIS scenario library.

Conclusion

In this post, you learned how to discover what your application does when SQS operations fail, and whether you’d notice. Every gap between your hypothesis and the results is an opportunity to improve your system’s resilience and its observability.

Start with the 2-minute phase in a non-production environment. Fix what breaks. Then run the full sequence and keep running it as the application evolves. Each phase of growth brings failure modes you might only find under load.

For more information, see:


About the authors

Validating multi-Region DR for Terraform Enterprise with AWS FIS

Post Syndicated from Frenil Randeria original https://aws.amazon.com/blogs/architecture/validating-multi-region-dr-for-terraform-enterprise-with-aws-fis/

In October 2025, Athenahealth, a major North American Electronic Health Record (EHR) provider, discovered a gap. An AWS regional service event in us-east-1 made their single-Region HashiCorp Terraform Enterprise (TFE) deployment inaccessible to their developers. This post shares the architecture, the AWS Fault Injection Service (AWS FIS) validation approach, HashiCorp best practices, and lessons learned from the collaboration between AWS and HashiCorp. Together, these help increase resiliency and verify that the customer’s critical workloads remain active during regional service events.

Currently, Terraform Enterprise (TFE) deployments are only supported within a single AWS Region. This means that, for TFE customers without a well-tested DR plan, a regional service event can block your engineering teams from deploying, modifying, or recovering infrastructure. A multi-Region disaster recovery (DR) strategy addresses this risk. The architecture in this post is a customer-operated DR pattern: HashiCorp supports TFE within a single Region and the HVD module targets single-Region deployments, so the multi-Region failover described here is designed, operated, and tested by the customer rather than provided as a supported product configuration. That strategy only works if you validate your regional failover workflow before you need it. Reacting during an event that impairs your primary Region costs developer productivity and business continuity. AWS FIS exposes hidden dependencies and configuration issues by injecting real failures into your AWS environment.

The following sections walk you through how to design three-phase AWS FIS experiments for TFE, expose hidden dependencies in failover automation, and validate both failover and failback for a multi-Region TFE deployment. You can help prevent extended downtime that impacts your infrastructure deployment capabilities and achieve 12-14 minute recovery times.

Prerequisites

To follow the validation approach in this post, you should have the following:

Starting architecture

If you’re running TFE in a single Region within AWS, this section describes the starting point. Athenahealth’s deployment used HashiCorp’s Terraform Enterprise Validated Design (HVD) module with the following components:

  • Amazon Elastic Compute Cloud (Amazon EC2) instances running TFE application servers.

  • Amazon Aurora PostgreSQL-Compatible Edition for application state.

  • Amazon Simple Storage Service (Amazon S3) for Terraform workspace state files.

Athenahealth hosted these components in the us-east-1 Region. The deployment provided Availability Zone-level resilience but lacked regional failover capabilities. The October 2025 event highlighted what was missing: no cross-Region database replication, no secondary Region compute capacity, no Terraform state file backup outside us-east-1, and DNS pointing exclusively to the primary Region.

Following the October 2025 event, Athenahealth engaged both their AWS and HashiCorp account teams for guidance on protecting not only TFE, but other critical workloads as well. The three organizations worked as a single team to design and implement a multi-Region DR strategy for the TFE environment. By combining the AWS Well-Architected Framework guidance regarding operational excellence and reliability, along with HashiCorp’s best practices regarding DR strategies using Terraform, the team came up with the multi-Region architecture (Figure 1) that would replace the customer’s current single-Region deployment.

Multi-Region DR solution

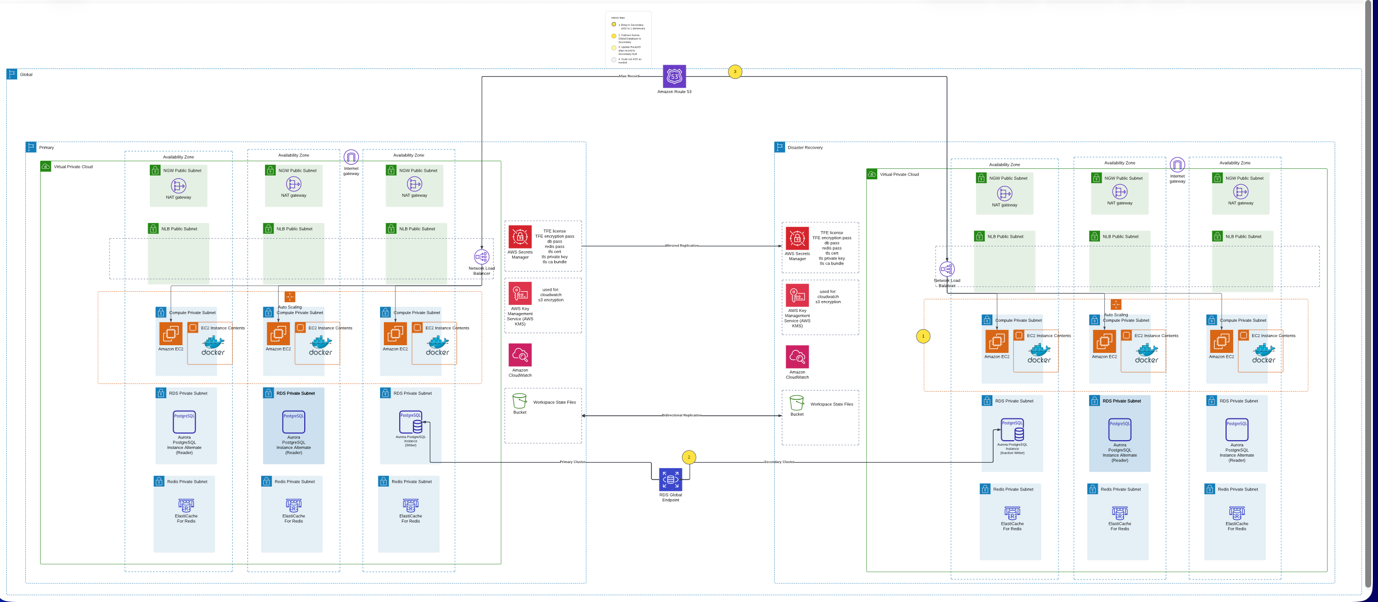
With an active-passive multi-Region design across us-east-1 (primary) and us-west-2 (DR), Athenahealth achieved a 12-14 minute Recovery Time Objective (RTO) and less than 1 minute Recovery Point Objective (RPO). In the AWS disaster recovery taxonomy, this is a pilot light strategy: data replicates continuously to the DR Region while compute stays at zero. A warm standby variant (DR minimum capacity of 1) trades higher cost for faster RTO. This section covers the architecture components that make this possible and the four-step failover process you can follow during a regional service event.

Multi-Region active-passive DR architecture for Terraform Enterprise with bidirectional S3 replication and a Route 53 health check.

Figure 1: Multi-Region active-passive DR architecture for Terraform Enterprise on AWS. Note the bidirectional S3 replication arrows between Regions and the Amazon Route 53 health check that determines the active Region.

The example Terraform code used to configure and manage the core architecture components, along with the failover process can be found in this sample GitHub repository. You can use this code to test a similar pattern for your TFE workload.

Core architecture components

You can route traffic to the active Region with Amazon Route 53 DNS alias records pointing to an Elastic Load Balancing (ELB) Network Load Balancer. Alias records for ELB targets use a 60-second time-to-live (TTL), which limits how long DNS resolvers cache the record. Clients begin resolving to the DR Region within about a minute of failover rather than waiting for longer cached entries to expire.

In each Region, an Amazon Virtual Private Cloud (Amazon VPC) spans three Availability Zones, and Amazon EC2 Auto Scaling groups manage the TFE instances. To help minimize cost, Athenahealth scaled DR Region compute to zero during normal operations by setting the Auto Scaling group minimum capacity to 0.

For cross-Region database replication, Athenahealth uses Aurora PostgreSQL-Compatible global databases, which provide sub-second replication lag and managed failover. The primary cluster runs one writer and two readers across three Availability Zones. The secondary cluster maintains an inactive writer that’s ready for promotion.

You can replicate Terraform workspace state files bidirectionally between primary and DR Amazon S3 buckets with S3 cross-Region replication. This design supports failback without data resynchronization.

AWS Secrets Manager and AWS Key Management Service (AWS KMS) provide cross-Region credential and encryption key management. Two TFE-specific dependencies deserve attention when you design for multi-Region. First, the TFE encryption password protects the internal Vault unseal key and root token. DR instances configured with a different value cannot start or decrypt existing data, so verify that this secret is replicated to your DR Region and referenced by your DR launch configuration. Second, if you run TFE in Active/Active mode, external Redis holds the job queue and cache. Account for a Redis equivalent in the DR Region and decide what in-flight job loss is acceptable at failover. Amazon CloudWatch alarms in each Region monitor the TFE instances, Auto Scaling groups, and Aurora clusters in that Region. Detection of a primary Region impairment does not depend on the primary Region itself: the Amazon Route 53 health check shown in Figure 1 probes the TFE endpoint from a globally distributed checker fleet, and alerts publish through Amazon Simple Notification Service (Amazon SNS) topics in both Regions.

Failover process

The architecture uses a four-step failover sequence:

1. Activate DR Auto Scaling group (2-5 minutes). Scale from 0 to 1 instance and validate health checks. TFE exposes a health check endpoint (/_health_check) that returns a 200 OK response when the application is running. The Network Load Balancer target group and the Route 53 health check probe this endpoint to determine instance health.

2. Promote Aurora PostgreSQL-Compatible global database (~1 minute). Promote the DR writer. Complete this step before DNS failover shifts traffic to the DR Region, to help prevent both Regions from accepting writes simultaneously (known as a split-brain scenario in distributed databases).

3. Confirm Amazon Route 53 DNS failover (~60 seconds). The pre-configured Route 53 failover routing policy detects the unhealthy primary endpoint and routes traffic to the DR Region’s Network Load Balancer. This happens in the Route 53 data plane, with no record modifications at failover time.

[Important: Your failover process should not depend on control plane API calls during an event. Modifying Route 53 records to perform failover is a documented anti-pattern because the Route 53 control plane operates from a single Region. Athenahealth avoided this dependency with pre-configured health check-based failover routing. For manually initiated Region switches through a highly available data plane, consider Amazon Application Recovery Controller (ARC) Region switch, which Athenahealth plans to evaluate in a future phase.]

4. Scale out for production load (5-10 minutes). Increase Auto Scaling group capacity while monitoring Amazon CloudWatch.

Note: Run failover scripts from outside the primary Region—for example, from the DR Region, a separate management Region, or a CI/CD system that is not dependent on the primary Region. If your failover automation runs in the primary Region, it might be unreachable during the event you are trying to recover from.

The ordering between Aurora promotion and traffic shift is enforced procedurally rather than by an automated control. The DR Auto Scaling group runs at zero capacity during normal operations, so the DR endpoint cannot pass health checks until an operator executes the runbook, and the runbook sequences promotion ahead of scaling for traffic. For an orchestrated Region switch with explicit sequencing controls, consider Amazon Application Recovery Controller Region switch, which Athenahealth plans to evaluate in a future phase.

Total failover execution time: 12-14 minutes, meeting the established RTO.

Validating with AWS Fault Injection Service

With the multi-Region architecture now in place, we still needed to confirm it would work under real failure conditions. This is where AWS FIS was introduced into the DR workflow. AWS FIS injects controlled failures into your AWS environment that can be used to measure actual recovery times and catch configuration issues before an actual disruption. The following three phases show how Athenahealth validated their architecture, and you can apply the same approach to your TFE deployment as well.

Progressive experiment approach

Rather than testing full regional failover immediately, the team validated resilience in three progressive phases starting with individual compute failures, then database failover, and finally simulated S3 connectivity loss. Each phase built confidence in a specific layer of the architecture before combining them, and each surfaced issues that manual review had missed.

Phase A: Amazon EC2 and Auto Scaling group failure injection

Athenahealth hypothesized that if TFE instances were stopped or Amazon EC2 capacity became unavailable, the Auto Scaling group would launch replacement instances within five minutes without manual intervention. To test this, they ran the following AWS FIS actions: aws:ec2:stop-instances, aws:ec2:asg-insufficient-instance-capacity-error, and Auto Scaling group suspend and resume operations. You can use these same actions to validate your own Auto Scaling group recovery behavior.

The results confirmed the hypothesis. The Auto Scaling group detected failed instances and launched replacements within 2-3 minutes. Network Load Balancer health checks removed failed instances from rotation within 30 seconds.

These experiments also revealed an outdated Amazon Machine Image (AMI) reference in the DR Region’s Auto Scaling group launch template. Athenahealth builds custom AMIs and copies them to the DR Region, but the DR launch template still referenced an older version. This configuration drift only surfaced when AWS FIS forced the Auto Scaling group to launch new instances. If you’re running similar experiments, check the launch template AMI references in both Regions as part of your validation.

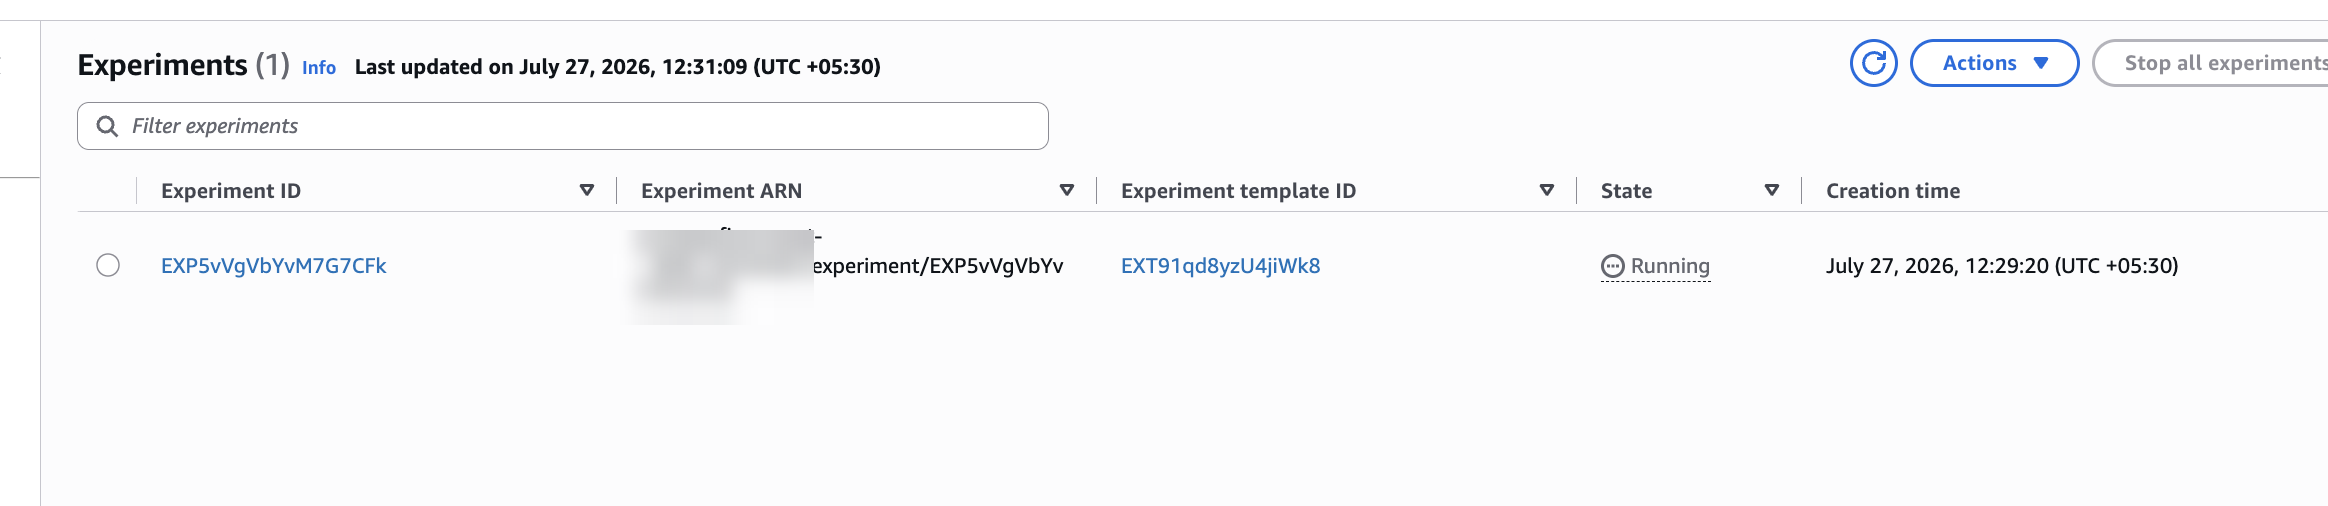
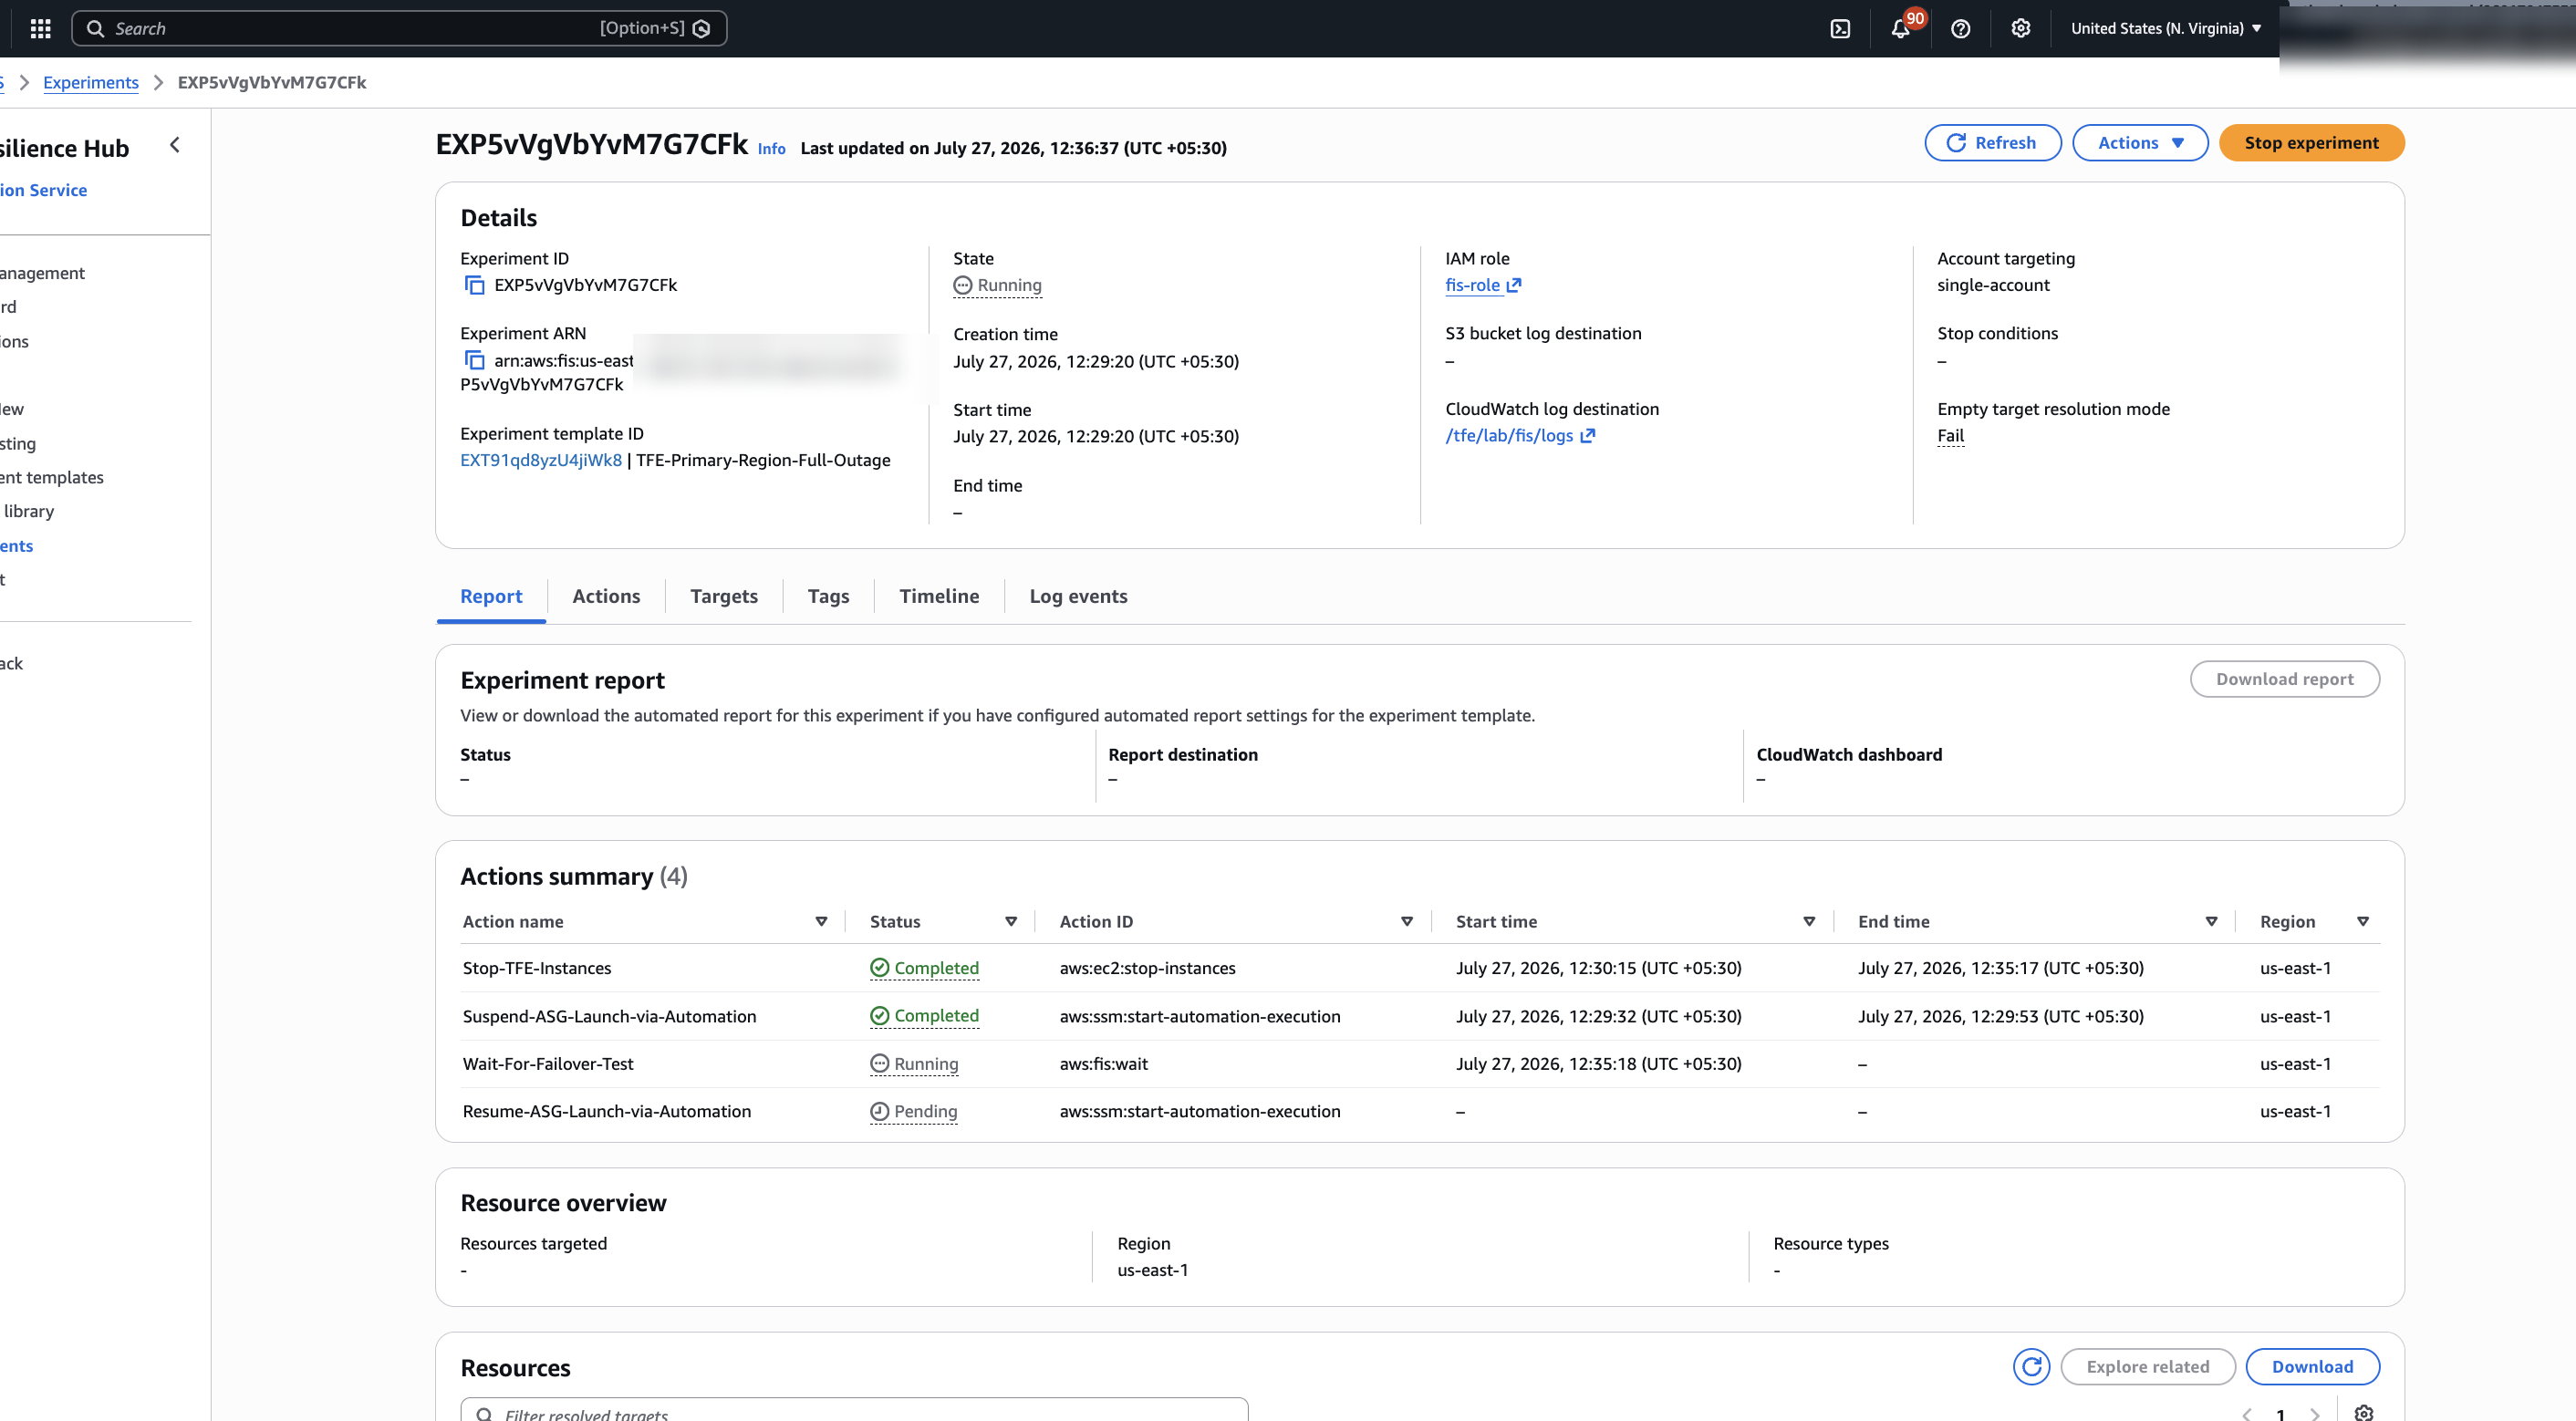
AWS FIS console experiments list showing one experiment in the Running state.

Figure 2. FIS experiments list showing experiment EXP5vVgVbYvM7G7CFk in Running state, created July 27, 2026 at 12:29:20 IST.

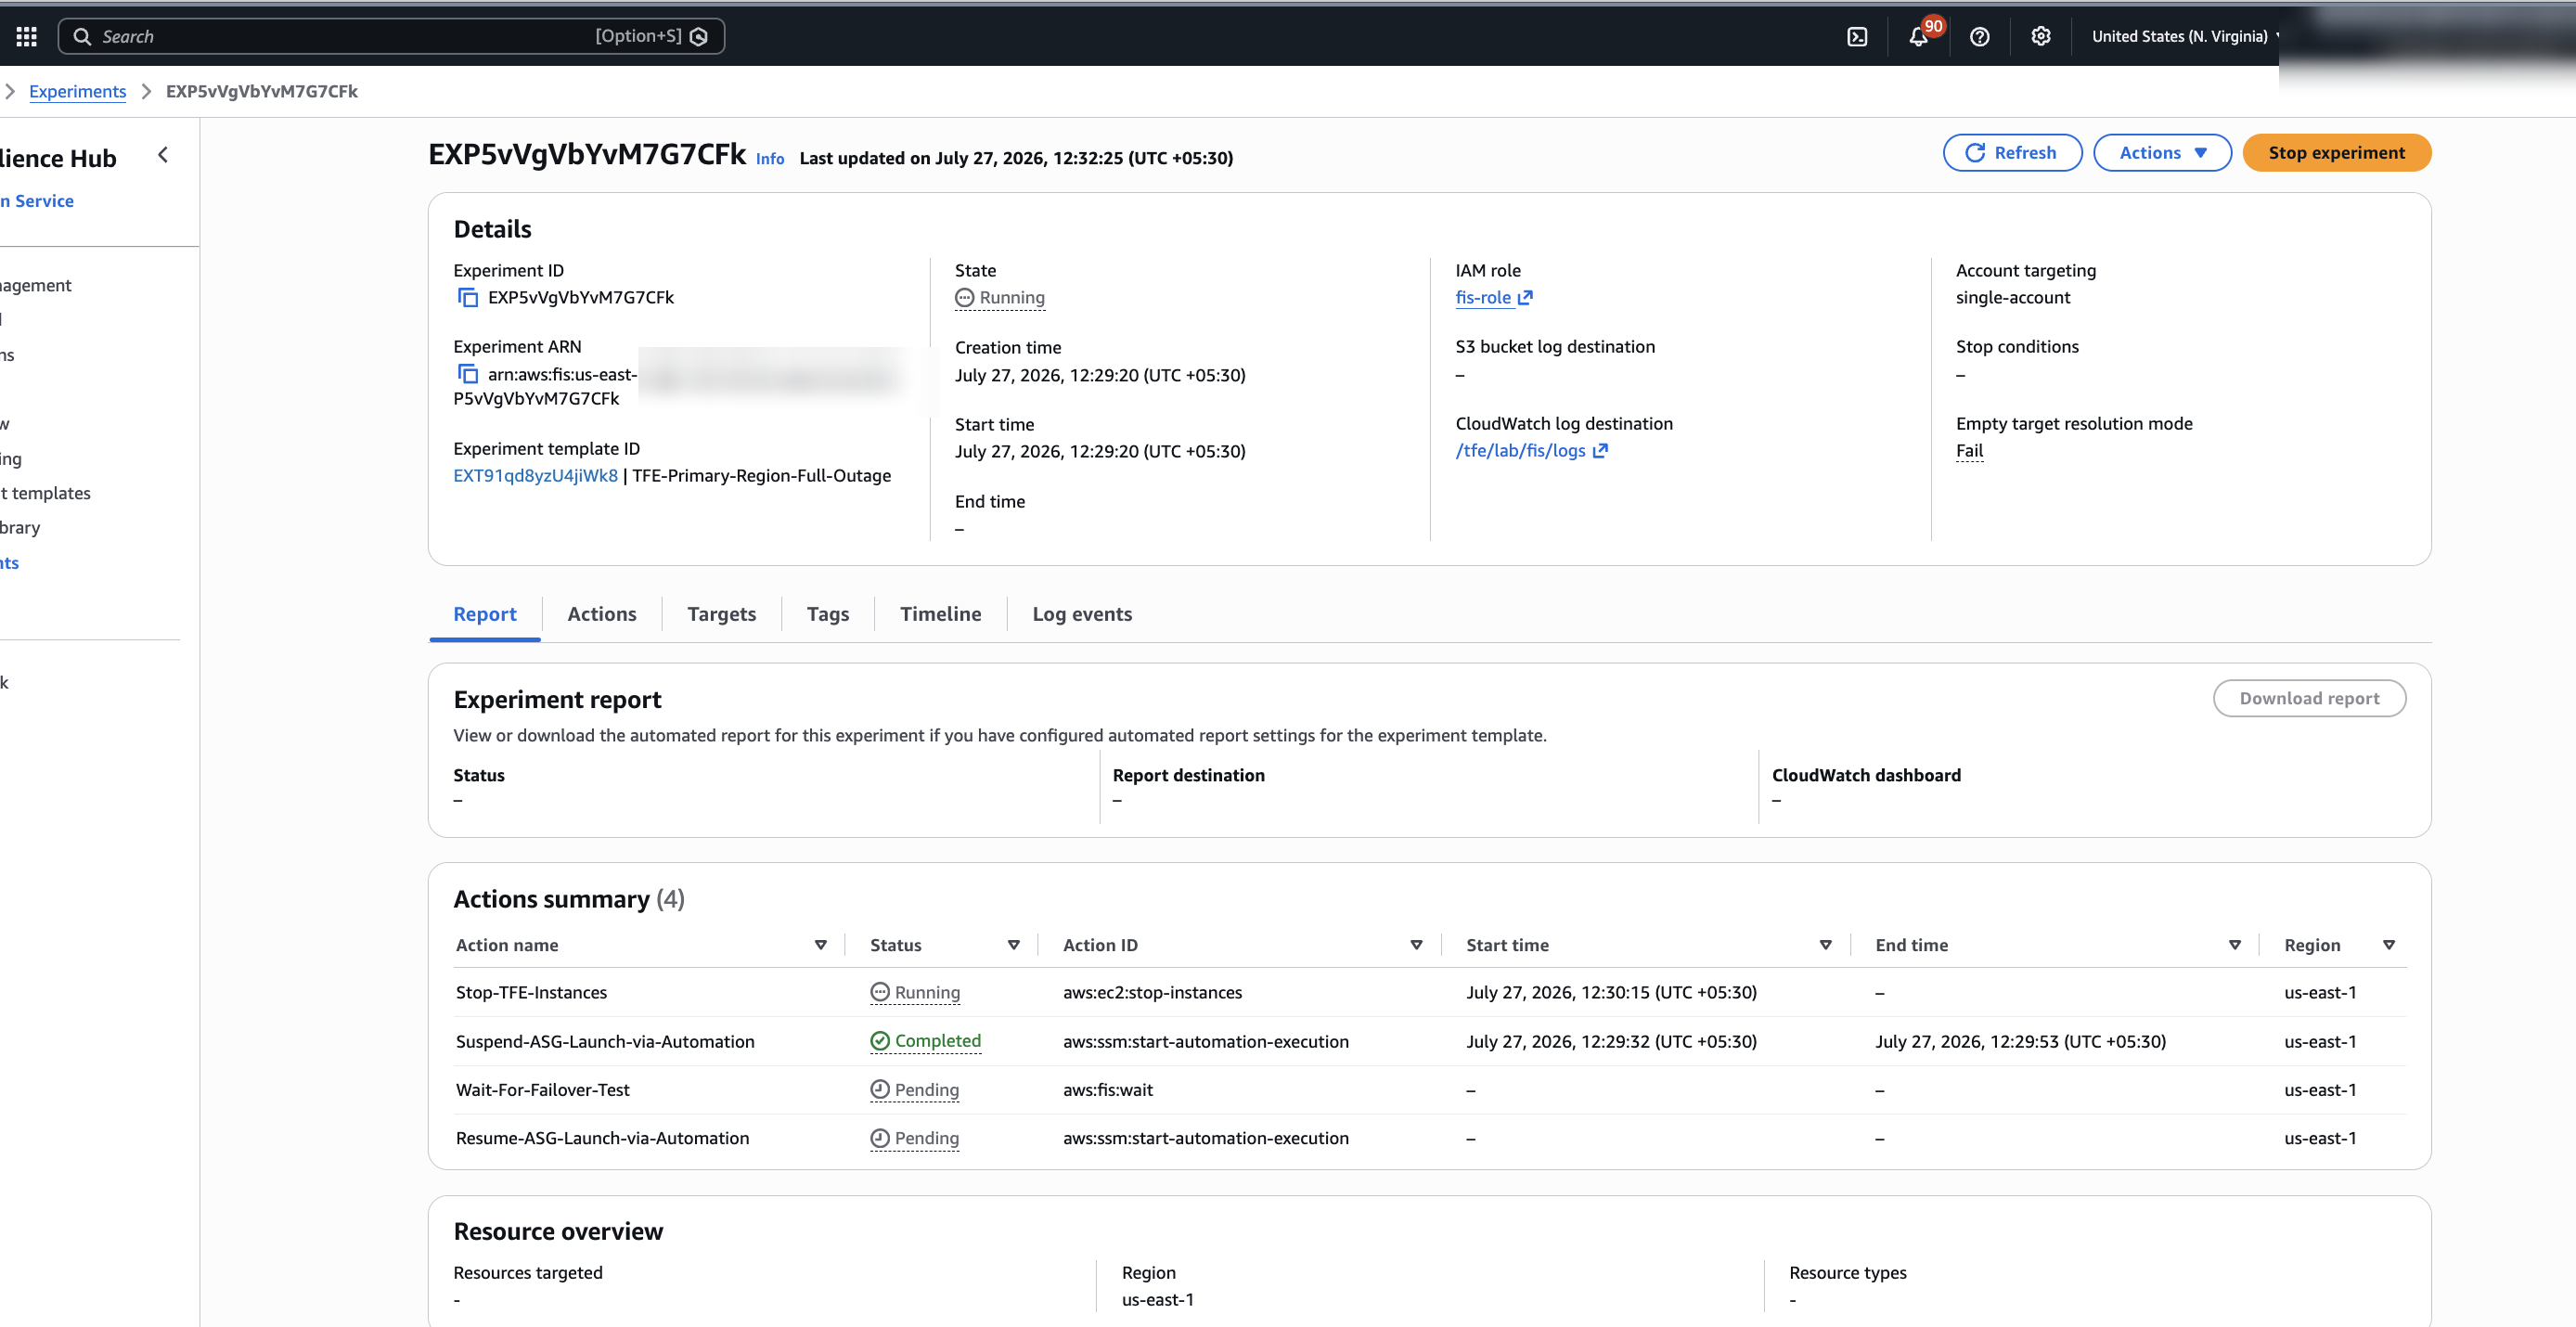
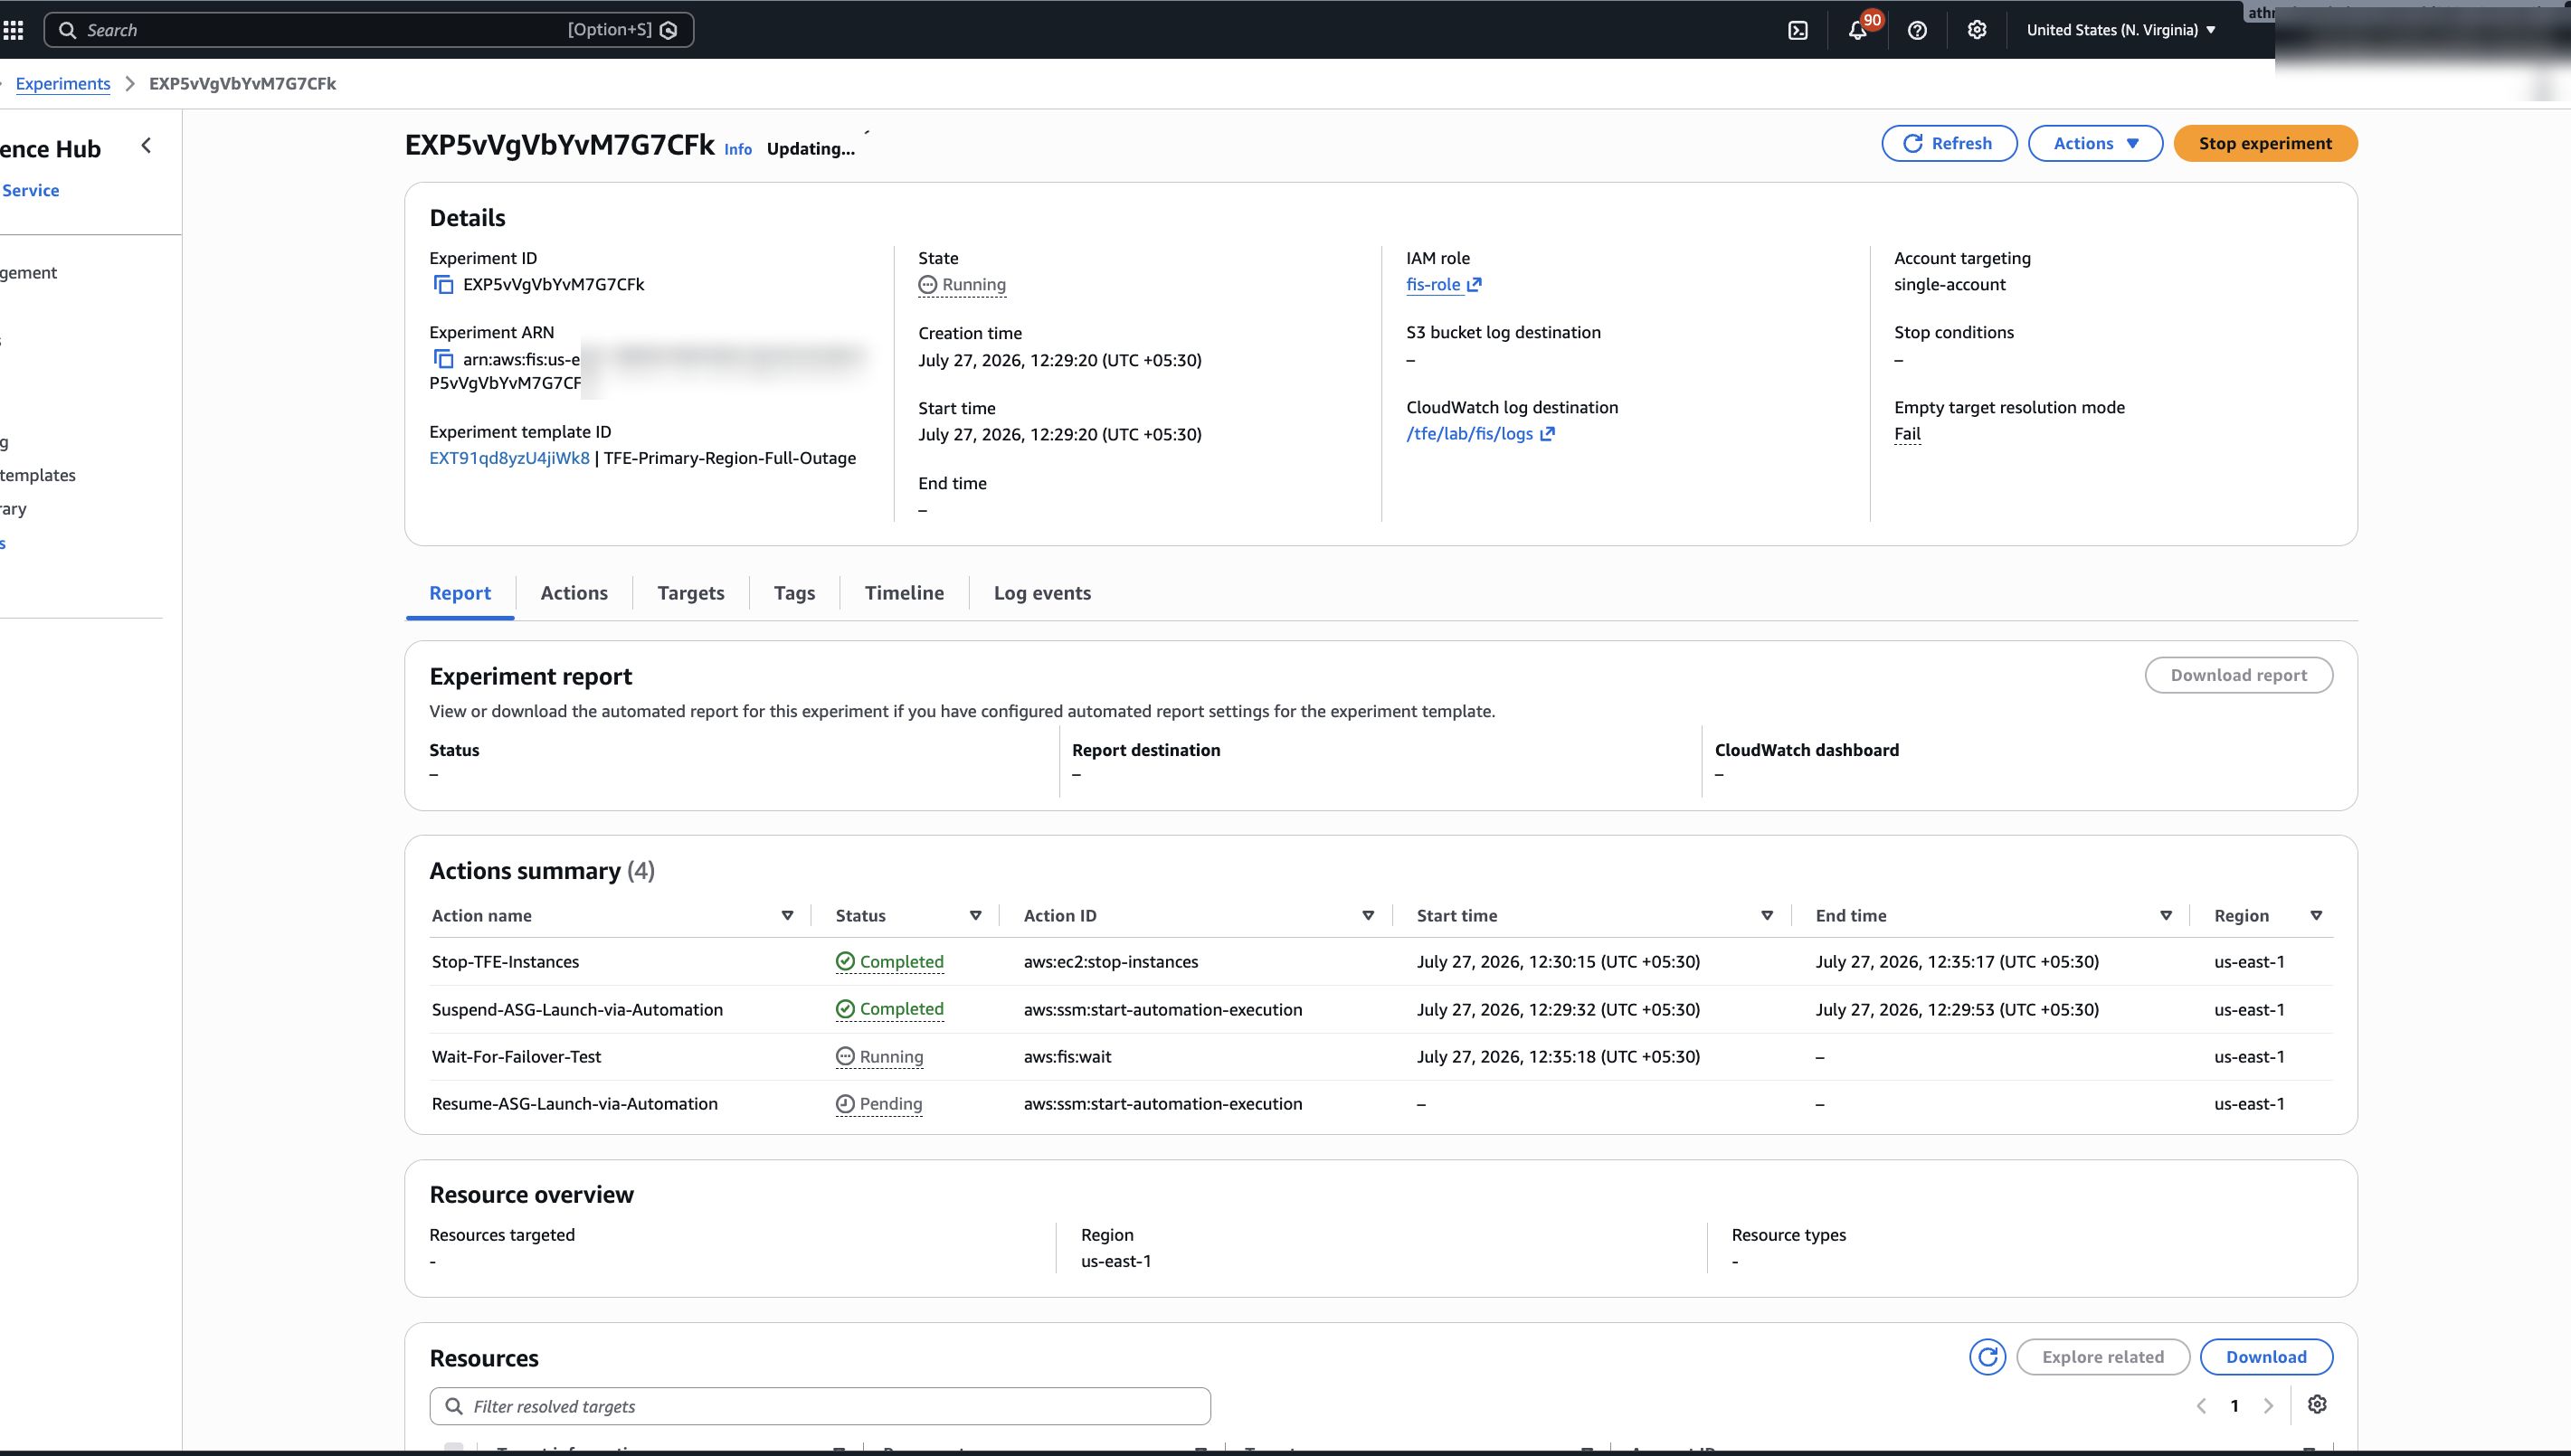
AWS FIS experiment details page showing the Suspend-ASG action completed and Stop-TFE-Instances running.

Figure 3. FIS experiment details showing template TFE-Primary-Region-Full-Outage, CloudWatch log destination /tfe/lab/fis/logs, Suspend-ASG completed, and Stop-TFE-Instances running.

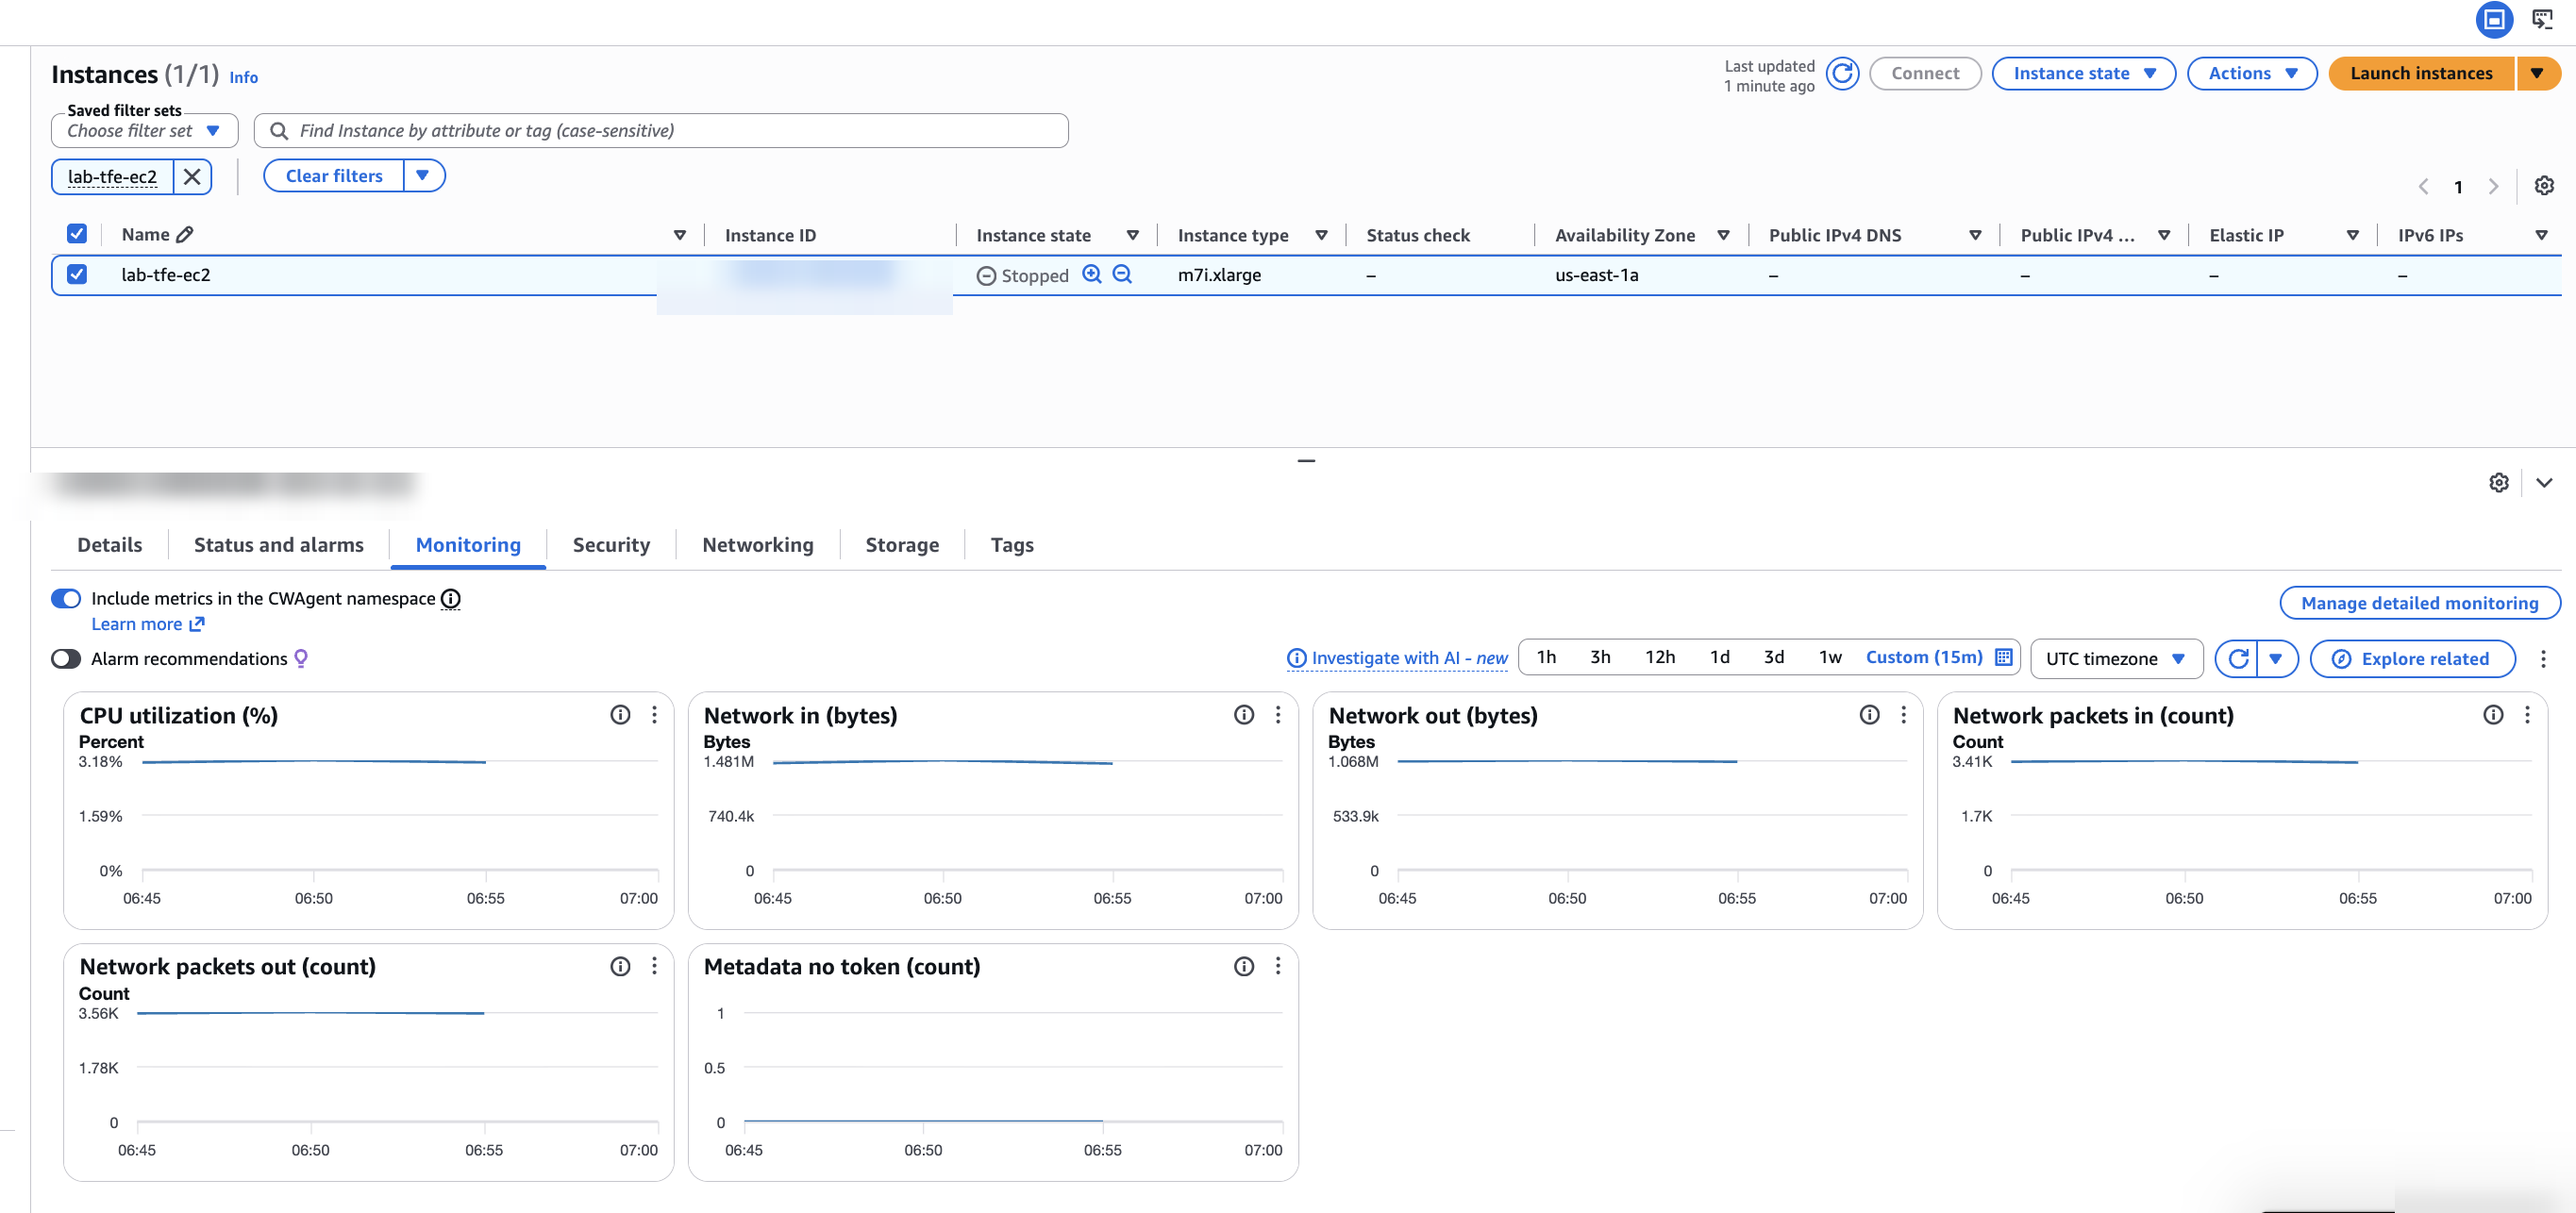
Amazon EC2 console showing the primary instance in us-east-1 in the stopped state.

Figure 4. Primary EC2 instance in us-east-1 stopped after the FIS stop-instances action.

AWS FIS action summary showing Stop-TFE-Instances completed and Wait-For-Failover-Test running.

Figure 5. FIS action summary showing Stop-TFE-Instances completed at 12:35:17 IST and Wait-For-Failover-Test running.

AWS FIS experiment running during the wait window, with the stop action completed and the resume action pending.

Figure 6. FIS experiment still running during the wait window, with stop action completed and resume action pending.

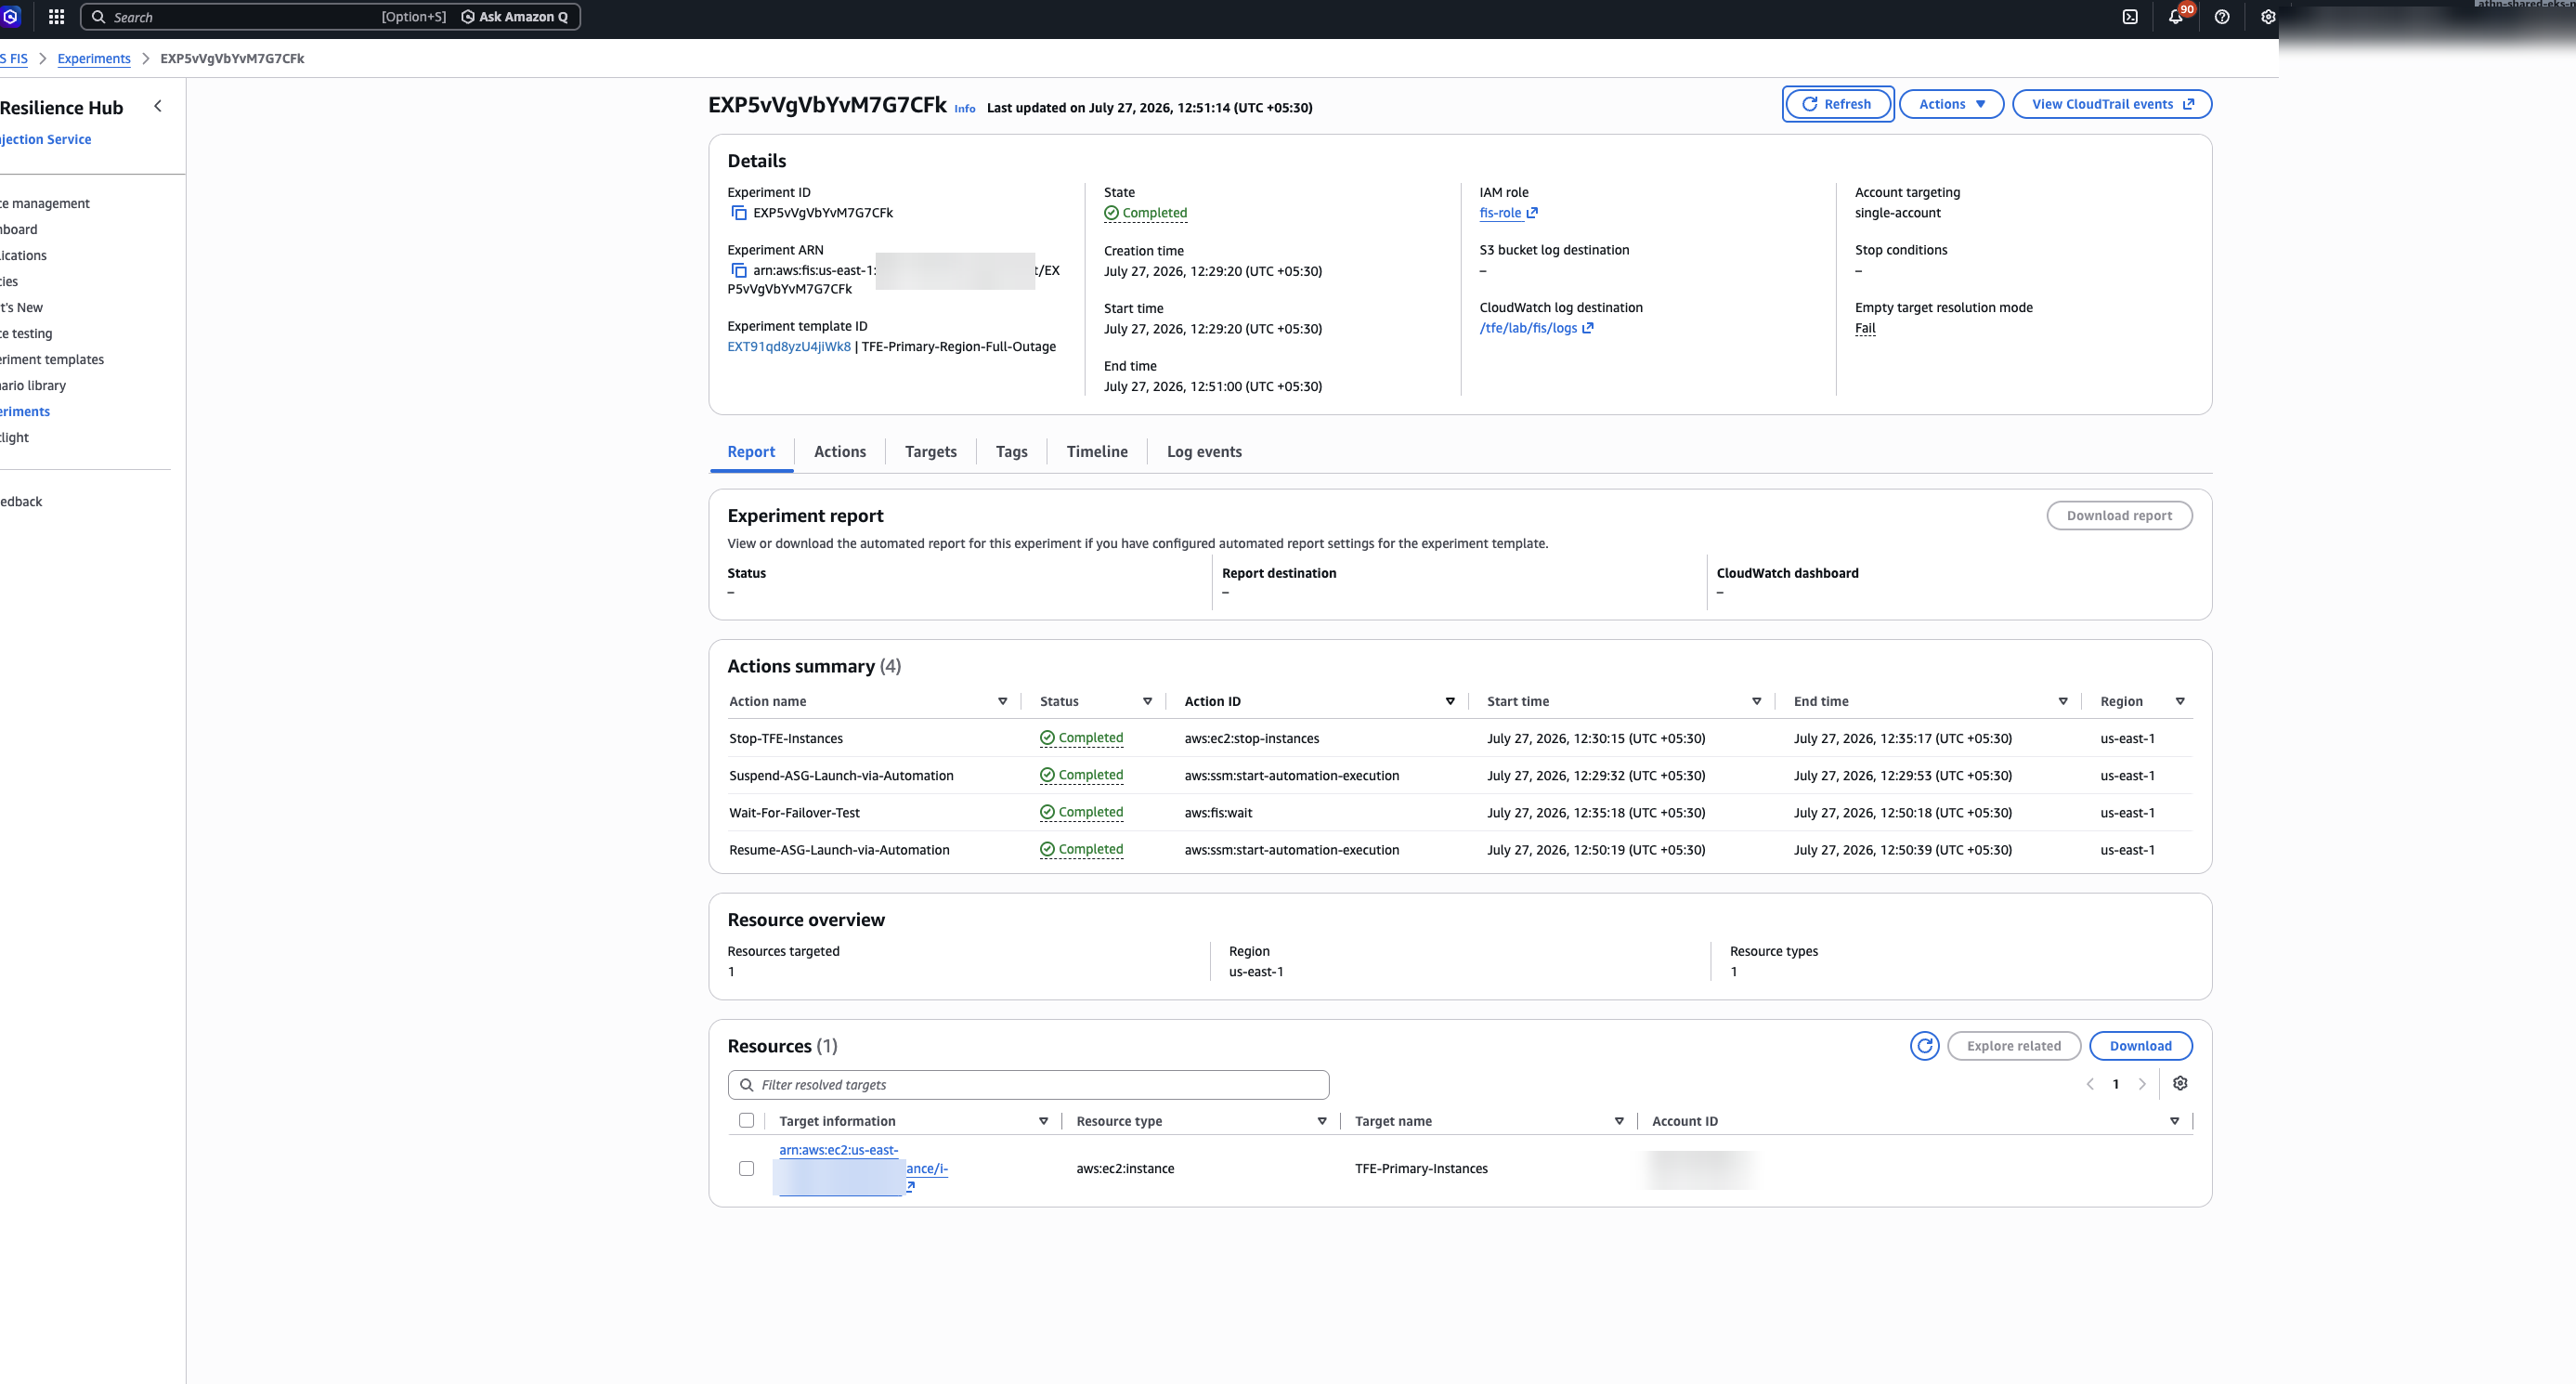
AWS FIS experiment completed with all four actions showing completed, including Resume-ASG-Launch-via-Automation.

Figure 7. FIS experiment completed at 12:51:00 IST. All four actions show completed, including Resume-ASG-Launch-via-Automation.

Phase B: Aurora PostgreSQL-Compatible database cluster failover

Athenahealth hypothesized that if the Aurora PostgreSQL-Compatible global database cluster failed over, TFE would resume writes within one minute without manual intervention. To test this, they ran the aws:rds:failover-db-cluster AWS FIS action. The results confirmed the hypothesis for the database layer. Aurora promoted the secondary cluster’s writer in 58 seconds. During the promotion, TFE experienced approximately 15 seconds of write unavailability.

The Amazon Relational Database Service (Amazon RDS) Global Endpoint automatically redirected connections to the new writer. Athenahealth also discovered that the application layer did not meet the hypothesis. TFE connection pooling settings caused extended reconnection delays.

They reduced the connection pool timeout from 60 seconds to 10 seconds, which improved recovery time significantly. If you’re running TFE with Aurora PostgreSQL-Compatible, review your connection pool settings as part of your AWS FIS validation.

Note that this experiment exercised the coordinated failover path of Aurora, which requires the primary Region to be reachable to synchronize before promotion. During an actual event impairing the primary Region, you would instead use Aurora Global Database managed failover (the failover-global-cluster command with the --allow-data-loss option) or a manual detach-and-promote. These paths do not wait for replication to synchronize, so promotion timing differs and the RPO is bounded by the replication lag at the time of the event rather than zero. Treat the 58-second promotion and sub-second lag measured here as coordinated-path results, and plan unplanned-path expectations using the Aurora Global Database disaster recovery documentation.

Phase C: Amazon S3 connectivity disruption

Athenahealth hypothesized that if TFE lost connectivity to Amazon S3 in the primary Region, the DR Region bucket would hold current replicated state files without data loss. Testing this required a workaround, because AWS FIS doesn’t provide a direct action to disrupt Amazon S3 access. You can use the aws:network:disrupt-connectivity action instead to inject network ACL rules that block S3 traffic at the subnet level.

The aws:network:disrupt-connectivity action targets subnets, not S3 buckets directly. AWS FIS injects network ACL rules on compute private subnets, which blocks egress traffic to S3 service endpoints and simulates Regional S3 disruption for TFE instances in those subnets.

This experiment validates the S3 consumer, meaning TFE losing access to S3. It does not disrupt S3 cross-Region replication, because service-side replication between buckets does not traverse your subnet network ACLs. To test delayed or paused replication between Regions, use the Cross-Region: Connectivity scenario described in Next steps. Note that this approach assumes your TFE instances reach S3 over an in-VPC path, such as a gateway VPC endpoint, so the injected network ACL rules sit on the egress path to S3.

To configure this AWS FIS experiment, use the following template. Replace <your-tfe-compute-private-subnet-prefix> with your actual subnet name prefix, which you can find in the Amazon VPC console under Subnets.

{
    "actions": {
        "DisruptS3Connectivity": {
            "actionId": "aws:network:disrupt-connectivity",
            "parameters": {
                "duration": "PT10M",
                "scope": "all"
            },
            "targets": {
                "Subnets": "TFE-Compute-Private-Subnets"
            }
        }
    },
    "targets": {
        "TFE-Compute-Private-Subnets": {
            "resourceType": "aws:ec2:subnet",
            "resourceTags": {
                "Name": "<your-tfe-compute-private-subnet-prefix>-*"
            },
            "selectionMode": "ALL"
        }
    }
}

The results confirmed the hypothesis for data durability. TFE detected S3 connectivity loss within 5 seconds. The DR Region S3 bucket contained replicated state files with less than 30 seconds of replication lag, and bidirectional replication prevented state file loss. The experiment also exposed a failure mode Athenahealth had not anticipated: the state file dependency issue detailed in the following section.

Combined experiment: primary Region impairment

After validating each layer individually, the team combined the faults into a single AWS FIS experiment template (shown in Figures 2-7). The experiment suspends the primary Region Auto Scaling group, stops the TFE instances, holds the faults in place during a wait window while the team executed the four-step failover runbook, and then resumes the Auto Scaling group. This end-to-end run validated the complete failover process under simultaneous compute impairment. The combined run surfaced no new failure modes beyond those found in the individual phases, which was itself the confirmation the team wanted.

Measuring recovery times

Across the three AWS FIS experiment phases, Amazon CloudWatch measured the following recovery times:

  • Amazon EC2 failure recovery: 2-3 minutes (automated Auto Scaling group replacement)

  • Aurora PostgreSQL-Compatible failover: 1-2 minutes (managed promotion)

  • Failover execution time: 12-14 minutes (operator-triggered four-step process)

  • Aurora replication lag: less than 1 second (99th percentile)

  • S3 replication lag: less than 30 seconds (99th percentile)

  • Data loss during failover: 0 bytes (across each experiment)

[Note: These measurements reflect controlled testing conditions. Aurora Global Database and S3 cross-Region replication are both asynchronous. During an actual event, writes committed within the replication lag window (sub-second for Aurora, up to 30 seconds for S3) may not yet be available in the DR Region. Plan for near-zero rather than zero data loss when setting RPO expectations.]

  • Failback RTO: approximately 20 minutes (including approximately 5 minutes for Aurora PostgreSQL-Compatible global database re-establishment)

The 12-14 minutes measure failover execution time, from the operator triggering the runbook to full recovery. End-to-end recovery from event onset also includes detection time and the decision to fail over, so plan for a larger overall RTO.

Lesson learned: the state file dependency pitfall

Athenahealth first identified this risk during production failover and failback testing: their automation scripts depended on Terraform S3 state file outputs from both Regions. Subsequent AWS FIS experiments (Phase C) confirmed the severity. When S3 access is lost, those scripts fail entirely.

How the dependency breaks failover

Athenahealth’s failover and failback scripts automate the four-step process described earlier: scaling the Auto Scaling group in the target Region, promoting the Aurora global database writer, and verifying application health. An operator triggers them as part of the manual failover runbook, and they run from outside the primary Region. In their original form, the scripts retrieved infrastructure identifiers such as the Amazon RDS global cluster ID and Auto Scaling group name from state files stored in Amazon S3:

# Failover script excerpt (problematic approach)
# Retrieve RDS Global Cluster ID from primary Region state file
RDS_GLOBAL_CLUSTER_ID=$(terraform output \
    -state=s3://<primary-region-bucket>/terraform.tfstate \
    rds_global_cluster_id)

# Retrieve DR Auto Scaling group name from primary Region state file
DR_ASG_NAME=$(terraform output \
    -state=s3://<primary-region-bucket>/terraform.tfstate \
    dr_asg_name)

# Run Aurora failover
aws rds failover-global-cluster \
    --global-cluster-identifier $RDS_GLOBAL_CLUSTER_ID \
    --region us-west-2

For an unplanned Regional impairment, add the --allow-data-loss option to this command to perform a managed failover instead of a switchover, because a switchover requires the primary Region to be healthy.

During a Regional service impairment, the primary Region’s S3 state file may be unreachable. The same applies in reverse during failback. The failover script tries to read the state file, S3 times out, and the script stops. This creates a circular dependency: you can’t run the failover without access to the infrastructure you’re trying to recover from.

How to remove the dependency

The underlying principle is to remove every recovery dependency on the Region you are recovering from. Failover automation must not read configuration from the control plane or data plane of the impaired Region. Athenahealth implemented this principle by hardcoding infrastructure identifiers directly in their failover scripts. You can obtain these values from your Terraform outputs during normal operations:

# Failover script excerpt (resilient approach)
# Infrastructure identifiers hardcoded, not from dynamic lookups
RDS_GLOBAL_CLUSTER_ID="<your-tfe-global-cluster>"
DR_ASG_NAME="<your-tfe-dr-asg-us-west-2>"
ROUTE53_HOSTED_ZONE_ID="<your-hosted-zone-id>"

# Run Aurora failover with no state file dependency
aws rds failover-global-cluster \
    --global-cluster-identifier $RDS_GLOBAL_CLUSTER_ID \
    --region us-west-2

The trade-off is maintenance: hardcoded values require manual updates when infrastructure changes. Athenahealth addressed this with a CI/CD pipeline that compares hardcoded values against Terraform outputs and alerts on drift.

Hardcoding is one implementation of the principle. A Region-independent configuration source outside the primary Region achieves the same resilience with less drift risk, such as an AWS Systems Manager Parameter Store parameter replicated across Regions, an Amazon DynamoDB global table, or values committed to the repository that holds your failover scripts.

Testing failback

The state file dependency affected both failover and failback. Athenahealth validated failback by running full failover to DR, operating there for 30 minutes, then returning to primary. Bidirectional S3 replication prevented state file loss.

Collaboration model

If you’re planning a multi-Region DR project for TFE, consider a cross-functional approach. Athenahealth’s five-month engagement combined AWS resilience and AWS FIS expertise, HashiCorp TFE architecture knowledge, Terraform DR best practices, and HVD modules. This combination helped the customer reach production-validated DR faster than working independently. You can engage AWS Support or AWS Professional Services for similar guidance.

Conclusion

You can maintain infrastructure deployment capabilities during events that impact a single Region with a validated multi-Region DR architecture for TFE. This architecture achieved a validated RTO of 12-14 minutes and an RPO of less than 1 minute.

Multi-Region DR is not the right choice for every TFE deployment. Athenahealth chose this approach because TFE manages infrastructure for critical healthcare workloads. The October 2025 event showed that losing the ability to deploy during a regional event was a risk the business could not accept. Costs vary based on your configuration, but Athenahealth observed costs approximately 30-40% higher than their single-Region deployment, primarily from Aurora PostgreSQL-Compatible global database replication and S3 cross-Region replication. Weigh this cost against your own RTO and RPO requirements. For less critical workloads, a single-Region deployment with regular backups and a tested restore process may meet your needs.

Key takeaways

  1. Give your infrastructure as code (IaC) tools the same resilience as production workloads. When your TFE deployment becomes unavailable during a Regional service event, you can’t deploy fixes or recover infrastructure.

  2. Validate DR with controlled failure injection. AWS FIS experiments simulating real S3 connectivity loss exposed the state file circular dependency, a failure mode that only surfaces under actual disruption conditions.

  3. Remove recovery dependencies on the Region you are recovering from. Dynamic lookups from state files tie failover to the infrastructure being recovered. Hardcoded identifiers or a Region-independent configuration source both work. Use drift detection to keep values current.

  4. Test failback, not only failover. Without failback validation, you risk getting stuck in the DR Region or causing data loss when returning to primary.

  5. Use subnet-level network disruption to simulate S3 connectivity disruption. The aws:network:disrupt-connectivity action targeting compute subnets simulates Regional S3 connectivity loss, which is the recommended approach because AWS FIS doesn’t offer a direct S3 disruption action.

Next steps

You can implement this solution in your environment with the following steps:

1. Run Phase A AWS FIS experiments on non-production TFE instances to validate Auto Scaling group recovery.

2. Review the HashiCorp’s Terraform Enterprise Validated Design module and DR guidance.

3. Establish your RTO and RPO targets before designing your Aurora replication strategy.

4. Create your first AWS FIS experiment to validate your DR architecture.

After you validate these three phases, extend your testing with additional AWS FIS scenarios. The AZ Availability: Power Interruption scenario validates recovery from the loss of an Availability Zone. The Cross-Region: Connectivity scenario simulates disrupted network connectivity between Regions, including paused S3 replication, which would delay state file replication to your DR Region.

If you need help designing or validating a multi-Region DR strategy, contact AWS Support or AWS Professional Services.

Cleanup

If you deploy this architecture for testing, delete the following resources in both Regions to avoid ongoing charges:

  • Aurora PostgreSQL-Compatible global database clusters.

  • Amazon S3 buckets with cross-Region replication.

  • Amazon EC2 instances in the DR Region Auto Scaling group.

If you used the sample GitHub repo to set up a test multi-Region TFE environment, verify that you also run terraform destroy to avoid any additional charges.

Resources:


About the authors

Architecting AI-powered resilience framework on AWS

Post Syndicated from Medha Shree original https://aws.amazon.com/blogs/architecture/architecting-ai-powered-resilience-framework-on-aws/

When your production system goes down, you often discover the hard way that your resilience testing missed critical dependencies. Building an AI-powered resilience framework on AWS helps you find those weaknesses before your customers do.

Your systems don’t fail because your infrastructure isn’t resilient. They fail because resilience is assumed, not proven. Every deployment introduces new dependencies, every configuration change creates untested paths, and every gap between design intent and runtime behavior is a risk waiting to surface. In a world where customers expect always-on availability, the cost of discovering these weaknesses in production isn’t just technical. It’s measured in revenue lost, trust eroded, and events that were entirely preventable.

In this post, you’ll learn how to architect and implement a five-layer AI-powered resilience framework that automatically discovers dependencies, generates targeted experiments, and integrates with your existing Continuous Integration/Continuous Deployment (CI/CD) pipelines. First, we’ll explore the key challenges in resilience testing. Then, we’ll walk through the five-layer architecture that solves these challenges. Finally, we’ll show you how to implement this, with phased rollout guidance for pilot, expansion, and organization-wide deployment.

Traditional resilience testing can take weeks because the information needed is naturally spread across architecture diagrams, runbooks, code repositories, and team knowledge that evolves with every deployment. Designing meaningful chaos experiments on top of that requires specialized expertise that most teams don’t have on hand. Here’s how this AI-powered framework discovers your infrastructure dependencies in hours and generates targeted experiments without requiring specialized knowledge.

Combining AWS Resilience Hub, AWS Fault Injection Service, Amazon Bedrock AgentCore, and AWS Systems Manager work together to discover infrastructure dependencies in hours, tailor experiments to your specific architecture, and identify weaknesses before they affect customers.

With the next generation of AWS Resilience Hub now providing native dependency discovery and generative AI-powered failure mode analysis, this framework extends those capabilities by automating experiment generation, embedding resilience testing into your CI/CD pipelines, and creating a continuous validation loop through custom AI agents hosted on Amazon Bedrock AgentCore.

Key concepts

Before diving into the architecture, here are the key terms used throughout this post:

  • Chaos engineering — The discipline of experimenting on a system to build confidence in its ability to withstand turbulent conditions in production.
  • Mean time to resolution (MTTR) — The average time to restore service after a failure.
  • Recovery Time Objective (RTO) — The maximum acceptable downtime for your application.
  • Recovery Point Objective (RPO) — The maximum acceptable data loss, measured in time.
  • Shift-left — Testing earlier in the development cycle to catch issues before they reach production.
  • Circuit breaker — An automated mechanism that detects service failures and helps prevent cascading outages by temporarily blocking requests to failing services.
  • Canary deployment — A technique where changes roll out to a small percentage of users first to validate functionality before full deployment.

Who this is for

This post targets cloud architects, DevOps engineers, and Site Reliability Engineering (SRE) teams responsible for system reliability. You should understand AWS services, distributed systems architecture, and CI/CD pipelines. While chaos engineering experience helps, it’s not required. This framework reduces the expertise barrier that traditionally prevented adoption.

Resilience testing challenges

When infrastructure changes happen quickly, documentation tends to lag behind. A routing change to the payment service might not get reflected in the architecture diagrams, leaving single points of failure (like a single-Availability Zone authentication dependency) undocumented and untested. The payment service calls a legacy authentication API that only runs in one Availability Zone, a critical single point of failure. But documentation doesn’t reflect this because someone made a “quick fix” three weeks ago and forgot to update the diagrams.

Distributed systems contain hundreds of interconnected components. Tracking every dependency manually becomes impractical when you deploy changes continuously. Documentation created last month already misses dozens of new dependencies.

Resilience testing can be challenging without dedicated specialists to design meaningful experiments. Resilience testing is most effective when it’s tailored to your actual architecture and runs continuously. Generic fault injection and one-off test runs can leave gaps, especially as your system changes over time.

The expertise barrier stops many organizations entirely. Effective chaos engineering demands understanding distributed systems architecture, failure mode analysis, experiment scope management, and safe experiment design. Without this specialized knowledge, you either avoid resilience testing or run superficial tests that miss critical vulnerabilities.

According to the 2024 IBM Security Services Benchmark Report, organizations with mature response capabilities reduce their MTTR by approximately 50% and achieve cost savings of up to 58% per event when compared to organizations with less mature capabilities. Yet Gartner research shows that 68% of organizations cite increasing system complexity as their reason for adopting chaos engineering, while 50% admit they weren’t prepared when failures occurred.

This framework automates discovery. Automated discovery reduces infrastructure mapping from weeks to hours, typically completing initial assessment in 2–4 hours for single-account environments with thousands of resources. Subsequent runs process only the changes tracked by AWS Config, so your architecture map stays current without manual effort. Agents hosted on AgentCore Runtime analyze your AWS CloudFormation templates, code repositories, and runtime behavior to identify every connection, including hidden dependencies that manual audits miss. Experiment templates analyze your specific architecture and produce targeted tests that validate your actual failure modes, removing the need for specialized chaos engineering expertise. Continuous integration into your CI/CD pipelines catches regressions before they reach production, shifting resilience from a one-time project into an ongoing practice embedded in your development workflow.

Solution overview

The framework addresses these gaps by automatically discovering infrastructure dependencies and continuously validating resilience as the system changes. AI agents, hosted on AgentCore Runtime for secure, scalable execution, discover system dependencies automatically, analyze architectural patterns, and create targeted experiments based on your actual risk profiles. Testing scales across your application portfolio while lowering the expertise barrier.

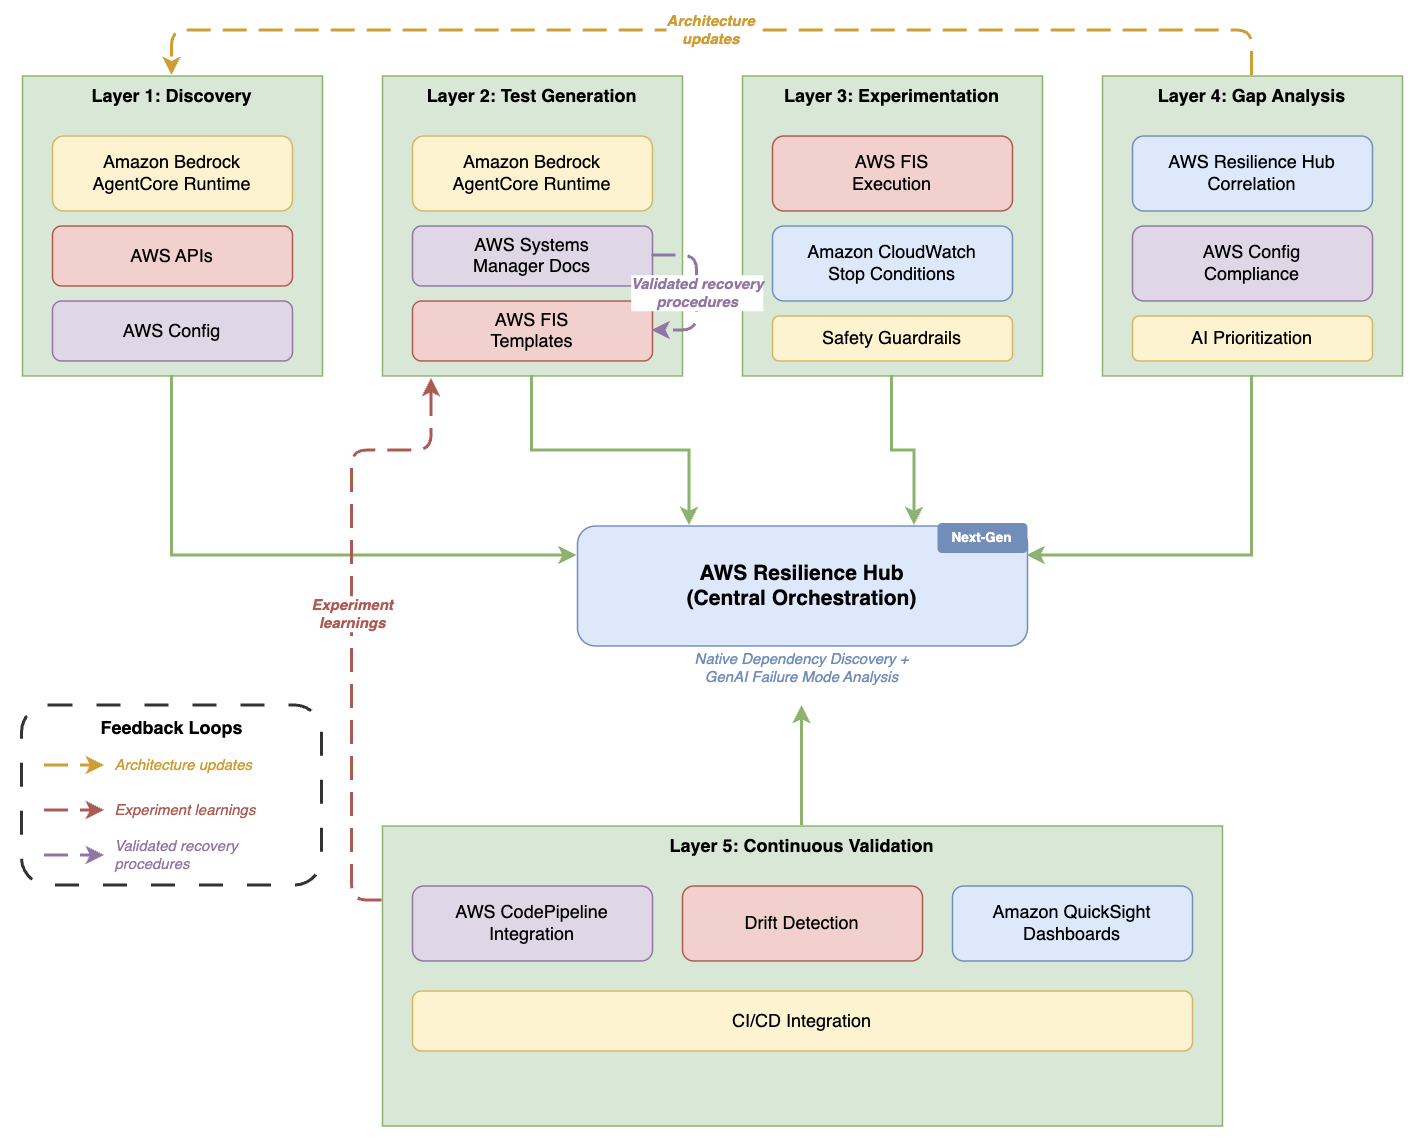
Five-layer AI-powered resilience architecture with AWS Resilience Hub as the central orchestration hub

Figure 1. Five-layer AI-powered resilience architecture

Five-layer architecture diagram with AWS Resilience Hub — labeled “Next-Gen” with native dependency discovery and generative AI failure mode analysis — as the central orchestration hub. Layers 1–4 (Discovery, Test Generation, Experimentation, Gap Analysis) sit across the top, each connecting down to the hub. Layer 5 (Continuous Validation) sits below with CI/CD, drift detection, and dashboards. Three dashed feedback loops overlay the diagram: Gap Analysis feeds “Architecture updates” back to Discovery, Continuous Validation sends “Experiment learnings” up to Test Generation, and SSM Docs feeds “Validated recovery procedures” into FIS Templates within the Test Generation layer.

Each layer builds on the previous one, creating a comprehensive validation strategy. This architecture aligns with the AWS Well-Architected Reliability Pillar, specifically the Test reliability best practice area. Discovery maps your infrastructure. Test generation creates relevant experiments from that map. Experimentation executes those tests safely. Gap analysis identifies what needs fixing. Continuous validation helps verify that improvements persist as your systems evolve.

Now that you understand the overall strategy, let’s examine each layer in detail, starting with how the discovery layer automatically maps your infrastructure.

Discovery layer

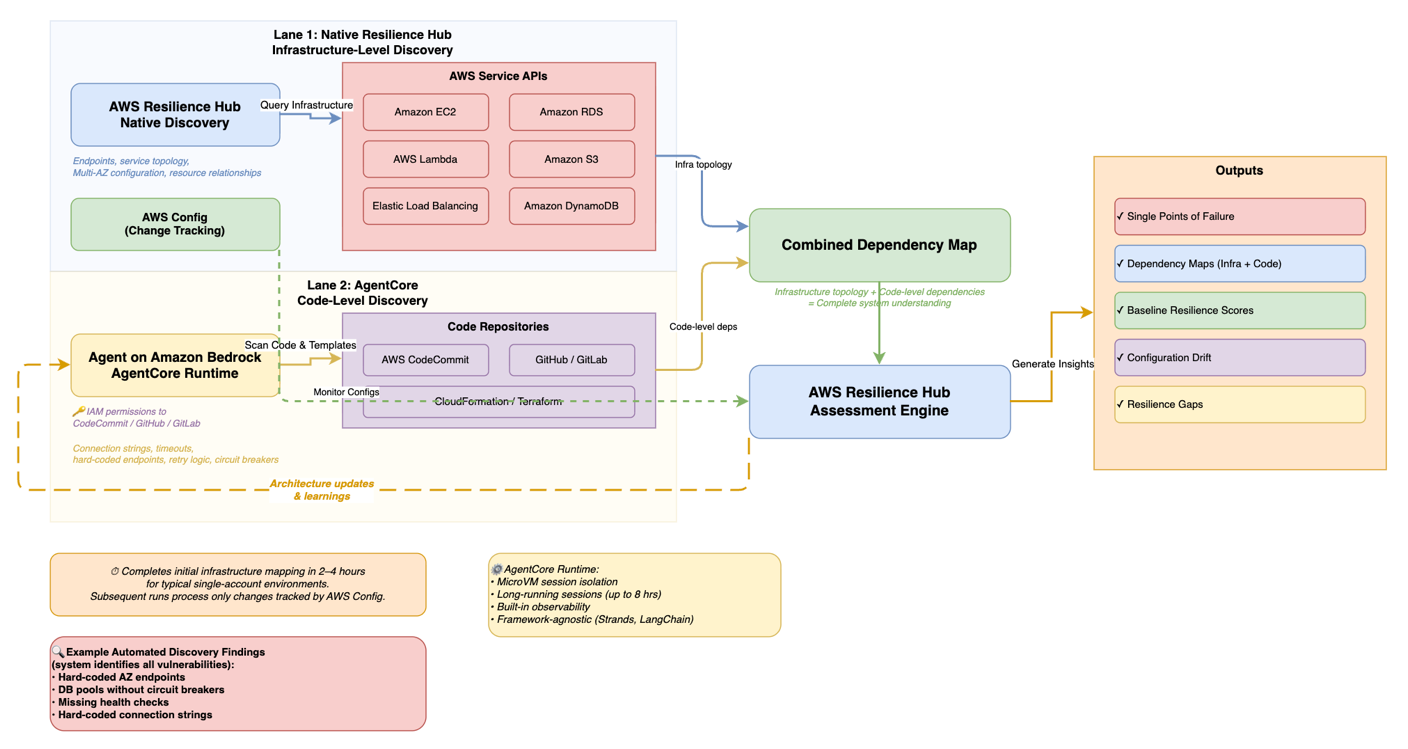
The discovery layer forms the foundation by automatically identifying infrastructure components and their dependencies. The next generation of AWS Resilience Hub provides native dependency discovery that identifies AWS services, internal endpoints, and third-party endpoints your applications rely on. A custom agent deployed on Amazon Bedrock AgentCore (with read permissions to AWS APIs) extends this native discovery with code-level analysis, scanning your code repositories for hard-coded dependencies, connection strings, timeout configurations, and retry logic that infrastructure-level discovery alone cannot detect. A custom agent deployed on Amazon Bedrock AgentCore (with read permissions to AWS APIs) handles infrastructure discovery. Amazon Bedrock AgentCore Runtime provides dedicated MicroVM session isolation, supports long-running discovery sessions up to eight hours, and handles scaling and security without requiring you to manage infrastructure. The runtime’s built-in observability (traces, logs, and metrics) integrates natively with your existing Amazon CloudWatch dashboards without additional instrumentation.

The AgentCore-hosted agent queries services including Amazon Elastic Compute Cloud (Amazon EC2), Amazon Relational Database Service (Amazon RDS), AWS Lambda, Amazon DynamoDB, and Amazon Simple Storage Service (Amazon S3) to build comprehensive inventory. It analyzes AWS CloudFormation templates and Terraform configurations to understand your intended architecture, and accesses code repositories to identify hard-coded dependencies, connection strings, and timeout configurations in your applications. AWS Config provides configuration data and tracks changes over time. This discovery completes in 2–4 hours for environments with thousands of resources.

AI-powered discovery workflow showing infrastructure-level and code-level discovery feeding into a combined dependency map

Figure 2. AI-powered discovery workflow

Workflow diagram organized in two swim lanes. Lane 1 (blue) shows AWS Resilience Hub native infrastructure-level discovery querying AWS service APIs (Amazon EC2, Amazon RDS, AWS Lambda, Amazon S3, Elastic Load Balancing, Amazon DynamoDB) for service topology, endpoints, and Multi-AZ configuration. Lane 2 (yellow) shows an agent on Amazon Bedrock AgentCore performing code-level discovery — scanning repositories (CodeCommit, GitHub, GitLab via IAM permissions) and analyzing CloudFormation/Terraform templates for connection strings, timeouts, and circuit breakers. Both lanes feed into a combined dependency map, which flows into the AWS Resilience Hub assessment engine. Outputs include single points of failure, dependency maps (infrastructure + code), baseline resilience scores, configuration drift, and resilience gaps. AWS Config monitors configurations in parallel. A dashed feedback arrow loops from the assessment engine back to the AgentCore agent labeled “Architecture updates & learnings.” Initial mapping completes in 2–4 hours for typical single-account environments; subsequent runs process only changes tracked by AWS Config.

Test generation layer

While the next generation of Resilience Hub includes a generative AI-powered failure mode assessment that identifies potential weaknesses through static analysis, this test generation layer converts those recommendations into executable AWS Fault Injection Service experiment templates, complete with safety guardrails, progressive scope expansion, and business impact scoring tailored to your specific architecture.

Building on the discovered infrastructure, the test generation layer creates targeted chaos experiments for your specific architecture. The agent hosted on AgentCore Runtime uses Amazon Bedrock foundation models to analyze your infrastructure context, combined with the RTO, RPO, and availability targets you define in AWS Resilience Hub, to identify single points of failure and produce hypothesis-driven test scenarios aligned with your business requirements. Each hypothesis is scored by potential business impact, prioritizing experiments for customer-facing systems and components where architectural patterns indicate high-availability intent. Each experiment includes business impact scoring based on your application tier definitions in AWS Resilience Hub, architectural patterns (such as internet-facing load balancers and Amazon API Gateway endpoints), dependency analysis, and AWS resource tags. This makes sure experiments prioritize your customer-facing systems and highest-impact components. Using the code repository analysis from the discovery layer, the system detects when your applications use Amazon RDS Multi-AZ but lack proper connection retry handling, and designs database failover tests that validate your actual recovery mechanisms rather than generic network disruption tests.

For your production environments, implement a manual approval workflow where your infrastructure teams review experiment templates before execution. AWS Step Functions orchestrates approval gates. Step Functions is a workflow management service that coordinates multiple AWS services into serverless workflows.

Experimentation layer

After creating targeted experiments, the experimentation layer runs chaos tests with multi-layered safety guardrails on your infrastructure. AWS Fault Injection Service executes chaos tests with built-in safety mechanisms. Experiments start with minimal scope (affecting only 1% of your resources) and expand progressively based on your risk tolerance and validation results (for example, 1% → 5% → 10% → 25%). This follows progressive deployment strategies recommended in the AWS Well-Architected Reliability Pillar, similar to canary deployments where changes roll out incrementally to limit blast radius. Amazon CloudWatch alarms serve as stop conditions that halt experiments before they violate your Service Level Agreements (SLAs), which are contracts defining expected uptime and performance. Set alarm thresholds well below your SLA limits. If your SLA allows 1% error rate, configure stop conditions to trigger at 0.1%.

Gap analysis layer

After your experiments complete, the gap analysis layer processes results to identify weaknesses and prioritize remediation. AWS Resilience Hub correlates experiment outcomes with your resilience policies, categorizing gaps across architectural, operational, data protection, and testing dimensions. Each gap receives a priority score based on severity (how badly this violates your resilience policy), likelihood (how often this failure mode occurs), and business impact (the cost if this failure occurs in your environment).

Continuous validation layer

The continuous validation layer integrates resilience testing into your development workflow. The right approach depends on your deployment velocity and testing goals.

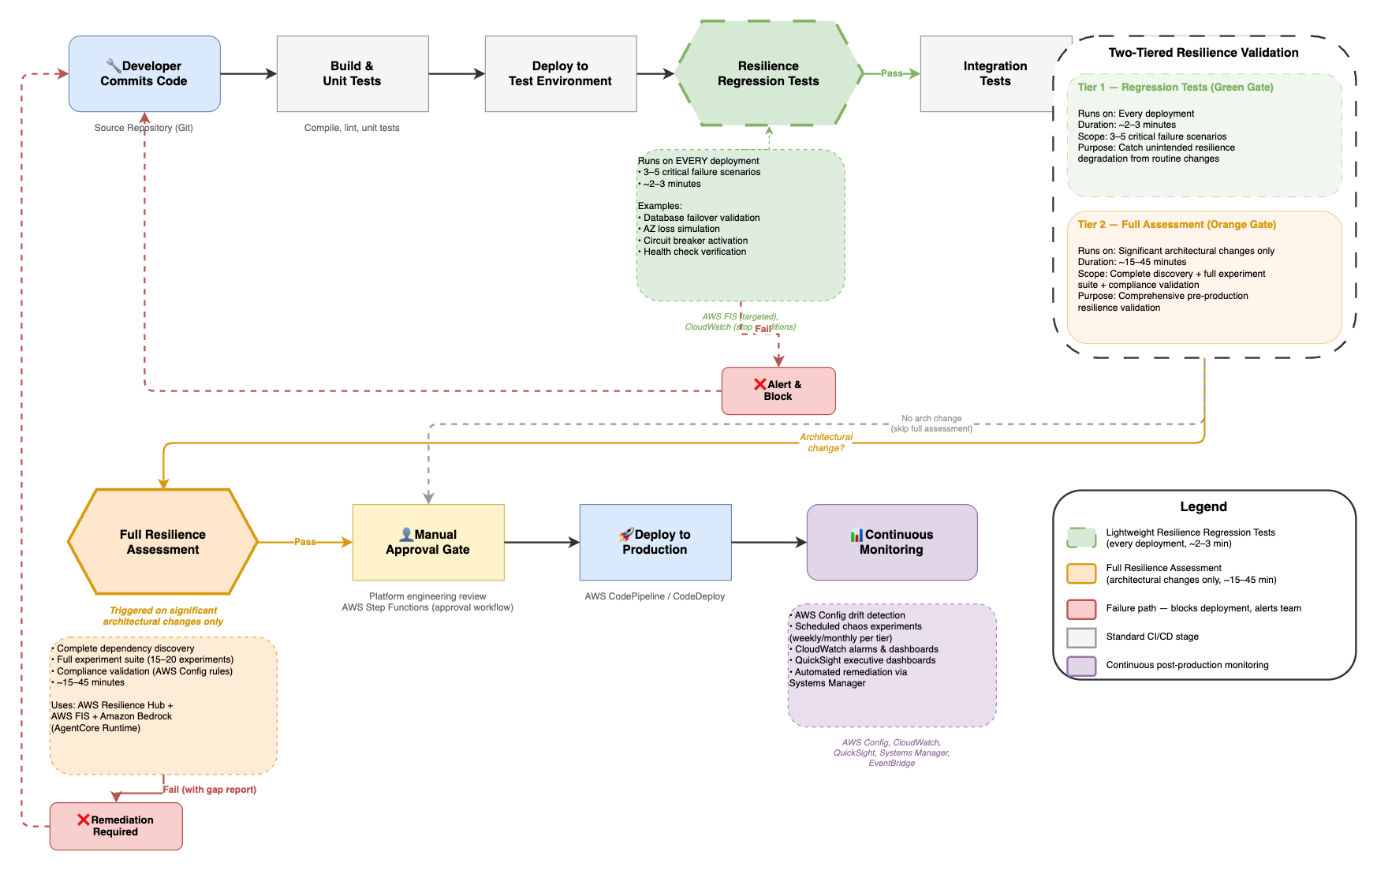
For most teams, a lightweight policy-as-code check (using tools like Open Policy Agent to validate Infrastructure as Code and Dockerfiles) runs in seconds and fits naturally in your CI/CD pipeline for every commit. This catches basic configuration issues, like missing health checks or single-AZ deployments, before code reaches staging.

Full resilience assessments are better suited as a pre-production gate, triggered on significant architectural changes rather than every commit. For routine deployments, lightweight resilience regression tests (validating a focused set of critical failure scenarios like database failover, Availability Zone loss, and circuit breaker activation) run automatically to catch unintended resilience degradation from code or configuration changes. This two-tiered approach gives you comprehensive safety validation for major changes and continuous regression coverage for everyday deployments, without slowing your pipeline. Your new code and infrastructure changes trigger automated resilience assessments that identify potential weaknesses during development rather than after deployment, embedding this shift-left strategy directly into your CI/CD workflow.

The policy-as-code check adds seconds to each pipeline run. Full resilience assessments add approximately 2–3 minutes per experiment.

AWS Config drift detection identifies manual changes that bypass your deployment pipelines, helping keep your architecture aligned with tested configurations.

CI/CD pipeline with two-tiered resilience testing gates for routine deployments and architectural changes

Figure 3. Resilience testing in the CI/CD pipeline

Flowchart showing a CI/CD pipeline with two-tiered resilience testing. The top row shows the standard pipeline flow: Developer Commits Code → Build & Unit Tests → Deploy to Test Environment → Resilience Regression Tests (green hexagon gate, runs 3–5 critical scenarios in ~2–3 minutes on every deployment) → Integration Tests → Deploy to Staging. From staging, if an architectural change is detected, the flow drops to a second row: Full Resilience Assessment (orange hexagon gate, runs 15–20 experiments over ~15–45 minutes using AWS Resilience Hub, FIS, and Bedrock) → Manual Approval Gate → Deploy to Production → Continuous Monitoring. If no architectural change occurred, staging skips directly to the approval gate. Both resilience gates have failure paths (red) that block deployment and loop back to the developer. A legend and a side panel summarize the two tiers.

Continuous improvement through feedback

Experiment results feed back into the discovery and test generation layers, creating a continuous improvement cycle. When experiments reveal undocumented dependencies, the discovery layer updates your architecture map. When remediation actions successfully resolve failure patterns, Systems Manager automation documents capture these procedures for future use. The Bedrock agent analyzes experiment outcomes to refine hypothesis generation, deprioritizing consistently passing scenarios and focusing on emerging risk areas as your architecture evolves.

Key benefits

Now that you’ve seen how each layer works together, let’s examine the concrete benefits this architecture brings to your organization.

Faster infrastructure discovery: Manual infrastructure discovery requires significant effort across distributed teams, including cataloging resources, tracing dependencies, and validating configurations. Automated discovery reduces this from weeks to hours by programmatically querying cloud service APIs, analyzing infrastructure-as-code templates, and mapping dependencies. After implementation, the framework scales across your application portfolio without proportionally increasing staffing.

Removes expertise barrier: Without chaos engineering specialists, you can implement resilience testing using automated scenarios. Start with the AWS Fault Injection Service Scenarios Library for common failure patterns, then expand with scenarios specific to your architecture and customize based on your application’s specific failure modes.

Proactive risk identification: Automated discovery reveals critical single points of failure that manual audits consistently miss, including hard-coded endpoints, missing circuit breakers, and absent health checks. The system identifies vulnerabilities across your infrastructure and prioritizes them by business impact, so your teams can focus remediation on the highest-risk items first.

Faster recovery through automated remediation: Automated remediation reduces your mean time to resolution by removing manual intervention for common failure patterns in your environments. AWS Systems Manager automation documents codify recovery procedures discovered during chaos experiments. When Amazon CloudWatch alarms detect failure patterns in your systems, AWS Systems Manager automatically executes remediation actions, handling issues faster than manual response.

Continuous resilience validation: Integrating resilience assessments into your CI/CD pipelines catches regressions before production deployment, maintaining resilience as your system evolves rather than treating it as a one-time validation.

Framework components

AWS Resilience Hub serves as the central orchestration layer, defining your resilience policies, running assessments, and tracking improvements. Define RTO and RPO targets for each application tier based on your business impact analysis.

Amazon Bedrock delivers the AI capabilities that power discovery and test creation. AgentCore Runtime provides the managed hosting layer, handling session isolation, scaling, identity management, and observability, so your agent runs securely in production without infrastructure overhead.

Deploy a custom agent on Amazon Bedrock AgentCore, a framework-agnostic managed runtime that supports agents built with Strands, LangChain, or custom Python. The agent uses Amazon Bedrock to analyze your infrastructure context against architectural patterns, AWS documentation, and best practices. AgentCore Runtime’s built-in tool gateway provides controlled, secure access to your AWS APIs during discovery.

AWS Fault Injection Service runs controlled chaos experiments with built-in safety mechanisms on your infrastructure. Pre-built actions cover common failure scenarios: terminating Amazon EC2 instances, injecting network latency, throttling API calls, failing over Amazon RDS databases, and disrupting Availability Zone connectivity in your environments.

AWS Systems Manager extends your resilience framework beyond the default AWS Fault Injection Service actions. You can create custom automation documents that codify recovery procedures and transform manual runbooks into automated self-healing responses. When you build custom actions, you take on responsibility for proper rollback procedures and service state restoration. Design these with the same rigor you’d apply to your production runbooks.

AWS Config continuously monitors your resource configurations and tracks changes. AWS Config rules validate that your resources comply with resilience policies. For example, they verify your Amazon RDS instances use Multi-AZ deployment and confirm your Auto Scaling groups span multiple Availability Zones.

Prerequisites

To implement this framework, you’ll need:

  1. AWS account with administrative access.
  2. AWS Identity and Access Management (IAM) permissions for: AWS Resilience Hub, AWS Fault Injection Service, Amazon Bedrock AgentCore, AWS Systems Manager, and AWS Config. For each service, follow the principle of least privilege. Refer to the respective service documentation for minimum required permissions.
  3. The Amazon Bedrock AgentCore Starter Toolkitcreates broad dev/test permissions by default. Scope these down to least-privilege before production deployment.
  4. AWS Command Line Interface (AWS CLI) installed and configured.
  5. Basic understanding of AWS CloudFormation or Terraform.
  6. Non-critical application available for testing.
  7. Estimated time: 4–6 hours for pilot implementation (with a team of 2–3 engineers who have working knowledge of your AWS environment).
  8. Cost awareness: This implementation creates billable AWS resources including AWS Resilience Hub, AWS Fault Injection Service, Amazon Bedrock AgentCore, AWS Systems Manager, AWS Config, and Amazon CloudWatch. Follow the cleanup procedures after testing to avoid ongoing charges.

Getting started

A phased rollout builds confidence before expanding scope if you’re new to chaos engineering.

Pilot phase (1–2 weeks, 2–3 engineers)

  1. Select a non-critical application with well-understood architecture from your portfolio.
  2. Enable AWS Config across the regions where your application runs.
  3. Package your discovery agent code using Strands, LangChain, or custom Python.
  4. Deploy the packaged agent on Amazon Bedrock AgentCore using the Amazon Bedrock AgentCore Starter Toolkit. AgentCore Runtime handles the compute, session management, and security so you can focus on the agent logic and discovery scope. The runtime maintains stateful working context (including tool state and memory) across the multi-step infrastructure discovery workflow.
  5. Run a baseline resilience assessment in AWS Resilience Hub to identify initial architectural gaps. Resilience Hub evaluates your architecture against Well-Architected best practices and establishes your starting resilience posture. The Bedrock agent you deploy in the next step builds on this baseline, discovering undocumented dependencies and generating targeted experiments that go beyond standard recommendations.

Verify: Check the AWS Resilience Hub console for a completed assessment report showing baseline resilience scores and identified gaps. You should see a resilience score for each disruption type (AZ, Region, Application) and a list of recommended actions.

Expansion phase (4–6 weeks, cross-functional team)

  1. Expand to 3–5 applications across different tiers after validating safety with your pilot.
  2. Configure automated test creation to develop experiments specific to each of your application’s architectures.
  3. Run controlled chaos experiments starting with 1% scope during your low-traffic periods.

Verify: Review the AWS Fault Injection Service console for experiment status “Completed” and check Amazon CloudWatch metrics to confirm the 1% scope was applied without triggering stop conditions.

  1. Analyze results to identify common patterns across your applications.

Enterprise scale (8–12 weeks, dedicated resilience team)

  1. Expand resilience assessments in your CI/CD pipelines to comprehensive, multi-account validation.
  2. Configure centralized reporting across organizational units.
  3. Set up cross-account experiment coordination.
  4. Distribute shared experiment templates across organizational units using AWS Organizations.
  5. Deploy distributed worker pools for parallel testing across your multiple applications.
  6. Implement executive dashboards using Amazon QuickSight to track resilience trends across your portfolio.

When to move to enterprise patterns

Consider adopting the enterprise deployment patterns in the next section when you meet any of these criteria:

  • You manage dozens of applications across multiple AWS accounts.
  • Multiple business units require differentiated resilience policies based on varying risk tolerances, compliance requirements, or customer SLAs.
  • Compliance requirements demand centralized audit trails across accounts.
  • Your testing cadence exceeds what a single-account setup can handle.

Design considerations for enterprise deployment

When you’re ready to scale beyond initial pilots, consider these enterprise deployment patterns that handle the unique challenges of managing resilience testing across large organizations.

Enterprise scalability patterns showing multi-account structure with tiered resilience policies and distributed worker pools

Figure 4. Enterprise scalability patterns

Diagram showing multi-account structure with native AWS Resilience Hub and AWS Organizations integration. A central management account connects to Production and Non-Production organizational units with distributed application accounts. The framework extends this native integration with cross-account FIS coordination (coordinated experiments across OUs) and shared FIS experiment templates distributed via Organizations. Priority-based scheduling shows Tier 1 Mission-Critical (weekly assessments, 100+ applications), Tier 2 Business-Critical (monthly assessments, 500+ applications), and Tier 3 Non-Critical (quarterly assessments, 1000+ applications). Distributed worker pools operate across multiple AWS regions (us-east-1, us-west-2, eu-west-1, ap-southeast-1) with centralized monitoring via Amazon EventBridge, Amazon QuickSight dashboards, Amazon CloudWatch logs, and Amazon SNS notifications.

Multi-account architecture

The next generation of AWS Resilience Hub supports modular resilience policies that you can assign at the system, user journey, or service level. Choose this multi-account strategy if you manage more than 100 applications across different business units. When you have thousands of applications, assessing your workloads simultaneously from a single account becomes impractical. Implement a hub-and-spoke model (a centralized architecture pattern where a central “hub” account manages shared services while “spoke” accounts contain individual workloads) with centralized resilience testing infrastructure and distributed application ownership. Deploy AWS Resilience Hub and AWS Fault Injection Service in your central management account. Your production accounts contain application workloads and local AWS Config recorders. The next generation of AWS Resilience Hub natively integrates with AWS Organizations, enabling central teams to define resilience policies and monitor posture across all accounts and regions from a single dashboard. This framework extends native multi-account visibility with cross-account experiment coordination and shared experiment templates across organizational units. For guidance on structuring your multi-account environment, see Best practices for a multi-account environment and the Organizing Your AWS Environment Using Multiple Accounts whitepaper.

Tiered resilience policies

Not every workload justifies the same resilience investment. Implement tiered resilience based on your business impact analysis. For example, mission-critical applications might target stricter recovery objectives (such as RTO < 15 minutes, RPO < 5 minutes, 99.99% availability) with comprehensive quarterly chaos experiments, while business-critical applications might set moderate targets (such as RTO < 1 hour, RPO < 15 minutes, 99.9% availability) with monthly validation, and non-critical applications might accept longer recovery windows with quarterly assessments. This tiered strategy optimizes costs by focusing resilience investments on your highest-impact workloads.

Security and compliance

Under the AWS Shared Responsibility Model, AWS is responsible for security of the cloud (infrastructure), while you are responsible for security in the cloud (your configurations, data, and access management). The controls described below are your responsibility to configure and maintain. Encrypt your data at rest using AWS Key Management Service (AWS KMS) with customer-managed keys. Implement separate encryption keys per environment to limit the scope of unauthorized access in your infrastructure. Enforce Transport Layer Security 1.3 (TLS 1.3), a cryptographic protocol that secures data transmission, for data in transit. AWS CloudTrail delivers complete audit trails of your resilience operations. Automated compliance monitoring through AWS Security Hub (which continuously evaluates resources against standards including CIS AWS Foundations Benchmark, PCI DSS, and AWS Foundational Security Best Practices), combined with AWS Config conformance packs, streamlines evidence collection for Service Organization Control 2 Type II (SOC 2 Type II), International Organization for Standardization 27001 (ISO 27001), Payment Card Industry Data Security Standard (PCI DSS), and Digital Operational Resilience Act (DORA), an EU regulation requiring financial institutions to test operational resilience.

AI agent security: The Amazon Bedrock AgentCore-hosted agent operates with scoped IAM roles following least-privilege principles. AgentCore Runtime’s MicroVM session isolation makes sure that each discovery session runs in a dedicated, ephemeral environment with no cross-session data leakage. The agent’s infrastructure access is read-only during discovery and cannot modify resources. Amazon Bedrock interactions occur within your AWS account boundary, and no customer data is used for training purposes. For additional guardrails, you can configure Amazon Bedrock Guardrails to filter agent outputs and enforce responsible AI policies.

Note: This framework supports your compliance efforts but does not guarantee compliance with any regulatory framework. Compliance is a shared responsibility. Consult your legal and compliance teams and qualified auditors to validate that your implementation meets your specific regulatory obligations.

Addressing common concerns

Progressive scope expansion and automated stop conditions help you verify experiments reveal weaknesses without causing outages in your environments. Starting with 1% of your resources limits potential impact to statistically insignificant traffic. Organizations have validated this strategy using progressive scope expansion and automated stop conditions.

Automated scenarios remove the expertise barrier. The AI-powered analysis examines your specific architecture to develop targeted experiments rather than demanding you design tests manually. AWS CloudTrail provides comprehensive audit trails of your chaos experiments, which can help support due diligence documentation for resilience testing. This evidence can contribute to your compliance documentation for SOC 2, ISO 27001, and other frameworks relevant to your organization. For financial services, the framework supports DORA scenario testing requirements.

Clean up

To avoid ongoing charges, delete the resources you created during implementation:

  1. Delete your AWS Fault Injection Service experiment templates. Warning: This permanently removes experiment history and results. Consider exporting experiment data before deletion if you need to retain this information for compliance or analysis purposes.
  2. Remove your Amazon Bedrock AgentCore agent deployment, runtime endpoints, and associated configurations.
  3. Delete your AWS Systems Manager automation documents. Warning: This removes your automation runbooks permanently. Back up any custom runbooks you may want to reuse in future implementations.
  4. Remove your Amazon CloudWatch alarms created for stop conditions.
  5. Delete any AWS Step Functions state machines created for approval workflows.
  6. Remove any Open Policy Agent configurations deployed for IaC validation.
  7. Delete Amazon QuickSight dashboards created for resilience tracking (if applicable). Warning: This removes resilience trend data and operational insights. Export dashboard data or save analysis snapshots before deletion.
  8. Remove Amazon EventBridge rules and Amazon SNS topics created for notifications (if applicable).

Your AWS Resilience Hub and AWS Config continue incurring minimal costs. Consider retaining them for ongoing resilience validation.

Conclusion

In this post, I showed you how to build a five-layer AI-powered resilience framework that automatically discovers dependencies, generates targeted experiments, and integrates with your CI/CD pipelines. Building on the next generation of AWS Resilience Hub’s native dependency discovery and generative AI-powered failure mode analysis, this framework adds automated experiment generation through Amazon Bedrock AgentCore, controlled execution via AWS Fault Injection Service, and continuous CI/CD validation through AWS Systems Manager, creating an end-to-end resilience pipeline that goes from discovery to prevention.

The next frontier is shifting even earlier, scanning your Infrastructure as Code and application code for resilience anti-patterns before a single resource is deployed. When your CI/CD pipeline can flag a missing circuit breaker or a single-AZ dependency at the pull request stage, prevention becomes truly proactive.

The progressive strategy (starting with your single application pilot, expanding to multiple applications, then scaling organization-wide) builds confidence while demonstrating value at each phase. Organizations often realize positive return on investment through prevented events and reduced MTTR.

The framework makes resilience testing accessible to you, removing the expertise barrier that traditionally prevented adoption. Start with the pilot phase outlined earlier and expand to your mission-critical systems as confidence builds.

Ready to get started? Pick a non-critical application from your portfolio, deploy the discovery agent, and run your first assessment this week. Then share what you found. We’d love to hear about the hidden dependencies your team uncovered.

Have you implemented chaos engineering in your organization? What challenges did you face? Share your experience in the comments below.

Next steps

For the latest Resilience Hub capabilities including native dependency discovery and generative AI-powered failure mode analysis, see Introducing the next generation of AWS Resilience Hub and the next generation documentation.

Start with the resources most relevant to where you are in your resilience journey:

If you’re just getting started:

  1. For more information about resilience policies and assessment capabilities, see AWS Resilience Hub documentation.
  2. For hands-on experience with chaos engineering, see AWS Fault Injection Service Workshop.

If you’re ready to build:

  1. For information about creating fault injection experiments using natural language through Amazon Bedrock, see Chaos engineering made clear: Generate AWS FIS experiments using natural language through Amazon Bedrock.
  2. For information about assessing application resilience with AWS Resilience Hub and AWS CodePipeline, see Continually assessing application resilience with AWS Resilience Hub and AWS CodePipeline.
  3. For additional fault injection experiment templates, see AWS Fault Injection Service Template Library.

If you’re scaling to production: 6. For information about hosting production AI agents at scale, see Amazon Bedrock AgentCore 7. For sample agent code and deployment templates, see the Amazon Bedrock AgentCore Starter Toolkit.

Systems will face failures. Discover and fix weaknesses before your customers experience them by shifting your resilience testing from reactive response to proactive prevention.

If you have questions or need guidance implementing the framework, contact AWS or reach out to your AWS Solutions Architect.


About the author

Improving platform resilience at Cash App

Post Syndicated from Dustin Ellis original https://aws.amazon.com/blogs/architecture/improving-platform-resilience-at-cash-app/

This post was coauthored with engineers at Cash App, including Ben Apprederisse (Platform Engineering Technical Lead), Jan Zantinge (Traffic Engineer), and Rachel Sheikh (Compute Engineer).

Cash App, a leading peer-to-peer payments and digital wallet service from Block, Inc., has grown to serve over 57 million users since its launch in 2013. Providing diverse offerings like instant money transfers, debit cards, stock and bitcoin investments, personal loans, and tax filing, Cash App continuously strives to make money more relatable, accessible, and secure. To meet this mission, their platform built on AWS must remain highly scalable and resilient.

Cash App has implemented resilience improvements across the entire technology stack, but for this post, we explore two enhancements implemented in 2024. First, we discuss how Cash App improved the resilience of its compute platform built on Amazon Elastic Kubernetes Service (Amazon EKS) by implementing a dual-cluster topology to reduce single points of failure. We also discuss how Cash App used AWS Fault Injection Service (AWS FIS) to conduct an Availability Zone power interruption scenario in non-production environments, preparing the platform team for real-world failures and ongoing regulatory requirements.

Moving to Amazon EKS

Cash App has used Amazon EKS as a shared platform for years, and in 2024, we migrated the last of our biggest and most critical services to it, driven by the ease of management and our strategy to run workloads in the cloud. This shift empowered our teams to focus more on application delivery and less on cluster management, abstracting away some of the complexity in operating Kubernetes clusters. With Amazon EKS, AWS is responsible for managing the Kubernetes control plane, which includes the control plane nodes, the ETCD database, and other infrastructure necessary for AWS to deliver a service offering with enhanced security features. As a consumer of Amazon EKS, we are still responsible for things like AWS Identity and Access Management (IAM), pod security, runtime security, networking, and cluster automatic scaling in the data plane for worker nodes. AWS refers to this as the Shared Responsibility Model; for more details, refer to Best Practices for Security. For a while, maintaining a single shared EKS cluster for each environment and AWS Region was acceptable and met our technical requirements.

Scaling challenges with a single shared EKS cluster

As Cash App’s shared EKS cluster grew and onboarded hundreds of microservices, we became an early adopter of the Karpenter Cluster Autoscaler, which improved application availability and cluster efficiency. Karpenter was designed to enhance node lifecycle management within Kubernetes clusters. It automates provisioning and deprovisioning of nodes based on the specific scheduling needs of pods, allowing for efficient scaling and cost optimization. We also reviewed and adopted many of the Amazon EKS Best Practices Guides for Reliability, Security, Networking, and Scalability.

Despite these efforts, in 2023, we realized having a single shared EKS cluster with hundreds of worker nodes had become a critical dependency in our cloud platform architecture, whereby standard operations like cluster upgrades posed a risk of impacting production traffic or causing downtime. Although we had a staging environment that allowed us to test new features and changes before rolling them out in production, it didn’t always reflect real traffic patterns that could allow impactful changes to go unnoticed in lower environments. For example, in late 2023, production traffic was briefly impacted due to a relatively new Kubernetes feature called API Priority and Fairness (APF) that introduced temporary control plane throttling following a cluster upgrade.

As a leader in the financial services industry, any interruption to our services directly impacts customers’ ability to transact and participate in the economy, so round-the-clock availability of our platform is essential. Following this incident, we reviewed and implemented the Kubernetes Control Plane best practices pertaining to APF and set up new detections in our observability platform to monitor things like FlowSchemas and queue depth. We also created a business case for investing in platform evolution and moving towards a multi-cluster topology. The desired state was to have a safer way to upgrade clusters, such that traffic is always serviceable regardless of the state of a single cluster in the fleet.

The following diagram illustrates our basic architecture in late 2023, portraying a single, Multi-AZ EKS cluster at Cash App. We had two ingress paths: for public ingress, we used Amazon Route 53 to a Network Load Balancer (NLB). For internal ingress across Amazon Virtual Private Cloud (Amazon VPC) networks (for example, from other business units), we set up a VPC endpoint service. Other components (such as service dependencies like database clusters and other Regions) are intentionally omitted from the diagram for simplicity.

Enterprise network architecture showcasing secure cross-VPC communication via PrivateLink to shared EKS cluster with public/internal ingress

Enterprise network architecture showcasing secure cross-VPC communication via PrivateLink to shared EKS cluster with public/internal ingress

Platform enhancements

In 2024, our cloud platform team implemented architectural changes to improve the reliability of the shared Amazon EKS platform, which was already running hundreds of services and over 10,000 pods. In the process, we also recognized the importance of chaos engineering to provide controlled failure testing and preparedness, which is also an evolving regulatory requirement for financial institutions. Our team has made multiple resilience improvements to apply long-term scalability; the rest of this post focuses on two enhancements we believe other AWS customers can benefit from.

Enhancement 1: Implementing a dual-cluster topology

When researching multi-cluster topologies and interacting with AWS specialists, we learned about architectural patterns to improve platform resilience with varying degrees of complexity. This included cell-based architecture, Route 53 weighted routing, and NLB chaining, among other patterns. Our initial requirements for the multi-cluster architecture were as follows:

  • Effortlessly deploy a service across two or more clusters
  • Serve production traffic from multiple clusters at the same time if needed
  • Seamlessly upgrade a production cluster without impacting production traffic
  • Have the ability to take a cluster out of the traffic flow during planned and unplanned events
  • Achieve reliability improvements with minimal architectural and cost changes

Based on these initial requirements and the complexity required to properly implement a cell-based architecture, we decided to start with Route 53 weighted routing for public ingress, and NLB chaining for internal ingress to achieve immediate improvements. Although we plan to implement a cell-based architecture in the future, it requires careful consideration and engineering investment (for example, creating a cell router and cell provisioning system). At the time, we needed a simpler, short-term solution that could improve overall scalability and reliability. From a Kubernetes perspective, we started with two Multi-AZ clusters in our production environment, each operating independently, such that a planned or unplanned event in one cluster would not affect the other cluster. Existing pipelines were extended to deploy the same Kubernetes resources into both clusters, which would actively serve ingress traffic using an NLB. If needed, we could divert all ingress traffic to one cluster during planned or unplanned events by updating the weights in Route 53 (for public ingress) or updating the listener rules and target groups on the frontend NLB (for internal ingress). In the following sections, we dive deeper into both approaches.

Public ingress changes

For public ingress, requests are still handled by Route 53. With the introduction of weighted routing, requests can be evenly routed between the two backend NLBs (one per cluster). This setup allows Cash App to split traffic evenly across clusters or temporarily route all traffic to one cluster during upgrades. As an example, during cluster A’s upgrade, we can direct ingress traffic to cluster B, enabling a sequential upgrade process with minimal disruption. This dual-cluster approach helps mitigate single points of failure and establishes a foundation for reliability improvements. The following diagram illustrates this architecture.

Highly available AWS Cash App architecture using Route 53 for 50/50 traffic distribution to dual NLB and EKS clusters across three AZs

Highly available architecture using Route 53 for 50/50 traffic distribution to dual NLB and EKS clusters across three AZs

Internal ingress changes

Cash App works closely with other business units like Square, and therefore needs to have a secure and scalable ingress path for cross-VPC traffic. To support these use cases, internal ingress requests are still routed from other business unit VPCs to the NLB associated with our VPC endpoint service. From there, requests are load balanced roughly evenly to two backend NLBs (one per cluster) using the listener rules. The following diagram illustrates this architecture.

Enterprise AWS Cash App architecture featuring secure VPC peering, tiered load balancing, and redundant EKS clusters for high availability

Cash App architecture featuring secure VPC peering, tiered load balancing, and redundant EKS clusters for high availability

Key considerations

Consider the following when assessing these approaches:

  • The NLB chaining approach used for internal ingress enables controlled failover and maintenance with minimal disruption by adjusting NLB listeners and target groups, and reduces single points of failure by distributing requests across two or more clusters.
  • Although this pattern met our initial requirements and made it possible to shift traffic from one cluster to another, it’s not as granular as we would like (for example, shift traffic for only service A to cluster B, and leave all other traffic on cluster A). We will continue to evolve the architecture and implement a more intelligent ingress router and cell provisioning system. Furthermore, at the time of writing, NLB doesn’t support weighted target group routing.
  • Using the NLB chaining approach adds additional cost due to multiple NLBs in the traffic path. With NLBs, you’re charged for each hour or partial hour that an NLB is running, and the number of Network Load Balancer Capacity Units (NLCUs) used by the NLB per hour.
  • The NLB chaining approach doesn’t achieve the full benefits of a cell-based architecture, which provides greater isolation and fault isolation boundaries. Moving to a cell-based architecture requires more complexity and coordination, so we decided to start with NLB chaining and Route 53 weighted routing for immediate improvements and minimal re-architecture.

Looking forward, we plan to implement a cell-based architecture that aligns with Block’s compute strategy. This will consist of a cell management layer (to create, update, and delete cells) and a cell routing layer (to route requests to the correct cell), which allows for fine-grained traffic routing.

Enhancement 2: Using AWS FIS for Availability Zone power interruption

After moving to a dual-cluster topology, we researched ways to test ongoing platform resilience. Specifically, we wanted to test what would happen to our environment during single Availability Zone impairments and how our services and data stores would recover. This led us to AWS FIS, which we could use to conduct an Availability Zone power interruption scenario in our staging environment. AWS FIS is a fully managed service for running fault injection experiments on AWS infrastructure, making it straightforward to get started with chaos engineering. Chaos engineering is the practice of stressing an application in testing or production environments by creating disruptive events, such as a sudden increase in CPU or memory consumption, observing how the system responds, and implementing improvements.

Our initial AWS FIS experiment used multiple actions, including network disruption, database failover (targeting Amazon Aurora and Amazon ElastiCache clusters), and EKS worker node disruption (pod eviction and rescheduling). For the full list of AWS FIS actions, refer to AZ Availability: Power Interruption. For our initial experiment, we targeted infrastructure in a single staging account; however, AWS FIS supports multi-account experiments by setting up an orchestrator account that enables centralized configuration, management, and logging. The orchestrator account owns the AWS FIS experiment template. For future AWS FIS experiments, we plan to target more accounts and resources, operating within the constraints of AWS FIS quotas and limits.

For clear communication during the AWS FIS experiment, our platform team coordinated with internal application stakeholders and our AWS account team, monitoring metrics to gauge failover and recovery responses. After the experiment, we debriefed with AWS teams and submitted product feature requests to support ongoing service evolution. Moving forward, we plan to conduct AWS FIS experiments at least twice a year to reinforce reliability best practices and adhere to ongoing regulatory requirements. We will also diversify the types of fault injection experiments we perform, and expand beyond the single Availability Zone failure tests. For example, we might introduce a capability that allows application teams to perform one-time AWS FIS experiments just for their service and backend database infrastructure in a controlled, self-service fashion. An added benefit of using AWS FIS is that there is no agent or infrastructure to deploy or manage, and you’re only billed for the duration of the experiment. This made it both straightforward and affordable to get started with chaos engineering. The following diagram illustrates the architecture of the Availability Zone power interruption scenario targeting subnets, compute, and database clusters.

AWS Fault Injection Service AZ Availability: Power Interruption scenario

AWS Fault Injection Service AZ Availability: Power Interruption scenario

Key considerations

Setting up the AWS FIS experiment required us to modify default service limits and quotas to accommodate the scale and scope, such as the number of target resources for ElastiCache, Amazon Relational Database Service (Amazon RDS), and subnets. We recommend reviewing the quotas, service limits, and supported services prior to conducting your own experiment, and collaborate with your AWS account team to achieve a seamless experience.

We also learned that certain failures, such as database failover, require more than network disruption actions alone—specific failover actions had to be configured in the AWS FIS experiment template to trigger the desired behavior, as outlined further in the service documentation. If you’re starting with the Availability Zone power interruption scenario, be sure to include all of the required actions to achieve the desired outcome. Finally, we recommend using AWS FIS in lower environments because AWS FIS actions will have real impact on the targeted resource state and availability.

Conclusion

Through these enhancements, Cash App has improved overall resilience posture and laid the groundwork for future improvements. On the Amazon EKS side, we aim to implement an ingress routing layer through cell-based architecture patterns, enabling more granular traffic routing and improved fault isolation boundaries. We will continue to use Karpenter for cluster automatic scaling, and are in the process of rolling out AWS Graviton based instances to further improve resource efficiency. Finally, we will continue using AWS FIS for chaos engineering at both the platform and application level, performing larger-scale AWS FIS experiments with more complexity.

For other blog posts and related resources, refer to:


About the authors