All posts by Martin Beeby

Cross-Account Data Sharing for Amazon Redshift

Post Syndicated from Martin Beeby original https://aws.amazon.com/blogs/aws/cross-account-data-sharing-for-amazon-redshift/

To be successful in today’s fast-moving world, businesses need to analyze data quickly and take meaningful action. Many of our customers embrace this concept to become data-driven organizations.

Data-driven organizations treat data as an asset and use it to improve their insights and make better decisions. They unleash the power of data by using secure systems to collect, store, and process data and share it with people in their organization. Some even offer their data and analytics as a service, to their customers, partners, and external parties to create new revenue streams.

All stakeholders want to share and consume the same accurate data as a single source of truth. They want to be able to query live views of the data concurrently while experiencing no performance degradation and access the right information exactly when it’s needed.

Amazon Redshift, the first data warehouse built for the cloud, has become popular as the data warehouse component of many of our customers’ data architecture.

Amazon Redshift users can share data with users in an AWS account, but to share and collaborate on data with other AWS accounts, they needed to extract it from one system and load it into another.

There is a lot of manual work involved in building and maintaining the different extract, transform, and load jobs required to make this work. As your data sharing scales and more stakeholders need data, the complexity increases. As a result, it can become hard to maintain the monitoring, compliance, and security best practices required to keep your data safe.

This way of sharing does not provide complete and up-to-date views of the data, either, because the manual processes introduce delays and data inconsistencies that result in stale data, lower-quality business results, and slow responses to customers.

That’s why we created cross-account data sharing for Amazon Redshift.

Introducing Cross-Account Data Sharing for Amazon Redshift
This new feature gives you a simple and secure way to share fresh, complete, and consistent data in your Amazon Redshift data warehouse with any number of stakeholders across AWS accounts. It makes it possible for you to share data across organizations and collaborate with external parties while meeting compliance and security requirements.

Amazon Redshift offers comprehensive security controls and auditing capabilities using IAM integration, system tables and AWS CloudTrail. These allow customers to control and monitor data sharing permissions and usage across consumers and revoke access instantly when necessary.

You can share data at many levels, including databases, schemas, tables, views, columns, and user-defined functions, to provide fine-grained access controls tailored to users and businesses who need access to Amazon Redshift data.

Let’s take a look at how cross-account data sharing works.

Sharing Data Across Two Accounts

Cross-account data sharing is a two-step process. First, a producer cluster administrator creates a datashare, adds objects, and gives access to the consumer account. Second, the producer account administrator authorizes sharing data for the specified consumer. You can do this from the Amazon Redshift console.

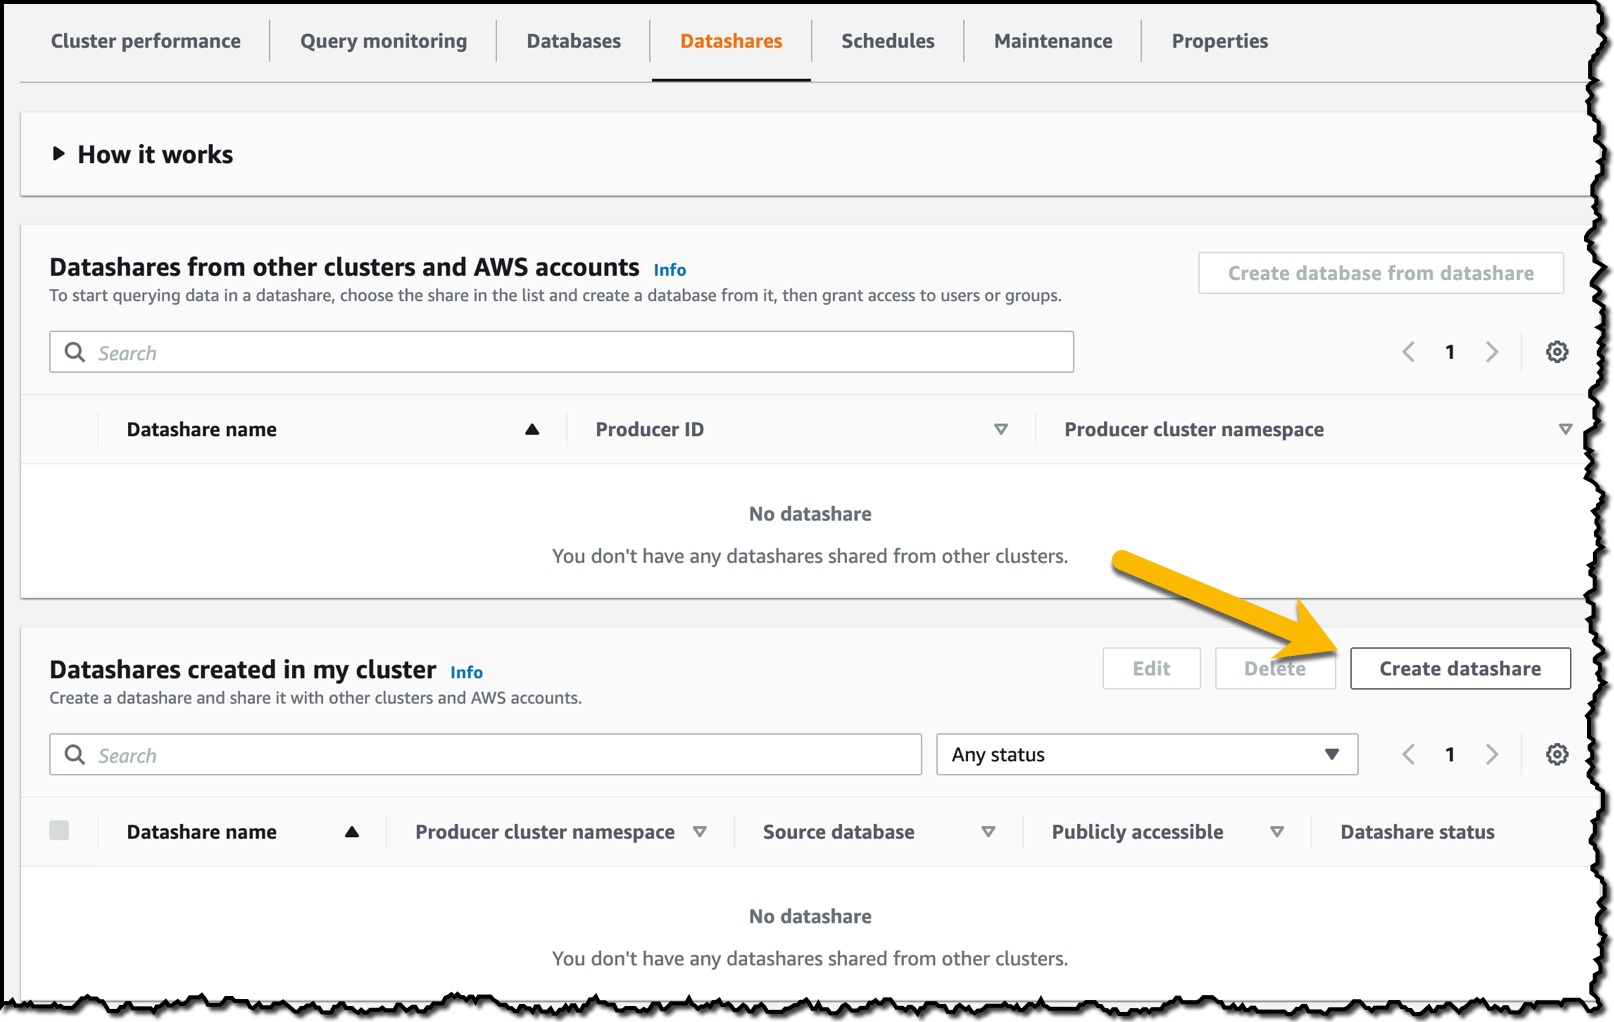
To get started, in the Amazon Redshift console, I create an Amazon Redshift cluster and then import some sample data. When the cluster is available, I navigate to the cluster details page, choose the Datashares tab, and then choose Create datashare.


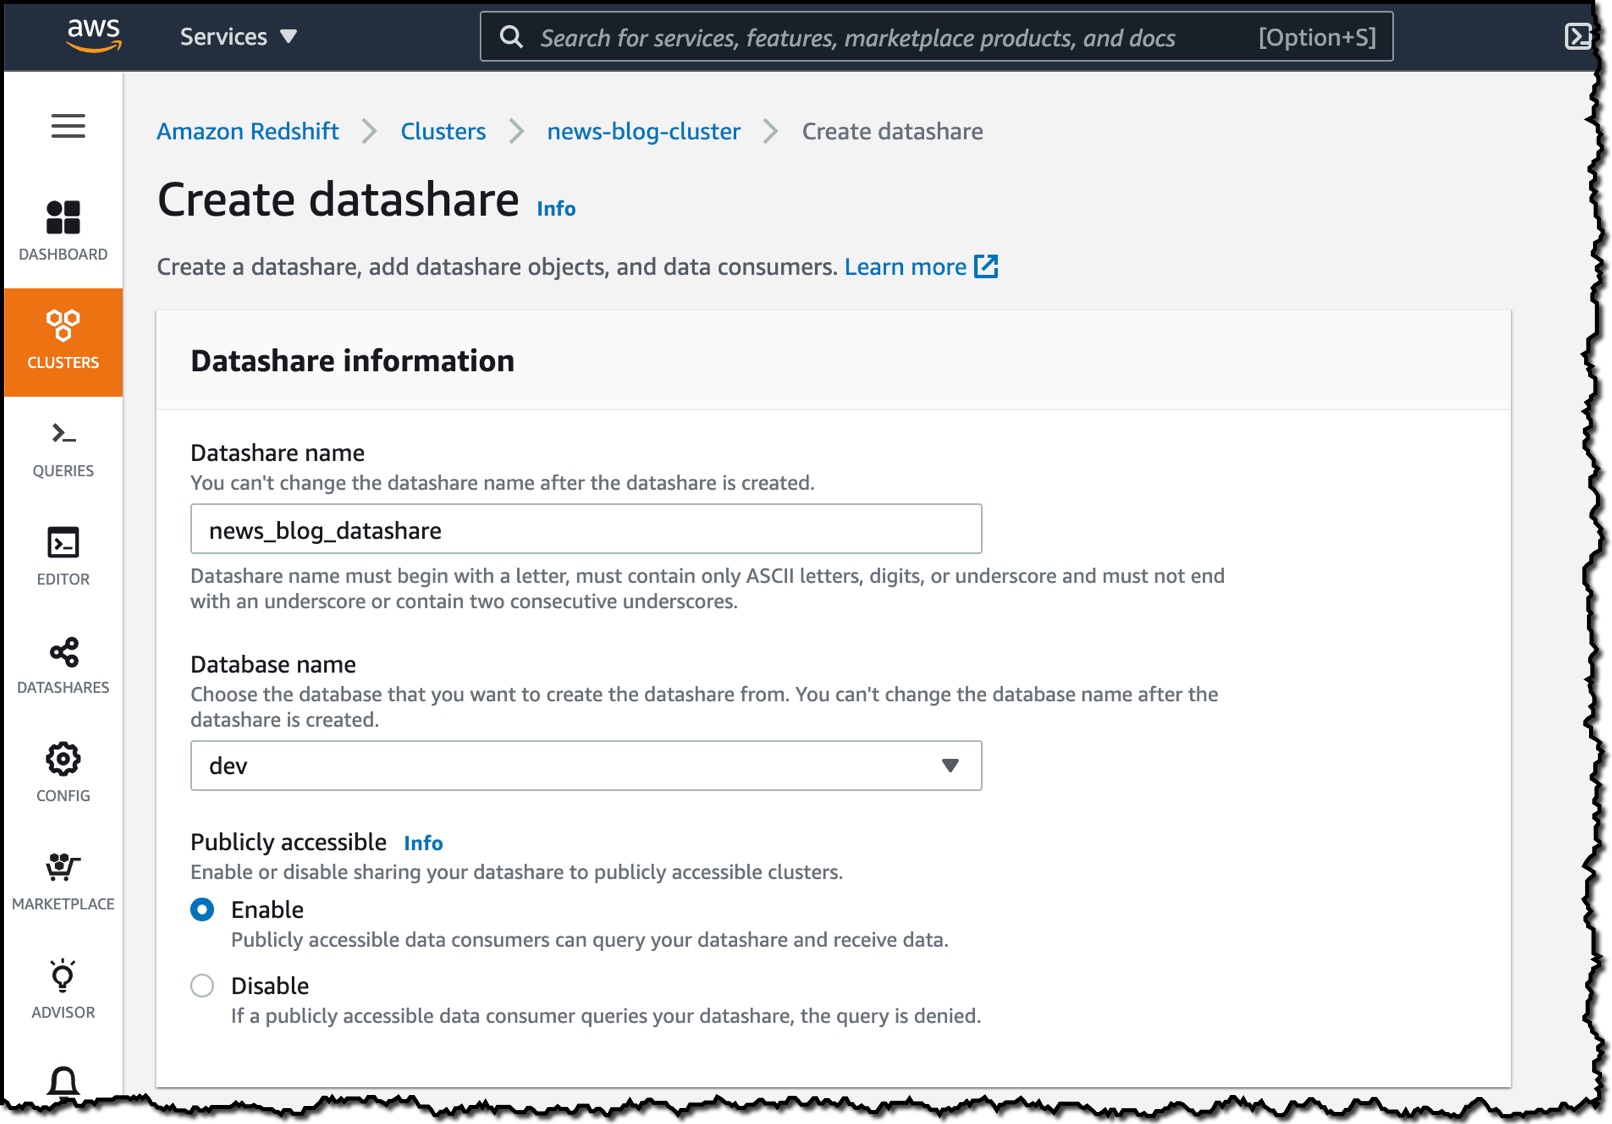
On the Create datashare page, I enter a datashare name and then choose a database. Under Publicly accessible, I choose Enable because I want the datashare to be shared with publicly accessible clusters.

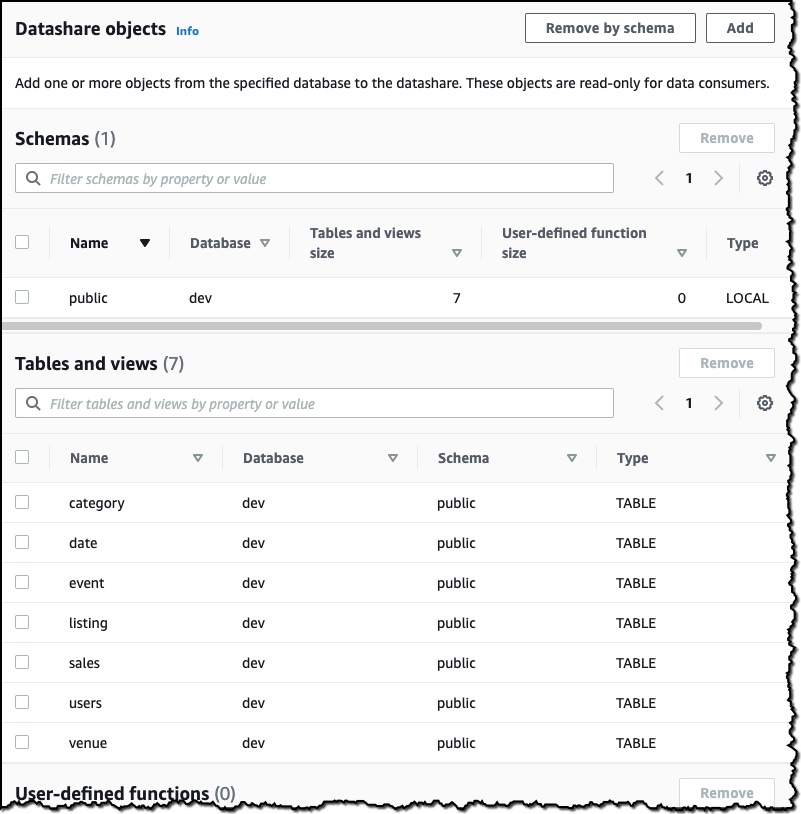
I then choose the objects from the database I want to include in the datashare. I have granular control of what I choose to share with others. For simplicity, I will share all the tables. In practice, though, you might choose one or more tables, views, or user-defined functions.

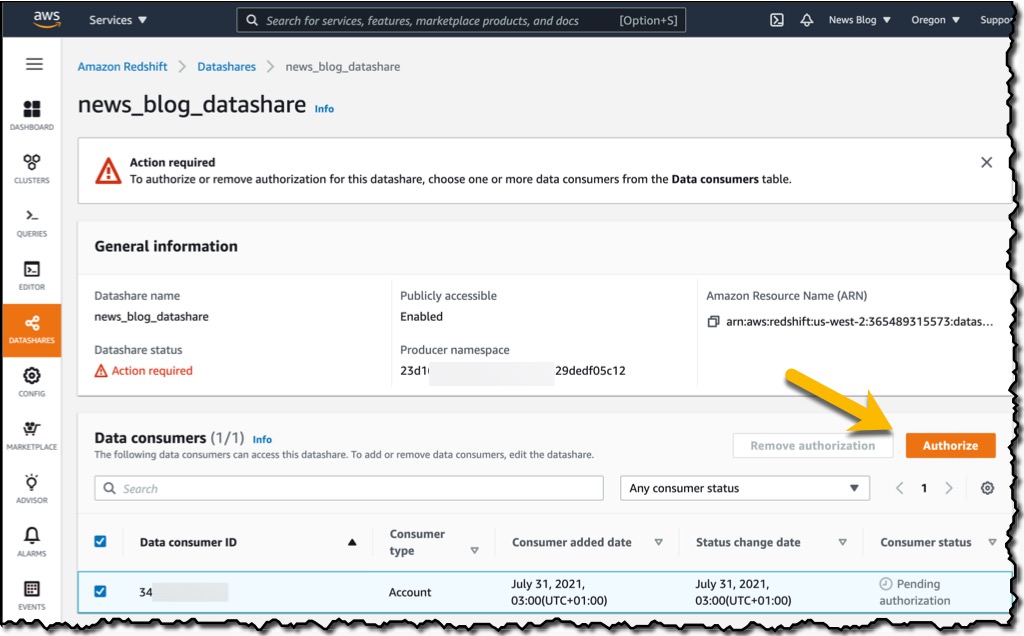
The last thing I need to do is add an AWS account to the datashare. I add my second AWS account ID and then choose Create datashare.

To authorize the data consumer I just created, in the Datashares section of the console, I choose Authorize. The Consumer status will change from Pending authorization to Authorized. Now that the datashare is set up, I’ll switch to my secondary account to show you how to consume the datashare in the consumer AWS account. It’s important to note that I need to use the same Region in the secondary account, as cross-account data sharing does not work across Regions.

Similar to the producer, there is a process for consuming data. First, you need to associate the data share with one or more clusters in the consumer account. You can also associate the data share to the entire consumer account so that the current and future clusters in the consumer account get access to the share.

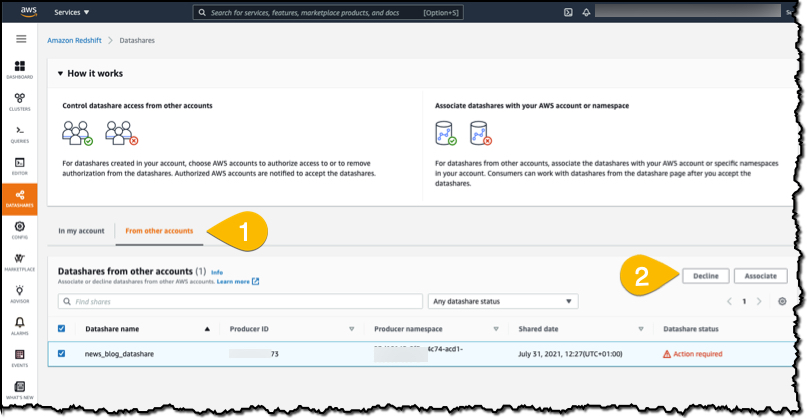
I sign in to my secondary account and go to the Datashares section of the console.  I choose the From other accounts tab and then select the news_blog_datashare that I shared from the producer AWS account. I then choose Associate to associate the datashare with a cluster in my account.

On the details page of the cluster, I choose Create database from datashare and then enter a name for my new database.

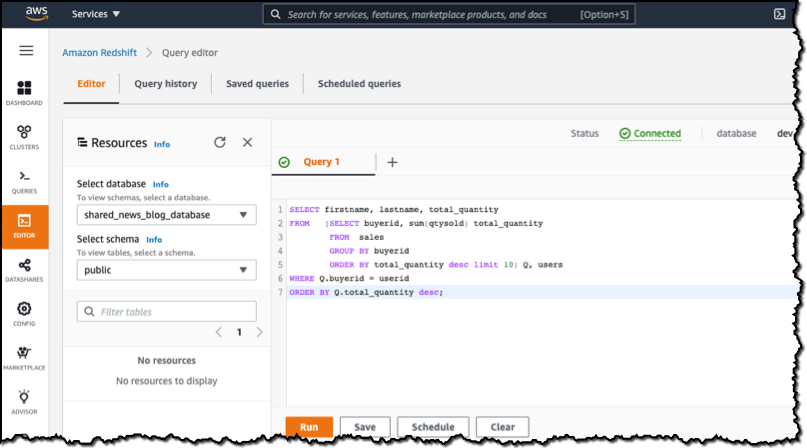
In the query editor, I select my database and run queries against all the objects that have been made available as part of the datashare.

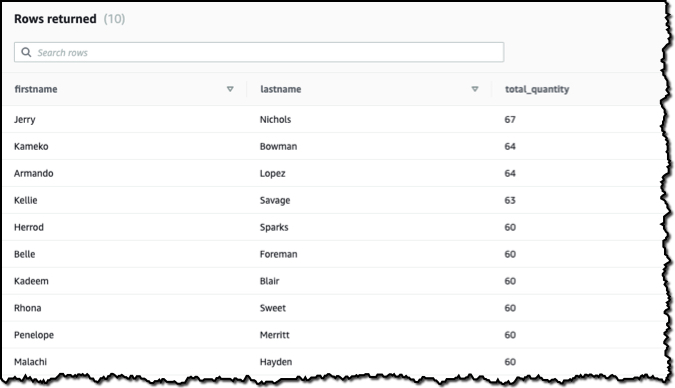
When I choose Run, data is returned from the query. What’s important to remember is that this is a live view of the data. Any changes in the producer database will be reflected in my queries. No copying or manual transfers are required.

Things to Know

Here are a couple of interesting facts about cross-account data sharing:

Security – All of the permissions required for authorization and association are managed with AWS Identity and Access Management (IAM), so you can create IAM policies to control which operations each user can complete. For security considerations, see Controlling access for cross-account datashares.

Encryption – Both the producer and consumer clusters must be encrypted and in the same AWS Region.

Regions – Cross-account data sharing is available for all Amazon Redshift RA3 node types in US East (N. Virginia), US East (Ohio), US West (N. California), US West (Oregon), Asia Pacific (Mumbai), Asia Pacific (Seoul), Asia Pacific (Singapore), Asia Pacific (Sydney), Asia Pacific (Tokyo), Canada (Central), Europe (Frankfurt), Europe (Ireland), Europe (London), Europe (Paris), Europe (Stockholm), and South America (São Paulo).

Pricing – Cross-account data sharing is available across clusters that are in the same Region. There is no cost to share data. Customers just pay for the Redshift clusters that participate in sharing.

Try Cross-Account Data Sharing for Amazon Redshift today.

This new feature is available right now so why not create a cluster and take cross-account data sharing for a spin? For information about how to get started, see Sharing data across AWS accounts. Don’t forget to let me know how you get on.

Happy sharing!

— Martin

New – AWS BugBust: It’s Game Over for Bugs

Post Syndicated from Martin Beeby original https://aws.amazon.com/blogs/aws/new-aws-bugbust-its-game-over-for-bugs/

Today, we are launching AWS BugBust, the world’s first global challenge to fix one million bugs and reduce technical debt by over $100 million.

You might have participated in a bug bash before. Many of the software companies where I’ve worked (including Amazon) run them in the weeks before launching a new product or service. AWS BugBust takes the concept of a bug bash to a new level.

AWS BugBust allows you to create and manage private events that will transform and gamify the process of finding and fixing bugs in your software. It includes automated code analysis, built-in leaderboards, custom challenges, and rewards. AWS BugBust fosters team building and introduces some friendly competition into improving code quality and application performance. What’s more, your developers can take part in the world’s largest code challenge, win fantastic prizes, and receive kudos from their peers.

Behind the scenes, AWS BugBust uses Amazon CodeGuru Reviewer and Amazon CodeGuru Profiler. These developer tools use machine learning and automated reasoning to find bugs in your applications. These bugs are then available for your developers to claim and fix. The more bugs a developer fixes, the more points the developer earns. A traditional bug bash requires developers to find and fix bugs manually. With AWS BugBust, developers get a list of bugs before the event begins so they can spend the entire event focused on fixing them.

Fix Your Bugs and Earn Points
As a developer, each time you fix a bug in a private event, points are allocated and added to the global leaderboard. Don’t worry: Only your handle (profile name) and points are displayed on the global leaderboard. Nobody can see your code or details about the bugs that you’ve fixed.

As developers reach significant individual milestones, they receive badges and collect exclusive prizes from AWS, for example, if they achieve 100 points they will win an AWS BugBust T-shirt and if they earn 2,000 points they will win an AWS BugBust Varsity Jacket. In addition, on the 30th of September 2021, the top 10 developers on the global leaderboard will receive a ticket to AWS re:Invent.

Create an Event
To show you how the challenge works, I’ll create a private AWS BugBust event. In the CodeGuru console, I choose Create BugBust event.

Under Step 1- Rules and scoring, I see how many points are awarded for each type of bug fix. Profiling groups are used to determine performance improvements after the players submit their improved solutions.

In Step 2, I sign in to my player account. In Step 3, I add event details like name, description, and start and end time.

I also enter details about the first-, second-, and third-place prizes. This information will be displayed to players when they join the event.

After I have reviewed the details and created the event, my event dashboard displays essential information, I can also import work items and invite players.

I select the Import work items button. This takes me to the Import work items screen where I choose to Import bugs from CodeGuru Reviewer and profiling groups from CodeGuru Profiler. I choose a repository analysis from my account and AWS BugBust imports all the identified bugs for players to claim and fix. I also choose several profiling groups that will be used by AWS BugBust.

Now that my event is ready, I can invite players. Players can now sign into a player portal using their player accounts and start claiming and fixing bugs.

Things to Know
Amazon CodeGuru currently supports Python and Java. To compete in the global challenge, your project must be written in one of these languages.

Pricing
When you create your first AWS BugBust event, all costs incurred by the underlying usage of Amazon CodeGuru Reviewer and Amazon CodeGuru Profiler are free of charge for 30 days per AWS account. This 30 day free period applies even if you have already utilized the free tiers for Amazon CodeGuru Reviewer and Amazon CodeGuru Profiler. You can create multiple AWS BugBust events within the 30-day free trial period. After the 30-day free trial expires, you will be charged for Amazon CodeGuru Reviewer and Amazon CodeGuru Profiler based on your usage in the challenge. See the Amazon CodeGuru Pricing page for details.

Available Today
Starting today, you can create AWS BugBust events in the Amazon CodeGuru console in the US East (N. Virginia) Region. Start planning your AWS BugBust today.

— Martin

File Access Auditing Is Now Available for Amazon FSx for Windows File Server

Post Syndicated from Martin Beeby original https://aws.amazon.com/blogs/aws/file-access-auditing-is-now-available-for-amazon-fsx-for-windows-file-server/

Amazon FSx for Windows File Server provides fully managed file storage that is accessible over the industry-standard Server Message Block (SMB) protocol. It is built on Windows Server and offers a rich set of enterprise storage capabilities with the scalability, reliability, and low cost that you have come to expect from AWS.

In addition to key features such as user quotas, end-user file restore, and Microsoft Active Directory integration, the team has now added support for the auditing of end-user access on files, folders, and file shares using Windows event logs.

Introducing File Access Auditing
File access auditing allows you to send logs to a rich set of other AWS services so that you can query, process, and store your logs. By using file access auditing, enterprise storage administrators and compliance auditors can meet security and compliance requirements while eliminating the need to manage storage as logs grow over time. File access auditing will be particularly important to regulated customers such as those in the financial services and healthcare industries.

You can choose a destination for publishing audit events in the Windows event log format. The destination options are logging to Amazon CloudWatch Logs or streaming to Amazon Kinesis Data Firehose. From there, you can view and query logs in CloudWatch Logs, archive logs to Amazon Simple Storage Service (Amazon S3), or use AWS Partner solutions, such as Splunk and Datadog, to monitor your logs.

You can also set up Lambda functions that are triggered by new audit events. For example, you can configure AWS Lambda and Amazon CloudWatch alarms to send a notification to data security personnel when unauthorized access occurs.

Using File Access Auditing on a New File System
To enable file access auditing on a new file system, I head over to the Amazon FSx console and choose Create file system. On the Select file system type page, I choose Amazon FSx for Windows File Server, and then configure other settings for the file system. To use the auditing feature, Throughput capacity must be at least 32 MB/s, as shown here:

Screenshot of creating a file system

In Auditing, I see that File access auditing is turned on by default. In Advanced, for Choose an event log destination, I can change the destination for publishing user access events. I choose CloudWatch Logs and then choose a CloudWatch Logs log group in my account.

Screenshot of the Auditing options

After my file system has been created, I launch a new Amazon Elastic Compute Cloud (Amazon EC2) Instance and join it to my Active directory. When the instance is available, I connect to it using a remote desktop client. I open File Explorer and follow the documentation to map my new file system.

Screenshot of the file system once mapped

I open the file system in Windows Explorer and then right-click and select Properties. I choose Security, Advanced, and Auditing and then choose Add to add a new auditing entry. On the page for the auditing entry, in Principal, I click Select a principal. This is who I will be auditing. I choose Everyone. Next, for Type, I select the type of auditing I want (Success/Fail/All). Under Basic permissions, I select Full control for the permissions I want to audit for.

Screenshot of auditing options on a file share

Now that auditing is set up, I create some folders and create and modify some files. All this activity is now being audited, and the logs are being sent to CloudWatch Logs.

Screenshot of a file share, where some files and folders have been created

In the CloudWatch Logs Insights console, I can start to query the audit logs. Below you can see how I ran a simple query that finds all the logs associated with a specific file.

Screenshot of AWS CloudWatch Logs Insights

Continued Momentum
File access auditing is one of many features the team has launched in recent years, including: Self-Managed Directories, Native Multi-AZ File Systems, Support for SQL Server, Fine-Grained File Restoration, On-Premises Access, a Remote Management CLI, Data Deduplication, Programmatic File Share Configuration, Enforcement of In-Transit Encryption, Storage Size and Throughput Capacity Scaling, and Storage Quotas.

Pricing
File access auditing is free on Amazon FSx for Windows File Server. Standard pricing applies for the use of Amazon CloudWatch Logs, Amazon Kinesis Data Firehose, any downstream AWS services such as Amazon Redshift, S3, or AWS Lambda, and any AWS Partner solutions like Splunk and Datadog.

Available Today
File access auditing is available today for all new file systems in all AWS Regions where Amazon FSx for Windows File Server is available. Check our documentation for more details.

— Martin

Amplify Flutter is Now Generally Available: Build Beautiful Cross-Platform Apps

Post Syndicated from Martin Beeby original https://aws.amazon.com/blogs/aws/amplify-flutter-is-now-generally-available-build-beautiful-cross-platform-apps/

AWS Amplify is a set of tools and services for building secure, scalable mobile and web applications. Currently, Amplify supports iOS, Android, and JavaScript (web and React Native) and is the quickest and easiest way to build applications powered by Amazon Web Services (AWS).

Flutter is Google’s UI toolkit for building natively compiled mobile, web, and desktop applications from a single code base and is one of the fastest-growing mobile frameworks.

Amplify Flutter brings together AWS Amplify and Flutter, and we designed it for customers who have invested in the Flutter ecosystem and now want to take advantage of the power of AWS.

In August 2020, we launched the developer preview of Amplify Flutter and asked for feedback. We were delighted with the response. After months of refining the service, today we are happy to announce the general availability of Amplify Flutter.

New Amplify Flutter Features in GA
The GA release makes it easier to build powerful Flutter apps with the addition of three new capabilities:

First, we recently added a GraphQL API backed by AWS AppSync as well as REST APIs and handlers using Amazon API Gateway and AWS Lambda.

Second, Amplify DataStore provides a programming model for leveraging shared and distributed data without writing additional code for offline and online scenarios, which makes working with distributed, cross-user data just as simple as working with local-only data.

Finally, we have Hosted UI which is a great way to implement authentication, and works with Amazon Cognito and other social identity providers such as Facebook, Google and Amazon. Hosted UI is a customizable OAuth 2.0 flow that allows you to launch a login screen without embedding the SDK for Cognito or a social provider in your application.

Digging Deeper Into Amplify DataStore
I have been building an app over the past two weeks using Amplify Flutter, and my favorite feature is Amplify DataStore, primarily because it has saved me so much time.

Working with the REST and GraphQL APIs is great in Amplify. However, when I create a mobile app, I’m often thinking about what happens when the mobile device has intermittent connectivity and can’t connect to the API endpoints. Storing data locally and syncing back to the cloud can become quite complicated. Amplify DataStore solves that problem by providing a persistent on-device data store that handles the offline or online scenario.

When I started developing my app, I used DataStore as a stand-alone local database. However, its power became apparent to me when I connected it to a cloud backend. DataStore uses my AWS AppSync API to sync data when network connectivity is available. If the app is offline, it stores it locally, ready for when a connection becomes available.

Amplify DataStore automatically versions data and implements conflict detection and resolution in the cloud using AppSync. The toolchain also generates object definitions for Dart based on the GraphQL schema that I provide.

Writing to Amplify DataStore
Writing to the DataStore is straightforward. The documentation site shows an example that you can try yourself that uses a schema from a blog site.

Post newPost = Post(
    title: 'New Post being saved', rating: 15, status: PostStatus.DRAFT);
await Amplify.DataStore.save(newPost);

Reading from Amplify DataStore
To read from the DataStore, you can query for all records of a given model type.

try {
   List<Post> posts = await Amplify.DataStore.query(Post.classType);
 } catch (e) {
   print("Query failed: " + e);
 }

Synchronization with Amplify DataStore
If you enable data synchronization, there can be different versions of an object across clients, and multiple clients may have updated their copies of an object. DataStore will converge different object versions by applying conflict detection and resolution strategies. The default resolution is called Auto Merge, but other strategies include optimistic concurrency control and custom Lambda functions.

Additional Amplify Flutter Features
Amplify Flutter allows you to work with AWS in three additional ways:

  • Authentication. Amplify Flutter provides an interface for authenticating a user and enables use cases like Sign-Up, Sign-In, and Multi-Factor Authentication. Behind the scenes, it provides the necessary authorization to the other Amplify categories. It comes with built-in support for Cognito user pools and identity pools.
  • Storage. Amplify Flutter provides an interface for managing user content for your app in public, protected, or private storage buckets. It enables use cases like upload, download, and deleting objects and provides built-in support for Amazon Simple Storage Service (S3) by default.
  • Analytics. Amplify Flutter enables you to collect tracking data for authenticated or unauthenticated users in Amazon Pinpoint. You can easily record events and extend the default functionality for custom metrics or attributes as needed.

Available Now
Amplify Flutter is now available in GA in all regions that support AWS Amplify. There is no additional cost for using Amplify Flutter; you only pay for the backend services your applications use above the free tier; check out the pricing page for more details.

Visit the Amplify Flutter documentation to get started and learn more. Happy coding.

— Martin

AWS PrivateLink for Amazon S3 is Now Generally Available

Post Syndicated from Martin Beeby original https://aws.amazon.com/blogs/aws/aws-privatelink-for-amazon-s3-now-available/

At AWS re:Invent, we pre-announced that AWS PrivateLink for Amazon S3 was coming soon, and soon has arrived — this new feature is now generally available. AWS PrivateLink provides private connectivity between Amazon Simple Storage Service (S3) and on-premises resources using private IPs from your virtual network.

Way back in 2015, S3 was the first service to add a VPC endpoint; these endpoints provide a secure connection to S3 that does not require a gateway or NAT instances. Our customers welcomed this new flexibility but also told us they needed to access S3 from on-premises applications privately over secure connections provided by AWS Direct Connect or AWS VPN.

Our customers are very resourceful and by setting up proxy servers with private IP addresses in their Amazon Virtual Private Clouds and using gateway endpoints for S3, they found a way to solve this problem. While this solution works, proxy servers typically constrain performance, add additional points of failure, and increase operational complexity.

We looked at how we could solve this problem for our customers without these drawbacks and PrivateLink for S3 is the result.

With this feature you can now access S3 directly as a private endpoint within your secure, virtual network using a new interface VPC endpoint in your Virtual Private Cloud. This extends the functionality of existing gateway endpoints by enabling you to access S3 using private IP addresses. API requests and HTTPS requests to S3 from your on-premises applications are automatically directed through interface endpoints, which connect to S3 securely and privately through PrivateLink.

Interface endpoints simplify your network architecture when connecting to S3 from on-premises applications by eliminating the need to configure firewall rules or an internet gateway. You can also gain additional visibility into network traffic with the ability to capture and monitor flow logs in your VPC. Additionally, you can set security groups and access control policies on your interface endpoints.

Available Now
PrivateLink for S3 is available in all AWS Regions. AWS PrivateLink is available at a low per-GB charge for data processed and a low hourly charge for interface VPC endpoints. We hope you enjoy using this new feature and look forward to receiving your feedback. To learn more, check out the PrivateLink for S3 documentation.

Try out AWS PrivateLink for Amazon S3 today, and happy storing.

— Martin

New – Multiple Private Marketplace Catalogs

Post Syndicated from Martin Beeby original https://aws.amazon.com/blogs/aws/new-multiple-private-marketplace-catalogs/

We launched AWS Marketplace in 2014, and it allows customers to find, buy, and immediately start using cloud-based applications developed by independent software vendors (ISVs). In 2018, we added the ability to add a Private Marketplace where you can curate a list of approved products your users can purchase from AWS Marketplace. Today we are adding a new feature so that you can create multiple Private Marketplace catalogs within your AWS Organizations. Each Private Marketplace can contain a different set of products to provide a tailored experience for particular groups of accounts.

Customers with diverse sets of users need to scale their governance to meet business needs. For example, a large enterprise with subsidiaries in different industries has varying software needs and policies for each subsidiary. IT administrators struggle with scaling their procurement process to address these differing needs across their organization and often revert to one procurement policy to govern their entire org. While there are exceptions, companies depend on time-consuming, manual processes to ensure the correct products are approved and procured. As a result, customers struggle to scale their procurement and governance process to meet their organization’s speed and agility demands.

After listening to customers explain these sorts of issues, we set about developing a solution to help, and the concept of multiple Private Marketplace catalogs was born. We call these Private Marketplace experiences. They represent the experience that your users will see when they browse their AWS Marketplace. Each experience is a collection of approved AWS Marketplace products that you, as an administrator, select and curate. You can add any of the 8000-plus products from AWS Marketplace to an experience and customize the look and feel by changing the Private Marketplace logo, wording, and color.

In the Private Marketplace admin portal, within the AWS Marketplace interface, you can create an Account group, which is essentially a way of grouping together a number of AWS accounts. You can then associate an experience with an Account group, enabling you to give different users distinct experiences. This association allows you to govern the use of third-party software subscriptions and ensure they adhere to your internal procurement policies.

To give you a flavor of this feature, I will create a new Private Marketplace experience.

How to Create a Private Marketplace Experience
I head over to the Private Marketplace interface and select the Experiences link; this lists the default experience called Private Marketplace Experience. I then press the Create experience button.

I give the experience a name and a description and click the Create experience button.

If I drill into the details for my newly created experience, I can then start to add products to my catalog. I use the search in the All AWS Marketplace products section and look for Tableau. I find the Tableau Server product and select it. I then click the Add button which adds the product to my catalog.

Screenshot, adding a product

To associate this experience with a set of AWS accounts, I click on the Create association button; this allows me to create a new Account group.

I give my account group the title Business Intelligence Group and add a description. I then associate AWS accounts that I want to be part of this group. Finally, I associate this group with the Business Intelligence Team experience I created earlier and finally click Create account group.

I now go to the settings for the experience and change the switch so that the experience is now live. On this screen I can also customize the look and feel of the Private Marketplace by uploading a logo, changing the color, and adding custom wording.

Now, if I log in and browse the AWS Marketplace using an account that is in the Account group I just created, I will see the Private Marketplace experience rather than the regular AWS Marketplace.

Available now
The ability to create multiple Private Marketplace catalogs is available now in all regions that support AWS Marketplace, and you can start using the feature directly from the Private Marketplace interface. Additionally, you can use the accompanying set of APIs so that you can integrate with existing approval or ticketing systems to simplify management across catalogs.

Visit the Private Marketplace page to get started and learn more. Happy curating.

— Martin

Amazon Lex Introduces an Enhanced Console Experience and New V2 APIs

Post Syndicated from Martin Beeby original https://aws.amazon.com/blogs/aws/amazon-lex-enhanced-console-experience/

Today, the Amazon Lex team has released a new console experience that makes it easier to build, deploy, and manage conversational experiences. Along with the new console, we have also introduced new V2 APIs, including continuous streaming capability. These improvements allow you to reach new audiences, have more natural conversations, and develop and iterate faster.

The new Lex console and V2 APIs make it easier to build and manage bots focusing on three main benefits. First, you can add a new language to a bot at any time and manage all the languages through the lifecycle of design, test, and deployment as a single resource. The new console experience allows you to quickly move between different languages to compare and refine your conversations. I’ll demonstrate later how easy it was to add French to my English bot.

Second, V2 APIs simplify versioning. The new Lex console and V2 APIs provide a simple information architecture where the bot intents and slot types are scoped to a specific language. Versioning is performed at the bot level so that resources such as intents and slot types do not have to be versioned individually. All resources within the bot (language, intents, and slot types) are archived as part of the bot version creation. This new way of working makes it easier to manage bots.

Lastly, you have additional builder productivity tools and capabilities to give you more flexibility and control of your bot design process. You can now save partially completed work as you develop different bot elements as you script, test and tune your configuration. This provides you with more flexibility as you iterate through the bot development. For example, you can save a slot that refers to a deleted slot type. In addition to saving partially completed work, you can quickly navigate across the configuration without getting lost. The new Conversation flow capability allows you to maintain your orientation as you move across the different intents and slot types.

In addition to the enhanced console and APIs, we are providing a new streaming conversation API. Natural conversations are punctuated with pauses and interruptions. For example, a customer may ask to pause the conversation or hold the line while looking up the necessary information before answering a question to retrieve credit card details when providing bill payments. With streaming conversation APIs, you can pause a conversation and handle interruptions directly as you configure the bot. Overall, the design and implementation of the conversation is simplified and easy to manage. The bot builder can quickly enhance the conversational capability of virtual contact center agents or smart assistants.

Let’s create a new bot and explore how some of Lex’s new console and streaming API features provide an improved bot building experience.

Building a bot
I head over to the new V2 Lex console and click on Create bot to start things off.

I select that I want to Start with an example and select the MakeAppointment example.

Over the years, I have spoken at many conferences, so I now offer to review talks that other community members are producing. Since these speakers are often in different time zones, it can be complicated to organize the various appointments for the different types of reviews that I offer. So I have decided to build a bot to streamline the process. I give my bot the name TalkReview and provide a description. I also select Create a role with basic Amazon Lex permissions and use this as my runtime role.

I must add at least one language to my bot, so I start with English (GB). I also select the text-to-speech voice that I want to use should my bot require voice interaction rather than just text.

During the creation, there is a new button that allows me to Add another language. I click on this to add French (FR) to my bot. You can add languages during creation as I am doing here, or you can add additional languages later on as your bot becomes more popular and needs to work with new audiences.

I can now start defining intents for my bot, and I can begin the iterative process of building and testing my bot. I won’t go into all of the details of how to create a bot or show you all of the intents I added, as we have better tutorials that can show you that step-by-step, but I will point out a few new features that make this new enhanced console really compelling.

The new Conversation flow provides you with a visual flow of the conversation, and you can see how the sample utterances you provide and how your conversation might work in the real world. I love this feature because you can click on the various elements, and it will take you to where you can make changes. For example, I can click on the prompt What type of review would you like to schedule and I am taken to the place where I can edit this prompt.

The new console has a very well thought-out approach to versioning a bot. At anytime, on the Bot versions screen, I can click Create version, and it will take a snapshot of the state of the bot’s current configuration. I can then associate that with an alias. For example, in my application, I have an alias called Production. This Production alias is associated with Version 1. Still, at any time, I could switch it to use a different version or even roll back to a previous version if I discover problems.

The testing experience is now very streamlined. Once I have built the bot, I can click the test button on the bottom right hand of the screen and start speaking to the bot and testing the experience. You can also expand the Inspect window, which gives you details about the conversations state, and you can also explore the raw JSON inputs and outputs.

Things to know
Here are a couple of important things to keep in mind when you use the enhanced console

  • Integration with Amazon Connect – Currently, bots built in the new console cannot be integrated with Amazon Connect contact flows. We plan to provide this integration as part of the near-term roadmap. You can use the current console and existing APIs to create and integrate bots with Amazon Connect.
  • Pricing – You only pay for what you use. The charges remain the same for existing audio and text APIs, renamed as RecognizeUtterance and RecognizeText. For the new Streaming capabilities, please refer to the pricing detail here.
  • All existing APIs and bots will continue to be supported. The newly announced features are only available in the new console and V2 APIs.

Go Build
Lex enhanced console is available now, and you can start using it today. The enhanced experience and V2 APIs are available in all existing regions and support all current languages. So, please give this console a try and let us know what you think. To learn more, check out the documentation for the console and the streaming API.

Happy Building!
— Martin

Amazon EKS Distro: The Kubernetes Distribution Used by Amazon EKS

Post Syndicated from Martin Beeby original https://aws.amazon.com/blogs/aws/amazon-eks-distro-the-kubernetes-distribution-used-by-amazon-eks/

Our customers have told us that they want to focus on building innovative solutions for their customers, and focus less on the heavy lifting of managing Kubernetes infrastructure. That is why Amazon Elastic Kubernetes Service (EKS) has been so popular; we remove the burden of managing Kubernetes while our customers glean the benefits.

However, not all customers choose to use Amazon EKS. For example, they may have existing infrastructure investments, data residency requirements or compliance obligations that lead them to operate Kubernetes on-premises. Customers in these situations tell us that they spend a lot of effort to track updates, figure out compatible versions of Kubernetes and the complicated matrix of underlying components, test them for compatibility, and keep pace with the Kubernetes release cadence, which can be as frequent as every three to four months. If customers are not able to maintain pace for testing and qualifying new versions, they risk breaking changes, version compatibility issues, and running unsupported versions of Kubernetes lacking critical security patches.

We have learned a lot while providing Amazon EKS at AWS and have developed a deep understanding of how to deliver Kubernetes with operational security, stability, and reliability. Today we are sharing Amazon EKS Distro, which we built using that knowledge.

EKS Distro is a distribution of the same version of Kubernetes deployed by Amazon EKS, which you can use to manually create your own Kubernetes clusters anywhere you choose. EKS Distro provides the installable builds and code of open source Kubernetes used by Amazon EKS, including the dependencies and AWS-maintained patches. Using a choice of cluster creation and management tooling, you can create EKS Distro clusters in AWS on Amazon Elastic Compute Cloud (EC2), in other clouds, and on your on-premises hardware.

EKS Distro includes upstream open source Kubernetes components and third-party tools including configuration database, network, and storage components necessary for cluster creation. They include Kubernetes control plane components (kube-controller-manager, etcd, and CoreDNS) and Kubernetes worker node components (kubelet, CNI plugins, CSI Sidecar images, Metrics Server and AWS-IAM-authenticator).

Building a Cluster
The EKS Distro repository has everything you need to build and create Kubernetes clusters. The repository contains the raw documentation for EKS Distro, and it has been built and published at https://distro.eks.amazonaws.com.

To create a new cluster, I follow this section of the documentation. The guide explains how I can build all of the parts and ultimately deploy a cluster to some EC2 instances on AWS using the open source tool kOps. EKS Distro works with many other tools besides kOps. You can find the details in the partner section of the documentation, and many partners have released blogs today that explain how you can deploy using their tooling.

The guide explains that before I can build my cluster, I need to get several container images. I can get them from the EKS Distro Container repository, download them as a tarball, or build them from scratch. I opt to build my containers from scratch and follow the Build Guide. An hour later, I have managed to create twenty containers and have pushed them into Amazon Elastic Container Registry.

The instructions detail several prerequisites that are required by both the build and deploy stages. I follow the guide and install all of the tools suggested.

Next, as per the guide, I locate the kops.sh script in the development folder of the EKS Distro repository. After running the script, it prompts me to enter a Fully Qualified Domain Name (FQDN). I provide newsblog.thebeebs.net.

This script does several things, including creating an S3 bucket in my account to store artifacts required by kOps. Also, it creates a file called newsblog.thebeebs.net.yaml. I edit this file and replace the container Image URLs with ones that point to my images in Elastic Container Registry.

I continue to follow the guide, which now instructs me to run some kOps commands to create my cluster. These commands use the newsblog.thebeebs.net.yaml file, which was an output of the previous step.

CLUSTER_NAME=newsblog.thebeebs.net
kops create -f ./$CLUSTER_NAME.yaml
kops create secret --name $CLUSTER_NAME sshpublickey admin -i ~/.ssh/id_rsa.pub
kops update cluster $CLUSTER_NAME --yes
kops validate cluster --wait 10m
cat << EOF > aws-iam-authenticator.yaml
apiVersion: v1
kind: ConfigMap
metadata:
  name: aws-iam-authenticator
  namespace: kube-system
  labels:
    k8s-app: aws-iam-authenticator
data:
  config.yaml: |
    clusterID: $CLUSTER_NAME
EOF

One of these commands creates a file called aws-iam-authenticator.yaml. I will apply this file to my kubernetes cluster so that it works correctly with the aws-iam-authenticator.

kubectl apply -f aws-iam-authenticator.yaml

I can now verify that my Kubernetes cluster is using the EKS Distro images by using kubectl to list all of the namespaces.

kubectl get po --all-namespaces -o json | jq -r .items[].spec.containers[].image | sort

Lastly, I delete my cluster by using kOps and issuing a delete command.

kops delete -f ./newsblog.thebeebs.net.yaml --yes

Updates
New versions of EKS Distro will be released soon after we make releases to Amazon EKS. The source code, open source tools, and settings are provided for reproducible builds so you can be assured EKS Distro matches what is deployed by Amazon EKS.

Things to Know
EKS Distro supports the same versions of Kubernetes and point releases that Amazon EKS uses. EKS Distro provides the same upstream versions of Kubernetes and dependencies that operating system vendors have tested and confirmed work with Kubernetes. This means that EKS Distro already works with common operating systems, such as CentOS, Canonical Ubuntu, Red Hat Enterprise Linux, Suse, and more.

Pricing and Support
EKS Distro is an open source project and will be distributed for free. Please collaborate with us on GitHub to make it even better. For example, if you find any issues, please submit them or create a pull request and we will fix them on a best effort basis. Partners will receive support through the Amazon Partner Network program and customers that adopt EKS Distro through partners will receive support from those providers.

What is Coming Next?
In 2021 we will be launching EKS Anywhere, which will provide an installable software package for creating and operating Kubernetes clusters on-premises and automation tooling for cluster lifecycle support, it will enable you to centrally backup, recover, patch, and upgrade your production clusters with minimal disruption. EKS Anywhere creates clusters based on EKS Distro, and so you will have version consistency with Amazon EKS. This version and tooling consistency will reduce support costs, and eliminate the redundant effort of using multiple tools for managing your on-premises and Amazon EKS clusters.

Available Now
EKS Distro is available today for download and you can get the source and builds from GitHub. To help you get started, check out the documentation.

Happy Deploying!

— Martin

AWS Panorama Appliance: Bringing Computer Vision Applications to the Edge

Post Syndicated from Martin Beeby original https://aws.amazon.com/blogs/aws/using-computer-vision-applications-at-the-edge/

At AWS re:Invent today, we gave a preview of the AWS Panorama Appliance. Also, we announced the AWS Panorama SDK is coming soon. These allow organizations to bring computer vision to their on-premises cameras and make automated predictions with high accuracy and low latency.

Over the past couple of decades, computer vision has gone from a topic discussed by academics to a tool used by businesses worldwide. Cloud has been critical in enabling this growth, and we have had an explosion of services and infrastructure capabilities that have made the previously impossible possible.

Customers face challenges with their physical systems, whether it be inspecting parts on a manufacturing line, ensuring workers wear hard hats in hazardous areas or analyzing customer traffic in retail stores. Customers often solve these problems by manually monitoring live video feeds or reviewing recorded footage after an issue or incident has occurred. These solutions are manual, error-prone, and difficult to scale.

Computer Vision is increasingly being used to perform these inspection tasks using models running in the cloud. Still, there are circumstances when relying exclusively on the cloud is not optimal due to latency requirements or intermittent connectivity that make a round trip to the cloud unfeasible.

What Was Announced Today
You can now develop a computer vision model using Amazon SageMaker and then deploy it to a Panorama Appliance that can then run the model on video feeds from multiple network and IP cameras. The Panorama Appliance and its associated console are now in preview.

Coming soon, we have the Panorama SDK, which is a Software Development Kit (SDK) that can be used by third-party device manufacturers to build Panorama-enabled devices. The Panorama SDK is flexible, with a small footprint, making it easy for hardware vendors to build new devices in various form factors and sensors to satisfy use cases across different industries and environments, including industrial sites, low light scenarios, and the outdoors.

Unboxing the Appliance
Jeff was sent a Panorama Appliance a few weeks before AWS re:Invent so that we could write this blog; here is a picture of the device set up in Jeff’s office.

To set up the Panorama Appliance, I head over to the console and click on Get Started.

The console presents me with a three-step guide to getting a computer vision model running on the Panorama Appliance. In this blog, I will only look at Step 1, which helps me set up the Panorama Appliance.

I plugged the Panorama Appliance into the local network with an ethernet cable, and so in the configure step, I choose the Ethernet option.

The console creates a configuration archive, based on my input, that can set up the device. I download the file and transfer it to a USB key, which I will then plug into the Panorama Appliance.

I power on the Panorama Appliance and plug in the USB key; lights begin to flash as the Panorama Appliance connects to AWS. A green message appears on the console after a little while, saying that the Panorama Appliance is connected and online.

The guide then asks me to Add camera streams.

There are two ways to Add cameras: Automatic and Manual. I select Automatic, which will search the subnet for available cameras.

Some of the network cameras are password-protected. I add the Username and Password so that the Panorama Appliance can connect.

The Panorama Appliance is now connected to the network cameras, and my Panorama Appliance is ready to use.

The next step is to create an application and then deploy it to the Panorama Appliance. Over the next few weeks, I will produce a demo application, and when the service becomes Generally Available, I look forward to talking about it on this blog and sharing with you what I have created.

Get Started
To get started with the AWS Panorama Appliance, visit the product page. To get started with the AWS Panorama SDK, check out the documentation. We are excited to see what our customers will develop with the Panorama Appliance, and the sort of products third-party device manufacturers will build with the Panorama SDK.

Happy Automating!

— Martin


Amazon Elastic Container Registry Public: A New Public Container Registry

Post Syndicated from Martin Beeby original https://aws.amazon.com/blogs/aws/amazon-ecr-public-a-new-public-container-registry/

In November, we announced that we intended to create a public container registry, and today at AWS re:Invent, we followed through on that promise and launched Amazon Elastic Container Registry Public (ECR Public).

ECR Public allows you to store, manage, share, and deploy container images for anyone to discover and download globally. You have long been able to host private container images on AWS with Amazon Elastic Container Registry, and now with the release of ECR Public, you can host public ones too, enabling anyone (with or without an AWS account) to browse and pull your published container artifacts.

As part of the announcement, a new website allows you to browse and search for public container images, view developer provided details, and discover the commands you need to pull containers.

If you check the website out now, you will see we have hosted some of our container images on the registry, including including the Amazon EKS Distro images. We also have hundreds of images from partners such as Bitnami, Canonical and HashiCorp.

Publishing A Container
Before I can upload a container, I need to create a repository. There is now a Public tab in the Repositories section of the Elastic Container Registry console. In this tab, I click the button Create repository.

I am taken to the Create repository screen, where I select that I would like the repository to be public.

I give my repository the name news-blog and upload a logo that will be used on the gallery details page. I provide a description and select Linux as the Content type, There is also an option to select the CPU architectures that the image supports, if you have a multi-architecture image you can select more than one architecture type. The content types are used for filtering on the gallery website, this will enable people using the gallery to filter their searches by architecture and operating system support.

I enter some markdown in the About section. The text I enter here will be displayed on the gallery page and would ordinarily explain what’s included in the repository, any licensing details, or other relevant information. There is also a Usage section where I enter some sample text to explain how to use my image and that I created the repository for a demo. Finally, I click Create repository.

Back at the repository page, I now have one public repository. There is also a button that says View push commands. I click on this so I can learn more about how to push containers to the repository.

I follow the four steps contained in this section. The first step helps me authenticate with ECR Public so that I can push containers to my repository. Steps two, three, and four show me how to build, tag, and push my container to ECR Public.

The application that I have containerized is a simple app that runs and outputs a terminal message. I use the docker CLI to push my container to my repository, it’s quite a small container, so it only takes a minute or two.

Once complete, I head over to the ECR Public gallery and can see that my image is now publicly available for anyone to pull.

Pulling A Container
You pull containers from ECR Public using the familiar docker pull command with the URL of the image.

You can easily find this URL on the ECR Public website, where the image URL is displayed along with other published information. Clicking on the URL copies the image URL to your clipboard for an easy copy-paste.

ECR Public image URLs are in the format public.ecr.aws/<namespace>/<image>:<tag>

For example, if I wanted to pull the image I uploaded earlier, I would open my terminal and run the following command (please note: you will need docker installed locally to run these commands).

docker pull public.ecr.aws/r6g9m2o3/news-blog:latest

I have now download the Docker Image onto my machine, and I can run the container using the following command:

docker run public.ecr.aws/r6g9m2o3/news-blog:latest

My application runs and writes a message from Jeff Barr. If you are wondering about the switches and parameters I have used on my docker run command, it’s to make sure that the log is written in color because we wouldn’t want to miss out on Jeff’s glorious purple hair.

Nice to Know
ECR Public automatically replicates container images across two AWS Regions to reduce download times and improve availability. Therefore, using public images directly from ECR Public may simplify your build process if you were previously creating and managing local copies. ECR Public caches image layers in Amazon CloudFront, to improve pull performance for a global audience, especially for popular images.

ECR Public also has some nice integrations that will make working with containers easier on AWS. For example, ECR Public will automatically notify services such as AWS CodeBuild to rebuild an application when a public container image changes.

Pricing
All AWS customers will get 50 GB of free storage each month, and if you exceed that limit, you will pay nominal charges. Check out the pricing page for details.

Anyone who pulls images anonymously will get 500 GB of free data bandwidth each month, after which they can sign up or sign in to an AWS account to get more. Simply authenticating with an AWS account increases free data bandwidth up to 5 TB each month when pulling images from the internet.

Finally, workloads running in AWS will get unlimited data bandwidth from any region when pulling publicly shared images from ECR Public.

Verification and Namespaces
You can create a custom namespace such as your organization or project name to be used in a ECR Public URL subdomain unless it’s a reserved namespace. Namespaces such as sagemaker and eks that identify AWS services are reserved. Namespaces that identify AWS Marketplace sellers are also reserved.

Available Today
ECR Public is available today and you can find out more over on the product page. Visit the gallery to explore and use available public container software and log into the ECR Console to share containers publicly.

Happy Containerizing!

— Martin

Multi-Region Replication Now Enabled for AWS Managed Microsoft Active Directory

Post Syndicated from Martin Beeby original https://aws.amazon.com/blogs/aws/multi-region-replication-now-enabled-for-aws-managed-microsoft-active-directory/

Our customers build applications that need to serve users that live in all corners of the world. When listening to our customers, they told us that whilst they were comfortable building Active Directory (AD) aware applications on AWS, making them work globally can be a real challenge.

Customers told us that AWS Directory Service for Microsoft Active Directory had saved them time and money and provided them with all the capabilities they need to run their AD-aware applications. However, if they wanted to go global, they needed to create independent AWS Managed Microsoft AD directories per Region. They would then need to create a solution to synchronize data across each Region. This level of management overhead is significant, complex, and costly. It also slowed customers as they sought to migrate their AD-aware workloads to the cloud.

Today, I want to tell you about a new feature that allows customers to deploy a single AWS Managed Microsoft AD across multiple AWS Regions. This new feature called multi-region replication automatically configures inter-region networking connectivity, deploys domain controllers, and replicates all the Active Directory data across multiple Regions, ensuring that Windows and Linux workloads residing in those Regions can connect to and use AWS Managed Microsoft AD with low latency and high performance. AWS Managed Microsoft AD makes it more cost-effective for customers to migrate AD-aware applications and workloads to AWS and easier to operate them globally. In addition, automated multi-region replication provides multi-region resiliency.

AWS can now synchronize all customer directory data, including users, groups, Group Policy Objects (GPOs), and schema across multiple Regions. AWS handles automated software updates, monitoring, recovery, and the security of the underlying AD infrastructure across all Regions, enabling customers to focus on building their applications. Integrating with Amazon CloudWatch Logs and Amazon Simple Notification Service (SNS), AWS Managed Microsoft AD makes it easy for customers to monitor the directory’s health, and security logs globally.

How It Works 
Let me show you how to create an Active Directory that spans multiple Regions using the AWS Managed Microsoft AD console. You do not have to create a new directory to use multi-region replication it will work on all your existing directories too.

First, I create a new Directory following the normal steps. I select Enterprise Edition since this is the only edition that supports multi-region replication.

I give my Directory a name and a description and then set an Admin password. I then click Next which takes me to the Networking setup.

I select a Amazon Virtual Private Cloud that I use for demos and then choose two subnets which are in separate Availability Zones. The AWS Managed Microsoft AD deploys two domain controllers per region and places them in separate subnets which are in different Availability Zones, this is done for resiliency reasons so that the directory can still operate even if one of the Availability Zones has issues.

Once I click next, I am presented with the review screen and I click Create Directory.

The directory takes between 20-45 minutes to be created. There is now a column on the Directories listing page that says Multi-Region, this directory has this value currently set to No indicating that it does not span multiple Regions

Once the directory has been created, I click on the Directory ID and drill into the details. I now have a new section called Multi-Region replication and there is a button called Add Region. If I click this button I can then configure an additional Region.

I select the Region that I want to add to my directory, in this example US West (Oregon) us-west-2, I then select a VPC in that Region and two subnets that must reside in separate Availability Zones. Finally, I click the Add button to add this new Region for my directory.

Now back on the directory details page I see there are two Regions listed one in US East (N. Virginia) and one in US West (Oregon), again the creation process can take upto 45 minutes, but once it has complete I will have my directory replicated across two Regions.

Costs
You pay by the hour for the domain controllers in each region, plus the cross-region data transfer. It’s important to understand that this feature will create two domain controllers in each Region that you Add, and so applications that reside in these Regions can now communicate with a local directory which lowers costs by minimizing the need for data transfer. To learn more, visit the pricing page.

Available Now
This new feature can be used today and is available for both new and existing directories that use the Enterprise Edition in any of the following Regions: US East (N. Virginia), US East (Ohio), US West (N. California), US West (Oregon), AWS GovCloud (US-East), US West (Oregon), Asia Pacific (Mumbai), Asia Pacific (Seoul), Asia Pacific (Singapore), Asia Pacific (Sydney), Asia Pacific (Tokyo), Canada (Central), Europe (Frankfurt), Europe (Ireland), Europe (London), Europe (Paris), Europe (Stockholm), and South America (São Paulo).

Head over to the product page to learn more, view pricing, and get started creating directories that span multiple AWS Regions.

Happy Administering

— Martin

Introducing Amazon S3 Storage Lens – Organization-wide Visibility Into Object Storage

Post Syndicated from Martin Beeby original https://aws.amazon.com/blogs/aws/s3-storage-lens/

When starting out in the cloud, a customer’s storage requirements might consist of a handful of S3 buckets, but as they grow, migrate more applications and realize the power of the cloud, things can become more complicated. A customer may have tens or even hundreds of accounts and have multiple S3 buckets across numerous AWS Regions. Customers managing these sorts of environments have told us that they find it difficult to understand how storage is used across their organization, optimize their costs, and improve security posture.

Drawing from more than 14 years of experience helping customers optimize their storage, the S3 team has built a new feature called Amazon S3 Storage Lens. This is the first cloud storage analytics solution to give you organization-wide visibility into object storage, with point-in-time metrics and trend lines as well as actionable recommendations. All these things combined will help you discover anomalies, identify cost efficiencies and apply data protection best practices.

With S3 Storage Lens , you can understand, analyze, and optimize storage with 29+ usage and activity metrics and interactive dashboards to aggregate data for your entire organization, specific accounts, regions, buckets, or prefixes. All of this data is accessible in the S3 Management Console or as raw data in an S3 bucket.

Every Customer Gets a Default Dashboard

S3 Storage Lens includes an interactive dashboard which you can find in the S3 console. The dashboard gives you the ability to perform filtering and drill-down into your metrics to really understand how your storage is being used. The metrics are organized into categories like data protection and cost efficiency, to allow you to easily find relevant metrics.

For ease of use all customers receive a default dashboard. If you are like many customers, this maybe the only dashboard that you need, but if you want to, you can make changes. For example, you could configure the dashboard to export the data daily to an S3 bucket for analysis with another tool (Amazon QuickSight, Amazon Athena, Amazon Redshift, etc.) or you could upgrade to receive advanced metrics and recommendations.

Creating a Dashboard
You can also create your own dashboards from scratch, to do this I head over to the S3 console and click on the Dashboards menu item inside the Storage Lens section. Secondly, I click the Create dashboard button.

Screenshot of the console

I give my dashboard the name s3-lens-demo and select a home Region. The home Region is where the metrics data for your dashboard will be stored. I choose to enable the dashboard, meaning that it will be updated daily with new metrics.

A dashboard can analyze storage across accounts, Regions, buckets, and prefix. I choose to include buckets from all accounts in my organization and across all regions in the Dashboard scope section.

S3 Storage Lens has two tiers: Free Metrics, which is free of charge, automatically available for all S3 customers and contains 15 usage related metrics; and Advanced metrics and recommendations, which has an additional charge, but includes all 29 usage and activity metrics with 15-month data retention, and contextual recommendations. For this demo, I select Advanced metrics and recommendations.

Screenshot of Management Console

Finally, I can configure the dashboard metrics to be exported daily to a specific S3 bucket. The metrics can be exported to either CSV or Apache Parquet format for further analysis outside of the console.

An alert pops up to tell me that my dashboard has been created, but it can take up to 48 hours to generate my initial metrics.

What does a Dashboard Show?

Once my dashboard has been created, I can start to explore the data. I can filter by Accounts, Regions, Storage classes, Buckets, and Prefixes at the top of the dashboard.

The next section is a snapshot of the metrics such as the Total storage and Object count, and I can see a trendline that shows the trend on each metric over the last 30 days and a percentage change. The number in the % change column shows by default the Day/day percentage change, but I can select to compare by Week/week or Month/month.

I can toggle between different Metric groups by selecting either Summary, Cost efficiency, Data protection, or Activity.

There are some metrics here that are pretty typical like total storage and object counts, and you can already receive these in a few places in the S3 console and in Amazon CloudWatch – but in S3 Storage Lens you can receive these metrics in aggregate across your organization or account, or at the prefix level, which was not previously possible.

There are some other metrics you might not expect, like metrics that pertain to S3 feature utilization. For example we can break out the % of objects that are using encryption, or the number of objects that are non-current versions. These metrics help you understand how your storage is configured, and allows you to identify discrepancies, and then drill in for details.

The dashboard provides contextual recommendations alongside your metrics to indicate actions you can take based on the metric, for example ways to improve cost efficiency, or apply data protection best practices. Any recommendations are shown in the Recommendation column. A few days ago I took the screenshot below which shows a recommendation on one of my dashboards that suggests I should check my buckets’ default encryption configuration.

The dashboard trends and distribution section allows me to compare two metrics over time in more detail. Here I have selected Total storage as my Primary metric and Object Count as my Secondary metric.

These two metrics are now plotted on a graph, and I can select a date range to view the trend over time.

The dashboard also shows me those two metrics and how they are distributed across Storage class and Regions.

I can click on any value in this graph and Drill down to filter the entire dashboard on that value, or select Anayze by to navigate to a new dashboard view for that dimension.

The last section of the dashboard allows me to perform a Top N analysis of a metric over a date range, where N is between 1 and 25. In the example below, I have selected the top 3 items in descending order for the Total storage metric.

I can then see the top three accounts (note: there are only two accounts in my organization) and the Total storage metric for each account.

It also shows the top 3 regions for the Total storage metric, and I can see that 51.15% of my data is stored in US East (N. Virginia)

Lastly, the dashboard contains information about the top 3 buckets and prefixes and the associated trends.

As I have shown, S3 Storage Lens delivers more than 29 individual metrics on S3 storage usage and activity for all accounts in your organization. These metrics are available in the S3 console to visualize storage usage and activity trends in a dashboard, with contextual recommendations that make it easy to take immediate action. In addition to the dashboard in the S3 console, you can export metrics in CSV or Parquet format to an S3 bucket of your choice for further analysis with other tools including Amazon QuickSight, Amazon Athena, or Amazon Redshift to name a few.

Video Walkthrough

If you would like a more indepth look at S3 Storage Lens the team have recorded the following video to explain how this new feature works.

Available Now

S3 Storage Lens is available in all commercial AWS Regions. You can use S3 Storage Lens with the Amazon S3 API, CLI, or in the S3 Console. For pricing information, regarding S3 Storage Lens advanced metrics and recommendations, check out the Amazon S3 pricing page. If you’d like to dive a little deeper, then you should check out the documentation or the S3 Storage Lens webpage.

Happy Storing

— Martin


A New Integration for CloudWatch Alarms and OpsCenter

Post Syndicated from Martin Beeby original https://aws.amazon.com/blogs/aws/a-new-integration-for-cloudwatch-alarms-and-opscenter/

Over a year ago, I wrote about the Launch of a feature in AWS Systems Manager called OpsCenter, which allows customers to aggregate issues, events, and alerts into one place and make it easier for operations engineers and IT professionals to investigate and remediate problems. Today, I get to tell you about a new integration […]

Amazon S3 on Outposts Now Available

Post Syndicated from Martin Beeby original https://aws.amazon.com/blogs/aws/amazon-s3-on-outposts-now-available/

AWS Outposts customers can now use Amazon Simple Storage Service (S3) APIs to store and retrieve data in the same way they would access or use data in a regular AWS Region. This means that many tools, apps, scripts, or utilities that already use S3 APIs, either directly or through SDKs, can now be configured to store that data locally on your Outposts.

AWS Outposts are a fully managed service that provides a consistent hybrid experience, with AWS installing the Outpost in your data center or colo facility. These Outposts are managed, monitored, and updated by AWS just like in the cloud. Customers use AWS Outposts to run services in their local environments, like Amazon Elastic Compute Cloud (EC2), Amazon Elastic Block Store (EBS), and Amazon Relational Database Service (RDS), and are ideal for workloads that require low latency access to on-premises systems, local data processing, or local data storage.

Outposts are connected to an AWS Region and are also able to access Amazon S3 in AWS Regions, however, this new feature will allow you to use the S3 APIs to store data on the AWS Outposts hardware and process it locally. You can use S3 on Outposts to satisfy demanding performance needs by keeping data close to on-premises applications. It will also benefit you if you want to reduce data transfers to AWS Regions, since you can perform filtering, compression, or other pre-processing on your data locally without having to send all of it to a region.

Speaking of keeping your data local, any objects and the associated metadata and tags are always stored on the Outpost and are never sent or stored elsewhere. However, it is essential to remember that if you have data residency requirements, you may need to put some guardrails in place to ensure no one has the permissions to copy objects manually from your Outposts to an AWS Region.

You can create S3 buckets on your Outpost and easily store and retrieve objects using the same Console, APIs, and SDKs that you would use in a regular AWS Region. Using the S3 APIs and features, S3 on Outposts makes it easy to store, secure, tag, retrieve, report on, and control access to the data on your Outpost.

S3 on Outposts provides a new Amazon S3 storage class, named S3 Outposts, which uses the S3 APIs, and is designed to durably and redundantly store data across multiple devices and servers on your Outposts. By default, all data stored is encrypted using server-side encryption with SSE-S3. You can optionally use server-side encryption with your own encryption keys (SSE-C) by specifying an encryption key as part of your object API requests.

When configuring your Outpost you can add 48 TB or 96 TB of S3 storage capacity, and you can create up to 100 buckets on each Outpost. If you have existing Outposts, you can add capacity via the AWS Outposts Console or speak to your AWS account team. If you are using no more than 11 TB of EBS storage on an existing Outpost today you can add up to 48 TB with no hardware changes on the existing Outposts. Other configurations will require additional hardware on the Outpost (if the hardware footprint supports this) in order to add S3 storage.

So let me show you how I can create an S3 bucket on my Outposts and then store and retrieve some data in that bucket.

Storing data using S3 on Outposts

To get started, I updated my AWS Command Line Interface (CLI) to the latest version. I can create a new Bucket with the following command and specify which outpost I would like the bucket created on by using the –outposts-id switch.

aws s3control create-bucket --bucket my-news-blog-bucket --outposts-id op-12345

In response to the command, I am given the ARN of the bucket. I take note of this as I will need it in the next command.

Next, I will create an Access point. Access points are a relatively new way to manage access to an S3 bucket. Each access point enforces distinct permissions and network controls for any request made through it. S3 on Outposts requires a Amazon Virtual Private Cloud configuration so I need to provide the VPC details along with the create-access-point command.

aws s3control create-access-point --account-id 12345 --name prod --bucket "arn:aws:s3-outposts:us-west-2:12345:outpost/op-12345/bucket/my-news-blog-bucket" --vpc-configuration VpcId=vpc-12345

S3 on Outposts uses endpoints to connect to Outposts buckets so that you can perform actions within your virtual private cloud (VPC). To create an endpoint, I run the following command.

aws s3outposts create-endpoint --outpost-id op-12345 --subnet-id subnet-12345 —security-group-id sg-12345

Now that I have set things up, I can start storing data. I use the put-object command to store an object in my newly created Amazon Simple Storage Service (S3) bucket.

aws s3api put-object --key my_news_blog_archives.zip --body my_news_blog_archives.zip --bucket arn:aws:s3-outposts:us-west-2:12345:outpost/op-12345/accesspoint/prod

Once the object is stored I can retrieve it by using the get-object command.

aws s3api get-object --key my_news_blog_archives.zip --bucket arn:aws:s3-outposts:us-west-2:12345:outpost/op-12345/accesspoint/prod my_news_blog_archives.zip

There we have it. I’ve managed to store an object and then retrieve it, on my Outposts, using S3 on Outposts.

Transferring Data from Outposts

Now that you can store and retrieve data on your Outposts, you might want to transfer results to S3 in an AWS Region, or transfer data from AWS Regions to your Outposts for frequent local access, processing, and storage. You can use AWS DataSync to do this with the newly launched support for S3 on Outposts.

With DataSync, you can choose which objects to transfer, when to transfer them, and how much network bandwidth to use. DataSync also encrypts your data in-transit, verifies data integrity in-transit and at-rest, and provides granular visibility into the transfer process through Amazon CloudWatch metrics, logs, and events.

Order today

If you want to start using S3 on Outposts, please visit the AWS Outposts Console, here you can add S3 storage to your existing Outposts or order an Outposts configuration that includes the desired amount of S3. If you’d like to discuss your Outposts purchase in more detail then contact our sales team.

Pricing with AWS Outposts works a little bit differently from most AWS services, in that it is not a pay-as-you-go service. You purchase Outposts capacity for a 3-year term and you can choose from a number of different payment schedules. There are a variety of AWS Outposts configurations featuring a combination of EC2 instance types and storage options. You can also increase your EC2 and storage capacity over time by upgrading your configuration. For more detailed information about pricing check out the AWS Outposts Pricing details.

Happy Storing

— Martin

Seamlessly Join a Linux Instance to AWS Directory Service for Microsoft Active Directory

Post Syndicated from Martin Beeby original https://aws.amazon.com/blogs/aws/seamlessly-join-a-linux-instance-to-aws-directory-service-for-microsoft-active-directory/

Many customers I speak to use Active Directory to manage centralized user authentication and authorization for a variety of applications and services. For these customers, Active Directory is a critical piece of their IT Jigsaws.

At AWS, we offer the AWS Directory Service for Microsoft Active Directory that provides our customers with a highly available and resilient Active Directory service that is built on actual Microsoft Active Directory. AWS manages the infrastructure required to run Active Directory and handles all of the patching and software updates needed. It’s fully managed, so for example, if a domain controller fails, our monitoring will automatically detect and replace that failed controller.

Manually connecting a machine to Active Directory is a thankless task; you have to connect to the computer, make a series of manual changes, and then perform a reboot. While none of this is particularly challenging, it does take time, and if you have several machines that you want to onboard, then this task quickly becomes a time sink.

Today the team is unveiling a new feature which will enable a Linux EC2 instance, as it is launched, to connect to AWS Directory Service for Microsoft Active Directory seamlessly. This complements the existing feature that allows Windows EC2 instances to seamlessly domain join as they are launched. This capability will enable customers to move faster and improves the experience for Administrators.

Now you can have both your Windows and Linux EC2 instances seamlessly connect to AWS Directory Service for Microsoft Active Directory. The directory can be in your own account or shared with you from another account, the only caveat being that both the instance and the directory must be in the same region.

To show you how the process works, let’s take an existing AWS Directory Service for Microsoft Active Directory and work through the steps required to have a Linux EC2 instance seamlessly join that directory.

Create and Store AD Credentials
To seamlessly join a Linux machine to my AWS Managed Active Directory Domain, I will need an account that has permissions to join instances into the domain. While members of the AWS Delegated Administrators have sufficient privileges to join machines to the domain, I have created a service account that has the minimum privileges required. Our documentation explains how you go about creating this sort of service account.

The seamless domain join feature needs to know the credentials of my active directory service account. To achieve this, I need to create a secret using AWS Secrets Manager with specifically named secret keys, which the seamless domain feature will use to join instances to the directory.

In the AWS Secrets Manager console I click on the Store a new secret button, on the next screen, when asked to Select a secret type, I choose the option named Other type of secrets. I can now add two secret key/values. The first is called awsSeamlessDomainUsername, and in the value textbox, I enter the username for my Active Directory service account. The Second key is called awsSeamlessDomainPassword, and here I enter the password for my service account.

Since this is a demo, I chose to use the DefaultEncryptionKey for the secret, but you might decide to use your own key.

After clicking next, I am asked to give the secret a name. I add the following name, replacing d-xxxxxxxxx with my directory ID.

aws/directory-services/d-xxxxxxxxx/seamless-domain-join

The domain join will fail if you mistype this name or if you have any leading or ending spaces.

I take note down the Secret ARN as I will need it when I create my IAM Policy.

Create The Required IAM Policy and Role
Now I need to create an IAM policy that gives permission to read my seamless-domain-join secret.

I sign in to the IAM console and choose Policies. In the content pane, I select Create policy. I switch over to the JSON tab and copy the text from the following JSON policy document, replacing the Secrets Manager ARN with the one I noted down earlier.

{
    "Version": "2012-10-17",
    "Statement": [
        {
            "Effect": "Allow",
            "Action": [
                "secretsmanager:GetSecretValue",
                "secretsmanager:DescribeSecret"
            ],
            "Resource": [
                "arn:aws:secretsmanager:us-east-1:############:secret:aws/directory-service/d-xxxxxxxxxx/seamless-domain-join-example"
            ]
        }
    ]
}

On the Review page, I name the policy SeamlessDomainJoin-Secret-Readonly then choose Create policy to save my work.

Now I need to create an IAM Role that will use this policy (and a few others). In the IAM Console, I choose Roles, and then in the content pane, choose to Create role. Under Select type of trusted entity, I select AWS service and then select EC2 as a use case and click Next:Permissions.


I attach the following policies to my Role: AmazonSSMManagedInstanceCore, AmazonSSMDirectoryServiceAccess, and SeamlessDomainJoin-Secret-Readonly.

I click through to the Review screen where it asks for a Role name, I call the role EC2DomainJoin, but it could be called whatever you like. I then create the role by pressing the button at the bottom right of the screen.

Create an Amazon Machine Image
When I launch a Linux Instance later I will need to pick a Linux Amazon Machine Image (AMI) as a template. Currently, the default Linux AMIs do not contain the version of AWS Systems Manager agent (SSM agent) that this new seamless domain feature needs. Therefore I am going to have to create an AMI with an updated SSM agent. To do this, I first create a new Linux Instance in my account and then connect to it using my SSH client. I then follow the documentation to update the SSM agent to 2.3.1644.0 or newer. Once the instance has finished updating I am then able to create a new AMI based on this instance using the following documentation.

I now have a new AMI which I can use in the next step. In the future, the base AMIs will be updated to use the newer SSM agent, and then we can skip this section. If you are interested to know what version of the SSM agent an instance is using this documentation explains how you can check.

Seamless Join
To start, I need to create a Linux instance, and so I head over to the EC2 console and choose Launch Instance.

Next, I pick a Linux Amazon Machine Image (AMI). I select the AMI which I created earlier.

When configuring the instance, I am careful to choose the Amazon Virtual Private Cloud that contains my directory. Using the drop-down labeled Domain join directory I am able to select the directory that I want this instance to join.

In the IAM role, I select the EC2DomainJoin role that I created earlier.

When I launch this instance, it will seamlessly join my directory. Once the instance comes online, I can confirm everything is working correctly by using SSH to connect to the instance using the administrator credentials of my AWS Directory Service for Microsoft Active Directory.

This new feature is available from today, and we look forward to hearing your feedback about this new capability.

Happy Joining

— Martin

Log your VPC DNS queries with Route 53 Resolver Query Logs

Post Syndicated from Martin Beeby original https://aws.amazon.com/blogs/aws/log-your-vpc-dns-queries-with-route-53-resolver-query-logs/

The Amazon Route 53 team has just launched a new feature called Route 53 Resolver Query Logs, which will let you log all DNS queries made by resources within your Amazon Virtual Private Cloud. Whether it’s an Amazon Elastic Compute Cloud (EC2) instance, an AWS Lambda function, or a container, if it lives in your Virtual Private Cloud and makes a DNS query, then this feature will log it; you are then able to explore and better understand how your applications are operating.

Our customers explained to us that DNS query logs were important to them. Some wanted the logs so that they could be compliant with regulations, others wished to monitor DNS querying behavior, so they could spot security threats. Others simply wanted to troubleshoot application issues that were related to DNS. The team listened to our customers and have developed what I have found to be an elegant and easy to use solution.

From knowing very little about the Route 53 Resolver, I was able to configure query logging and have it working with barely a second glance at the documentation; which I assure you is a testament to the intuitiveness of the feature rather than me having any significant experience with Route 53 or DNS query logging.

You can choose to have the DNS query logs sent to one of three AWS services: Amazon CloudWatch Logs, Amazon Simple Storage Service (S3), and Amazon Kinesis Data Firehose. The target service you choose will depend mainly on what you want to do with the data. If you have compliance mandates (For example, Australia’s Information Security Registered Assessors Program), then maybe storing the logs in Amazon Simple Storage Service (S3) is a good option. If you have plans to monitor and analyze DNS queries in real-time or you integrate your logs with a 3rd party data analysis tool like Kibana or a SEIM tool like Splunk, than perhaps Amazon Kinesis Data Firehose is the option for you. For those of you who want an easy way to search, query, monitor metrics, or raise alarms, then Amazon CloudWatch Logs is a great choice, and this is what I will show in the following demo.

Over in the Route 53 Console, near the Resolver menu section, I see a new item called Query logging. Clicking on this takes me to a screen where I can configure the logging.

The dashboard shows the current configurations that are setup. I click Configure query logging to get started.

The console asks me to fill out some necessary information, such as a friendly name; I’ve named mine demoNewsBlog.

I am now prompted to select the destination where I would like my logs to be sent. I choose the CloudWatch Logs log group and select the option to Create log group. I give my new log group the name /aws/route/demothebeebsnet.

Next, I need to select what VPC I would like to log queries for. Any resource that sits inside the VPCs I choose here will have their DNS queries logged. You are also able to add tags to this configuration. I am in the habit of tagging anything that I use as part of a demo with the tag demo. This is so I can easily distinguish between demo resources and live resources in my account.

Finally, I press the Configure query logging button, and the configuration is saved. Within a few moments, the service has successfully enabled the query logging in my VPC.

After a few minutes, I log into the Amazon CloudWatch Logs console and can see that the logs have started to appear.

As you can see below, I was quickly able to start searching my logs and running queries using Amazon CloudWatch Logs Insights.

There is a lot you can do with the Amazon CloudWatch Logs service, for example, I could use CloudWatch Metric Filters to automatically generate metrics or even create dashboards. While putting this demo together, I also discovered a feature inside of Amazon CloudWatch Logs called Contributor Insights that enables you to analyze log data and create time series that display top talkers. Very quickly, I was able to produce this graph, which lists out the most common DNS queries over time.
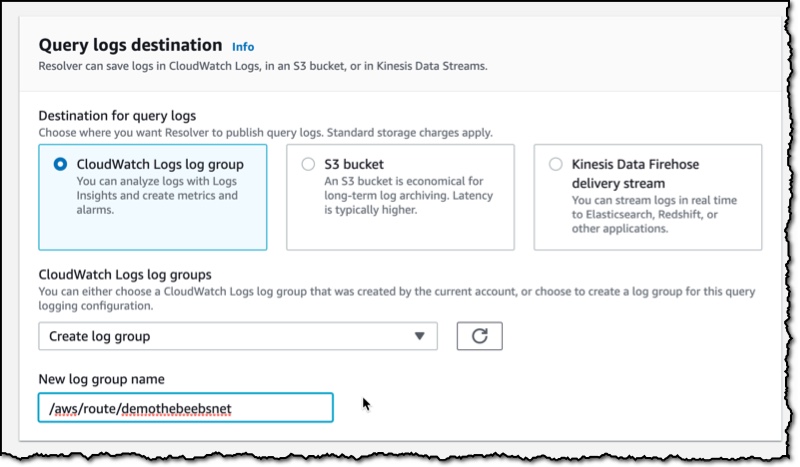
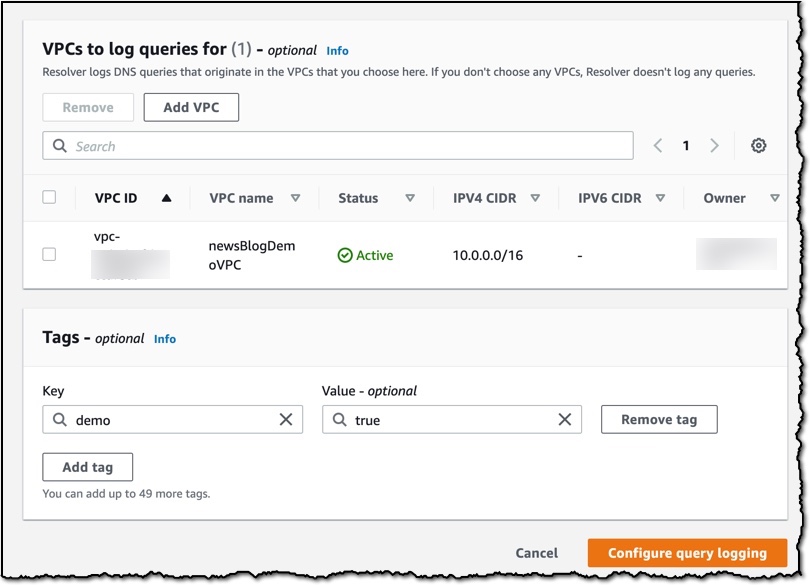
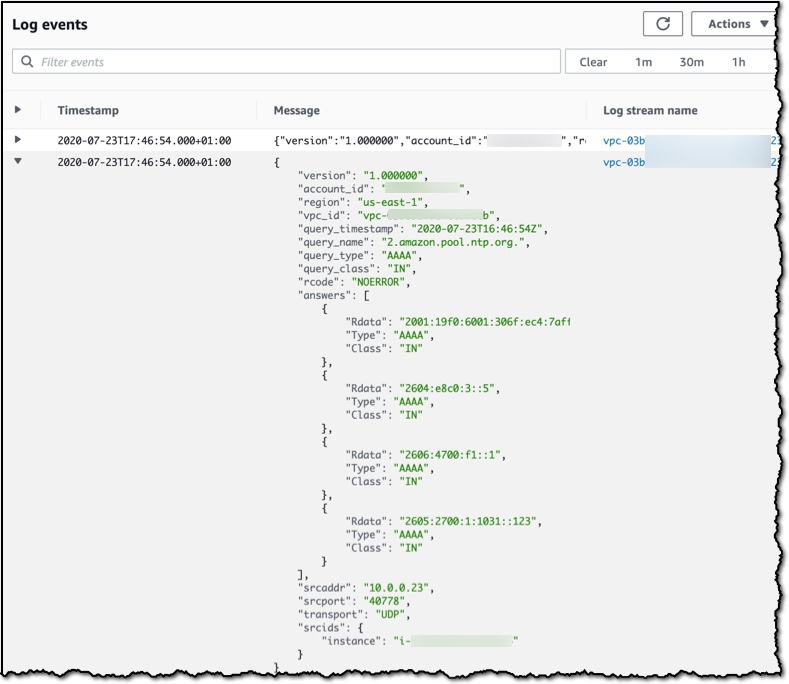
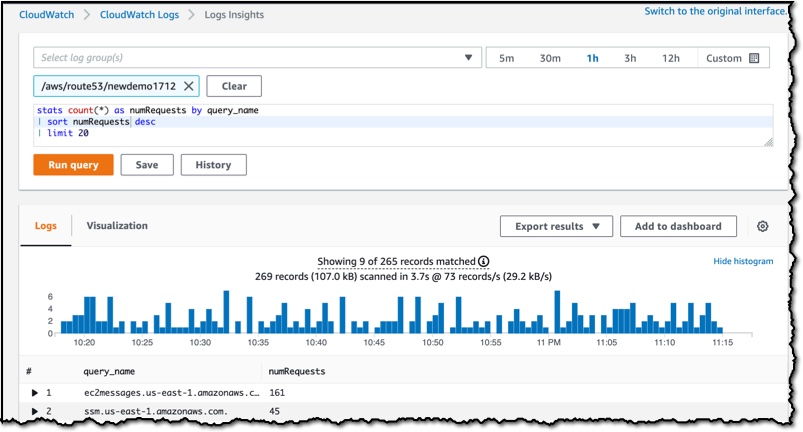
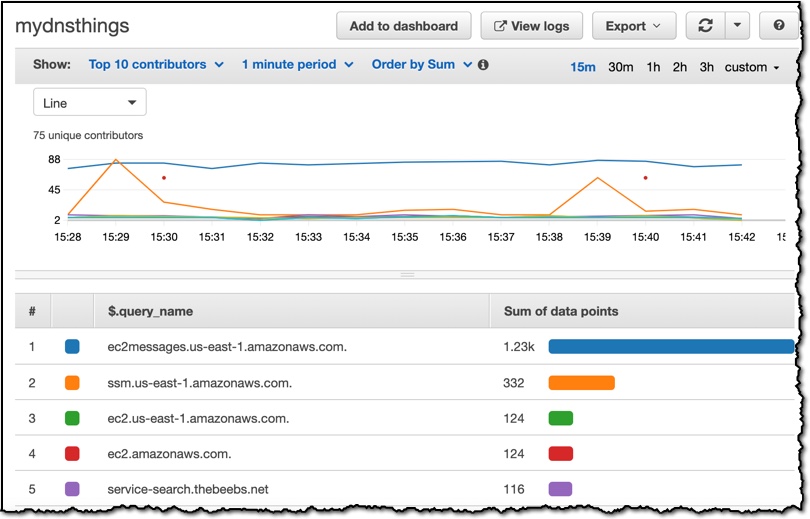
Route 53 Resolver Query Logs is available in all AWS Commercial Regions that support Route 53 Resolver Endpoints, and you can get started using either the API or the AWS Console. You do not pay for the Route 53 Resolver Query Logs, but you will pay for handling the logs in the destination service that you choose. So, for example, if you decided to use Amazon Kinesis Data Firehose, then you will incur the regular charges for handling logs with the Amazon Kinesis Data Firehose service.

Happy Logging

— Martin