Post Syndicated from The Hook Up original https://www.youtube.com/watch?v=KPFPuXm2u7I
[$] Race-free process creation in the GNU C Library
Post Syndicated from corbet original https://lwn.net/Articles/943022/
The pidfd API has been added to the kernel
over the last several years to provide a race-free way for processes to
refer to each other. While the GNU C Library (glibc) gained
basic pidfd support with the 2.36 release in 2022, it still lacks a
complete solution for race-free process creation. This
patch set from Adhemerval Zanella seems likely to fill that gap in the
near future, though, with an extension to the posix_spawn()
API.
The New MikroTik CRS310-8G+2S+IN Finally Joins 2.5GbE Switch Revolution
Post Syndicated from Cliff Robinson original https://www.servethehome.com/the-new-mikrotik-crs310-8g2sin-finally-joins-2-5gbe-switch-revolution-marvell-arm/
The new MikroTik CRS310-8G+2S+IN is an 8-port 2.5GbE switch with two SFP+ ports and a beefy Marvell switch chip. Finally MikroTik 2.5GbE!
The post The New MikroTik CRS310-8G+2S+IN Finally Joins 2.5GbE Switch Revolution appeared first on ServeTheHome.
Upgrading the Pentium III Bear PC with a more bearable GPU
Post Syndicated from LGR original https://www.youtube.com/watch?v=pZlIKjYHxxs
Comic for 2023.09.01 – Under The Sink
Post Syndicated from Explosm.net original https://explosm.net/comics/under-the-sink
New Cyanide and Happiness Comic
Security updates for Friday
Post Syndicated from jake original https://lwn.net/Articles/943302/
Security updates have been issued by Debian (chromium, firefox-esr, and gst-plugins-ugly1.0), Fedora (firefox, libeconf, libwebsockets, mosquitto, and rust-rustls-webpki), SUSE (amazon-ssm-agent, open-vm-tools, and terraform-provider-helm), and Ubuntu (linux-azure, linux-azure, linux-azure-5.15, linux-azure-fde, linux-gcp-5.15, linux-gcp-5.4, linux-oracle-5.4, linux-gkeop, linux-gkeop-5.15, linux-intel-iotg, linux-kvm, linux-oracle, and python-git).
Discover the benefits of AWS WAF advanced rate-based rules
Post Syndicated from Rodrigo Ferroni original https://aws.amazon.com/blogs/security/discover-the-benefits-of-aws-waf-advanced-rate-based-rules/
In 2017, AWS announced the release of Rate-based Rules for AWS WAF, a new rule type that helps protect websites and APIs from application-level threats such as distributed denial of service (DDoS) attacks, brute force log-in attempts, and bad bots. Rate-based rules track the rate of requests for each originating IP address and invokes a rule action on IPs with rates that exceed a set limit.
While rate-based rules are useful to detect and mitigate a broad variety of bad actors, threats have evolved to bypass request-rate limit rules. For example, one bypass technique is to send a high volumes of requests by spreading them across thousands of unique IP addresses.
In May 2023, AWS announced AWS WAF enhancements to the existing rate-based rules feature that you can use to create more dynamic and intelligent rules by using additional HTTP request attributes for request rate limiting. For example, you can now choose from the following predefined keys to configure your rules: label namespace, header, cookie, query parameter, query string, HTTP method, URI path and source IP Address or IP Address in a header. Additionally, you can combine up to five composite keys as parameters for stronger rule development. These rule definition enhancements help improve perimeter security measures against sophisticated application-layer DDoS attacks using AWS WAF. For more information about the supported request attributes, see Rate-based rule statement in the AWS WAF Developer Guide.
In this blog post, you will learn more about these new AWS WAF feature enhancements and how you can use alternative request attributes to create more robust and granular sets of rules. In addition, you’ll learn how to combine keys to create a composite aggregation key to uniquely identify a specific combination of elements to improve rate tracking.
Getting started
Configuring advanced rate-based rules is similar to configuring simple rate-based rules. The process starts with creating a new custom rule of type rate-based rule, entering the rate limit value, selecting custom keys, choosing the key from the request aggregation key dropdown menu, and adding additional composite keys by choosing Add a request aggregation key as shown in Figure 1.

Figure 1: Creating an advanced rate-based rule with two aggregation keys
For existing rules, you can update those rate-based rules to use the new functionality by editing them. For example, you can add a header to be aggregated with the source IP address, as shown in Figure 2. Note that previously created rules will not be modified.

Figure 2: Add a second key to an existing rate-based rule
You still can set the same rule action, such as block, count, captcha, or challenge. Optionally, you can continue applying a scope-down statement to limit rule action. For example, you can limit the scope to a certain application path or requests with a specified header. You can scope down the inspection criteria so that only certain requests are counted towards rate limiting, and use certain keys to aggregate those requests together. A technique would be to count only requests that have /api at the start of the URI, and aggregate them based on their SessionId cookie value.
Target use cases
Now that you’re familiar with the foundations of advanced rate-based rules, let’s explore how they can improve your security posture using the following use cases:
- Enhanced Application (Layer 7) DDoS protection
- Improved API security
- Enriched request throttling
Use case 1: Enhance Layer 7 DDoS mitigation
The first use case that you might find beneficial is to enhance Layer 7 DDoS mitigation. An HTTP request flood is the most common vector of DDoS attacks. This attack type aims to affect application availability by exhausting available resources to run the application.
Before the release of these enhancements to AWS WAF rules, rules were limited by aggregating requests based on the IP address from the request origin or configured to use a forwarded IP address in an HTTP header such as X-Forwarded-For. Now you can create a more robust rate-based rule to help protect your web application from DDoS attacks by tracking requests based on a different key or a combination of keys. Let’s examine some examples.
To help detect pervasive bots, such as scrapers, scanners, and crawlers, or common bots that are distributed across many unique IP addresses, a rule can look for static request data like a custom header — for example, User-Agent.
Key 1: Custom header (User-Agent)
To help you decide what unique key to use, you can analyze AWS WAF logs. For more information, review Examples 2 and 3 in the blog post Analyzing AWS WAF Logs in Amazon CloudWatch Logs.
To uniquely identity users behind a NAT gateway, you can use a cookie in addition to an IP address. Before the aggregation keys feature, it was difficult to identify users who connected from a single IP address. Now, you can use the session cookie to aggregate requests by their session identifier and IP address.
Note that for Layer 7 DDoS mitigation, tracking by session ID in cookies can be circumvented, because bots might send random values or not send any cookie at all. It’s a good idea to keep an IP-based blanket rate-limiting rule to block offending IP addresses that reach a certain high rate, regardless of their request attributes. In that case, the keys would look like:
- Key 1: Session cookie
- Key 2: IP address
You can reduce false positives when using AWS Managed Rules (AMR) IP reputation lists by rate limiting based on their label namespace. Labelling functionality is a powerful feature that allows you to map the requests that match a specific pattern and apply custom rules to them. In this case, you can match the label namespace provided by the AMR IP reputation list that includes AWSManagedIPDDoSList, which is a list of IP addresses that have been identified as actively engaging in DDoS activities.
You might want to be cautious about using this group list in block mode, because there’s a chance of blocking legitimate users. To mitigate this, use the list in count mode and create an advanced rate-based rule to aggregate all requests with the label namespace awswaf:managed:aws:amazon-ip-list:, targeting captcha as the rule action. This lets you reduce false positives without compromising security. Applying captcha as an action for the rule reduces serving captcha to all users and instead only applies it when the rate of requests exceeds the defined limit. The key for this rule would be:
- Labels (AMR IP reputation lists).
Use case 2: API security
In this second use case, you learn how to use an advanced rate-based rule to improve the security of an API. Protecting an API with rate-limiting rules helps ensure that requests aren’t being sent too frequently in a short amount of time. Reducing the risk from misusing an API helps to ensure that only legitimate requests are handled and not denied due to an overload of requests.
Now, you can create advanced rate-based rules that track API requests based on two aggregation keys. For example, HTTP method to differentiate between GET, POST, and other requests in combination with a custom header like Authorization to match a JSON Web Token (JWT). JWTs are not decrypted by AWS WAF, and AWS WAF only aggregates requests with the same token. This can help to ensure that a token is not being used maliciously or to bypass rate-limiting rules. An additional benefit of this configuration is that requests with no authorization headers are being aggregated together towards the rate limiting threshold. The keys for this use case are:
- Key 1: HTTP method
- Key 2: Custom header (Authorization)
In addition, you can configure a rule to block and add a custom response when the requests limit is reached. For example, by returning HTTP error code 429 (too many requests) with a Retry-After header indicating the requester should wait 900 seconds (15 minutes) before making a new request.
Use case 3: Implement request throttling
There are many situations where throttling should be considered. For example, if you want to maintain the performance of a service API by providing fair usage for all users, you can have different rate limits based on the type or purpose of the API, such as mutable or non-mutable requests. To achieve this, you can create two advanced rate-based rules using aggregation keys like IP address, combined with an HTTP request parameter for either mutable or non-mutable that indicates the type of request. Each rule will have its own HTTP request parameter, and you can set different maximum values for the rate limit. The keys for this use case are:
- Key 1: HTTP request parameter
- Key 2: IP address
Another example where throttling can be helpful is for a multi-tenant application where you want to track requests made by each tenant’s users. Let’s say you have a free tier but also a paying subscription model for which you want to allow a higher request rate. For this use case, it’s recommended to use two different URI paths to verify that the two tenants are kept separated. Additionally, it is advised to still use a custom header or query string parameter to differentiate between the two tenants, such as a tenant-id header or parameter that contains a unique identifier for each tenant. To implement this type of throttling using advanced rate-based rules, you can create two rules using an IP address in combination with the custom header as aggregation keys. Each rule can have its own maximum value for rate limiting, as well as a scope-down statement that matches requests for each URI path. The keys and scope-down statement for this use case are:
- Key 1: Custom header (tenant-id)
- Key 2: IP address
- Scope down statement (URI path)
As a third example, you can rate-limit web applications based on the total number of requests that can be handled. For this use case, you can use the new Count all as aggregation option. The option counts and rate-limits the requests that match the rule’s scope-down statement, which is required for this type of aggregation. One option is to scope down and inspect the URI path to target a specific functionality like a /history-search page. An option when you need to control how many requests go to a specific domain is to scope down a single header to a specific host, creating one rule for a.example.com and another rule for b.example.com.
- Request Aggregation: Count all
- Scope down statement (URI path | Single header)
For these examples, you can block with a custom response when the requests exceed the limit. For example, by returning the same HTTP error code and header, but adding a custom response body with a message like “You have reached the maximum number of requests allowed.”
Logging
The AWS WAF logs now include additional information about request keys used for request-rate tracking and the values of matched request keys. In addition to the existing IP or Forwarded_IP values, you can see the updated log fields limitKey and customValue, where the limitKey field now shows either CustomKeys for custom aggregate key settings or Constant for count all requests. CustomValues shows an array of keys, names, and values.

Figure 3: Example log output for the advanced rate-based rule showing updated limitKey and customValues fields
As mentioned in the first use case, to get more detailed information about the traffic that’s analyzed by the web ACL, consider enabling logging. If you choose to enable Amazon CloudWatch Logs as the log destination, you can use CloudWatch Logs Insights and advanced queries to interactively search and analyze logs.
For example, you can use the following query to get the request information that matches rate-based rules, including the updated keys and values, directly from the AWS WAF console.
Figure 4 shows the CloudWatch Log Insights query and the logs output including custom keys, names, and values fields.

Figure 4: The CloudWatch Log Insights query and the logs output
Pricing
There is no additional cost for using advanced rate-base rules; standard AWS WAF pricing applies when you use this feature. For AWS WAF pricing information, see AWS WAF Pricing. You only need to be aware that using aggregation keys will increase AWS WAF web ACL capacity units (WCU) usage for the rule. WCU usage is calculated based on how many keys you want to use for rate limiting. The current model of 2 WCUs plus any additional WCUs for a nested statement is being updated to 2 WCUs as a base, and 30 WCUs for each custom aggregation key that you specify. For example, if you want to create aggregation keys with an IP address in combination with a session cookie, this will use 62 WCUs, and aggregation keys with an IP address, session cookie, and customer header will use 92 WCUs. For more details about the WCU-based cost structure, visit Rate-based rule statement in the AWS WAF Developer Guide.
Conclusion
In this blog post, you learned about AWS WAF enhancements to existing rate-based rules that now support request parameters in addition to IP addresses. Additionally, these enhancements allow you to create composite keys based on up to five request parameters. This new capability allows you to be either more coarse in aggregating requests (such as all the requests that have an IP reputation label associated with them) or finer (such as aggregate requests for a specific session ID, not its IP address).
For more rule examples that include JSON rule configuration, visit Rate-based rule examples in the AWS WAF Developer Guide.
If you have feedback about this post, submit comments in the Comments section below. If you have questions about this post, contact AWS Support.
Want more AWS Security news? Follow us on Twitter.
Improving Worker Tail scalability
Post Syndicated from Joshua Johnson original http://blog.cloudflare.com/improving-worker-tail-scalability/


Being able to get real-time information from applications in production is extremely important. Many times software passes local testing and automation, but then users report that something isn’t working correctly. Being able to quickly see what is happening, and how often, is critical to debugging.
This is why we originally developed the Workers Tail feature – to allow developers the ability to view requests, exceptions, and information for their Workers and to provide a window into what’s happening in real time. When we developed it, we also took the opportunity to build it on top of our own Workers technology using products like Trace Workers and Durable Objects. Over the last couple of years, we’ve continued to iterate on this feature – allowing users to quickly access logs from the Dashboard and via Wrangler CLI.
Today, we’re excited to announce that tail can now be enabled for Workers at any size and scale! In addition to telling you about the new and improved scalability, we wanted to share how we built it, and the changes we made to enable it to scale better.
Why Tail was limited
Tail leverages Durable Objects to handle coordination between the Worker producing messages and consumers like wrangler and the Cloudflare dashboard, and Durable Objects are a great choice for handling real-time communication like this. However, when a single Durable Object instance starts to receive a very high volume of traffic – like the kind that can come with tailing live Workers – it can see some performance issues.
As a result, Workers with a high volume of traffic could not be supported by the original Tail infrastructure. Tail had to be limited to Workers receiving 100 requests/second (RPS) or less. This was a significant limitation that resulted in many users with large, high-traffic Workers having to turn to their own tooling to get proper observability in production.
Believing that every feature we provide should scale with users during their development journey, we set out to improve Tail's performance at high loads.
Updating the way filters work
The first improvement was to the existing filtering feature. When starting a Tail with wrangler tail (and now with the Cloudflare dashboard) users have the ability to filter out messages based on information in the requests or logs.
Previously, this filtering was handled within the Durable Object, which meant that even if a user was filtering out the majority of their traffic, the Durable Object would still have to handle every message. Often users with high traffic Tails were using many filters to better interpret their logs, but wouldn’t be able to start a Tail due to the 100 RPS limit.
We moved filtering out of the Durable Object and into the Tail message producer, preventing any filtered messages from reaching the Tail Durable Object, and thereby reducing the load on the Tail Durable Object. Moving the filtering out of the Durable Object was the first step in improving Tail’s performance at scale.
Sampling logs to keep Tails within Durable Object limits
After moving log filtering outside of the Durable Object, there was still the issue of determining when Tails could be started since there was no way to determine to what degree filters would reduce traffic for a given Tail, and simply starting a Durable Object back up would mean that it more than likely hit the 100 RPS limit immediately.
The solution for this was to add a safety mechanism for the Durable Object while the Tail was running.
We created a simple controller to track the RPS hitting a Durable Object and sample messages until the desired volume of 100 RPS is reached. As shown below, sampling keeps the Tail Durable Object RPS below the target of 100.

When messages are sampled, the following message appears every five seconds to let the user know that they are in sampling mode:

This message goes away once the Tail is stopped or filters are applied that drop the RPS below 100.
A final failsafe
Finally as a last resort a failsafe mechanism was added in the case the Durable Object gets fully overloaded. Since RPS tracking is done within the Durable Object, if the Durable Object is overloaded due to an extremely large amount of traffic, the sampling mechanism will fail.
In the case that an overload is detected, all messages forwarded to the Durable Object are stopped periodically to prevent any issues with Workers infrastructure.

Here we can see a user who had a large amount of traffic that started to become sampled. As the traffic increased, the number of sampled messages grew. Since the traffic was too fast for the sampling mechanism to handle, the Durable Object got overloaded. However, soon excess messages were blocked and the overload stopped.
Try it out
These new improvements are in place currently and available to all users 🎉
To Tail Workers via the Dashboard, log in, navigate to your Worker, and click on the Logs tab. You can then start a log stream via the default view.

If you’re using the Wrangler CLI, you can start a new Tail by running wrangler tail.
Beyond Worker tail
While we're excited for tail to be able to reach new limits and scale, we also recognize users may want to go beyond the live logs provided by Tail.
For example, if you’d like to push log events to additional destinations for a historical view of your application’s performance, we offer Logpush. If you’d like more insight into and control over log messages and events themselves, we offer Tail Workers.
These products, and others, can be read about in our Logs documentation. All of them are available for use today.
Reduce costs and enable integrated SMS tracking with Braze URL shortening
Post Syndicated from Umesh Kalaspurkar original https://aws.amazon.com/blogs/architecture/reduce-costs-and-enable-integrated-sms-tracking-with-braze-url-shortening/
As competition grows fiercer, marketers need ways to ensure they reach each user with personalized content on their most critical channels. Short message/messaging service (SMS) is a key part of that effort, touching more than 5 billion people worldwide, with an impressive 82% open rate. However, SMS lacks the built-in engagement metrics supported by other channels.
To bridge this gap, leading customer engagement platform, Braze, recently built an in-house SMS link shortening solution using Amazon DynamoDB and Amazon DynamoDB Accelerator (DAX). It’s designed to handle up to 27 billion redirects per month, allowing marketers to automatically shorten SMS-related URLs. Alongside the Braze Intelligence Suite, you can use SMS click data in reporting functions and retargeting actions. Read on to learn how Braze created this feature and the impact it’s having on marketers and consumers alike.
SMS link shortening approach
Many Braze customers have used third-party SMS link shortening solutions in the past. However, this approach complicates the SMS composition process and isolates click metrics from Braze analytics. This makes it difficult to get a full picture of SMS performance.

Figure 1. Multiple approaches for shortening URLs
The following table compares all 3 approaches for their pros and cons.
| Scenario | #1 – Unshortened URL in SMS | #2 – 3rd Party Shortener | #3 – Braze Link Shortening & Click Tracking |
|---|---|---|---|
| Low Character Count | X | ✓ | ✓ |
| Total Clicks | X | ✓ | ✓ |
| Ability to Retarget Users | X | X | ✓ |
| Ability to Trigger Subsequent Messages | X | X | ✓ |
With link shortening built in-house and more tightly integrated into the Braze platform, Braze can maintain more control over their roadmap priority. By developing the tool internally, Braze achieved a 90% reduction in ongoing expenses compared with the $400,000 annual expense associated with using an outside solution.
Braze SMS link shortening: Flow and architecture

Figure 2. SMS link shortening architecture
The following steps explain the link shortening architecture:
- First, customers initiate campaigns via the Braze Dashboard. Using this interface, they can also make requests to shorten URLs.
- The URL registration process is managed by a Kubernetes-deployed Go-based service. This service not only shortens the provided URL but also maintains reference data in Amazon DynamoDB.
- After processing, the dashboard receives the generated campaign details alongside the shortened URL.
- The fully refined campaign can be efficiently distributed to intended recipients through SMS channels.
- Upon a user’s interaction with the shortened URL, the message gets directed to the URL redirect service. This redirection occurs through an Application Load Balancer.
- The redirect service processes links in messages, calls the service, and replaces links before sending to carriers.
- Asynchronous calls feed data to a Kafka queue for metrics, using the HTTP sink connector integrated with Braze systems.
The registration and redirect services are decoupled from the Braze platform to enable independent deployment and scaling due to different requirements. Both the services are running the same code, but with different endpoints exposed, depending on the functionality of a given Kubernetes pod. This restricts internal access to the registration endpoint and permits independent scaling of the services, while still maintaining a fast response time.
Braze SMS link shortening: Scale
Right now, our customers use the Braze platform to send about 200 million SMS messages each month, with peak speeds of around 2,000 messages per second. Many of these messages contain one or more URLs that need to be shortened. In order to support the scalability of the link shortening feature and give us room to grow, we designed the service to handle 33 million URLs sent per month, and 3.25 million redirects per month. We assumed that we’d see up to 65 million database writes per month and 3.25 million reads per month in connection with the redirect service. This would require storage of 65 GB per month, with peaks of ~2,000 writes and 100 reads per second.
With these needs in mind, we carried out testing and determined that Amazon DynamoDB made the most sense as the backend database for the redirect service. To determine this, we tested read and write performance and found that it exceeded our needs. Additionally, it was fully managed, thus requiring less maintenance expertise, and included DAX out of the box. Most clicks happen close to send, so leveraging DAX helps us smooth out the read and write load associated with the SMS link shortener.
Because we know how long we must keep the relevant written elements at write time, we’re able to use DynamoDB Time to Live (TTL) to effectively manage their lifecycle. Finally, we’re careful to evenly distribute partition keys to avoid hot partitions, and DynamoDB’s autoscaling capabilities make it possible for us to respond more efficiently to spikes in demand.
Braze SMS link shortening: Flow

Figure 3. Braze SMS link shortening flow
- When the marketer initiates an SMS send, Braze checks its primary datastore (a MongoDB collection) to see if the link has already been shortened (see Figure 3). If it has, Braze re-uses that shortened link and continues the send. If it hasn’t, the registration process is initiated to generate a new site identifier that encodes the generation date and saves campaign information in DynamoDB via DAX.
- The response from the registration service is used to generate a short link (1a) for the SMS.
- A recipient gets an SMS containing a short link (2).
- Recipient decides to tap it (3). Braze smoothly redirects them to the destination URL, and updates the campaign statistics to show that the link was tapped.
- Using Amazon Route 53’s latency-based routing, Braze directs the recipient to the nearest endpoint (Braze currently has North America and EU deployments), then inspects the link to ensure validity and that it hasn’t expired. If it passes those checks, the redirect service queries DynamoDB via DAX for information about the redirect (3a). Initial redirects are cached at send time, while later requests query the DAX cache.
- The user is redirected with a P99 redirect latency of less than 10 milliseconds (3b).
- Emit campaign-level metrics on redirects.
Braze generates URL identifiers, which serve as the partition key to the DynamoDB collection, by generating a random number. We concatenate the generation date timestamp to the number, then Base66 encode the value. This results in a generated URL that looks like https://brz.ai/5xRmz, with “5xRmz” being the encoded URL identifier. The use of randomized partition keys helps avoid hot, overloaded partitions. Embedding the generation date lets us see when a given link was generated without querying the database. This helps us maintain performance and reduce costs by removing old links from the database. Other cost control measures include autoscaling and the use of DAX to avoid repeat reads of the same data. We also query DynamoDB directly against a hash key, avoiding scatter-gather queries.
Braze link shortening feature results
Since its launch, SMS link shortening has been used by over 300 Braze customer companies in more than 700 million SMS messages. This includes 50% of the total SMS volume sent by Braze during last year’s Black Friday period. There has been a tangible reduction in the time it takes to build and send SMS. “The Motley Fool”, a financial media company, saved up to four hours of work per month while driving click rates of up to 15%. Another Braze client utilized multimedia messaging service (MMS) and link shortening to encourage users to shop during their “Smart Investment” campaign, rewarding users with additional store credit. Using the engagement data collected with Braze link shortening, they were able to offer engaged users unique messaging and follow-up offers. They retargeted users who did not interact with the message via other Braze messaging channels.
Conclusion
The Braze platform is designed to be both accessible to marketers and capable of supporting best-in-class cross-channel customer engagement. Our SMS link shortening feature, supported by AWS, enables marketers to provide an exceptional user experience and save time and money.
Further reading:
Best of History Guy: Hats
Post Syndicated from The History Guy: History Deserves to Be Remembered original https://www.youtube.com/watch?v=0vOAEQlb7v0
Spyware Vendor Hacked
Post Syndicated from Bruce Schneier original https://www.schneier.com/blog/archives/2023/09/spyware-vendor-hacked.html
A Brazilian spyware app vendor was hacked by activists:
In an undated note seen by TechCrunch, the unnamed hackers described how they found and exploited several security vulnerabilities that allowed them to compromise WebDetetive’s servers and access its user databases. By exploiting other flaws in the spyware maker’s web dashboard—used by abusers to access the stolen phone data of their victims—the hackers said they enumerated and downloaded every dashboard record, including every customer’s email address.
The hackers said that dashboard access also allowed them to delete victim devices from the spyware network altogether, effectively severing the connection at the server level to prevent the device from uploading new data. “Which we definitely did. Because we could. Because #fuckstalkerware,” the hackers wrote in the note.
The note was included in a cache containing more than 1.5 gigabytes of data scraped from the spyware’s web dashboard. That data included information about each customer, such as the IP address they logged in from and their purchase history. The data also listed every device that each customer had compromised, which version of the spyware the phone was running, and the types of data that the spyware was collecting from the victim’s phone.
Sigma 23mm f/1.4 APSC VS FujiFilm (Fuji X Mount)
Post Syndicated from Matt Granger original https://www.youtube.com/watch?v=9XLR1rEY1AE
AIC HA401-TU High-Availability SAS Storage Server Review
Post Syndicated from Patrick Kennedy original https://www.servethehome.com/aic-ha401-tu-high-availability-sas-storage-server-review-intel-micron-broadcom/
In our AIC HA401-TU reivew, we see how this 4U dual node high-availability SAS3 storage chassis is built and what makes it unique
The post AIC HA401-TU High-Availability SAS Storage Server Review appeared first on ServeTheHome.
The Schedule for the PromCon Europe 2023 is Live
Post Syndicated from Matthias Loibl (@metalmatze) original https://prometheus.io/blog/2023/09/01/promcon2023-schedule/
tax deductions
Post Syndicated from Oglaf! -- Comics. Often dirty. original https://www.oglaf.com/tax-deductions/


Fossil
Post Syndicated from xkcd.com original https://xkcd.com/2823/

The Schedule for the PromCon Europe 2023 is Live
Post Syndicated from Matthias Loibl (@metalmatze) original https://prometheus.io/blog/2023/09/01/promcon2023-schedule/
PromCon Europe is the eighth conference fully dedicated to the Prometheus monitoring system
Berlin, Germany – September 1, 2023 – The CNCF and the Prometheus team, released the two-day schedule for the single-track PromCon Europe 2023 conference happening in Berlin, Germany from September 28 to September 29, 2023. Attendees will be able to choose from 21 full-length (25min) sessions and up to 20 five-minute lightning talk sessions spanning diverse topics related to Prometheus.
Now in its 8th installment, PromCon brings together Prometheus users and developers from around the world to exchange knowledge, best practices, and experience gained through using Prometheus. The program committee reviewed 66 submissions that will provide a fresh and informative look into the most pressing topics around Prometheus today.
“We are super excited for PromCon to be coming home to Berlin. Prometheus was started in Berlin at Soundcloud in 2012. The first PromCon was hosted in Berlin and in between moved to Munich. This year we’re hosting around 300 attendees at Radialsystem in Friedrichshain, Berlin. Berlin has a vibrant Prometheus community and many of the Prometheus team members live in the neighborhood. It is a great opportunity to network and connect with the Prometheus family who are all passionate about systems and service monitoring,” said Matthias Loibl, Senior Software Engineer at Polar Signals and Prometheus team member who leads this year’s PromCon program committee. “It will be a great event to learn about the latest developments from the Prometheus team itself and connect to some big-scale users of Prometheus up close.”
The community-curated schedule will feature sessions from open source community members, including:
- Towards making Prometheus OpenTelemetry native
- How to Monitor Global Tens of Thousands of Kubernetes Clusters with Thanos Federation
- Prometheus Java Client 1.0.0
- Perses
- Where’s your money going? The Beginners Guide To Measuring Kubernetes Costs
For the full PromCon Europe 2023 program, please visit the schedule.
Registration
Register for the in-person standard pricing of $350 USD through September 25. The venue has space for 300 attendees so don’t wait!
Thank You to Our Sponsors
PromCon Europe 2023 has been made possible thanks to the amazing community around Prometheus and support from our Diamond Sponsor Grafana Labs, Platinum Sponsor Red Hat as well as many more Gold, and Startup sponsors. This year’s edition is organized by Polar Signals and CNCF.
Watch the Prometheus Documentary
Contact
Jessie Adams-Shore – The Linux Foundation – [email protected]
PromCon Organizers – [email protected]
Fake Update Utilizes New IDAT Loader To Execute StealC and Lumma Infostealers
Post Syndicated from Natalie Zargarov original https://blog.rapid7.com/2023/08/31/fake-update-utilizes-new-idat-loader-to-execute-stealc-and-lumma-infostealers/

Technical Analysis by: Thomas Elkins, Natalie Zargarov
Contributions: Evan McCann, Tyler McGraw
Recently, Rapid7 observed the Fake Browser Update lure tricking users into executing malicious binaries. While analyzing the dropped binaries, Rapid7 determined a new loader is utilized in order to execute infostealers on compromised systems including StealC and Lumma.
The IDAT loader is a new, sophisticated loader that Rapid7 first spotted in July 2023. In earlier versions of the loader, it was disguised as a 7-zip installer that delivered the SecTop RAT. Rapid7 has now observed the loader used to deliver infostealers like Stealc, Lumma, and Amadey. It implements several evasion techniques including Process Doppelgänging, DLL Search Order Hijacking, and Heaven’s Gate. IDAT loader got its name as the threat actor stores the malicious payload in the IDAT chunk of PNG file format.
Prior to this technique, Rapid7 observed threat actors behind the lure utilizing malicious JavaScript files to either reach out to Command and Control (C2) servers or drop the Net Support Remote Access Trojan (RAT).
The following analysis covers the entire attack flow, which starts from the SocGholish malware and ends with the stolen information in threat actors’ hands.
Technical Analysis
Threat Actors (TAs) are often staging their attacks in the way security tools will not detect them and security researchers will have a hard time investigating them.
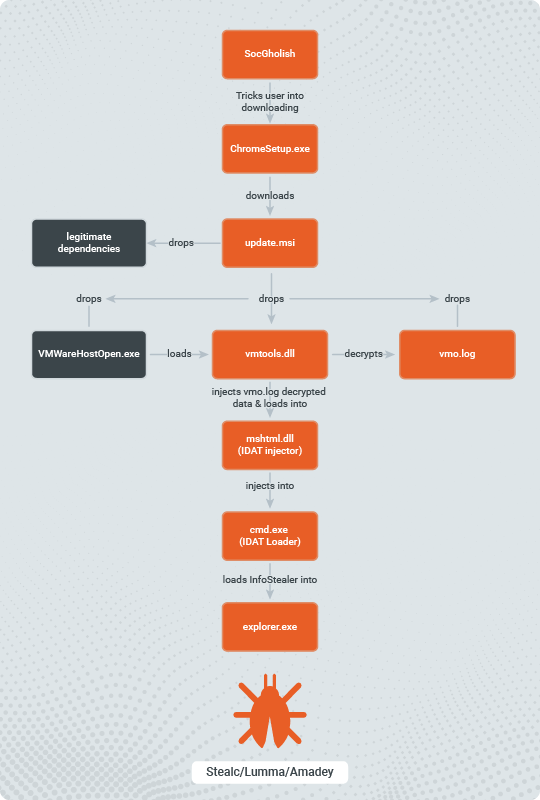
Stage 1 – SocGholish
First observed in the wild as early as 2018, SocGholish was attributed to TA569. Mainly recognized for its initial infection method characterized as “drive-by” downloads, this attack technique involves the injection of malicious JavaScript into compromised yet otherwise legitimate websites. When an unsuspecting individual receives an email with a link to a compromised website and clicks on it, the injected JavaScript will activate as soon as the browser loads the page.
The injected JavaScript investigated by Rapid7 loads an additional JavaScript that will access the final URL when all the following browser conditions are met:
- The access originated from the Windows OS
- The access originated from an external source
- Cookie checks are passed

This prompt falsely presents itself as a browser update, with the added layer of credibility coming from the fact that it appears to originate from the intended domain.

Once the user interacts with the “Update Chrome” button, the browser is redirected to another URL where a binary automatically downloads to the user’s default download folder. After the user double clicks the fake update binary, it will proceed to download the next stage payload. In this investigation, Rapid7 identified a binary called ChromeSetup.exe, the file name widely used in previous SocGholish attacks.
Stage 2 – MSI Downloader
ChromeSetup.exe downloads and executes the Microsoft Software Installer (MSI) package from: hxxps://ocmtancmi2c5t[.]xyz/82z2fn2afo/b3/update[.]msi.
In similar investigations, Rapid7 observed that the initial dropper executable appearance and file name may vary depending on the user’s browser when visiting the compromised web page. In all instances, the executables contained invalid signatures and attempted to download and install an MSI package.
Rapid7 determined that the MSI package executed with several switches intended to avoid detection:
- /qn to avoid an installation UI
- /quiet to prevent user interaction
- /norestart to prevent the system from restarting during the infection process
When executed, the MSI dropper will write a legitimate VMwareHostOpen.exe executable, multiple legitimate dependencies, and the malicious Dynamic-Link Library (DLL) file vmtools.dll. It will also drop an encrypted vmo.log file which has a PNG file structure and is later decrypted by the malicious DLL.
Rapid7 spotted an additional version of the attack where the MSI dropped a legitimate pythonw.exe, legitimate dependencies, and the malicious DLL file python311.dll. In that case, the encrypted file was named pz.log, though the execution flow remains the same.

Stage 3 – Decryptor
When executed, the legitimate VMWareHostOpen.exe loads the malicious vmtools.dll from the same directory as from which the VMWareHostOpen.exe is executed. This technique is known as DLL Search Order Hijacking.
During the execution of vmtools.dll, Rapid7 observed that the DLL loads API libraries from kernel32.dll and ntdll.dll using API hashing and maps them to memory. After the API functions are mapped to memory, the DLL reads the hex string 83 59 EB ED 50 60 E8 and decrypts it using a bitwise XOR operation with the key F5 34 84 C3 3C 0F 8F, revealing the string vmo.log. The file is similar to the Vmo\log directory, where Vmware logs are stored.
The DLL then reads the contents from vmo.log into memory and searches for the string …IDAT. The DLL takes 4 bytes following …IDAT and compares them to the hex values of C6 A5 79 EA. If the 4 bytes following …IDAT are equal to the hex values C6 A5 79 EA, the DLL proceeds to copy all the contents following …IDAT into memory.

Once all the data is copied into memory, the DLL attempts to decrypt the copied data using the bitwise XOR operation with key F4 B4 07 9A. Upon additional analysis of other samples, Rapid7 determined that the XOR keys were always stored as 4 bytes following the hex string C6 A5 79 EA.

Once the DLL decrypts the data in memory, it is decompressed using the RTLDecompressBuffer function. The parameters passed to the function include:
- Compression format
- Size of compressed data
- Size of compressed buffer
- Size of uncompressed data
- Size of uncompressed buffer

The vmtools.dll DLL utilizes the compression algorithm LZNT1 in order to decompress the decrypted data from the vmo.log file.
After the data is decompressed, the DLL loads mshtml.dll into memory and overwrites its .text section with the decompressed code. After the overwrite, vmtools.dll calls the decompressed code.
Stage 4 – IDAT Injector
Similarly to vmtools.dll, IDAT loader uses dynamic imports. The IDAT injector then expands the %APPDATA% environment variable by using the ExpandEnvironmentStringsW API call. It creates a new folder under %APPDATA%, naming it based on the QueryPerformanceCounter API call output and randomizing its value.
All the dropped files by MSI are copied to the newly created folder. IDAT then creates a new instance of VMWareHostOpen.exe from the %APPDATA% by using CreateProcessW and exits.
The second instance of VMWareHostOpen.exe behaves the same up until the stage where the IDAT injector code is called from mshtml.dll memory space. IDAT immediately started the implementation of the Heaven’s Gate evasion technique, which it uses for most API calls until the load of the infostealer is completed.
Heaven’s Gate is widely used by threat actors to evade security tools. It refers to a method for executing a 64-bit process within a 32-bit process or vice versa, allowing a 32-bit process to run in a 64-bit process. This is accomplished by initiating a call or jump instruction through the use of a reserved selector. The key points in analyzing this technique in our case is to change the process mode from 32-bit to 64-bit, the specification of the selector “0x0033” required and followed by the execution of a far call or far jump, as shown in Figure 8.

Figure 8 – Heaven’s Gate technique implementation
The IDAT injector then expands the %TEMP% environment variable by using the ExpandEnvironmentStringsW API call. It creates a string based on the QueryPerformanceCounter API call output and randomizes its value.
Next, the IDAT loader gets the computer name by calling GetComputerNameW API call, and the output is randomized by using rand and srand API calls. It uses that randomized value to set a new environment variable by using SetEnvironmentVariableW. This variable is set to a combination of %TEMP% path with the randomized string created previously.

Now, the new cmd.exe process is executed by the loader. The loader then creates and writes to the %TEMP%\89680228 file.
Next, the IDAT injects code into cmd.exe process by using NtCreateSection + NtMapViewOfSection Code Injection technique. Using this technique the malware:
- Creates a new memory section inside the remote process by using the NtCreateSection API call
- Maps a view of the newly created section to the local malicious process with RW protection by using NtMapViewOfSection API call
- Maps a view of the previously created section to a remote target process with RX protection by using NtMapViewOfSection API call
- Fills the view mapped in the local process with shellcode by using NtWriteVirtualMemory API call
- In our case, IDAT loader suspends the main thread on the cmd.exe process by using NtSuspendThread API call and then resumes the thread by using NtResumeThread API call
After completing the injection, the second instance of VMWareHostOpen.exe exits.
Stage 5 – IDAT Loader:
The injected loader code implements the Heaven’s Gate evasion technique in exactly the same way as the IDAT injector did. It retrieves the TCBEDOPKVDTUFUSOCPTRQFD environment variable, and reads the %TEMP%\89680228 file data into the memory. The data is then recursively XORed with the 3D ED C0 D3 key.
The decrypted data seems to contain configuration data, including which process the infostealer should be loaded, which API calls should be dynamically retrieved, additional code,and more. The loader then deletes the initial malicious DLL (vmtools.dll) by using DeleteFileW. The loader finally injects the infostealer code into the explorer.exe process by using the Process Doppelgänging injection technique.
The Process Doppelgänging method utilizes the Transactional NTFS feature within the Windows operating system. This feature is designed to ensure data integrity in the event of unexpected errors. For instance, when an application needs to write or modify a file, there’s a risk of data corruption if an error occurs during the write process. To prevent such issues, an application can open the file in a transactional mode to perform the modification and then commit the modification, thereby preventing any potential corruption. The modification either succeeds entirely or does not commence.
Process Doppelgänging exploits this feature to replace a legitimate file with a malicious one, leading to a process injection. The malicious file is created within a transaction, then committed to the legitimate file, and subsequently executed. The Process Doppelgänging in our sample was performed by:
- Initiating a transaction by using NtCreateTransaction API call
- Creating a new file by using NtCreateFile API call
- Writing to the new file by using NtWriteFile API call
- Writing malicious code into a section of the local process using NtCreateSection API call
- Discarding the transaction by using NtRollbackTransaction API call
- Running a new instance of explorer.exe process by using NtCreateProcessEx API call
- Running the malicious code inside explorer.exe process by using NtCreateThreadEx API call
If the file created within a transaction is rolled back (instead of committed), but the file section was already mapped into the process memory, the process injection will still be performed.
The final payload injected into the explorer.exe process was identified by Rapid7 as Lumma Stealer.

Throughout the whole attack flow, the malware delays execution by using NtDelayExecution, a technique that is usually used to escape sandboxes.
As previously mentioned, Rapid7 has investigated several IDAT loader samples. The main differences were:
- The legitimate software that loads the malicious DLL.
- The name of the staging directory created within %APPDATA%.
- The process the IDAT injector injects the Loader code to.
- The process into which the infostealer/RAT loaded into.
- Rapid7 observed the IDAT loader has been used to load the following infostealers and RAT: Stealc, Lumma and Amadey infostealers and SecTop RAT.


Conclusion
IDAT Loader is a new sophisticated loader that utilizes multiple evasion techniques in order to execute various commodity malware including InfoStealers and RAT’s. The Threat Actors behind the Fake Update campaign have been packaging the IDAT Loader into DLLs that are loaded by legitimate programs such as VMWarehost, Python and Windows Defender.
Rapid7 Customers
For Rapid7 MDR and InsightIDR customers, the following Attacker Behavior Analytics (ABA) rules are currently deployed and alerting on the activity described in this blog:
- Attacker Technique – MSIExec loading object via HTTP
- Suspicious Process – FSUtil Zeroing Out a File
- Suspicious Process – Users Script Spawns Cmd And Redirects Output To Temp File
- Suspicious Process – Possible Dropper Script Executed From Users Downloads Directory
- Suspicious Process – WScript Runs JavaScript File from Temp Or Download Directory
MITRE ATT&CK Techniques:
| Initial Access | Drive-by Compromise (T1189) | The SocGholish Uses Drive-by Compromise technique to target user’s web browser |
|---|---|---|
| Defense Evasion | System Binary Proxy Execution: Msiexec (T1218.007) | The ChromeSetup.exe downloader (C9094685AE4851FD5A5B886B73C7B07EFD9B47EA0BDAE3F823D035CF1B3B9E48) downloads and executes .msi file |
| Execution | User Execution: Malicious File (T1204.002) | Update.msi (53C3982F452E570DB6599E004D196A8A3B8399C9D484F78CDB481C2703138D47) drops and executes VMWareHostOpen.exe |
| Defense Evasion | Hijack Execution Flow: DLL Search Order Hijacking (T1574.001) | VMWareHostOpen.exe loads a malicious vmtools.dll (931D78C733C6287CEC991659ED16513862BFC6F5E42B74A8A82E4FA6C8A3FE06) |
| Defense Evasion | Deobfuscate/Decode Files or Information (T1140) | vmtools.dll (931D78C733C6287CEC991659ED16513862BFC6F5E42B74A8A82E4FA6C8A3FE06) decrypts vmo.log(51CEE2DE0EBE01E75AFDEFFE29D48CB4D413D471766420C8B8F9AB08C59977D7) file |
| Defense Evasion | Masquerading (T1036) | vmo.log(51CEE2DE0EBE01E75AFDEFFE29D48CB4D413D471766420C8B8F9AB08C59977D7) file masqueraded to .png file |
| Execution | Native API (T1106) | The IDAT injector and IDAT loader are using Heaven’s Gate technique to evade detection |
| Defense Evasion | Process Injection (T1055) | IDAT injector implements NtCreateSection + NtMapViewOfSection Code Injection technique to inject into cmd.exe process |
| Defense Evasion | Process Injection: Process Doppelgänging (T1055.013) | IDAT loader implements Process Doppelgänging technique to load the InfoStealer |
| Defense Evasion | Virtualization/Sandbox Evasion: Time Based Evasion (T1497.003) | Execution delays are performed by several stages throughout the attack flow |
IOCs
| IOC | SHA-256 | Notes |
|---|---|---|
| InstaIIer.exe | A0319E612DE3B7E6FBB4B71AA7398266791E50DA0AE373C5870C3DCAA51ABCCF | MSI downloader |
| ChromeSetup.exe | C9094685AE4851FD5A5B886B73C7B07EFD9B47EA0BDAE3F823D035CF1B3B9E48 | MSI downloader |
| MlcrоsоftЕdgеSеtuр.exe | 3BF4B365D61C1E9807D20E71375627450B8FEA1635CB6DDB85F2956E8F6B3EC3 | MSI downloader |
| update.msi | 53C3982F452E570DB6599E004D196A8A3B8399C9D484F78CDB481C2703138D47 | MSI dropper, dropped pythonw.exe, python311.dll and pz.log files |
| update.msi | D19C166D0846DDAF1A6D5DBD62C93ACB91956627E47E4E3CBD79F3DFB3E0F002 | MSI dropper, dropped VMWareHostOpen.exe, vmtools.dll and vmo.log files |
| DirectX12AdvancedSupport.msi | B287C0BC239B434B90EEF01BCBD00FF48192B7CBEB540E568B8CDCDC26F90959 | MSI dropper, dropped MpCopyAccelerator.exe, MpClient.dll, and virginium.flac file |
| python311.dll | BE8EB5359185BAA8E456A554A091EC54C8828BB2499FE332E9ECD65639C9A75B | Malicious dll loaded by pythonw.exe |
| vmtools.dll | 931D78C733C6287CEC991659ED16513862BFC6F5E42B74A8A82E4FA6C8A3FE06 | Malicious dll loaded by VMWareHostOpen.exe |
| MpClient.dll | 5F57537D18ADCC1142294D7C469F565F359D5FF148E93A15CCBCEB5CA3390DBD | Malicious dll loaded by MpCopyAccelerator.exe |
| vmo.log | 51CEE2DE0EBE01E75AFDEFFE29D48CB4D413D471766420C8B8F9AB08C59977D7 | Encrypted payload decrypted by vmtools.dll |
| pz.log | 8CE0901A5CF2D3014AAA89D5B5B68666DA0D42D2294A2F2B7E3A275025B35B79 | Encrypted payload decrypted by python311.dll |
| virginium.flac | B3D8BC93A96C992099D768BEB42202B48A7FE4C9A1E3B391EFBEEB1549EF5039 | Encrypted payload decrypted by MpClient.dll |
| ocmtancmi2c5t[.]xyz | Host of the MSI package | |
| lazagrc3cnk[.]xyz | Host of the MSI package | |
| omdowqind[.]site | Domain that facilitated download of the MSI downloader | |
| weomfewnfnu[.]site | Domain that facilitated download of the MSI downloader | |
| winextrabonus[.]life | Domain that facilitated download of the MSI downloader | |
| bgobgogimrihehmxerreg[.]site | Domain that facilitated download of the MSI downloader | |
| pshkjg[.]db[.]files[.]1drv[.]com | Domain that facilitated download of the MSI downloader | |
| ooinonqnbdqnjdnqwqkdn[.]space | Domain that facilitated download of the MSI downloader | |
| hello-world-broken-dust-1f1c[.]brewasigfi1978[.]workers[.]dev | Domain that facilitated download of the MSI downloader | |
| doorblu[.]xyz | C&C server | |
| costexcise[.]xyz | C&C server | |
| buyerbrand[.]xyz | C&C server | |
| 94.228.169[.]55 | C&C server | |
| gapi-node[.]io | C&C server | |
| gstatic-node[.]io | C&C server |
References:
Introducing Amazon MSK as a source for Amazon OpenSearch Ingestion
Post Syndicated from Muthu Pitchaimani original https://aws.amazon.com/blogs/big-data/introducing-amazon-msk-as-a-source-for-amazon-opensearch-ingestion/
Ingesting a high volume of streaming data has been a defining characteristic of operational analytics workloads with Amazon OpenSearch Service. Many of these workloads involve either self-managed Apache Kafka or Amazon Managed Streaming for Apache Kafka (Amazon MSK) to satisfy their data streaming needs. Consuming data from Amazon MSK and writing to OpenSearch Service has been a challenge for customers. AWS Lambda, custom code, Kafka Connect, and Logstash have been used for ingesting this data. These methods involve tools that must be built and maintained. In this post, we introduce Amazon MSK as a source to Amazon OpenSearch Ingestion, a serverless, fully managed, real-time data collector for OpenSearch Service that makes this ingestion even easier.
Solution overview
The following diagram shows the flow from data sources to Amazon OpenSearch Service.
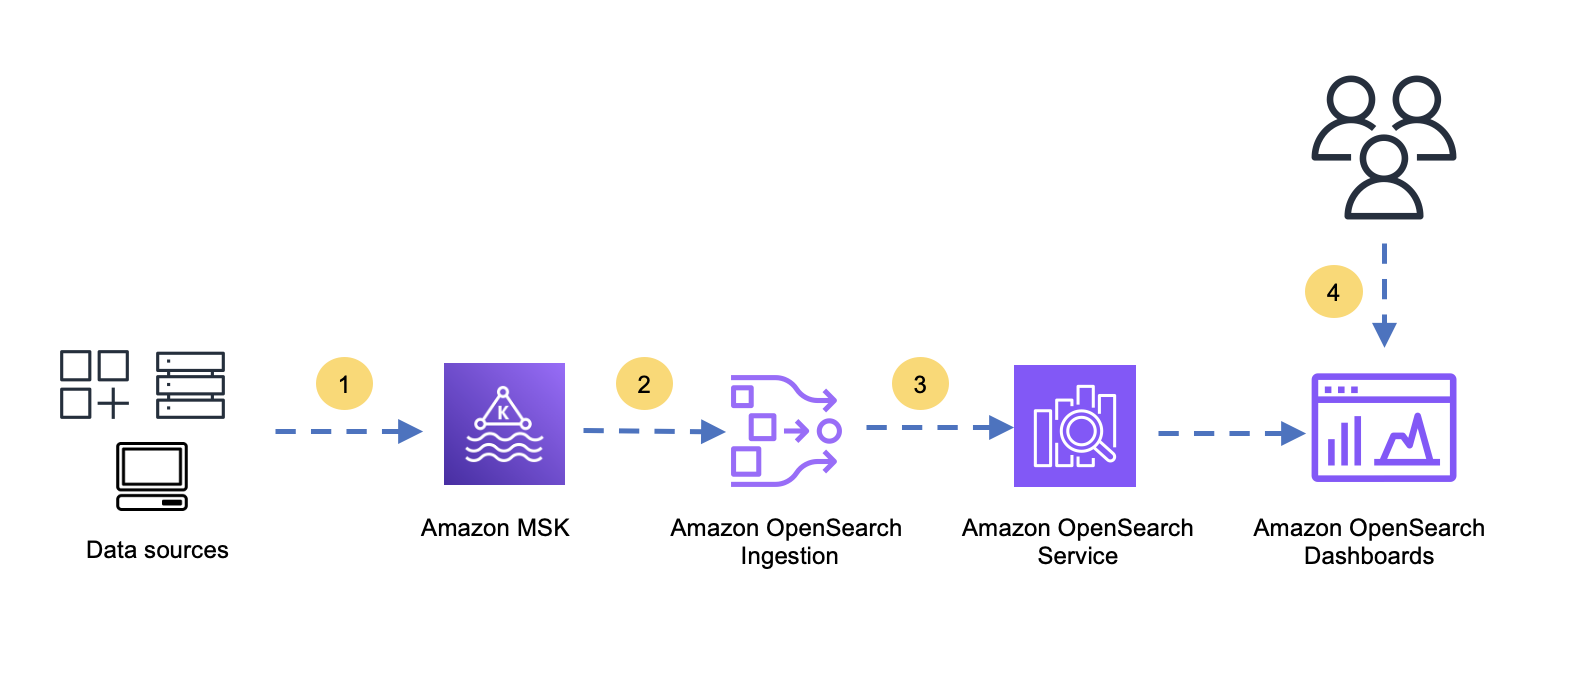
The flow contains the following steps:
- Data sources produce data and send that data to Amazon MSK
- OpenSearch Ingestion consumes the data from Amazon MSK.
- OpenSearch Ingestion transforms, enriches, and writes the data into OpenSearch Service.
- Users search, explore, and analyze the data with OpenSearch Dashboards.
Prerequisites
You will need a provisioned MSK cluster created with appropriate data sources. The sources, as producers, write data into Amazon MSK. The cluster should be created with the appropriate Availability Zone, storage, compute, security and other configurations to suit your workload needs. To provision your MSK cluster and have your sources producing data, see Getting started using Amazon MSK.
As of this writing, OpenSearch Ingestion supports Amazon MSK provisioned, but not Amazon MSK Serverless. However, OpenSearch Ingestion can reside in the same or different account where Amazon MSK is present. OpenSearch Ingestion uses AWS PrivateLink to read data, so you must turn on multi-VPC connectivity on your MSK cluster. For more information, see Amazon MSK multi-VPC private connectivity in a single Region. OpenSearch Ingestion can write data to Amazon Simple Storage Service (Amazon S3), provisioned OpenSearch Service, and Amazon OpenSearch Service. In this solution, we use a provisioned OpenSearch Service domain as a sink for OSI. Refer to Getting started with Amazon OpenSearch Service to create a provisioned OpenSearch Service domain. You will need appropriate permission to read data from Amazon MSK and write data to OpenSearch Service. The following sections outline the required permissions.
Permissions required
To read from Amazon MSK and write to Amazon OpenSearch Service, you need to create a an AWS Identity and Access Management (IAM) role used by Amazon OpenSearch Ingestion. In this post we use a role called pipeline-Role for this purpose. To create this role please see Creating IAM roles.
Reading from Amazon MSK
OpenSearch Ingestion will need permission to create a PrivateLink connection and other actions that can be performed on your MSK cluster. Edit your MSK cluster policy to include the following snippet with appropriate permissions. If your OpenSearch Ingestion pipeline resides in an account different from your MSK cluster, you will need a second section to allow this pipeline. Use proper semantic conventions when providing the cluster, topic, and group permissions and remove the comments from the policy before using.
Edit the pipeline role’s inline policy to include the following permissions. Ensure that you have removed the comments before using the policy.
Writing to OpenSearch Service
In this section, you provide the pipeline role with necessary permissions to write to OpenSearch Service. As a best practice, we recommend using fine-grained access control in OpenSearch Service. Use OpenSearch dashboards to map a pipeline role to an appropriate backend role. For more information on mapping roles to users, see Managing permissions. For example, all_access is a built-in role that grants administrative permission to all OpenSearch functions. When deploying to a production environment, ensure that you use a role with enough permissions to write to your OpenSearch domain.

Creating OpenSearch Ingestion pipelines
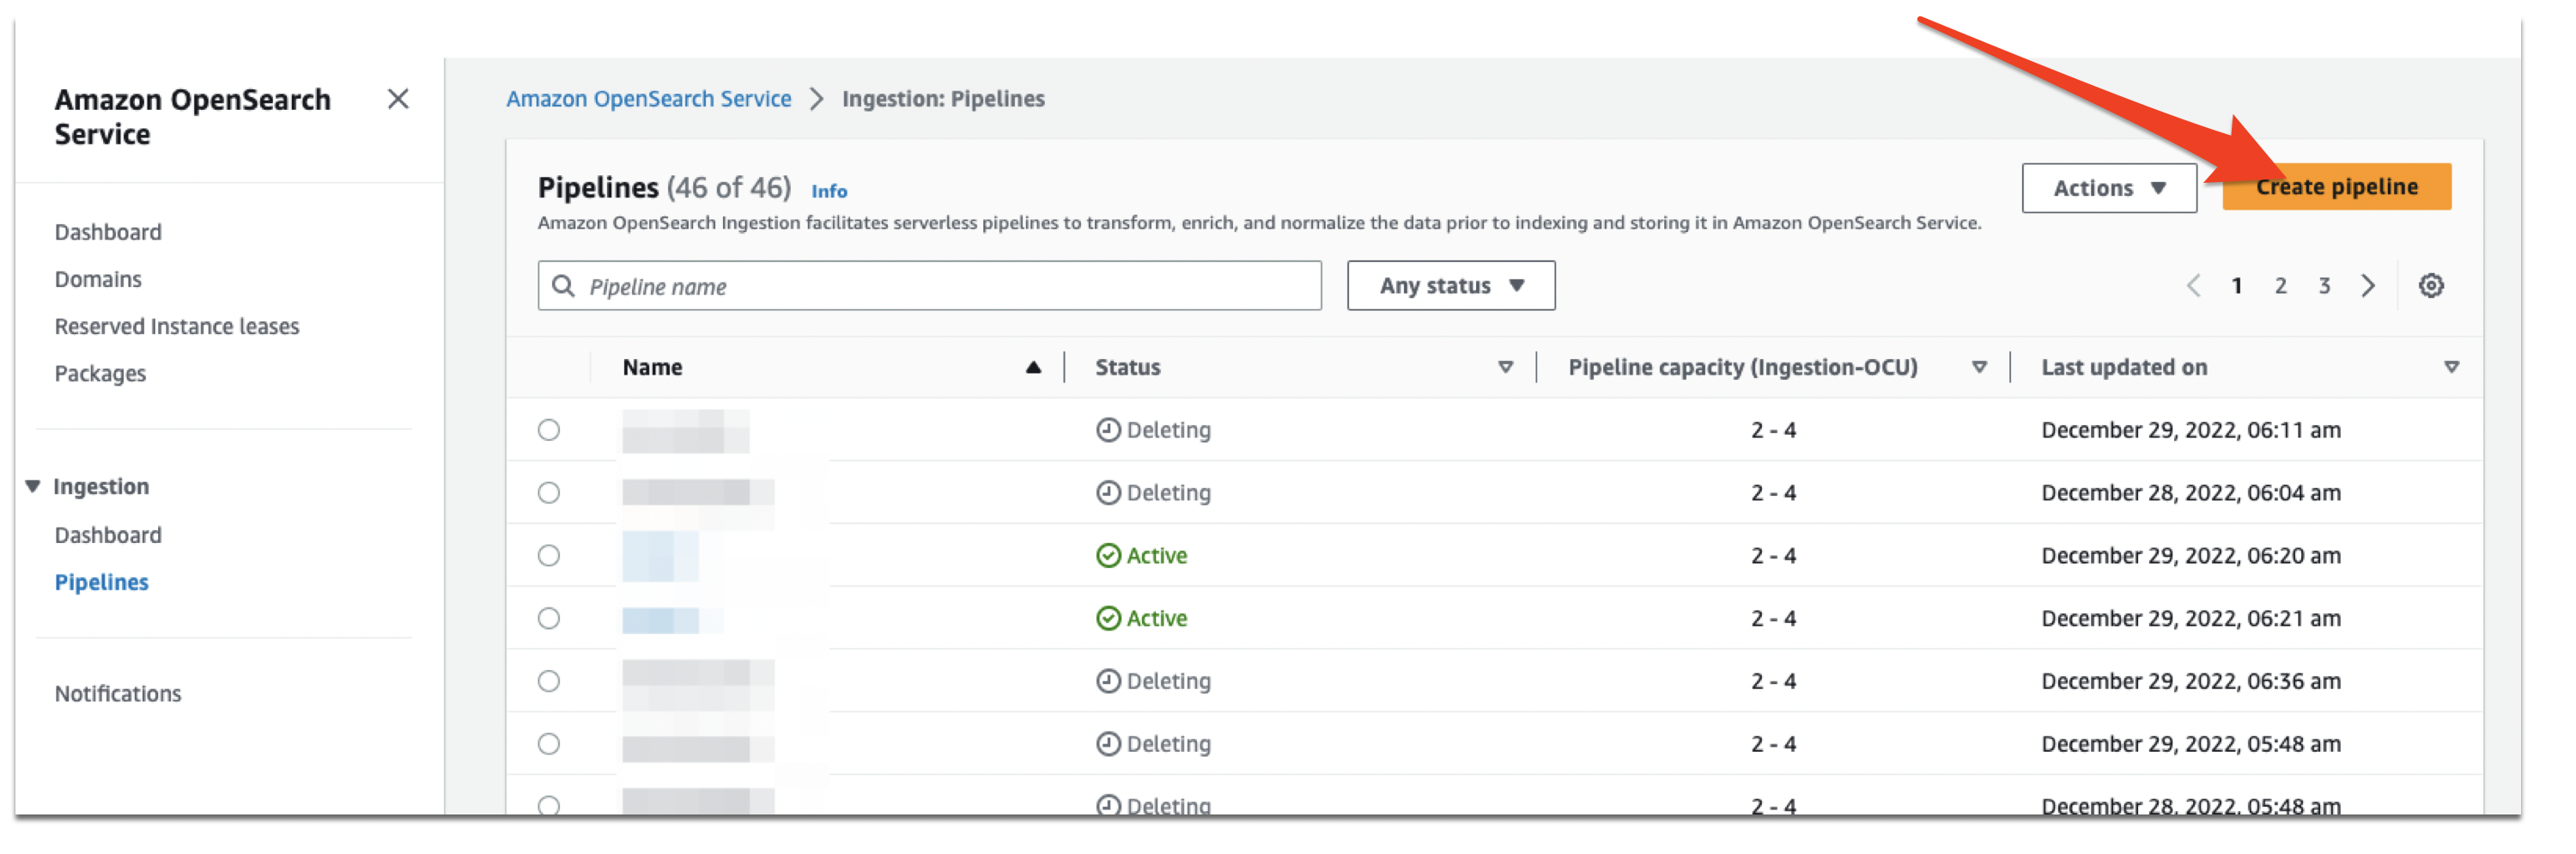
The pipeline role now has the correct set of permissions to read from Amazon MSK and write to OpenSearch Service. Navigate to the OpenSearch Service console, choose Pipelines, then choose Create pipeline.
Choose a suitable name for the pipeline. and se the pipeline capacity with appropriate minimum and maximum OpenSearch Compute Unit (OCU). Then choose ‘AWS-MSKPipeline’ from the dropdown menu as shown below.
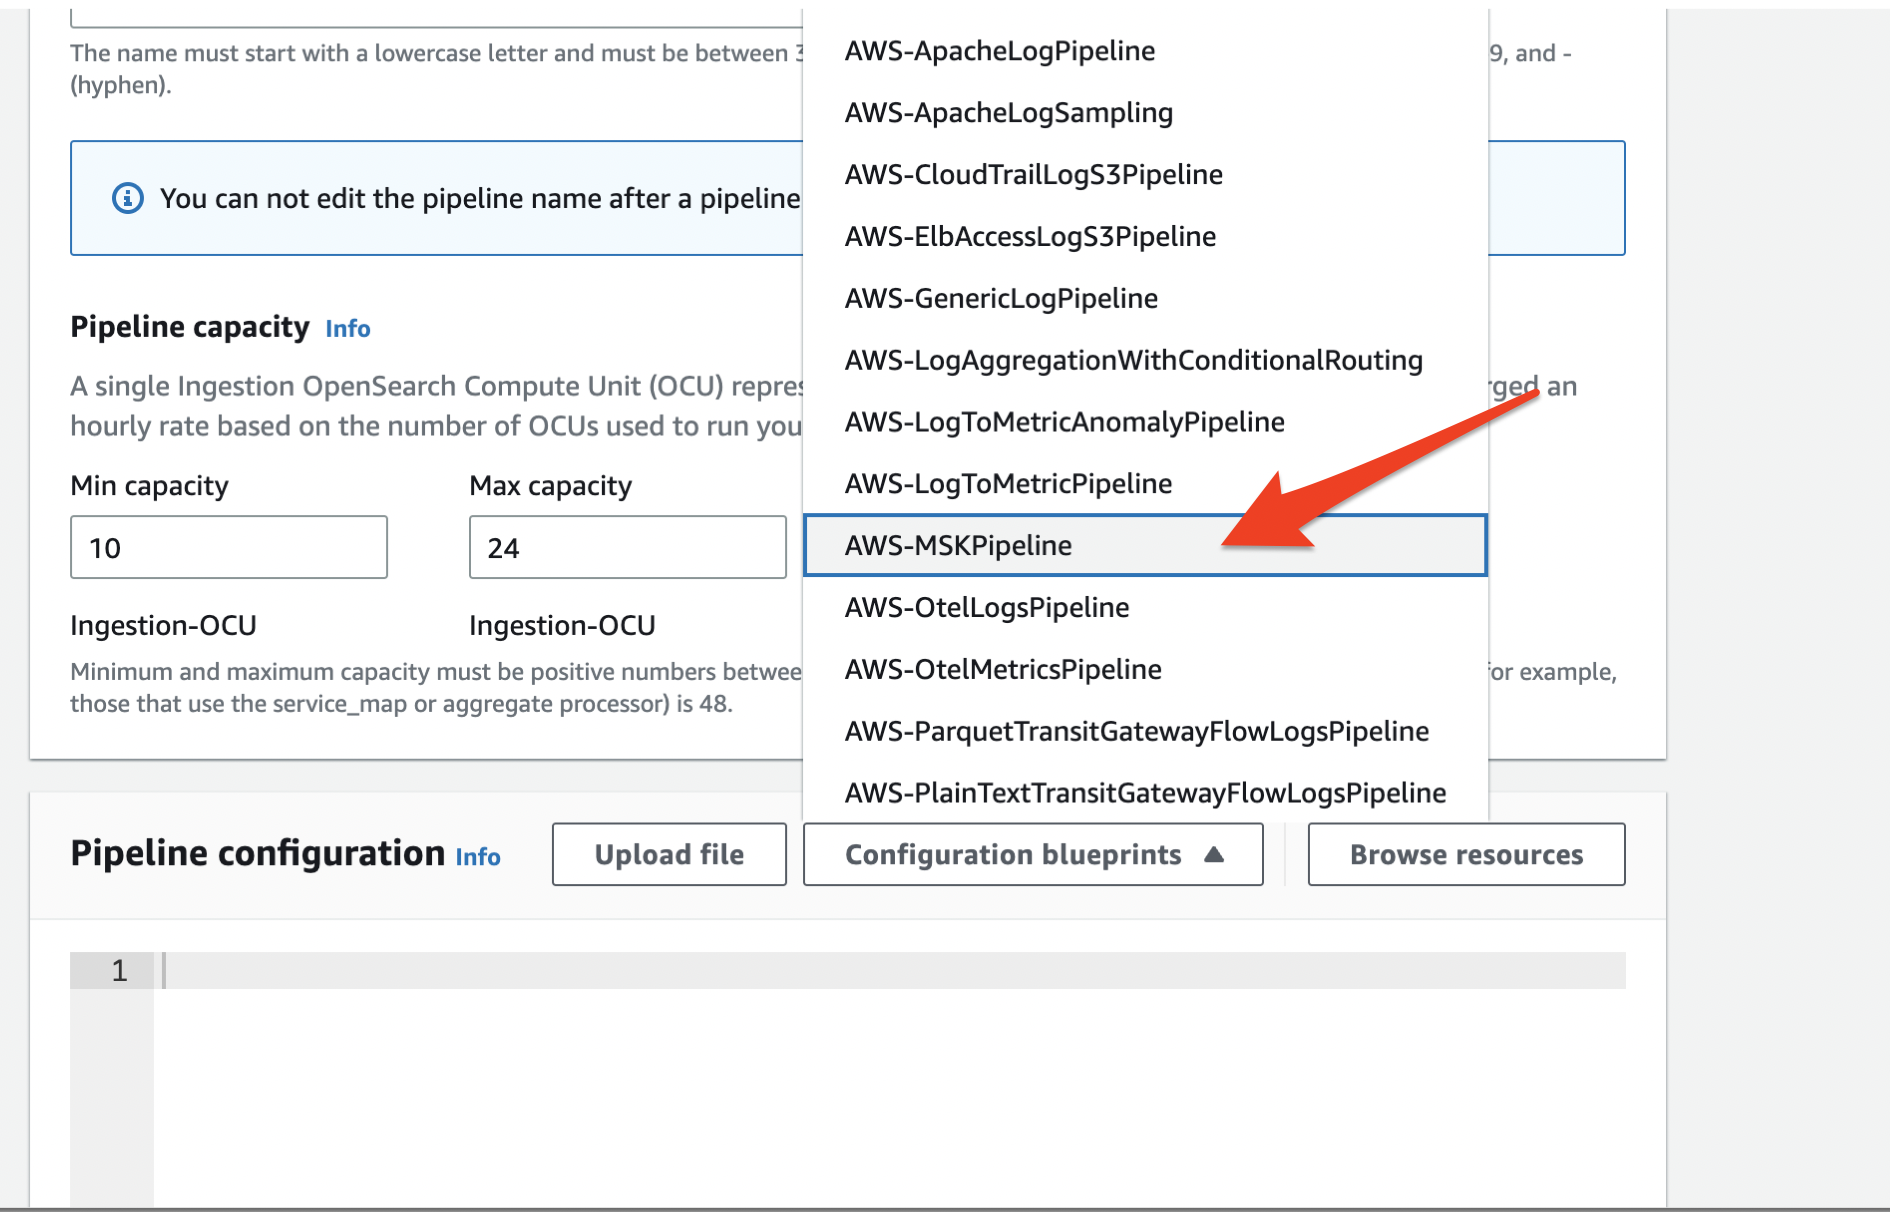
Use the provided template to fill in all the required fields. The snippet in the following section shows the fields that needs to be filled in red.
Configuring Amazon MSK source
The following sample configuration snippet shows every setting you need to get the pipeline running:
We use the following parameters:
- acknowledgements – Set to
truefor OpenSearch Ingestion to ensure that the data is delivered to the sinks before committing the offsets in Amazon MSK. The default value is set to false. - name – This specifies topic OpenSearch Ingestion can read from. You can read a maximum of four topics per pipeline.
- group_id – This parameter specifies that the pipeline is part of the consumer group. With this setting, a single consumer group can be scaled to as many pipelines as needed for very high throughput.
- serde_format – Specifies a deserialization method to be used for the data read from Amazon MSK. The options are JSON and plaintext.
- AWS sts_role_arn and OpenSearch sts_role_arn – Specifies the role OpenSearch Ingestion uses for reading and writing. Specify the ARN of the role you created from the last section. OpenSearch Ingestion currently uses the same role for reading and writing.
- MSK arn – Specifies the MSK cluster to consume data from.
- OpenSearch host and index – Specifies the OpenSearch domain URL and where the index should write.
When you have configured the Kafka source, choose the network access type and log publishing options. Public pipelines do not involve PrivateLink and they will not incur a cost associated with PrivateLink. Choose Next and review all configurations. When you are satisfied, choose Create pipeline.
Log in to OpenSearch Dashboards to see your indexes and search the data.
Recommended compute units (OCUs) for the MSK pipeline
Each compute unit has one consumer per topic. Brokers will balance partitions among these consumers for a given topic. However, when the number of partitions is greater than the number of consumers, Amazon MSK will host multiple partitions on every consumer. OpenSearch Ingestion has built-in auto scaling to scale up or down based on CPU usage or number of pending records in the pipeline. For optimal performance, partitions should be distributed across many compute units for parallel processing. If topics have a large number of partitions, for example, more than 96 (maximum OCUs per pipeline), we recommend configuring a pipeline with 1–96 OCUs because it will auto scale as needed. If a topic has a low number of partitions, for example, less than 96, then keep the maximum compute unit to same as the number of partitions. When pipeline has more than one topic, user can pick a topic with highest number of partitions as a reference to configure maximum computes units. By adding another pipeline with a new set of OCUs to the same topic and consumer group, you can scale the throughput almost linearly.
Clean up
To avoid future charges, clean up any unused resources from your AWS account.
Conclusion
In this post, you saw how to use Amazon MSK as a source for OpenSearch Ingestion. This not only addresses the ease of data consumption from Amazon MSK, but it also relieves you of the burden of self-managing and manually scaling consumers for varying and unpredictable high-speed, streaming operational analytics data. Please refer to the ‘sources’ list under ‘supported plugins’ section for exhaustive list of sources from which you can ingest data.
About the authors
 Muthu Pitchaimani is a Search Specialist with Amazon OpenSearch Service. He builds large-scale search applications and solutions. Muthu is interested in the topics of networking and security, and is based out of Austin, Texas.
 Arjun Nambiar is a Product Manager with Amazon OpenSearch Service. He focusses on ingestion technologies that enable ingesting data from a wide variety of sources into Amazon OpenSearch Service at scale. Arjun is interested in large scale distributed systems and cloud-native technologies and is based out of Seattle, Washington.
 Raj Sharma is a Sr. SDM with Amazon OpenSearch Service. He builds large-scale distributed applications and solutions. Raj is interested in the topics of Analytics, databases, networking and security, and is based out of Palo Alto, California.
Improve email delivery rates with email delivery and engagement history for every email
Post Syndicated from sakoppes original https://aws.amazon.com/blogs/messaging-and-targeting/improve-email-delivery-rates-with-email-delivery-and-engagement-history-for-every-email/
Email is a ubiquitous way to reach customers, whether to stay in touch, offer new services, or inform customers of product changes or transaction status. Amazon Simple Email Service helps customers send hundreds of billions of emails each month, and now offers more tools to improve email delivery rates and explore campaign success. SES’ Virtual Deliverability Manager now supports email delivery and engagement history, giving customers the ability to easily troubleshoot and investigate email delivery activities. Customers can verify the delivery of emails, identify the source of deliverability challenges, and find means to improve their email delivery rates. This reduces the effort needed to debug delivery problems, and lowers the mean time to resolution when responding to email delivery operational events.
How did Amazon SES’ deliverability features work before?
Previously, customers could get powerful insights into their delivery rates using SES Virtual Deliverability Manager, but they could not explore delivery activity at the level of individual messages. Customers could see overall send, delivery, bounce, and open/click rates for their accounts, as well as by mailbox provider (e.g. Gmail or Hotmail), sending email address, and configuration set. These insights were aggregated across multiple emails, making it difficult to find specific examples of failures to support troubleshooting efforts. It was also not possible to verify individual email delivery status and troubleshoot specific failures, which is a common customer support use case. Customers could implement custom solutions tracking delivery events emitted by SES, but this required custom coding and private data store maintenance. Often the associated effort was a barrier to customers, and they simply did not have an effective way to troubleshoot delivery problems at scale.
What new capabilities are available to enhance email deliverability?
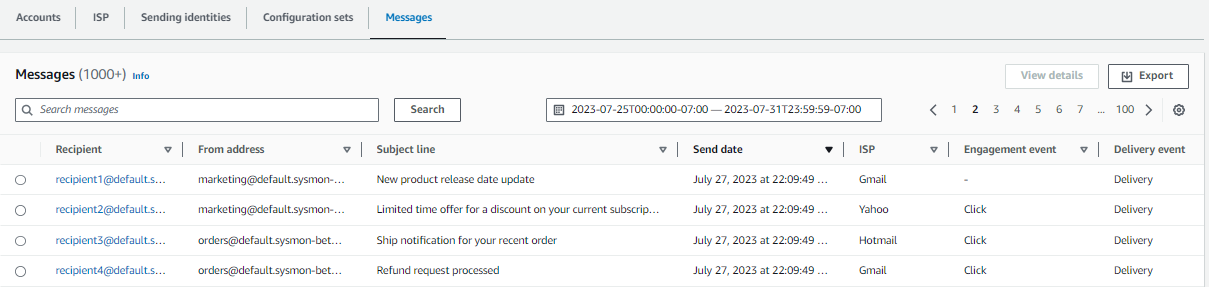
Now, customers can see the delivery transaction status and details for every email they have sent in the last 30 days. As an integrated part of the SES Virtual Deliverability Manager experience, customers have a seamless search and drilldown experience built into the AWS SES console, to search for email transaction records and explore delivery status. It’s easy to pivot by multiple criteria, including searches by sending email address, or looking at the emails sent to a specific recipient. Customers can narrow down searches to specific timeframes and sample based on delivery status. The flexible query capabilities of Virtual Deliverability Manager help customers quickly solve a variety of use cases, from verifying whether an order shipment notification has been delivered, to sampling mailbox provider responses to failed email deliveries when investigating a drop in delivery rates.
What can I do with the new email delivery and engagement history capabilities?
Lookup individual email recipient history:
Say you have a customer support team that gets complaints from customers about not getting specific transactional emails, such as a shipping confirmation email. Without a custom solution, it was difficult to confirm whether a specific email sent through SES had indeed reached the target recipient. Now you can look up the recent email history of a single recipient, and quickly see all the emails sent to that recipient with delivery and engagement status. It’s easy to see, for example, if an email bounced because a customer’s mailbox was full. It’s easy to get a fast and concise answer, streamlining investigations into single delivery events.
Understand drops in email delivery rates:
Another interesting case is when you have a drop in deliverability success rates, and you need to find out why. Now you can easily search for emails that bounced within a specific timeframe, and look at the message received from the mailbox provider which describes the bounce reason. These messages often contain useful information, such as identifying messages identified as spam or listed in a public blocklist. You can also see if send actions are failing because recipients are on your blocklist. This helps quickly narrow down the possible root causes to resolve delivery issues quickly.

Find your most engaged customers:
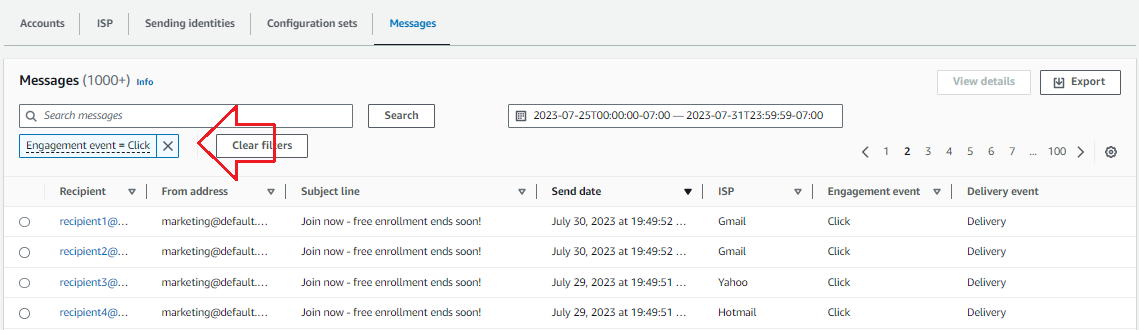
It’s also helpful to be able to find lists of customers who might benefit from focused marketing efforts. When you send emails through SES, you can track whether recipients open the emails and whether they click on links in the content. In aggregate these metrics helps show campaign success, but now you can find out who engaged with your emails to drive further outreach efforts. Searching for emails from a specific sender that have had a click event will give you a list of recipients that may be responsive to further actions. It takes just seconds with Virtual Deliverability Manager, and you can use the Export feature to easily pull your search results into a spreadsheet.
How to get started with email delivery and engagement history:
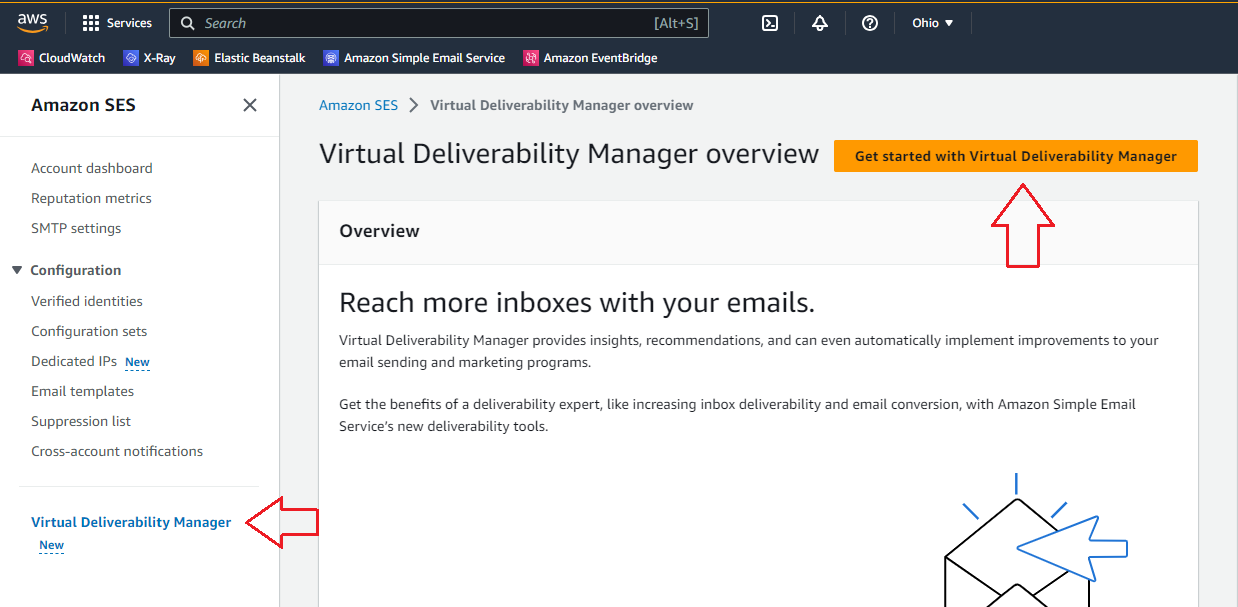
To get started using email delivery and engagement history, if you have Virtual Deliverability Manager enabled, just open the AWS SES console, navigate to the Virtual Deliverability Manager Dashboard in the left navigation, and click on the “Messages” tab. For customers who wish to enable Virtual Deliverability Manager, just open the AWS SES console and navigate to the Virtual Deliverability Manager page in the left navigation, and follow the instructions to turn on Virtual Deliverability Manager.
If you want to learn more, see the Virtual Deliverability Manager dashboard documentation.
Get started with SES visit https://aws.amazon.com/ses/.