On August 17, 2023, Juniper Networks published an out-of-band advisory on four different CVEs affecting Junos OS on SRX and EX Series devices:
CVE-2023-36846 Affects the SRX Series
A Missing Authentication for Critical Function vulnerability in Juniper Networks Junos OS on SRX Series allows an unauthenticated, network-based attacker to cause limited impact to the file system integrity. With a specific request that doesn’t require authentication, an attacker is able to upload arbitrary files via J-Web, leading to a loss of integrity for a certain part of the file system, which may allow chaining to other vulnerabilities.
CVE-2023-36844 Affects the EX Series
A PHP External Variable Modification vulnerability in J-Web of Juniper Networks Junos OS on EX Series allows an unauthenticated, network-based attacker to control certain important environment variables. Utilizing a crafted request, an attacker is able to modify certain PHP environments variables. This would lead to partial loss of integrity, which may allow chaining to other vulnerabilities.
CVE-2023-36847 Affects the EX Series
A Missing Authentication for Critical Function vulnerability in Juniper Networks Junos OS on EX Series allows an unauthenticated, network-based attacker to cause limited impact to the file system integrity. With a specific request that doesn’t require authentication, an attacker is able to upload arbitrary files via J-Web, leading to a loss of integrity for a certain part of the file system, which may allow chaining to other vulnerabilities.
CVE-2023-36845 Affects the EX and SRX Series
When chained, the vulnerabilities permit an unauthenticated user to upload an arbitrary file to the JunOS file system and then execute it. It’s unclear exactly which issues need to be chained together — our research team was able to execute an attack chain successfully, but we did not determine exact CVE mappings. Security organization Shadowserver posted on social media this week that they’d been seeing exploit attempts against “CVE-2023-36844 and friends” since August 25.
Further Context
Platform mitigations make executing an arbitrary binary difficult, but a public proof of concept and associated write-up from watchTowr demonstrate how to execute arbitrary PHP code in the context of the root user. Notably, the attack chain does not allow for operating system-level code execution — instead, it gives the attacker code execution within a BSD jail, which is a stripped-down environment designed to run a single application (in this case the HTTP server). Jails have their own set of users and their own root account which are limited to the jail environment, per BSD documentation.
The vulnerabilities affect the Juniper EX Series (switches) and SRX Series (firewalls). While the issue is on the management interface, these devices tend to have privileged access to corporate networks, and even with code execution restricted to a BSD jail, successful exploitation would likely provide an opportunity for attackers to pivot to organizations’ internal networks.
Juniper software is widely deployed, and Shodan shows around 10,000 devices facing the internet, although we can’t say with certainty how many are vulnerable. The affected Juniper service is J-Web, which is enabled by default on ports 80 and 443. The CVEs from Juniper are ranked as CVSS 5.3, but the advisory shows a combined CVSS score of 9.8. This sends a mixed message that might confuse users into thinking the impact of the flaws is of only moderate severity, which it is not.
Organizations that are not able to apply the patch should disable J-Web or restrict access to only trusted hosts. See the Juniper Networks advisory for more information.
Affected Products
CVE-2023-36845 and CVE-2023-36846 affect Juniper Networks Junos OS on the following versions of SRX Series:
All versions prior to 20.4R3-S8
21.1 version 21.1R1 and later versions
21.2 versions prior to 21.2R3-S6
21.3 versions prior to 21.3R3-S5
21.4 versions prior to 21.4R3-S5
22.1 versions prior to 22.1R3-S3
22.2 versions prior to 22.2R3-S2
22.3 versions prior to 22.3R2-S2, 22.3R3
22.4 versions prior to 22.4R2-S1, 22.4R3
CVE-2023-36844 and CVE-2023-36847 affect Juniper Networks Junos OS on the following versions of EX Series:
All versions prior to 20.4R3-S8
21.1 version 21.1R1 and later versions
21.2 versions prior to 21.2R3-S6
21.3 versions prior to 21.3R3-S5
21.4 versions prior to 21.4R3-S4
22.1 versions prior to 22.1R3-S3
22.2 versions prior to 22.2R3-S1
22.3 versions prior to 22.3R2-S2, 22.3R3
22.4 versions prior to 22.4R2-S1, 22.4R3
The vulnerability affects the J-Web component, which, by default, listens on ports 80 and 443 of the management interface.
Mitigation Guidance
Organizations should patch their devices as soon as is practical. Those that are not able to apply the patch should disable J-Web or restrict access to only trusted hosts. See the Juniper Networks advisory for more information.
Rapid7 Customers
InsightVM and Nexpose customers can assess their exposure to all four CVEs with vulnerability checks released in the August 17 content release.
Over the past few decades, digital technologies have brought tremendous benefits to our societies, governments, businesses, and everyday lives. However, the more we depend on them for critical applications, the more we must do so securely. The increasing reliance on these systems comes with a broad responsibility for society, companies, and governments.
At Amazon Web Services (AWS), every employee, regardless of their role, works to verify that security is an integral component of every facet of the business (see Security at AWS). This goes hand-in-hand with new cybersecurity-related regulations, such as the Directive on Measures for a High Common Level of Cybersecurity Across the Union (NIS 2), formally adopted by the European Parliament and the Counsel of the European Union (EU) in December 2022. NIS 2 will be transposed into the national laws of the EU Member States by October 2024, and aims to strengthen cybersecurity across the EU.
AWS is excited to help customers become more resilient, and we look forward to even closer cooperation with national cybersecurity authorities to raise the bar on cybersecurity across Europe. Building society’s trust in the online environment is key to harnessing the power of innovation for social and economic development. It’s also one of our core Leadership Principles: Success and scale bring broad responsibility.
Compliance with NIS 2
NIS 2 seeks to ensure that entities mitigate the risks posed by cyber threats, minimize the impact of incidents, and protect the continuity of essential and important services in the EU.
Besides increased cooperation between authorities and support for enhanced information sharing amongst covered entities, NIS 2 includes minimum requirements for cybersecurity risk management measures and reporting obligations, which are applicable to a broad range of AWS customers based on their sector. Examples of sectors that must comply with NIS 2 requirements are energy, transport, health, public administration, and digital infrastructures. For the full list of covered sectors, see Annexes I and II of NIS 2. Generally, the NIS 2 Directive applies to a wider pool of entities than those currently covered by the NIS Directive, including medium-sized enterprises, as defined in Article 2 of the Annex to Recommendation 2003/361/EC (over 50 employees or an annual turnover over €10 million).
In several countries, aspects of the AWS service offerings are already part of the national critical infrastructure. For example, in Germany, Amazon Elastic Compute Cloud (Amazon EC2) and Amazon CloudFront are in scope for the KRITIS regulation. For several years, AWS has fulfilled its obligations to secure these services, run audits related to national critical infrastructure, and have established channels for exchanging security information with the German Federal Office for Information Security (BSI) KRITIS office. AWS is also part of the UP KRITIS initiative, a cooperative effort between industry and the German Government to set industry standards.
AWS will continue to support customers in implementing resilient solutions, in accordance with the shared responsibility model. Compliance efforts within AWS will include implementing the requirements of the act and setting out technical and methodological requirements for cloud computing service providers, to be published by the European Commission, as foreseen in Article 21 of NIS 2.
AWS cybersecurity risk management – Current status
Even before the introduction of NIS 2, AWS has been helping customers improve their resilience and incident response capacities. Our core infrastructure is designed to satisfy the security requirements of the military, global banks, and other highly sensitive organizations.
AWS provides information and communication technology services and building blocks that businesses, public authorities, universities, and individuals use to become more secure, innovative, and responsive to their own needs and the needs of their customers. Security and compliance remain a shared responsibility between AWS and the customer. We make sure that the AWS cloud infrastructure complies with applicable regulatory requirements and good practices for cloud providers, and customers remain responsible for building compliant workloads in the cloud.
In total, AWS supports or has obtained over 143 security standards compliance certifications and attestations around the globe, such as ISO 27001, ISO 22301, ISO 20000, ISO 27017, and System and Organization Controls (SOC) 2. The following are some examples of European certifications and attestations that we’ve achieved:
C5 — provides a wide-ranging control framework for establishing and evidencing the security of cloud operations in Germany.
ENS High — comprises principles for adequate protection applicable to government agencies and public organizations in Spain.
HDS — demonstrates an adequate framework for technical and governance measures to secure and protect personal health data, governed by French law.
Pinakes — provides a rating framework intended to manage and monitor the cybersecurity controls of service providers upon which Spanish financial entities depend.
These and other AWS Compliance Programs help customers understand the robust controls in place at AWS to help ensure the security and compliance of the cloud. Through dedicated teams, we’re prepared to provide assurance about the approach that AWS has taken to operational resilience and to help customers achieve assurance about the security and resiliency of their workloads. AWS Artifact provides on-demand access to these security and compliance reports and many more.
For security in the cloud, it’s crucial for our customers to make security by design and security by default central tenets of product development. To begin with, customers can use the AWS Well-Architected tool to help build secure, high-performing, resilient, and efficient infrastructure for a variety of applications and workloads. Customers that use the AWS Cloud Adoption Framework (AWS CAF) can improve cloud readiness by identifying and prioritizing transformation opportunities. These foundational resources help customers secure regulated workloads. AWS Security Hub provides customers with a comprehensive view of their security state on AWS and helps them check their environments against industry standards and good practices.
With regards to the cybersecurity risk management measures and reporting obligations that NIS 2 mandates, existing AWS service offerings can help customers fulfill their part of the shared responsibility model and comply with future national implementations of NIS 2. For example, customers can use Amazon GuardDuty to detect a set of specific threats to AWS accounts and watch out for malicious activity. Amazon CloudWatch helps customers monitor the state of their AWS resources. With AWS Config, customers can continually assess, audit, and evaluate the configurations and relationships of selected resources on AWS, on premises, and on other clouds. Furthermore, AWS Whitepapers, such as the AWS Security Incident Response Guide, help customers understand, implement, and manage fundamental security concepts in their cloud architecture.
At Amazon, we strive to be the world’s most customer-centric company. For AWS Security Assurance, that means having teams that continuously engage with authorities to understand and exceed regulatory and customer obligations on behalf of customers. This is just one way that we raise the security bar in Europe. At the same time, we recommend that national regulators carefully assess potentially conflicting, overlapping, or contradictory measures.
We also cooperate with cybersecurity agencies around the globe because we recognize the importance of their role in keeping the world safe. To that end, we have built the Global Cybersecurity Program (GCSP) to provide agencies with a direct and consistent line of communication to the AWS Security team. Two examples of GCSP members are the Dutch National Cyber Security Centrum (NCSC-NL), with whom we signed a cooperation in May 2023, and the Italian National Cybersecurity Agency (ACN). Together, we will work on cybersecurity initiatives and strengthen the cybersecurity posture across the EU. With the war in Ukraine, we have experienced how important such a collaboration can be. AWS has played an important role in helping Ukraine’s government maintain continuity and provide critical services to citizens since the onset of the war.
The way forward
At AWS, we will continue to provide key stakeholders with greater insights into how we help customers tackle their most challenging cybersecurity issues and provide opportunities to deep dive into what we’re building. We very much look forward to continuing our work with authorities, agencies and, most importantly, our customers to provide for the best solutions and raise the bar on cybersecurity and resilience across the EU and globally.
If you have feedback about this post, submit comments in the Comments section below. If you have questions about this post, contact AWS Support.
Want more AWS Security news? Follow us on Twitter.
Amazon Redshift is a fast, fully managed petabyte-scale cloud data warehouse that makes it simple and cost-effective to analyze all your data using standard SQL and your existing business intelligence (BI) tools. Tens of thousands of customers today use Amazon Redshift to analyze exabytes of data and run analytical queries, making it the most widely used cloud data warehouse. Amazon Redshift is available in both serverless and provisioned configurations.
Amazon Redshift enables you to directly access data stored in Amazon Simple Storage Service (Amazon S3) using SQL queries and join data across your data warehouse and data lake. With Amazon Redshift, you can query the data in your S3 data lake using a central AWS Glue metastore from your Redshift data warehouse.
Amazon Redshift supports querying a wide variety of data formats, such as CSV, JSON, Parquet, and ORC, and table formats like Apache Hudi and Delta. Amazon Redshift also supports querying nested data with complex data types such as struct, array, and map.
With this capability, Amazon Redshift extends your petabyte-scale data warehouse to an exabyte-scale data lake on Amazon S3 in a cost-effective manner.
Apache Iceberg is the latest table format that is supported now in preview by Amazon Redshift. In this post, we show you how to query Iceberg tables using Amazon Redshift, and explore Iceberg support and options.
Solution overview
Apache Iceberg is an open table format for very large petabyte-scale analytic datasets. Iceberg manages large collections of files as tables, and it supports modern analytical data lake operations such as record-level insert, update, delete, and time travel queries. The Iceberg specification allows seamless table evolution such as schema and partition evolution, and its design is optimized for usage on Amazon S3.
Iceberg stores the metadata pointer for all the metadata files. When a SELECT query is reading an Iceberg table, the query engine first goes to the Iceberg catalog, then retrieves the entry of the location of the latest metadata file, as shown in the following diagram.
Amazon Redshift now provides support for Apache Iceberg tables, which allows data lake customers to run read-only analytics queries in a transactionally consistent way. This enables you to easily manage and maintain your tables on transactional data lakes.
Amazon Redshift supports Apache Iceberg’s native schema and partition evolution capabilities using the AWS Glue Data Catalog, eliminating the need to alter table definitions to add new partitions or to move and process large amounts of data to change the schema of an existing data lake table. Amazon Redshift uses the column statistics stored in the Apache Iceberg table metadata to optimize its query plans and reduce the file scans required to run queries.
In this post, we use Athena to convert the data. Complete the following steps:
Download the files using the previous link or use the AWS Command Line Interface (AWS CLI) to copy the files from the public S3 bucket for year 2020 and 2021 to your S3 bucket using the following command:
Create an Iceberg table in Athena with the following code. You can see the table type properties as an Iceberg table with Parquet format and snappy compression in the following create table statement. You need to update the S3 location before running the SQL. Also note that the Iceberg table is partitioned with the Year key.
After you create the table, load the data into the Iceberg table using the previously loaded Parquet table nyc_taxi_yellow_parquet with the following SQL:
When the SQL statement is complete, validate the data in the Iceberg table nyc_taxi_yellow_iceberg. This step is required before moving to the next step.
SELECT * FROM nyc_taxi_yellow_iceberg LIMIT 5;
You can validate that the nyc_taxi_yellow_iceberg table is in Iceberg format table and partitioned on the Year column using the following command:
SHOW CREATE TABLE nyc_taxi_yellow_iceberg;
Create an external schema in Amazon Redshift
In this section, we demonstrate how to create an external schema in Amazon Redshift pointing to the AWS Glue database icebergdbto query the Iceberg table nyc_taxi_yellow_iceberg that we saw in the previous section using Athena.
Log in to the Redshift via Query Editor v2 or a SQL client and run the following command (note that the AWS Glue database icebergdb and Region information is being used):
CREATE external schema spectrum_iceberg_schema
from data catalog
database 'icebergdb'
region 'us-east-1'
iam_role default;
To learn about creating external schemas in Amazon Redshift, refer to create external schema
After you create the external schema spectrum_iceberg_schema, you can query the Iceberg table in Amazon Redshift.
Query the Iceberg table in Amazon Redshift
Run the following query in Query Editor v2. Note that spectrum_iceberg_schema is the name of the external schema created in Amazon Redshift and nyc_taxi_yellow_iceberg is the table in the AWS Glue database used in the query:
The query data output in the following screenshot shows that the AWS Glue table with Iceberg format is queryable using Redshift Spectrum.
Check the explain plan of querying the Iceberg table
You can use the following query to get the explain plan output, which shows the format is ICEBERG:
EXPLAIN
SELECT vendorid,count(*)
FROM "dev"."spectrum_iceberg_schema"."nyc_taxi_yellow_iceberg"
GROUP BY vendorid;
Validate updates for data consistency
After the update is complete on the Iceberg table, you can query Amazon Redshift to see the transactionally consistent view of the data. Let’s run a query by picking a vendorid and for a certain pick-up and drop-off:
SELECT * FROM nyc_taxi_yellow_iceberg
WHERE vendorid=1
AND tpep_pickup_datetime=cast('2021-06-24 21:53:26' AS timestamp)
AND tpep_dropoff_datetime=cast('2021-06-24 22:02:46'AS timestamp)
LIMIT 5;
Next, update the value of passenger_count to 4 and trip_distance to 9.4 for a vendorid and certain pick-up and drop-off dates in Athena:
UPDATE nyc_taxi_yellow_iceberg
SET passenger_count=4,trip_distance=9.4
WHERE vendorid=1
AND tpep_pickup_datetime=cast('2021-06-24 21:53:26' AS timestamp)
AND tpep_dropoff_datetime=cast('2021-06-24 22:02:46'AS timestamp);
Finally, run the following query in Query Editor v2 to see the updated value of passenger_count and trip_distance:
SELECT *
FROM "dev"."spectrum_iceberg_schema"."nyc_taxi_yellow_iceberg"
WHERE vendorid=1
AND tpep_pickup_datetime=cast('2021-06-24 21:53:26' AS timestamp)
AND tpep_dropoff_datetime=cast('2021-06-24 22:02:46' AS timestamp)
LIMIT 5;
As shown in the following screenshot, the update operations on the Iceberg table are available in Amazon Redshift.
Create a unified view of the local table and historical data in Amazon Redshift
As a modern data architecture strategy, you can organize historical data or less frequently accessed data in the data lake and keep frequently accessed data in the Redshift data warehouse. This provides the flexibility to manage analytics at scale and find the most cost-effective architecture solution.
In this example, we load 2 years of data in a Redshift table; the rest of the data stays on the S3 data lake because that dataset is less frequently queried.
Use the following code to load 2 years of data in the nyc_taxi_yellow_recent table in Amazon Redshift, sourcing from the Iceberg table:
CREATE TABLE nyc_taxi_yellow_recent
AS
SELECT *
FROM "dev"."spectrum_iceberg_schema"."nyc_taxi_yellow_iceberg"
WHERE extract(year from tpep_pickup_datetime)>2020;
Next, you can remove the last 2 years of data from the Iceberg table using the following command in Athena because you loaded the data into a Redshift table in the previous step:
DELETE FROM nyc_taxi_yellow_iceberg
WHERE EXTRACT(year from tpep_pickup_datetime)>2020;
After you complete these steps, the Redshift table has 2 years of the data and the rest of the data is in the Iceberg table in Amazon S3.
Create a view using the nyc_taxi_yellow_iceberg Iceberg table and nyc_taxi_yellow_recent table in Amazon Redshift:
create or replace view nyc_taxi_yellow as
select 'nyc_taxi_yellow_iceberg' as source,vendorid,tpep_pickup_datetime,
    tpep_dropoff_datetime,
    passenger_count,trip_distance,
    ratecodeid,store_and_fwd_flag,
    pulocationid,dolocationid,
    payment_type,fare_amount,
    extra,mta_tax,tip_amount,
    tolls_amount,total_amount,
    congestion_surcharge,airport_fee
from "dev"."spectrum_iceberg_schema"."nyc_taxi_yellow_iceberg"
union all
select 'nyc_taxi_yellow_recent' as source,vendorid,tpep_pickup_datetime,
    tpep_dropoff_datetime,
    passenger_count,trip_distance,
    ratecodeid,store_and_fwd_flag,
    pulocationid,dolocationid,
    payment_type,fare_amount,
    extra,mta_tax,tip_amount,
    tolls_amount,total_amount,
    congestion_surcharge,airport_fee
from  public.nyc_taxi_yellow_recent
with no schema binding;
Now query the view, depending on the filter conditions, Redshift Spectrum will scan either the Iceberg data, the Redshift table, or both. The following example query returns a number of records from each of the source tables by scanning both tables:
SELECT source,count(1)
FROM  nyc_taxi_yellow
GROUP BY source;
Partition evolution
Iceberg uses hidden partitioning, which means you don’t need to manually add partitions for your Apache Iceberg tables. New partition values or new partition specs (add or remove partition columns) in Apache Iceberg tables are automatically detected by Amazon Redshift and no manual operation is needed to update partitions in the table definition. The following example demonstrates this.
In our example, if the Iceberg table nyc_taxi_yellow_iceberg was originally partitioned by year and later the column vendorid was added as an additional partition column, then Amazon Redshift can seamlessly query the Iceberg table nyc_taxi_yellow_iceberg with two different partition schemes over a period of time.
Considerations when querying Iceberg tables using Amazon Redshift
During the preview period, consider the following when using Amazon Redshift with Iceberg tables:
Only Iceberg tables defined in the AWS Glue Data Catalog are supported.
CREATE or ALTER external table commands are not supported, which means the Iceberg table should already exist in an AWS Glue database.
Time travel queries are not supported.
Iceberg versions 1 and 2 are supported. For more details on Iceberg format versions, refer to Format Versioning.
“Tinuiti, the largest independent performance marketing firm, handles large volumes of data on a daily basis and must have a robust data lake and data warehouse strategy for our market intelligence teams to store and analyze all our customer data in an easy, affordable, secure, and robust way,” says Justin Manus, Chief Technology Officer at Tinuiti. “Amazon Redshift’s support for Apache Iceberg tables in our data lake, which is the single source of truth, addresses a critical challenge in optimizing performance and accessibility and further simplifies our data integration pipelines to access all the data ingested from different sources and to power our customers’ brand potential.”
Conclusion
In this post, we showed you an example of querying an Iceberg table in Redshift using files stored in Amazon S3, cataloged as a table in the AWS Glue Data Catalog, and demonstrated some of the key features like efficient row-level update and delete, and the schema evolution experience for users to unlock the power of big data using Athena.
You can use Amazon Redshift to run queries on data lake tables in various files and table formats, such as Apache Hudi and Delta Lake, and now with Apache Iceberg (preview), which provides additional options for your modern data architectures needs.
We hope this gives you a great starting point for querying Iceberg tables in Amazon Redshift.
About the Authors
Rohit Bansal is an Analytics Specialist Solutions Architect at AWS. He specializes in Amazon Redshift and works with customers to build next-generation analytics solutions using other AWS Analytics services.
Satish Sathiya is a Senior Product Engineer at Amazon Redshift. He is an avid big data enthusiast who collaborates with customers around the globe to achieve success and meet their data warehousing and data lake architecture needs.
Ranjan Burman is an Analytics Specialist Solutions Architect at AWS. He specializes in Amazon Redshift and helps customers build scalable analytical solutions. He has more than 16 years of experience in different database and data warehousing technologies. He is passionate about automating and solving customer problems with cloud solutions.
Amazon OpenSearch Serverless provides the search and analytical functionality of OpenSearch without the manual overhead of configuring, managing, and scaling OpenSearch clusters. It automatically scales the resources based on your workload, and you only pay for the resources consumed. Managing OpenSearch Serverless is simple, but with infrastructure as code (IaC) software like Terraform, you can simplify your resource management even more.
This post demonstrates how to use Terraform to create, deploy, and clean up OpenSearch Serverless infrastructure.
Solution overview
To create and deploy an OpenSearch Serverless collection with security and access policies using Terraform, you need to follow these steps:
Terraform 0.12 or greater installed on your workstation. See Install Terraform.
Initialize the Terraform configuration
The sample code is available in the Terraform GitHub repo in the terraform-provider-aws/examples/opensearchserverless directory. This configuration will get you started with OpenSearch Serverless. First, clone the repository to your workstation and navigate to the directory:
$ git clone https://github.com/hashicorp/terraform-provider-aws.git && \
cd ./terraform-provider-aws/examples/opensearchserverless
Initialize the configuration to install the aws provider by running the following command:
$ terraform init
The Terraform configuration first defines the version of Terraform required and configures the AWS provider to launch resources in the Region defined by the aws_region variable:
# Require Terraform 0.12 or greater
terraform {
  required_version = ">= 0.12"
}

# Set AWS provider region
provider "aws" {
  region = var.aws_region
}
The variables used in this Terraform configuration are defined in the variables.tf file. This post assumes the default values are used:
variable "aws_region" {
  description = "The AWS region to create things in."
  default     = "us-east-1"
}

variable "collection_name" {
  description = "Name of the OpenSearch Serverless collection."
  default     = "example-collection"
}
Create an encryption policy
Now that the provider is installed and configured, the Terraform configuration moves on to defining OpenSearch Serverless policies for security. OpenSearch Serverless uses AWS Key Management Service (AWS KMS) to encrypt your data. The encryption is managed by an encryption policy. To create an encryption policy, use the aws_opensearchserverless_security_policy resource, which has a name parameter, a type of encryption, a JSON string that defines the policy, and an optional description:
This encryption policy is named example-encryption-policy, applies to a collection named example-collection, and uses an AWS owned key to encrypt the data.
Create an OpenSearch Serverless collection
You can organize your OpenSearch indexes into a logical grouping called a collection. Create a collection using the aws_opensearchserverless_collection resource, which has a name parameter, and optionally, description, tags, and type:
# Creates a collection
resource "aws_opensearchserverless_collection" "collection" {
  name = var.collection_name

  depends_on = [aws_opensearchserverless_security_policy.encryption_policy]
}
This collection is named example-collection. If type is not specified, a time series collection is created. Supported collection types can be found in the Terraform documentation for the aws_opensearchserverless_collection resource. OpenSearch Serverless requires encryption at rest, so an applicable encryption policy is required before a collection can be created. The Terraform configuration explicitly defines this dependency using the depends_on meta-argument. Errors can arise if this dependency is not defined.
Now that a collection has been created with an AWS owned KMS key, the Terraform configuration goes on to define the network and data access policy to configure access to the collection.
Create a network policy
A network policy allows access to your collection either over the public internet or through OpenSearch Serverless-managed VPC endpoints. Similar to the encryption policy, to create a network policy, use the aws_opensearchserverless_security_policy resource, which has a name parameter, a type of network, a JSON string that defines the policy, and an optional description:
This network policy is named example-network-policy and applies to the collection named example-collection. This policy only allows access to the collection’s OpenSearch endpoint through a VPC endpoint, but allows public access to the OpenSearch Dashboards endpoint.
You’ll notice the VPC endpoint has not been defined yet, but it is referenced in the network policy. Terraform determines this dependency automatically and will not create the network policy until the VPC endpoint has been created.
Creating a VPC and all the required networking resources is out of scope for this post, but the minimum required VPC resources are created here in a separate file to demonstrate the VPC endpoint functionality. Refer to Getting Started with Amazon VPC to learn more.
Create a data access policy
The configuration defines a data source that looks up information about the context Terraform is currently running in. This data source is used when defining the data access policy. More information can be found in the Terraform documentation for aws_caller_identity.
# Gets access to the effective Account ID in which Terraform is authorized
data "aws_caller_identity" "current" {}
A data access policy allows you to define who has access to collections and indexes. The data access policy is defined using the aws_opensearchserverless_access_policy resource, which has a name parameter, a type parameter set to data, a JSON string that defines the policy, and an optional description:
# Creates a data access policy
resource "aws_opensearchserverless_access_policy" "data_access_policy" {
  name        = "example-data-access-policy"
  type        = "data"
  description = "allow index and collection access"
  policy = jsonencode([
    {
      Rules = [
        {
          ResourceType = "index",
          Resource = [
            "index/${var.collection_name}/*"
          ],
          Permission = [
            "aoss:*"
          ]
        },
        {
          ResourceType = "collection",
          Resource = [
            "collection/${var.collection_name}"
          ],
          Permission = [
            "aoss:*"
          ]
        }
      ],
      Principal = [
        data.aws_caller_identity.current.arn
      ]
    }
  ])
}
This data access policy allows the current AWS role or user to perform collection-related actions on the collection named example-collection and index-related actions on the indexes in the collection.
Deploy using Terraform
Now that you have configured the necessary resources, apply the configuration using terraform apply. Before creating the resources, Terraform will describe all the resources that will be created so you can verify your configuration:
$ terraform apply

...

Terraform used the selected providers to generate the following execution plan. Resource actions are indicated with the following symbols:
  + create

Terraform will perform the following actions:

...

Plan: 13 to add, 0 to change, 0 to destroy.

Changes to Outputs:
  + collection_enpdoint = (known after apply)
  + dashboard_endpoint  = (known after apply)

Do you want to perform these actions?
  Terraform will perform the actions described above.
  Only 'yes' will be accepted to approve.

  Enter a value:
Answer yes to proceed.
If this is the first OpenSearch Serverless collection in your account, applying the configuration may take over 10 minutes because Terraform waits for the collection to become active.
You have now deployed an OpenSearch Serverless time series collection with policies to configure encryption and access to the collection!
Clean up
The resources will incur costs as long as they are running, so clean up the resources when you are done using them. Use the terraform destroy command to do this:
$ terraform destroy

...

Terraform used the selected providers to generate the following execution plan. Resource actions are indicated with the following symbols:
  - destroy

Terraform will perform the following actions:

  ...

Plan: 0 to add, 0 to change, 13 to destroy.

Changes to Outputs:

...

Do you really want to destroy all resources?
  Terraform will destroy all your managed infrastructure, as shown above.
  There is no undo. Only 'yes' will be accepted to confirm.

  Enter a value:
Answer yes to run this plan and destroy the infrastructure.
Destroy complete! Resources: 13 destroyed.
All resources created during this walkthrough have now been deleted.
Conclusion
In this post, you created an OpenSearch Serverless collection. Using IaC software like Terraform can make it simple to manage your resources like OpenSearch Serverless collections, encryption, network, and data access policies, and VPC endpoints.
Thank you to all the open-source contributors who help maintain OpenSearch and Terraform.
Joshua Luo is a Software Development Engineer for Amazon OpenSearch Serverless. He works on the systems that enable customers to manage and monitor their OpenSearch Serverless resources. He enjoys bouldering, photography, and videography in his free time.
Satish Nandi is a Senior Technical Product Manager for Amazon OpenSearch Service.
Data warehousing provides a business with several benefits such as advanced business intelligence and data consistency. It plays a big role within an organization by helping to make the right strategic decision at the right moment which could have a huge impact in a competitive market. One of the major and essential parts in a data warehouse is the extract, transform, and load (ETL) process which extracts the data from different sources, applies business rules and aggregations and then makes the transformed data available for the business users.
This process is always evolving to reflect new business and technical requirements, especially when working in an ambitious market. Nowadays, more verification steps are applied to source data before processing them which so often add an administration overhead. Hence, automatic notifications are more often required in order to accelerate data ingestion, facilitate monitoring and provide accurate tracking about the process.
Amazon Redshift is a fast, fully managed, cloud data warehouse that allows you to process and run your complex SQL analytics workloads on structured and semi-structured data. It also helps you to securely access your data in operational databases, data lakes or third-party datasets with minimal movement or copying. AWS Step Functions is a fully managed service that gives you the ability to orchestrate and coordinate service components. Amazon S3 Event Notifications is an Amazon S3 feature that you can enable in order to receive notifications when specific events occur in your S3 bucket.
In this post we discuss how we can build and orchestrate in a few steps an ETL process for Amazon Redshift using Amazon S3 Event Notifications for automatic verification of source data upon arrival and notification in specific cases. And we show how to use AWS Step Functions for the orchestration of the data pipeline. It can be considered as a starting point for teams within organizations willing to create and build an event driven data pipeline from data source to data warehouse that will help in tracking each phase and in responding to failures quickly. Alternatively, you can also use Amazon Redshift auto-copy from Amazon S3 to simplify data loading from Amazon S3 into Amazon Redshift.
Solution overview
The workflow is composed of the following steps:
A Lambda function is triggered by an S3 event whenever a source file arrives at the S3 bucket. It does the necessary verifications and then classifies the file before processing by sending it to the appropriate Amazon S3 prefix (accepted or rejected).
There are two possibilities:
If the file is moved to the rejected Amazon S3 prefix, an Amazon S3 event sends a message to Amazon SNS for further notification.
If the file is moved to the accepted Amazon S3 prefix, an Amazon S3 event is triggered and sends a message with the file path to Amazon SQS.
An Amazon EventBridge scheduled event triggers the AWS Step Functions workflow.
The workflow executes a Lambda function that pulls out the messages from the Amazon SQS queue and generates a manifest file for the COPY command.
Once the manifest file is generated, the workflow starts the ETL process using stored procedure.
The following image shows the workflow.
Prerequisites
Before configuring the previous solution, you can use the following AWS CloudFormation template to set up and create the infrastructure
Give the stack a name, select a deployment VPC and define the master user for the Amazon Redshift cluster by filling in the two parameters MasterUserName and MasterUserPassword.
The template will create the following services:
An S3 bucket
An Amazon Redshift cluster composed of two ra3.xlplus nodes
An empty AWS Step Functions workflow
An Amazon SQS queue
An Amazon SNS topic
An Amazon EventBridge scheduled rule with a 5-minute rate
Two empty AWS Lambda functions
IAM roles and policies for the services to communicate with each other
The names of the created services are usually prefixed by the stack’s name or the word blogdemo. You can find the names of the created services in the stack’s resources tab.
Step 1: Configure Amazon S3 Event Notifications
Create the following four folders in the S3 bucket:
received
rejected
accepted
manifest
In this scenario, we will create the following three Amazon S3 event notifications:
Trigger an AWS Lambda function on the received folder.
Send a message to the Amazon SNS topic on the rejected folder.
Send a message to Amazon SQS on the accepted folder.
To create an Amazon S3 event notification:
Go to the bucket’s Properties tab.
In the Event Notifications section, select Create Event Notification.
Fill in the necessary properties:
Give the event a name.
Specify the appropriate prefix or folder (accepted/, rejected/ or received/).
Select All object create events as an event type.
Select and choose the destination (AWS lambda, Amazon SNS or Amazon SQS). Note: for an AWS Lambda destination, choose the function that starts with ${stackname}-blogdemoVerify_%
At the end, you should have three Amazon S3 events:
An event for the received prefix with an AWS Lambda function as a destination type.
An event for the accepted prefix with an Amazon SQS queue as a destination type.
An event for the rejected prefix with an Amazon SNS topic as a destination type.
The following image shows what you should have after creating the three Amazon S3 events:
Step 2: Create objects in Amazon Redshift
Connect to the Amazon Redshift cluster and create the following objects:
Three schemas:
create schema blogdemo_staging; -- for staging tables
create schema blogdemo_core; -- for target tables
create schema blogdemo_proc; -- for stored procedures
A table in the blogdemo_staging and blogdemo_core schemas:
create table ${schemaname}.rideshare
(
  id_ride bigint not null,
  date_ride timestamp not null,
  country varchar (20),
  city varchar (20),
  distance_km smallint,
  price decimal (5,2),
  feedback varchar (10)
) distkey(id_ride);
A stored procedure to extract and load data into the target schema:
create or replace procedure blogdemo_proc.elt_rideshare (bucketname in varchar(200),manifestfile in varchar (500))
as $$
begin
-- purge staging table
truncate blogdemo_staging.rideshare;

-- copy data from s3 bucket to staging schema
execute 'copy blogdemo_staging.rideshare from ''s3://' + bucketname + '/' + manifestfile + ''' iam_role default delimiter ''|'' manifest;';

-- apply transformation rules here

-- insert data into target table
insert into blogdemo_core.rideshare
select * from blogdemo_staging.rideshare;

end;
$$ language plpgsql;
Set the role ${stackname}-blogdemoRoleRedshift_% as a default role:
In the Amazon Redshift console, go to clusters and click on the cluster blogdemoRedshift%.
Go to the Properties tab.
In the Cluster permissions section, select the role ${stackname}-blogdemoRoleRedshift%.
Click on Set default then Make default.
Step 3: Configure Amazon SQS queue
The Amazon SQS queue can be used as it is; this means with the default values. The only thing you need to do for this demo is to go to the created queue ${stackname}-blogdemoSQS% and purge the test messages generated (if any) by the Amazon S3 event configuration. Copy its URL in a text file for further use (more precisely, in one of the AWS Lambda functions).
Step 4: Setup Amazon SNS topic
In the Amazon SNS console, go to the topic ${stackname}-blogdemoSNS%
Click on the Create subscription button.
Choose the blogdemo topic ARN, email protocol, type your email and then click on Create subscription.
Confirm your subscription in your email that you received.
Step 5: Customize the AWS Lambda functions
The following code verifies the name of a file. If it respects the naming convention, it will move it to the accepted folder. If it does not respect the naming convention, it will move it to the rejected one. Copy it to the AWS Lambda function ${stackname}-blogdemoLambdaVerify and then deploy it:
The second AWS Lambda function ${stackname}-blogdemonLambdaGenerate% retrieves the messages from the Amazon SQS queue and generates and stores a manifest file in the S3 bucket manifest folder. Copy the following content, replace the variable ${sqs_url} by the value retrieved in Step 3 and then click on Deploy.
Step 6: Add tasks to the AWS Step Functions workflow
Create the following workflow in the state machine ${stackname}-blogdemoStepFunctions%.
If you would like to accelerate this step, you can drag and drop the content of the following JSON file in the definition part when you click on Edit. Make sure to replace the three variables:
${GenerateManifestFileFunctionName} by the ${stackname}-blogdemoLambdaGenerate% arn.
${RedshiftClusterIdentifier} by the Amazon Redshift cluster identifier.
${MasterUserName} by the username that you defined while deploying the CloudFormation template.
Step 7: Enable Amazon EventBridge rule
Enable the rule and add the AWS Step Functions workflow as a rule target:
Go to the Amazon EventBridge console.
Select the rule created by the Amazon CloudFormation template and click on Edit.
Enable the rule and click Next.
You can change the rate if you want. Then select Next.
Add the AWS Step Functions state machine created by the CloudFormation template blogdemoStepFunctions% as a target and use an existing role created by the CloudFormation template ${stackname}-blogdemoRoleEventBridge%
Click on Next and then Update rule.
Test the solution
In order to test the solution, the only thing you should do is upload some csv files in the received prefix of the S3 bucket. Here are some sample data; each file contains 1000 rows of rideshare data.
If you upload them in one click, you should receive an email because the ridesharedata2022.csv does not respect the naming convention. The other three files will be loaded in the target table blogdemo_core.rideshare. You can check the Step Functions workflow to verify that the process finished successfully.
Clean up
Go to the Amazon EventBridge console and delete the rule ${stackname}-blogdemoevenbridge%.
In the Amazon S3 console, select the bucket created by the CloudFormation template ${stackname}-blogdemobucket% and click on Empty.
Go to Subscriptions in the Amazon SNS console and delete the subscription created in Step 4.
In the AWS CloudFormation console, select the stack and delete it.
Conclusion
In this post, we showed how different AWS services can be easily implemented together in order to create an event-driven architecture and automate its data pipeline, which targets the cloud data warehouse Amazon Redshift for business intelligence applications and complex queries.
About the Author
Ziad WALI is an Acceleration Lab Solutions Architect at Amazon Web Services. He has over 10 years of experience in databases and data warehousing where he enjoys building reliable, scalable and efficient solutions. Outside of work, he enjoys sports and spending time in nature.
AWS Step Functions is emerging as a foundational tool for building scalable and distributed serverless applications through workflows. In 2021, the Step Functions team launched Workflow Studio, a low-code visual tool for creating Step Functions workflows in the AWS Management Console. This made workflow building accessible even to those with limited coding experience.
In response to feedback from customers, today the Step Functions team introduces a comprehensive set of new features. Addressing some of the most common requests, these make the authoring experience even more intuitive, versatile, and aligned with your specific development approach.
What’s new?
The latest release includes three new components:
1. Enhanced Starter Template Experience: This update offers developers and business users an advanced foundational point, streamlining the process of creating and prototyping workflows swiftly.
2. Code Mode for Workflow Studio: Today, Workflow Studio introduces a new code mode, enabling builders to alternate between design and code authoring views. This feature expedites workflow construction by reducing the need for context switching. For instance, you can seamlessly paste an Amazon States Language (ASL) workflow definition from the Step Functions workflows collection directly into Workflow Studio. You can then transition to the design view to continue your workflow development. Alternatively, opt for a starter template from the new authoring experience. If necessary, you can switch to the new code mode for meticulous adjustments.
3. Enhanced Workflow Execution and Configuration: This version of Workflow Studio also incorporates the capability to execute your workflows directly from the authoring view within Workflow Studio. Additionally, you can configure supplementary workflow settings such as permissions, logging, and tracing to enhance your workflow management.
Introducing the starter template experience
A standout feature is the introduction of the improved starter template experience. This is a new interface designed to expedite the workflow creation process.
By allowing you to filter templates by use-case or service, this feature provides a curated selection that aligns with your project’s needs. The starter template experience serves as a powerful stepping stone, equipping you with a robust foundation to build upon.
This presents you with the new template selection. Search by keyword, or filter by use-case and service:
Choose “Distributed Map to Process a CSV file in S3” and choose Select.
The following view shows a visual representation of the workflow, along with a detailed description. There are two usage options for each template:
Run a demo: Step Functions automatically deploys an AWS CloudFormation stack to your account, equipped with the state machine and all related resources. This ready-to-run demo workflow not only showcases the capabilities of your chosen template, but also serves as a springboard for your unique creations. Building upon this foundation, customize, fine tune, and tailor workflows to meet your exact specifications.
Build on it: This places the workflow’s ASL into the new Workflow Studio code view. Importantly, this transition does not deploy any associated resources. The goal is to let you with an expedited workflow creation process that uses best practices templates, while allowing you to customize and adapt them to your specific needs without the need to build from scratch.
Choose Run a demo, and then choose Use template. This places the workflow template into Workflow Studio in Read-only mode. Allowing you to inspect the workflow definition further before deploying the demo resources.
To deploy the demo, choose Deploy and run: After a few moments, the demo application is deployed to your account.
Seamless transitions between drag-and-drop design and code mode
Another enhancement in Workflow Studio is the ability to switch seamlessly between the drag-and-drop design view and the new code mode. This versatility allows you to transition between visual design and code-based authoring, catering to varying preferences and skill sets. While the design view offers an intuitive approach to creating workflows, the code mode provides a dynamic space akin to familiar coding environments.
Open up the previously deployed workflow demo by selecting it from the state machines console and choosing Edit:
Choose the Code button to switch to the code authoring view:
Here you are presented with an interface reminiscent of industry standard coding environments such as Visual Studio Code. This transformation lets experienced developers use the full potential of ASL enabling intricate customization and fine-tuning. It also allows you to use the graph visualization on the right to re-order easily and quickly, duplicate, or delete steps.
Chose the Design button to toggle back to the low code editor:
This is ideal for builders that are less experienced in ASL or for experienced developers needing to build workflow mocks rapidly, templates for further editing or prototype workflows.
Execute workflows directly from Workflow Studio
Workflow Studio now enables you to start a workflow from within the interface. This feature bridges the gap between design and execution, allowing developers to start their workflow from the Workflow Studio authoring environment.
To start a workflow from within Workflow Studio, choose the Execute button:
This takes you directly to the Step Functions executions interface where you can enter an input payload and inspect the workflow execution. This feature reduces the need to switch between interfaces, enabling developers to iterate more swiftly and efficiently. Choose Edit to jump directly back into Workflow Studio and continue iteratively refining your workflow.
Workflow Studio can now also view and edit execution role permissions, configure logging, and adjust additional parameters. To access this view, choose the Config button from Workflow Studio:
Availability for existing workflows
The new features are automatically available for all your existing workflows at no additional cost. This ensures that you can use the enhanced capabilities of Workflow Studio without any additional steps or configuration.
Workflow Studio’s new features allow developers to amplify their efforts. By simplifying the creation and execution of workflows, developers can channel more time and energy into the creative aspects of application development. Workflow Studio’s enhancements not only boost productivity but also provide a platform for turning creative designs into tangible, impactful applications.
Conclusion
Workflow Studio continues to evolve with the ongoing goal of simplifying and enhancing the process of building Step Functions workflows. The introduction of seamless authoring mode transitions, direct execution capabilities, and the improved starter template experience represents a pragmatic step towards improving authoring efficiency and flexibility, establishing Workflow Studio as the default authoring experience to Step Functions.
Cloudflare Radar was launched in September 2020, almost three years ago, when the pandemic was affecting Internet traffic usage. It is a free tool to show Internet usage patterns from both human and automated systems, as well as attack trends, top domains, and adoption and usage of browsers and protocols. As Cloudflare has been publishing data-driven insights related to the general Internet for more than 10 years now, Cloudflare Radar is a natural evolution.
This year, we have introduced several new features to Radar, also available through our public API, that enables deeper data exploration. We’ve also launched an Internet Quality section, a Trending Domains section, a URL Scanner tool, and a Routing section to track network interconnection, routing security, and observed routing anomalies.
In this reading list, we want to highlight some of those new additions, as well as some of the Internet disruptions and trends we’ve observed and published posts about during this year, including the war in Ukraine, the impact of Easter, and exam-related shutdowns in Iraq and Algeria.
We also encourage everyone to explore Cloudflare Radar and its new features, and to give you a partial review of the year, in terms of Internet insights — our 2023 Year in Review is coming later this year.
New additions to Cloudflare Radar
In 2022, Cloudflare Radar 2.0 was released last September, refreshing the look & feel and building on a new platform that allows us to easily add new features in the future. At that time, we added two new sections:
Cloudflare Radar’s 2022 Year in Review and the related blog were published at the end of the year.
Without further ado, here are some of the new features launched in 2023.
Analyze any URL safely using the Cloudflare Radar URL Scanner (✍️)
If you're invited to click on a link and if you're unsure about its safety, or if you simply want to verify technical details about a particular site, URL Scanner is here to assist. Provide us with a URL, and our scanner will compile a report containing a myriad of technical details: risk assessment, SSL certificate data, HTTP request and response data, page performance data, DNS records, associated cookies, what technologies and libraries the page uses, and more.
Introducing the Cloudflare Radar Internet Quality Page (✍️)
In June 2023, the new Internet Quality page was introduced to Cloudflare Radar, offering both country and network (autonomous system) level insight. This provides information on Internet connection performance (bandwidth) and quality (latency, jitter) over time based on benchmark test data as well as speed.cloudflare.com test results.
You can also see in a world map how the different countries compare with each other in different metrics from bandwidth to latency and jitter. Autonomous systems (AS) or networks are presented on individual pages, including Starlink’s AS14593. Latency is the metric that gives a better perspective on quality and improved Internet experience. Here’s the most recent global view on latency-based connection quality (lower is better):
Measuring the Internet's pulse: trending domains now on Cloudflare Radar (✍️)
Starting July 2023, our Domain Rankings page received enhancements through the inclusion of specific Trending Domains lists. While the top 100 list is typically dominated by the big names such as Google, Facebook, and Apple, there are trending domains that also tell interesting and even more local stories.
The Trending Domains lists highlight surges in interest from the previous day and previous week. For instance, we captured how nba.com was trending in 28 locations during the NBA Draft 2023, and how rt.com (a Russian-based news site) gained attention in multiple countries during the Wagner group mutiny in Russia. More recently, on the same subject, after the death of Wagner’s leader, Yevgeny Prigozhin, in a plane crash, flightradar24.com was trending in our daily list both in Russia and Ukraine.
The Internet is a vast, sprawling collection of networks (autonomous systems) that connect to each other, and routing is one of the most critical operations of the Internet. Launched in late July 2023, the new Cloudflare Radar Routing page examines the routing status of the Internet, including secure routing protocol deployment for a country and routing changes and anomalies. Included are routing security statistics, and also announced prefixes and connectivity insights. Why is that important? Routing decides how and where the Internet traffic should flow from the source to the destination, and deviations or anomalies can indicate potential issues that lead to connectivity disruptions.
Border Gateway Protocol (BGP), is considered the postal service of the Internet, but as a routing protocol suffers from a number of security weaknesses. Within the Routing page, we also present BGP route leaks and BGP hijack detection results, highlighting relevant events detected for any given network or globally. Notably, BGP origin hijacks allow attackers to intercept, monitor, redirect, or drop traffic destined for the victim's networks. In this related blog post, we also explain how Cloudflare built its BGP hijack detection system (including notifications), from its design and implementation to its integration: Cloudflare Radar's new BGP origin hijack detection system.
General Internet insights from 2023
One year of war in Ukraine: Internet trends, attacks, and resilience (✍️)
This blog post details Internet insights during the war in Europe and discusses how Ukraine's Internet remained resilient in spite of dozens of attacks and disruptions in three different stages of the conflict.
Cloudflare observed multiple Internet disruptions in the first weeks of the war (Internet infrastructure was damaged, and Internet access was limited in besieged areas, like Mariupol), as well as airstrikes on Ukrainian energy infrastructure. We also emphasize how application-layer cyber attacks in Ukraine rose 1,300% in early March 2022 as compared to pre-war levels, the country’s Internet resilience during the war, and major growth in Starlink traffic from the country.
Cloudflare’s view of the Virgin Media outage in the UK (✍️)
At times, major Internet operators experience significant outages due to technical issues. In 2022, it was Canada’s Rogers that experienced a 17-hour disruption impacting millions of users, and in early April 2023, a similar incident occurred with the United Kingdom’s Virgin Media. In this case, there were two clear outages for a few hours during April 4, 2023.
The post examines the impact on Internet traffic, the availability of Virgin Media web properties, and how BGP activity offered insights into the root cause.
How Easter, Passover and Ramadan show up in Internet trends (✍️)
National holidays celebrated in various countries can influence local Internet traffic trends. That was the case during Easter, celebrated between April 7-10, 2023. In countries including Italy, Poland, Germany, France, Spain, Portugal, the United States, Mexico, and Australia, the Easter long weekend led to the lowest traffic levels of 2023 up to that point—over 100 days into the year. Traffic dipped most significantly on Easter Sunday, compared to the previous Sunday, in Poland (22% lower), Italy (18% lower), France (16% lower).
The post also illustrates Orthodox Easter trends, with Greece being most impacted. It examines Ramadan-related changes, where eating rituals impacted Internet patterns in several countries with significant Muslim populations, and Passover trends, showing how Israel’s Internet traffic dropped as much as 24%.
Effects of the conflict in Sudan on Internet patterns (✍️)
We’ve been monitoring changes and disruptions in Internet patterns linked to military interventions. In this Sudan-related blog post, we analyze the impact of the armed conflict between rival factions of the military government that began on April 15, 2023. Cloudflare observed varying disruptions in Internet traffic after that day, with a mix of clear outages and general decrease in traffic.
The most recent Internet pattern change linked to military intervention is the ongoing coup in Niger. This particular event caused a distinct traffic drop, likely tied to shifts in human Internet usage, given the absence of signs of consistent connectivity disruption.
How the coronation of King Charles III affected Internet traffic (✍️)
As the coronation ceremony of King Charles III unfolded in London on May 6, 2023, distinct spikes and dips in Internet traffic were observed, each coinciding with key moments of the event. Also, on Sunday during the Coronation Big Lunch event, and Prince William’s speech at night, both instances led to a clear traffic drop of up to 18% compared with the previous Sunday. The accompanying chart displays this trend.
During the coronation weekend, Canada and Australia also exhibited shifts in Internet traffic patterns. And within this coronation post, there’s also analysis on Internet traffic pattern changes when Queen Elizabeth II passed away on September 8, 2022.
Cloudflare’s view of Internet disruptions in Pakistan (✍️)
Following the arrest of ex-PM Imran Khan, violent protests led the Pakistani government to order the shutdown of mobile Internet services and blocking of social media platforms. Mobile network shutdowns in the country lasted for several days.
We examined the impact of these shutdowns on Internet traffic in Pakistan and traffic to Cloudflare’s 1.1.1.1 DNS resolver and how Pakistanis appeared to be using it in an attempt to maintain access to the open Internet.
Nine years of Project Galileo and how the last year has changed it (✍️)
For the ninth anniversary of our Project Galileo in June 2023, the focus turned towards providing access to affordable cybersecurity tools and sharing our learnings from protecting the most vulnerable communities. We also published a ninth anniversary Project Galileo report.
One of the highlights of the report was a clear DDoS attack targeting an organization related to international law. This incident occurred on the same day an international arrest warrant was issued for Russian President Vladimir Putin and Russian official Maria Lvova-Belova, on March 17, 2023. Another standout observation involved the spikes in traffic experienced by Ukrainian emergency and humanitarian services, coinciding with bombings within the country.
Exam-related Internet shutdowns in Iraq and Algeria put connectivity to the test (✍️)
Since early June 2023, we’ve seen Iraq implementing a series of multi-hour shutdowns that continued through July and into August, as documented in our Outage Center. Algeria took similar actions, but using a content blocking-based approach, instead of the wide-scale Internet shutdowns, to prevent cheating on baccalaureate exams. This summer, these exam-related shutdowns were also implemented in Syria.
Cloudflare has previously observed and reported on similar occurrences in 2022 and also in 2021, in Syria and Sudan.
2023 has been a busy year for different types of Internet disruptions and outages, from government-directed shutdowns to natural incidents.
Reports: DDoS, Internet disruptions, and application security
Within Cloudflare Radar’s reports section, you will find a diverse array of perspectives on the Internet. From the Project Galileo 9th Anniversary — focused on aiding significant yet vulnerable online voices — to the more recent Q2 2023 Browsers and Search Engines reports. Some reports, such as the DDoS attack trends one, are also blog posts. Others are only available as blog posts, like the Internet disruptions summary, expanding on entries in the Outage Center, and the Application Security report.
This post delves into Internet disruptions observed by Cloudflare during the second quarter of 2023. Since 2022, we have been consistently offering these quarterly overviews of disruptions, and Q2 proved to be a busy quarter, with different types of disruptions:
There were several government directed shutdowns, including the ones related to “exam season” in several Middle Eastern and African countries, that continue through August.
Severe weather also played a role with a “Super Typhoon”-related disruption on the US territory of Guam.
Cable damage was behind disruptions in Bolivia, the Gambia and the Philippines.
Power outage-related Internet disruptions were observed in Curaçao, Portugal, and Botswana.
More generic technical problems impacted SpaceX Starlink’s satellite service, and Virgin Media in the United Kingdom.
Cyberattacks played a role in disruptions in both Russia and Ukraine.
Military action-related outages were observed in Chad and Sudan.
There were also maintenance related outages that affected Togo, Republic of Congo (Brazzaville), and Burkina Faso.
The Internet disruptions overview for Q1 2023 included another cause, a massive earthquake. The early February 7.8 magnitude earthquake in Turkey, which also affected Syria, caused widespread damage and tens of thousands of fatalities, and resulted in significant disruptions to Internet connectivity in multiple regions for several weeks.
Since 2020, our DDoS reports/blog posts have been focused on uncovering new attack trends, identifying the most affected countries, and showing targeted industries. Our Q2 2023 DDoS threats blog post highlights an unprecedented escalation in DDoS attack sophistication. Pro-Russian hacktivists REvil, Killnet, and Anonymous Sudan joined forces to attack Western sites. Exploits related to the zero-day vulnerability known as TP240PhoneHome surged by a whopping 532%, and attacks on crypto rocketed up by 600%.
An associated interactive version of this report is available on Cloudflare Radar. Furthermore, we’ve also added a new interactive component to Radar’s security section that allows you to dive deeper into attack activity in each country or region.
Our Application Security report has been around since 2022. The latest one highlights new attack trends and insights visible through Cloudflare’s global network. Some highlights include:
Daily mitigated HTTP requests decreased by 2 percentage points to 6% on average from 2021 to 2022, but days with larger than usual malicious activity were clearly seen across the network.
Application owners are increasingly relying on geo location blocks.
On average, more than 10% of non-verified bot traffic is mitigated. Compared to the last report, non-verified bot HTTP traffic mitigation is currently on a downward trend (down 6 percentage points).
65% of global API traffic is generated by browsers.
HTTP Anomalies are the most common attack vector on API endpoints, with 64%, followed by SQLi injection attacks (11%) and XSS attacks (9%).
The network of networks, also known as the Internet, is both complex and already seen as a human basic right—enabling work, leisure, communication, knowledge acquisition, and the pursuit of opportunities.
In 2023, Cloudflare Radar introduced new capabilities that facilitate the exploration of a broader array of insights and trends showing the Internet's various facets. These include Internet quality, insights into trending domains, and pertinent routing changes. There’s also no lack of general Internet insights and reports that try to offer different perspectives on 2023 events and occurrences and their impact. And already in August 2023, we’ve launched the “date picker” functionality, allowing any user to go back in time by selecting arbitrary date ranges. It looks like this:
Over the years, the film industry has witnessed constant transformation, from the introduction of sound and color to the digital revolution, 4K, and ultra high definition (UHD). However, a groundbreaking change is now underway, as cloud technology merges with media and entertainment (M&E) workflows, reshaping the way content is created, stored, and shared.
What’s helping to drive this transformation? APIs, or application programming interfaces. For any post facility, indie filmmaker/creator, or media team, understanding what APIs are is the first step in using them to embrace the flexibility, efficiency, and speed of the cloud.
Check Out Our New Technical Documentation Portal
When you’re working on a media project, you need to be able to find instructions about the tools you’re using quickly. And, it helps if those instructions are easy to use, easy to understand, and easy to share. Our Technical Documentation Portal has been completely overhauled to deliver on-demand content in a user-friendly way so you can find the information you need. Check out the API overview page to get you started, then dig into the implementation with the full documentation for our S3 Compatible, Backblaze, and Partner APIs.
From Tape to Digital: A Digital File Revolution
The journey towards the cloud transformation in the M&E industry started with the shift from traditional tape and film to digital formats. This revolutionary transition converted traditional media into digital entities, moving them from workstations to servers, shuttle drives, and shared storage systems. Simultaneously, the proliferation of email and cloud-hosted applications like Gmail, Dropbox, and Office 365 laid the groundwork for a cloud-centric future.
Seamless Collaboration With API-Driven Tools
As time went on, applications began communicating effortlessly with one another, facilitating tasks such as creating calendar invites in Gmail through Zoom and the ability to start Zoom meetings with a command in Slack. These integrations were made possible by APIs that allow applications to interact and share data effectively.
What Are APIs?
APIs are sets of rules and protocols that enable different software applications to communicate and interact with each other, allowing you to access specific functionalities or data from one application to be used in another. APIs facilitate seamless integration between diverse systems, enhancing workflows and promoting interoperability.
Most of us in the film industry are familiar with a GUI, a graphical user interface. It’s how we use applications day in and day out—literally the screens on our programs and computers. But a lot of the tasks we execute via a GUI (like saving files, reading files, and moving files) really are pieces of executable code hidden from us behind a nice button. Think of APIs as another method to execute those same pieces of code, but with code. Code executing code. (Let’s not get into the Skynet complex, and this isn’t AI either.)
Grinding the Gears: A Metaphor for APIs
An easy way to think about APIs is to think of them as gears. Each application has a gear. If we adjust the two gears to talk we simply align them to each other allowing their APIs to establish communication.
Once communications are established, you can start to do some cool stuff. For example, you can migrate a Frame.io archive to a Backblaze B2 Bucket. Or you could use the iconik API to move a file we want to edit with into our Lucidlink filespace, then remove it as soon as we finish our project.
Check out a video about the solution here:
The MovieLabs 2030 Vision and Cloud Integration
As the industry embraced cloud technology, the need for standardization became apparent. Organizations like the Institute of Electrical and Electronics Engineers (IEEE) and the Society of Motion Picture and Television Engineers (SMPTE) worked diligently to establish technical unity across vendors and technologies. However, implementation of these standards lacked persistence. To address this void, the Movie Picture Association (MPA) established MovieLabs, an organization dedicated to researching, testing, and developing new guidelines, processes, and tooling to drive improvements on how content is created. One such set of guidelines is the MovieLabs 2030 Vision.
Core Principles of the MovieLabs 2030 Vision
The MovieLabs 2030 Vision outlines 10 core principles that are aspirational for the film industry to accomplish by 2030. These core principles set the stage with a high importance on cloud technology and interoperability. Interoperability boils down to the ability to use various tools but have them share resources—which is where APIs come in. APIs help make tools interoperable and able to share resources. It’s a key functionality, and it’s how many cloud tools work together today.
MovieLab’s 2030 Vision aspirational principles.
The Future Is Here: Cloud Technology at Its Peak
Cloud technology grants us instant access to digital documents and the ability to carry our entire lives in our pockets. With the right tools, our data is securely synced, backed up, and accessible across devices, from smartphones to laptops and even TVs.
Although cloud technology has revolutionized various industries, the media and entertainment sector lagged behind, relying on cumbersome shuttle drives and expensive file systems for our massive files. The COVID pandemic, however, acted as a catalyst for change, pushing the industry to seriously consider the benefits of cloud integration.
Breaking Down Silos With APIs
In a post-pandemic world, many popular media and entertainment applications are built in the cloud, the same as other software as a service (SaaS) applications like Zoom, Slack, or Outlook. Which is great! But many of these tools are designed to best operate in their own ecosystem, meaning once the files are in their systems, it’s not easy to take them out. This may sound familiar if you are an iPhone user faced with migrating to an Android or vice versa. (But who would do that? )
With each of these applications working in their own ecosystem, the result is their own dedicated storage and usage costs which can vary greatly across tools. So many productions end up with projects and project files locked in various different environments creating storage silos—the opposite of centralized interoperability.
APIs not only foster interoperability in cloud-based business applications, but also empower filmmaking cloud tools like Frame.io, iconik, and Backblaze the ability to send, receive, and delete files (the POST, GET, PUT, and DELETE commands) data from other programs, enabling more dynamic and advanced workflows, such as sending files to colorists or reviewing edits for picture lock.
Customized Workflows and Automation
APIs offer the flexibility to tailor workflows to specific needs, whether within a single company or for vendor-specific processes. The automation possibilities are virtually limitless, facilitating seamless integration between cloud tools and storage solutions.
The Road Ahead for Media and Entertainment
The Movie Labs 2030 Vision offers a glimpse into a future defined by cloud tools and automation. Principally, that cloud technology with open and extensible storage exists and is available today.
So for any post facility, indie filmmaker/creator, or media team still driving around shuttle drives while James Cameron is shooting Avatar in New Zealand and editing it in Santa Monica, the future is here and within reach. You can get started today with all the power and flexibility of the cloud without the Avatar budget.
AgentSmith HIDS is a powerful component of a Host-based Intrusion Detection system, it has anti-rootkit functionalities and is a very performant way to collect information about a host.
As of this writing, 4,588 non-merge changesets have been pulled into the
mainline repository for the 6.6 kernel release. The 6.6 merge window, in
other words, is just getting started. Nonetheless, a fair amount of
significant work has already been pulled, so the time has come to summarize
what has happened so far in this development cycle.
Since we released GitHub Codespaces in 2021, we’ve made a number of updates aimed at improving usability, controlling cost, and more (for example, free usage for all, one click into templates, and concurrency policies). Now, GitHub has improved our developer experience and reduced usage costs at the same time by taking advantage of new virtual machines that provide all of our users twice the RAM, and approximately 10-30% improved CPU performance after adopting Advanced Micro Devices (AMD)-based hosts. These changes enable you to achieve the same (or better) machine performance for half the cost of the previous machine generation.
How this change helps you
In our previous VM generation, memory intensive workloads often had to overprovision CPUs just to get enough RAM in order to run, particularly when running multiple services. For professional developers this was particularly frustrating because of the increased complexity of their development environments, and their higher expectations for performance. Now, rather than having to choose between paying a premium for larger developer machines or sacrificing developer experience and productivity, you can get the best of both worlds.
For example, at GitHub we use our own software and services to build GitHub itself. GitHub uses Codespaces to build not only Codespaces, but the entire platform. GitHub has a large Ruby monolith that requires significant CPU and RAM to test, and also sets an extremely high bar for developer experience. In order to operate these environments while maximizing developer happiness, GitHub used the largest virtual machines available in Codespaces.
Once the new machine types were available, GitHub’s internal developer experience (DX) team started by moving a few dev teams with RAM-hungry workflows to machines with half the CPU count, but the same RAM, to test whether they would be sufficient. With very little effort, and nearly zero developer impact, testing showed that developers were just as successful on the smaller machines, and GitHub incurred half the cost. As additional teams tried moving the fewer-core machines, there was only one build process that turned out to be CPU architecture dependent. The fix was simple—to specify the CPU architecture so that QEMU could emulate appropriately. No other negative impacts were identified.
Due to the success of the initial trials, we quickly rolled out the changes to more teams. The result? Approximately 50% savings!
Figure 1: Codespaces cost for GitHub during the introduction of the AMD machines
Since we’ve rolled out the AMD machines for GitHub, we’ve seen no problems and had only happy users.
You can do the same in your organization by working with your development teams using GitHub Codespaces to test smaller machines on your existing development environments. All Codespaces virtual machines have been upgraded, so testing is as simple as having some developers try working in a smaller machine than they usually do. In most cases, no other configuration changes are necessary!
Once you have found the sweet spot for performance and experience, you can set a policy within your organization to restrict machine types, ensuring cost controls while providing environments that allow your developers to do their best work.
Save costs while empowering your developers
Now that these changes are in your hands, we invite you to see how much more you can get out of GitHub Codespaces by taking advantage of the improved processing power and increased headroom the RAM provides. As ever, please reach out to your account team, or participate in the GitHub Codespaces Community Discussions to provide us your feedback.
Welcome to another blog post from the AWS Customer Incident Response Team (CIRT)! For this post, we’re looking at two events that the team was involved in from the viewpoint of a regularly discussed but sometimes misunderstood subject, least privilege. Specifically, we consider the idea that the benefit of reducing permissions in real-life use cases does not always require using the absolute minimum set of privileges. Instead, you need to weigh the cost and effort of creating and maintaining privileges against the risk reduction that is achieved, to make sure that your permissions are appropriate for your needs.
To quote VP and Distinguished Engineer at Amazon Security, Eric Brandwine, “Least privilege equals maximum effort.” This is the idea that creating and maintaining the smallest possible set of privileges needed to perform a given task will require the largest amount of effort, especially as customer needs and service features change over time. However, the correlation between effort and permission reduction is not linear. So, the question you should be asking is: How do you balance the effort of privilege reduction with the benefits it provides?
Unfortunately, this is not an easy question to answer. You need to consider the likelihood of an unwanted issue happening, the impact if that issue did happen, and the cost and effort to prevent (or detect and recover from) that issue. You also need to factor requirements such as your business goals and regulatory requirements into your decision process. Of course, you won’t need to consider just one potential issue, but many. Often it can be useful to start with a rough set of permissions and refine them down as you develop your knowledge of what security level is required. You can also use service control policies (SCPs) to provide a set of permission guardrails if you’re using AWS Organizations. In this post, we tell two real-world stories where limiting AWS Identity and Access Management (IAM) permissions worked by limiting the impact of a security event, but where the permission set did not involve maximum effort.
Story 1: On the hunt for credentials
In this AWS CIRT story, we see how a threat actor was unable to achieve their goal because the access they obtained — a database administrator’s — did not have the IAM permissions they were after.
Background and AWS CIRT engagement
A customer came to us after they discovered unauthorized activity in their on-premises systems and in some of their AWS accounts. They had incident response capability and were looking for an additional set of hands with AWS knowledge to help them with their investigation. This helped to free up the customer’s staff to focus on the on-premises analysis.
Before our engagement, the customer had already performed initial containment activities. This included rotating credentials, revoking temporary credentials, and isolating impacted systems. They also had a good idea of which federated user accounts had been accessed by the threat actor.
The key part of every AWS CIRT engagement is the customer’s ask. Everything our team does falls on the customer side of the AWS Shared Responsibility Model, so we want to make sure that we are aligned to the customer’s desired outcome. The ask was clear—review the potential unauthorized federated users’ access, and investigate the unwanted AWS actions that were taken by those users during the known timeframe. To get a better idea of what was “unwanted,” we talked to the customer to understand at a high level what a typical day would entail for these users, to get some context around what sort of actions would be expected. The users were primarily focused on working with Amazon Relational Database Service (RDS).
Analysis and findings
For this part of the story, we’ll focus on a single federated user whose apparent actions we investigated, because the other federated users had not been impersonated by the threat actor in a meaningful way. We knew the approximate start and end dates to focus on and had discovered that the threat actor had performed a number of unwanted actions.
After reviewing the actions, it was clear that the threat actor had performed a console sign-in on three separate occasions within a 2-hour window. Each time, the threat actor attempted to perform a subset of the following actions:
Note: This list includes only the actions that are displayed as readOnly = false in AWS CloudTrail, because these actions are often (but not always) the more impactful ones, with the potential to change the AWS environment.
This is the point where the benefit of permission restriction became clear. As soon as this list was compiled, we noticed that two fields were present for all of the actions listed:
"errorCode": "Client.UnauthorizedOperation",
"errorMessage": "You are not authorized to perform this operation. [rest of message]"
As this reveals, every single non-readOnly action that was attempted by the threat actor was denied because the federated user account did not have the required IAM permissions.
Customer communication and result
After we confirmed the findings, we had a call with the customer to discuss the results. As you can imagine, they were happy that the results showed no material impact to their data, and said no further investigation or actions were required at that time.
What were the IAM permissions the federated user had, which prevented the set of actions the threat actor attempted?
The answer did not actually involve the absolute minimal set of permissions required by the user to do their job. It’s simply that the federated user had a role that didn’t have an Allow statement for the IAM actions the threat actor tried — their job did not require them. Without an explicit Allow statement, the IAM actions attempted were denied because IAM policies are Deny by default. In this instance, simply not having the desired IAM permissions meant that the threat actor wasn’t able to achieve their goal, and stopped using the access. We’ll never know what their goal actually was, but trying to create access keys, passwords, and update policies means that a fair guess would be that they were attempting to create another way to access that AWS account.
Story 2: More instances for crypto mining
In this AWS CIRT story, we see how a threat actor’s inability to create additional Amazon Elastic Compute Cloud (Amazon EC2) instances resulted in the threat actor leaving without achieving their goal.
Because this account was new and currently only used for testing their software, the customer saw that the detection was related to the Amazon ECS cluster and decided to delete all the resources in the account and rebuild. Not too long after doing this, they received a similar GuardDuty alert for the new Amazon ECS cluster they had set up. The second finding resulted in the customer’s security team and AWS being brought in to try to understand what was causing this. The customer’s security team was focused on reviewing the tasks that were being run on the cluster, while AWS CIRT reviewed the AWS account actions and provided insight about the GuardDuty finding and what could have caused it.
Analysis and findings
Working with the customer, it wasn’t long before we discovered that the 3rd party Amazon ECS task definition that the customer was using, was unintentionally exposing a web interface to the internet. That interface allowed unauthenticated users to run commands on the system. This explained why the same alert was also received shortly after the new install had been completed.
This is where the story takes a turn for the better. The AWS CIRT analysis of the AWS CloudTrail logs found that there were a number of attempts to use the credentials of the Task IAM role that was associated with the Amazon ECS task. The majority of actions were attempting to launch multiple Amazon EC2 instances via RunInstances calls. Every one of these actions, along with the other actions attempted, failed with either a Client.UnauthorizedOperation or an AccessDenied error message.
Next, we worked with the customer to understand the permissions provided by the Task IAM role. Once again, the permissions could have been limited more tightly. However, this time the goal of the threat actor — running a number of Amazon EC2 instances (most likely for surreptitious crypto mining) — did not align with the policy given to the role:
AWS CIRT recommended creating policies to restrict the allowed actions further, providing specific resources where possible, and potentially also adding in some conditions to limit other aspects of the access (such as the two Condition keys launched recently to limit where Amazon EC2 instance credentials can be used from). However, simply having the policy limit access to Amazon Simple Storage Service (Amazon S3) meant that the threat actor decided to leave with just the one Amazon ECS task running crypto mining rather than a larger number of Amazon EC2 instances.
Customer communication and result
After reporting these findings to the customer, there were two clear next steps: First, remove the now unwanted and untrusted Amazon ECS resource from their AWS account. Second, review and re-architect the Amazon ECS task so that access to the web interface was only provided to appropriate users. As part of that re-architecting, an Amazon S3 policy similar to “Allows read and write access to objects in an S3 bucket” was recommended. This separates Amazon S3 bucket actions from Amazon S3 object actions. When applications have a need to read and write objects in Amazon S3, they don’t normally have a need to create or delete entire buckets (or versioning on those buckets).
Some tools to help
We’ve just looked at how limiting privileges helped during two different security events. Now, let’s consider what can help you decide how to reduce your IAM permissions to an appropriate level. There are a number of resources that talk about different approaches:
The first approach is to use Access Analyzer to help generate IAM policies based on access activity from log data. This can then be refined further with the addition of Condition elements as desired. We already have a couple of blog posts about that exact topic:
The third approach is a manual method of creating and refining policies to reduce the amount of work required. For this, you can begin with an appropriate AWS managed IAM policy or an AWS provided example policy as a starting point. Following this, you can add or remove Actions, Resources, and Conditions — using wildcards as desired — to balance your effort and permission reduction.
An example of balancing effort and permission is in the IAM tutorial Create and attach your first customer managed policy. In it, the authors create a policy that uses iam:Get* and iam:List:* in the Actions section. Although not all iam:Get* and iam:List:* Actions may be required, this is a good way to group similar Actions together while minimizing Actions that allow unwanted access — for example, iam:Create* or iam:Delete*. Another example of this balancing was mentioned earlier relating to Amazon S3, allowing access to create, delete, and read objects, but not to change the configuration of the bucket those objects are in.
In addition to limiting permissions, we also recommend that you set up appropriate detection and response capability. This will enable you to know when an issue has occurred and provide the tools to contain and recover from the issue. Further details about performing incident response in an AWS account can be found in the AWS Security Incident Response Guide.
There are also two services that were used to help in the stories we presented here — Amazon GuardDuty and AWS CloudTrail. GuardDuty is a threat detection service that continuously monitors your AWS accounts and workloads for malicious activity. It’s a great way to monitor for unwanted activity within your AWS accounts. CloudTrail records account activity across your AWS infrastructure and provides the logs that were used for the analysis that AWS CIRT performed for both these stories. Making sure that both of these are set up correctly is a great first step towards improving your threat detection and incident response capability in AWS.
Conclusion
In this post, we looked at two examples where limiting privilege provided positive results during a security event. In the second case, the policy used should probably have restricted permissions further, but even as it stood, it was an effective preventative control in stopping the unauthorized user from achieving their assumed goal.
Hopefully these stories will provide new insight into the way your organization thinks about setting permissions, while taking into account the effort of creating the permissions. These stories are a good example of how starting a journey towards least privilege can help stop unauthorized users. Neither of the scenarios had policies that were least privilege, but the policies were restrictive enough that the unauthorized users were prevented from achieving their goals this time, resulting in minimal impact to the customers. However in both cases AWS CIRT recommended further reducing the scope of the IAM policies being used.
Finally, we provided a few ways to go about reducing permissions—first, by using tools to assist with policy creation, and second, by editing existing policies so they better fit your specific needs. You can get started by checking your existing policies against what Access Analyzer would recommend, by looking for and removing overly permissive wildcard characters (*) in some of your existing IAM policies, or by implementing and refining your SCPs.
If you have feedback about this post, submit comments in the Comments section below. If you have questions about this post, contact AWS Support.
Want more AWS Security news? Follow us on Twitter.
Security updates have been issued by Debian (firefox-esr, json-c, opendmarc, and otrs2), Red Hat (java-1.8.0-ibm and kpatch-patch), Scientific Linux (kernel), Slackware (mozilla), SUSE (haproxy, php7, vim, and xen), and Ubuntu (elfutils, frr, and linux-gcp, linux-starfive).
At Rapid7 we love a good pen test story. So often they show the cleverness, skill, resilience, and dedication to our customer’s security that can only come from actively trying to break it! In this series, we’re sharing some of our favorite tales from the pen test desk and hopefully highlight some ways you can improve your own organization’s security.
Performing a Red Team exercise at Rapid7 is a rollercoaster of emotions. The first week starts off with excitement and optimism, as you have a whole new client environment to dig into. All assets and employees are in-scope, no punches held. From a hacker mentality, it’s truly exciting to be unleashed with unlimited possibilities bouncing around in your head of how you’ll breach the perimeter, set persistence, laterally move, and access the company “crown jewels.”
Then the first week comes to a close and you’ve realized this company has locked down their assets, and short of developing and deploying a 0-day, you’re going to have to turn to other methods of entry such as social engineering. Excitement dies down but optimism remains, until that first phish is immediately burned. Then the second falls flat. Desperation to “win” kicks in and you find yourself working through the night, trying to find one seemingly non-existent issue in their network, all in the name of just getting that first foothold.
One of our recent Red Teams followed this emotional roller-coaster to a ‘T’. We were tasked with compromising a software development company with the end goal of obtaining access to their code repositories and cloud infrastructure. We had four weeks, two Rapid7 pen test consultants and a lot of Red Bull to hack all the things at our disposal. We spent the first two days performing Open Source Intelligence (OSINT) gathering. This phase was a method of passive reconnaissance, in which we scoured the internet for publicly accessible information about our target company. Areas of interest included public network ranges owned by the company, domain names, recent acquisitions, technologies used within the company, and employee contact information.
Our OSINT revealed that the company was cloud-first with a limited external footprint. They had a few HTTPS services with APIs for their customers, software download portals, customer ticketing systems, the usual. Email was cloud hosted in Office365 with Single Sign-On (SSO) handled through Okta. The only external employee resources were an Extranet page that required authentication, a VPN portal which required Multi-Factor Authentication (MFA) and a certificate, email cloud hosted in Office365, and Okta to handle Single Sign-On (SSO) with MFA.
After initial reconnaissance, we determined three possible points of entry: compromise one of the API endpoints, phish a user with a payload or MFA bypass, or guess a password and hope it can sign into something without MFA required. We spent our first two days combing over the customer’s product API documentation and testing for any endpoints which could be accessed without authentication or exploited to gain useful information. We were stonewalled here — kudos to the company.
Gone Phishin’
Our optimism and excitement was still high, however, as we set our eyes on plan B, phishing employees. We whipped up a basic phishing campaign that masqueraded as a new third-party employee compliance training portal. To bypass web content filtering, we purchased a recently expired domain that was categorized as “information/technology.” We then created a fake landing page with our new company logo and a “sign in with SSO” button.
Little did the employees realize, while they saw their normal Okta login page, it was a proxy-phishing page using Evilginx that would capture their credentials and authenticated Okta session. The only noticeable difference was the URL. After capturing the employee’s Okta session we redirected them back to our fake third-party compliance platform, where they were requested to download an HTML Application (HTA) file containing our payload.
We fired off this phishing campaign to 50 employee email addresses discovered online, ensuring that anyone with “information security” in their title was removed from the target list. Then we waited. One hour went by. Two. Three. No interactions with the campaign. The dread was starting to sit in. We suspected that a day of hard work to build the entire campaign was eaten by a spam filter, or worse, identified and the domain was instantly blocked.
With defeat looming, we began preparing a second phishing campaign, when all of the sudden our TMUX session with Evilginx running showed a blob of green text. A valid credential was captured as well as an Okta session token. We held our breath as we switched to our Command and Control (C2) server dashboard, fingers crossed, and there it was. A callback from the phished user’s workstation. They opened the HTA on their workstation. It bypassed the EDR solution and executed our payload. We were in.
The thrill of establishing initial access is exhilarating. However, it’s at this moment that we have to take a deep breath and focus. Initial access by phishing is a fragile thing, if the user reports it, we’ll lose our shell. If we trip an alert within the EDR, we’ll lose our shell. If the user goes home for the night and restarts their computer before we can set persistence, we’ll lose our shell.
First things first, we quickly replaced our HTA payload on the phishing page with something benign in case the campaign was reported and the Security Operations Center (SOC) triaged the landing page. We can’t have them pulling Indicators of Compromise (IoCs) out of our payload and associating it with our initial access host in their environment. From here, one operator focused on setting persistence and identifying a lateral movement path while the other operator used stolen Okta session tokens to review the user’s cloud applications before it expired. Three hours in and we still had access, reconnaissance was underway, and we had identified a few juicy Kerberoastable service accounts that if cracked would allow lateral movement.
Things were going our way. And then it all came crashing down.
At what felt like a crescendo of success, we received another successful phish with credentials. We cracked the service account password that we had Kerberoasted, and… lost our initial access shell. Looking in the employee’s Teams messages, we saw messages from the SOC asking about suspicious activity on their asset as they prepared to quarantine it. Deflated and tired, back to the drawing board we went. But, like all rollercoasters, we started going back uphill when we realized the most recent credentials captured were for an intern on the help desk team. While the tier one help desk employee didn’t have much access in the company, they could view all available employee support tickets in the SaaS ticketing solution. Smiling ear to ear, we assumed our role as the helpful company IT helpdesk.
Hi, We’re Here to Help
We quickly crafted a payload that utilized legitimate Microsoft binaries packaged alongside our malicious DLL, loaded in via AppDomain injection, and packaged nicely into an ISO. We then identified an employee who had submitted a ticket to the help desk asking for assistance with connecting to an internal application which was throwing an error. Taking a deep breath, we spoofed the help desk phone number and called the employee in need of assistance.
“Hi ma’am, this is Arthur from the IT help desk. We received your ticket regarding not being able to connect to the portal, and would like to troubleshoot it with you. Is this a good time?”
Note: you might be wondering what the employee could have done better here, but in the end, the responsibility lay with the company not having multi-factor on their help desk portal. It gave us the information we needed to answer any question the employee could ask, as the help desk.
The employee was thrilled to get assistance so quickly from the help desk. We even went the extra mile and spent time trying to troubleshoot the actual issue with the employee, receiving thanks for our efforts. Finally, we asked the employee to try applying “one last update” that may resolve the issue. We directed them to go to a website hosting our payload, download the ISO, open it, and run the “installer.” They obliged, as we had already built rapport throughout the entire call. Moments later, we had a shell on the employee’s workstation.
With a shell, cracked service account credentials, and all the noisy reconnaissance out of the way from our first shell, we dove right into the lateral movement. The service account allowed us to access an MSSQL server as an admin. We mounted the C$ drive of the server and identified already installed programs which utilized Microsoft’s .NET framework. We uploaded a malicious DLL and configuration file and remotely executed the installed program using Windows Management Instrumentation (WMI), again utilizing AppDomain injection to load our DLL. Success! We received a callback to our new C2 domain from the MSSQL server. Lateral movement hop number one, complete.
Using Rubeus, we checked for Kerberos tickets in memory and discovered a Kerberos Ticket Granting Ticket (KRBTGT) cached for a Domain Admin user. The KRBTGT could be used in a Pass-the-Ticket (PTT) attack to authenticate as the account, which meant we had Domain Admin access until the ticket expired in approximately four more hours. Everything was flowing and we were ready for our next setback. But it didn’t come. Instead, we used the ticket to authenticate to the workstation of a cloud administrator employee and establish yet another shell on the host. Luckily for us, the company had everyone’s roles and titles in their Active Directory descriptions, and employee workstations also contained the associated employee name in the description field, which made identifying the cloud admin employee’s workstation a breeze.
Using our shell on the cloud administrator’s workstation, we executed our own Chrome cookie extractor, “HomemadeChocolateChips,” in memory, which spawned Chrome with a debug port and extracted all cookies from the current user’s profile. This provided us with an Okta session token, which we used in conjunction with a SOCKS proxy through the employee’s machine to access their Okta dashboard sourced from an internal IP address. The company had it configured such that once authenticated to Okta, if coming from the company’s IP space, the Azure Okta chiclet did not prompt for MFA again. With a squeal of excitement, we were into their Azure Portal with admin privileges.
In Azure, there is a handy feature under a virtual machine’s configuration and operations tab called “Run Command.” This allows an administrator to do just as it states, run a PowerShell script on the virtual machine. As if it couldn’t get any easier, we identified a virtual machine labeled “Jenkins Build Server” with “Run Command” enabled. After running a quick PowerShell script to download our zip file with backdoored legitimate binaries, expand the archive, and then execute them, we established a C2 foothold on the build server. From there we found GitHub credentials utilized by build jobs, which let us access our objective: source code for company applications.
Exhausted but triumphant, with bags under our eyes and shaking from the caffeine induced energy, we set up a few long-haul C2 connections to maintain persistent network access through the end of the assessment. We also met with the client to determine our next steps, such as intentionally alerting their security team to the breach. Well, after a good beer and nap over the weekend, that is.
The preceding story was an amalgamation of several recent attack workflows to obfuscate client identity and showcase one cohesive assessment.
Rapid7 is thrilled to announce version 0.7.0 of Velociraptor is now LIVE and available for download. The focus of this release was on improving user efficiency while also expanding and strengthening the library of VQL plug-ins and artifacts.
Let’s take a look at some of the interesting new features in detail.
GUI improvements
The GUI was updated in this release to improve user workflow and accessibility.
Enhanced client search
In previous versions, client information was written to the datastore in individual files (one file per client record). This works ok, as long as the number of clients is not too large and the filesystem is fast. This has become more critical as users are now deploying Velociraptor with larger deployment sizes, often in excess of 50k.
In this release, the client index was rewritten to store all client records in a single snapshot file, while managing this file in memory. This approach allows client searching to be extremely quick even for large numbers of clients well over 100k.
Additionally, it is now possible to display the total number of hits in each search giving a more comprehensive indication of the total number of clients.
Paged table in Flows list
Velociraptor’s collections view shows the list of collections from the endpoint (or the server). Previously, the GUI limited this view to 100 previous collections. This meant that for heavily collected clients it was impossible to view older collections (without custom VQL).
In this release, the GUI was updated to include a paged table (with suitable filtering and sorting capabilities) so all collections can be accessed.
VQL Plugins and artifacts
Chrome artifacts
Version 0.7.0 added a leveldb parser and several artifacts around Chrome Session Storage. This allows analyzing data that is stored by Chrome locally for various web apps.
Lnk forensics
This release added a more comprehensive Lnk parser covering all known Lnk file features. You can access the Lnk file analysis using the `Windows.Forensics.Lnk` artifact.
Direct S3 accessor
Velociraptor’s accessors provide a way to apply the many plugins that operate on files to other domains. In particular, the glob() plugin allows searching the accessors for filename patterns.
In this release, Velociraptor adds an Amazon S3 accessor. This allows plugins to directly operate on S3 buckets. In particular the glob() plugin can be used to query bucket contents and read files from various buckets. This capability opens the door for sophisticated automation around S3 buckets.
Volume Shadow Copies analysis
Windows Volume Shadow Service (VSS) is used to create snapshots of the drive at a specific point in time. Forensically, this can be very helpful as it captures a point-in-time view of the previous disk state (If the VSS is still around when we perform our analysis).
Velociraptor provides access to the different VSS volumes via the ntfs accessor, and many artifacts previously provided the ability to report files that differed between VSS snapshots.
In the 0.7.0 release, Velociraptor adds the ntfs_vss accessor. This accessor automatically considers different snapshots and deduplicates files that are identical in different snapshots. This makes it much easier to incorporate VSS analysis into your artifacts.
The SQLiteHunter project
Many artifacts consist of parsing SQLite files. For example, major browsers use SQLite files heavily. This release incorporates the SQLiteHunter artifact.
SQLiteHunter is a one stop shop for finding and analyzing SQLite files such as browser artifacts and OS internal files. Although the project started with SQLite files, it now automates a lot of artifacts such as WebCacheV01 parsing and the Windows Search Service – aka Windows.edb (which are ESE based parsers).
This one artifact combines and makes obsolete many distinct older artifacts.
The glob() plugin may be the most used plugin in VQL, as it allows for the efficient search of filenames in the filesystem. While the glob() plugin can accept a list of glob expressions so the filesystem walk can be optimized as much as possible, it was previously difficult to know why a particular reported file was chosen.
In this release, the glob() plugin reports the list of glob expressions that caused the match to be reported. This allows callers to more easily combine several file searches into the same plugin call.
URL style paths
In very old versions of Velociraptor, nested paths could be represented as URL objects. Until now, a backwards compatible layer was used to continue supporting this behavior. In the latest release, URL style paths are no longer supported. Instead, use the pathspec() function to build proper OSPath objects.
Server improvements
Velociraptor offers automatic use of Let’s Encrypt certificates. However, Let’s Encrypt can only issue certificates for port 443. This means that the frontend service (which is used to communicate with clients) has to share the same port as the GUI port (which is used to serve the GUI application). This makes it hard to create firewall rules to filter access to the frontend and not to the GUI when used in this configuration.
In the 0.7.0 release, Velociraptor offers the GUI.allowed_cidr option. If specified, the list of CIDR addresses will specify the source IP acceptable to the server for connections to the GUI application (for example 192.168.1.0/24).
This filtering only applies to the GUI and forms an additional layer of security protecting the GUI application (in addition to the usual authentication methods).
Better handling of out of disk errors
Velociraptor can collect data very quickly and sometimes this results in a full disk. Previously, a full disk error could cause file corruption and data loss. In this release, the server monitors its free disk level and disables file writing when the disk is too full. This avoids data corruption when the disk fills up. When space is freed the server will automatically start writing again.
The offline collector
The offline collector is a pre-configured binary which can be used to automatically collect any artifacts into a ZIP file and optionally upload the file to a remote system like a cloud bucket or SMB share.
Previously, Velociraptor would embed the configuration file into the binary so it only needed to be executed (e.g. double clicked). While this method is still supported on Windows, it turned out that on MacOS this is no longer supported as binaries can not be modified after build. Even on Windows, embedding the configuration will invalidate the signature.
In this release, we added a generic collector:
This collector will embed the configuration into a shell script instead of the Velociraptor binary. Users can then launch the offline collector using the unmodified official binary by specifying the --embedded_config flag:
While the method is required for MacOS, it can also be used for Windows in order to preserve the binary signature.
Conclusions
There are many more new features and bug fixes in the 0.7.0 release. If you’re interested in any of these new features, we welcome you to take Velociraptor for a spin by downloading it from our release page. It’s available for free on GitHub under an open-source license.
As always, please file bugs on the GitHub issue tracker or submit questions to our mailing list by emailing [email protected]. You can also chat with us directly on our Discord server.
Learn more about Velociraptor by visiting any of our web and social media channels below:
Finally, don’t forget to register for VeloCON 2023, taking place on Wednesday September 13, 2023. VeloCON is a one-day virtual event which includes fascinating discussions, tech talks and the opportunity to get to know real members of the Velociraptor community. It’s a forum to share experiences in using and developing Velociraptor to address the needs of the wider DFIR landscape and an opportunity to take a look ahead at the future of our platform.
Много грешно е схващането, че при влизането в монетарния съюз, лихвите по кредитите ще паднат. Реално е точно обратното!
ЛИХВИТЕ ПО КРЕДИТИТЕ ЩЕ СЕ УВЕЛИЧАТ и това е 100% сигурно
Веднага обяснявам защо.
Как се образуват лихвите по кредитите в ЕС?
EURIBOR + фиксирана надбавка = Лихва по кредита
Понеже надбавката е фиксирана за целия период на кредита, то размера на лихвата е пряко свързана с промяната в EURIBOR. Как обаче се променя той и какво му влияе?
По дефиниция EURIBOR e лихвеният процент, по който банките търгуват една с друга свободните си парични средства. Той се публикува в 5 варианта – седмичен, месечен, тримесечен, шествесечен и годишен. До тук добре, всичко е пазарно. Обаче има още един индекс, който влияе доста директно на EURIBOR-a. И това е
ECB-refinancing-rate
До тук бяхме с пазарния показател!
За разлика от БНБ, Европейската централна банка има право да рефинансира европейските банки при ликвидни проблеми. Това рефинансиране се случва по този индекс ECB-refinancing-rate! А той вече не е пазарен. Той се решава на заседание на ЕЦБ и се обявява.
В този ред на мисли, банките могат да вземат пари или от междубанковия пазар, като по този начин влияят на EURIBOR-a, но могат да ги вземат и от ЕЦБ директно, което на практика принуждава EURIBOR-a да следва движението на ECB-refinancing-rate.
Затова няма да сгрешим ако кажем, че на практика ЕЦБ определя EURIBOR-a с решение на своя изпълнителен орган!
За срещa с мен моля използвайте посочената форма.
[contact-form-7]
Сега да видим как стои въпросът с Основния лихвен процент в България (ОЛП).
както казахме по-горе БНБ няма право да рефинансира българските банки директно, понеже сме във валутен борд. Реално затова беше въведен валутният борд. БНБ с онова си управление, просто не можеше да спре да рефинансира проблеми банки, а това ни докара хиперинфлацията.
Но да се върнем на ОЛП. В основата му е така наречения индекс LEONIA+. Той беше „изчистен” и „съгласуван” с ЕЦБ, за да може методиката за изчислението му да е абсолютно една и съща в целия ЕС. Предходния индекс беше просто LEONIA (без +), а още по-предходния SOFIBOR.
Та този индекс е истински пазарен и отразява междубанковата търговия на свободни парични средства. БНБ не може да му влияе и може би половината банки го използват за основен индекс при формирането на лихвите по левови кредити.
От поне 10 години депозитите в банките нарастват постоянно. Ще рече, че банките имат достатъчно пари под формата на депозити, за да търгуват помежду си. Затова и този индекс е нисък. В момента той дори е висок – 3.45%, като за определянето му са извършени 13 сделки между банки и са изтъргувани 447 000 000 лева.
EURIBO-a от друга страна се движи между 3,65% (месечен) и 4.06% (годишен).
Голямата разлика идва от това, че в ЕС банките вече имат нужда от пари и съответно проблем с депозитите. ЕЦБ затегна паричната политика и те трябва да търсят пари от ЕЦБ, да привличат депозити или да търгуват помежду си. Всички тези опции неизменно ще водят до увеличеие а лихвите.
У нас обаче банките са червиви с пари, защото просто спестяванията в левове няма в какво да бъдат инвестирани. Тоест банките ни са добре капитализирани, за да им се налага да търсят пари срещу лихва, което би повишило и ОЛП-то ( LEONIA+), респективно лихвите по кредитите.
В един хубав момент, когато затрием лева, вече няма да можем да „доказваме”, че в лева би била по-ниска лихвата по кредитите, просто защото няма да има такава валута.
Друг е въпросът за банките обаче. Ако влезем в монетарния съюз, те ще могат да се снабдяват с по-евтини кредити директно от ЕЦБ при нужда, EURIBOR + рискова надбавка, което при всички положения ще е повече от лихвата която банките плащат по привлечените депозити от граждани (клони към 0 в момента).
В тази връзка нещата с приемането на еврото се свеждат до евтин ресурс за българските банки и по-високи лихви по кредитите за физичските лица.
Естествено премахването на лева и въвеждането на еврото има още десетки аспекти, но ако говорим за лихвите по кредитите, то те ще бъдат по-високи, а не по ниски.
И ако сте стигнали до тук – знайте, че предоговарянето на кредита може да Ви спести пари или да Ви струва много скъпо.
A used government surveillance van is for sale in Chicago:
So how was this van turned into a mobile spying center? Well, let’s start with how it has more LCD monitors than a Counterstrike LAN party. They can be used to monitor any of six different video inputs including a videoscope camera. A videoscope and a borescope are very similar as they’re both cameras on the ends of optical fibers, so the same tech you’d use to inspect cylinder walls is also useful for surveillance. Kind of cool, right? Multiple Sony DVD-based video recorders store footage captured by cameras, audio recorders by high-end equipment brand Marantz capture sounds, and time and date generators sync gathered media up for accurate analysis. Circling back around to audio, this van features seven different audio inputs including a body wire channel.
Only $26,795, but you can probably negotiate them down.
To provide the best experiences, we use technologies like cookies to store and/or access device information. Consenting to these technologies will allow us to process data such as browsing behavior or unique IDs on this site. Not consenting or withdrawing consent, may adversely affect certain features and functions.
Functional
Always active
The technical storage or access is strictly necessary for the legitimate purpose of enabling the use of a specific service explicitly requested by the subscriber or user, or for the sole purpose of carrying out the transmission of a communication over an electronic communications network.
Preferences
The technical storage or access is necessary for the legitimate purpose of storing preferences that are not requested by the subscriber or user.
Statistics
The technical storage or access that is used exclusively for statistical purposes.The technical storage or access that is used exclusively for anonymous statistical purposes. Without a subpoena, voluntary compliance on the part of your Internet Service Provider, or additional records from a third party, information stored or retrieved for this purpose alone cannot usually be used to identify you.
Marketing
The technical storage or access is required to create user profiles to send advertising, or to track the user on a website or across several websites for similar marketing purposes.

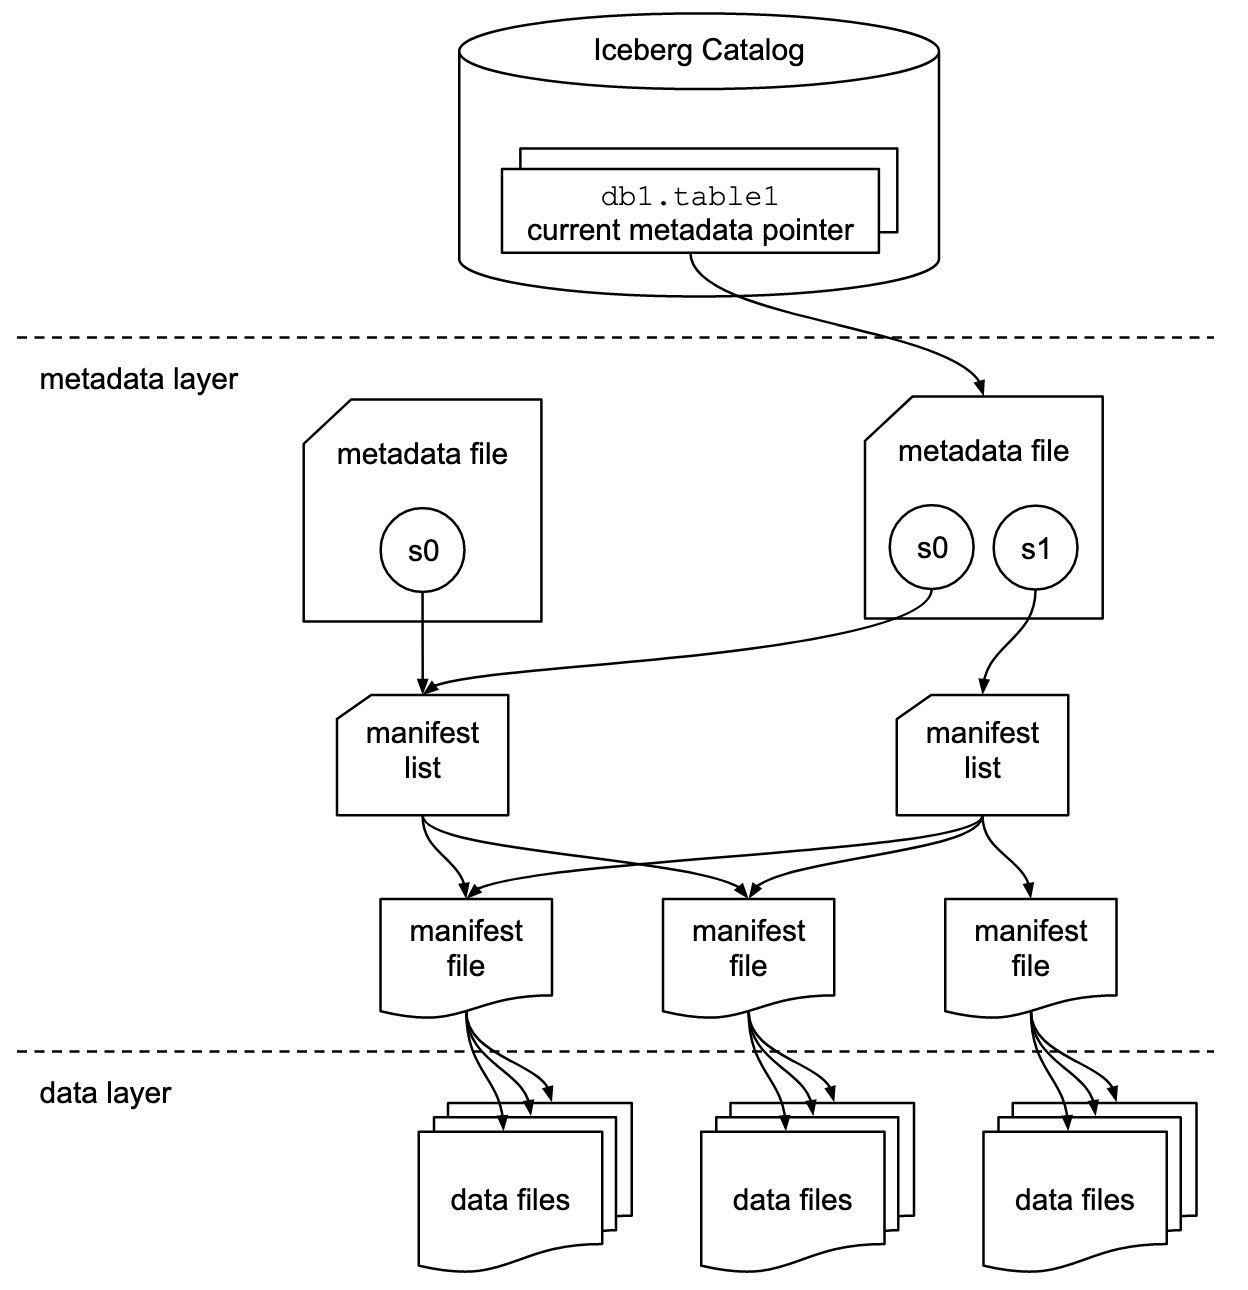


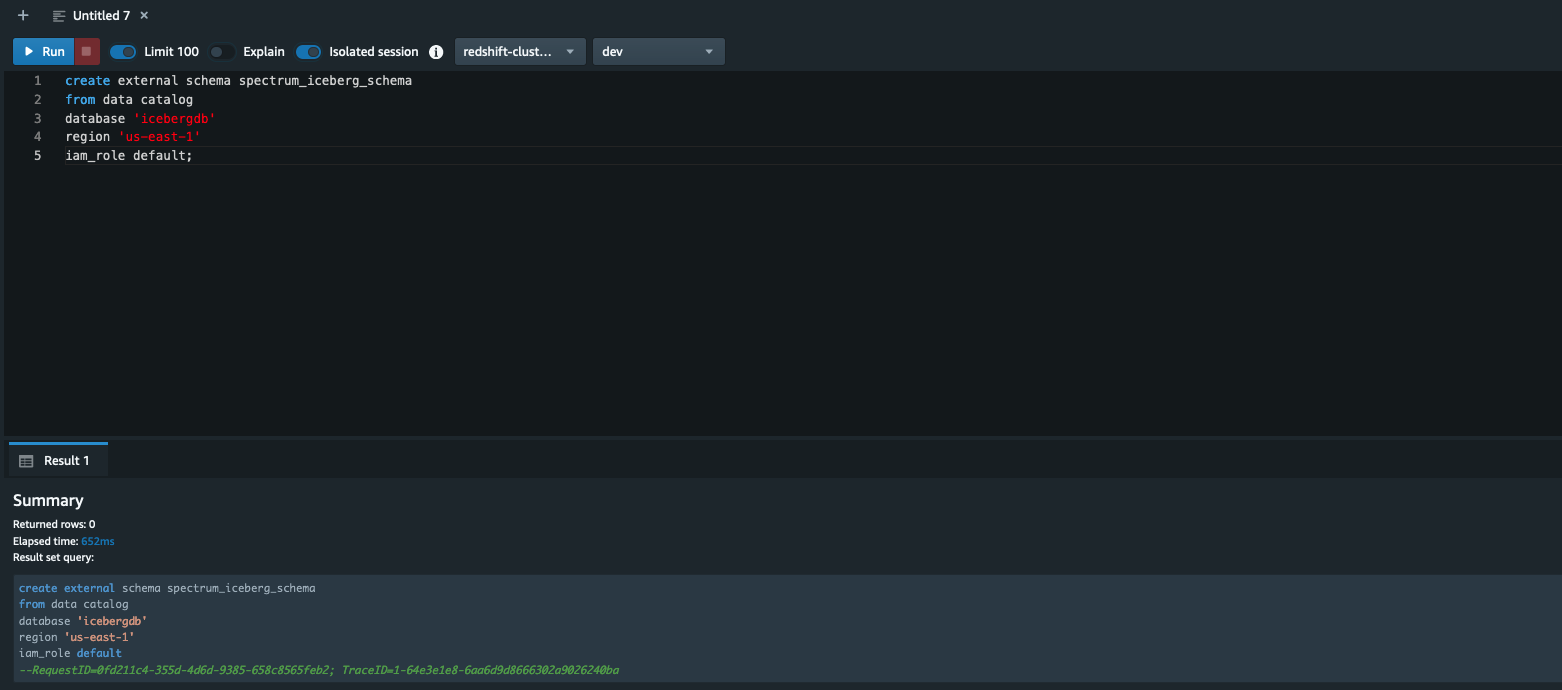
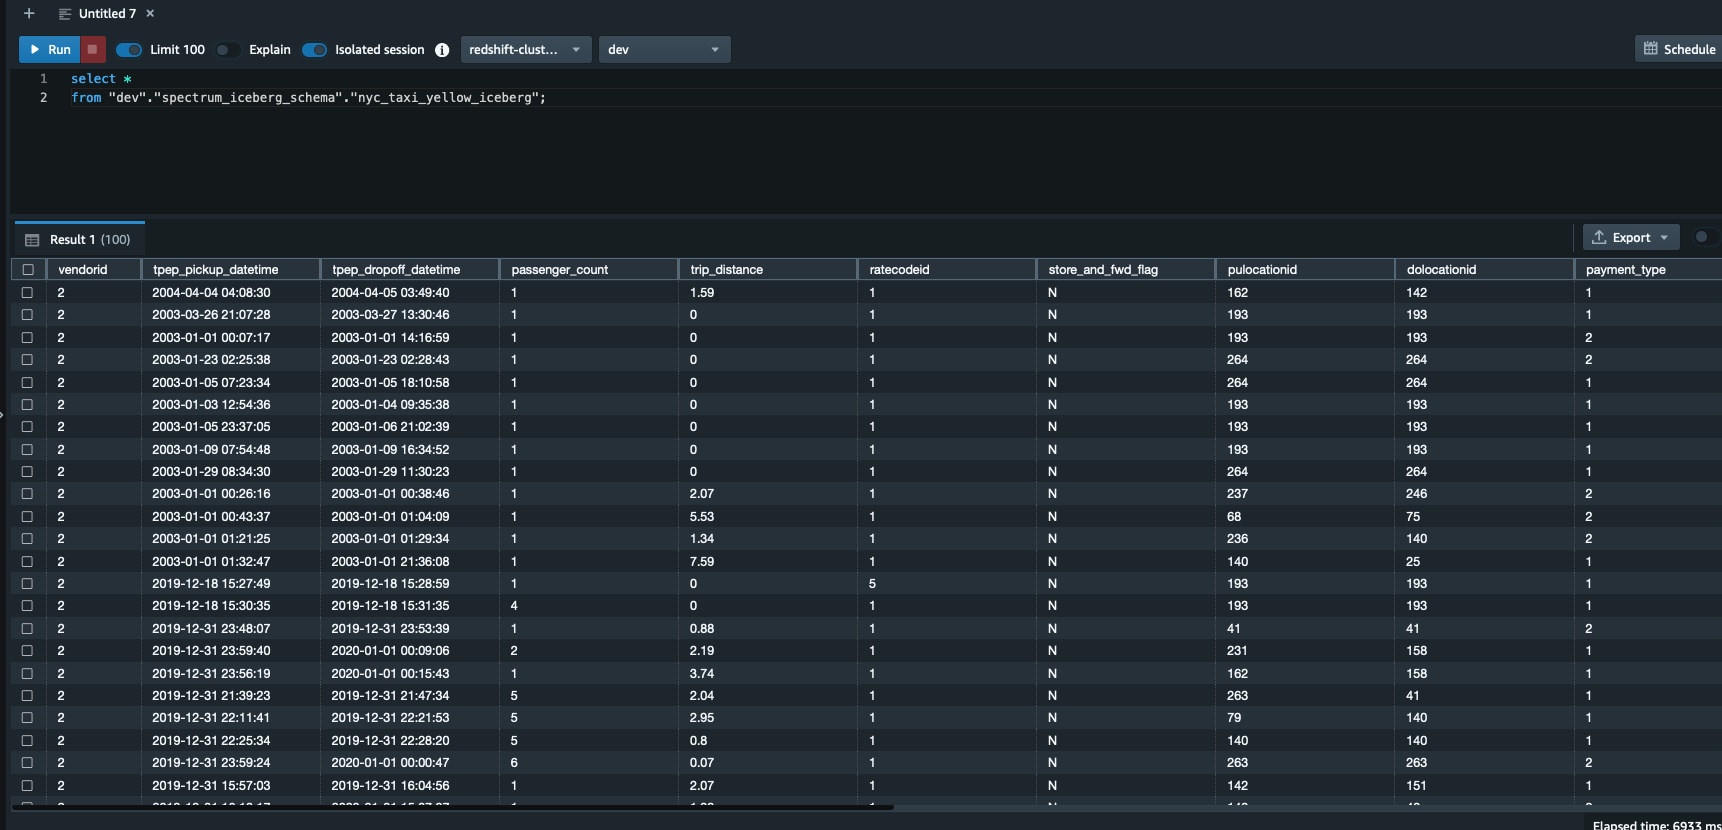

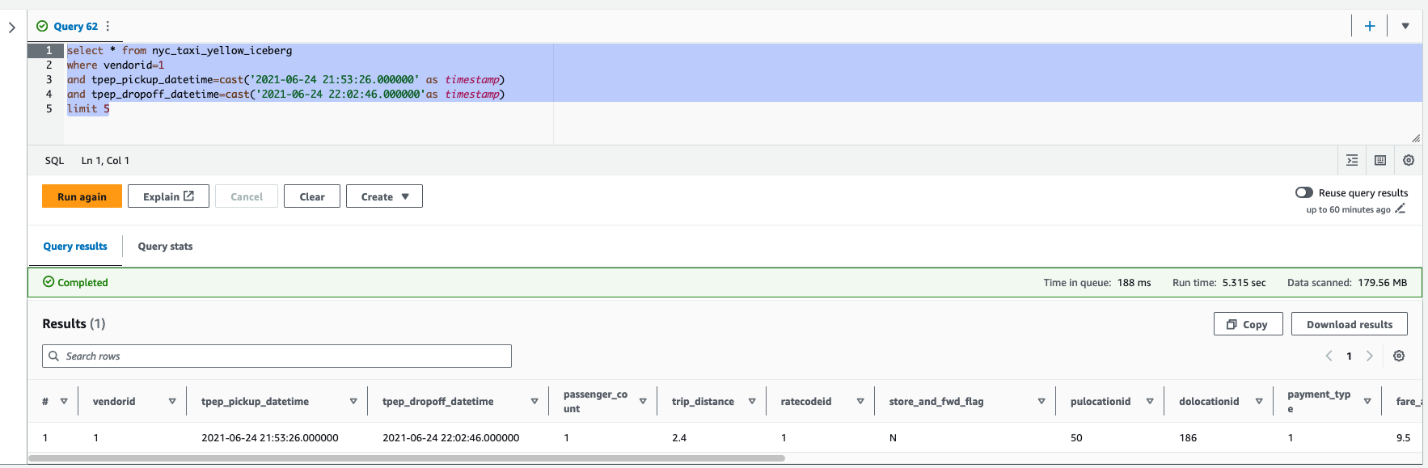
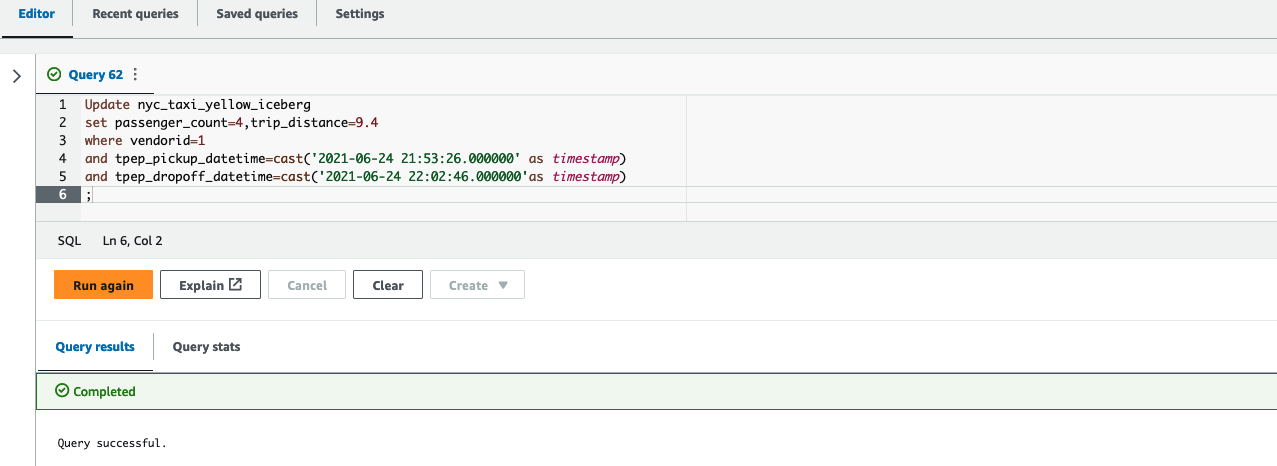


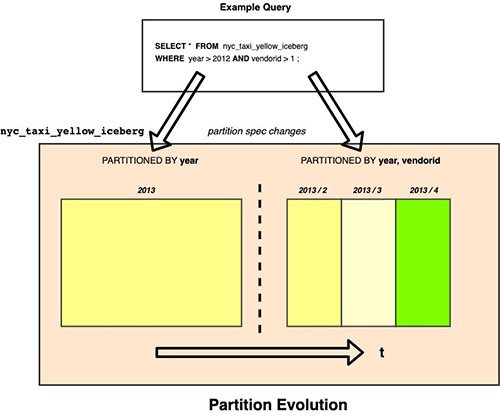

 Satish Sathiya is a Senior Product Engineer at Amazon Redshift. He is an avid big data enthusiast who collaborates with customers around the globe to achieve success and meet their data warehousing and data lake architecture needs.

 Joshua Luo is a Software Development Engineer for Amazon OpenSearch Serverless. He works on the systems that enable customers to manage and monitor their OpenSearch Serverless resources. He enjoys bouldering, photography, and videography in his free time.
 Satish Nandi is a Senior Technical Product Manager for Amazon OpenSearch Service.


 Ziad WALI is an Acceleration Lab Solutions Architect at Amazon Web Services. He has over 10 years of experience in databases and data warehousing where he enjoys building reliable, scalable and efficient solutions. Outside of work, he enjoys sports and spending time in nature.
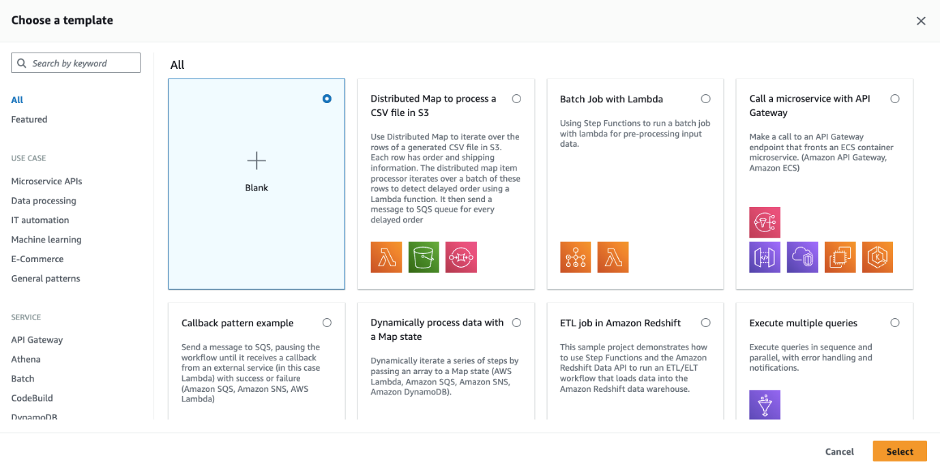


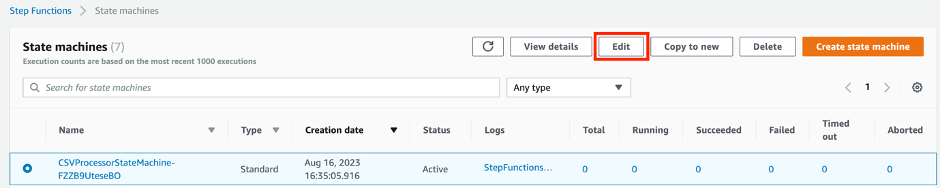
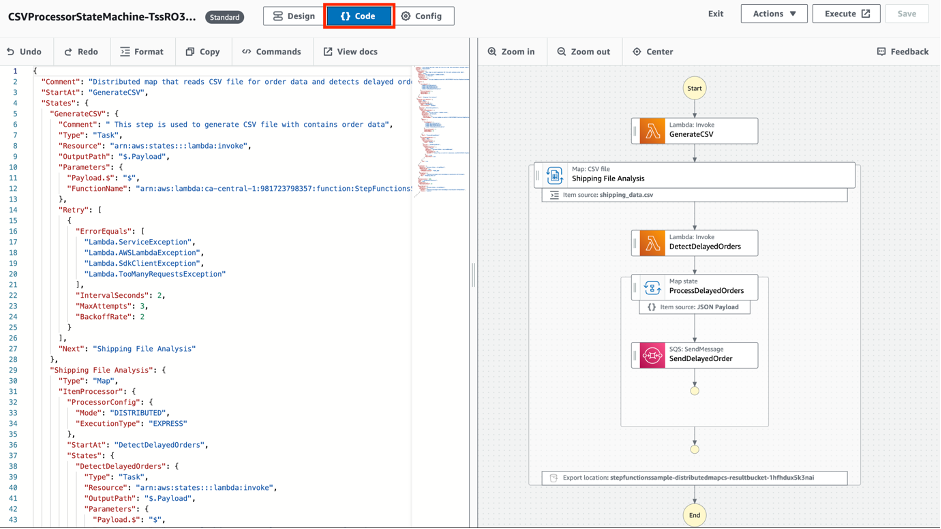
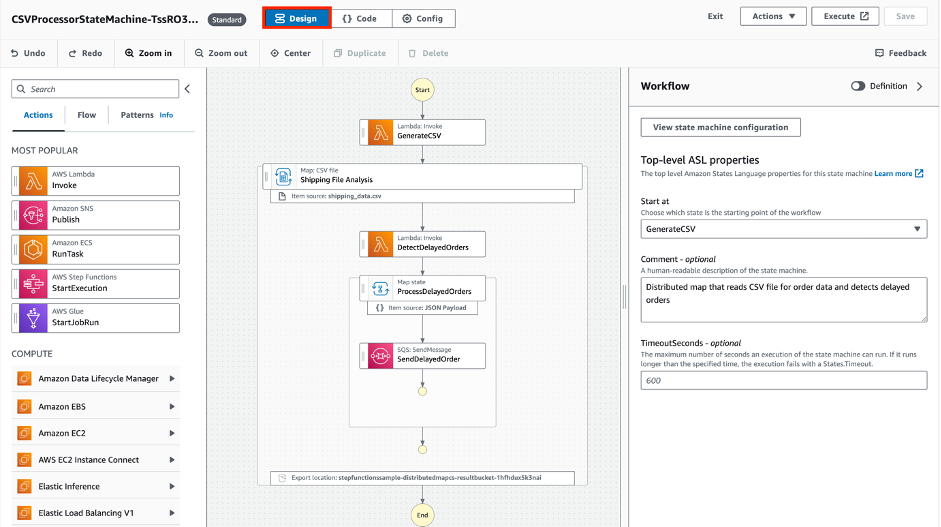
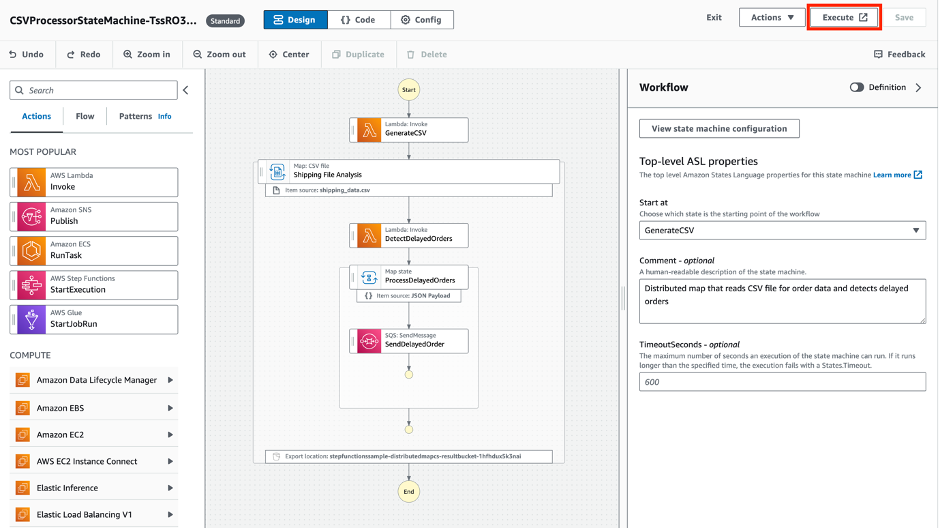



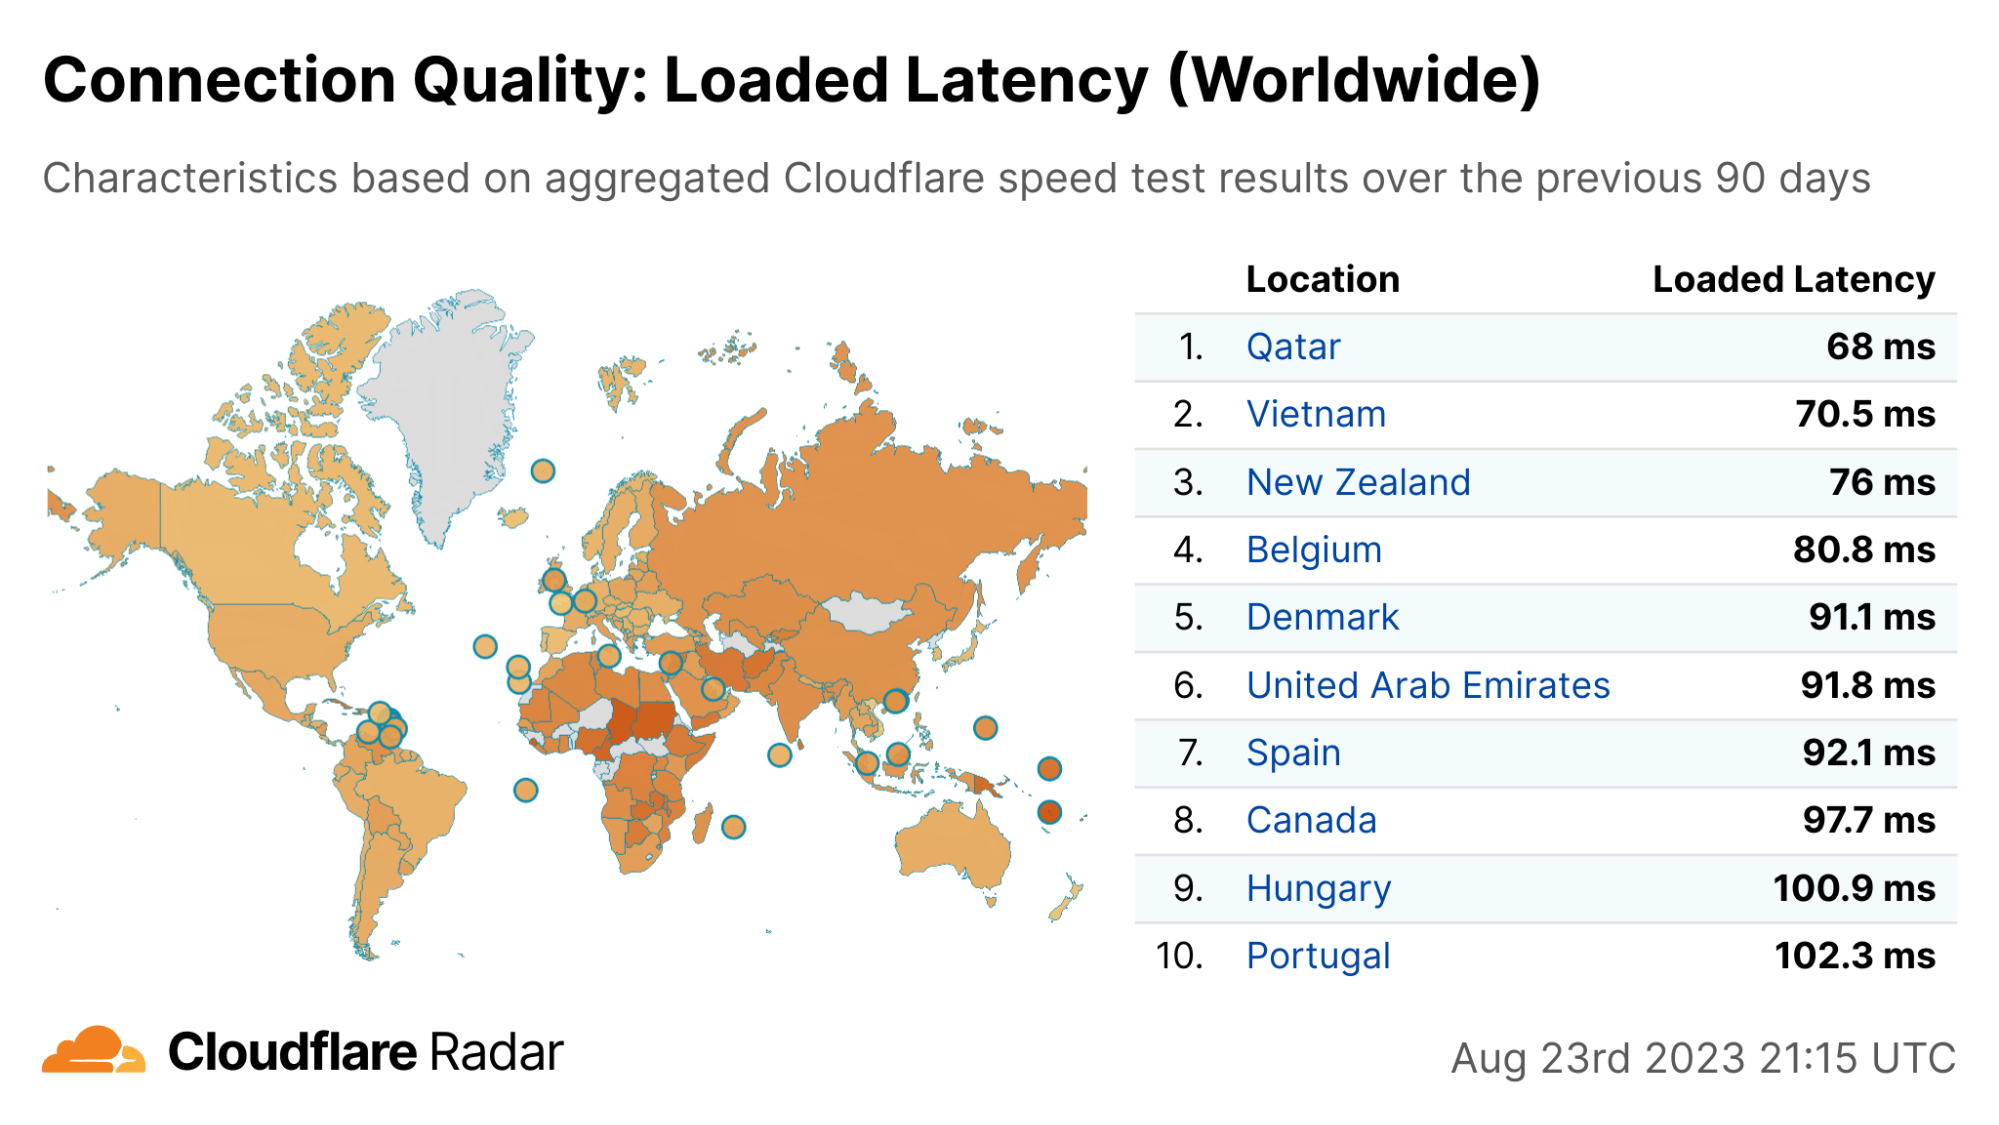

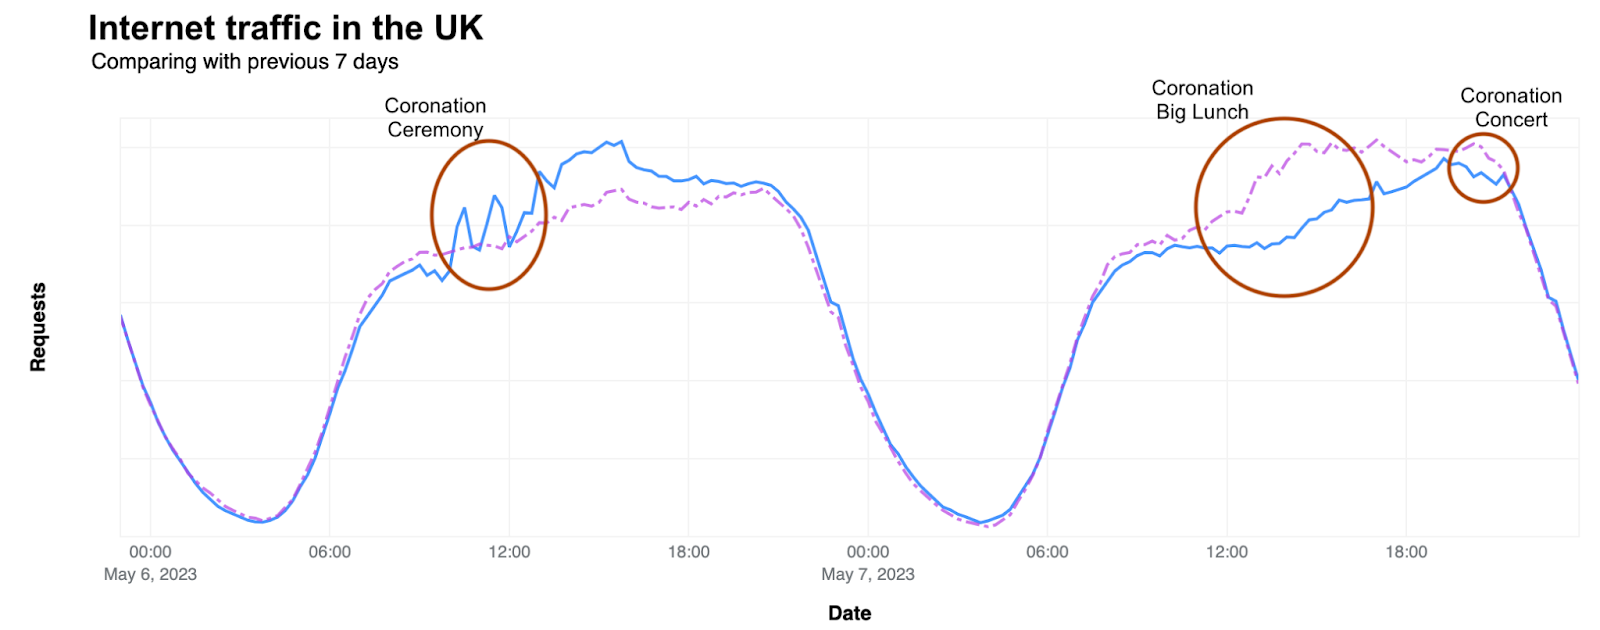

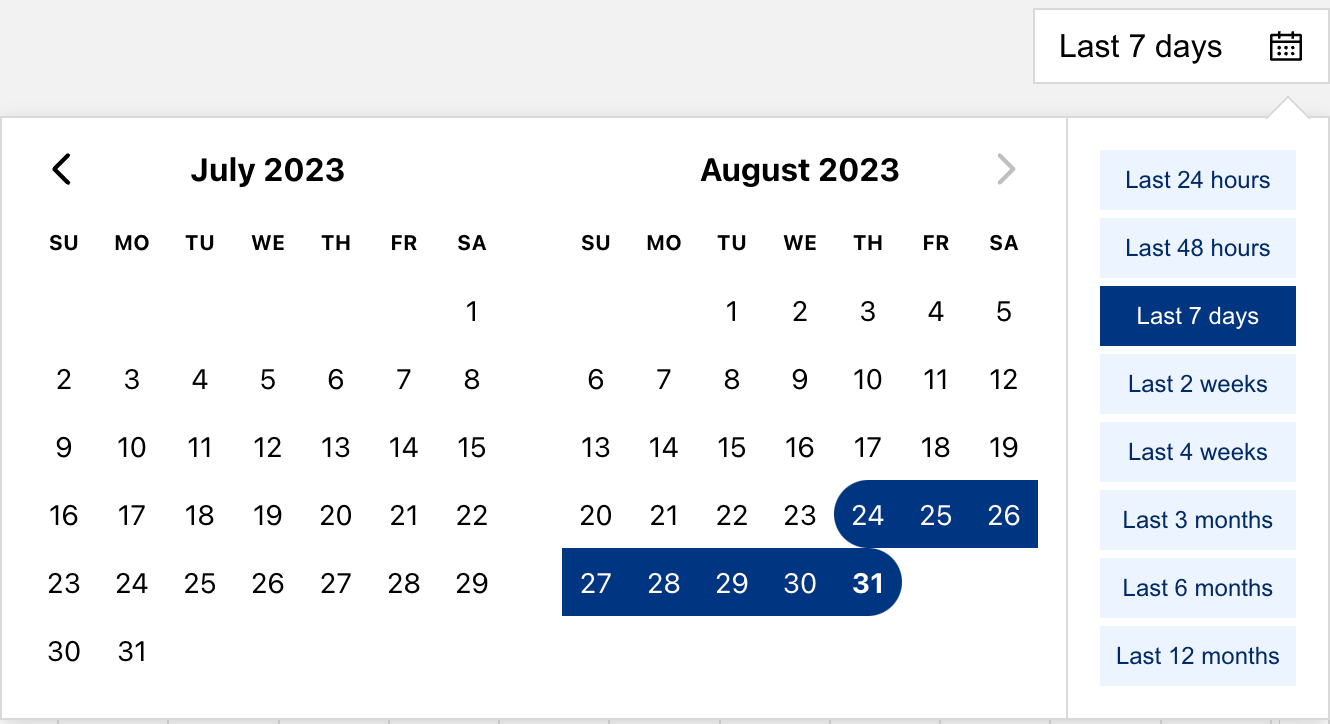


 )

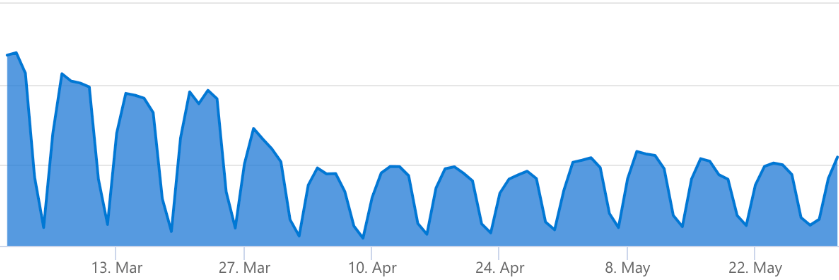





 Много грешно е схващането, че при влизането в монетарния съюз, лихвите по кредитите ще паднат. Реално е точно обратното!