Cloudflare Radar’s 2021 Year In Review

Post Syndicated from João Tomé original https://blog.cloudflare.com/cloudflare-radar-2021-year-in-review/

Cloudflare Radar's 2021 Year In Review

Cloudflare Radar's 2021 Year In Review

In 2021, we continued to live with the effects of the COVID pandemic and Internet traffic was also impacted by it. Although learning and exercising may have started to get back to something close to normal (depending on the country), the effects of what started almost two years ago on the way people work and communicate seems to be here to stay, and the lockdowns or restrictions continue to have an impact on where and how people go online.

So, Cloudflare Radar’s 2021 Year In Review is out with interactive maps and charts you can use to explore what changed on the Internet throughout this past year. Year In Review is part of Cloudflare Radar. We launched Radar in September 2020 to give anyone access to Internet use and abuse trends.

This year we’ve added a mobile vs desktop traffic chart, but also the attack distribution that shows the evolution throughout the year — the beginning of July 2021, more than a month after the famous Colonial Pipeline cyberattack, was the time of the year when attacks worldwide peaked.

There are also interesting pandemic-related trends like the (lack) of Internet activity in Tokyo with the Summer Olympics in town and how Thanksgiving week in the US in late November affected mobile traffic in the United States.

You can also check our Popular Domains — 2021 Year in Review where TikTok, e-commerce and space companies had a big year.

Internet: growing steadily (with lockdown bumps)

In 2020 by late April we saw that the Internet had seen incredible, sudden growth in traffic because of lockdowns and that was sustained throughout the year as we showed in our 2020 Year In Review. 2021 told a slightly different story, depending on the country.

The big April-March and May Internet traffic peak from 2020 related to the pandemic wasn’t there, in the same way, this year — it was more distributed depending on the local restrictions. In 2021, Internet traffic, globally, continued to grow throughout the year, and it was at the end of the year that was higher (a normal trend, given there’s a growth in categories like online shopping and the colder season in the Northern Hemisphere, where most Internet traffic occurs, affects human behaviour).

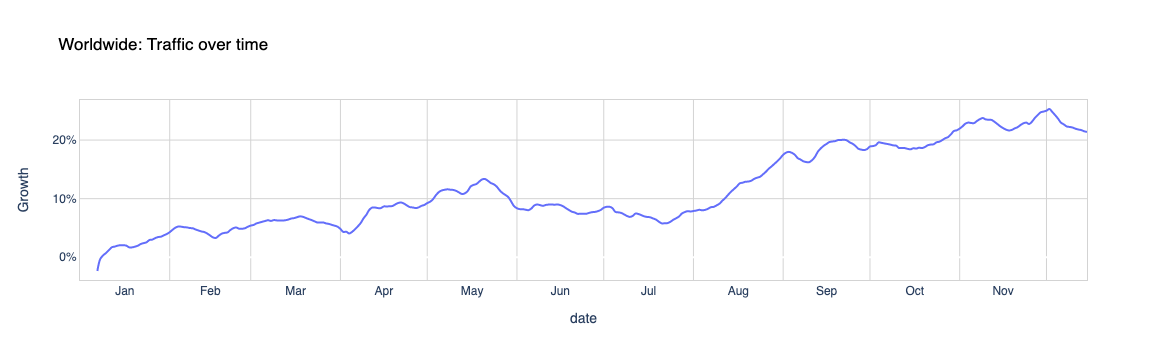
The day of the year with the highest growth in traffic worldwide, from our standpoint, was December 2, 2021, with 20% more than the first week of the year — the Y-axis shows the percentage change in Internet traffic using a cohort of top domains from each country. But in May there was also a bump (highlighted in red as a possible pandemic-related occurrence), although not as high as we saw in the March-May period of last year.

Spikes in Internet traffic — Worldwide 2021

#1 November-December1 (+23%)
#2 September (+20%)
#3 October (+19%)
#4 August (+16%)
#5 May (+13%)
1Beginning of December

Cloudflare Radar's 2021 Year In Review

When we focus on specific countries using our Year In Review 2021 page you can see that new restrictions or lockdowns affected (again) Internet traffic and, in some countries, that is more evident than others.

In the following table, we show the months with the highest traffic growth (the percentage shown focus on the spikes). From our standpoint the last four months of the year usually have the highest growth in traffic after September, but Canada, the UK, Germany, France, Portugal, South Korea and Brazil seemed to show (in red) an impact of restrictions in their Internet traffic — with higher increases in the first five months of the year.

Months with the largest traffic growth — 2021

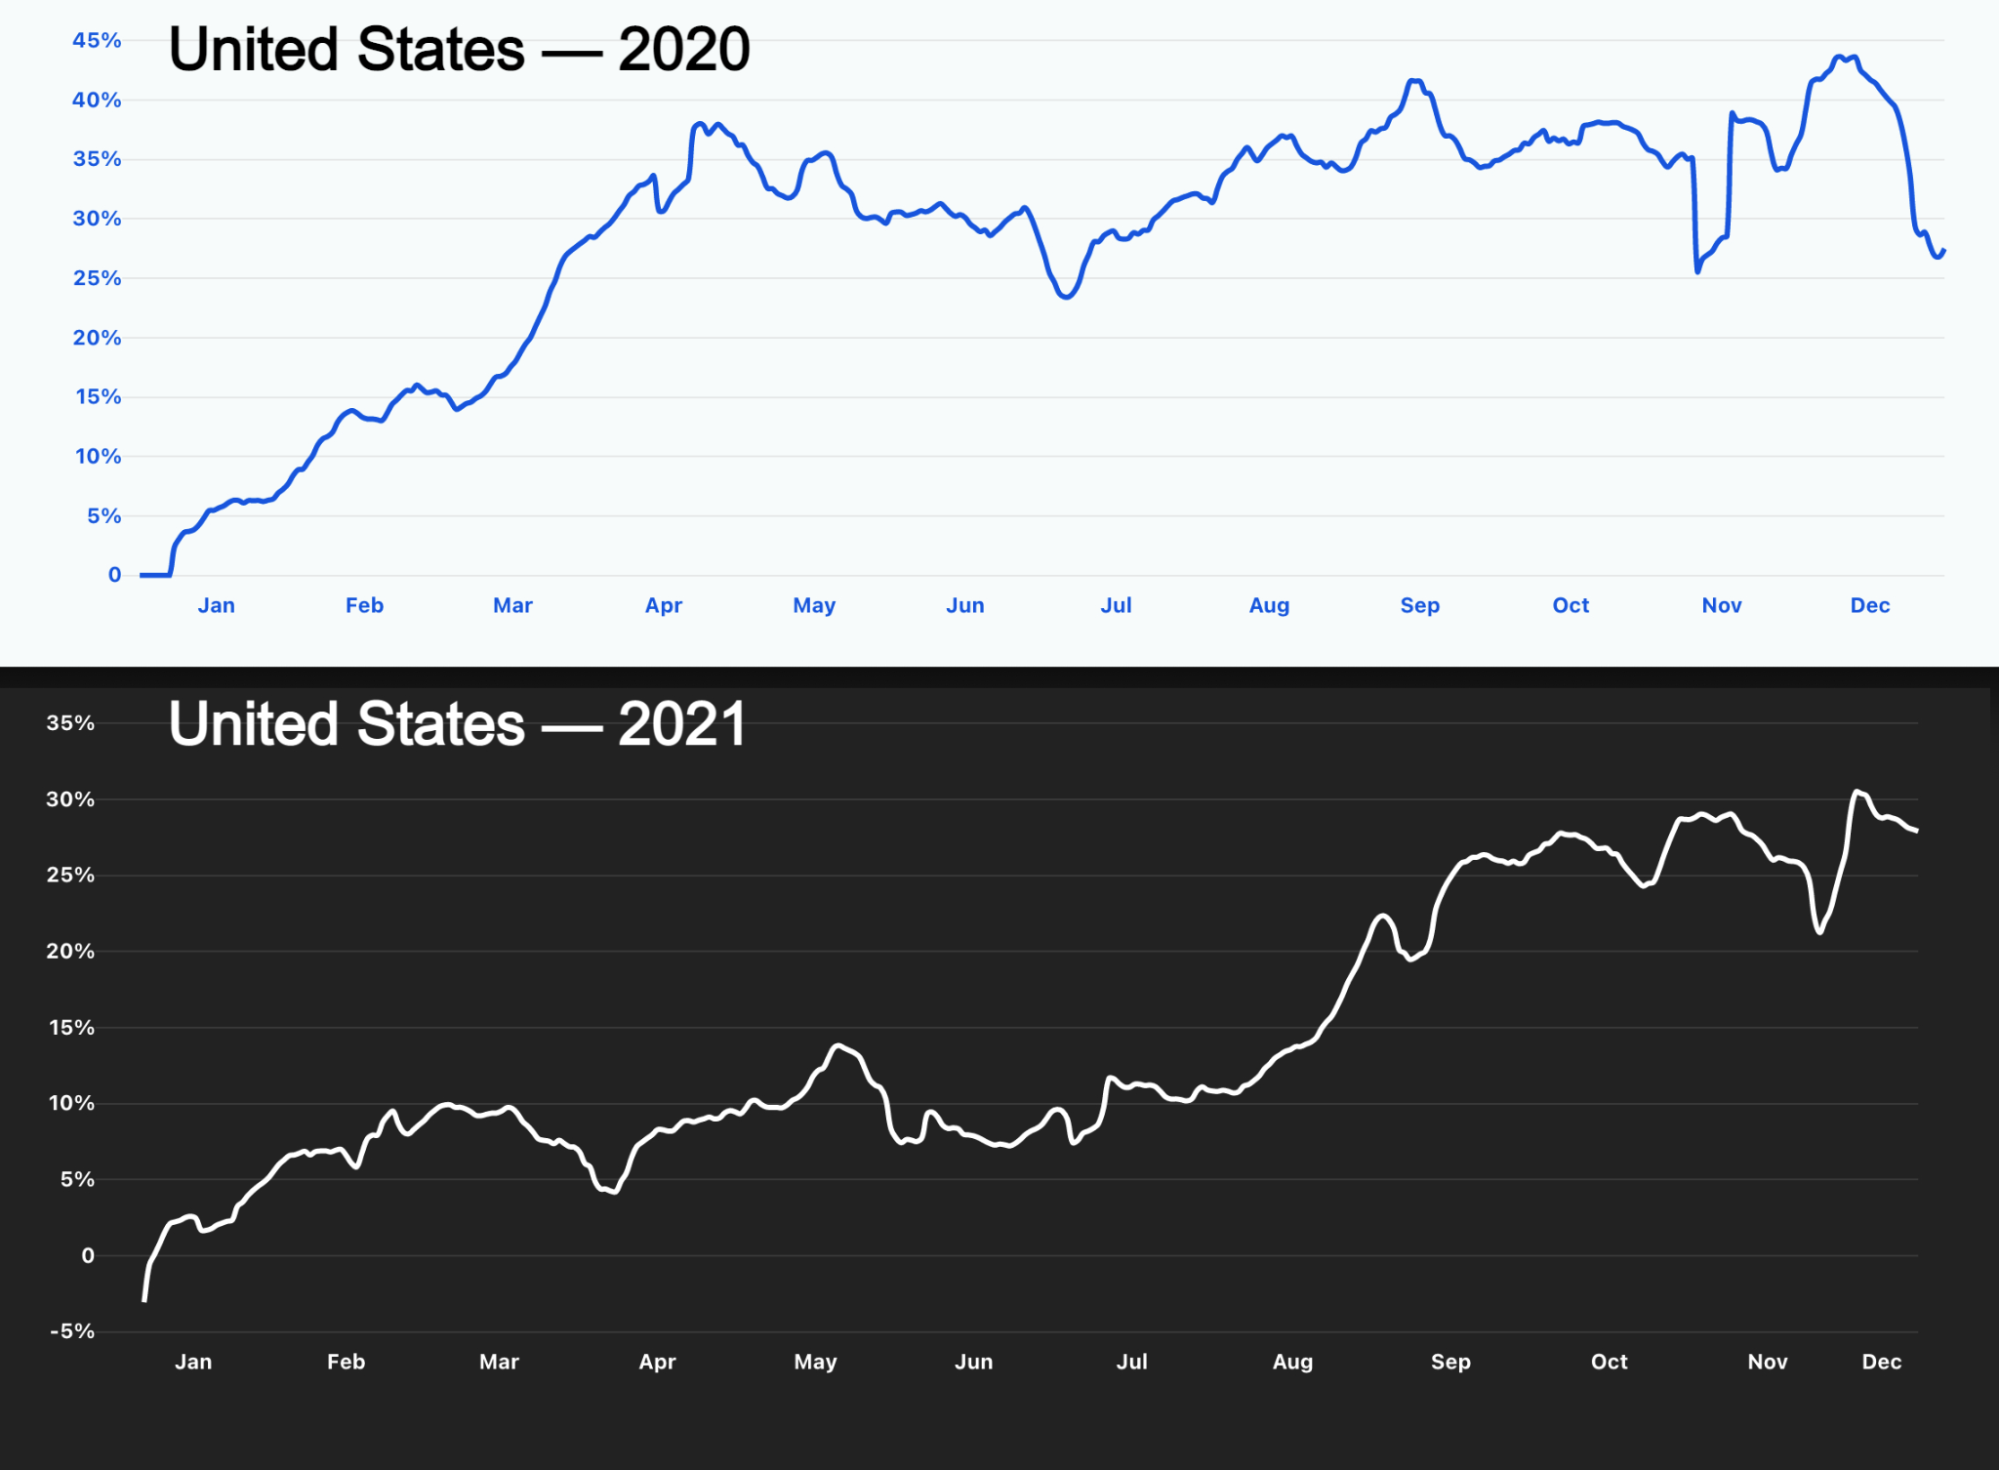
United States 

#1 November-Dec (+30%)
#2 October (+26%)
#3 September (+25%)
#4 August (+15%)
#5 May (+13%)

Canada

#1 November-Dec (+21%)
#2 October (+10%)
#3 April (+9%)
#4 May (+8%)
#5 March (+7%)

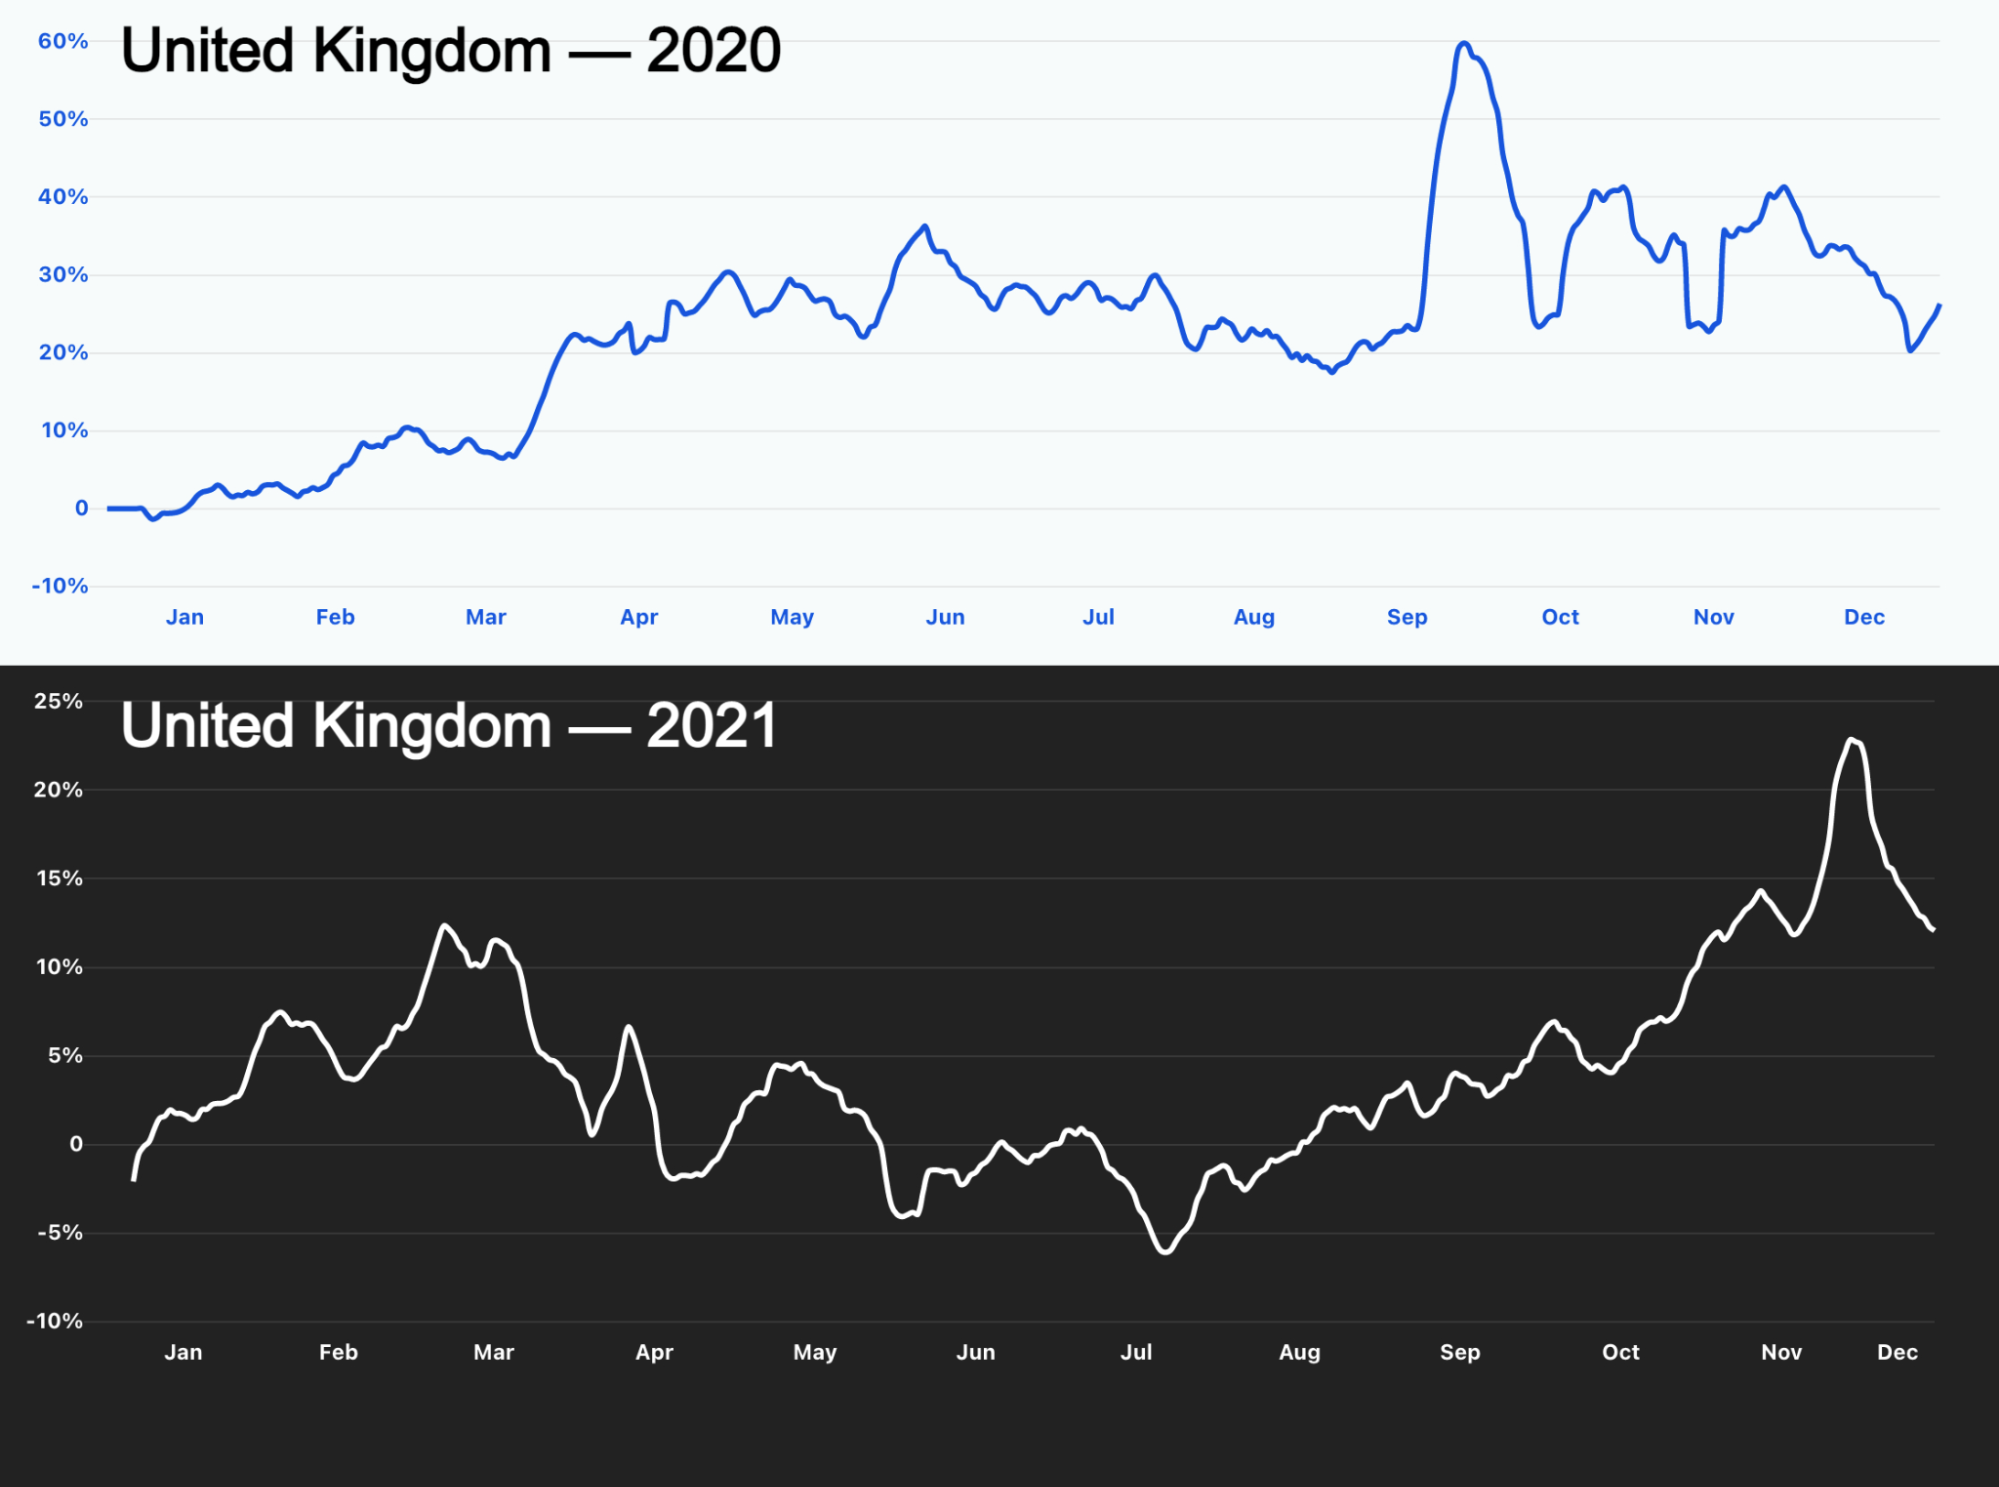
UK

#1 November-Dec (+23%)
#2 March (+13%)
#3 October (+12%)
#4 February (+7%)
#5 September (+5%)

Germany

#1 November-Dec (+25%)
#2 October (+15%)
#3 May (+7%)
#4 February (+6%)
#5 September (+5%)

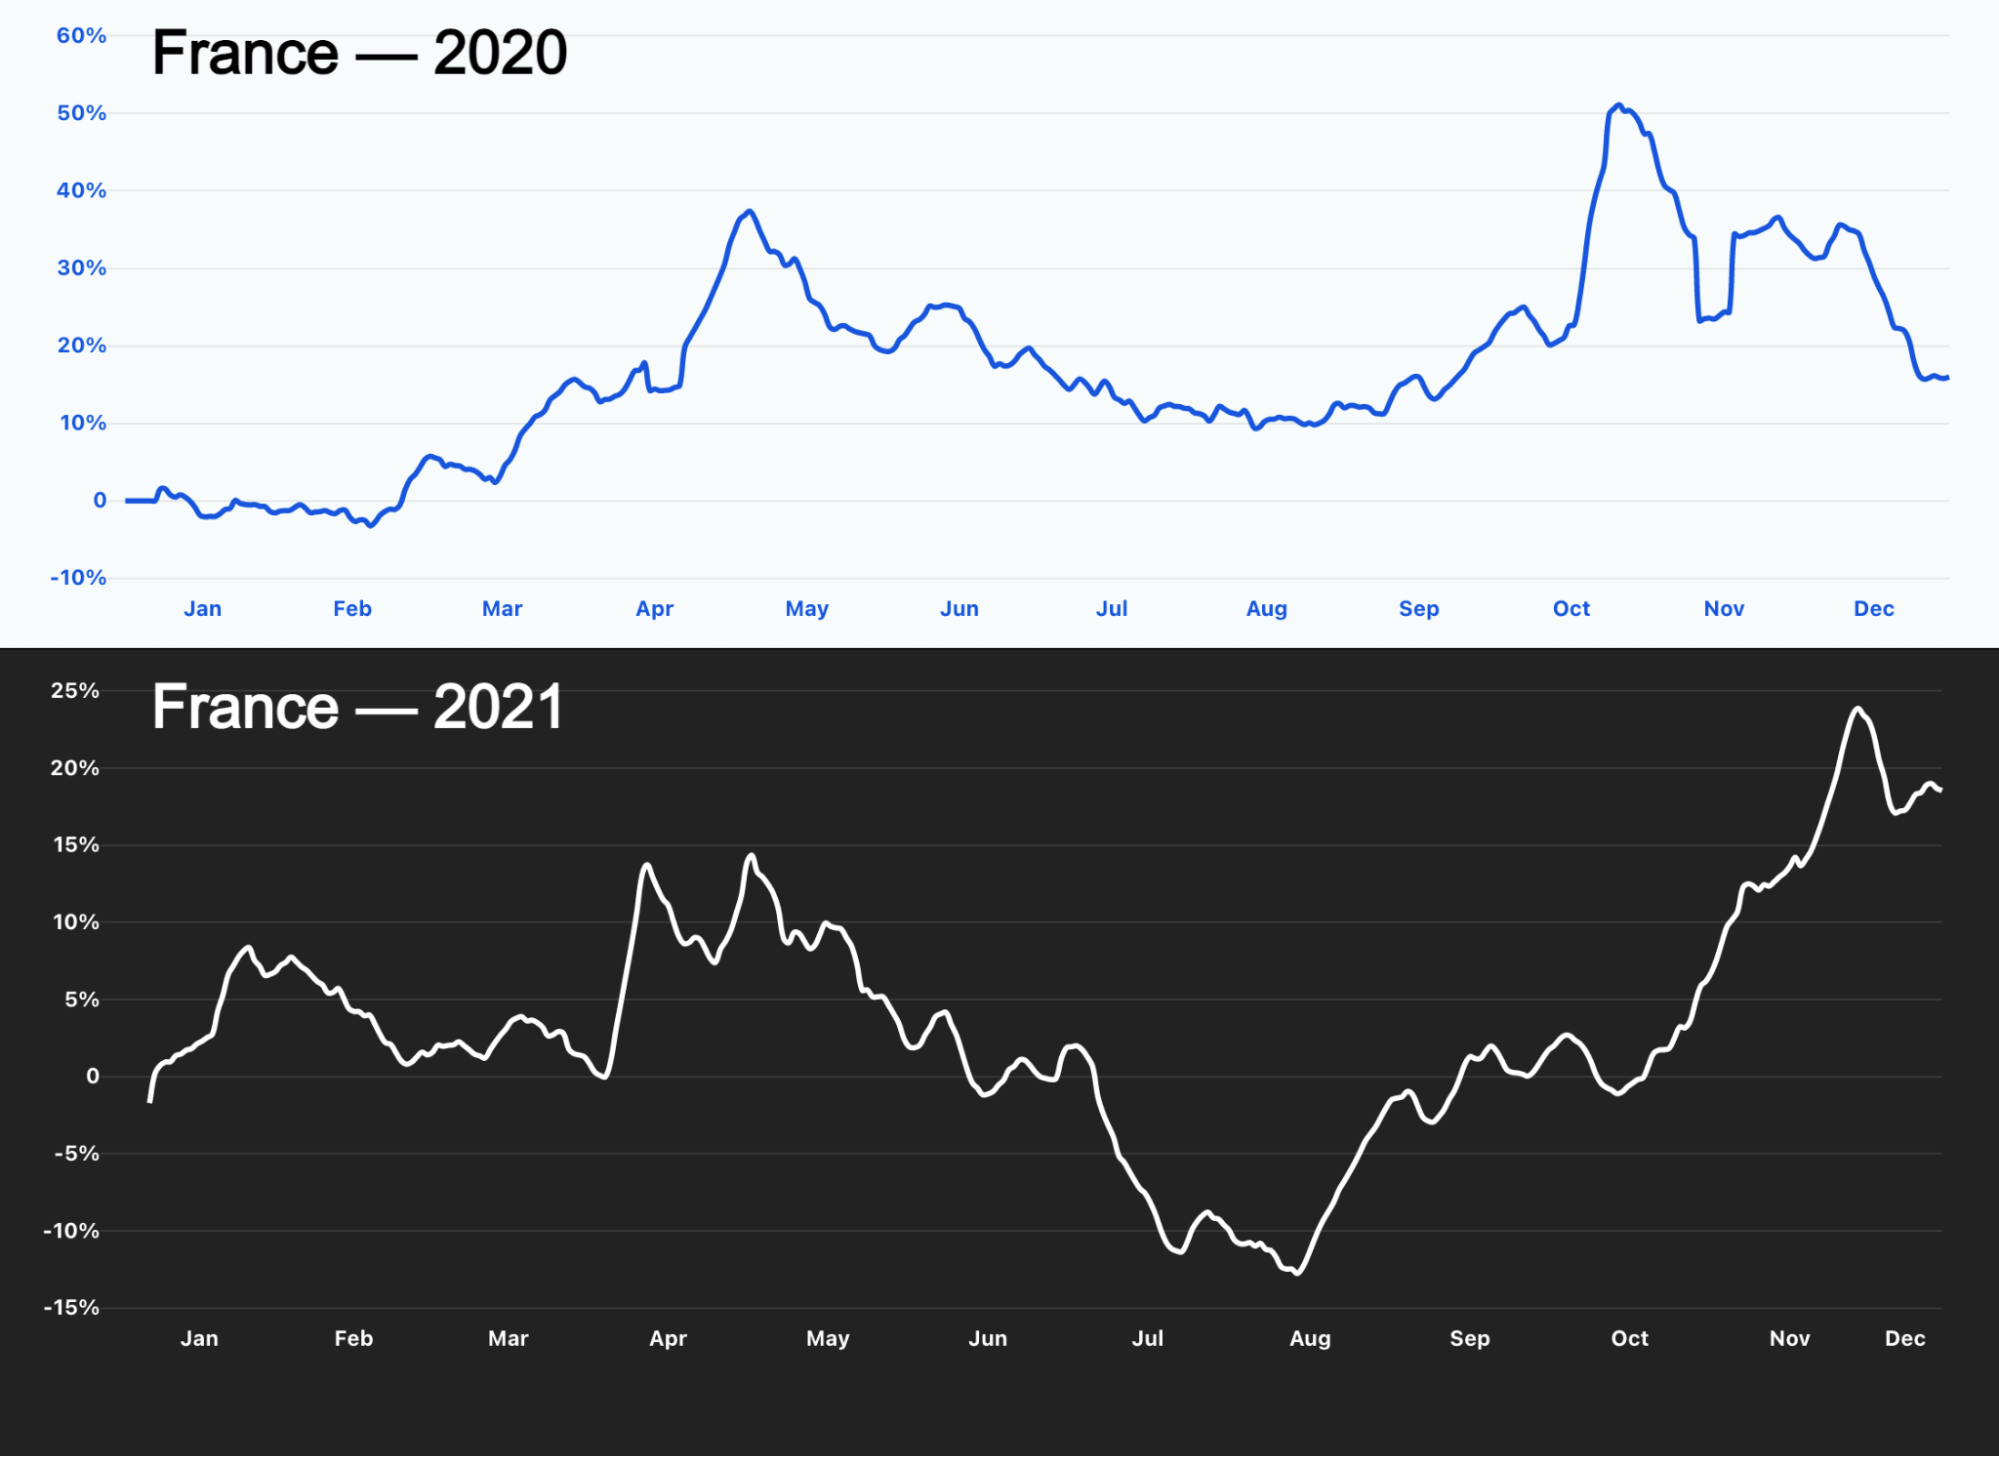
France

#1 November-Dec (+24%)
#2 May (+14%)
#3 April (+13%)
#4 January (+8%)
#5 February (+7%)

Japan

#1 November-Dec (+32%)
#2 October (+28%)
#3 September (+28%)
#4 August (+24%)
#5 July (+18%)

Australia

#1 November-Dec (+42%)
#2 September (+38%)
#3 October (+37%)
#4 August (+32%)
#5 July (+27%)

Singapore

#1 November-Dec (+62%)
#2 October (+58%)
#3 September (+58%)
#4 August (+41%)
#5 July (+31%)

Portugal

#1 February (+38%)
#2 March (+23%)
#3 January (+22%)
#4 November-Dec (+18%)
#5 April (+17%)

South Korea

#1 April (+21%)
#2 May (+16%)
#3 February (+10%)
#4 August (+7%)
#5 September (+7%)

Brazil

#1 May (+25%)
#2 June (+23%)
#3 November-Dec (+22%)
#4 April (+21%)
#5 July (+21%)

India

#1 November-Dec (+24%)
#2 September (+22%)
#3 October (+21%)
#4 August (+19%)
#5 July (+10%)

When we look at those countries’ trends we can see that Canada had lockdowns at the beginning of February that went through March and May, depending on the area of the country. That is in line with what we’ve seen in 2020: when restrictions/lockdowns are up, people tend to use the Internet more to communicate, work, exercise and learn.

Most of Europe also started 2021 with lockdowns and restrictions that included schools — so online learning was back on. That’s clear in the UK. From January to March showed a high increase in traffic percentage that went down when restrictions were relaxed.

Cloudflare Radar's 2021 Year In Review
The lines here show Internet traffic growth from our standpoint throughout 2020 and 2021 in the UK

The same happens in Portugal, where new measures on January 21, 2021, put the three first months of the year in the top 3 of the year in terms of growth of traffic, and April was #5.

We can also check the example of France. Lockdowns were imposed again especially during April and May 2021, and we can see the growth in Internet traffic during those months, slightly more timid than the first lockdown of 2020, but nonetheless evident in the 2021 chart.

Cloudflare Radar's 2021 Year In Review

Germany had the same situation in May (in April work from home was again the rule and the relaxation of measures for vaccinated people only began in mid-May), but in February the lockdown that started at the end of 2020 (and included schools) was also having an impact on Internet traffic.

In South Korea there was also an impact of the beginning of the year lockdown seen in spikes through February, April and May 2021.

Internet traffic growth in the United States had a very different year in 2021 than it had the year before, when the first lockdown had a major effect on Internet growth, but still, May was a month of high growth — it was in mid-May that there were new guidelines from the CDC about masks.

Cloudflare Radar's 2021 Year In Review

Mobile traffic: The Thanksgiving effect

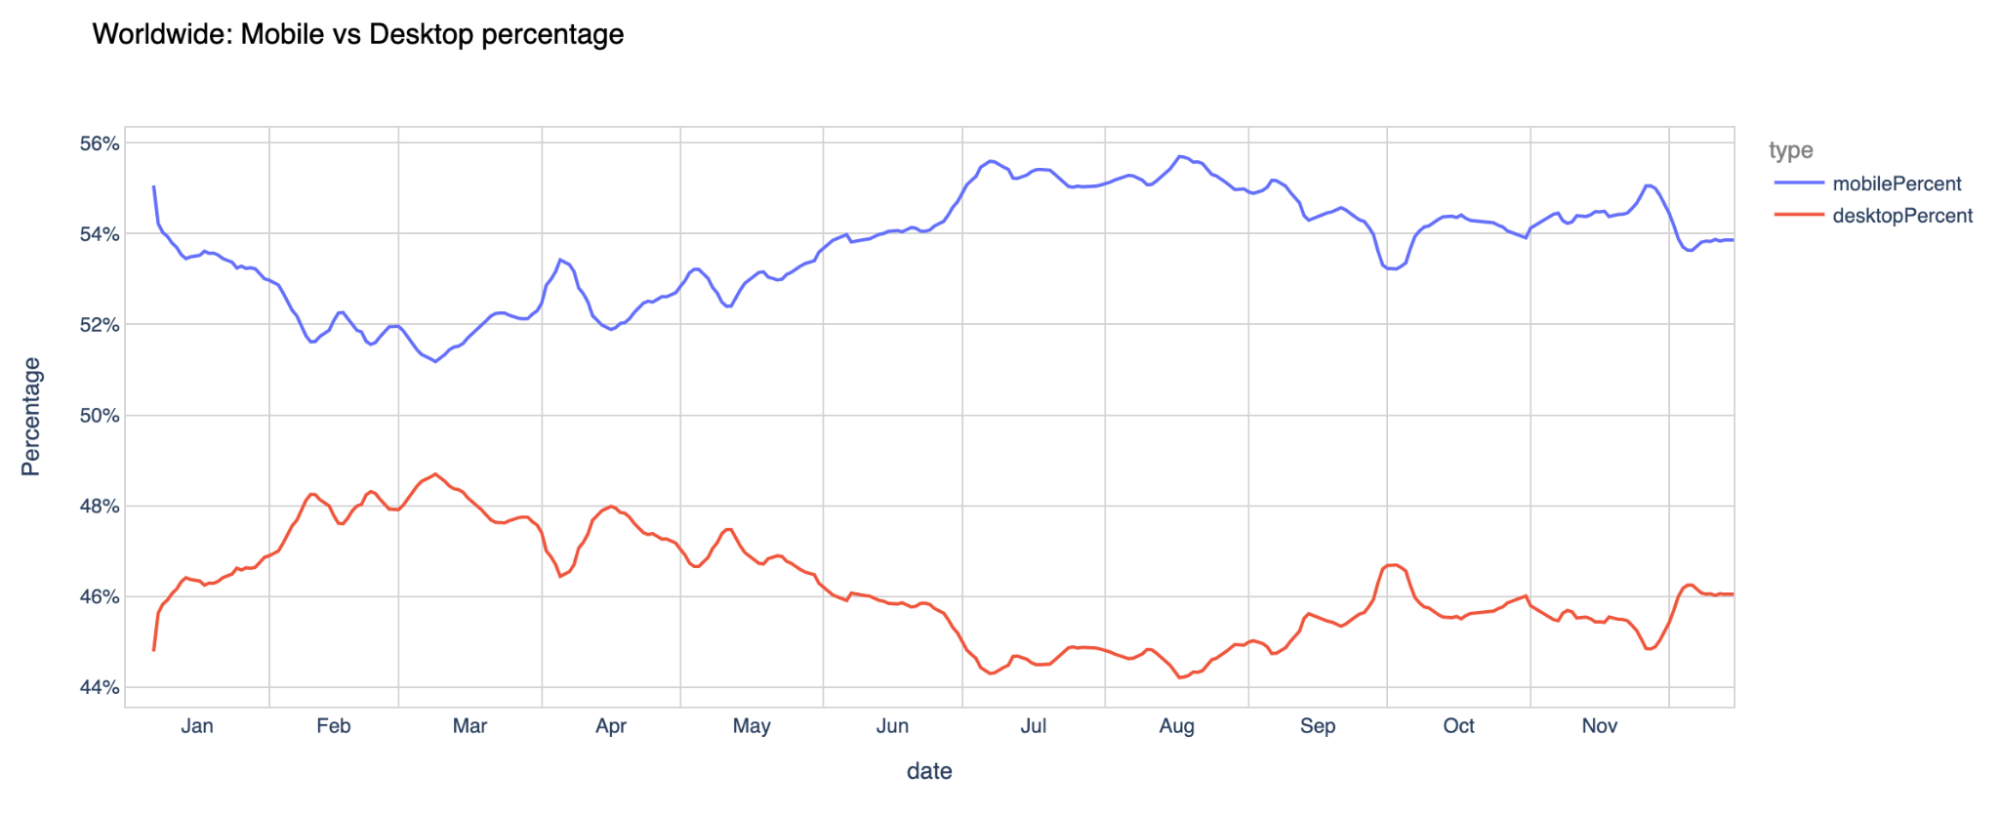
Another trend worldwide from 2021 is the mobile traffic percentage evolution. Worldwide, from our standpoint, the more mobile-friendly months of the year — where mobile devices were more prevalent to go online — were July and August (typical vacations months in most of the Northern Hemisphere), but January and November were also very strong.

Cloudflare Radar's 2021 Year In Review

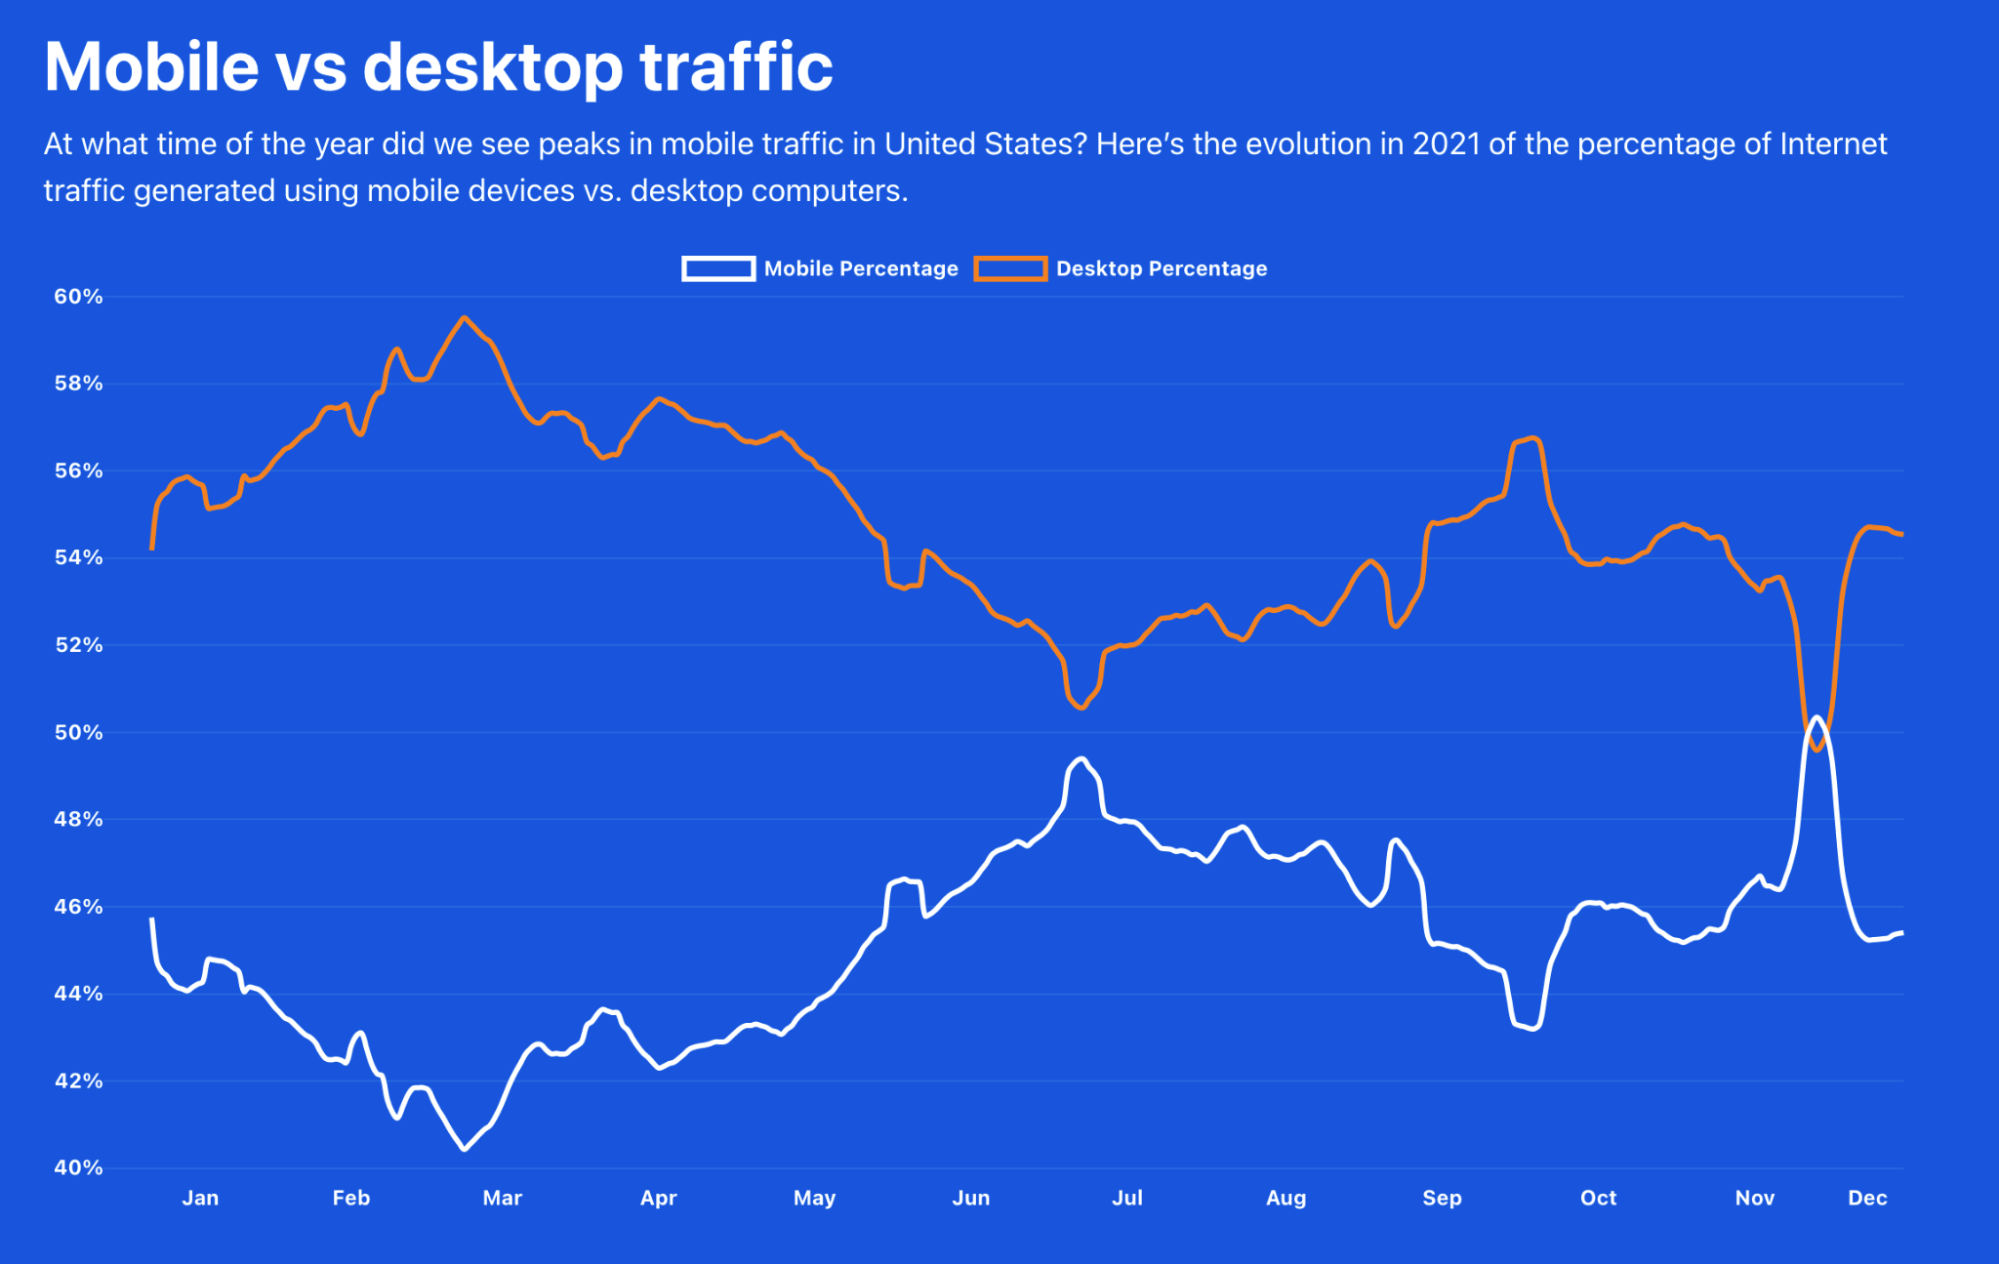
On our Year in Review page, you can also see the new mobile vs desktop traffic chart. The evolution of the importance of mobile traffic is different depending on the country.

For example, the United States has more desktop traffic throughout the year, but in 2021, during the Thanksgiving (November 25) week, mobile traffic took the lead for the first and only time in the whole year. We can also see that in July mobile traffic was also high in terms of relevance.

Cloudflare Radar's 2021 Year In Review

The UK has a similar trend, with June, July and August being the only months of the year when mobile traffic is prevalent compared to desktop.

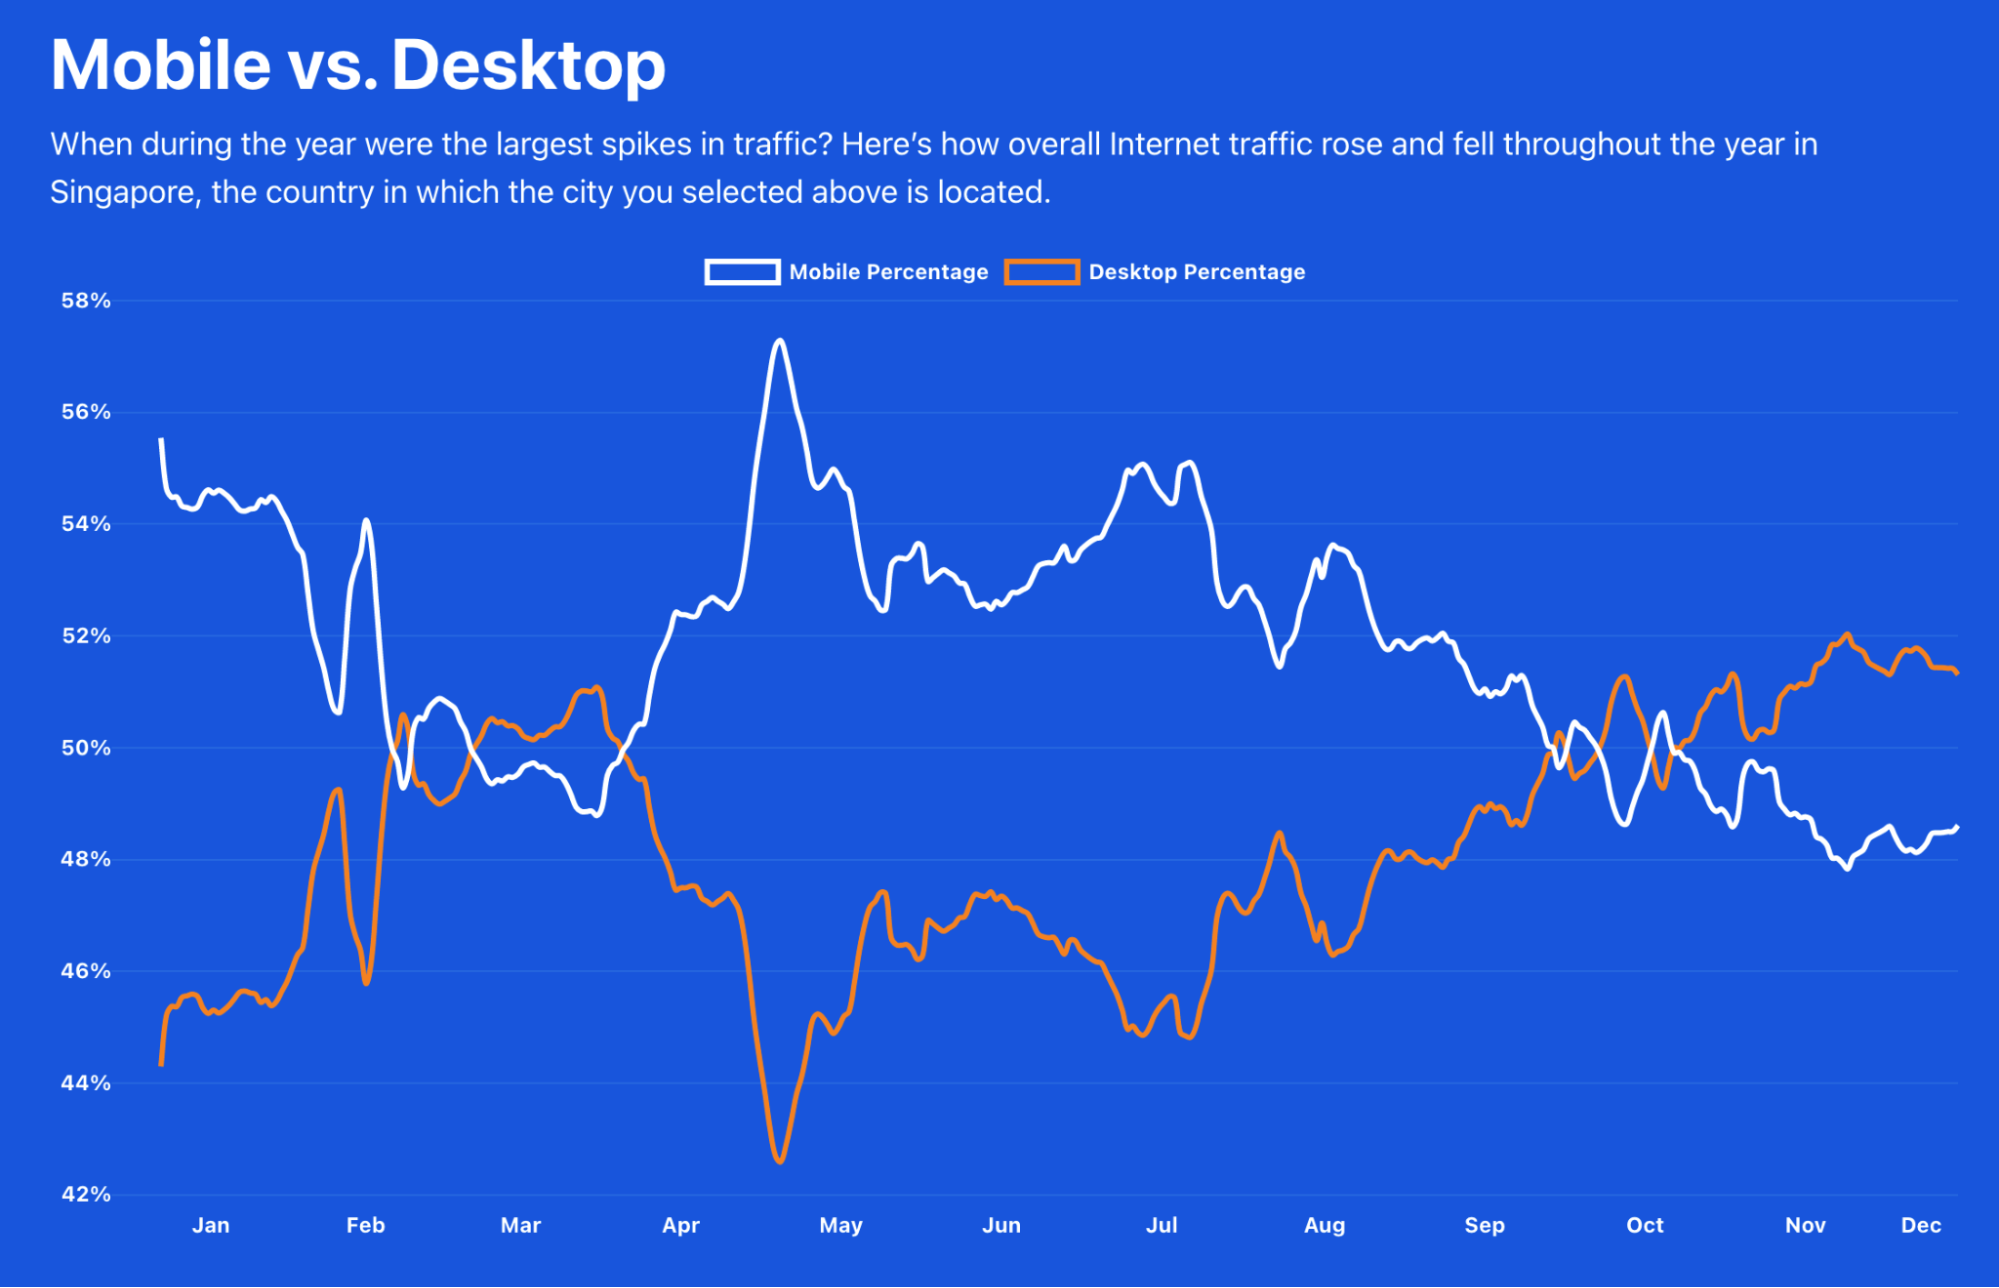
If we go to the other side of the planet, to Singapore, there the mobile percentage is usually higher than desktop, and we see a completely different trend than in the US. Mobile traffic was higher in May, and desktop only went above mobile in some days of February, some in March, and especially after the end of October.

Cloudflare Radar's 2021 Year In Review

Where people accessed the Internet

We also have, again, available the possibility of selecting a city from the map of our Year in Review to zoom into a city to see the change in Internet use throughout the year. Let’s zoom in on San Francisco.

The following agglomeration of maps highlights (all available in our Year in Review site) the change in Internet use comparing the start of 2020, mid-January to mid-March — you can see that there’s still some increase in traffic, in orange —, to the total lockdown situation of April and May, with more blue areas (decrease in traffic).

Cloudflare Radar's 2021 Year In Review
The red circles shows San Francisco and its surroundings (home of a lot of companies) in a map that compares working hours Internet use on a weekday between two months.

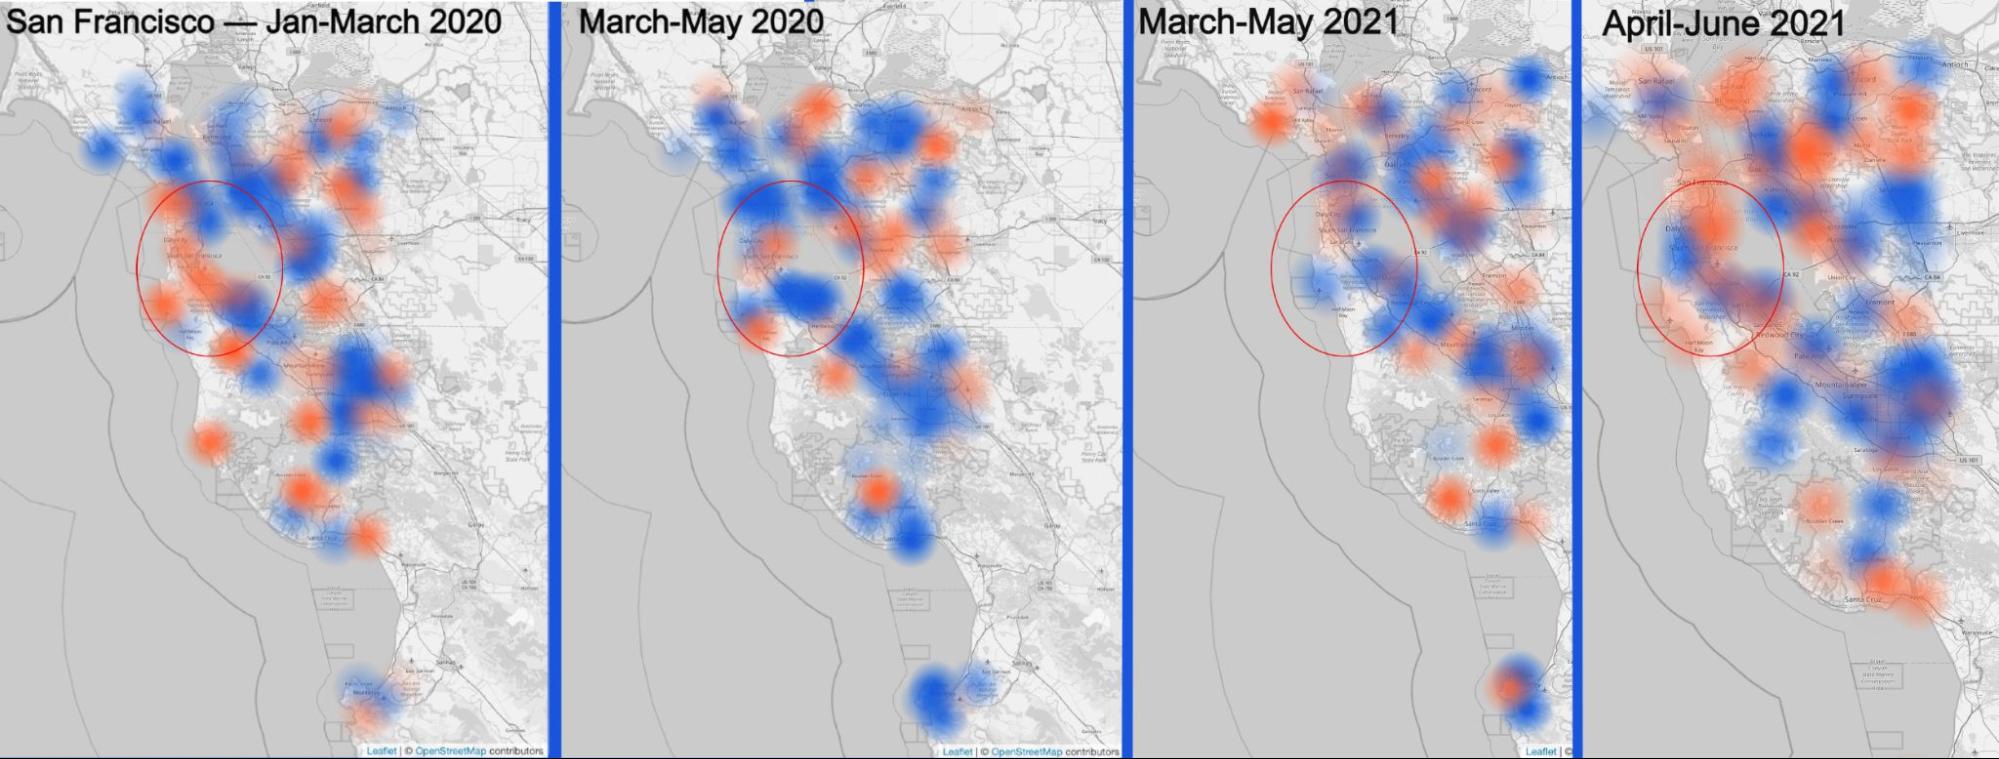
The same trend is seen already in May 2021 in a time when remote work continued to be strong — especially in tech companies (employees moved from the Bay Area). Only in June of this year, there was some increase in traffic (more orange areas), especially further away from San Francisco (in residential areas).

London: From lockdown to a Euro Championship final

London tells us a different story. Looking through the evolution since the start of 2020 we can see that in March (compared to January) we have an increase in traffic (in orange) outside London (where blue is dominant).

The Internet activity only starts to get heavier in June, in time for the kick-off of the 2020 UEFA European Championship. The tournament played in several cities in Europe had a lot of restrictions and a number of games were played in London at Wembley Stadium — where Italy won the final by beating England on penalties. But at the time of the final, July, and especially August, blue was already dominant again — so people seemed to leave the London area. Only in September and October did the traffic start to pick up again, but mostly outside the city centre.

Cloudflare Radar's 2021 Year In Review

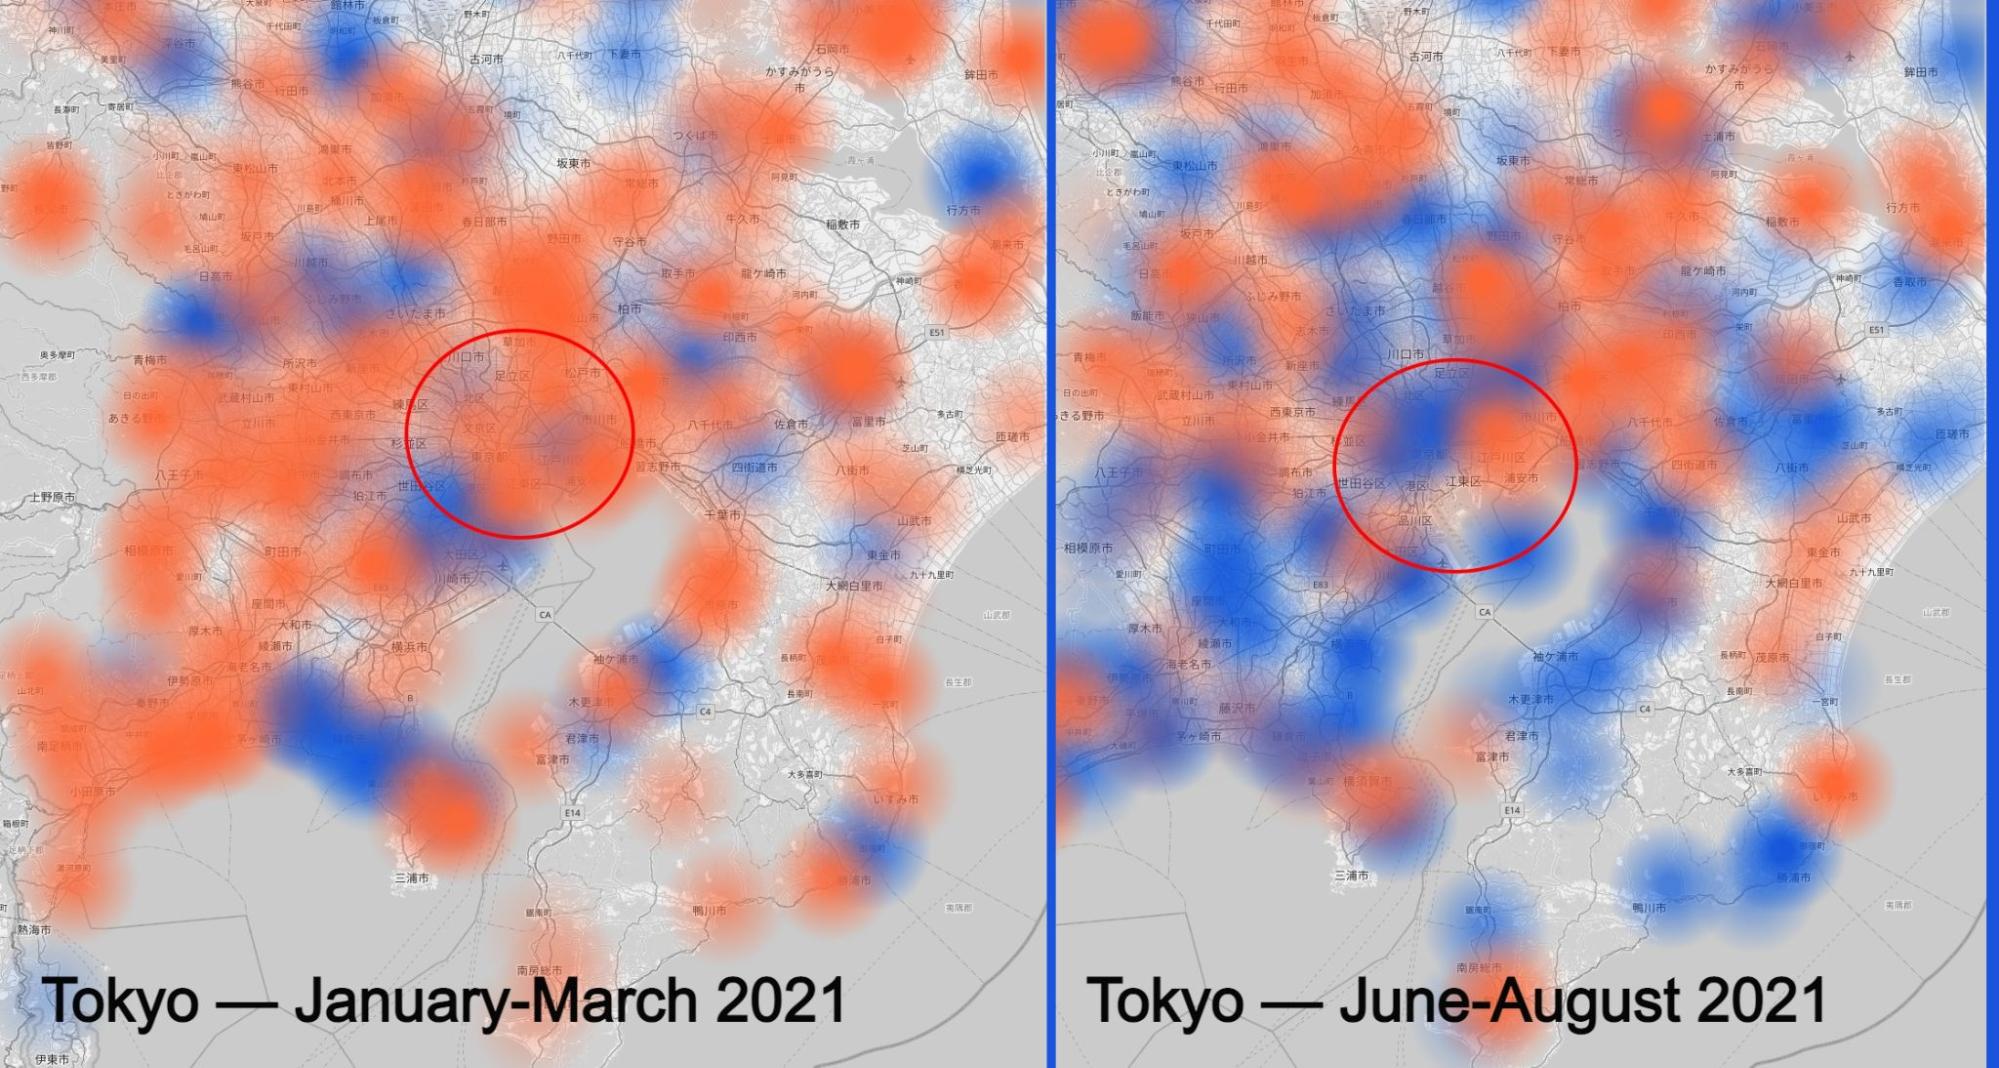
The Summer Olympics impact? Tokyo with low activity

After the UEFA European Championship, came the other big event postponed back in 2020, the Tokyo Summer Olympics. Our map seems to show the troubled months before the event with the pandemic numbers and the restrictions rising before the dates of the major event — late July and the first days of August.

There were athletes, but not fans from around the world and even locals weren’t attending — i​t was largely an event held behind closed doors with no public spectators permitted due to the declaration of a state of emergency in the Greater Tokyo Area. We can see that in our charts, especially when looking at the increase in activity in March (compared to January) and the decrease in August (compared to June), even with a global event in town (Tokyo is in the red circle).

Cloudflare Radar's 2021 Year In Review

There’s also another interesting trend pandemic-related in Lisbon, Portugal. With the lockdowns put in place since mid-January, the comparison with March shows the centre of the city losing Internet traffic and the residential areas outside Lisbon gaining it (in orange in the animation). But in April the activity decreased even around Lisbon and only started to get heavier in May when restrictions were more a lot more relaxed.

Lockdowns bring more traffic to Berlin

A different trend can be seen in Berlin, Germany. Internet activity in the city and its surroundings was very high in March and in April (compared to the previous two months) at a time when lockdowns were in place — nonetheless, in 2020 the activity decreased in April with the first major lockdown.

But in May and June, with the relaxation in restrictions, Internet activity decreased (blue) giving the idea that people left the city or, at least, weren’t using the Internet so much. Only in August did Internet activity begin to pick up again, but decreased once more in the colder months of November and December.

Cloudflare Radar's 2021 Year In Review

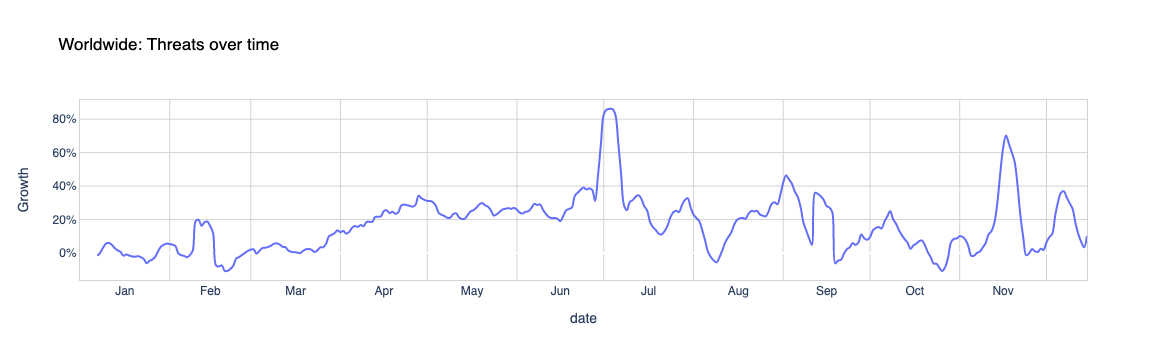
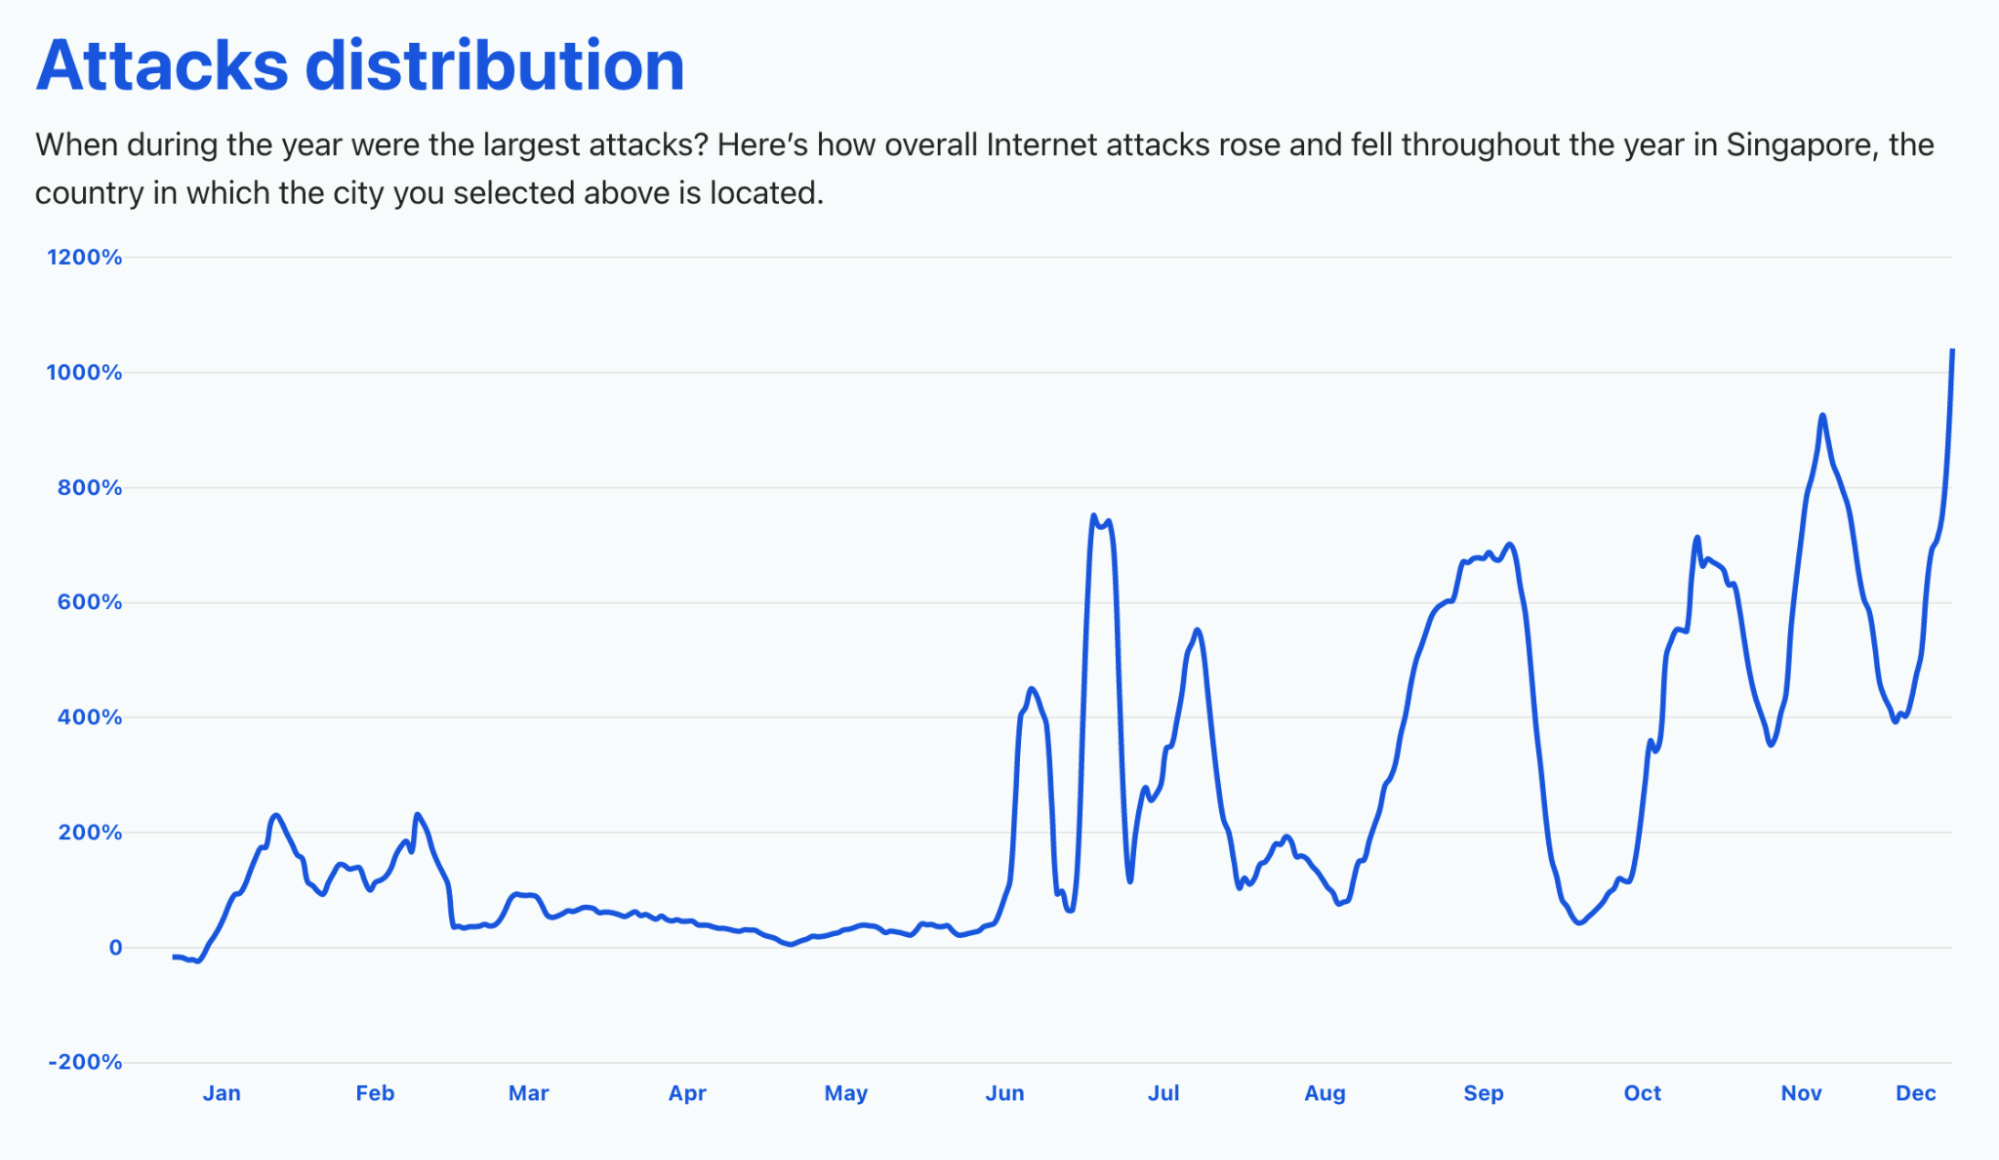
Cyberattacks: Threats that came in July

In terms of worldwide attacks, July and November (the month of Black Friday, when it reached a 78% in increase) were definitely the months with the highest peak of the year. The biggest peak was at the beginning of July 2021, when it reached 82%. That was more than a month after the Colonial Pipeline ransomware cyberattack — May was also the month of an attack on part of Toshiba and, in the same week, the Irish health system and of the meat processing company JBS.

The week of December 6 (the same when the Log4j vulnerability was disclosed) also had an increase in attacks — 42% more, and there was also a clear increase (42%) in the beginning of October, around the time of the Facebook outage.

Cloudflare Radar's 2021 Year In Review

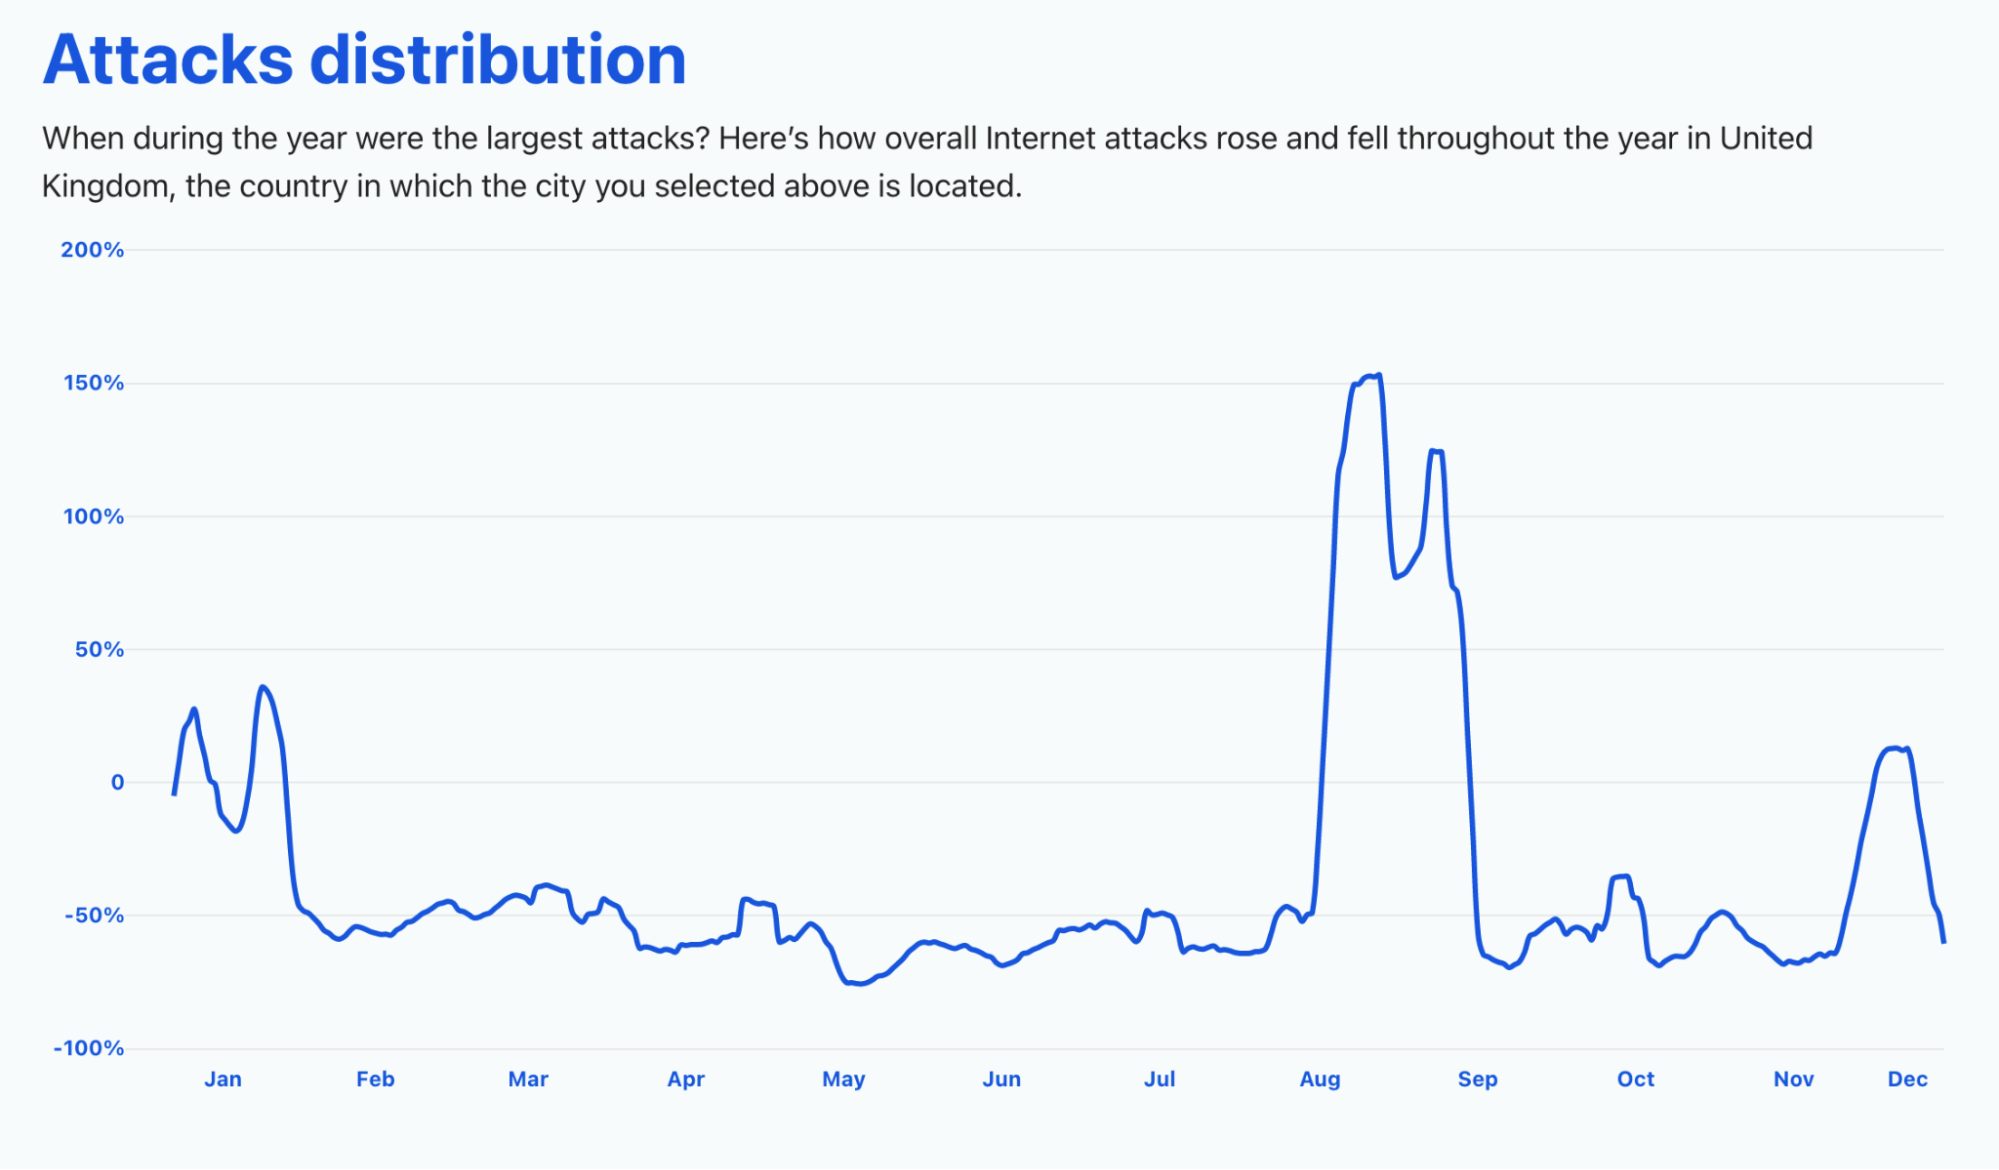
In our dedicated page you can check — for the first time this year — the attack distribution in a selection of countries.

The UK had a very noticeable peak in overall Internet attacks (a growth of 150%) in August and that continued through September. We already saw that the beginning of the year, because of lockdowns, also had an increase in Internet traffic, and we can also see an increase in attacks in January 2021, but also in late November — around the time of the Black Friday week.

Cloudflare Radar's 2021 Year In Review

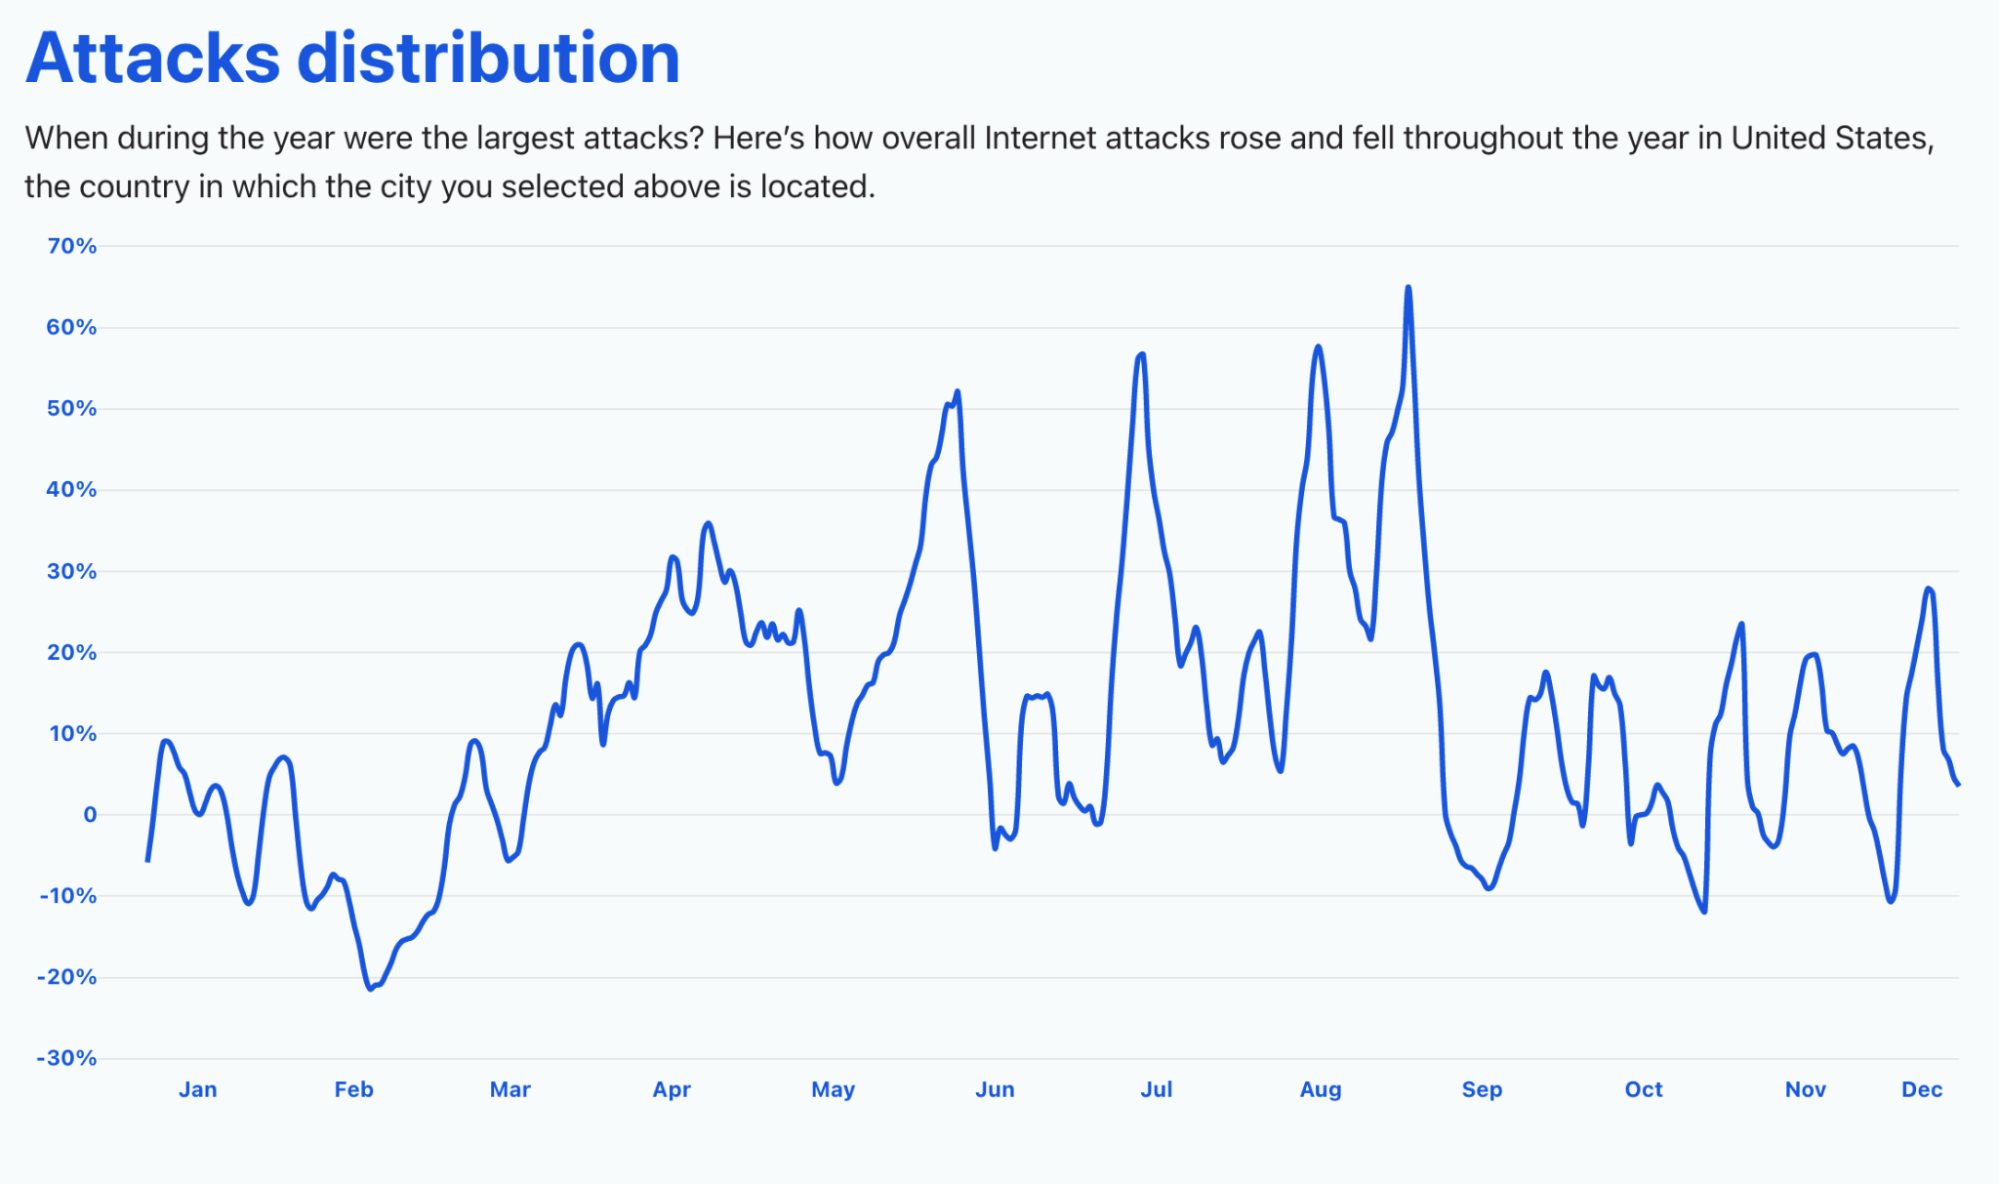
The United States, on the other hand, saw a growth in threats that was more uniform throughout the year. The biggest spike was between August and September (a time when students, depending on the state, were going back to school), with 65% of growth. July also had a big spike in threats (58%), but also late May (48%) — that was the month of the Colonial Pipeline ransomware cyberattack. Late November also had a spike (29%).

Cloudflare Radar's 2021 Year In Review

Countries like France had their peak in attacks (420% more) in late September and Germany it was in June (425%), but also in October (380%) and in November (350%).

The same trend can be seen in Singapore, but with an even higher growth. It reached 1,000% more threats in late November and 900% in the same month, around the time of the famous Singles’ Day (11.11, on November 11), the main e-commerce event in the region.

Cloudflare Radar's 2021 Year In Review

Also in the region, Australia, for example, also saw a big increase (more than 100%) in attacks in the beginning of September. In Japan, it was more in late May (over 40% of growth in threats).

What people did online in 2021

Last year we saw how the e-commerce category jumped in several countries after the first major lockdown — late March.

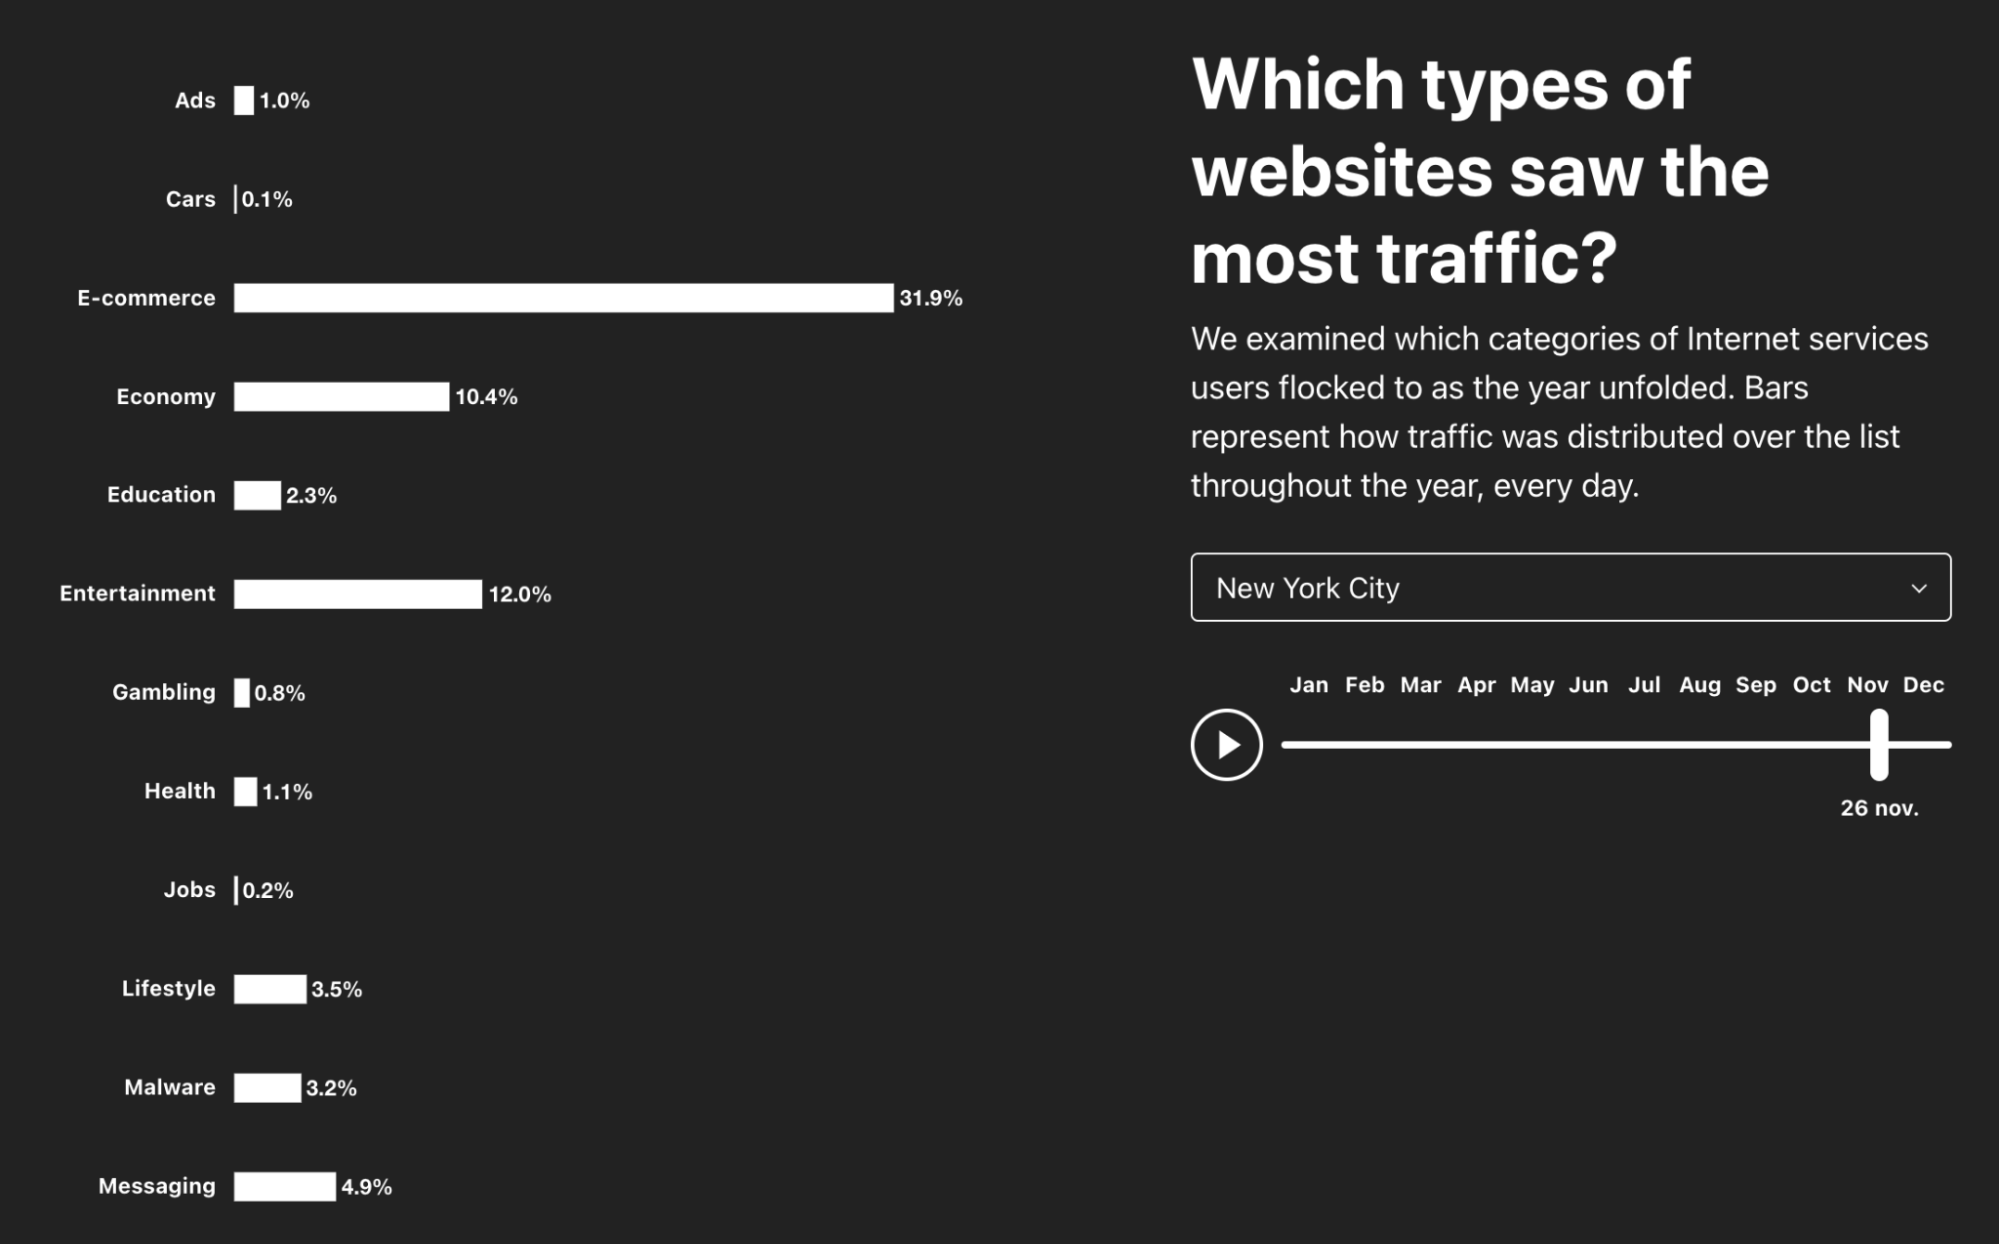
In New York, Black Friday, November 26, 2021, was the day of the whole year that e-commerce traffic peaked — it represented 31.9% of traffic, followed by Cyber Monday, November 29, with 26.6% (San Francisco has the same trend). It’s also interesting to see that in 2020 the same category peaked Black Friday, November 27, 2020 (24.3%) but April 22, during the first lockdowns, was a close second at 23.1% (this year the category only had ~14% in April).

Also with no surprise, messaging traffic peaked (20.6%) in the city that never sleeps on the first day of the year, January 1, 2021, to celebrate the New Year.

Cloudflare Radar's 2021 Year In Review

London calling (pre-Valentine messages)

But countries, cities and the people who live there have different patterns and in London messaging traffic actually peaks at 21.5% of traffic on Friday, February 12, 2021 (two days before Valentine’s Day). While in London, let’s check if Black Friday was also big outside the US. And the answer is: yes! E-commerce traffic peaked at 20.7% of traffic precisely on Black Friday, November 26.

The pandemic also has an influence in the types of websites people use and in London, travel websites had the biggest percentage in traffic on August 8, with only 1.4% — in Munich it was 1.1% on August 11. On the other hand, in New York and San Francisco, travel websites always had less than 1% of traffic.

Going back to Europe, Paris, France, saw a different trend. Travel websites had 1.9% of traffic on June 7, 2021, precisely the week that the pandemic restrictions were lifted — France opened to international travelers on June 9, 2021. The “City of Light” (and love) had its biggest day of the year for messaging websites (24.4%) on Sunday, January 31 — a time when there were new restrictions announced to try to avoid a total lockdown.

The hacker attack: 2021 methods

Our Year in Review site also lets you dig into which attack methods gained the most traction in 2021. It is a given that hackers continued to run their tools to attack websites, overwhelm APIs, and try to exfiltrate data — recently the Log4j vulnerability exposed the Internet to new possible exploitation.

Just to give some examples, in Paris “faking search engine bots” represented 48.3% of the attacks selected for the chart on January 14, 2021, but “SQL Injection” got to 59% on April 29.

Cloudflare Radar's 2021 Year In Review
Cyberattacks distribution throughout the year in San Francisco

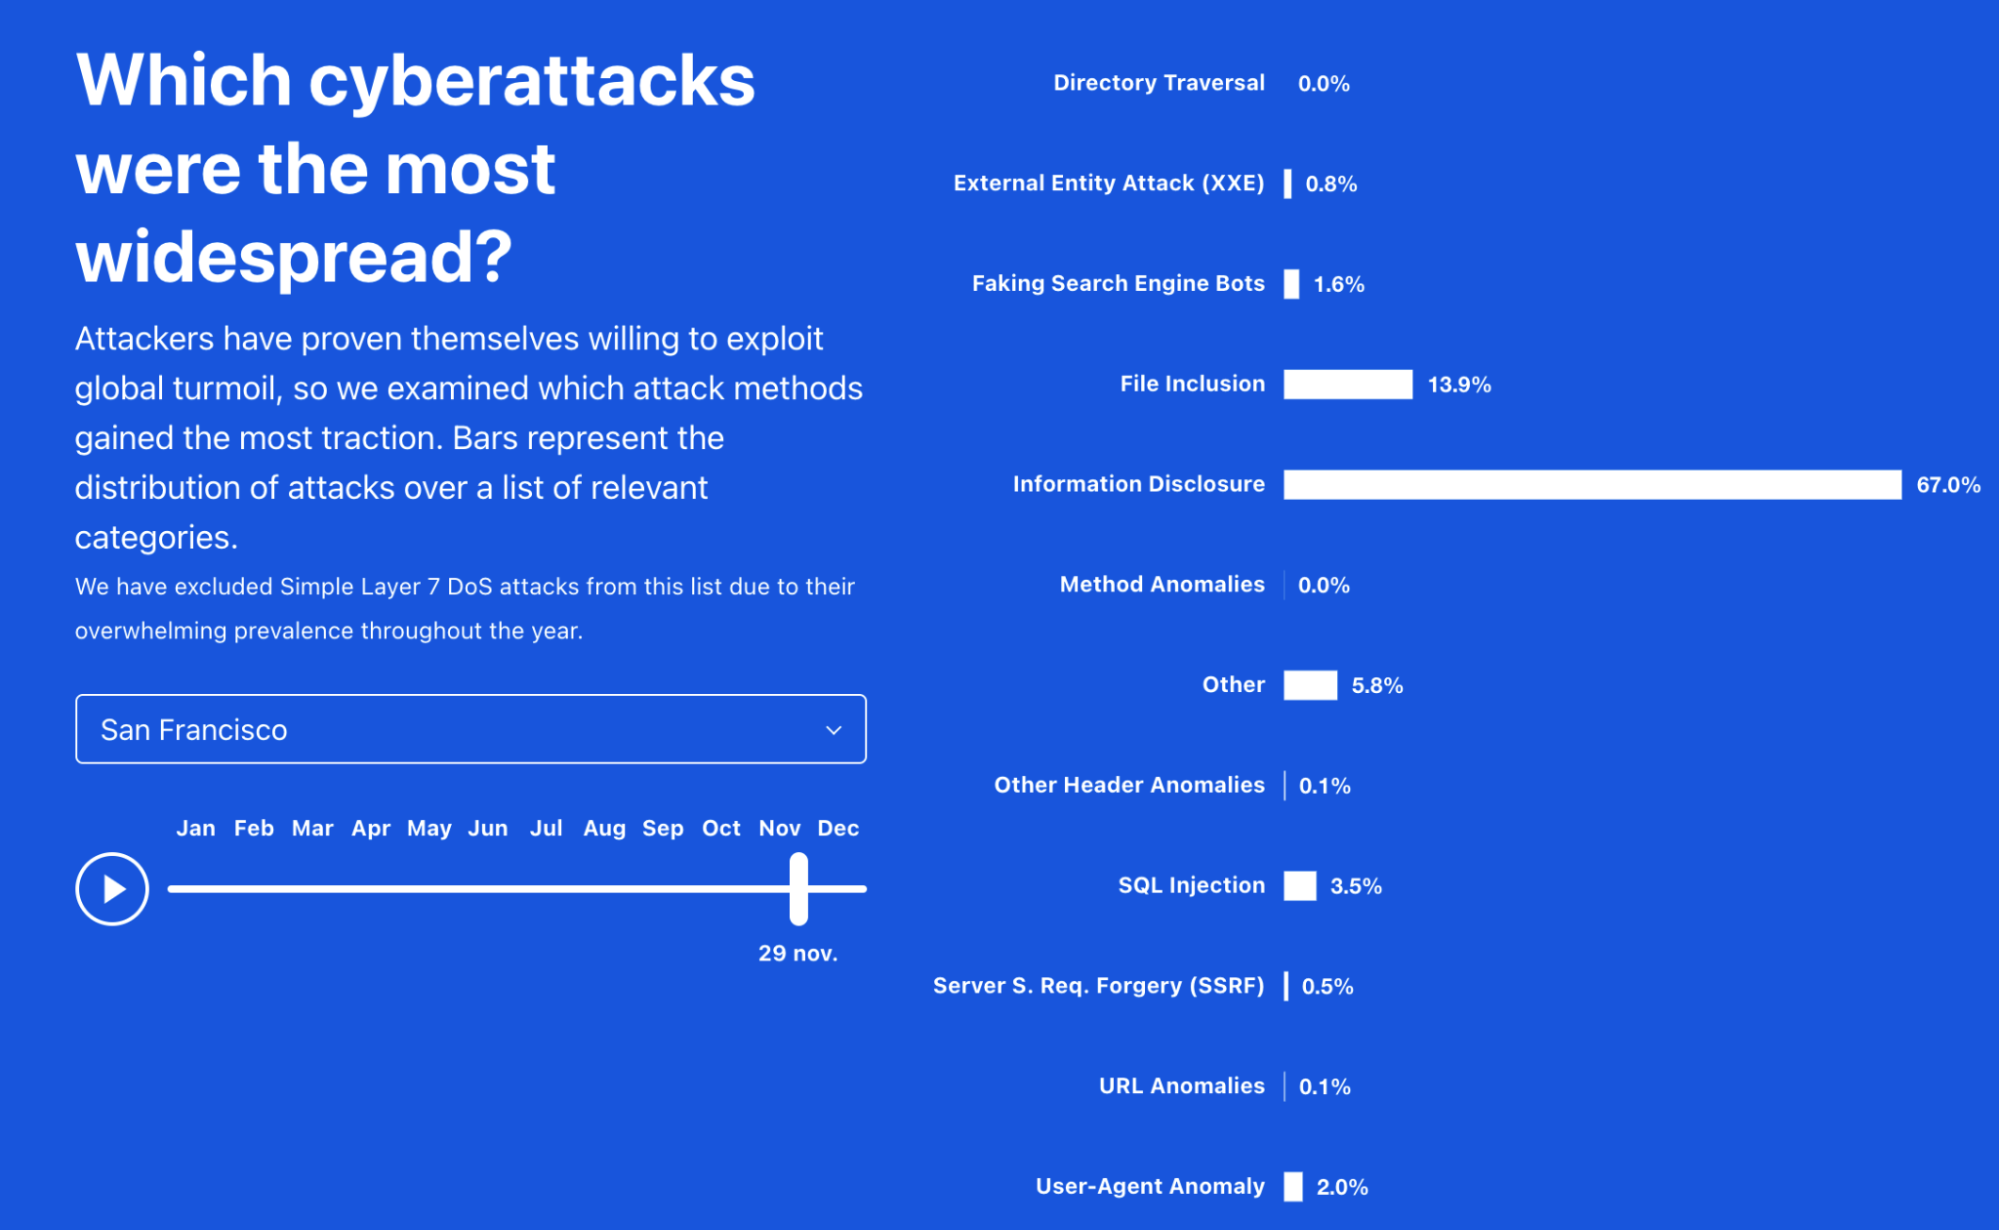
In London “User-Agent Anomaly” was also relevant in some parts of the year, but in San Francisco it was mostly “information disclosure” that was more prevalent, especially in late November, at a time when online shopping was booming — in December “file inclusion” vulnerability had a bigger percentage.

Now it’s your turn: explore more

To explore data for 2021 (but also 2020), you can check out Cloudflare Radar’s Year In Review page. To go deep into any specific country with up-to-date data about current trends, start at Cloudflare Radar’s homepage.

Security updates for Thursday

Post Syndicated from original https://lwn.net/Articles/879675/rss

Security updates have been issued by Debian (openjdk-11), Fedora (keepalived and tang), openSUSE (openssh, p11-kit, runc, and thunderbird), Oracle (postgresql:12, postgresql:13, and virt:ol and virt-devel:ol), Red Hat (rh-maven36-log4j12), and SUSE (ansible, chrony, logstash, elasticsearch, kafka, zookeeper, openstack-monasca-agent, openstack-monasca-persister-java, openstack-monasca-thresh, openssh, p11-kit, python-Babel, and thunderbird).

Optimize Cost by Automating the Start/Stop of Resources in Non-Production Environments

Post Syndicated from Ashutosh Pateriya original https://aws.amazon.com/blogs/architecture/optimize-cost-by-automating-the-start-stop-of-resources-in-non-production-environments/

Co-authored with Nirmal Tomar, Principal Consultant, Infosys Technologies Ltd.

Ease of creating on-demand resources on AWS can sometimes lead to over-provisioning or under-utilization of AWS resources like Amazon EC2 and Amazon RDS. This can lead to higher costs that can often be avoided with proper planning and monitoring.  Non-critical environments, like development and test are often not monitored on a regular basis and can result in under-utilization of AWS resources.

In this blog, we discuss a common AWS cost optimization strategy, which is an automated and deployable solution to schedule the start/stop of AWS resources. For this example, we are considering non-production environments because in most scenarios these do not need to be available at all time. By following this solution, cloud architects can automate the start/stop of services per their usage pattern and can save up to 70% of costs while running their non-production environment.

The solution outlined here is designed to automatically stop and start the following AWS services based on your needs; Amazon RDS, Amazon Aurora, Amazon EC2, Auto Scaling groups, AWS Beanstalk, and Amazon EKS. The solution is automated using AWS Step functions, AWS Lambda, AWS Cloud​Formation Templates, Amazon EventBridge and AWS Identity and Access Management (IAM).

In this solution, we also provide an option to exclude specific Amazon Resource Names (ARNs) of the aforementioned services. This helps cloud architects to exclude the start/stop function for various use cases like in a QA environment when they don’t want to stop Aurora or they want to start RDS in a Development environment. The solution can be used to start/stop the services mentioned previously on a scheduled interval but can also be used for other applicable services like Amazon ECS, Amazon SageMaker Notebook Instances, Amazon Redshift and many more.

Note – Don’t set up this solution in a production or other environment where you require continuous service availability.

Prerequisites

For this walkthrough, you should have the following prerequisites:

  • An AWS account with permission to spin up required resources.
  • A running Amazon Aurora instance in the source AWS account.

Walkthrough

To set up this solution, proceed with the following two steps:

  1. Set up the step function workflow to stop services using a CloudFormation template. On a scheduled interval, this workflow will run and stop the chosen services.
  2. Set up the step function workflow to start services using a  CloudFormation template. On a scheduled interval, this workflow will run and start services as configured during the CloudFormation setup.

1. Stop Services using the Step Function workflow for a predefined duration

Figure 1 – Architecture showing the AWS Step Functions Workflow to stop services

Figure 1 – Architecture showing the AWS Step Functions Workflow to stop services

The AWS Lambda functions involved in this workflow:

  • StopAuroraCluster:  This Lambda function will stop all Aurora Cluster setup across Region including read replica.
  • StopRDSInstances:  This Lambda function will stop all RDS Instances except the Aurora setup across the Region.
  • ScaleDownEKSNodeGroups: This Lambda function will downsize all nodegroups to zero instance across the Region.
  • ScaleDownASG: This Lambda function will downsize all Auto Scaling groups including the Elastic Beanstalk Auto Scaling group to zero instance across Region. We can edit CloudFormation templates to include the custom value.
  • StopEC2Instances: This Lambda function will stop all EC2 instances set up across the Region.

Using the following AWS CloudFormation Template, we set up the required services and workflow:

a. Launch the template in the source account and source Region:

Launch Stack

Specify stack details screenshot

b.     Fill out the preceding form with the following details and select Next.

Stack name:  Stack Name which you want to create.

ExcludeAuroraClusterArnListInCommaSeprated: Comma separated Aurora clusters ARN which enterprises don’t want to stop, keep the default value if there is no exclusion list.

e.g.  arn:aws:rds:us-east-1:111111111111:cluster:aurorcluster1, arn:aws:rds:us-east-2:111111111111:cluster:auroracluster2

ExcludeRDSDBInstancesArnListInCommaSeprated: Comma separated DB instances ARN which enterprises don’t want to stop, keep the default value if there is no exclusion list.

e.g.   arn:aws:rds:us-east-1:111111111111:db:rds-instance-1, arn:aws:rds:us-east-2:111111111111:db:rds-instance-2

ExcludeEKSClusterNodeGroupsArnListInCommaSeprated: Comma separated EKS Clusters ARN which enterprises don’t want to stop, leave it with default value if there is no exclusion list.

e.g.   arn:aws:eks:us-east-2:111111111111:cluster/testcluster

ExcludeAutoScalingGroupIncludingBeanstalkListInCommaSeprated: Comma separated Beanstalk and other Auto Clusters groups ARN (except Amazon EKS) which enterprises don’t want to stop, keep the default value if there is no exclusion list.

e.g.  arn:aws:autoscaling:us-east-1:111111111111:autoScalingGroup:6d5af669-eb3b-4530-894b-e314a667f2e7:autoScalingGroupName/test-0-ASG

ExcludeEC2InstancesIdListInCommaSeprated: Comma separated EC2 instance ID’s which you don’t want to stop, keep the default value if there is no exclusion list.

e.g.  i-02185df0872f0f852, 0775f7e39513c50dd

ScheduleExpression: Schedule a cron expression when you want to run this workflow. Sample expressions are available in this guide, Schedule expressions using rate or cron.

c.     Select IAM role to launch this template.  As a best practice, select the AWS CloudFormation service role to manage AWS services and resources  available to each user.

Permissions screenshot

d.     Acknowledge that you want to create various resources including IAM roles/policies and select Create Stack.

d. Acknowledge to create various resources including IAM roles/policies and select Create Stack.

2. Start Services using the Step Function workflow in pre-configured time

Figure 2 – Architecture showing the AWS Step Functions Workflow to start services

Figure 2 – Architecture showing the AWS Step Functions Workflow to start services

The  Lambda functions involved in this workflow:

  • StartAuroraCluster:  This Lambda function will start all Aurora Cluster setup across Region including read-replica.
  • StartRDSInstances:  This Lambda function will start all RDS Instances except for the Aurora setup across the Region.
  • ScaleUpEKSNodeGroups: This Lambda function will upsize all nodegroups to minimum 2 and maximum 4 instances across Region. We can edit CloudFormation templates for custom value.
  • ScaleUpASG: This Lambda function will Scale up all Auto Scaling group including Elastic Beanstalk Auto Scaling group to minimum 2 and maximum 4 instances across the Region. We can edit CloudFormation templates for custom value.
  • StartEC2Instances: This Lambda function will start all EC2 instances setup across the Region.

Using the following AWS CloudFormation template, we set up the required services and workflow:

a. Launch the template in the source account and source Region:

Launch Stack

b. Fill out the preceding form with the following details and select Next.

Stack details screenshot

Stack name:  Stack Name which you want to create.

ExcludeAuroraClusterArnListInCommaSeprated: Comma separated Aurora clusters the ARN which you don’t want to start, keep the default value if there is no exclusion list.

For example:  arn:aws:rds:us-east-1:111111111111:cluster:aurorcluster1, arn:aws:rds:us-east-2:111111111111:cluster:auroracluster2

ExcludeRDSDBInstancesArnListInCommaSeprated: Comma separated databaseinstances ARN which you don’t want to start, keep default value if there is no exclusion list.

For example:   arn:aws:rds:us-east-1:111111111111:db:rds-instance-1, arn:aws:rds:us-east-2:111111111111:db:rds-instance-2

ExcludeEKSClusterNodeGroupsArnListInCommaSeprated: Comma separated EKS Clusters ARN which you don’t want to start, keep the default value if there is no exclusion list.

For example:   arn:aws:eks:us-east-2:111111111111:cluster/testcluster

ExcludeAutoScalingGroupIncludingBeanstalkListInCommaSeprated: Comma separated Beanstalk and other Auto Clusters groups ARN (except EKS) which you don’t want to start, keep the default value if there is no exclusion list.

For example:  arn:aws:autoscaling:us-east-1:111111111111:autoScalingGroup:6d5af669-eb3b-4530-894b-e314a667f2e7:autoScalingGroupName/test-0-ASG

ExcludeEC2InstancesIdListInCommaSeprated: Comma separated EC2 instance ID s you  don’t want to start, keep the default value if there is no exclusion list.

For example:  i-02185df0872f0f852, 0775f7e39513c50dd

ScheduleExpression: Schedule a cron expression when you want to run this workflow. Sample expressions are available in this guide, Schedule expressions using rate or cron.

c.     Select IAM role to launch this template.  As a best practice, select the AWS CloudFormation service role to manage AWS services and resources available to each user.

Permissions screenshot

d. Acknowledge that you want to create various resources including IAM roles and policies and select Create Stack.

Acknowledgement screenshot

Cleaning up

Delete any unused resources to avoid incurring future charges.

Conclusion

In this blog post, we outlined a solution to help you optimize cost by automating the stop/start of AWS services in non-production environments. Cost Optimization and Cloud Financial Management are ongoing initiatives. We hope you found this solution helpful and encourage you to explore additional ways to optimize cost on the AWS Architecture Center.

Nirmal Tomar

Nirmal Tomar

Nirmal is a principal consultant with Infosys, assisting vertical industries on application migration and modernization to the public cloud. He is the part of the Infosys Cloud CoE team and leads various initiatives with AWS. Nirmal has a keen interest in industry and cloud trends, and in working with hyperscalers to build differentiated offerings. Nirmal also specializes in cloud native development, managed containerization solutions, data analytics, data lakes, IoT, AI, and machine learning solutions.

Test for Log4Shell With InsightAppSec Using New Functionality

Post Syndicated from Bria Grangard original https://blog.rapid7.com/2021/12/22/test-for-log4shell-with-insightappsec-using-new-functionality/

Test for Log4Shell With InsightAppSec Using New Functionality

We can all agree at this point that the Log4Shell vulnerability (CVE-2021-44228) can rightfully be categorized as a celebrity vulnerability. Security teams have been working around the clock investigating whether they have instances of Log4j in their environment. You are likely very familiar with everything regarding  Log4Shell, but if you are looking for more information, you can check out our Everyperson’s Guide to Log4Shell (CVE-2021-44228). In this blog, we will share how Rapid7 customers can test for Log4Shell with InsightAppSec.

Testing for Log4Shell with InsightAppSec

With InsightAppSec, our dynamic application security testing (DAST) solution, customers can assess the risk of their applications. InsightAppSec allows you to configure various attacks of your applications to identify response behaviors that make your applications more vulnerable to attacks. These attacks are run during scans that you can customize based on your needs. In this case, we’ve introduced a new default attack template for Out of Band Injection specific to Log4Shell attacks.

What’s this mean? Customers can now run an Out of Band Attack Injection from our default template, which includes an attack type for Log4Shell. The new default Out of Band attack template in InsightAppSec will perform sophisticated web application attacks that do not rely on traditional HTTP request-response interactions. Our Log4Shell vulnerability detection will simulate an attacker on your website. InsightAppSec will validate the exploitability of the application and the associated risk.

How to run a Log4Shell attack in InsightAppSec

You can scan for this new Out of Band attack using either a new attack template we have created or by creating your own custom attack template and selecting this new attack module. We have added some highlights below, but you can find a detailed guide via our help docs.

Attack templates

Out of Band Injection attack template

Test for Log4Shell With InsightAppSec Using New Functionality

Out of band Log4Shell attack module

Test for Log4Shell With InsightAppSec Using New Functionality

Run a scan

Scan Config

Depending on the choice of either using the new Out of Band Injection attack template or creating your own custom attack module, you now need to choose this template on your scan config and run a scan against your selected app(s).

Test for Log4Shell With InsightAppSec Using New Functionality

Scan results

Now you run your scan, you can review your scan results to see if your app(s) have any findings that could be exposed as per the details in CVE-2021-44228.

Test for Log4Shell With InsightAppSec Using New Functionality

What’s next?

Though official mitigation steps are changing as new information arises, we recommend for Java 8+ applications, upgrade your Log4j libraries to the latest version (currently 2.17.0) to fix any new issues as they are discovered. Application using Java 7 should upgrade Log4j to at least version 2.212.2 If you’re looking to validate any fixes have been implemented, feel free to run a validation scan with InsightAppSec to verify the fixes have been made.

If you’re looking for additional information on how Rapid7 can help support you during this time, check out our Log4j resource hub.

Increasing McGraw-Hill’s Application Throughput with Amazon SQS

Post Syndicated from Vikas Panghal original https://aws.amazon.com/blogs/architecture/increasing-mcgraw-hills-application-throughput-with-amazon-sqs/

This post was co-authored by Vikas Panghal, Principal Product Mgr – Tech, AWS and Nick Afshartous, Principal Data Engineer at McGraw-Hill

McGraw-Hill’s Open Learning Solutions (OL) allow instructors to create online courses using content from various sources, including digital textbooks, instructor material, open educational resources (OER), national media, YouTube videos, and interactive simulations. The integrated assessment component provides instructors and school administrators with insights into student understanding and performance.

McGraw-Hill measures OL’s performance by observing throughput, which is the amount of work done by an application in a given period. McGraw-Hill worked with AWS to ensure OL continues to run smoothly and to allow it to scale with the organization’s growth. This blog post shows how we reviewed and refined their original architecture by incorporating Amazon Simple Queue Service (Amazon SQS). to achieve better throughput and stability.

Reviewing the original Open Learning Solutions architecture

Figure 1 shows the OL original architecture, which works as follows:

  1. The application makes a REST call to DMAPI. DMAPI is an API layer over the Datamart. The call results in a row being inserted in a job requests table in Postgres.
  2. A monitoring process called Watchdog periodically checks the database for pending requests.
  3. Watchdog spins up an Apache Spark on Databricks (Spark) cluster and passes up to 10 requests.
  4. The report is processed and output to Amazon Simple Storage Service (Amazon S3).
  5. Report status is set to completed.
  6. User can view report.
  7. The Databricks clusters shut down.
Original OL architecture

Figure 1. Original OL architecture

To help isolate longer running reports, we separated requests that have up to five schools (P1) from those having more than five (P2) by allocating a different pool of clusters. Each of the two groups can have up to 70 clusters running concurrently.

Challenges with original architecture

There are several challenges inherent in this original architecture, and we concluded that this architecture will fail under heavy load.

It takes 5 minutes to spin up a Spark cluster. After processing up to 10 requests, each cluster shuts down. Pending requests are processed by new clusters. This results in many clusters continuously being cycled.

We also identified a database resource contention problem. In testing, we couldn’t process 142 reports out of 2,030 simulated reports within the allotted 4 hours. Furthermore, the architecture cannot be scaled out beyond 70 clusters for the P1 and P2 pools. This is because adding more clusters will increase the number of database connections. Other production workloads on Postgres would also be affected.

Refining the architecture with Amazon SQS

To address the challenges with the existing architecture, we rearchitected the pipeline using Amazon SQS. Figure 2 shows the revised architecture. In addition to inserting a row to the requests table, the API call now inserts the job request Id into one of the SQS queues. The corresponding SQS consumers are embedded in the Spark clusters.

New OL architecture with Amazon SQS

Figure 2. New OL architecture with Amazon SQS

The revised flow is as follows:

  1. An API request results in a job request Id being inserted into one of the queues and a row being inserted into the requests table.
  2. Watchdog monitors SQS queues.
  3. Pending requests prompt Watchdog to spin up a Spark cluster.
  4. SQS consumer consumes the messages.
  5. Report data is processed.
  6. Report files output to Amazon S3
  7. Job status is updated in the requests table.
  8. Report can be viewed in the application.

After deploying the Amazon SQS architecture, we reran the previous load of 2,030 reports with a configuration ceiling of up to five Spark clusters. This time all reports were completed within the 4-hour time limit, including the 142 reports that timed out previously. Not only did we achieve better throughput and stability, but we did so by running far fewer clusters.

Reducing the number of clusters reduced the number of concurrent database connections that access Postgres. Unlike the original architecture, we also now have room to scale by adding more clusters and consumers. Another benefit of using Amazon SQS is a more loosely coupled architecture. The Watchdog process now only prompts Spark clusters to spin up, whereas previously it had to extract and pass job requests Ids to the Spark job.

Consumer code and multi-threading

The following code snippet shows how we consumed the messages via Amazon SQS and performed concurrent processing. Messages are consumed and submitted to a thread pool that utilizes Java’s ThreadPoolExecutor for concurrent processing. The full source is located on GitHub.

/**
  * Main Consumer run loop performs the following steps:
  *   1. Consume messages
  *   2. Convert message to Task objects
  *   3. Submit tasks to the ThreadPool
  *   4. Sleep based on the configured poll interval.
  */
 def run(): Unit = {
   while (!this.shutdownFlag) {
     val receiveMessageResult = sqsClient.receiveMessage(new  
                                           ReceiveMessageRequest(queueURL)
       .withMaxNumberOfMessages(threadPoolSize))
     val messages = receiveMessageResult.getMessages
     val tasks = getTasks(messages.asScala.toList)

     threadPool.submitTasks(tasks, sqsConfig.requestTimeoutMinutes)
     Thread.sleep(sqsConfig.pollIntervalSeconds * 1000)
   }

   threadPool.shutdown()
 }

Kafka versus Amazon SQS

We also considered routing the report requests via Kafka, because Kafka is part of our analytics platform. However, Kafka is not a queue, it is a publish-subscribe streaming system with different operational semantics. Unlike queues, Kafka messages are not removed by the consumer. Publish-subscribe semantics can be useful for data processing scenarios. In other words, it can be used in cases where it’s required to reprocess data or to transform data in different ways using multiple independent consumers.

In contrast, for performing tasks, the intent is to process a message exactly once. There can be multiple consumers, and with queue semantics, the consumers work together to pull messages off the queue. Because report processing is a type of task execution, we decided that SQS queue semantics better fit the use case.

Conclusion and future work

In this blog post, we described how we reviewed and revised a report processing pipeline by incorporating Amazon SQS as a messaging layer. Embedding SQS consumers in the Spark clusters resulted in fewer clusters and more efficient cluster utilization. This, in turn, reduced the number of concurrent database connections accessing Postgres.

There are still some improvements that can be made. The DMAPI call currently inserts the report request into a queue and the database. In case of an error, it’s possible for the two to become out of sync. In the next iteration, we can have the consumer insert the request into the database. Hence, the DMAPI call would only insert the SQS message.

Also, the Java ThreadPoolExecutor API being used in the source code exhibits the slow poke problem. Because the call to submit the tasks is synchronous, it will not return until all tasks have completed. Here, any idle threads will not be utilized until the slowest task has completed. There’s an opportunity for improved throughput by using a thread pool that allows idle threads to pick up new tasks.

Ready to get started? Explore the source code illustrating how to build a multi-threaded AWS SQS consumer.

Looking for more architecture content? AWS Architecture Center provides reference architecture diagrams, vetted architecture solutions, Well-Architected best practices, patterns, icons, and more!

Use AWS Step Functions to Monitor Services Choreography

Post Syndicated from Vito De Giosa original https://aws.amazon.com/blogs/architecture/use-aws-step-functions-to-monitor-services-choreography/

Organizations frequently need access to quick visual insight on the status of complex workflows. This involves collaboration across different systems. If your customer requires assistance on an order, you need an overview of the fulfillment process, including payment, inventory, dispatching, packaging, and delivery. If your products are expensive assets such as cars, you must track each item’s journey instantly.

Modern applications use event-driven architectures to manage the complexity of system integration at scale. These often use choreography for service collaboration. Instead of directly invoking systems to perform tasks, services interact by exchanging events through a centralized broker. Complex workflows are the result of actions each service initiates in response to events produced by other services. Services do not directly depend on each other. This increases flexibility, development speed, and resilience.

However, choreography can introduce two main challenges for the visibility of your workflow.

  1. It obfuscates the workflow definition. The sequence of events emitted by individual services implicitly defines the workflow. There is no formal statement that describes steps, permitted transitions, and possible failures.
  2. It might be harder to understand the status of workflow executions. Services act independently, based on events. You can implement distributed tracing to collect information related to a single execution across services. However, getting visual insights from traces may require custom applications. This increases time to market (TTM) and cost.

To address these challenges, we will show you how to use AWS Step Functions to model choreographies as state machines. The solution enables stakeholders to gain visual insights on workflow executions, identify failures, and troubleshoot directly from the AWS Management Console.

This GitHub repository provides a Quick Start and examples on how to model choreographies.

Modeling choreographies with Step Functions

Monitoring a choreography requires a formal representation of the distributed system behavior, such as state machines. State machines are mathematical models representing the behavior of systems through states and transitions. States model situations in which the system can operate. Transitions define which input causes a change from the current state to the next. They occur when a new event happens. Figure 1 shows a state machine modeling an order workflow.

Figure 1. Order workflow

Figure 1. Order workflow

The solution in this post uses Amazon State Language to describe a choreography as a Step Functions state machine. The state machine pauses, using Task states combined with a callback integration pattern. It then waits for the next event to be published on the broker. Choice states control transitions to the next state by inspecting event payloads. Figure 2 shows how the workflow in Figure 1 translates to a Step Functions state machine.

Figure 2. Order workflow translated into Step Functions state machine

Figure 2. Order workflow translated into Step Functions state machine

Figure 3 shows the architecture for monitoring choreographies with Step Functions.

Figure 3. Choreography monitoring with AWS Step Functions

Figure 3. Choreography monitoring with AWS Step Functions

  1. Services involved in the choreography publish events to Amazon EventBridge. There are two configured rules. The first rule matches the first event of the choreography sequence, Order Placed in the example. The second rule matches any other event of the sequence. Event payloads contain a correlation id (order_id) to group them by workflow instance.
  2. The first rule invokes an AWS Lambda function, which starts a new execution of the choreography state machine. The correlation id is passed in the name parameter, so you can quickly identify an execution in the AWS Management Console.
  3. The state machine uses Task states with AWS SDK service integrations, to directly call Amazon DynamoDB. Tasks are configured with a callback pattern. They issue a token, which is stored in DynamoDB with the execution name. Then, the workflow pauses.
  4. A service publishes another event on the event bus.
  5. The second rule invokes another Lambda function with the event payload.
  6. The function uses the correlation id to retrieve the task token from DynamoDB.
  7. The function invokes the Step Functions SendTaskSuccess API, with the token and the event payload as parameters.
  8. The state machine resumes the execution and uses Choice states to transition to the next state. If the choreography definition expects the received event payload, it selects the next state and the process will restart from Step # 3. The state machine transitions to a Fail state when it receives an unexpected event.

Increased visibility with Step Functions console

Modeling service choreographies as Step Functions Standard Workflows increases visibility with out-of-the-box features.

1. You can centrally track events produced by distributed components. Step Functions records full execution history for 90 days after the execution completes. You’ll be able to capture detailed information about the input and output of each state, including event payloads. Additionally, state machines integrate with Amazon CloudWatch to publish execution logs and metrics.

2. You can monitor choreographies visually. The Step Functions console displays a list of executions with information such as execution id, status, and start date (see Figure 4).

Figure 4. Step Functions workflow dashboard

Figure 4. Step Functions workflow dashboard

After you’ve selected an execution, a graph inspector is displayed (see Figure 5). It shows states, transitions, and marks individual states with colors. This identifies at a glance, successful tasks, failures, and tasks that are still in progress.

Figure 5. Step Functions graph inspector

Figure 5. Step Functions graph inspector

3. You can implement event-driven automation. Step Functions enables you to capture execution status changes emitting events directly to EventBridge (see Figure 6). Additionally, AWS gives you the ability to emit events by setting alarms on top of metrics. Step Functions publishes these to CloudWatch. You can respond to events by initiating corrective actions, sending notifications, or integrating with third-party solutions, such as issue tracking systems.

Figure 6. Automation with Step Functions, EventBridge, and CloudWatch alarms

Figure 6. Automation with Step Functions, EventBridge, and CloudWatch alarms

Enabling access to AWS Step Functions console

Stakeholders need secure access to the Step Functions console. This requires mechanisms to authenticate users and authorize read-only access to specific Step Functions workflows.

AWS Single Sign-On authenticates users by directly managing identities or through federation. SSO supports federation with Active Directory and SAML 2.0 compliant external identity providers (IdP). Users gain access to Step Functions state machines by assigning a permission set, which is a collection of AWS Identity and Access Management (IAM) policies. Additionally, with permission sets, you can configure a relay state, which is a URL to redirect the user after successful authentication. You can authenticate the user through the selected identity provider and immediately show the AWS Step Functions console with the workflow state machine already displayed. Figure 7 shows this process.

Figure 7. Access to Step Functions state machine with AWS SSO

Figure 7. Access to Step Functions state machine with AWS SSO

  1. The user logs in through the selected identity provider.
  2. The SSO user portal uses the SSO endpoint to send the response from the previous step. SSO uses AWS Security Token Service (STS) to get temporary security credentials on behalf of the user. It then creates a console sign-in URL using those credentials and the relay state. Finally, it sends the URL back as a redirect.
  3. The browser redirects the user to the Step Functions console.

When the identity provider does not support SAML 2.0, SSO is not a viable solution. In this case, you can create a URL with a sign-in token for users to securely access the AWS Management Console. This approach uses STS AssumeRole to get temporary security credentials. Then, it uses credentials to obtain a sign-in token from the AWS federation endpoint. Finally, it constructs a URL for the AWS Management Console, which includes the token. It then distributes this to users to grant access. This is similar to the SSO process. However, it requires custom development.

Conclusion

This post shows how you can increase visibility on choreographed business processes using AWS Step Functions. The solution provides detailed visual insights directly from the AWS Management Console, without requiring custom UI development. This reduces TTM and cost.

To learn more:

How Interns Can Help Your Business and the World

Post Syndicated from Jason Knight original https://www.backblaze.com/blog/how-interns-can-help-your-business-and-the-world/

My name is Jason Knight and I lead the Growth team here at Backblaze. There are certain annual events you experience working in tech: fiscal year budgeting, conferences, and when HR asks if you want summer interns, and you say “No.”

2020 was a different year, and as everyone knows, a lot of the difference wasn’t good. So when HR and the Diversity, Equity, and Inclusion Committee reached out asking who would take interns over the summer of 2021, the stakes seemed higher. Backblaze is the most diverse company I’ve ever worked for. For me, especially in the broader context of what is happening in society today, the importance of helping to create a more inclusive and diverse workplace felt more vital than ever.

And yet, when HR came knocking, it was hard to see how having interns was going to be additive to the team. I was the only member of a new team (Growth) being spun up within the Marketing department. We had ambitious goals, and a lot to do to achieve them. I was skeptical that taking on interns would be constructive for driving results.

I was also hearing from some of my peers that they didn’t believe having interns would or could be beneficial to the company. They had come to the same conclusion I had year after year, and that was the problem. We were the problem—the company was willing to provide the resources, but a bottom line mentality was preventing us from risking our short-term success.

The choice seemed to be whether or not to risk personal and team success for the opportunity to help young people gain access to exciting and potentially lucrative careers. I wish I could say the answer was clear, but it wasn’t. My peers and I were all considering this same question, and our collective response was going to have a meaningful impact on the nature of the society we live in.

Building Internships That Work…for Everyone

After a lot of thought, I acknowledged that the primary reason I didn’t want interns was my assumption that they couldn’t create value. But as any good marketer knows, assumptions and received wisdom are often wrong. I didn’t have any real evidence on hand that interns didn’t create value. It made me wonder: What if the real opportunity was to challenge received wisdom and create a compelling argument for my peers within and outside of Backblaze to take the risk and provide a bigger on-ramp for interns across the industry?

I took a step back and organized my thoughts: What do we really want in an internship program right now?

  1. A program that adds value and makes the company money.
  2. More importantly, a model that encourages others to bring on more interns.

The Growth-positive Internship

This was an intriguing proposition, so I started to think about the internships from a “Growth” perspective. I sketched out an approach:

  1. Source candidates who have the potential to be A players.
  2. Give interns goals that can deliver clear ROI.
  3. Don’t defocus team leads with the program.
  4. Publish learnings in the hopes that other firms and leaders will also be inspired to take the plunge.

I told HR we’d take three interns. Three because for some reason, three people can generally help each other out better than one or two. I also thought the success of a program was a lot of weight to put on one intern.

It was still the middle of the winter, and we weren’t expecting the interns to join us until summertime. So I went back to work and hoped that in six months we would be in position to deliver a useful program that would improve both our bottom line and people’s lives. Which—if you know Backblaze—is right in line with our company values.

Assembling an ROI-oriented Intern Team

And suddenly, the interns’ arrival was just a month away. As I considered how to achieve my goal of a growth-positive internship, I tried to zero in on the clearest way to link their effort to value. For my team, the most attributable ROI is closest to the transaction, so I decided to start with the fantastic Sales Development Representative (SDR) team led by SDR Manager, Adam.

My thought was for the interns to spend a full six weeks working as full-time SDRs. Then maybe three weeks on, they could work on paid user acquisition putting a campaign together, and then three weeks on SEO launching a campaign. I talked to Anna, Senior Manager of Data and Analytics, about helping the interns quantify the value they were creating for their resumes, and she enthusiastically agreed to pitch in. In my mind, I could see the bullet points and action verbs filling up their incipient resumes.

This was the plan. No ramp up, straight into the deep end of the pool. Everyone was fully on board. It was time to interview some candidates.

Adam joined me, and we very quickly identified that interns fell on a spectrum with two ends:

  1. Students from elite schools with a history of relevant internships.
  2. Students from non-elite schools with few internships on their resume.

Given that the whole point of our program was to help students access opportunities that otherwise would not be available to them, I made the choice to rule out candidates who already had experience or access to our field. My fantastic HR partner, our Marketing and Sales Recruiter, Desiree, explained that this was a fairly typical experience sourcing candidates. On the HR team, they have long been focused on expanding DEI efforts in our internship program, so they have plenty of experience encouraging hiring managers to look past the brand halo elite colleges confer to applicants.

As Adam, Desiree, and I synchronized our efforts and filters, we eventually identified three people we wanted to work with: Roland, Javier, and Katie. Offers were extended, start dates and pay agreed to, and they were on their way (virtually, for all the obvious reasons).

Turning Interns Into Teammates

We also reached out to senior leaders in the Marketing department who agreed to be mentors to our interns, so VP of Marketing, Nick, worked with Roland; Director of Marketing Operations, Shannon, worked with Katie; and Senior Director of Marketing, Yev, worked with Javier. The interns started work as junior SDRs and launched their outbound sequences within a week of starting. They joined all of the Growth team meetings, and I scheduled a weekly sync meeting with them. Other than that, they functioned exactly like a junior SDR team.

The interns understood that success for them was converting our leads into sales accepted leads (SALs). To do this, they used our Growth stack: ZoomInfo, Outreach, Salesforce, Calendly, and Slack. They learned from expert SDRs what it means to be creative, work with fortitude in a rejection-based environment, and to find a way to succeed.

It took about a month before the first SALs started rolling in, but it happened, and then it happened again, and again, and again. Six weeks into their work and the program was clearly a success in every dimension we could wish. They fit into the team, they helped us achieve our SAL goals, and the whole of the Growth team enjoyed sharing their knowledge and skills with our interns.

It is probably worth taking a moment to contextualize the historical moment they were working with us: The Delta variant was spreading throughout the U.S. and political and social divisions were on the nightly news. The ambient stress level, in other words, was high for everyone. Add to that the fact that we were a new team with big goals and high expectations. All this to say: The interns could easily have been perceived as an unnecessary distraction.

But it turned out the opposite was true: In the midst of stress and ambiguity, the ability to share and help others bonded our team. Our Slack channel was 💥 filled with jokes, encouragement, and laughter. The interns were a ray of sunshine for the team, and I will never forget how relieved I was halfway through the internship that we had made this commitment.

Where the Rubber Hit the Road With the Intern Team

As we reached the halfway point, I asked the interns to think about whether they wanted to continue to work as SDRs or if they were interested in exploring what the other team members were doing: paid user acquisition, customer journey marketing, and SEO. All three requested to continue to work as SDRs, and while it was a surprise on some levels, it also made sense: The interns were doing critical work, learning skills, having success, and clearly making a difference.

Oh yeah, and they also generated $1,500,000.00 in the SAL pipeline.

Ultimately, they worked as SDRs for the whole of their internship. We will have to wait and see how much of their pipeline ends up being closed with wins, but they generated enough leads that it is hard to imagine they didn’t pay for all the internships the company provided. In other words, the program exceeded our wildest expectations, and I’m happy to report back that internships, if structured properly, can in fact add enormous value to the companies that provide them.

Looking Forward, and Thanks

I’m already looking forward to meeting next year’s interns. As a team, we will do our very best to show them why we love marketing at Backblaze.

I’d like to end by thanking Roland, Javier, and Katie for spending their summer with us. We are incredibly proud of the SALs our colleagues generated, and happy to call them friends. I remember when I was interviewing Javier and I asked him why he wanted to work at a cloud storage company, and he said “I worked at a deli near the Salesforce headquarters, and every day, all the employees would come to order food, and I couldn’t imagine what they did for the company. This is my chance to find out what it is to work in a company like that.” Now Javier knows not only what they do, but that he can succeed at doing it as well.

The post How Interns Can Help Your Business and the World appeared first on Backblaze Blog | Cloud Storage & Cloud Backup.

Stolen Bitcoins Returned

Post Syndicated from Bruce Schneier original https://www.schneier.com/blog/archives/2021/12/stolen-bitcoins-returned.html

The US has returned $154 million in bitcoins stolen by a Sony employee.

However, on December 1, following an investigation in collaboration with Japanese law enforcement authorities, the FBI seized the 3879.16242937 BTC in Ishii’s wallet after obtaining the private key, which made it possible to transfer all the bitcoins to the FBI’s bitcoin wallet.

[$] A farewell to LWN

Post Syndicated from original https://lwn.net/Articles/879072/rss

Back at the beginning of 2020, it was predicted that retirements would increase
during this decade. In 2021, the prediction
was that retirements would increase over the next couple of years. It is
happening and LWN is no exception. I am retiring at the end of this year
after more than 20 years with LWN.

So who am I and how did I get here? To some, I’m a name at the bottom of
some LWN page. To a few, I’m the one that reminds them when their LWN group
subscription is about to expire. You might have even met me at a
conference. Not that I have been to very many. Mostly I tend to be quietly
in the background watching the LWN mailbox, looking for brief items and
quotes of the week (sorry I haven’t found much lately), proofreading
articles, managing subscriptions, and more. But I’m older than most of you
and this is my last LWN weekly edition. Getting here is a bit of story.

Security updates for Wednesday

Post Syndicated from original https://lwn.net/Articles/879492/rss

Security updates have been issued by CentOS (firefox, ipa, log4j, and samba), Debian (sogo, spip, and xorg-server), Fedora (jansi and log4j), Mageia (apache, apache-mod_security, kernel, kernel-linus, and x11-server), openSUSE (log4j and xorg-x11-server), Oracle (kernel, log4j, and openssl), and SUSE (libqt4 and xorg-x11-server).

What a fantastic year it was!

Post Syndicated from Jekaterina Sizova original https://blog.zabbix.com/what-a-fantastic-year-it-was/18253/

The year 2021 is coming to the end and what a year it has been for Zabbix! Thank you for spending this year with us – installing new versions of Zabbix, solving monitoring tasks on the forum and community groups, reading our blog posts and watching videos, attending our events, and much more.

Let’s look back at some of the Zabbix Highlights of the year.

Great Minds Think Alike

Thanks to our community and partners’ support, we have organized about 50 online meetups and meetings in English, Russian, Chinese, Dutch, French, Portuguese, Spanish, Italian, and Polish this year. The recordings of the presentations are always available on our events page.

Offline events also took place – Zabbix Conferences have been held in China and Japan – both events were available to attend online and in person.

We organized and held Zabbix Summit Online 2021, which had been visited by thousands of attendees from 130+ countries.

The Ongoing Development

Our integrations team has released 35 new integrations and monitoring templates during the year and is currently developing new in-demand solutions.

Our main page received a few extra tweaks with a new menu bar which makes it easier to navigate between the website sections. Plus, we have completely redesigned and updated the features page, providing a more in-depth overview of Zabbix monitoring solution capabilities.

We released Zabbix 5.4 version that came with scheduled PDF report generation, robust problem detection, advanced data aggregation, and other significant improvements demanded by Zabbix users.

We’ve been working hard on the new Zabbix 6.0 LTS version, developing the most required features. By the beginning of the new year, we’ll be ready to celebrate this long-awaited release together with you.

Knowledge is Power

We’ve been working on the Zabbix Series and have recorded a number of helpful educational videos. Be sure to check out the entire playlist.

We launched the one-day intensive training courses that allow Zabbix users to learn in-depth one specific monitoring topic at a time.

We’ve started a new weekly tradition of sharing the Handy Tips with you – the detailed how-tos where we briefly explain all the nuances of monitoring with Zabbix. Remember that all the handy tips are available in Zabbix Blog.

Finally, we have reached a meaningful internal milestone. In 2021, Zabbix international team has passed the 100-employee mark and continues to grow, becoming more powerful.

Setting the Course for New Achievements

Well, this year is over, and there’s a new one ahead – full of big plans and inspiring intentions. However, we’ll have time to talk about new goals later, but for now, have fun with the holidays! We wish you to enjoy the magic of this festive period and get charged with joy for the whole coming year!

[$] Locked root and rescue mode

Post Syndicated from original https://lwn.net/Articles/879272/rss

Fedora is among the group of Linux distributions that, by default, lock
out the root account such that it does not have a password and cannot be
logged into. But, traditionally, “rescue mode” boots the system into
single-user
mode
, which requires a root password—difficult to provide if it
does not exist. A Fedora proposal to remove the need for the password in
that case, and just drop into a root shell, does not seem likely to go far
in that form,
but it would seem to have pointed toward some better solutions for the
underlying problem.

The collective thoughts of the interwebz