Ingesting Automotive Sensor Data using DXC RoboticDrive Ingestor on AWS

Post Syndicated from Bryan Berezdivin original https://aws.amazon.com/blogs/architecture/ingesting-automotive-sensor-data-using-dxc-roboticdrive-ingestor-on-aws/

This post was co-written by Pawel Kowalski, a Technical Product Manager for DXC RoboticDrive and Dr. Max Böhm, a software and systems architect and DXC Distinguished Engineer.

To build the first fully autonomous vehicle, L5 standard per SAE, auto-manufacturers collected sensor data from test vehicle fleets across the globe in their testing facilities and driving circuits. It wasn’t easy collecting, ingesting and managing massive amounts of data, and that’s before it’s used for any meaningful processing, and training the AI self-driving algorithms. In this blog post, we outline a solution using DCX RoboticDrive Ingestor to address the following challenges faced by automotive original equipment manufacturers (OEMs) when ingesting sensor data from the car to the data lake:

  • Each test drive alone can gather hundreds of terabytes of data per fleet. A few vehicles doing test fleets can produce petabyte(s) worth of data in a day.
  • Vehicles collect data from all the sensors into local storage with fast disks. Disks must offload data to a buffer station and then to a data lake as soon as possible to be reused in the test drives.
  • Data is stored in binary file formats like ROSbag, ADTF or MDF4, that are difficult to read for any pre-ingest checks and security scans.
  • On-premises (ingest location) to Cloud data ingestion requires a hybrid solution with reliable connectivity to the cloud.
  • Ingesting process depositing files into a data lake without organizing them first can cause discovery and read performance issues later in the analytics phase.
  • Orchestrating and scaling an ingest solution can involve several steps, such as copy, security scans, metadata extraction, anonymization, annotation, and more.

Overview of the RoboticDrive Ingestor solution

The DXC RoboticDrive Ingestor (RDI) solution addresses the core requirements as follows:

  • Cloud ready:  Implements a recommended architectural pattern where data from globally located logger copy stations are ingested into the cloud data lake in one or more AWS Regions over AWS Direct Connect or Site-to-Site VPN connections.
  • Scalable: Runs multiple steps as defined in an Ingest Pipeline, containerized on Amazon EKS based Amazon EC2 compute nodes that can auto-scale horizontally and vertically on AWS. Steps can be for example, Virus Scan, Copy to Amazon S3, Quality Check, Metadata Extraction, and others.
  • Performant: Uses the Apache Spark-based DXC RoboticDrive Analyzer component to process large amounts of sensor data files efficiently in parallel, which will be described in a future blog post. Analyzer can read and processes native automotive file formats, extract and prepare metadata, and populate metadata into the DXC RoboticDrive Meta Data Store. The maximum throughput of network and disk is leveraged and data files are placed on the data lake following a hierarchical prefix domain model, that aligns with the best practices around S3 performance.
  • Operations ready: Containerized deployment, custom monitoring UI, visual workflow management with MWAA, Amazon CloudWatch based monitoring for virtual infrastructure and cloud native services.
  • Modular: Programmatically add or customize steps into the managed Ingest Pipeline DAG, defined in Amazon Managed Workflows for Apache Airflow (MWAA).
  • Security: IAM based access policy and technical roles, Amazon Cognito based UI authentication, virus scan, and an optional data anonymization step.

The ingest pipeline copies new files to S3 followed by user configurable steps, such as Virus Scan or Integrity Checks. When new files have been uploaded, cloud native S3 event notifications generate messages in an Amazon SQS queue. These are then consumed by serverless AWS Lambda functions or by containerized workloads in the EKS cluster, to asynchronously perform metadata extraction steps.

Walkthrough

There are two main areas of the ingest solution:

  1. On-Premises devices – these are dedicated copy stations in the automotive OEM’s data center where data cartridges are physically connected. Copy stations are easily configurable devices that automatically mount inserted data cartridges and share its content via NFS. At the end of the mounting process, they call an HTTP post API to trigger the ingest process.
  2. Managed Ingest Pipeline – this is a Managed service in the cloud to orchestrate the ingest process. As soon as a cartridge is inserted into the Copy Station, mounted and shared via NFS, the ingest process can be started.
Figure 1 - Architecture showing the DXC RoboticDrive Ingestor (RDI) solution

Figure 1 – Architecture showing the DXC RoboticDrive Ingestor (RDI) solution

Depending on the customer’s requirements, the ingest process may differ. It can be easily modified using predefined Docker images. A configuration file defines what features from the Ingest stack should be used. It can be a simple copy from the source to the cloud but we can easily extend it with additional steps, such as a virus scan, special data partitioning, data quality checks on even scripts provided by the automotive OEM.

The ingest process is orchestrated by a dedicated MWAA pipeline built dynamically from the configuration file. We can easily track the progress, see the logs and, if required, stop or restart the process. Progress is tracked at a detailed level, including the number and volume of data uploaded, remaining files, estimated finish time, and ingest summary, all visualized in a dedicated ingest UI.

Prerequisites

Ingest pipeline

To build an MWAA pipeline, we need to choose from prebuilt components of the ingestor and add them into the JSON configuration, which is stored in an Airflow variable:

{
    "tasks" : [
        {
            "name" : "Virus_Scan",
            "type" : "copy",
            "srcDir" : "file:///mnt/ingestor/CopyStation1/",
            "quarantineDir" : "s3a://k8s-ingestor/CopyStation1/quarantine/”
        },
        {
            "name" : "Copy_to_S3",
            "type" : "copy",
            "srcDir" : "file:///mnt/ingestor/car01/test.txt",
            "dstDir" : "s3a://k8s-ingestor/copy_dest/",
            "integrity_check" : false
        },
        {
            "name" : "Quality_Check",
            "type" : "copy",
            "srcDir" : "file:///mnt/ingestor/car01/test.txt",
            "InvalidFilesDir" : "s3a://k8s-ingestor/CopyStation1/invalid/",
        }
    ]
}

The final ingest pipeline, a Directed Acyclic Graph (DAG), is built automatically from the configuration and changes are visible within seconds:

Figure 2 - Screenshot showing the final ingest pipeline, a Directed Acyclic Graph (DAG)

Figure 2 – Screenshot showing the final ingest pipeline, a Directed Acyclic Graph (DAG)

If required, external tools or processes can also call ingest components using the Ingest API, which is shown in the following screenshot:

Figure 3 - Screenshot showing a tool being used to call ingest components using the Ingest API

Figure 3 – Screenshot showing a tool being used to call ingest components using the Ingest API

The usual ingest process consists of the following steps:

  1. Ingest data source (cartridge) into the Copy Station

2. Wait for Copy Station to report proper cartridge mounting. In case a dedicated device (Copy Station) is not used, and you want to use an external disc as your data source, it can be mounted manually:

mount -o ro /dev/sda /media/disc

Here, /dev/sda is the disc containing your data and /media/disc is the mountpoint, which must also be added to /etc/exports.

3. Every time the MWAA ingest pipeline (DAG) is triggered, a Kubernetes job is created through a Helm template and Helm values which add the above data source as a persistent volume (PV) mount inside the job.

Helm template is as follows:

apiVersion: v1

kind: PersistentVolume

metadata:

 name: {{ .name }}

 namespace: {{ .Values.namespace }}

spec:

 capacity:

  storage: {{ .storage }}

 accessModes:

  - {{ .accessModes }}

nfs:

 server: {{ .server }}

 path: {{ .path }}

Helm values:

name: "YourResourceName"

server: 10.1.1.44

path: "/cardata"

mountPath: "/media/disc"

storage: 100Mi

accessModes: ReadOnlyMany

4.  Trigger ingest manually from MWAA UI – this can also be automatically triggered from a Copy Station by calling MWAA API:

curl -X POST "https://roboticdrive/api/v1/dags/ingest_dag/dagRuns" -H "accept: application/json" -H "Content-Type: application/json" -d "{\"dag_run_id\":\"IngestDAG\"}"

5.  Watch ingest progress – this can be omitted as the ingest results, such as success, failure, can be notified by email or reported to a ticketing system.

6.  Once successfully uploaded, turn off the Copy Station manually or it can be the last task of a flow in the following ingest DAG:

(…)

def ssh_operator(task_identifier: str, cmd: str):

    return SSHOperator(task_id=task_identifier,

                       command=cmd + ' ',

                       remote_host=CopyStation,

                       ssh_hook=sshHook,

                       trigger_rule=TriggerRule.NONE_FAILED,

                       do_xcom_push=True,

                       dag= IngestDAG)

host_shutdown = ssh_operator(task_identifier='host_shutdown', \

                             cmd='sudo shutdown –h +5 &')

When launched, you can track the progress and basic KPIs on the Monitoring UI:

Figure 5 - Screenshot basic KPIs on the Monitoring UI

Figure 4 – Screenshot basic KPIs on the Monitoring UI

Conclusion

In this blog post, we showed how to set up the DXC RoboticDrive Ingestor. This solution was designed to overcome several data ingestion challenges and resulted in the following positive results:

  • Time-to-Analyze KPI decreased by 30% in our tests, local offload steps become obsolete, and data offloaded from cars were accessible on a globally accessible data-lake (S3) for further processing and analysis.
  • MWAA integrated with EKS made the solution flexible, fault tolerant, as well as easy to manage and maintain.
  • Autoscaling the compute capacity as needed for any pre-processing steps within ingestion, helped with boosting performance and productivity.
  • On-premises to AWS cloud connectivity options provided flexibility in configuring and scaling (up and down), and provides optimal performance and bandwidth.

We hope you found this solution insightful and look forward to hearing your feedback in the comments!

Dr. Max Böhm

Dr. Max Böhm

Dr. Max Böhm is a software and systems architect and DXC Distinguished Engineer with over 20 years’ experience in the IT industry and 9 years of research and teaching at universities. He advises customers across industries on their digital journeys, and has created innovative solutions, including real-time management views for global IT infrastructures and data correlation tools that simplify consumption-based billing. He currently works as a solution architect for DXC Robotic Drive. Max has authored or co-authored over 20 research papers and four patents. He has participated in key industry-research collaborations including projects at CERN.

Pawel Kowalski

Pawel Kowalski

Pawel Kowalski is a Technical Product Manager for DXC RoboticDrive where he leads the Data Value Services stream. His current area of focus is to drive solution development for large-scale (PB) end-to-end data ingestion use cases, ensuring performance and reliability. With over 10 years of experience in Big Data Analytics & Business Intelligence, Pawel has designed and delivered numerous customer tailored solutions.

Deliverability Sessions: Managing Large Volume Spikes in Email

Post Syndicated from Matt Strzelecki original https://aws.amazon.com/blogs/messaging-and-targeting/deliverability-sessions-managing-large-volume-spikes-in-email/

Introduction:
In an ideal world of email deliverability, email is sent on a regular cadence to a normalized lists of subscribers and recipient email addresses with no major changes in pattern. Typically the volume, list members and content are relatively the same and mailbox providers (such as Gmail) begin to expect that schedule and those volumes. Often times however, marketers are tasked with sending out campaigns (both marketing and transactional) with little time to prepare and even less time to ramp up to a normalized schedule. This can create not only a short term deliverability problem but potentially a long term deliverability problem as your sender reputation may suffer as a result of big changes to volume and cadence. This blog provides some recommendations and points to consider that will give your messages a better chance at inbox placement and thus engagement.

What Internet Service Providers (ISP)/Mailbox Providers (MP) Expect:
As email senders, we are responsible to understand and adhere to the recipient domains we are attempting to send messages. For example, if you are sending a good portion of your emails to Gmail or Yahoo you should understand what each mailbox provider expects in terms of warming up, sending throughput, and general deliverability advice. Examples of these resources can be found here for Gmail and Yahoo. The important thing here is that while general email practices are similar, each mailbox provider may have specific requirements or recommendations for delivering to their users. The mailbox providers top priorities are to #1 deliver wanted messages to their users and #2 block unwanted messages from getting to their users. So one of the keys to developing a good approach even with spikes in sending is to understand your destination ISPs/mailboxes and make sure you’re following the recommended best practices from those ISPs/MPs.

Ultimately you need to build trust with the ISPs/MPs in order to successfully deliver to them. A big part of it is understanding what they expect but the following key areas will also provide valuable recommendations for approaching an email program with variant timing and volumes. These topics include: List hygiene, bounce/complaint management, list segmentation/stacking & scheduling, and IP/Domain environment.

List Hygiene and Management:
The next area of focus we’ll review is your list and how you manage your list. It is important to understand that building a list is hard and takes a lot of time and effort but it is important to build your list(s) organically. This means that you only send to folks who have explicitly signed up for whatever it is you’re planning on sending them. The goal here is to honor your user’s preferences and at times limit the volume of messages if they are unresponsive.

When a recipient becomes unresponsive over a longer period of time (say over 1 year) a few things are happening if you continue to send those addresses email. The first thing that happens is that your user engagement goes down as you are not getting opens for any of those messages sent. This can be problematic especially as mailbox providers shift to more machine learning and A.I. driven filtering decisions, like Gmail. The second thing that often happens is if they are ignoring your messages purposefully and you keep sending, at some point they may select all the messages and flag them all as spam inflating your spam feedback numbers. The third thing that happens is that ISPs/MPs start to see lower overall user engagement which then reduces your sender reputation score with them and if your spam rate spikes as well, you’ll be certain to have deliverability issues.

The best way to manage your list is to be as targeted as possible in terms of your brands, offerings, and what the user initially signed up to receive (or implicitly confirmed through a purchase or transaction). Understand that if a user is not engaging with your message it is best to stop sending that specific series and look at putting them into a win-back style campaign in which you make one to a few more attempts to connect with the recipient and confirm their preferences and opt-in status to those mailing lists.

In large volume sending days, you still need to honor previous unsubscribes and spam complaints by removing them from your active mailing lists and not sending to those addresses that have explicitly opted-out. Additionally, large spikes in bounced email addresses (invalid addresses) will also negatively impact your sender reputation so be sure to keep your suppression list(s) and bounce management current.

More information on strategies for list management are available in this SES Blog post:
https://aws.amazon.com/blogs/messaging-and-targeting/strategies-for-list-management-with-amazon-pinpoint-and-amazon-simple-email-service/

IP/Domain Reputation:
Building and maintaining IP and domain reputation is extremely important when it comes to consistent deliverability and also having good enough sender reputation to have a spike in traffic without immediately running into deliverability issues. The best way to maintain good sender reputation (both IP and domain) is getting high user engagement (Unique Open Rate) and low complaints. High user engagement means users are interacting positively with your messages at a high rate, primarily identified by Opens but can also be supported by clicks as well. The rate can vary based on industry but if you’re getting around a 20% unique open rate, you have high user engagement and are doing well with your list. But rates can vary depending on industry, frequency of sends, types of messages and content. Complaints can hurt deliverability quickly because it is instant feedback to ISPs/MPs and if the complaint rate is high enough it is a major trigger for the ISP/MP to react negatively which typically results in putting messages directly into the spam folder, throttling messages (deferring) and/or blocking the message outright.

List Segmenting and Scheduling:
When it comes to a large volume spike in messaging for your email program list segmenting and scheduling is extremely important. Typically you want to avoid a large spike in volume but at times it is mandatory to send out. To do so you need to split out your segments by likely best performance. You want to send to the subscribers that will most likely engage with the message positively – for instance your new signups, recently engaged in a message and long term engagement (multiple opens within the past 30 days for example). This does two things. First it allows the most likely to positively engage with the message the opportunity to get the message to their inbox. The second thing that will happen is that as you get better initial engagement on your first few segments, your sender reputation will continue to improve and the next segments will have a much better chance at also hitting the inbox as a result of good performance from the first segments.

When you need to send a large volume spike, utilize as much of your scheduling flexibility as you have available. If you have 2 days to send the massive spike, use the full two days and spread the segments out. This helps you reduce the size of your message blasts to an ISP/MP. In addition, you can monitor performance of your segments which will start to give you a better idea of where in your list the ROI might not be worth the risk. For example, once you get towards the end of your list it may not be worth sending to people who have never opened a message in the past year and the risk of a complaint, bounce or unsubscribe may outweigh that benefit of a potential open/click.

Authentication:
There are two authentication mechanisms for email which are SPF and DKIM. SPF (Sender Policy Framework) is a simple text record within the DNS of the sending domain that lists the IP addresses that messages should always come from and a policy indicating what to do with messages that are not from those resources. These options can be rejecting a message, accepting all messages or accepting messages but placing them in the spam folder. Additionally DKIM (DomainKeys Identified Mail) is an encrypted signature within the message header to validate the message came from the purported source. Most mailbox providers require both authentication mechanisms to exists to pass the message on to their users.

In additional to these two authentication mechanisms is another reporting mechanism called DMARC (domain-based message authentication, reporting and conformance). DMARC utilizes SPF and DKIM protocols to indicate to recipient mail servers that the messages are protected by SPF and DKIM and how to handle the messages based on the alignment of these two protocols. In addition to creating a delivery policy, DMARC provides the ability for the recipient to send back reports to the sender indicating a pass or fail of the DMARC evaluation. This is a good mechanism for brands to see if their brand is being spoofed by bad actors and/or if they have authentication issues for various sources of their messages.

Authentication is not only suggested but it is required. Passing SPF and DKIM are critical for message delivery. DMARC allows senders to additionally impose policies based on these two heavily used email authentication protocols. DMARC also provides insight into other sources who may be purporting to your brand.

More information on these protocols can be found here:
SPF: https://docs.aws.amazon.com/ses/latest/DeveloperGuide/send-email-authentication-spf.html
DKIM: https://docs.aws.amazon.com/ses/latest/DeveloperGuide/send-email-authentication-dkim.html
DMARC: https://docs.aws.amazon.com/ses/latest/DeveloperGuide/send-email-authentication-dmarc.html

Final Thoughts:
Even though you will sometimes be forced to go off schedule (or possibly a non-normalized schedule is the norm) you must still try to align with ISP/MP best practices when possible. The goal is to build and maintain trust with not only the ISPs and Mailbox Providers but more importantly with your recipients. Your recipients are your key to email deliverability success – send them what they want and honor their opt-outs or preference center updates and you will be on the right track for good email deliverability.

Security updates for Friday

Post Syndicated from original https://lwn.net/Articles/879020/rss

Security updates have been issued by Debian (kernel), Fedora (dr_libs, libsndfile, and podman), openSUSE (fetchmail, log4j, log4j12, logback, python3, and seamonkey), Oracle (go-toolset:ol8, idm:DL1, and nodejs:16), Red Hat (go-toolset-1.16 and go-toolset-1.16-golang, ipa, rh-postgresql12-postgresql, rh-postgresql13-postgresql, and samba), Slackware (xorg), SUSE (log4j, log4j12, and python3), and Ubuntu (apache-log4j2 and openjdk-8, openjdk-lts).

Build Zabbix Server HA Cluster in 10 minutes by Kaspars Mednis / Zabbix Summit Online 2021

Post Syndicated from Kaspars Mednis original https://blog.zabbix.com/build-zabbix-server-ha-cluster-in-10-minutes-by-kaspars-mednis-zabbix-summit-online-2021/18155/

With the native Zabbix server HA cluster feature added in Zabbix 6.0 LTS, it is now possible to quickly configure and deploy a multi-node Zabbix Server HA cluster without using any external tools. Let’s take a look at how we can deploy a Zabbix server HA cluster in just 10 minutes.

The full recording of the speech is available on the official Zabbix Youtube channel.

Why Zabbix needs HA

Let’s dive deeper into what high availability is and try to define what the term High availability entails:

  • A system runs in high availability mode if it does not have a single point of failure
  • A single point of failure is a component failure of which halts the whole system
  • Redundancy is a requirement in systems that use high availability. In our case, we need a redundant component to which we can fail-over in case if the currently active component encounters an issue.
  • The failover process needs to be transparent and automated

In the case of the Zabbix components, the single point of failure is our Zabbix server. Even though Zabbix in itself is very stable, you can still encounter scenarios when a crash happens due to OS level issues or something more trivial – like running out of disk space. If your Zabbix server goes down, all of the data collection, problem detection, and alerting is stopped. That’s why it’s important to have some form of high availability and redundancy for this particular Zabbix component.

How to choose HA for Zabbix

Before the addition of native HA cluster support in Zabbix 6.0 LTS it was possible to use 3rd party HA solutions for Zabbix. This caused an ongoing discussion – which 3rd party solution should I use and how should I configure it for Zabbix components? On top of this, you would also have a new layer of software that requires proper expertise to deploy, configure and manage. There are also cloud-based HA options, but most of the time these incur an extra cost.

Not having the required expertise for the 3rd party high availability tools can cause unwanted downtimes or, at worst, can cause inconsistencies in the Zabbix DB backend. Here are some of the potential scenarios that can be caused by a misconfigured high availability solution:

  • The automatic failover may not be configured properly
  • A split-brain scenario with two nodes running concurrently, potentially causing inconsistencies in the Zabbix database backend
  • Misconfigured STONITH (Shoot the other node in the head) scenarios – potentially causing both nodes to go down

Native Zabbix HA solution

Zabbix 6.0 LTS native high availability solution is easy to set up and all of the required steps are documented in the Zabbix documentation. The native solution does not require any additional expertise and will continue to be officially supported, updated, and improved by Zabbix. Native high availability solution doesn’t require any new software components – the high availability solution stores the information about the Zabbix server node status in the Zabbix database backend.

How Zabbix cluster works

To enable the native high availability cluster for our servers, we first need to start the Zabbix server component in the high availability mode. To achieve this, we need to look at the two new parameters in the /etc/zabbix/zabbix_server.conf configuration file:

  • HANodeName – specify an arbitrary name for your Zabbix server cluster node
  • ExternalAddress – specify the address of the cluster node

Once you have made the changes and added these parameters, don’t forget to restart the Zabbix server cluster nodes to apply the changes.

Zabbix HA Node name

Let’s take a look at the HANodeName parameter. This is the most important configuration parameter – it is mandatory to specify it if you wish to run your Zabbix server in the high availability mode.

  • This parameter is used to specify the name of the particular cluster mode
  • If the HANodeName is not specified, Zabbix server will not start in the cluster mode
  • The node name needs to be unique on each of your nodes

In our example, we can observe a two-node cluster, where zbx-node1 is the active node and zbx-node2 is the standby node. Both of these nodes will send their heartbeats to the Zabbix database backend every 5 seconds. If one node stops sending its heartbeat, another node will take over.

Zabbix HA Node External Address

The second parameter that you will also need to specify is the ExternalAddress parameter.

In our example, we are using the address node1.example.com. The purpose of this parameter is to let the Zabbix frontend know the address of the currently active Zabbix server since the Zabbix frontend component also constantly communicates with the Zabbix server component. If this parameter is not specified, the Zabbix frontend might not be able to connect to the active Zabbix server node.

Zabbix frontend setup

Seasoned Zabbix users might know that the Zabbix frontend has its own configuration file, which usually contains the Zabbix server address and the Zabbix server port for establishing connections from the Zabbix frontend to the Zabbix server. If you are using the Zabbix high availability cluster, then you will have to comment these parameters out since instead of being static, now they depend on the currently active Zabbix server node and will be obtained from the Zabbix backend database.

Putting it all together

In the above example, we can see that we have two nodes – zbx-node1, which is currently active and zbx-node2. These nodes can be reachable by using the external addresses – node1.example.com and node2.example.com for zbx-node1 and zbx-node2 respectively. We can see that we also have deployed multiple frontends. Each of these frontend nodes will connect to the Zabbix backend database, read the address of the currently active node and proceed to connect to that node.

Zabbix HA node types

Zabbix server high availability cluster nodes can have one of the following multiple statuses:

  • Active – The currently active node. Only one node can be active at a time
  • Standby – The node is currently running in standby mode. Multiple nodes can have this status
  • Shutdown – The node was previously detected, but it has been gracefully shut down
  • Unreachable – Node was previously detected but was unexpectedly lost without a shutdown. This can be caused by many different reasons, for example – the node crashing or having network issues

In normal circumstances, you will have an active node and one or more standby nodes. Nodes in shutdown mode are also expected if, for example, you’re performing some maintenance tasks on these nodes. On the other hand, if an active node becomes unreachable, this is when one of the standby nodes will take over.

Zabbix HA Manager

How can we check which node is currently active and which nodes are running in standby mode? First off, we can see this in the Zabbix frontend – we will take a look at this a bit later. We can also check the node status from the command line. On every node – no matter active or standby, you will see that the zabbix_server and ha manager processes have been started. The ha manager process is responsible for checking the high availability node status in the database every 5 seconds and is responsible for taking over if the active node fails.

On the other hand, the currently active Zabbix server node will have many other processes – data collector processes such as pollers and trappers, history and configuration syncers, and many other Zabbix child processes.

Zabbix HA node status

The System information widget has received some changes in Zabbix 6.0 LTS. It is now capable of displaying the status of your Zabbix server high availability cluster and its individual nodes.

The widget can display the current cluster mode, which is enabled in our example and provides a list of all cluster nodes. In our example, we can see that we have 3 nodes – 1 active node,1 stopped node, and 1 node running in standby mode. This way we can not only see the status of our nodes but also their names, addresses, and last access times.

Switching Zabbix HA node

The witching between nodes is done manually. Once you stop the currently active Zabbix server node, another node will automatically take over. Of course, you need to have at least one more node running in standby status, so it can take over from the failed active node.

How failover works?

All nodes report their status every 5 seconds. Whenever you shut down a node, it goes into a shutdown state and in 5 seconds another node will take over. But if a node fails the workflow is a bit different. This is where something called a failover delay is taken into account. By default, this failover delay is 1 minute. The standby node will wait for one minute for the failed active node to update its status and if in one minute the active node is still not visible, then the standby node will take over.

Zabbix cluster tuning

It is possible to adjust the failover delay by using the ha_set_failover_delay runtime command. The supported range of the failover delay is from 10 seconds to 15 minutes. In most cases the default value of 1 minute will work just fine, but there could be some exceptions and it very much depends on the specifics of your environment.

We can also remove a node by using the ha_remove_node runtime command. This command requires us to specify the ID of the node that we wish to remove.

Connecting agents and proxies

Connecting Zabbix agents to your cluster

Now let’s talk about how we can connect Zabbix agents and proxies to your Zabbix cluster. First, let’s take a look at the passive Zabbix agent configuration.

  • Passive Zabbix agents require all nodes to be written in the configuration file under the Server parameter
  • Nodes are specified in a comma-separated list

Once you specify the list of all nodes, the passive Zabbix agent will accept connections from all of the specified nodes.

What about the active Zabbix agents?

  • Active Zabbix agents require all nodes to be written in the configuration file under the ServerActive parameter
  • Nodes need to be separated by semicolons

Notice the difference – comma-separated list for passive Zabbix agents and nodes separated by semicolons for active Zabbix agents!

Connecting Zabbix proxies to your cluster

Proxy configuration is very similar to the agent configuration. Once again – we can have a proxy running either in passive mode or active mode.

For the passive Zabbix proxies, we need to list our cluster nodes under the Server parameter in the proxy configuration file. These nodes should be specified in a comma-separated list. This way the proxies will accept connections from any Zabbix server node. As for the active Zabbix proxies – we need once again to list our nodes under the Server parameter, but this time the node names will be separated by semicolons.

Conclusion – Setting up Zabbix HA cluster

Let’s conclude by going through all of the steps that are required to set up a Zabbix server HA cluster.

  • Start Zabbix server in high availability mode on all of your Zabbix server cluster nodes – this can be done by providing the HANodeName parameter in the Zabbix server configuration file
  • Comment out the $ZBX_SERVER and $ZBX_SERVER_PORT in the frontend configuration file
  • List your cluster nodes in the Server and/or ServerActive parameters in the Zabbix agent configuration file for all of the Zabbix agents
  • List your cluster nodes in the Server parameter for all of your Zabbix proxies
  • For other monitoring types, such as SNMP – make sure your endpoints accept connections from all of the Zabbix server cluster nodes
  • And that’s it – Enjoy!

Zabbix HA workshop and training

Wish to learn more about the Zabbix server high availability cluster and get some hands-on experience with the guidance of a Zabbix certified trainer? Take a look at the following options!

  • The Zabbix server high availability workshop will be hosted shortly after the release of Zabbix 6.0 LTS, which is currently planned for January 2022. One of the workshop sessions will be focused specifically on Zabbix server high availability cluster configuration and troubleshooting.
  • Zabbix Certified professional training course covers the Zabbix server HA cluster configuration and troubleshooting. This is also a great opportunity to discuss your own Zabbix use cases and infrastructure with a Zabbix certified trainer. Feel free to check out our Zabbix training page to learn more!

Questions

Q: What about the high availability for the Zabbix frontend? Is it possible to set it up?
A: This is already supported since Zabbix 5.2. All you have to do is deploy as many Zabbix frontend nodes as you require and don’t forget to properly configure the external address so the Zabbix frontends are able to connect to the Zabbix servers and that’s all!

Q: Does high availability cause a performance impact on the network or the Zabbix backend database?
A: No, this should not be the case. The heartbeats that the cluster nodes send to the database backend are extremely small messages that get recorded in one of the smaller Zabbix database tables, so the performance impact should be negligible.

Q: What is the best practice when it comes to migrating from a 3rd party solution such as PCS/Corosync/Pacemaker to the native Zabbix server high availability cluster? Any suggestions on how that can be achieved?
A: The most complex part here is removing the existing high availability solution without breaking anything in the existing environment. Once that is done, all you have to do is upgrade your Zabbix instance to Zabbix 6.0 LTS and follow the configuration steps described in this post. Remember, that if you’re performing an upgrade instead of a fresh install, the configuration files will not have the new configuration parameters so they will have to be added in manually.

COVID-19 за политическа употреба

Post Syndicated from Зорница Латева original https://toest.bg/covid-19-za-politicheska-upotreba/

Използването на темата за COVID-19 за извличане на политически дивиденти не е български патент. В последните месеци обаче една по същество националистическа крайнодясна партия превърна говоренето за вируса и мерките срещу разпространението му в свое основно предизборно оръжие. На вота на 14 ноември предвожданата от Костадин Костадинов партия „Възраждане“ успя да събере над 127 500 гласа – с близо 50 000 повече спрямо изборите през април. Това ѝ осигури 13 места в 47-мото Народно събрание.

Риториката на Костадинов на тема COVID-19, ваксини и зелени сертификати не е единствената причина за този електорален резултат. Но със сигурност има съществена роля за постигането му.

„Гласът на здравомислещите“

През последните години Костадинов се превърна от местен в национален фактор на политическата сцена. Неговият възход съвпадна със залеза на други националистически формации, като „Атака“, ВМРО и НФСБ. Костадинов създава „Възраждане“ през 2014 г., след като вече е минал през няколко партии със същия профил. По това време той е директор на Историческия музей в Добрич и общински съветник във Варна (от 2011 г. до влизането му като депутат в настоящото Народно събрание). На предсрочните парламентарни избори през 2017 г. партията му става единствената извънпарламентарна формация със субсидия, след като печели 1,11% подкрепа. През 2019 г. стига до балотаж в надпреварата за кмет на Варна, но губи от Портних.

Костадинов беше и е сред противниците на Истанбулската конвенция и Стратегията за детето. Обявявал се е срещу промени в учебниците, издал е и собствен „учебник по родинознание“, който не е одобрен от МОН. Доскоро любимите му теми бяха против Европейския съюз, еврозоната, САЩ, „джендърите“. В официалната му страница във Facebook от септември насам те са изместени от тезите му срещу ваксинацията срещу COVID-19 и налагането на мерки срещу разпространението на коронавируса, като зелените сертификати, маските, пълното или частичното спиране на дейности от обществения живот. Откакто е в парламента, не пропуска тази тема, а на консултациите за съставяне на правителство при президента, на които отиде без маска, обяви, че първият приоритет на „Възраждане“ е връщането на нормалността с отпадането на мерките срещу вируса. Говорене, което би се харесало на всеки човек, който иска отново да живее спокойно и без ограничения.

Костадинов обаче удобно премълчава цената на връщането към нормалността – препълнени болници, срината здравна система и стотици починали всеки ден. Самият той се определя като глас на здравомислещите хора.

„Това е грип. Ваксините не са ефективни“

В публичните си изяви и постовете в социалните мрежи Костадинов нарича COVID-19 „грип“. Той не отрича, че има тежки случаи и починали, но смята, че информацията за това се преекспонира. Твърди, че болниците са препълнени именно заради страха на хората от усложнения и летален изход от заболяването. Костадинов не предлага мерки срещу COVID-19, а популистки пропагандира пълното отпадане на вече наложените. Неколкократно определя зеления сертификат като „античовешки“, а мерките, основани на него, като „концлагерни“.

Лидерът на „Възраждане“ заявява, че е „за“ ваксините, но не и за тези срещу коронавируса, които определя като „експериментални продукти“. Според него ваксините срещу коронавируса са разработени прекалено бързо, не са ефективни, а кампанията за масовото им прилагане е рекламна.

„Както всеки един човек знае, и без да има медицинско образование, ваксините предпазват на 100% от заболяване. Именно заради това ние от „Възраждане“ подкрепяме ваксинацията с утвърдените и доказани във времето ваксини срещу сериозните болести. […] Ваксините, които са доказали своята ефикасност, са разработвани десетилетия. Повече от 20 години е разработвана ваксината срещу детски паралич. Повече от 30 години е разработвана ваксината срещу малария. Ваксините срещу дифтерит, срещу коклюш и всички тези болести, които са били бичове за човешката цивилизация, са разработвани десетилетия от най-добрите учени на човечеството“, казва лидерът на „Възраждане“.

Той добавя, че ваксинацията срещу COVID-19 трябва да е доброволна и от нея не бива да произтичат ограничения или привилегии.

Това не е грип

Грипът и COVID-19 си приличат по начина на разпространение и по симптомите. Част от усложненията и при двете заболявания са подобни. Една от основните разлики между тях е, че при грип от години се прилагат ефективни противовирусни препарати, които могат да съкратят времето на протичане на болестта. До момента лекарство срещу коронавируса, което да се прилага масово, няма. Използват се медикаменти за други болести, и то основно в болнични условия.

Освен това смъртността от COVID-19 е по-висока от тази от грип. Колко точно по-висока, все още не е установено, но според публикация на Института „Джонс Хопкинс“ разликата може и да е над 10 пъти в полза на коронавируса. Според данните на Световната здравна организация годишно от свързани с грип усложнения умират между 290 000 и 650 000 души по целия свят. За последните две години от COVID-19 са починали над 5,34 млн. души. Дори ако се вземе предвид горната граница от смъртни случаи от грип – 650 000 на година, за две години починалите от усложнения, свързани с вируса на инфлуенцата, са около 1,3 млн. души, или над 4 пъти по-малко, отколкото при коронавируса.

Данните за България показват, че общата смъртност от 5 януари 2020 г. до момента е с 25% по-висока от очакваната смъртност на базата на данни от годините преди разпространението на коронавируса.

Колко ефективни са ваксините

Въпреки твърденията на Костадин Костадинов, че познатите и използвани от десетилетия ваксини са 100% ефективни, такива препарати почти не съществуват. В листовката на задължителната ваксина срещу полиомиелит (детски паралич) е записано, че тя е ефективна 99–100% (при прилагане на всички дози). Тази за дифтерия е с ефективност 97%. Ваксината срещу малария, която Костадинов споменава, действително се разработва от 30 години. Към момента обаче ефективността ѝ е 40%. Противогрипните ваксини, които Костадинов посочва като доказани, предпазват между 30 и 60% срещу различните щамове. Но и те, както и ваксините срещу COVID-19 намаляват риска от усложнения при евентуално заразяване.

Ефективността на антиковид ваксините продължава да се изследва, а данните се променят и според изменението на самия вирус. При Алфа варианта ефективността на иРНК ваксините се измерваше на над 90%. При Делта варианта, който доминира в момента, това число намалява, но се смята, че различните препарати (включително векторните) предпазват между 60 и 90% от заболяване.

В България няма точна статистика колко от всички установени случаи на COVID-19 до момента са при ваксинирани хора, както и колко от тях са стигнали до болница или са починали. Подобна статистика се дава на дневна база от последните няколко месеца. Информацията ден за ден показва, че обикновено над 80% от новозаразените не са били имунизирани. Делът на неваксинираните сред хоспитализираните с ковид е 85–90%, а сред починалите – 90–95%. И това на фона на новините за случаи с издаване на фалшиви сертификати за ваксинация.

Години работа

Ваксините срещу COVID-19 действително се появиха бързо. Масовото им прилагане започна в рамките на около година. Първи бяха иРНК препаратите. Този вид ваксини до момента не бяха прилагани по света, което допълнително предизвика съмнения и недоверие, но те всъщност се разработват от десетилетия. По данни на СЗО и национални здравни организации, като Центровете за контрол и превенция на заболяванията в САЩ, иРНК ваксините са проучвани за превенция на грип, бяс, зика, цитомегаловирус. Очаква се, че този тип ваксини ще бъдат все по-разпространени, тъй като може да се произвеждат в големи количества за кратко време.

Нарушени ли са човешките права

По света от десетилетия се прилагат задължителни ваксини. България не прави изключение. А липсата на имунизации води до ограничения – децата, на които не са поставени всички препарати и дози, не могат да посещават ясли, детски градини и училище.

Според решение на Европейския съд за правата на човека от април т.г. задължителната ваксинация не нарушава човешките права. Съдът се произнесе по жалба на родители от Чехия, чиято имунизационна политика е доста сходна с българската. ЕСПЧ постанови, че задължителната ваксинация е необходима мярка в демократичните общества, и подчерта, че никой не бива принудително да се ваксинира, а се оспорват последиците от отказа от имунизация. В решението се казва, че наистина за децата това да не посещават детска градина е загуба на важна възможност да развият личността си и да започнат да придобиват важни социални и учебни умения. „Това обаче е пряка последица от избора на техните родителите да откажат да изпълнят законово задължение, чиято цел е опазването на здравето конкретно на децата в тази възрастова група“, пише в решението.

Освен това възможността деца, които не могат да бъдат ваксинирани по медицински причини, да посещават детска градина зависи от високия процент на ваксинация сред другите деца. „Съдът смята, че не може да се счита за непропорционално държавата да изисква от тези, за които ваксинацията представлява малък риск за здравето, да приемат тази универсално практикувана защитна мярка като законово задължение в името на социалната солидарност и на по-малкия брой уязвими деца, които не могат да се възползват от ваксинацията“, пише още в решението.

Някои страни задължиха определени групи, като медици, полицаи, пожарникари, да се ваксинират срещу ковид. В държави като Италия и Австрия са въведени и изисквания за наличие на здравен сертификат за всички работещи. ЕСПЧ вече отхвърли жалбите на френски пожарникари и на гръцки медици срещу задължителното изискване да се имунизират.

В България ваксината срещу COVID-19 не е задължителна за никого. Със зеления сертификат, който се издава и на ваксинирани, и на преболедували, и на хора с отрицателен тест за коронавирус или положителен за антитела, се налагат ограничения, като забрана за посещения на някои обществени места на закрито за тези, които не разполагат с документа. Въвеждането му доведе до съдебни жалби, за каквито призоваха и от „Възраждане“. До момента десетки са отхвърлени.

Зеленият сертификат вкара „Възраждане“ в парламента

„Говоренето срещу ваксините и зеленият сертификат вкараха „Възраждане“ в парламента“, коментира Първан Симеонов, политолог и изпълнителен директор на „Галъп интернешънъл болкан“. Той допълва, че в предходните два вота за парламент партията леко е повишила резултата си и въпреки че предварителните социологически проучвания не ѝ отреждаха място в Народното събрание след 14 ноември, е направила „силен финален спринт“.

Според него говоренето на крайнодесния Костадин Костадинов срещу правилата, наложени заради COVID-19, е част от подобна тенденция и в Западна Европа. „Получава се парадокс – радикалната десница пропагандира за човешките права, а прогресивната левица, която не съществува у нас, пропагандира за спазване на правилата“, обясни Симеонов. По думите му, на местна почва посланията на Костадинов в предизборната кампания са се отличили толкова ярко, тъй като е липсвало „обратното говорене“ за налагане на ограничения и в полза на ваксините. „Никоя друга партия не зае твърда позиция“, коментира политологът.

Доколко антиковид говоренето е помогнало за изборния резултат на „Възраждане“, косвено се разглежда в доклада на Центъра за изследване на демокрацията отпреди изборите на тема „Пропаганда и дезинформация в предизборната кампания: основни послания и канали за разпространение“. Проучването обхваща информацията в публично достъпни Facebook страници и групи, които са били наблюдавани в периода между 14 октомври и 8 ноември 2021 г.

Изследването показва, че партия „Възраждане“ и нейният лидер са абсолютни шампиони по бързо увеличаване на броя на последователите в социалната мрежа. Костадинов е привлякъл най-много нови последователи от всички кандидат-президенти (над 22 000 само за 3 седмици) и като основна причина ярко се откроява въвеждането на задължителния зелен сертификат на 19 октомври. От петте изследвани националистически и проруски партии („Възраждане“, АБВ, ВМРО, „Атака“ и „Воля“) „Възраждане“ е привлякла най-много внимание на публиката във Facebook – с 95% от всички взаимодействия и 98% от всички нови последователи.

Анализ на страницата на Костадинов с инструмента BuzzSumo също показва, че ангажираността, която публикациите на страницата създават сред потребителите (харесвания, коментари, споделяния), нараства лавинообразно. През септември общата ангажираност с постовете е била над 401 000 реакции, през октомври, когато се въвежда и сертификатът, тя рязко нараства на близо 900 000 реакции, а през ноември вече е почти 1,2 млн. реакции. Най-активните публикации са именно тези с възгледите му за пандемията, зеления сертификат и ваксините. От септември до момента средната ангажираност на постовете на страницата на Костадинов се е увеличила от около 2500 на 7685 реакции средно на публикация.


Влизането на „Възраждане“ в парламента дава все по-голяма трибуна на Костадинов да пропагандира тезите си против антиковид ваксините и срещу мерките за ограничаването на разпространението на коронавируса. Като депутат неговите изказвания се появяват все по-често в националните медии и достигат до още повече хора. И със сигурност ще намерят благоприятна почва сред част от обществото, уморено от ограничения и страх от COVID-19. А това е опасно не само за съмишлениците на Костадинов, които не желаят да се ваксинират, да носят маски и да спазват ограничения, а и за останалите. Тъй като коронавирусът не избира приемниците си според това дали искат и спазват правилата, или не.

Увеличаващата се гласност на политици като Костадинов ще прави все по-трудно налагането на допълнителни ограничения във времена на поредната ковид вълна. И подкопава и без това не особено ефективните усилия на властите за увеличаване на дела на ваксинираните българи. А с това се отдалечава моментът за връщане към що-годе нормален живот, в който разпространението на вируса може да се контролира.

Заглавна илюстрация: © Пеню Кирацов

Източник

Insights for CTOs: Part 2 – Enable Good Decisions at Scale with Robust Security

Post Syndicated from Syed Jaffry original https://aws.amazon.com/blogs/architecture/insights-for-ctos-part-2-enable-good-decisions-at-scale-with-robust-security/

In my role as a Senior Solutions Architect, I have spoken to chief technology officers (CTOs) and executive leadership of large enterprises like big banks, software as a service (SaaS) businesses, mid-sized enterprises, and startups.

In this 6-part series, I share insights gained from various CTOs during their cloud adoption journeys at their respective organizations. I have taken these lessons and summarized architecture best practices to help you build and operate applications successfully in the cloud. This series will also cover topics on building and operating cloud applications, security, cloud financial management, modern data and artificial intelligence (AI), cloud operating models, and strategies for cloud migration.

In part 2, my colleague Paul Hawkins and I will show you how to effectively communicate organization-wide security processes. This will ensure you can make informed decisions to scale effectively. We also describe how to establish robust security controls using best practices from the Security Pillar of the Well-Architected Framework.

Effectively establish and communicate security processes

To ensure your employees, customers, contractors, etc., understand your organization’s security goals, make sure that people know the what, how, and why behind your security objectives:

  • What are the overall objectives they need to meet?
  • How do you intend for the organization and your customers to work together to meet these goals?
  • Why are meeting these goals important to your organization and customers?

Having well communicated security principles gives a common understanding of overall objectives. Once you communicate these goals, you can get more specific in terms of how those objectives can be achieved.

The next sections discuss best practices to establish your organization’s security processes.

Create a “path to production” process

A “path to production” process is a set of consistent and reusable engineering standards and steps that each new cloud workload must adhere to prior to production deployment. Using this process will increase delivery velocity while reducing business risk by ensuring strong compliance to standards.

Classify your data for better access control

Understanding the type of data that you are handling and where it is being handled is critical to understanding what you need to do to appropriately protect it. For example, the requirements for a public website are different than a payment processing workload. By knowing where and when sensitive data is being accessed or used, you can more easily assess and establish the appropriate controls.

Figure 1 shows a scale that will help you determine when and how to protect sensitive data. It shows that you would apply stricter access controls for more sensitive data to reduce the risk of inappropriate access. Detective controls allow you to audit and respond to unexpected access.

By simplifying the baseline control posture across all environments and layering on stricter controls where appropriate, you will make it easier to deliver change more swiftly while maintaining the right level of security.

Data classification and control scale

Figure 1. Data classification and control scale

Identify and prioritize how to address risks using a threat model

As shown in the How to approach threat modeling blog post, threat modeling helps workload teams identify potential threats and develop or implement security controls to address those threats.

Threat modeling is most effective when it’s done at the workload (or workload feature) level. We recommend creating reusable threat modeling templates. This will help ensure quicker time to production and a consistent security control posture for your systems.

Create feedback cycles

Security, like other areas of architecture and design, is not static. You don’t implement security processes and walk away, just like you wouldn’t ship an application and never improve its availability, performance, or ease of operation.

Implementation of feedback cycles will vary depending on your organizational structure and processes. However, one common way we have seen feedback cycles being implemented is with a collaborative, blame-free root cause analysis (RCA) process. It allows you to understand how many issues you have been able to prevent or effectively respond to and apply that knowledge to make your systems more secure. It also demonstrates organizational support for an objective discussion where people are not penalized for asking questions.

Security controls

Protect your applications and infrastructure

To secure your organization, build automation that delivers robust answers to the following questions:

  1. Preventative controls – how well can you block unauthorized access?
  2. Detective controls – how well can you identify unexpected activity or unwanted configuration?
  3. Incident response – how quickly and effectively can you respond and recover from issues?
  4. Data protection – how well is the data protected while being used and stored?

Preventative controls

Start with robust identity and access management (IAM). For human access, avoid having to maintain separate credentials between cloud and on-premises systems. It does not scale and creates threat vectors such as long-lived credentials and credential leaks.

Instead, use federated authentication within a centralized system for provisioning and deprovisioning organization-wide access to all your systems, including the cloud. For AWS access, you can do this with AWS Single Sign-On (AWS SSO), direct federation to IAM, or integration with partner solutions, such as Okta or Active Directory.

Enhance your trust boundary with the principles of “zero trust.” Traditionally, organizations tend to rely on the network as the primary point of control. This can create a “hard shell, soft core” model, which doesn’t consider context for access decisions. Zero trust is about increasing your use of identity as a means to grant access in addition to traditional controls that rely on network being private.

Apply “defense in depth” to your application infrastructure with a layered security architecture. The sequence in which you layer the controls together can depend on your use case. For example, you can apply IAM controls either at the database layer or at the start of user activity—or both. Figure 2 shows a conceptual view of layering controls to help secure access to your data. Figure 3 shows the implementation view for a web-facing application.

Defense in depth

Figure 2. Defense in depth

Defense in depth applied to a web application

Figure 3. Defense in depth applied to a web application

Detective controls

Detective controls allow you to get the information you need to respond to unexpected changes and incidents. Tools like Amazon GuardDuty and AWS Config can integrate with your security information and event monitoring (SIEM) system so you can respond to incidents using human and automated intervention.

Incident response

When security incidents are detected, timely and appropriate response is critical to minimize business impact. A robust incident response process is a combination of human intervention steps and automation. The AWS Security Hub Automated Response and Remediation solution provides an example of how you can build incident response automation.

Protect data with robust controls

Restrict access to your databases with private networking and strong identity and access control. Apply data encryption in transit (TLS) and at rest. A common mistake that organizations make is not enabling encryption at rest in databases at the time of initial deployment.

It is difficult to enable database encryption after the fact without time-consuming data migration. Therefore, enable database encryption from the start and minimize direct human access to data by applying principles of least privilege. This reduces the likelihood of accidental disclosure of information or misconfiguration of systems.

Ready to get started?

As a CTO, understanding the overall posture of your security processes against the foundational security controls is beneficial. Tracking key metrics on the effectiveness of the decision-making process, overall security objectives, and the improvement in posture over time should be regularly evaluated by the CTO and CISO organizations.

Embedding the principles of robust security processes and controls into the way your organization designs, develops, and operates workloads makes it easier to consistently make good decisions quickly.

To get started, look at workloads where engineering and security are already working together or bootstrap an initiative for this. Use the Well Architected Tool’s Security Pillar to create and communicate a set of objectives that demonstrate value.

Other blogs in this series

Looking for more architecture content? AWS Architecture Center provides reference architecture diagrams, vetted architecture solutions, Well-Architected best practices, patterns, icons, and more!

Technical interviews via Codespaces

Post Syndicated from Ian Olsen original https://github.blog/2021-12-16-technical-interviews-via-codespaces/

Technical interviews are the worst. Getting meaningful signal from candidates without wasting their time is notoriously hard. Thankfully, the industry has come a long way from brainteaser-style questions and interviews requiring candidates to balance a binary tree with dry erase markers in front of a group of strangers. There are more valuable ways to spend time today, and in this post, I’ll share how our team at GitHub adopted Codespaces to streamline the interview process.

Technical interviews: looking back

My team at GitHub found itself in hiring mode in early 2021. Most of the work we do is in Rails, and we opted to leverage an existing exercise for our technical screen. We asked candidates to make some API improvements to a simple Rails application. It’s been around for many years and has had most of its sharp edges sanded smooth. There is some CI magic to get us started in evaluating a new submission. We perform a manual evaluation using a rubric that is far from perfect but at least well-understood. So we deployed it and started looking through the submissions, a task we expected to be routine.

Despite all the deliberately straightforward decisions to this point, we had some surprises right away. It turned out this exercise hadn’t been touched in a couple of years and was running outdated versions of Ruby and Rails. For some candidates, the experienced engineers already writing Rails apps for a living, this wasn’t much of an obstacle. But a significant number of candidates were bogged down just getting their local development environment up and running. A team looking only for senior engineers might even do something like this deliberately, but that wasn’t true for my team. The goal of the exercise was to mirror the job, and this wasn’t it. Flailing for half your alotted time on environment set-up issues tells us virtually nothing about how successful candidates would be at the technical work we do.

Enter Codespaces

We immediately did the obvious work of updating Ruby, Rails, and all of the app’s dependencies. This was necessary but felt insufficient. How could we prevent a future team from making the same mistake? How could we help other growing teams (or even future us) fall into the proverbial pit of success? It was around this time that the Codespaces Computer Club started gaining traction internally. I don’t tend to be the first person to jump into a newfangled cloud-based dev environment. Many years have gone into this .vimrc and I like it just how it is, thank you very much. Don’t move my cheese, particuarly not to The Cloud. But even I had to admit that Codespaces is an excellent tool, aimed squarely at solving these kinds of problems, and we gave it a look.

So what is Codespaces? In short: a cloud-based development environment. Built atop Visual Studio Code’s Remote Containers, Codespaces allow you to spin up a remote development environment directly from a GitHub repository. The Visual Studio Code web interface is instantly available, as is Visual Studio Code on the desktop. Dotfiles and ssh are supported, so the terminal-oriented folks (🖐) need not abandon their precious .vimrc!

Screenshot of UI to launch a new codespace

The containerized development environmentment is perfectly predictable, frozen in time like Han Solo in Carbonite. We can prebuild all of the dependencies, and they remain at that version for as long as the codespace configuration is unchanged. This removes an entire class of meaningless problems from the candidate’s experience. Experienced developers who have a finely tuned local environment can still use it; enabling Codespaces has no impact on the ability to do it locally. Clone the repository and do your thing. But the experience of being quickly dropped into a development environment that’s perfectly tuned for the task at hand is pretty cool!
 
codespace ready

Returning signal

Dropping the candidate into a finely honed environment, suited to the task at hand, has myriad benefits. It eliminates the random starting point, leveling the playing field for candidates of varying backgrounds all over the world. No assumptions need be made about the hardware or software they have access to. With internet access and a browser, you have everything you need!

The advantages extend to pairing exercises, too. There’s good reason for a candidate to have anxiety pairing in an interviewing context. Perhaps the best way to fray nerves is to start with a broken dev environment. Maybe the candidate is using a work machine, and the app they maintain at work is on an older version of Rails. Maybe this is a personal machine, but their bird watching hobby yields terabytes of video and bundle install just ran out of disk space. Even if it’s a quick fix, a nervous candidate isn’t performing at the level they would in their normal work. Working in a codespace lets us virtually eliminate this pitfall and focus on the pairing task, yielding higher signal about the skills we really intend to measure.

This has turned out to be a terrific improvement in our hiring process, appreciated by both candidates and interviewers. Visual Studio Code has great tooling for adding Codespaces support to an existing project, and you can probably have something that works in a single afternoon. Check it out!

Ibotta builds a self-service data lake with AWS Glue

Post Syndicated from Erik Franco original https://aws.amazon.com/blogs/big-data/ibotta-builds-a-self-service-data-lake-with-aws-glue/

This is a guest post co-written by Erik Franco at Ibotta.

Ibotta is a free cash back rewards and payments app that gives consumers real cash for everyday purchases when they shop and pay through the app. Ibotta provides thousands of ways for consumers to earn cash on their purchases by partnering with more than 1,500 brands and retailers.

At Ibotta, we process terabytes of data every day. Our vision is to allow for these datasets to be easily used by data scientists, decision-makers, machine learning engineers, and business intelligence analysts to provide business insights and continually improve the consumer and saver experience. This strategy of data democratization has proven to be a key pillar in the explosive growth Ibotta has experienced in recent years.

This growth has also led us to rethink and rebuild our internal technology stacks. For example, as our datasets began to double in size every year combined with complex, nested JSON data structures, it became apparent that our data warehouse was no longer meeting the needs of our analytics teams. To solve this, Ibotta adopted a data lake solution. The data lake proved to be a huge success because it was a scalable, cost-effective solution that continued to fulfill the mission of data democratization.

The rapid growth that was the impetus for the transition to a data lake has now also forced upstream engineers to transition away from the monolith architecture to a microservice architecture. We now use event-driven microservices to build fault-tolerant and scalable systems that can react to events as they occur. For example, we have a microservice in charge of payments. Whenever a payment occurs, the service emits a PaymentCompleted event. Other services may listen to these PaymentCompleted events to trigger other actions, such as sending a thank you email.

In this post, we share how Ibotta built a self-service data lake using AWS Glue. AWS Glue is a serverless data integration service that makes it easy to discover, prepare, and combine data for analytics, machine learning, and application development.

Challenge: Fitting flexible, semi-structured schemas into relational schemas

The move to an event-driven architecture, while highly valuable, presented several challenges. Our analytics teams use these events for use cases where low-latency access to real-time data is expected, such as fraud detection. These real-time systems have fostered a new area of growth for Ibotta and complement well with our existing batch-based data lake architecture. However, this change presented two challenges:

  • Our events are semi-structured and deeply nested JSON objects that don’t translate well to relational schemas. Events are also flexible in nature. This flexibility allows our upstream engineering teams to make changes as needed and thereby allows Ibotta to move quickly in order to capitalize on market opportunities. Unfortunately, this flexibility makes it very difficult to keep schemas up to date.
  • Adding to these challenges, in the last 3 years, our analytics and platform engineering teams have doubled in size. Our data processing team, however, has stayed the same size largely due to difficulty in hiring qualified data engineers who possess specialized skills in developing scalable pipelines and industry demand. This meant that our data processing team couldn’t keep up with the requests from our analytics teams to onboard new data sources.

Solution: A self-service data lake

To solve these issues, we decided that it wasn’t enough for the data lake to provide self-service data consumption features. We also needed self-service data pipelines. These would provide both the platform engineering and analytics teams with a path to make their data available within the data lake and with minimal to no data engineering intervention necessary. The following diagram illustrates our self-service data ingestion pipeline.

The pipeline includes the following components:

  1. Ibotta data stakeholders – Our internal data stakeholders wanted the capability to automatically onboard datasets. This user base includes platform engineers, data scientists, and business analysts.
  2. Configuration file – Our data stakeholders update a YAML file with specific details on what dataset they need to onboard. Sources for these datasets include our enterprise microservices.
  3. Ibotta enterprise microservices – Microservices make up the bulk of our Ibotta platform. Many of these microservices utilize events to asynchronously communicate important information. These events are also valuable for deriving analytics insights.
  4. Amazon Kinesis – After the configuration file is updated, data is immediately streamed to Amazon Kinesis. Amazon Kinesis makes it easy to collect, process, and analyze real-time, streaming data so you can get timely insights and react quickly to new information. Streaming the data through Kinesis Data Streams and Kinesis Data Firehose gives us the flexibility to analyze the data in real time while also allowing us to store the data in Amazon Simple Storage Service (Amazon S3).
  5. Ibotta self-service data pipeline – This is the starting point of our data processing. We use Apache Airflow to orchestrate our pipelines once every hour.
  6. Amazon S3 raw data – Our data lands in Amazon S3 without any transformation. The complex nature of the JSON is retained for future processing or validation.
  7. AWS Glue – Our goal now is to take the complex nested JSON and create a simpler structure. AWS Glue provides a set of built-in transforms that we use to process this data. One of the transforms is Relationalize—an AWS Glue transform that takes semi-structured data and transforms it into a format that can be more easily analyzed by engines like Presto. This feature means that our analytics teams can continue to use the analytics engines they’re comfortable with and thereby lessen the impact of transitioning from relational data sources to semi-structured event data sources. The Relationalize function can flatten nested structures and create multiple dynamic frames. We use 80 lines of code to convert any JSON-based microservice message to a consumable table. We have provided this code base here as a reference and not for reuse.
    // Convert to a DynamicFrame and relationalize
       // Convert it back to DataFrame
       val dynamicFrame: DynamicFrame = DynamicFrame(df, glueContext)
       val dynamicFrameCollection: Seq[DynamicFrame] = dynamicFrame.relationalize(rootTableName = glueSourceTable,
         stagingPath = glueTempStorage,
         options = JsonOptions.empty)
       val relationalizedDF: Dataset[Row] = removeColumnDotNotationRelationalize(dynamicFrameCollection(0).toDF())
       // Get rid of dot-notation and repartition it
       val repartitionedDF: Dataset[Row] = relationalizedDF.repartition(finalRepartitionValue.toInt)
       // Write it out
       repartitionedDF
         .write
         .mode("overwrite")
         .option("compression", "snappy")
         .parquet(glueRelationalizeOutputS3Path)

  8. Amazon S3 curated – We then store the relationalized structures as Parquet format in Amazon S3.
  9. AWS Glue crawler AWS Glue crawlers allow us to automatically discover schema and catalogs in the AWS Glue Data Catalog. This feature is a core component of our self-service data pipelines because it removes the requirement of having a data engineer manually create or update the schemas. Previously, if a change needed to occur, it flowed through a communication path that included platform engineers, data engineers, and analytics. AWS Glue crawlers effectively remove the data engineers from this communication path. This means new datasets or changes to datasets are made available quickly within the data lake. It also frees up our data engineers to continue working on improvements to our self-service data pipelines and other data paved roadmap features.
  10. AWS Glue Data Catalog – A common problem in growing data lakes is that the datasets can become harder and harder to work with. A common reason for this is a lack of discoverability of data within the data lake as well as a lack of clear understanding of what the datasets are conveying. The AWS Glue Catalog is a feature that works in conjunction with AWS Glue crawlers to provide data lake users with searchable metadata for different data lake datasets. As AWS Glue crawlers discover new datasets or updates, they’re recorded into the Data Catalog. You can then add descriptions at the table or fields levels for these datasets. This cuts down on the level of tribal knowledge that exists between various data lake consumers and makes it easy for these users to self-serve from the data lake.
  11. End-user data consumption – The end-users are the same as our internal stakeholders called out in Step 1.

Benefits

The AWS Glue capabilities we described make it a core component of building our self-service data pipelines. When we initially adopted AWS Glue, we saw a three-fold decrease in our OPEX costs as compared to our previous data pipelines. This was further enhanced when AWS Glue moved to per-second billing. To date, AWS Glue has allowed us to realize a five-fold decrease in OPEX costs. Also, AWS Glue requires little to no manual intervention to ingest and process our over 200 complex JSON objects. This allows Ibotta to utilize AWS Glue each day as a key component in providing actionable data to the organization’s growing analytics and platform engineering teams.

We took away the following learnings in building self-service data platforms:

Conclusion and next steps

With the self-service data lake we have established, our business teams are realizing the benefits of speed and agility. As next steps, we’re going to improve our self-service pipeline with the following features:

  • AWS Glue streaming – Use AWS Glue streaming for real-time relationalization. With AWS Glue streaming, we can simplify our self-service pipelines by potentially getting rid of our orchestration layer while also getting data into the data lake sooner.
  • Support for ACID transactions – Implement data formats in the data lake that allow for ACID transactions. A benefit of this ACID layer is the ability to merge streaming data into data lake datasets.
  • Simplify data transport layers – Unify the data transport layers between the upstream platform engineering domains and the data domain. From the time we first implemented an event-driven architecture at Ibotta to today, AWS has offered new services such as Amazon EventBridge and Amazon Managed Streaming for Apache Kafka (Amazon MSK) that have the potential to simplify certain facets of our self-service and data pipelines.

We hope that this blog post will inspire your organization to build a self-service data lake using serverless technologies to accelerate your business goals.


About the Authors

Erik Franco is a Data Architect at Ibotta and is leading Ibotta’s implementation of its next-generation data platform. Erik enjoys fishing and is an avid hiker. You can often find him hiking one of the many trails in Colorado with his lovely wife Marlene and wonderful dog Sammy.

Shiv Narayanan is Global Business Development Manager for Data Lakes and Analytics solutions at AWS. He works with AWS customers across the globe to strategize, build, develop and deploy modern data platforms. Shiv loves music, travel, food and trying out new tech.

Matt Williams is a Senior Technical Account Manager for AWS Enterprise Support. He is passionate about guiding customers on their cloud journey and building innovative solutions for complex problems. In his spare time, Matt enjoys experimenting with technology, all things outdoors, and visiting new places.

What’s new in Amazon Redshift – 2021, a year in review

Post Syndicated from Manan Goel original https://aws.amazon.com/blogs/big-data/whats-new-in-amazon-redshift-2021-a-year-in-review/

Amazon Redshift is the cloud data warehouse of choice for tens of thousands of customers who use it to analyze exabytes of data to gain business insights. Customers have asked for more capabilities in Redshift to make it easier, faster, and secure to store, process, and analyze all of their data. We announced Redshift in 2012 as the first cloud data warehouse to remove the complexity around provisioning, managing, and scaling data warehouses. Since then, we have launched capabilities such as Concurrency scaling, Spectrum, and RA3 nodes to help customers analyze all of their data and support growing analytics demands across all users in the organization. We continue to innovate with Redshift on our customers’ behalf and launched more than 50 significant features in 2021. This post covers some of those features, including use cases and benefits.

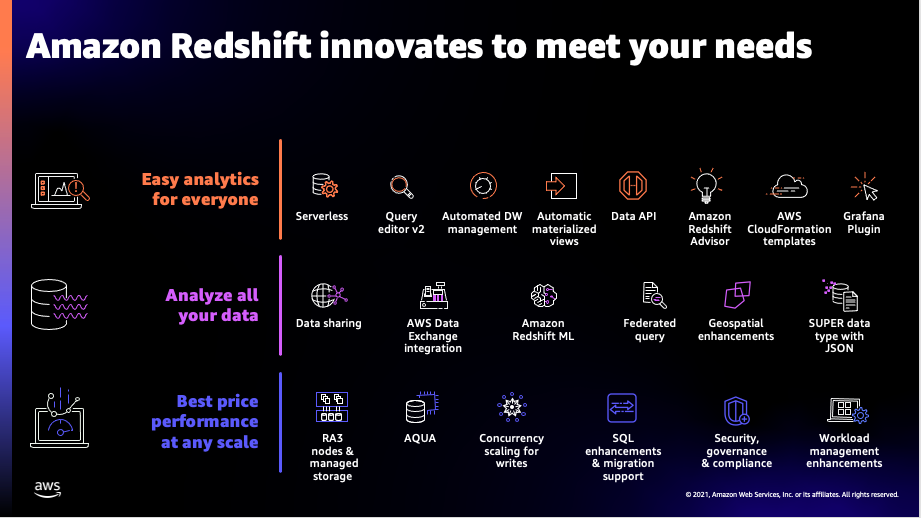
Working backwards from customer requirements, we are investing in Redshift to bring out new capabilities in three main areas:

  1. Easy analytics for everyone
  2. Analyze all of your data
  3. Performance at any scale

Customers told us that the data warehouse users in their organizations are expanding from administrators, developers, analysts, and data scientists to the Line of Business (LoB) users, so we continue to invest to make Redshift easier to use for everyone. Customers also told us that they want to break free from data silos and access data across their data lakes, databases, and data warehouses and analyze that data with SQL and machine learning (ML). So we continue to invest in letting customers analyze all of their data. And finally, customers told us that they want the best price performance for analytics at any scale from Terabytes to Petabytes of data. So we continue to bring out new capabilities for performance at any scale. Let’s dive into each of these pillars and cover the key capabilities that we launched in 2021.

Amazon Redshift key innovations

Amazon Redshift key innovations

Redshift delivers easy analytics for everyone

Easy analytics for everyone requires a simpler getting-started experience, automated manageability, and visual user interfaces that make is easier, simpler, and faster for both technical and non-technical users to quickly get started, operate, and analyze data in a data warehouse. We launched new features such as Redshift Serverless (in preview), Query Editor V2, and automated materialized views (in preview), as well as enhanced the Data API in 2021 to make it easier for customers to run their data warehouses.

Redshift Serverless (in preview) makes it easy to run and scale analytics in seconds without having to provision and manage data warehouse clusters. The serverless option lets all users, including data analysts, developers, business users, and data scientists use Redshift to get insights from data in seconds by simply loading and querying data into the data warehouse. Customers can launch a data warehouse and start analyzing the data with the Redshift Serverless option through just a few clicks in the AWS Management Console. There is no need to choose node types, node count, or other configurations. Customers can take advantage of pre-loaded sample data sets along with sample queries to kick start analytics immediately. They can create databases, schemas, tables, and load their own data from their desktop, Amazon Simple Storage Service (S3), via Amazon Redshift data shares, or restore an existing Amazon Redshift provisioned cluster snapshot. They can also directly query data in open formats, such as Parquet or ORC, in their Amazon S3 data lakes, as well as data in their operational databases, such as Amazon Aurora and Amazon RDS. Customers pay only for what they use, and they can manage their costs with granular cost controls.

Redshift Query Editor V2 is a web-based tool for data analysts, data scientists, and database developers to explore, analyze, and collaborate on data in Redshift data warehouses and data lake. Customers can use Query Editor’s visual interface to create and browse schema and tables, load data, author SQL queries and stored procedures, and visualize query results with charts. They can share and collaborate on queries and analysis, as well a track changes with built in version control. Query Editor V2 also supports SQL Notebooks (in preview), which provides a new Notebook interface that lets users such as data analysts and data scientists author queries, organize multiple SQL queries and annotations on a single document, and collaborate with their team members by sharing Notebooks.

Amazon Redshift Query Editor V2

Amazon Redshift Query Editor V2

Customers have long used Amazon Redshift materialized views (MV) for precomputed result sets, based on an SQL query over one or more base tables to improve query performance, particularly for frequently used queries such as those in dashboards and reports. In 2021, we launched Automated Materialized View (AutoMV) in preview to improve the performance of queries (reduce the total execution time) without any user effort by automatically creating and maintaining materialized views. Customers told us that while MVs offer significant performance benefits, analyzing the schema, data, and workload to determine which queries might benefit from having an MV or which MVs are no longer beneficial and should be dropped requires knowledge, time, and effort. AutoMV lets Redshift continually monitor the cluster to identify candidate MVs and evaluates the benefits vs costs. It creates MVs that have high benefit-to-cost ratios, while ensuring existing workloads are not negatively impacted by this process. AutoMV continually monitors the system and will drop MVs that are no longer beneficial. All of these are transparent to users and applications. Applications such as dashboards benefit without any code change thanks to automatic query re-write, which lets existing queries benefit from MVs even when not explicitly referenced. Customers can also set the MVs to autorefresh so that MVs always have up-to-date data for added convenience.

Customers have also asked us to simplify and automate data warehouse maintenance tasks, such as schema or table design, so that they can get optimal performance out of their clusters. Over the past few years, we have invested heavily to automate these maintenance tasks. For example, Automatic Table Optimization (ATO) selects the best sort and distribution keys to determine the optimal physical layout of data to maximize performance. We’ve extended ATO to modify column compression encodings to achieve high performance and reduce storage utilization. We have also introduced various features, such as auto vacuum delete and auto analyze, over the past few years to make sure that customer data warehouses continue to operate at peak performance.

Data API, which launched in 2020, has also seen major enhancements, such as multi-statement query execution, support for parameters to develop reusable code, and availability in more regions in 2021 to make it easier for customers to programmatically access data in Redshift. Data API lets Redshift enable customers to painlessly access data with all types of traditional, cloud-native, and containerized, serverless web services-based applications and event-driven applications. It simplifies data access, ingest, and egress from programming languages and platforms supported by the AWS SDK, such as Python, Go, Java, Node.js, PHP, Ruby, and C++. The Data API eliminates the need for configuring drivers and managing database connections. Instead, customers can run SQL commands to an Amazon Redshift cluster by simply calling a secured API endpoint provided by the Data API. The Data API takes care of managing database connections and buffering data. The Data API is asynchronous, so results can be retrieved later and are stored for 24 hours.

Finally in our easy analytics for everyone pillar, in 2021 we launched the Grafana Redshift Plugin to help customers gain a deeper understanding of their cluster’s performance. Grafana is a popular open-source tool for running analytics and monitoring systems online. The Grafana Redshift Plugin lets customers query system tables and views for the most complete set of operational metrics on their Redshift cluster. The Plugin is available in the Open Source Grafana repository, as well as in our Amazon Managed Grafana service. We also published a default in-depth operational dashboard to take advantage of this feature.

Redshift makes it possible for customers to analyze all of their data

Redshift gives customers the best of both data lakes and purpose-built data stores, such as databases and data warehouses. It enables customers to store any amount of data, at low cost, and in open, standards-based data formats such as parquet and JSON in data lakes, and run SQL queries against it without loading or transformations. Furthermore, it lets customers run complex analytic queries with high performance against terabytes to petabytes of structured and semi-structured data, using sophisticated query optimization, columnar storage on high-performance storage, and massively parallel query execution. Redshift lets customers access live data from the transactional databases as part of their business intelligence (BI) and reporting applications to enable operational analytics. Customers can break down data silos by seamlessly querying data in the data lakes, data warehouses, and databases; empower their teams to run analytics and ML using their preferred tool or technique; and manage who has access to data with the proper security and data governance controls. We launched new features in 2021, such as Data Sharing, AWS Data Exchange integration, and Redshift ML, to make it easier for customers to analyze all of their data.

Amazon Redshift data sharing lets customers extend the ease of use, performance, and cost benefits that Amazon Redshift offers in a single cluster to multi-cluster deployments while being able to share data. It enables instant, granular, and fast data access across Amazon Redshift clusters without the need to copy or move data around. Data sharing provides live access to data so that your users always see the most up-to-date and consistent information as it’s updated in the data warehouse. Customers can securely share live data with Amazon Redshift clusters in the same or different AWS accounts within the same region or across regions. Data sharing features several performance enhancements, including result caching and concurrency scaling, which allow customers to support a broader set of analytics applications and meet critical performance SLAs when querying shared data. Customers can use data sharing for use cases such as workload isolation and offer chargeability, as well as provide secure and governed collaboration within and across teams and external parties.

Customers also asked us to help them with internal or external data marketplaces so that they can enable use cases such as data as a service and onboard 3rd-party data. We launched the public preview of AWS Data Exchange for Amazon Redshift, a new feature that enables customers to find and subscribe to third-party data in AWS Data Exchange that they can query in an Amazon Redshift data warehouse in minutes. Data providers can list and offer products containing Amazon Redshift data sets in the AWS Data Exchange catalog, granting subscribers direct, read-only access to the data stored in Amazon Redshift. This feature empowers customers to quickly query, analyze, and build applications with these third-party data sets. AWS Data Exchange for Amazon Redshift lets customers combine third-party data found on AWS Data Exchange with their own first-party data in their Amazon Redshift cloud data warehouse, with no ETL required. Since customers are directly querying provider data warehouses, they can be certain that they are using the latest data being offered. Additionally, entitlement, billing, and payment management are all automated: access to Amazon Redshift data is granted when a data subscription starts and is removed when it ends, invoices are automatically generated, and payments are automatically collected and disbursed through AWS Marketplace.

Customers also asked for our help to make it easy to train and deploy ML models such as prediction, natural language processing, object detection, and image classification directly on top of the data in purpose-built data stores without having to perform complex data movement or learn new tools. We launched Redshift ML earlier this year to enable customers to create, train, and deploy ML models using familiar SQL commands. Amazon Redshift ML lets customers leverage Amazon SageMaker, a fully managed ML service, without moving their data or learning new skills. Furthermore, Amazon Redshift ML powered by Amazon SageMaker lets customers use SQL statements to create and train ML models from their data in Amazon Redshift, and then use these models for use cases such as churn prediction and fraud risk scoring directly in their queries and reports. Amazon Redshift ML automatically discovers the best model and tunes it based on training data using Amazon SageMaker Autopilot. SageMaker Autopilot chooses between regression, binary, or multi-class classification models. Alternatively, customers can choose a specific model type such as Xtreme Gradient Boosted tree (XGBoost) or multilayer perceptron (MLP), a problem type like regression or classification, and preprocessors or hyperparameters. Amazon Redshift ML uses customer parameters to build, train, and deploy the model in the Amazon Redshift data warehouse. Customers can obtain predictions from these trained models using SQL queries as if they were invoking a user defined function (UDF), and leverage all of the benefits of Amazon Redshift, including massively parallel processing capabilities. Customers can also import their pre-trained SageMaker Autopilot, XGBoost, or MLP models into their Amazon Redshift cluster for local inference. Redshift ML supports both supervised and unsupervised ML for advanced analytics use cases ranging from forecasting to personalization.

Customers want to combine live data from operational databases with the data in Amazon Redshift data warehouse and the data in Amazon S3 data lake environment to get unified analytics views across all of the data in the enterprise. We launched Amazon Redshift federated query to let customers incorporate live data from the transactional databases as part of their BI and reporting applications to enable operational analytics. The intelligent optimizer in Amazon Redshift pushes down and distributes a portion of the computation directly into the remote operational databases to help speed up performance by reducing data moved over the network. Amazon Redshift complements subsequent execution of the query by leveraging its massively parallel processing capabilities for further speed up. Federated query also makes it easier to ingest data into Amazon Redshift by letting customers query operational databases directly, applying transformations on the fly, and loading data into the target tables without requiring complex ETL pipelines. In 2021, we added support for Amazon Aurora MySQL and Amazon RDS for MySQL databases in addition to the existing Amazon Aurora PostgreSQL and Amazon RDS for PostgreSQL databases for federated query to enable customers to access more data sources for richer analytics.

Finally in our analyze all your data pillar in 2021, we added data types such as SUPER, GEOGRAPHY, and VARBYTE to enable customers to store semi-structured data natively in the Redshift data warehouse so that they can analyze all of their data at scale and with performance. The SUPER data type lets customers ingest and store JSON and semi-structured data in their Amazon Redshift data warehouses. Amazon Redshift also includes support for PartiQL for SQL-compatible access to relational, semi-structured, and nested data. Using the SUPER data type and PartiQL in Amazon Redshift, customers can perform advanced analytics that combine classic structured SQL data (such as string, numeric, and timestamp) with the semi-structured SUPER data (such as JSON) with superior performance, flexibility, and ease-of-use. The GEOGRAPHY data type builds on Redshift’s support of spatial analytics, opening-up support for many more third-party spatial and GIS applications. Moreover, it adds to the GEOMETRY data type and over 70 spatial functions that are already available in Redshift. The GEOGRAPHY data type is used in queries requiring higher precision results for spatial data with geographic features that can be represented with a spheroid model of the Earth and referenced using latitude and longitude as a spatial coordinate system. VARBYTE is a variable size data type for storing and representing variable-length binary strings.

Redshift delivers performance at any scale

Since we announced Amazon Redshift in 2012, performance at any scale has been a foundational tenet for us to deliver value to tens of thousands of customers who trust us every day to gain business insights from their data. Our customers span all industries and sizes, from startups to Fortune 500 companies, and we work to deliver the best price performance for any use case. Over the years, we have launched features such as dynamically adding cluster capacity when you need it with concurrency scaling, making sure that you use cluster resources efficiently with automatic workload management (WLM), and automatically adjusting data layout, distribution keys, and query plans to provide optimal performance for a given workload. In 2021, we launched capabilities such as AQUA, concurrency scaling for writes, and further enhancements to RA3 nodes to continue to improve Redshift’ price performance.

We introduced the RA3 node types in 2019 as a technology that allows the independent scaling of compute and storage. We also described how customers, including Codeacademy, OpenVault, Yelp, and Nielsen, have taken advantage of Amazon Redshift RA3 nodes with managed storage to scale their cloud data warehouses and reduce costs. RA3 leverages Redshift Managed Storage (RMS) as its durable storage layer which allows near-unlimited storage capacity where data is committed back to Amazon S3. This enabled new capabilities, such as Data Sharing and AQUA, where RMS is used as a shared storage across multiple clusters. RA3 nodes are available in three sizes (16XL, 4XL, and XLPlus) to balance price/performance. In 2021, we launched single node RA3 XLPlus clusters to help customers cost-effectively migrate their smaller data warehouse workloads to RA3s and take advantage of better price performance. We also introduced a self-service DS2 to RA3 RI migration capability that lets RIs be converted at a flat cost between equivalent node types.

AQUA (Advanced Query Accelerator) for Amazon Redshift is a new distributed and hardware-accelerated cache that enables Amazon Redshift to run an order of magnitude faster than other enterprise cloud data warehouses by automatically boosting certain query types. AQUA uses AWS-designed processors with AWS Nitro chips adapted to speed up data encryption and compression, and custom analytics processors, implemented in FPGAs, to accelerate operations such as scans, filtering, and aggregation. AQUA is available with the RA3.16xlarge, RA3.4xlarge, or RA3.xlplus nodes at no additional charge and requires no code changes.

Concurrency Scaling was launched in 2019 to handle spiky and unpredictable read workloads without having to pre-provision any capacity. Redshift offers one hour of free Concurrency Scaling for every 24 hours of usage that your main cluster is running. It also offers cost controls to monitor and limit your usage and associated costs for Concurrency Scaling. In addition to read queries, supporting write queries has been a big ask from customers to support ETL workloads. In 2021, we launched Redshift Concurrency Scaling write queries support in preview with common operations such as INSERT, DELETE, UPDATE, and COPY to handle unpredictable spikes in ETL workloads. If you are currently using Concurrency Scaling, this new capability is automatically enabled in your cluster. You can monitor your Concurrency Scaling usage using the Amazon Redshift Console and get alerts on any usage exceeding your defined limits. You can also create, modify, and delete usage limits programmatically by using the AWS Command Line Interface (CLI) and AWS API.

Finally we continue to ensure that AWS has comprehensive security capabilities to satisfy the most demanding requirements, and Amazon Redshift continues to provides data security out-of-the-box at no extra cost. We introduced new security features in 2021, such as cross-VPC support and default IAM roles, to continue to make Redshift more secure for customer workloads.

Summary

When it comes to making it easier, simpler, and faster for customers to analyze all of their data, velocity matters and we are innovating at a rapid pace to bring new capabilities to Redshift. We continue to make Redshift features available in more AWS regions worldwide to make sure that all customers have access to all capabilities. We have covered the key features above and the complete list is available here. We look forward to how you will use some of these capabilities to continue innovating with data and analytics.


About the Author

Manan Goel is a Product Go-To-Market Leader for AWS Analytics Services including Amazon Redshift & AQUA at AWS. He has more than 25 years of experience and is well versed with databases, data warehousing, business intelligence, and analytics. Manan holds a MBA from Duke University and a BS in Electronics & Communications engineering.

[$] Lessons from Log4j

Post Syndicated from original https://lwn.net/Articles/878570/rss

By now, most readers will likely have seen something about the Log4j
vulnerability
that has been making life miserable for system administrators
since its disclosure on December 9. This bug is relatively easy to
exploit, results in remote code execution, and lurks on servers all across
the net; it is not hyperbolic to call it one of the worst vulnerabilities
that has been disclosed in some years. In a sense, the lessons from Log4j
have little new to teach us, but this bug does highlight some problems in
the free-software ecosystem in an unambiguous way.

NAS and the Hybrid Cloud

Post Syndicated from Molly Clancy original https://www.backblaze.com/blog/nas-and-the-hybrid-cloud/

illustration of a NAS device and cloud storage

Upgrading to network attached storage (NAS) can be a game changer for your business. When you invest in NAS, you get easier collaboration, faster restores, 24/7 file availability, and added redundancy. But you can get an even bigger return on your investment by pairing it with cloud storage. When you combine NAS with a trusted cloud storage provider in a hybrid cloud strategy, you gain access to features that complement the security of your data and your ability to share files both locally and remotely.

In this post, we’ll look at how you can achieve a hybrid cloud strategy with NAS and cloud storage.

What Is Hybrid Cloud?

A hybrid cloud strategy uses a private cloud and public cloud in combination. To expand on that a bit, we can say that the hybrid cloud refers to a cloud environment made up of a mixture of typically on-premises, private cloud resources combined with third-party public cloud resources that use some kind of orchestration between them. A private cloud doesn’t necessarily need to live on-premises—some companies rent space in a data center to host the infrastructure for their private cloud—the important defining factor is that a private cloud is dedicated to only one “tenant” or organization.

illustration of hybrid cloud - private cloud sending data to public cloud
A hybrid cloud strategy combines a private cloud with a public cloud.

In this case, your NAS device serves as the on-premises private cloud, as it’s dedicated to only you or your organization, and then you connect it to the public cloud.

What Are the Benefits of Hybrid Cloud?

A hybrid cloud model offers a number of benefits, including:

  • Off-site backup protection.
  • Added security features.
  • Remote sync capabilities.
  • Flexibility and cost savings.

Hybrid Cloud Benefit 1: Off-site Backup Protection

To start with, cloud storage provides off-site backup protection. This aligns your NAS setup with the industry standard for data protection: a 3-2-1 backup strategy—which ensures that you have three copies of your data on two different media (read: devices) with one stored off-site. When using NAS and the cloud in a hybrid strategy, you have three copies of your data—the source data and two backups. One of those backups lives on your NAS and one is stored off-site in the cloud. In the event of data loss, you can restore your systems directly from the cloud even if all the systems in your office are knocked out or destroyed.

Hybrid Cloud Benefit 2: Added Security Features

Data sent to the cloud is encrypted in-flight via SSL, and you can also encrypt your backups so that they are only openable with your team’s encryption key. The cloud can also give you advanced storage options for your backup files, like Object Lock. Object Lock allows you to store data using a Write Once, Read Many (WORM) model. Once you set Object Lock and the retention timeframe, your data stored with Object Lock is unchangeable for a defined period of time. You can also set custom data lifecycle rules at the bucket level to help match your ideal backup workflow.

Hybrid Cloud Benefit 3: Remote Sync Capabilities

Cloud storage provides valuable access to your data and documents from your NAS through sync capabilities. In case anyone on your team needs to access a file when they are away from the office, or as is more common now, when your entire team is working from home, they’ll be able to access the files that have been synced to the cloud through your NAS’s secure sync program. You can even sync across multiple locations using the cloud as a two-way sync to quickly replicate data across locations. For employees collaborating remotely, this helps to ensure they’re not waiting on the internet to deliver critical files: They’re already on-site.

What’s the Difference Between Cloud Sync, Cloud Backup, and Cloud Storage?

Sync services allow multiple users across multiple devices to access the same file. Backup stores a copy of those files somewhere remote from your work environment, usually in an off-site server—like cloud storage. It’s important to know that a “sync” is not a backup, but they can work well together when properly coordinated.

Hybrid Cloud Benefit 4: Flexibility and Cost Savings

Additionally, two of the biggest advantages of the hybrid cloud are flexibility and cost savings. Provisioning an additional device to store backups and physically separating it from your production data is time consuming and costly. The cloud eliminates the need to provision and maintain additional hardware while keeping your data protected with a 3-2-1 strategy, and it can be scaled up or down flexibly as needed.

With NAS on-site for fast, local access combined with the cloud for off-site backups and storage of less frequently used files, you get the best of both worlds.

How to Set Up a Hybrid Cloud With NAS

Some cloud providers are already integrated with NAS systems. (Backblaze B2 Cloud Storage is integrated with NAS systems from Synology and QNAP, for example.) Check if your preferred NAS system is already integrated with a cloud storage provider to ensure setting up cloud backup, storage, and sync is as easy as possible.

Your NAS should come with a built-in backup manager, like Hyper Backup from Synology or Hybrid Backup Sync from QNAP. Once you download and install the appropriate backup manager app, you can configure it to send backups to your preferred cloud provider. You can also fine-tune the behavior of the backup jobs, including what gets backed up and how often.

Now, you can send backups to the cloud as a third, off-site backup and use your cloud instance to access files anywhere in the world with an internet connection.

Wondering If NAS Is Right for You?

Our Complete NAS Guide provides comprehensive information on NAS and what it can do for your business, how to evaluate and purchase a NAS system, and how to deploy your NAS. Download the guide today for more on all things NAS.

The post NAS and the Hybrid Cloud appeared first on Backblaze Blog | Cloud Storage & Cloud Backup.

More Log4j News

Post Syndicated from Bruce Schneier original https://www.schneier.com/blog/archives/2021/12/more-log4j-news.html

Log4j is being exploited by all sorts of attackers, all over the Internet:

At that point it was reported that there were over 100 attempts to exploit the vulnerability every minute. “Since we started to implement our protection we prevented over 1,272,000 attempts to allocate the vulnerability, over 46% of those attempts were made by known malicious groups,” said cybersecurity company Check Point.

And according to Check Point, attackers have now attempted to exploit the flaw on over 40% of global networks.

And a second vulnerability was found, in the patch for the first vulnerability. This is likely not to be the last.

The collective thoughts of the interwebz