Post Syndicated from original https://lwn.net/Articles/890577/
The LWN.net Weekly Edition for April 14, 2022 is available.
Post Syndicated from original https://lwn.net/Articles/890577/
The LWN.net Weekly Edition for April 14, 2022 is available.
Post Syndicated from original https://lwn.net/Articles/891082/
Using strings with contents that are supplied by users can be fraught with
peril; SQL injection is a well-known technique for attacking applications
that stems from that, for example. Generally, database frameworks and
libraries provide mechanisms that seek to lead programmers toward doing The
Right Thing, with parameterized queries and the like, but they cannot
enforce that—inventive developers will seemingly always find ways to inject
user input into places it should not go. A recently adopted Python
Enhancement Proposal (PEP) provides a way to enforce the use of
strings that are untainted by user input, but it uses the optional typing features
of the language to do so; those wanting to take advantage of it will need
to be running a type-checking program.
Post Syndicated from original https://www.backblaze.com/blog/share-conversion-and-founder-selling-plan/
Over the past 15 years, Backblaze has established a track record of transparency by sharing everything we can about our work, from publishing our Drive Stats to exploring how we grew our business. After becoming a publicly traded company this past November, we now have a whole new set of opportunities to maintain our commitment to transparency.
Today, I wanted to share in-depth information about a few things we just did and plan to do: In short, the Backblaze founders converted some of our company shares to make them available for sale via 10b5-1 automatic trading plans that were adopted back in February. These plans arrange for automatic sales to occur each trading day over the next 12 months. Importantly, the founders have aligned to each sell the same number of shares and, following the sales from these 10b5-1 plans, would each still hold over 80% of their current shares and jointly continue to hold the majority of the voting control. (If you’re not familiar with some of those terms or concepts, don’t worry, they’re new to many of us, too. We’ll explain in greater detail below.)
Why share this information today? Partially because we’re required to in other channels: When management converts shares from Class B to Class A, a Form 4 must be filed with the Securities and Exchange Commission (SEC). These filings are then typically picked up by financial reporting bots and further shared across financial media to inform shareholders.
But what we are sharing here goes beyond the SEC requirements. We’re doing so because of our commitment to transparency and to provide an easier to grasp (hopefully) explanation of the news.
When the sales under the 10b5-1 plans are summed up at the end of the 12 month period, this should be a relatively minor transaction. But we’re aware of the potential perception of founding members selling shares, so we wanted to explain our motivations and their implications more plainly here:
From the outside, SEC regulations and financial mechanisms can seem overly complicated and, when read in regulatory filings, somewhat gloomy. But the story here is simple: The other founders and I remain committed to the long-term success of Backblaze. We would also like to realize some of our very long-term investment as we do so. Hopefully the information we’ve shared here helps clarify the picture for you.
If you’d like to dig deeper, you can always access our company filings at https://ir.backblaze.com or in the EDGAR filings database on the SEC website, sec.gov. If you’re an investor and you’d like to ask any questions about the information above or any other topics, you can submit questions about our next earnings beginning one week prior to our call; watch for a forthcoming press release on this topic.
The post Share Conversion and Founder Selling Plan appeared first on Backblaze Blog | Cloud Storage & Cloud Backup.
Post Syndicated from original https://lwn.net/Articles/891248/
The 5.17.3,
5.16.20,
5.15.34, and
5.10.111 stable kernel updates have been
released after a relatively quick review cycle. Each contains a relatively
large set of important fixes. Note that 5.16.20 is the final update in the
5.16.x series.
Post Syndicated from Noritaka Sekiyama original https://aws.amazon.com/blogs/big-data/best-practices-to-optimize-data-access-performance-from-amazon-emr-and-aws-glue-to-amazon-s3/
Customers are increasingly building data lakes to store data at massive scale in the cloud. It’s common to use distributed computing engines, cloud-native databases, and data warehouses when you want to process and analyze your data in data lakes. Amazon EMR and AWS Glue are two key services you can use for such use cases. Amazon EMR is a managed big data framework that supports several different applications, including Apache Spark, Apache Hive, Presto, Trino, and Apache HBase. AWS Glue Spark jobs run on top of Apache Spark, and distribute data processing workloads in parallel to perform extract, transform, and load (ETL) jobs to enrich, denormalize, mask, and tokenize data on a massive scale.
For data lake storage, customers typically use Amazon Simple Storage Service (Amazon S3) because it’s secure, scalable, durable, and highly available. Amazon S3 is designed for 11 9’s of durability and stores over 200 trillion objects for millions of applications around the world, making it the ideal storage destination for your data lake. Amazon S3 averages over 100 million operations per second, so your applications can easily achieve high request rates when using Amazon S3 as your data lake.
This post describes best practices to achieve the performance scaling you need when analyzing data in Amazon S3 using Amazon EMR and AWS Glue. We specifically focus on optimizing for Apache Spark on Amazon EMR and AWS Glue Spark jobs.
Amazon S3 is a very large distributed system, and you can scale to thousands of transactions per second in request performance when your applications read and write data to Amazon S3. Amazon S3 performance isn’t defined per bucket, but per prefix in a bucket. Your applications can achieve at least 3,500 PUT/COPY/POST/DELETE or 5,500 GET/HEAD requests per second per prefix in a bucket. Additionally, there are no limits to the number of prefixes in a bucket, so you can horizontally scale your read or write performance using parallelization. For example, if you create 10 prefixes in an S3 bucket to parallelize reads, you could scale your read performance to 55,000 read requests per second. You can similarly scale writes by writing data across multiple prefixes.
You can scale performance by utilizing automatic scaling in Amazon S3 and scan millions of objects for queries run over petabytes of data. Amazon S3 automatically scales in response to sustained new request rates, dynamically optimizing performance. While Amazon S3 is internally optimizing for a new request rate, you receive HTTP 503 request responses temporarily until the optimization completes:
Such situations require the application to retry momentarily, but after Amazon S3 internally optimizes performance for the new request rate, all requests are generally served without retries. One such situation is when multiple workers in distributed compute engines such as Amazon EMR and AWS Glue momentarily generate a high number of requests to access data under the same prefix.
When using Amazon EMR and AWS Glue to process data in Amazon S3, you can employ certain best practices to manage request traffic and avoid HTTP Slow Down errors. Let’s look at some of these strategies.
You can use the following approaches to take advantage of the horizontal scaling capability in Amazon S3 and improve the success rate of your requests when accessing Amazon S3 data using Amazon EMR and AWS Glue:
We recommend choosing and applying the options that fit best for your use case to optimize data processing on Amazon S3. In the following sections, we describe best practices of each approach.
This is the easiest way to avoid HTTP 503 Slow Down responses and improve the success rate of your requests. To access Amazon S3 data, both Amazon EMR and AWS Glue use the EMR File System (EMRFS), which retries Amazon S3 requests with jitters when it receives 503 Slow Down responses. To improve the success rate of your Amazon S3 requests, you can adjust your retry strategy by configuring certain properties. In Amazon EMR, you can configure parameters in your emrfs-site configuration. In AWS Glue, you can configure the parameters in job parameters. You can adjust your retry strategy in the following ways:
fs.s3.maxRetries parameter. Note that you may experience longer job duration if you set a higher value for this parameter. We recommend experimenting with different values, such as 20 as a starting point, confirm the duration overhead of the jobs for each value, and then adjust this parameter based on your requirement.fs.s3.aimd.enabled property to true. You can further refine the AIMD retry strategy using the advanced AIMD retry settings.Another approach is to adjust the number of Amazon S3 objects processed so you have fewer requests made concurrently. When you lower the number of objects to be processed in a job, you use fewer Amazon S3 requests, thereby lowering the request rate or transactions per second (TPS) required for each job. Note the following considerations:
To adjust the number of Amazon S3 requests to have fewer concurrent reads per prefix, you can configure Spark parameters. By default, Spark populates 10,000 tasks to list prefixes when creating Spark DataFrames. You may experience Slow Down responses, especially when you read from a table with highly nested prefix structures. In this case, it’s a good idea to configure Spark to limit the number of maximum listing parallelism by decreasing the parameter spark.sql.sources.parallelPartitionDiscovery.parallelism (the default is 10000).
To have fewer concurrent write requests per prefix, you can use the following techniques:
df.repartition(n) or df.coalesce(n) in DataFrames. For Spark SQL, you can also use query hints like REPARTITION or COALESCE. You can see the number of tasks (=RDD partitions) on the Spark UI.--enable-s3-parquet-optimized-committer. The committer uses Amazon S3 multipart uploads instead of renaming files, and it usually reduces the number of HEAD/LIST requests significantly.The following are other techniques to adjust the Amazon S3 request rate in Amazon EMR and AWS Glue. These options have the net effect of reducing parallelism of the Spark job, thereby reducing the probability of Amazon S3 Slow Down responses, although it can lead to longer job duration. We recommend testing and adjusting these values for your use case.
spark-submit option --num-executors and Spark parameter spark.executor.instance).NumberOfWorkers parameter.WorkerType parameter to a smaller one (for example, G.2X to G.1X).spark.default.parallelism.spark.sql.shuffle.partitions.spark.task.cpus (the default is 1) to allocate more CPU cores per Spark task.In this post, we described the best practices to optimize data access from Amazon EMR and AWS Glue to Amazon S3. With these best practices, you can easily run Amazon EMR and AWS Glue jobs by taking advantage of Amazon S3 horizontal scaling, and process data in a highly distributed way at a massive scale.
For further guidance, please reach out to AWS Premium Support.
To monitor Amazon S3 requests, you can enable request metrics in Amazon CloudWatch for the bucket. Then, define a filter for the prefix. For a list of useful metrics to monitor, see Monitoring metrics with Amazon CloudWatch. After you enable metrics, use the data in the metrics to determine which of the aforementioned options is best for your use case.
To configure Spark parameters in Amazon EMR, there are several options:
--conf option.SparkConf object in the job script codes.To configure Spark parameters in AWS Glue, you can configure AWS Glue job parameters using key --conf with value like spark.hadoop.fs.s3.maxRetries=50.
To set multiple configs, configure your job parameters using key --conf with value like spark.hadoop.fs.s3.maxRetries=50 --conf spark.task.cpus=2.
 Noritaka Sekiyama is a Principal Big Data Architect on the AWS Glue team. He is passionate about releasing AWS Glue connector custom blueprints and other software artifacts to help customers build their data lakes. In his spare time, he enjoys watching hermit crabs with his children.
 Aditya Kalyanakrishnan is a Senior Product Manager on the Amazon S3 team at AWS. He enjoys learning from customers about how they use Amazon S3 and helping them scale performance. Adi’s based in Seattle, and in his spare time enjoys hiking and occasionally brewing beer.
Post Syndicated from Samson Lee original https://aws.amazon.com/blogs/big-data/build-a-data-pipeline-to-automatically-discover-and-mask-pii-data-with-aws-glue-databrew/
Personally identifiable information (PII) data handling is a common requirement when operating a data lake at scale. Businesses often need to mitigate the risk of exposing PII data to the data science team while not hindering the productivity of the team to get to the data they need in order to generate valuable data insights. However, there are challenges in striking the right balance between data governance and agility:
To help overcome these challenges, we can build a data pipeline that automatically scans data upon its arrival to the data lake, then further masks the portion of data that is labeled as PII data. Automating the PII data scanning and masking tasks helps prevent human actors processing the data while the PII data is still presented in plain text, yet still provides data consumers timely access to the newly arrived dataset.
To build a data pipeline that can automatically handle PII data, you can use AWS Glue DataBrew. DataBrew is a no-code data preparation tool with pre-built transformations to automate data preparation tasks. It natively supports PII data identification, entity detection, and PII data handling features. In addition to its visual interface for no-code data preparation, it offers APIs to let you orchestrate the creation and running of DataBrew profile jobs and recipe jobs.
In this post, we illustrate how you can orchestrate DataBrew jobs with AWS Step Functions to build a data pipeline to handle PII data. The pipeline is triggered by Amazon Simple Storage Service (Amazon S3) event notifications sent to Amazon EventBridge whenever there is a new data object lands in a S3 bucket. We also include an AWS CloudFormation template for you to deploy as a reference.
The following diagram describes the solution architecture.

The solution includes a S3 bucket as the data input bucket and another S3 bucket as the data output bucket. Data uploaded to the data input bucket sends an event to EventBridge to trigger the data pipeline. The pipeline is composed of a Step Functions state machine, DataBrew jobs, and an AWS Lambda function used for reading the results of the DataBrew profile job.
The solution workflow includes the following steps:
TXlTZWNyZXQ=) stored in AWS Secrets Manager to hash the PII columns.To deploy the solution, you should have the following prerequisites:
To deploy the solution using the CloudFormation template, complete the following steps.

us-east-1).automate-pii-handling-data-pipeline).80) to indicate the desired percentage of records the DataBrew profile job must identify as PII data in a given column, so that the data in the column is further hashed by the subsequent DataBrew PII recipe job.
The CloudFormation stack creation process takes around 3-4 minutes to complete.
To test the data pipeline, you can download the sample synthetic data generated by Mockaroo. The dataset contains synthetic PII fields such as email, contact number, and credit card number.

The sample data contains columns of PII data as an illustration; you can use DataBrew to detect PII values down to the cell level.
AmazonS3BucketForGlueDataBrewDataInput to navigate to the S3 bucket created for DataBrew data input.


AWSStepFunctionsStateMachine.
Running state.

While we’re waiting for the steps to complete, let’s explain more of how this data pipeline is built. The following figure is the detailed workflow of the Step Functions state machine.

The key step in the state machine is the Lambda function used to parse the DataBrew profile job result. The following code is a snippet of the profile job result in JSON format:
Inside columns, each column object has the property entity if it’s detected to be a column containing PII data. rowsCount inside entity tells us how many rows out of the total sample are identified as PII, followed by entityTypes to indicate the type of PII identified.
The following is the Python code used in the Lambda function:
To summarize what the logic of the Lambda function is, a for-loop is implemented to aggregate a list of column names, in which the ratio of PII rows over the total sample size of that column is larger than or equal to the threshold value set earlier in the CloudFormation stack creation step. The Lambda function returns the list of column names to the Step Functions state machine to author a DataBrew recipe that masks only the columns in the returned list, instead of all the columns of the dataset. This way, we retain the content of non-PII columns for the data consumer while not exposing the PII data in plain text.

We use CRYPTOGRAPHIC_HASH in this solution for the Operation parameter of the DataBrew CreateRecipe step. Because the profile job result and threshold value have already been used to determine which columns contain PII data to mask, the recipe step doesn’t include the parameter entityTypeFilter to enforce all rows of the columns getting hashed. Otherwise, some rows in the column might not be hashed by the operation if the particular rows of data are not identified by DataBrew as PII.
If your dataset potentially contains free-text columns such as doctor notes and email body, it would be beneficial to include the parameter entityTypeFilter in an additional recipe step to handle the free-text columns. For more information, refer to the values supported for this parameter.
To customize the solution further, you can also choose other PII recipe steps available from DataBrew to mask, replace, or transform the data in approaches best suited for your use cases.
After a deeper dive into the solution components, let’s check if all the steps in the Step Functions state machine are complete and review the results.

spoken_language wouldn’t be included in the PII data masking step because only 14% of the rows were identified as a name of a person.

.json file, which is the data profile result you just reviewed in JSON format. There is also a folder path that contains the data output of the PII data masking task.


full_name, email_address, and contact_phone_number) have been masked. Congratulations! You have successfully produced a dataset from a data pipeline that detects and masks PII data automatically.To avoid incurring future charges, delete the resources you created as part of this post.
On the AWS CloudFormation console, delete the stack you created (default name is automate-pii-handling-data-pipeline).
In this post, you learned how to build a data pipeline that automatically detects PII data and masks the data accordingly when a new data file arrives in an S3 bucket. With DataBrew profile jobs, you can develop logics with low code to run automatically on the profile results. For this post, our job determined which columns to mask. You can also author the DataBrew recipe job in an automated approach, which helps limit occasions when human actors can access the PII data while it’s still in plain text.
You can learn more about this solution and the source code by visiting the GitHub repository. To learn more about what DataBrew can do in handling PII data, refer to Introducing PII data identification and handling using AWS Glue DataBrew and Personally identifiable information (PII) recipe steps.

Samson Lee is a Solutions Architect with a focus on the data analytics domain. He works with customers to build enterprise data platforms, discovering and designing solutions on AI/ML use cases. Samson also enjoys coffee and wine tasting outside of work.
Post Syndicated from Rapid7 original https://blog.rapid7.com/2022/04/13/security-nation-kate-stewart-on-open-source-projects-at-the-linux-foundation/

In this episode of Security Nation, Jen and Tod chat with Kate Stewart, VP of Dependable Embedded Systems at the Linux Foundation, about the open-source security projects she’s working on, including the Zephyr project. They chat about strategies for dealing with bugs and vulnerabilities in today’s complex tech landscape, including the much talked-about software bill of materials (SBOM), so we can reap the benefits of open source while avoiding the downsides as much as possible.
Stick around for our Rapid Rundown, where Tod and Jen talk about a recent piece of news in the open-source community: A developer used the “event-source-polyfill” npm package to write a piece of “protestware” decrying Russia’s aggression in Ukraine. They also pay homage to healthcare cybersecurity stalwart Mike Murray, who recently passed away.

Kate Stewart works with the safety, security, and license compliance communities to advance the adoption of best practices into embedded open-source projects. With over 30 years of experience in the software industry, she has held a variety of roles and worked as a developer in Canada, Australia, and the US and for the last 20 years has managed international software development teams and activities. Kate was one of the founders of SPDX and is currently the specification coordinator. She is also the co-lead for the NTIA SBOM formats and tooling working group. Since joining The Linux Foundation, she has launched the ELISA and Zephyr Projects among others, as well as supporting other embedded projects.
Interview links
Rapid Rundown links
Like the show? Want to keep Jen and Tod in the podcasting business? Feel free to rate and review with your favorite podcast purveyor, like Apple Podcasts.
Post Syndicated from Jeff Barr original https://aws.amazon.com/blogs/aws/amazon-fsx-for-netapp-ontap-update-new-single-az-deployment-type/
Last year I told you about Amazon FSx for NetApp ONTAP and showed you how you can create a file system in minutes with just a couple of clicks. You can use these high-performance, scalable (up to 176 PiB) file systems to migrate your on-premises applications to the cloud and to build new, cloud-native applications. As I noted in my original post, your file systems can have up to 192 TiB of fast, SSD-based primary storage, and many pebibytes of cost-optimized capacity pool storage. Your file systems also support many of ONTAP’s unique features including multi-protocol (NFS, SMB, and iSCSI) access, built-in deduplication & compression, cloning, and replication.
We launched Amazon FSx for NetApp ONTAP with a Multi-AZ deployment type that has AWS infrastructure in a pair of Availability Zones in the same AWS region, data replication between them, and automated failover/failback that is typically complete within seconds. This option has a 99.99% SLA (Service Level Agreement) for availability, and is suitable for hosting the most demanding storage workloads.
New Deployment Type
Today we are launching a new single-AZ deployment type that is designed to provide high availability and durability within an AZ, at a level similar to an on-premises file system. It is a great fit for many use cases including dev & test workloads, disaster recovery, and applications that manage their own replication. It is also a great for storing secondary copies of data that is stored elsewhere (either on-premises or AWS), or for data that can be recomputed if necessary.
The AWS infrastructure powering each single-AZ file system resides in separate fault domains within a single Availability Zone. As is the case with the multi-AZ option, the infrastructure is monitored and replaced automatically, and failover typically completes within seconds.
This new deployment type offers the same ease of use and data management capabilities as the multi-AZ option, with 50% lower storage costs and 40% lower throughput costs. File operations deliver sub-millisecond latency for SSD storage and tens of milliseconds for capacity pool storage, at up to hundreds of thousands of IOPS.
Creating a Single-AZ File System
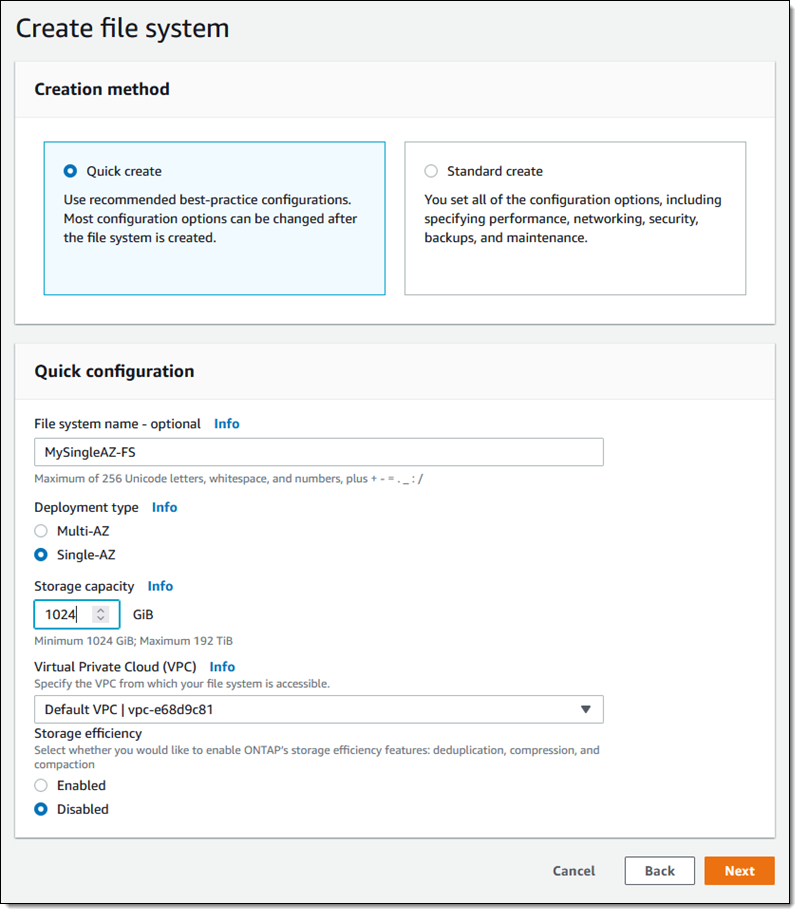
I can create a single-AZ NetApp ONTAP file system using the Amazon FSx Console, the CLI (aws fsx create-file-system), or the Amazon FSx CreateFileSystem API function. From the console I click Create file system, select Amazon FSx for NetApp ONTAP, and enter a name. Then I select the Single-AZ deployment type, indicate the desired amount of storage, and click Next:
On the next page I review and confirm my choices, and then click Create file system. The file system Status starts out as Creating, then transitions to Available within 20 minutes or so, as detailed in my original post.
Depending on my architecture and use case, I can access my new file system in several different ways. I can simply mount it to an EC2 instance running in the same VPC. I can also access it from another VPC in the same region or in a different region across a peered (VPC or Transit Gateway) connection, and from my on-premises clients using AWS Direct Connect or AWS VPN.
Things to Know
Here are a couple of things to know:
Regions – The new deployment type is available in all regions where FSx for ONTAP is already available.
Pricing – Pricing is based on the same billing dimensions as the multi-AZ deployment type; see the Amazon FSx for NetApp Pricing page for more information.
Available Now
The new deployment type is available now and you can start using it today!
— Jeff;
Post Syndicated from Николай Марченко original https://bivol.bg/%D0%B1%D0%B5%D0%B7%D0%B4%D0%B5%D0%B9%D1%81%D1%82%D0%B2%D0%B8%D0%B5-%D0%B8-%D0%BB%D0%B8%D0%BF%D1%81%D0%B0-%D0%BD%D0%B0-%D0%BE%D1%82%D0%B3%D0%BE%D0%B2%D0%BE%D1%80%D0%B8-%D0%B8%D0%B2.html

Главният прокурор Иван Гешев е обещал на делегацията на Европарламента от Комисията по бюджетен контрол резултати по казуса Барселона Гейт до 10 – 15 дни. Това обявиха пред „Биволъ“ евродепутатите…
Post Syndicated from Talks at Google original https://www.youtube.com/watch?v=lisRnNr8N9o
Post Syndicated from Jeremy Ber original https://aws.amazon.com/blogs/big-data/query-your-data-streams-interactively-using-kinesis-data-analytics-studio-and-python/
Amazon Kinesis Data Analytics Studio makes it easy for customers to analyze streaming data in real time, as well as build stream processing applications powered by Apache Flink using standard SQL, Python, and Scala. Just a few clicks in the AWS Management console lets customers launch a serverless notebook to query data streams and get results in seconds. Kinesis Data Analytics reduces the complexity of building and managing Apache Flink applications. Apache Flink is an open-source framework and engine for processing data streams. It’s highly available and scalable, and it delivers high throughput and low latency for stream processing applications.
Customers running Apache Flink workloads face the non-trivial challenge of developing their distributed stream processing applications without having true visibility into the steps conducted by their application for data processing. Kinesis Data Analytics Studio combines the ease-of-use of Apache Zeppelin notebooks, with the power of the Apache Flink processing engine, to provide advanced streaming analytics capabilities in a fully-managed offering. Furthermore, it accelerates developing and running stream processing applications that continuously generate real-time insights.
In this post, we will introduce you to Kinesis Data Analytics Studio and get started querying data interactively from an Amazon Kinesis Data Stream using the Python API for Apache Flink (Pyflink). We will use a Kinesis Data Stream for this example, as it is the quickest way to begin. Kinesis Data Analytics Studio is also compatible with Amazon Managed Streaming for Apache Kafka (Amazon MSK), Amazon Simple Storage Service (Amazon S3), and various other data sources supported by Apache Flink.
To follow this guide and interact with your streaming data, you will need a data stream with data flowing through.
You can create these streams using either the Amazon Kinesis console or the following AWS Command Line Interface (AWS CLI) command. For console instructions, see Creating and Updating Data Streams in the Kinesis Data Streams Developer Guide.
To create the data stream, use the following Kinesis create-stream AWS CLI command. Your data stream will be named input-stream.
You can start interacting with your data stream by following these steps:
We will keep the default settings for the application, and we can scale up as needed.
Once the application has been created, select Start to start the Apache Flink application. This will take a few minutes to complete, at which point you can Open in Apache Zeppelin.
In this section, you can create a Python script within the Apache Zeppelin notebook to write sample records to the stream for the application to process.
Select Create a new note in Apache Zeppelin, and name the new notebook stock-producer with the following contents:
You can run the stock-producer paragraph to begin publishing messages to your Kinesis Data Stream either by pressing SHIFT + ENTER on the paragraph, or by selecting the Play button in the top-right of the paragraph.
Feel free to close or navigate away from this notebook for now, as it will continue publishing events indefinitely.
Note that this will continue publishing events until the notebook is paused or the Apache Flink cluster is shut down.
Apache Zeppelin supports the Apache Flink interpreter and allows for the direct use of Apache Flink within a notebook for interactive data analysis. Within the Flink Interpreter, three languages are supported at this time—Scala, Python (PyFlink), and SQL. The notebook requires a specification to one of these languages at the top of each paragraph to interpret the language properly.
There are several other predefined variables per interpreter, such as the senv variable in Scala for a StreamExecutionEnvironment, and st_env in python for the same. A full list of these entry point variables can be found here. Now we will showcase the capabilities of Apache Flink in Python (Pyflink) by providing code samples for the most common use cases.
If you would like to follow along with this walkthrough, we have provided the Kinesis Data Analytics Studio notebook here with comments and context. Once you have created your Kinesis Data Analytics application, you can download the file and upload it to Kinesis Data Analytics studio.
Once you have imported the notebook, you should be able to follow along with the remainder of the post as you try it out!
Using the %flink.pyflink header to signify that this code block will be interpreted via the Python Flink interpreter, we’re creating a table called stock_table with a ticker, price, and event_time column that signifies the time at which the price was recorded for the ticker. The WATERMARK clause defines the watermark strategy for generating watermarks according to the event_time (row_time) column. The event_time column must be defined as Timestamp(3) and be a top-level column to be used in conjunction with watermarks. The syntax following the WATERMARK definition—FOR event_time AS event_time - INTERVAL '5' SECOND declares that watermarks will be emitted according to a bounded out of orderness watermark strategy that allows for a five second delay in event_time data.
To learn more about event time and watermarks, read about the techniques implemented by Apache Flink here.
The table defined below uses the Kinesis connector to read from a kinesis data stream called input-stream in the us-east-1 region from the latest stream position.
In this example, we are utilizing the Python interpreter’s built-in streaming table environment variable, st_env, to execute a SQL DDL statement. The streaming table environment provides access to the Table API within pyflink and uses the blink planner to optimize the job graph. This planner translates queries into a DataStream program regardless of whether the input is batch or streaming.
If the table already exists in the AWS Glue Data Catalog, then this statement will issue an error stating that the table already exists.
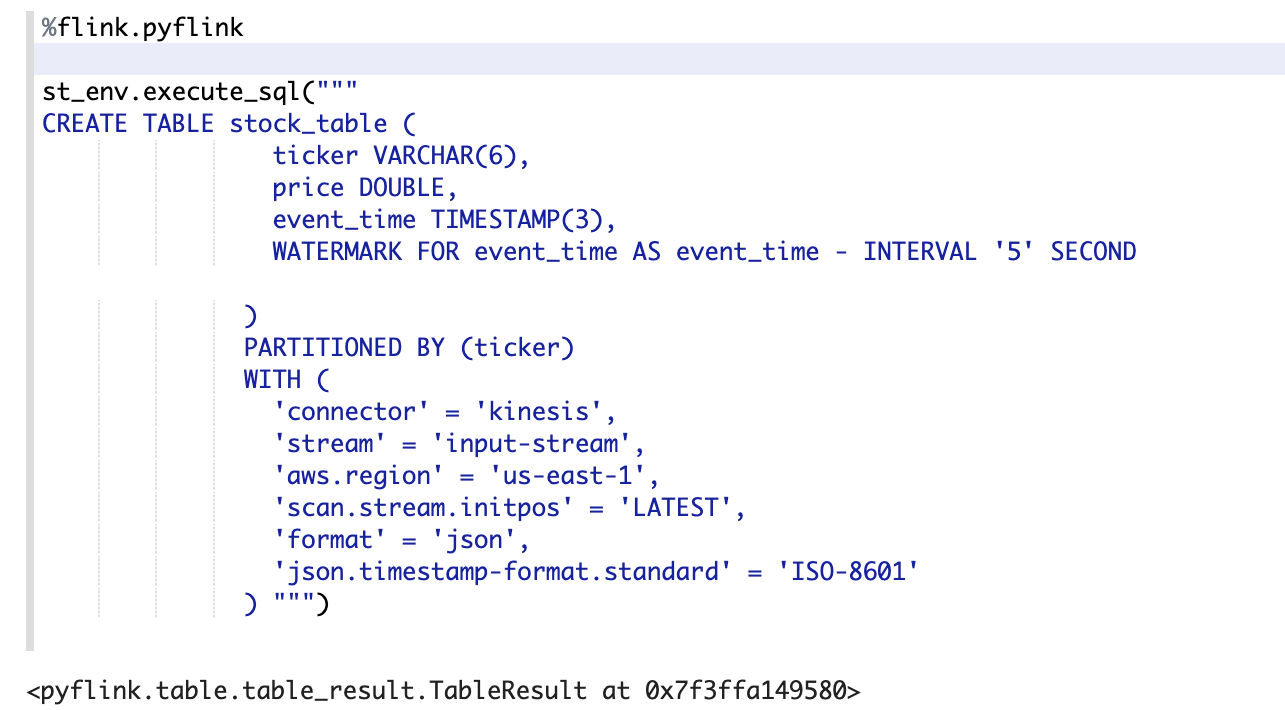
The screenshot above showcases the successful execution of this paragraph. We can verify the results by checking in the AWS Glue Data Catalog for the accompanying table.
To find this, navigate back to the AWS Management Console, and then search for Glue. Once here, locate the Glue database that you chose for our Kinesis Data Analytics application, and select it. You should see a link toward the bottom of the Databases view that lets you view the Tables in your database. Furthermore, you can directly select Tables in the left-hand side. Locate the table that we created in the previous step, called stock_table.
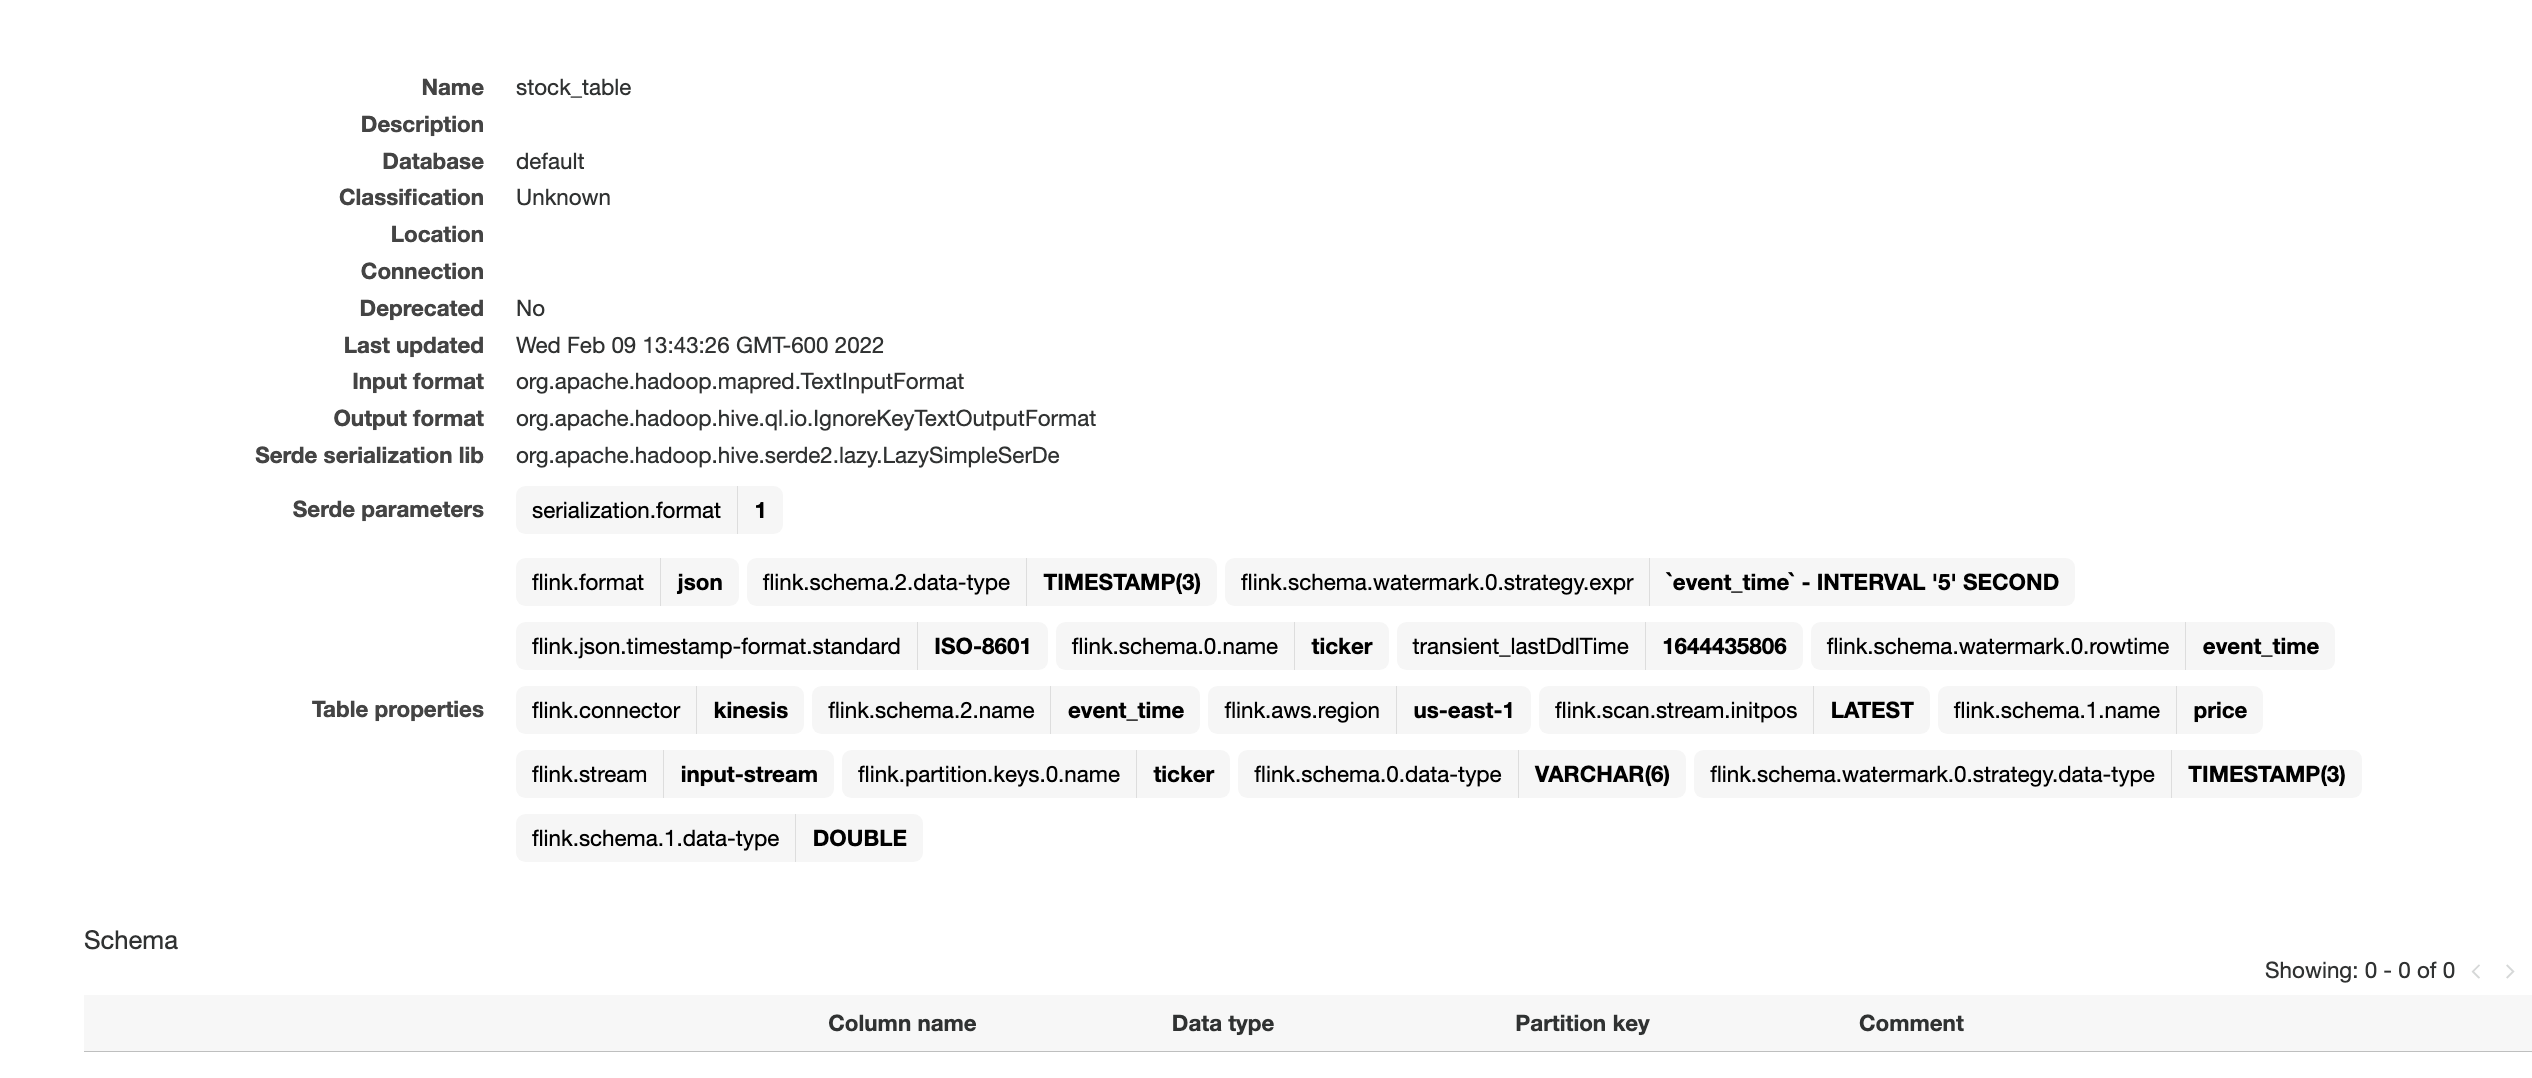
Here we can see that the table was not only created in Kinesis Data Analytics studio, but also durably persisted in a Glue Data Catalog table for reference from other applications or between runs of your application.
Performing a tumbling window in the Python Table API first requires the definition of an in-memory reference to the table created in Step 1. We use the st_env variable to define this table using the from_path function and referencing the table name. Once this is created, then we can create a windowed aggregation over one minute of data, according to the event_time column.
Note that you could also perform this transformation entirely in Flink SQL, as described in this blog post. We’re simply showcasing the features of the Pyflink API. The blog post linked above also showcases many different window operators that you might perform, such as sliding windows, group windows, over windows, session windows, etc. The windowing choice is entirely use-case dependent.
Use the ZeppelinContext to visualize the Python Table aggregation within the notebook.

This image shows the count_table we defined previously displayed as a pie chart within the Apache Zeppelin notebook.
To use and reuse common business logic into an operator, it can be useful to reference a User-defined function to transform your Data stream. This can be done either within the Kinesis Data Analytics notebook, or as an externally referenced application jar file. Utilizing User-defined functions can simplify the transformations or data enrichments that you might perform over streaming data.
In our notebook, we will be referencing a simple Java application jar that computes an integer hash of our ticker symbol. You can also write Python or Scala UDFs for use within the notebook. We chose a Java application jar to highlight the functionality of importing an application jar into a Pyflink notebook.
You can find the application jar here.
Once you save changes, the application will take a few minutes to update before you can open it again.
Open the notebook once it has been restarted so that we can reference our UDF.
Now we can view this newly transformed data from the hash_ticker table context.
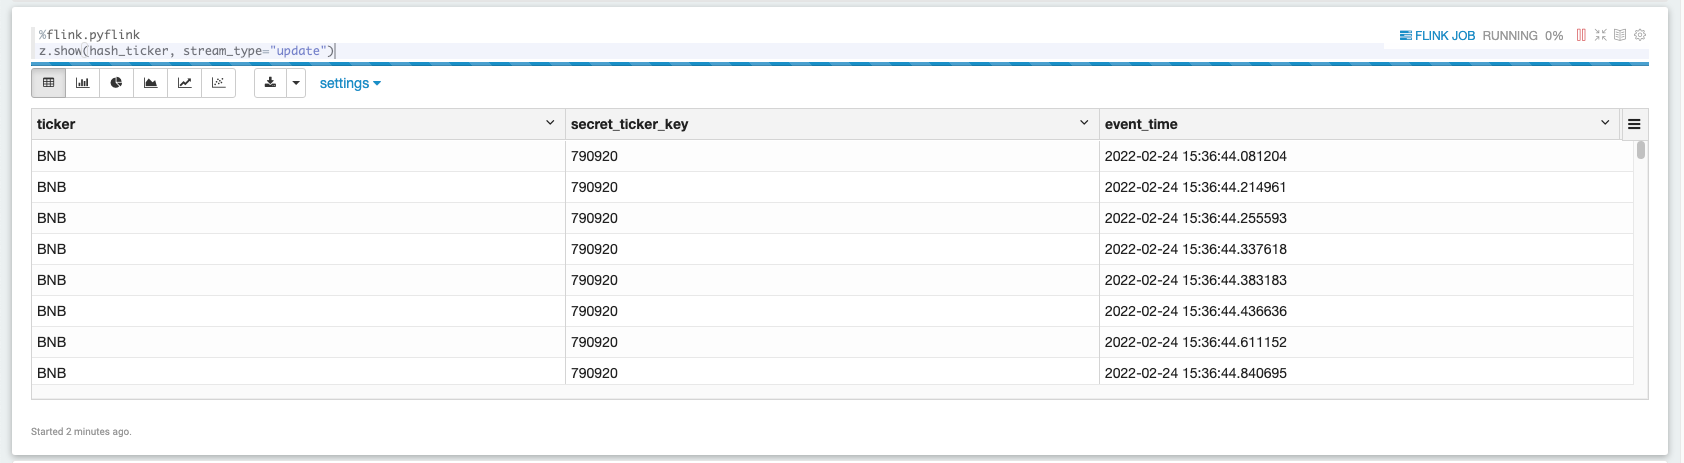
The screenshot above showcases data being displayed in a tabular format from our hashed results set.
To utilize the fault-tolerant features of the Streaming File Sink (writing data to Amazon S3), we must enable checkpointing within our Apache Flink application. This setting isn’t enabled by default on any Kinesis Data Analytics Studio notebook. However, it can be enabled by simply accessing the streaming environment variable’s configuration and setting the proper string accordingly:
In the same way that we ingested data into Kinesis Data Analytics Studio, we will create another table, called a sink, that will be responsible for taking data within Kinesis Data Analytics Studio and writing it out to Amazon S3 using the Apache Flink Filesystem connector. This connector does require checkpoints to commit data to a Filesystem, hence the previous step.
First, let’s create the table.
Next, we can perform the insert by calling the streaming table environment’s execute_sql function.
The return value table_result is a pyflink table TableResult object. This lets you query and interact with the Flink job that is operating in the background.
Since we’ve set our checkpointing interval to one minute, wait at least one minute with data flowing to see data in your Amazon S3 bucket.
To stop the Amazon S3 sink process, run the following cell:
A Studio notebook application consists of one or more tasks. You can split an application task into several parallel instances for execution, where each parallel instance processes a subset of the task’s data. The number of parallel instances of a task is called its parallelism, and adjusting that helps execute your tasks more efficiently.
Upon creation, Studio notebooks are given four parallel Kinesis Processing Units (KPU) which make up the application parallelism. To increase that parallelism, navigate to the Kinesis Data Analytics Studio Management Console, select your application name, and select the Configuration tab.
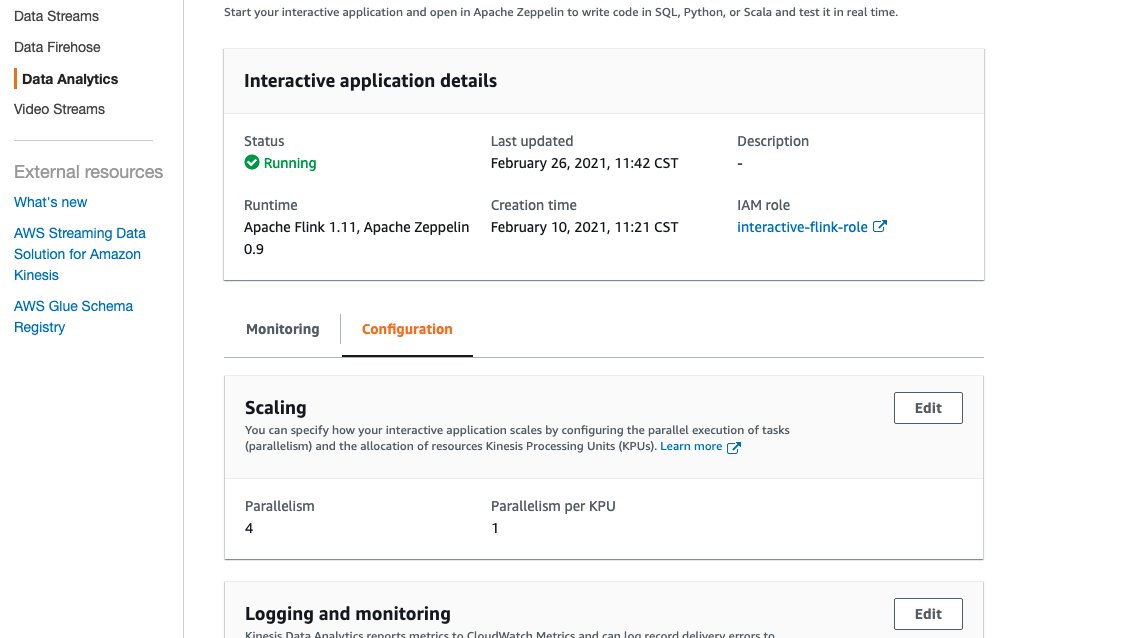
The screenshot above shows the Kinesis Data Analytics Studio console configuration page, where we can note the runtime environment, IAM Role, and modify things like the number of KPU’s the application is allocated.
When you have thoroughly tested and iterated on your application code within a Kinesis Data Analytics Studio notebook, you may choose to promote your notebook to a Kinesis Data Analytics for Apache Flink application with durable state. The benefits of doing this include having full fault tolerance with stateful operations, such as checkpointing, snapshotting, and autoscaling based on CPU usage.
To promote your Kinesis Data Analytics Studio notebook to a Kinesis Data Analytics for Apache Flink application:
Make sure that you have stopped all paragraphs in your Kinesis Data Analytics studio notebook so as not to contend for resources with your Kinesis Data Stream.
When the application has started, you should begin to see new data flowing into your Amazon S3 bucket in an entirely fault-tolerant and stateful manner.
Congratulations! You’ve just promoted a Kinesis Data Analytics studio notebook to Kinesis Data Analytics for Apache Flink!
Kinesis Data Analytics Studio makes developing stream processing applications using Apache Flink much faster. Moreover, all of this is done with rich visualizations, a scalable and user-friendly interface to develop and collaborate on pipelines, and the flexibility of language choice to make any streaming workload performant and powerful. Users can run paragraphs from within the notebook as described in this post, or choose to promote their Studio notebook to a Kinesis Data Analytics for Apache Flink application with durable state.
For more information, please see the following documentation:
 Jeremy Ber has been working in the telemetry data space for the past five years as a Software Engineer, Machine Learning Engineer, and most recently a Data Engineer. In the past, Jeremy has supported and built systems that stream in terabytes of data-per-day, and process complex Machine Learning Algorithms in real-time. At AWS, he is a Solutions Architect Streaming Specialist supporting both Managed Streaming for Kafka (Amazon MSK) and Amazon Kinesis services.
Post Syndicated from Jeremy Milk original https://www.backblaze.com/blog/announcing-backblaze-b2-universal-data-migration/
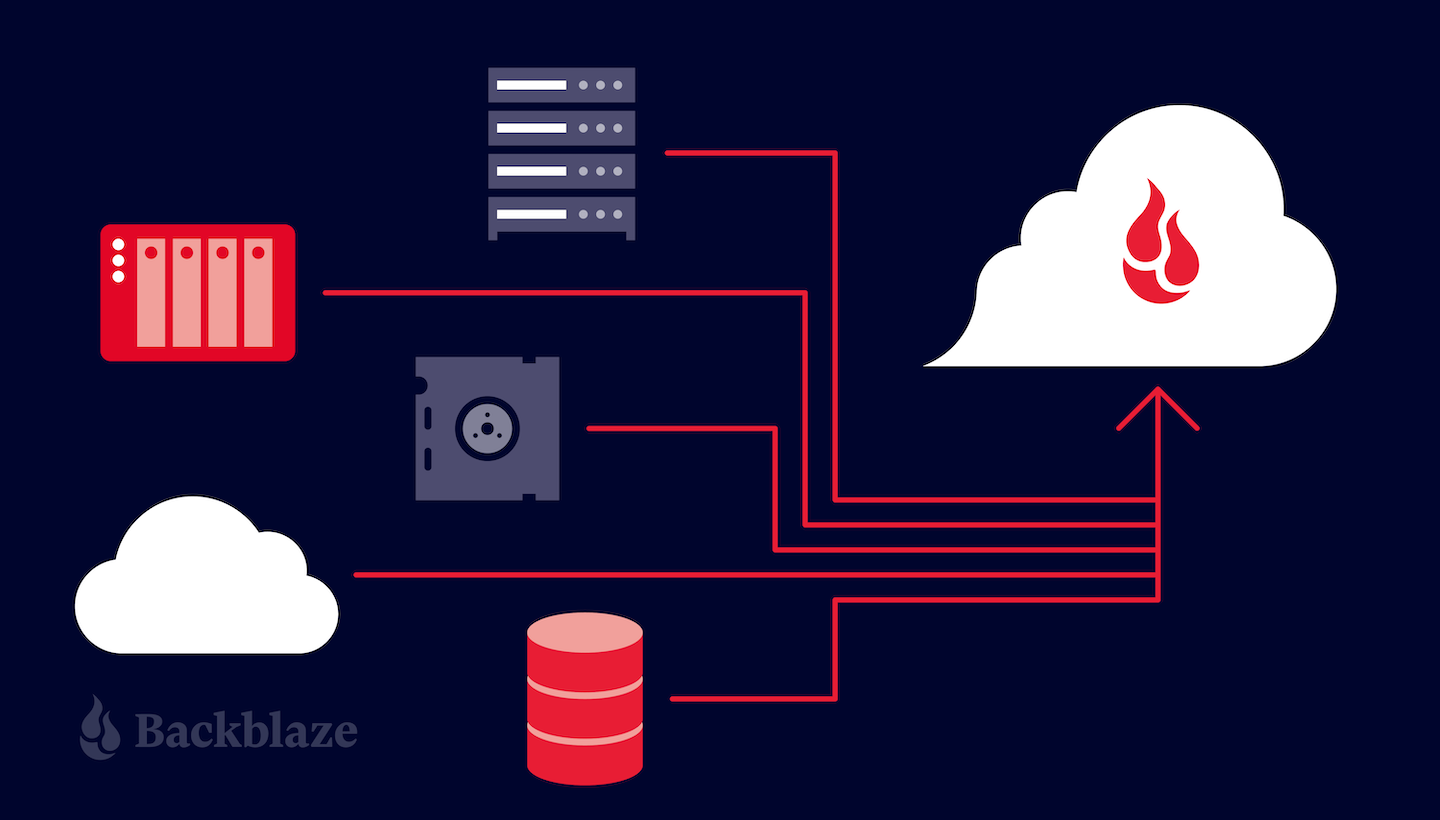
Your data is valuable. Whether you’re sequencing genomes, managing a media powerhouse, or running your own business, you need fast, affordable, ready access to it in order to achieve your goals. But, you can’t get the most out of your data if it’s locked-in to a provider where it’s hard to manage or time-consuming to retrieve. Unfortunately, due to egress fees and closed, “all-in-one” platforms, vendor lock-in is currently trapping too many companies.
Backblaze can help: Universal Data Migration, a new service launched today, covers all data transfer costs, including legacy provider egress fees, and manages data migration from any legacy on-premises or cloud source. In short, your migration to Backblaze B2 Cloud Storage is on us.
Many of the businesses we’ve spoken to about this didn’t believe that the service was free at first. But seriously—you will never see an invoice for your transfer fees, any egress fees levied by your legacy vendor when you pull data out, or for the assistance in moving data.
If you’re still in doubt, read on to learn more about how Universal Data Migration can help you say goodbye to vendor lock-in, cold delays, and escalating storage costs, and hello to B2 Cloud Storage gains, all without fears of cost, complexity, downtime, or data loss.
Backblaze has curated a set of integrated services to handle migrations from pretty much every source, including:
We cover data transfer and egress costs and facilitate the migration to Backblaze B2 Cloud Storage. The turnkey service expands on our earlier Cloud to Cloud Migration services as well as transfers via internet and the Backblaze Fireball rapid ingest devices. These offerings are now rolled up into one universal service.
“I thought moving my files would be the hardest part of the process, and it’s why I never really thought about switching providers before, but it was easy.”
—Tristan Pelligrino, Co-founder, Motion
We do ask that companies who use the service commit to maintaining at least 10TB in Backblaze B2 for a minimum of one year, but we expect that our cloud storage pricing—a quarter the cost of comparable services—and our interoperability with other cloud services, will keep new customers happy for that first year and beyond.
Outside of specifics that will vary by your unique infrastructure and workflows, migration types include:
Backblaze also supports simple internet transfers for moving files over your existing bandwidth—with multi-threading to maximize speed.
Not to sound like a broken record, but this is the best part—the service is entirely free to you. You’ll never receive a bill. Backblaze incurs all data transfer and legacy vendor egress or download fees for inbound migrations >10TB with a one-year commitment. It’s pretty cool that we can help save you money; it’s even cooler that we can help more businesses build the tech stacks they want using unconflicted providers to truly get the most out of their data.
After divesting from its parent company, Fortune Media rebuilt its technology infrastructure and moved many services, including data storage, to the cloud. However, the initial tech stack was expensive, difficult to use, and not 100% reliable.
Backblaze B2 offered a more reliable and cost-effective solution for both hot cloud storage and archiving. In addition, the platform’s ease of use would give Fortune’s geographically-dispersed video editors a modern, self-service experience, and it was easier for the IT team to manage.
Using Backblaze’s Cloud to Cloud Migration, now part of Universal Data Migration, the team transferred over 300TB of data from their legacy provider in less than a week with zero downtime, business disruption, or egress costs, and was able to cut overall storage costs by two-thirds.
“In the cloud space, the biggest complaint that we hear from clients is the cost of egress and storage. With Backblaze, we saved money on the migration, but also overall on the storage and the potential future egress of this data.”
—Tom Kehn, Senior Solutions Architect at CHESA, Fortune Media’s technology systems integrator
What else do you get with Universal Data Migration? Additional benefits include:
The Universal Data Migration service is generally available now. To qualify, organizations must migrate and commit to maintaining at least 10TB in Backblaze B2 for a minimum of one year. For more information or to set up a free proof of concept, contact the Backblaze Sales team.
The post Announcing Backblaze B2’s Universal Data Migration appeared first on Backblaze Blog | Cloud Storage & Cloud Backup.
Post Syndicated from original https://lwn.net/Articles/891182/
Security updates have been issued by Arch Linux (gzip, python-django, and xz), Debian (chromium, subversion, and zabbix), Red Hat (expat, kernel, and thunderbird), SUSE (go1.16, go1.17, kernel, libexif, libsolv, libzypp, zypper, opensc, subversion, thunderbird, xxx, and xz), and Ubuntu (git, linux-bluefield, nginx, and subversion).
Post Syndicated from Matt Lewis original https://blog.cloudflare.com/kentik-and-magic-transit/

We are excited to announce that as of today, network security teams can procure and use Magic Transit, Cloudflare’s industry-leading DDoS mitigation solution, and Kentik’s network observability as an integrated solution. We are excited to help our customers not just with technical simplicity, but business process simplicity as well.

Distributed Denial of Service (DDoS) attacks are highly disruptive to businesses everywhere. According to the Cloudflare DDoS Attack Trends report, in the first half of 2021 the world witnessed massive ransomware and ransom DDoS attack campaigns that interrupted critical infrastructure, including oil pipelines, healthcare, and financial services. In the second half, we saw a growing swarm of attacks, including one of the most powerful botnets deployed (Meris), with record-breaking network-layer attacks observed on the Cloudflare network.
Along with an increase in severity, there is a proliferation of automated toolkits that make it simple and cheap for anyone to launch these attacks. Detecting and stopping these attacks manually is not effective, and network security engineers are increasingly turning to automated tools to help ensure network and application availability.
DDoS protection has evolved over the years from appliances to hybrid models to fully Internet-native solutions, like Cloudflare’s Magic Transit. Cloudflare has been protecting millions of Internet properties against DDoS attacks, ensuring they are available at all times. Magic Transit extends Cloudflare’s industry-leading DDoS protection to shield entire IP subnets from DDoS attacks, while also accelerating network traffic, ensuring your data centers, cloud services and corporate networks are always reachable from the Internet. Our powerful global network spanning 250+ cities and 121 Tbps of capacity ensures that customers can have always-on DDoS protection without impacting network latency and application performance. Magic Transit also supports on-demand mode, which allows customers to activate DDoS protection when they need it most.
Network observability becomes critical to understand what normal looks like for your environment so that DDoS attacks are readily detected. Flow-based monitoring helps you understand not only how much traffic is flowing over your network, but also where it came from, where it’s going, and what applications are consuming bandwidth.
Magic Transit is one of the most powerful DDoS mitigation platforms available today. We have worked hard to ensure Magic Transit is flexible enough for the most demanding network architectures. We need to fit into your world, not the other way around. And that involves partnering with leading network observability vendors to give you multiple options for how you choose to protect your network.
With this new partnership, customers can now consume Cloudflare’s Magic Transit service in one of three modes:
In each configuration, Magic Transit is seamlessly paired with Magic Firewall — our cloud-native firewall-as-a-service.
At Cloudflare, we continuously take feedback from our customers on both our product and on what other tools they use. Customer feedback helps us build our products and how we grow Cloudflare’s Technology Partner Program.
For our Magic Transit customers, we found that many of our customers who chose Magic Transit On Demand have adopted solutions from Kentik, the network observability company with one of the leading flow-based monitoring tools in the ecosystem. Kentik empowers network professionals to plan, run, and fix any network with observability into all their traffic.
Cloudflare strives to simplify how customers can shield their network from cybersecurity threats like DDoS attacks. Magic Transit gives network security professionals the confidence that their network resources are immune from DDoS-related outages. We have now extended that same simplicity to this joint solution, making it simple for our customers to procure, provision, and integrate Magic Transit and Kentik. Our end goal is always creating the best experience possible for our customers, with Cloudflare’s services fitting seamlessly into their existing technology stack.
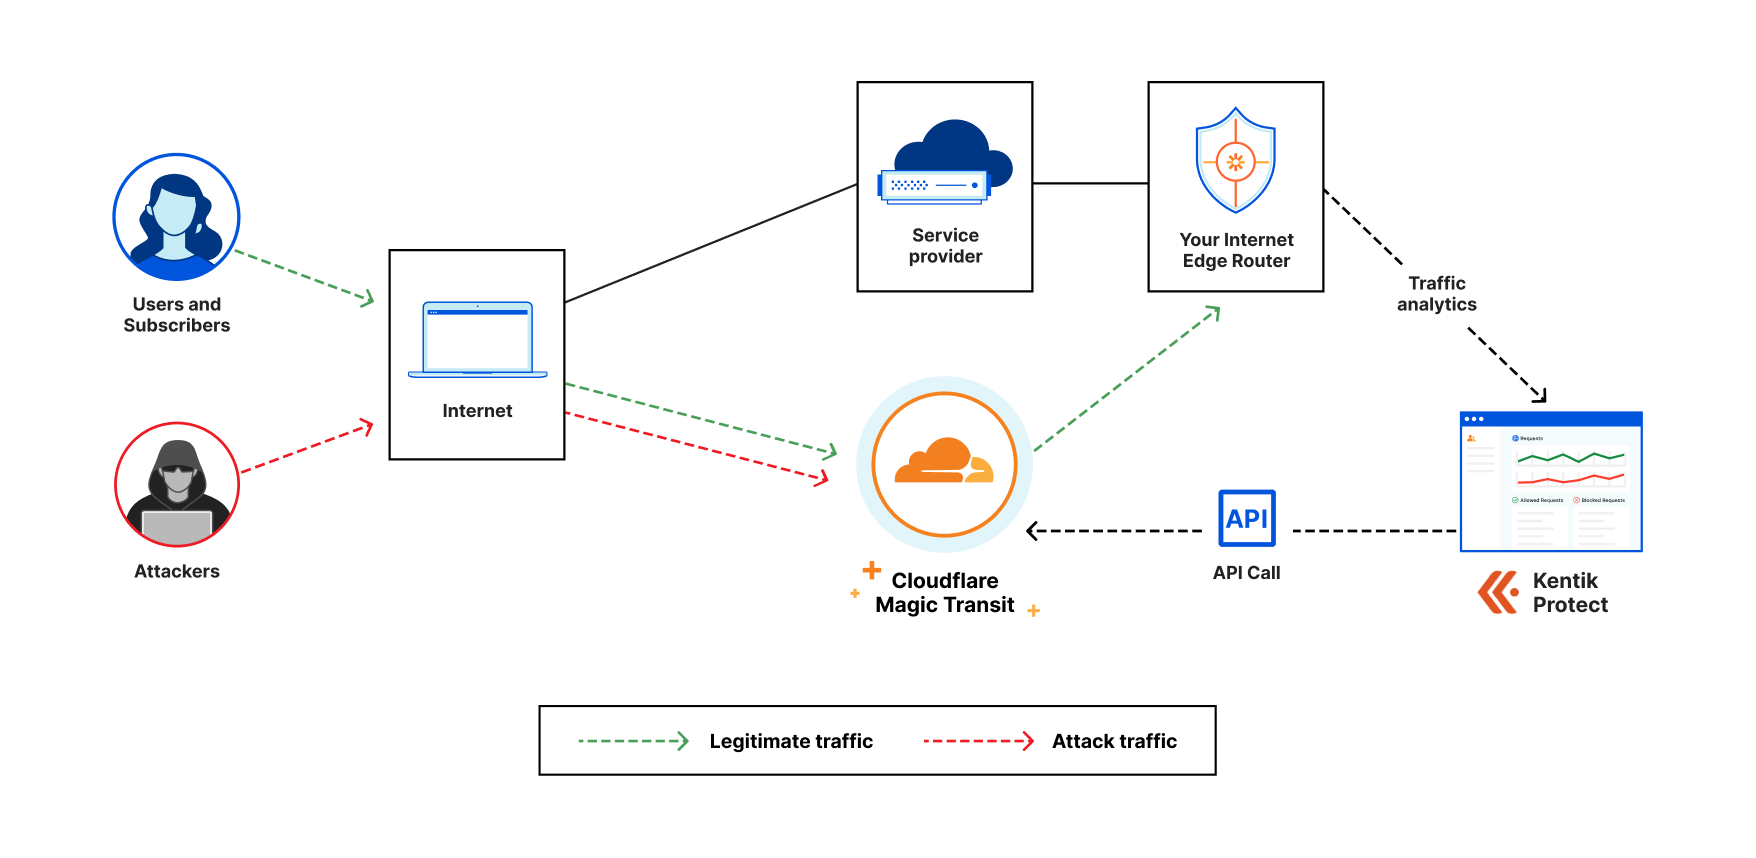
Kentik’s powerful network observability cloud collects flow logs from your network components and continuously learns network behavior, detecting anomalies such as DDoS attacks. Using our native API integration, the Kentik platform can trigger Magic Transit to start attracting network traffic when there’s an attack underway. Magic Transit’s autonomous DDoS mitigation automatically analyzes incoming traffic and filters out DDoS traffic across the entire Cloudflare network, protecting your network from unwanted traffic and avoiding service availability issues and outages.
Together, Kentik and Cloudflare have created a well-supported integration and a more streamlined procurement process to combine Kentik’s best-of-breed network observability and Cloudflare’s industry-leading DDoS protection in Magic Transit. Customers can now receive the best DDoS protection and network observability in a completely SaaS-based offering.
“We are excited to partner with Cloudflare to make it easier for our mutual customers to integrate our leading technology solutions and deploy industry-leading DDoS protection in a fully SaaS-based environment”, said Mike Mooney, CRO at Kentik.
Now, customers seeking to combine purpose-built, best-of-breed network observability and visualization from Kentik with Cloudflare’s Magic Transit On Demand can do so through a single vendor agreement and an integrated solution.
If you’d like to learn more DDoS attack trends and how Kentik plus Cloudflare combine to provide the leading SaaS-based DDoS protection solution with over 121 Tbps of capacity, review our developer documentation and join our upcoming webinar on April 28 to learn more.
Post Syndicated from The History Guy: History Deserves to Be Remembered original https://www.youtube.com/watch?v=jmeg0lfF1IY
Post Syndicated from Bruce Schneier original https://www.schneier.com/blog/archives/2022/04/russian-cyberattack-against-ukrainian-power-grid-prevented.html
A Russian cyberweapon, similar to the one used in 2016, was detected and removed before it could be used.
Key points:
- ESET researchers collaborated with CERT-UA to analyze the attack against the Ukrainian energy company
- The destructive actions were scheduled for 2022-04-08 but artifacts suggest that the attack had been planned for at least two weeks
- The attack used ICS-capable malware and regular disk wipers for Windows, Linux and Solaris operating systems
- We assess with high confidence that the attackers used a new version of the Industroyer malware, which was used in 2016 to cut power in Ukraine
- We assess with high confidence that the APT group Sandworm is responsible for this new attack
News article.
EDITED TO ADD: Better news coverage from Wired.
Post Syndicated from original https://lwn.net/Articles/891121/
Version 6.3 of the Qt
graphics library has been released. “Qt 6.3 also comes with a decent
set of new functionality. A total of 250 user stories and tasks
implementing new functionality have been completed for 6.3. Those are of
course too many to list individually, and if you want to have all the
details, have a look at our new
features page and our Release Notes.”
Post Syndicated from original https://lwn.net/Articles/891112/
Git maintainer Junio C Hamano has
announced the
release of v2.35.2, along with multiple other Git versions
(“v2.30.3, v2.31.2, v2.32.1, v2.33.2, and
v2.34.2“), to fix a security problem that can happen on multi-user
machines (CVE-2022-24765).
This GitHub blog
post has more details, though the GitHub service itself is not
vulnerable. The description in the announcement seems a bit
Windows-centric, but Linux multi-user systems are apparently vulnerable as well:
On multi-user machines, Git users might find themselves
unexpectedly in a Git worktree, e.g. when another user created a
repository in `C:\.git`, in a mounted network drive or in a
scratch space. Merely having a Git-aware prompt that runs `git
status` (or `git diff`) and navigating to a directory which is
supposedly not a Git worktree, or opening such a directory in an
editor or IDE such as VS Code or Atom, will potentially run
commands defined by that other user.
Post Syndicated from original https://xkcd.com/2606/

Post Syndicated from Let's Encrypt original https://letsencrypt.org/2022/04/13/receiving-the-levchin-prize.html
On April 13, 2022, the Real World Crypto steering committee presented the
Max Levchin Prize for Real-World Cryptography to Let’s Encrypt. The
following is the speech delivered by our Executive Director, Josh Aas upon
receiving the award. We’d like to
thank our community for supporting us and invite you to join us
in making the Internet more secure and privacy-respecting for everyone.
Thank you to the
Real World Crypto steering committee
and to Max Levchin for this
recognition. I couldn’t be more proud of what our team has accomplished
since we started working on Let’s Encrypt back in 2013.
My first temptation is to name some names, but there are so many people who
have given a significant portion of their lives to this work over the years
that the list would be too long. You know who you are. I hope you’re as
proud as I am at this moment.
Let’s Encrypt is currently used by more than
280 million websites,
issuing between two and three million certificates per day. I often think about how we got here, looking for some nugget of wisdom
that might be useful to others. I’m not sure I’ve really come up with
anything particularly profound, but I’m going to give you my thoughts
anyway. Generally speaking: we started with a pretty good idea, built a
strong team, stayed focused on what’s important, and kept ease of use in
mind every step of the way.
Let’s Encrypt ultimately came from a group of people thinking about a pretty
daunting challenge. The billions of people living increasingly large
portions of their lives online deserved better privacy and security, but in
order to do that we needed to convince hundreds of millions of websites to
switch to HTTPS. Not only did we want them to make that change, we wanted
most of them to make the change within the next three to five years.

We thought through a lot of options but in the end we just didn’t see any
other way than to build what became Let’s Encrypt. In hindsight building
Let’s Encrypt seems like it was a good and rewarding idea, but at the time
it was a frustrating conclusion in many ways. It’s not an easy solution to
commit to. It meant standing up a new organization, hiring at least a dozen
people, understanding a lot of details about how to operate a CA, building
some fairly intense technical systems, and setting all of it up to operate
for decades. Many of us wanted to work on this interesting problem for a
bit, solve it or at least put a big dent in it, and then move on to other
interesting problems. I don’t know about you, but I certainly didn’t dream
about building and operating a CA when I was younger.
It needed to be done though, so we got to work. We built a great team that
initially consisted of mostly volunteers and very few staff. Over time that
ratio reversed itself such that most people working on Let’s Encrypt on a
daily basis are staff, but we’re fortunate to continue to have a vibrant
community of volunteers who do work ranging from translating our website and
providing assistance on our community forums, to maintaining the dozens
(maybe hundreds?) of client software options out there.
Today there are just 11 engineers working on Let’s Encrypt, as well as a
small team handling fundraising, communication, and administrative tasks.
That’s not a lot of people for an organization serving hundreds of millions
of websites in every country on the globe, subject to a fairly intense set
of industry rules, audits, and high expectations for security and
reliability. The team is preparing to serve as many as 1 billion websites.
When that day comes to pass the team will be larger, but probably not much
larger. Efficiency is important to us, for a couple of reasons. The first is
principle – we believe it’s our obligation to do the most good we can with
every dollar entrusted to us. The second reason is necessity – it’s not easy
to raise money, and we need to do our best to accomplish our mission with
what’s available to us.
It probably doesn’t come as a surprise to anyone here at Real World Crypto
that ease of use was critical to any success we’ve had in applying
cryptography more widely. Let’s Encrypt has a fair amount of internal
complexity, but we expose users to as little of that as possible. Ideally
it’s a fully automated and forgettable background task even to the people
running servers.
The fact that Let’s Encrypt is free is a huge factor in ease of use. It
isn’t even about how much money people might be willing or able to pay, but
any financial transaction requirement would make it impossible to fully
automate our service. At some point someone would have to get a credit card
and manage payment information. That task ranges in complexity from finding
your wallet to obtaining corporate approval. The existence of a payment in
any amount would also greatly limit our geographic availability because of
sanctions and financial logistics.
All of these factors led to the decision to form
ISRG, a nonprofit entity to
support Let’s Encrypt. Our ability to provide this global, reliable service
is all thanks to the people and companies who believe in TLS everywhere and
have supported us financially. I’m so grateful to all of our contributors
for helping us.
Our service is pretty easy to use under normal circumstances, but we’re not
done yet. We can be better about handling exceptional circumstances such as
large revocation events. Resiliency is good. Automated, smooth resiliency is
even better. That’s why I’m so excited about the
ACME Renewal Info
work we’re doing in the IETF now, which will go into production over the
next year.
Everyone here has heard it before, but I’ll say it again because we can’t
afford to let it slip our minds. Ease of use is critical for widespread
adoption of real world cryptography. As we look toward the future of ISRG,
our new projects will have ease of use at their core. In fact, you can learn
about our newest project related to privacy-preserving measurement at two of
this afternoon’s sessions! Getting ease of use right is not just about the
software though. It’s a sort of pas de trois, a dance for three, between
software, legal, and finance, in order to achieve a great outcome.
Thank you again. This recognition means so much to us.
As a nonprofit project, 100% of our funding comes from contributions from
our community of users and supporters. We depend on their support in order
to provide our services for the public benefit. If your company or
organization would like to
sponsor Let’s Encrypt
please email us at
[email protected]. If you
can support us with a
donation, we ask that you make
an individual contribution.