Automating Anomaly Detection in Ecommerce Traffic Patterns

Post Syndicated from Aditya Pendyala original https://aws.amazon.com/blogs/architecture/automating-anomaly-detection-in-ecommerce-traffic-patterns/

Many organizations with large ecommerce presences have procedures to detect major anomalies in their user traffic. Often, these processes use static alerts or manual monitoring. However, the ability to detect minor anomalies in traffic patterns near real-time can be challenging. Early detection of these minor anomalies in ecommerce traffic (such as website page visits and order completions) helps organizations take corrective actions to address issues. This decreases negative impacts to business key performance indicators (KPIs).

In this blog post, we will demonstrate an artificial intelligence/machine learning (AI/ML) solution using AWS services. We’ll show how Amazon Kinesis and Amazon Lookout for Metrics can be used to detect major and minor anomalies near-real time, based on historical and current traffic trends.

The inconsistency of ecommerce traffic

The ecommerce traffic (and number of orders placed) varies based on season, month, date, and time of day. For example, ecommerce websites experience high traffic during weekday evening hours, compared to morning hours. Similarly, there is a spike in web traffic on weekends, compared to weekdays. However, the ecommerce traffic on holiday events (for example, Black Friday, Cyber Monday) does not follow this trend. Due to such dynamic and varying patterns, detecting minor anomalies in user traffic near-real time becomes difficult.

We need a smart solution that can detect the smallest deviation in user traffic based on historical data (date and time). As you can imagine, programming these trends based on static rules is time-intensive. In the next section, we discuss a solution that can help organizations automate and detect minor (and major) anomalies while still accounting for varying traffic trends.

The components of our anomaly detection solution

The architecture consists of three functional components:

  • The ecommerce application that customers use for interaction
  • The data ingesting, transforming, and storage platform
  • Anomaly detection and notification

This solution automates data ingestion and anomaly detection, and provides a graphical user interface to interact, tweak, and filter anomalies based on severity.

Figure 1 illustrates the architecture of this solution:

Figure 1. Architecture diagram of an anomaly detection solution for ecommerce traffic

Figure 1. Architecture diagram of an anomaly detection solution for ecommerce traffic

Let’s look at the individual components of this architecture before reviewing the overall solution.

The ecommerce application that customers use for interaction 

A customer’s journey of purchasing a product online involves user actions that include:

  • Searching for and viewing the product on the “Product Display Page” (PDP)
  • Adding to the “cart”
  • Completing the purchase on the “checkout“ page

The traffic on these pages is broken down into chunks based on time intervals. These serve as the data points that we can use to understand traffic patterns.

The data ingesting, transforming, and storage platform

Ecommerce applications generate data in multiple formats and in different volumes. This data must be fed into a streaming platform that can ingest and collect data continuously. Typically, the data must be transformed and stored for analysis and machine learning purposes. To satisfy these requirements, we will use Amazon Kinesis Data Streams as a streaming platform for data ingestion. Amazon Kinesis Data Firehose with AWS Lambda can transform the data. And we’ll store the data in Amazon Simple Storage Service (S3).

Anomaly detection and notification in near-real time

Once our data is ready, we must analyze it near-real time to identify anomalies. We must notify the concerned team about this anomaly so that they can take necessary corrective actions, if needed. We will use Lookout for Metrics and Amazon Simple Notification Service (SNS) to satisfy these requirements.

Lookout for Metrics can detect and diagnose anomalies in traffic patterns using ML. Amazon Lookout for Metrics accepts feedback on detected anomalies and tunes the results to improve accuracy over time. Lookout for Metrics is also capable of integrating with Amazon SNS, which can send notifications via SMS, mobile push, and emails.

Monitoring ecommerce traffic with Lookout for Metrics

As shown in Figure 1, data from user traffic and user interactions with the ecommerce application is captured as a function of time, and ingested into Kinesis Data Streams. Using Kinesis Data Firehose and Lambda, data is transformed and stored in an S3 bucket. We then create a detector in Lookout for Metrics and use the S3 bucket as the data source. Because of seamless integration between S3 and Lookout for Metrics, data from S3 bucket is automatically ingested into the detector we created.

Once the detector is activated, Lookout for Metrics will start monitoring the data for anomalies, and start identifying the anomalies near-real time. Lookout for Metrics also provides a mechanism to adjust severity threshold on a scale of 0-100, which will help decrease false positives as much as desired. In addition, it integrates with SNS, and can publish notifications to an SNS Topic. An email/ SMS or mobile push subscription can be created on this topic, which will notify users about any current anomalies.

 Conclusion

In this post, we discussed how minor anomalies are hard to detect near-real time in ecommerce traffic of organizations. We also discussed the services that can be used to monitor these anomalies, such as Lookout for Metrics. Use this architecture to help you monitor, detect anomalies in near-real time, and reduce any negative impact to your business KPIs.

For further reading:

Slicing and Dicing Instant Logs: Real-time Insights on the Command Line

Post Syndicated from Cole MacKenzie original https://blog.cloudflare.com/instant-logs-on-the-command-line/

Slicing and Dicing Instant Logs: Real-time Insights on the Command Line

Slicing and Dicing Instant Logs: Real-time Insights on the Command Line

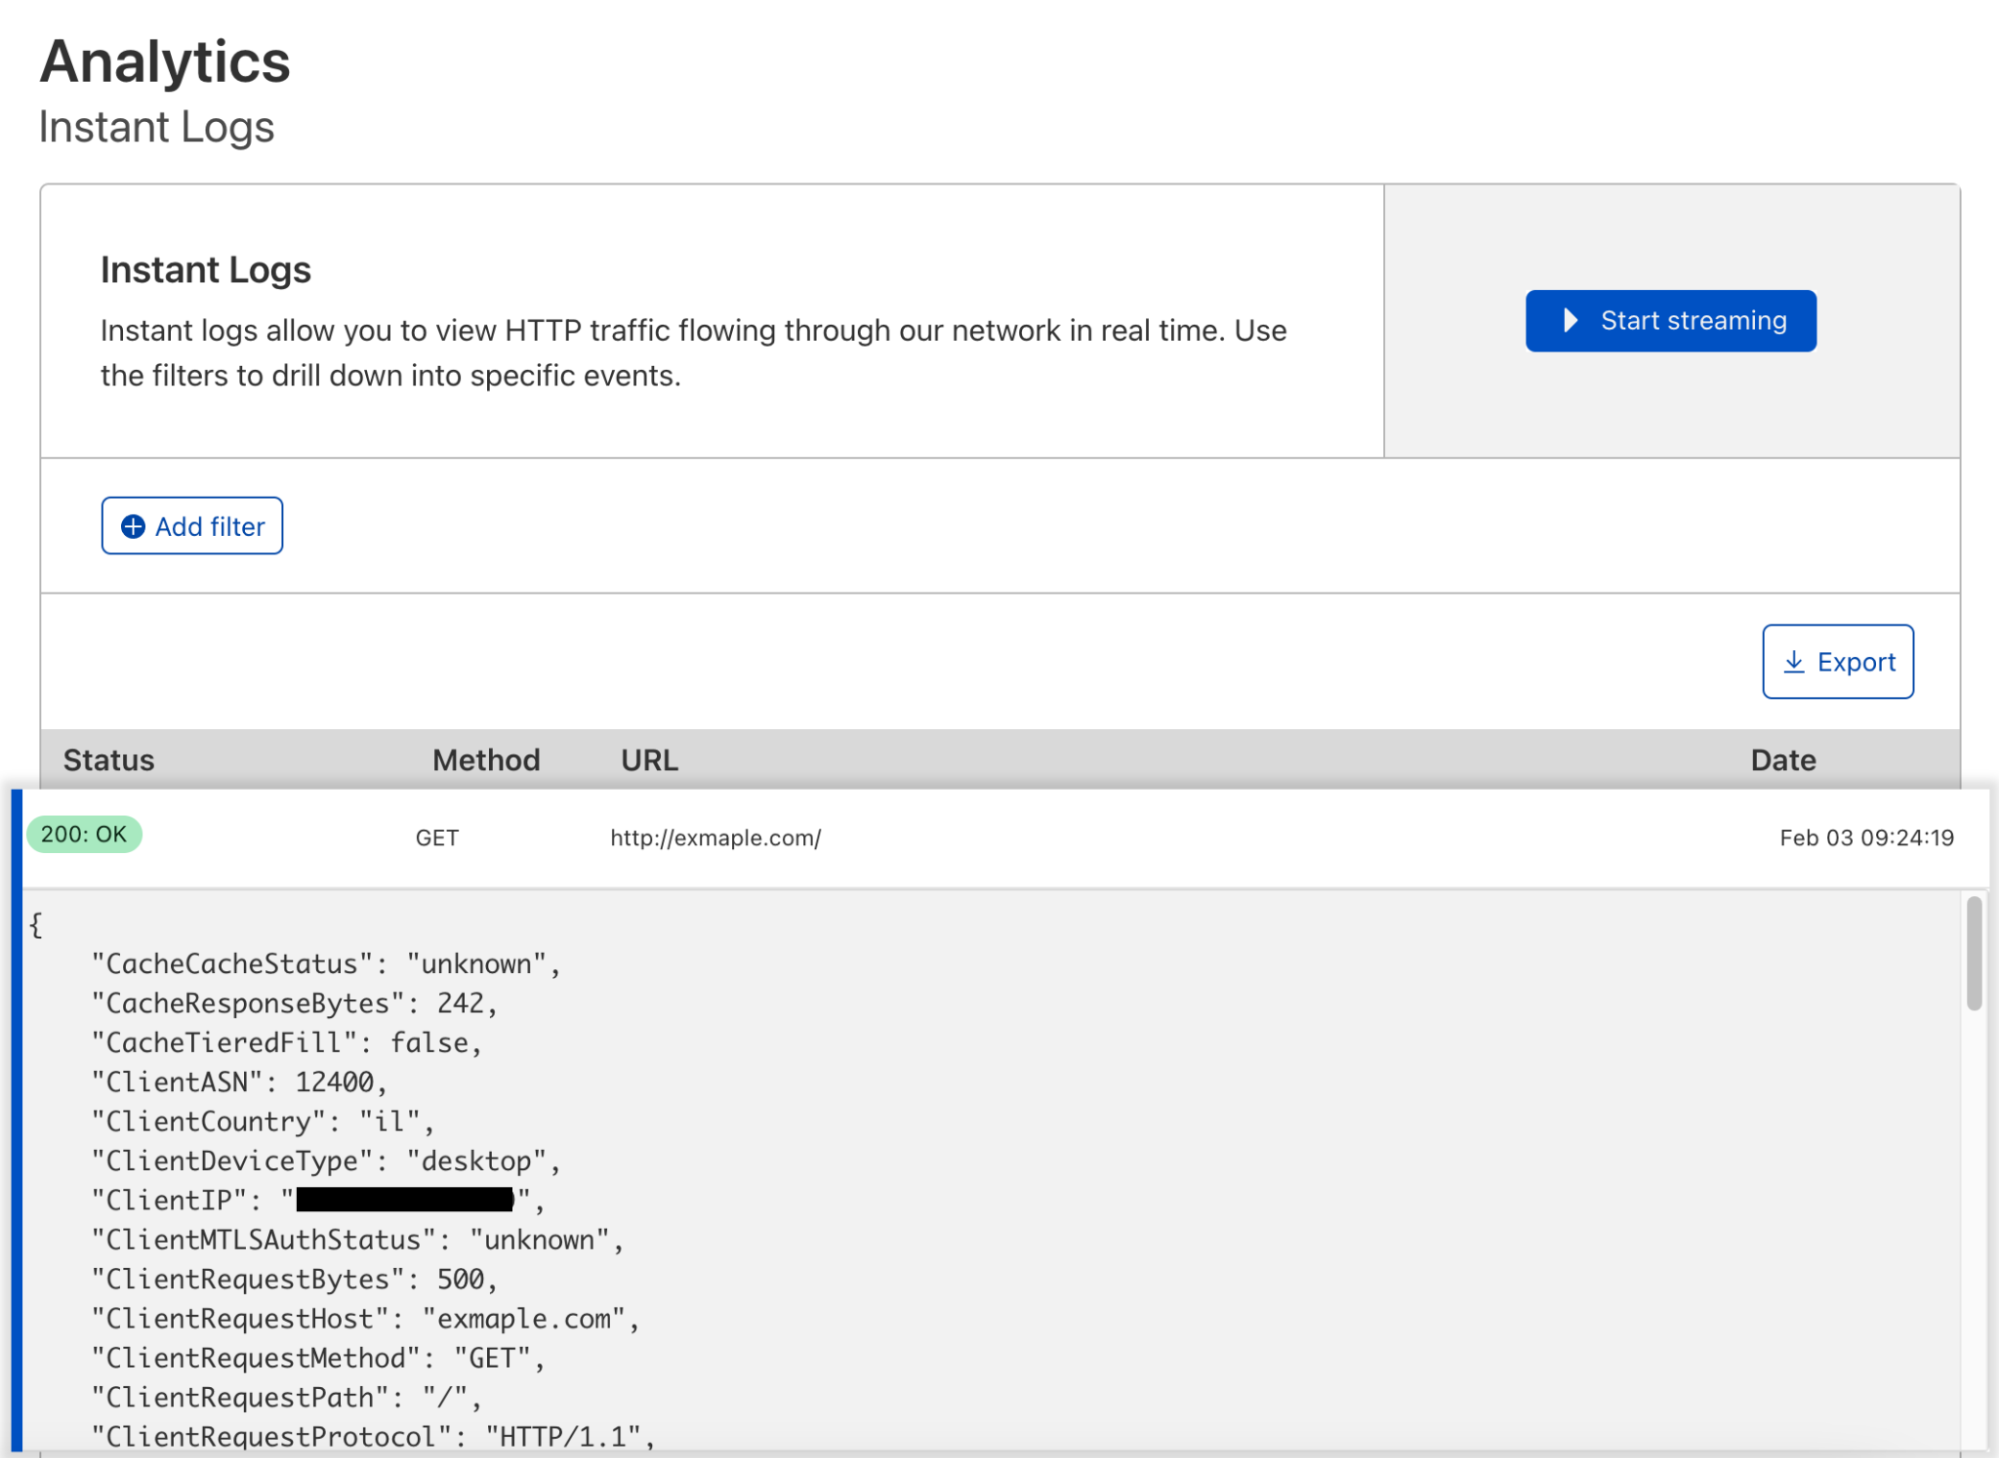
During Speed Week 2021 we announced a new offering for Enterprise customers, Instant Logs. Since then, the team has not slowed down and has been working on new ways to enable our customers to consume their logs and gain powerful insights into their HTTP traffic in real time.

Slicing and Dicing Instant Logs: Real-time Insights on the Command Line

We recognize that as developers, UIs are useful but sometimes there is the need for a more powerful alternative. Today, I am going to introduce you to Instant Logs in your terminal! In order to get started we need to install a few open-source tools to help us:

  • Websocat – to connect to WebSockets.
  • Angle Grinder – a utility to slice-and-dice a stream of logs on the command line.

Creating an Instant Log’s Session

For enterprise zones with access to Instant Logs, you can create a new session by sending a POST request to our jobs’ endpoint. You will need:

  • Your Zone Tag / ID
  • An Authentication Key or an API Token with at least the Zone Logs Read permission

curl -X POST 'https://api.cloudflare.com/client/v4/zones/${ZONE_ID}/logpush/edge/jobs' \
-H 'X-Auth-Key: <KEY>' \
-H 'X-Auth-Email: <EMAIL>' \
-H 'Content-Type: application/json' \
--data-raw '{
    "fields": "ClientIP,ClientRequestHost,ClientRequestMethod,ClientRequestPath,EdgeEndTimestamp,EdgeResponseBytes,EdgeResponseStatus,EdgeStartTimestamp,RayID",
    "sample": 1,
    "filter": "",
    "kind": "instant-logs"
}'

Response

The response will include a new field called destination_conf. The value of this field is your unique WebSocket address that will receive messages directly from our network!

{
    "errors": [],
    "messages": [],
    "result": {
        "id": 401,
        "fields": "ClientIP,ClientRequestHost,ClientRequestMethod,ClientRequestPath,EdgeEndTimestamp,EdgeResponseBytes,EdgeResponseStatus,EdgeStartTimestamp,RayID",
        "sample": 1,
        "filter": "",
        "destination_conf": "wss://logs.cloudflare.com/instant-logs/ws/sessions/949f9eb846f06d8f8b7c91b186a349d2",
        "kind": "instant-logs"
    },
    "success": true
}

Connect to WebSocket

Using a CLI utility like Websocat, you can connect to the WebSocket and start immediately receiving logs of line-delimited JSON.

websocat wss://logs.cloudflare.com/instant-logs/ws/sessions/949f9eb846f06d8f8b7c91b186a349d2
{"ClientRequestHost":"example.com","ClientRequestMethod":"GET","ClientRequestPath":"/","EdgeEndTimestamp":"2022-01-25T17:23:05Z","EdgeResponseBytes":363,"EdgeResponseStatus":200,"EdgeStartTimestamp":"2022-01-25T17:23:05Z","RayID":"6d332ff74fa45fbe","sampleInterval":1}
{"ClientRequestHost":"example.com","ClientRequestMethod":"GET","ClientRequestPath":"/","EdgeEndTimestamp":"2022-01-25T17:23:06Z","EdgeResponseBytes":363,"EdgeResponseStatus":200,"EdgeStartTimestamp":"2022-01-25T17:23:06Z","RayID":"6d332fffe9c4fc81","sampleInterval":1}

The Scenario

Now that you are able to create a new Instant Logs session let’s give it a purpose! Say you just recently deployed a new firewall rule blocking users from downloading a specific asset that is only available to users in Canada. For the purpose of this example, the asset is available at the path /canadians-only.

Specifying Fields

In order to see what firewall actions (if any) were taken, we need to make sure that we include ClientRequestCountry, ​​FirewallMatchesActions and FirewallMatchesRuleIDs fields when creating our session.

Additionally, any field available in our HTTP request dataset is usable by Instant Logs. You can view the entire list of HTTP Request fields on our developer docs.

Choosing a Sample Rate

Instant Logs users also have the ability to choose a sample rate. The sample parameter is the inverse probability of selecting a log. This means that "sample": 1 is 100% of records, "sample": 10 is 10% and so on.

Going back to our example of validating that our newly deployed firewall rule is working as expected, in this case, we are choosing not to sample the data by setting "sample": 1.

Please note that Instant Logs has a maximum data rate supported. For high volume domains, we sample server side as indicated in the “sampleInterval” parameter returned in the logs. For example, “sampleInterval”: 10 indicates this log message is just one out of 10 logs received.

Defining the Filters

Since we are only interested in requests with the path of /canadians-only, we can use filters to remove any logs that do not match that specific path. The filters consist of three parts: key, operator and value. The key can be any field specified in the "fields": "" list when creating the session. The complete list of supported operators can be found on our Instant Logs documentation.

To only get the logs of requests destined to /canadians-only, we can specify the following filter:

{
  "filter": "{\"where\":{\"and\":[{\"key\":\"ClientRequestPath\",\"operator\":\"eq\",\"value\":\"/canadians-only\"}]}}"
}

Creating an Instant Logs Session: Canadians Only

Using the information above, we can now craft the request for our custom Instant Logs session.

curl -X POST 'https://api.cloudflare.com/client/v4/zones/${ZONE_ID}/logpush/edge/jobs' \
-H 'X-Auth-Key: <KEY>' \
-H 'X-Auth-Email: <EMAIL>' \
-H 'Content-Type: application/json' \
--data-raw '{
  "fields": "ClientIP,ClientRequestHost,ClientRequestMethod,ClientRequestPath,ClientCountry,EdgeEndTimestamp,EdgeResponseBytes,EdgeResponseStatus,EdgeStartTimestamp,RayID,FirewallMatchesActions,FirewallMatchesRuleIDs",
  "sample": 1,
  "kind": "instant-logs",
  "filter": "{\"where\":{\"and\":[{\"key\":\"ClientRequestPath\",\"operator\":\"eq\",\"value\":\"/canadians-only\"}]}}"
}'

Angle Grinder

Now that we have a connection to our WebSocket and are receiving logs that match the request path /canadians-only, we can start slicing and dicing the logs to see that the rule is working as expected. A handy tool to use for this is Angle Grinder. Angle Grinder lets you apply filtering, transformations and aggregations on stdin with first class JSON support. For example, to get the number of visitors from each country we can sum the number of events by the ClientCountry field.

websocat wss://logs.cloudflare.com/instant-logs/ws/sessions/949f9eb846f06d8f8b7c91b186a349d2 | agrind '* | json | sum(sampleInterval) by ClientCountry'
ClientCountry    	_sum
---------------------------------
pt               	4
fr               	3
us               	3

Using Angle Grinder, we can create a query to count the firewall actions by each country.

websocat wss://logs.cloudflare.com/instant-logs/ws/sessions/949f9eb846f06d8f8b7c91b186a349d2 |  agrind '* | json | sum(sampleInterval) by ClientCountry,FirewallMatchesActions'
ClientCountry        FirewallMatchesActions        _sum
---------------------------------------------------------------
ca                   []                            5
us                   [block]                       1

Looks like our newly deployed firewall rule is working 🙂

Happy Logging!

Qubes OS 4.1.0 released

Post Syndicated from original https://lwn.net/Articles/884036/rss

Version 4.1.0 of the secure-desktop-oriented Qubes OS distribution has been
released. “The
culmination of years of development, this release brings a host of new
features, major improvements, and numerous bug fixes
“. New features
an experimental GUI domain separate from dom0, the “Qrexec” policy system,
progress toward a reproducible build, and more. See below and this article for more information.

[$] Raw photo editing with RawTherapee

Post Syndicated from original https://lwn.net/Articles/883599/rss

Digital photography opens up a whole new world of photo postprocessing
opportunities, especially if the photographer uses their camera’s raw
format to take advantage of all of the data collected by the sensor. On
the other hand, using raw images means doing without all of the processing
done by the camera and taking on a range of complex tasks. Raw photo
editors are designed to work with raw images as a key part of a
photographer’s workflow. Your editor recently reviewed the darktable editor, but there are
other options available in the free-software community. RawTherapee is a GPLv3-licensed raw
editor that is in some ways simpler than darktable — but that is not the
same as saying that it is simple.

Security updates for Monday

Post Syndicated from original https://lwn.net/Articles/884015/rss

Security updates have been issued by Debian (ldns and libphp-adodb), Fedora (kernel, kernel-headers, kernel-tools, mingw-binutils, mingw-openexr, mingw-python3, mingw-qt5-qtsvg, scap-security-guide, stratisd, util-linux, and webkit2gtk3), Mageia (lrzsz, qtwebengine5, and xterm), openSUSE (chromium), and Ubuntu (python-django).

Why Security in Kubernetes Isn’t the Same as in Linux: Part 2

Post Syndicated from Sagi Rosenthal original https://blog.rapid7.com/2022/02/07/why-security-in-kubernetes-isnt-the-same-as-in-linux-part-2/

Why Security in Kubernetes Isn't the Same as in Linux: Part 2

Security for Kubernetes might not be quite the same as what you’re used to. In our previous article, we covered why security is so important in both Linux on-premises servers and cloud Kubernetes clusters. We also talked about 3 major aspects of Linux server security — processes, network, and file system — and how they correspond to Kubernetes. So today, we’ll talk more about the security concerns unique to Kubernetes.

Configurations

When trying to secure your infrastructure, you have to start by configuring it well. For example, this might mean disabling all unused features or using allow-policies wherever you can to keep your files, executables, or network available only to the intended entity. Both Linux servers and Kubernetes clusters have known vulnerabilities and recommendations.

One of the famous among these is the Center for Internet Security (CIS) recommendations, which are often used for compliance for insurance. Having a cloud security platform that can help implement these recommendations can be a major boon to your security.

API server

The Kubernetes API server is the admin panel, so to speak, of your cluster. In most deployments, this HTTP server is exposed to the internet. This means that a hacker that finds their way to the API server can have full control over your cluster.

Using the most strict authentication and authorization settings is highly recommended to prevent this. If you can set your cluster to private, with access only allowed from an internal network, you can sleep well at night. And just as with with configurations, you should be aware at all times of who (and what) can have access to which resources and operations in your cluster.

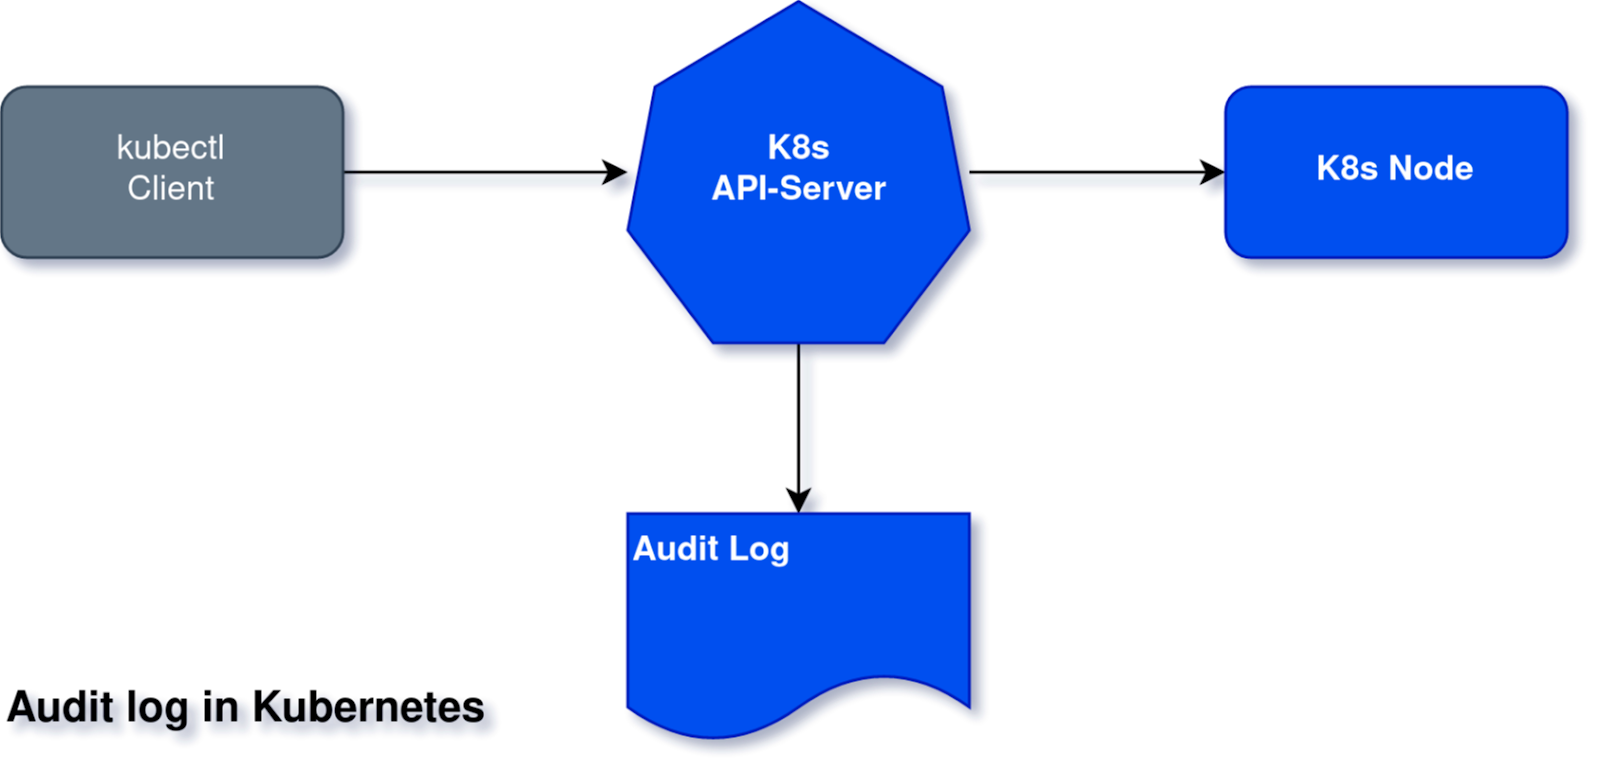
Audit log and other Kubernetes logs

In Kubernetes, there are additional attack vectors using the Kubernetes control plane itself that don’t exist in Linux server security. For example, an attack could call the Kubernetes API to load a new pod you didn’t want.

Kubernetes and cloud providers invest a lot of effort in preventing unauthorized users and machines from doing this. But there is always a chance that one of your employees gets hacked or a badly configured service account has too much power. Kubernetes logs all requests to its audit log so they can be investigated later in case of a breach. Additional logs include the kube-API log or etcd (resources DB) log.

Why Security in Kubernetes Isn't the Same as in Linux: Part 2

Container runtime

Container runtime is also a unique aspect of Kubernetes security. In Kubernetes, each node is actually a virtual Linux server running a container runtime daemon. A container runtime is responsible for managing the images and running and monitoring the containers, their storage and network provisioning, and more. You might be familiar with Docker as a container runtime. In reality, Docker is a company developing multiple container tools, and their container runtime is named containerd. Other container runtimes for Kubernetes include CRI-O, Rocket, and more.

Apart from a whole Linux server or virtual machine that uses its own single operating system, multiple containers are usually running over multiple operating systems that share the same host kernel. Although the operating systems of the containers are minimal, they may still have security holes. And the more holes the merrier for the attacker! Monitoring the container runtime activity can also yield a lot of information about what is going on in the node — what processes are running inside the container, any internal communication that might escape from network monitoring, the data being collected and created, and so on.

Right tools, lower risks

The unique interfaces and engines of Kubernetes can be an additional exposed surface in terms of security, especially when considering the complexity of the system. However, don’t forget that distribution and containerization add to security and help isolate potential malware.

Kubernetes may come with a few new risks to watch out for, but that’s no reason to be scared off. As long as you know what to look for, security for your Kubernetes clusters doesn’t have to be any harder than it was for your Linux servers. And there’s no need to go it alone — not when you can have handy tools like InsightCloudSec, Rapid7’s cloud-native security platform, at your side.

Additional reading

NEVER MISS A BLOG

Get the latest stories, expertise, and news about security today.

Calling all Computing and ICT teachers in the UK and Ireland: Have your say

Post Syndicated from Sue Sentance original https://www.raspberrypi.org/blog/computing-ict-teacher-survey-uk-ireland-ukicts-call-for-responses/

Back in October, I wrote about a report that the Brookings Institution, a US think tank, had published about the provision of computer science in schools around the world. Brookings conducted a huge amount of research on computer science curricula in a range of countries, and the report gives a very varied picture. However, we believe that, to see a more complete picture, it’s also important to gather teachers’ own perspectives on their teaching.

school-aged girls and a teacher using a computer together.

Complete our survey for computing teachers

Experiences shared by teachers on the ground can give important insights to educators and researchers as well as to policymakers, and can be used to understand both gaps in provision and what is working well. 

Today we launch a survey for computing teachers across Ireland and the UK. The purpose of this survey is to find out about the experiences of computing teachers across the UK and Ireland, including what you teach, your approaches to teaching, and professional development opportunities that you have found useful. You can access it by clicking one of these buttons:

The survey is:

  • Open to all early years, primary, secondary, sixth-form, and further education teachers in Ireland, England, Northern Ireland, Scotland, and Wales who have taught any computing or computer science (even a tiny bit) in the last year
  • Available in English, Welsh, Gaelic, and Irish/Gaeilge
  • Anonymous, and we aim to make the data openly available, in line with our commitment to open-source data; the survey collects no personal data
  • Designed to take you 20 to 25 minutes to complete

The survey will be open for four weeks, until 7 March. When you complete the survey, you’ll have the opportunity to enter a prize draw for a £50 book token per week, so if you complete the survey in the first week, you automatically get four chances to win a token!

We’re aiming for 1000 teachers to complete the survey, so please do fill it in and share it with your colleagues. If you can help us now, we’ll be able to share the survey findings on this website and other channels in the summer.

“Computing education in Ireland — as in many other countries — has changed so much in the last decade, and perhaps even more so in the last few years. Understanding teachers’ views is vital for so many reasons: to help develop, inform, and steer much-needed professional development; to inform policymakers on actions that will have positive effects for teachers working in the classroom; and to help researchers identify and conduct research in areas that will have real impact on and for teachers.”

– Keith Quille (Technological University Dublin), member of the research project team

What computing is taught in the UK and Ireland?

There are key differences in the provision of computer science and computing education across the UK and Ireland, not least what we all call the subject.

In England, the mandatory national curriculum subject is called Computing, but for learners electing to take qualifications such as GCSE and A level, the subject is called computer science. Computing is taught in all schools from age 5, and is a broad subject covering digital literacy as well as elements of computer science, such as algorithms and programming; networking; and computer architecture.

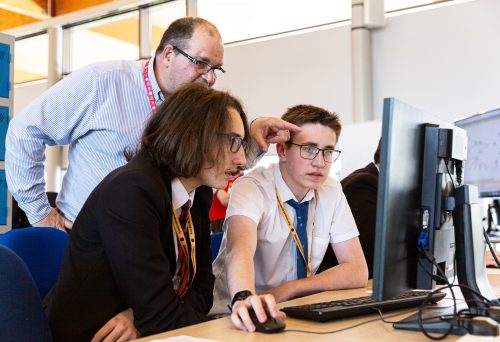
Male teacher and male students at a computer

In Northern Ireland, the teaching curriculum involves developing Cross-Curricular Skills (CCS) and Thinking Skills and Personal Capabilities. This means that from the Early Years Foundation Stage to the end of key stage 3, “using ICT” is one of the three statutory CCS, alongside “communication” and “using mathematics”, which must be included in lessons. At GCSE and A level, the subject (for those who select it) is called Digital Technology, with GCSE students being able to choose between GCSE Digital Technology (Multimedia) and GCSE Digital Technology (Programming).

In Scotland, the ​​Curriculum for Excellence is divided into two phases: the broad general education (BGE) and the senior phase. In the BGE, from age 3 to 15 (the end of the third year of secondary school), all children and young people are entitled to a computing science curriculum as part of the Technologies framework. In S4 to S6, young people may choose to extend and deepen their learning in computing science through National and Higher qualification courses.

A computing teacher and students in the classroom.

In Wales, computer science will be part of a new Science & Technology area of learning and experience for all learners aged 3-16. Digital competence is also a statutory cross-curricular skill alongside literacy and numeracy;  this includes Citizenship; Interacting and collaborating; Producing; and Data and computational thinking. Wales offers a new GCSE and A level Digital Technology, as well as GCSE and A level Computer Science.

Ireland has introduced the Computer Science for Leaving Certificate as an optional subject (age ranges typically from 15 to 18), after a pilot phase which began in 2018. The Leaving Certificate subject includes three strands: practices and principles; core concepts; and computer science in practice. At junior cycle level (age ranges typically from 12 to 15), an optional short course in coding is now available. The short course has three strands: Computer science introduction; Let’s get connected; and Coding at the next level. 

What is the survey?

The survey is a localised and slightly adapted version of METRECC, which is a comprehensive and validated survey tool developed in 2019 to benchmark and measure developments of the teaching and learning of computing in formal education systems around the world. METRECC stands for ‘MEasuring TeacheR Enacted Computing Curriculum’. The METRECC survey has ten categories of questions and is designed to be completed by practising computing teachers.

Using existing standardised survey instruments is good research practice, as it increases the reliability and validity of the results. In 2019, METRECC was used to survey teachers in England, Scotland, Ireland, Italy, Malta, Australia, and the USA. It was subsequently revised and has been used more recently to survey computing teachers in South Asia and in four countries in Africa.

A computing teacher and a learner do physical computing in the primary school classroom.

With sufficient responses, we hope to be able to report on the resources and classroom practices of computing teachers, as well as on their access to professional development opportunities. This will enable us to not only compare the UK’s four devolved nations and Ireland, but also to report on aspects of the teaching of computing in general, and on how teachers perceive the teaching of the subject. As computing is a relatively new subject whatever country you are in, it’s crucial to gather and analyse this information so that we can develop our understanding of the teaching of computing. 

The research team

For this project, we are working as a team of researchers across the UK and Ireland. Together we have a breadth of experience around the development of computing as a school subject (using this broad term to also cover digital competencies and digital technology) in our respective countries. We also have experience of quantitative research and reporting, and we are aiming to publish the results in an academic journal as well as disseminate them to a wider audience. 

In alphabetical order, on the team are:

  • Elizabeth Cole, who researches early years and primary programming education at the Centre for Computing Science Education (CCSE), University of Glasgow
  • Tom Crick, who is Professor of Digital Education & Policy at Swansea University and has been involved in policy development around computing in Wales for many years
  • Diana Kirby, who is a Programme Coordinator at the Raspberry Pi Foundation
  • Nicola Looker, who is a Lecturer in Secondary Education at Edgehill University, and a PhD student at CCSE, University of Glasgow, researching programming pedagogy
  • Keith Quille, who is a Senior Lecturer in Computing at Technological University Dublin
  • Sue Sentance, who is the Director of the Raspberry Pi Computing Education Research Centre at University of Cambridge; and Chief Learning Officer at the Raspberry Pi Foundation

In addition, Dr Irene Bell, Stranmillis University College, Belfast, has been assisting the team to ensure that the survey is applicable for teachers in Northern Ireland. Keith, Sue, and Elizabeth were part of the original team that designed the survey in 2019.

How can I find out more?

On this page, you’ll see more information about the survey and our findings once we start analysing the data. You can bookmark the page, as we will keep it updated with the results of the survey and any subsequent publications.

The post Calling all Computing and ICT teachers in the UK and Ireland: Have your say appeared first on Raspberry Pi.

Репликата на изкуството и изкуството на репликата

Post Syndicated from original https://bivol.bg/%D1%80%D0%B5%D0%BF%D0%BB%D0%B8%D0%BA%D0%B0%D1%82%D0%B0-%D0%BD%D0%B0-%D0%B8%D0%B7%D0%BA%D1%83%D1%81%D1%82%D0%B2%D0%BE%D1%82%D0%BE-%D0%B8-%D0%B8%D0%B7%D0%BA%D1%83%D1%81%D1%82%D0%B2%D0%BE%D1%82%D0%BE.html

понеделник 7 февруари 2022


„Това е абсурд и е недопустимо. Това е кощунство спрямо паметта на Майстора. Обезателно трябва да се преустанови”.—„Хората, съпреживявайки лично един проблем – не само в областта на трансполовата общност,…

Stable kernels galore

Post Syndicated from original https://lwn.net/Articles/883949/rss

The
5.16.6,
5.15.20,
5.10.97, and
5.4.177
stable kernel updates have been released. Unfortunately, a
problem was reported
almost immediately after that release, leading to
the reversion of a broken patch and the subsequent release of
5.16.7,
5.15.21, and
5.10.98.
It’s worth noting that numerous groups tested the first set of releases and
reported successful results (they can be seen as replies to the
-rc1 posting
), but nobody hit this problem in time.

Friday Squid Blogging: Are Squid from Another Planet?

Post Syndicated from Bruce Schneier original https://www.schneier.com/blog/archives/2022/02/friday-squid-blogging-are-squid-from-another-planet.html

An actually serious scientific journal has published a paper speculating that octopus and squid could be of extraterrestrial origin.

News article.

As usual, you can also use this squid post to talk about the security stories in the news that I haven’t covered.

Read my blog posting guidelines here.

How to mount Linux volume and keep mount point consistency

Post Syndicated from limillan original https://aws.amazon.com/blogs/compute/how-to-mount-linux-volume-and-keep-mount-point-consistency/

This post is written by: Leonardo Azize Martins, Cloud Infrastructure Architect, Professional Services

Customers often use Amazon Elastic Compute Cloud (Amazon EC2) Linux based instances with many Amazon Elastic Block Store (Amazon EBS) volumes attached. In this case, device name can vary depending on some facts, such as virtualization type, instance type, or operating system. As the device name can change, the customer shouldn’t rely on the device name to mount volumes from it. The customer wants to avoid the situation where a volume is mounted on a different mount point just because the device name changed, or the device name doesn’t exist because the name pattern changed.

Customers who want to utilize the latest instance family usually change the instance type when a new one is available. The device name can be different between instance families, such as T2 and T3. T2 uses /dev/sd[a-z], while T3 uses /dev/nvme[0-26]n1. If you mount a device on T2 called /dev/sdc, when you change the instance family to T3 the same device won’t be called /dev/sdc anymore. In this case, it will fail to mount.

Amazon EBS volumes are exposed as NVMe block devices on instances built on the AWS Nitro System. The block device driver can assign NVMe device names in a different order than what you specified for the volumes in the block device mapping. In this situation, a device that should be mounted on /data could end-up being mounted on /logs.

On Linux, you can use the fstab file to mount devices using kernel name descriptors (the traditional way), file system labels, or the file system UUID. Kernel name descriptors aren’t persistent and can change each boot. Therefore, they shouldn’t be used in configuration files.

UUID is a mechanism for giving each filesystem a unique identifier. These identifiers’ attributes are generated by filesystem utilities (mkfs.*) when the device is formatted, and they’re designed so that collisions are unlikely. All GNU/Linux filesystems (including swap and LUKS headers of raw encrypted devices) support UUID.

As UUID is a filesystem attribute, it can also be used with Logical Volume Manager (LVM) and Linux software RAID (mdadm).

Depending on the fstab file configuration, you may find that you can’t access your instance, which requires you to follow a rescue process to fix issues. This is the case if you configure the fstab file with the device name and change the instance type.

This post shows how to mount Linux volumes and keep mount points preserved when the instance type is changed or the instance is rebooted.

Overview of solution

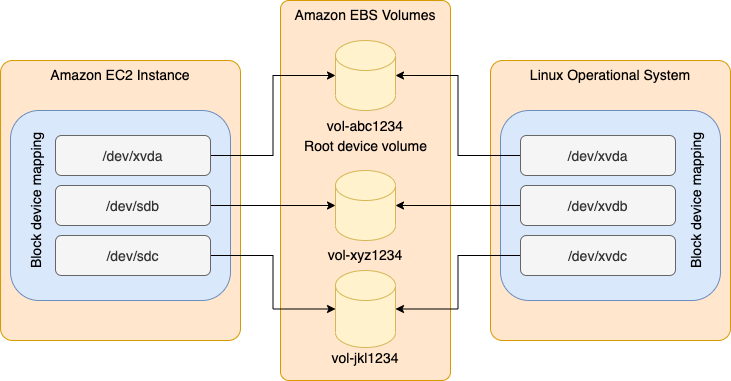
When you create an instance, you specify block devices mapping. It doesn’t mean that the Linux device has the same name or can be discovered in the same order as specified on the instance mapping. This situation can be more evident when using applications that require more volumes.

Using UUID to mount volumes lets you mitigate future issues when you stop and start your instance or change the instance type.

EC2 instance block device mapping

Figure 1: EC2 instance block device mapping

Walkthrough

You will create one instance with three volumes: one root volume and two data volumes. We use Amazon Linux 2 in this post. In this instance type, volumes have a specific name format. Later, you will change the instance type. The new instance type volumes will have another name format.

Follow these steps:

  • Create an instance with three volumes
  • Create the filesystem on the volumes and mount them
  • Change the instance type

Prerequisites

For this walkthrough, you should have the following prerequisites:

Create instance

Create one instance with three volumes: a root volume and two data volumes. Use Launch Instance Wizard with the following details.

Launch Amazon Linux 2 instance

  1. On Step 1, choose Amazon Linux 2 AMI (HVM), SSD Volume Type.
  2. On Step 2, choose micro.
  3. On Step 3, choose Next.
  4. On Step 4, add two new volumes, device /dev/sdb 10 GiB and device /dev/sdc 12 GiB.

Launch instances, add storage

Figure 2: Launch instances, add storage

Create filesystem and mount

Connect to your instance using EC2 Instance Connect or any other method that feels comfortable for you. Mount the device using UUID instead of the device name. Run the following instructions as the user root.

Format and mount the device

  1. Run the following command to confirm that you have three disks:
    $ lsblk
  2. Format disk as xfs, and run the following commands:
    mkfs.xfs /dev/xvdb
    mkfs.xfs /dev/xvdc
  3. Create mount point, and run the following commands:
    mkdir /mnt/disk1
    mkdir /mnt/disk2
  4. Add mount instructions, and run the following commands:
    echo "$(blkid /dev/xvdb | awk '{print $2}') /mnt/disk1 xfs defaults,noatime" | tee -a /etc/fstab
    echo "$(blkid /dev/xvdc | awk '{print $2}') /mnt/disk2 xfs defaults,noatime" | tee -a /etc/fstab
  5. Mount volumes, create dummy file, and run the following commands:
    mount -a
    touch /mnt/disk1/file1.txt
    touch /mnt/disk2/file2.txt

You will have an fstab file like the following:

cat /etc/fstab
UUID=7b355c6b-f82b-4810-94b9-4f3af651f629     /           xfs    defaults,noatime  1   1
UUID="2c160dd6-586c-4258-84bb-c79933b9ae02" /mnt/disk1 xfs defaults,noatime
UUID="3e7a0c28-7cf1-40dc-82a1-2f5cfb53f9a4" /mnt/disk2 xfs defaults,noatime

Change instance type

Change the instance type from t2.micro to t3.micro.

Launch Amazon Linux 2 instance

  1. Stop instance.
  2. Change the instance type to micro.
  3. Start instance.
  4. Connect to your instance using EC2 Instance Connect.
  5. Check the device name, and run the following command:
lsblk
  1. List files, and run the following command:
ls -l /mnt/*

Note that the device names are changed from xvd* to nvme*. All of the devices are mounted without any issue and with the correct mount points.

Cleaning up

To avoid incurring future charges, delete the instance and all of the volumes that you created in this post.

The other side

UUID is an attribute of the filesystem that was generated when you formatted your device. Therefore, it will follow your device even if you create an AMI or snapshot. So you don’t need to worry about a restore process, and it will smoothly proceed to an instance restore. You must be careful if you restore a snapshot from one volume and attach it to the same instance, as you will end-up with two volumes that are using the same UUID. If you try to mount the restored volume on the same instance, then it will fail and you will find this message on /var/log/messages file. kernel: XFS (xvdf1): Filesystem has duplicate UUID f6646b81-f2a6-46ca-9f3d-c746cf015379 - can't mount It is even more important to be careful if you attach a volume created from the snapshot of the root volume and restart your instance. Since both volumes have the same UUID, you may find that a volume other than the one attached to /dev/xvda or /dev/sda has become the root volume of your instance. See the following example for details. Note that both volumes have the same UUID, but the one mounted on / is /dev/xvdf1, not /dev/xvda1, which is the real root volume for this instance.

$ blkid
/dev/xvda1: LABEL="/" UUID="f6646b81-f2a6-46ca-9f3d-c746cf015379" TYPE="xfs" PARTLABEL="Linux" PARTUUID="79fae994-3708-4293-bb29-4d069d1c786b"
/dev/xvdf1: LABEL="/" UUID="f6646b81-f2a6-46ca-9f3d-c746cf015379" TYPE="xfs" PARTLABEL="Linux" PARTUUID="79fae994-3708-4293-bb29-4d069d1c786b"
$ lsblk
NAME    MAJ:MIN RM SIZE RO TYPE MOUNTPOINT
xvda    202:0    0   8G  0 disk
└─xvda1 202:1    0   8G  0 part
xvdf    202:80   0   8G  0 disk
└─xvdf1 202:81   0   8G  0 part /

Conclusion

In this post, we covered how to use UUID to mount Linux devices using fstab file. This keeps the mount point on the correct device. It also lets you change the instance type without changes to the fstab file. You can use UUID with LVM and Linux software RAID (mdadm), UUID, as an attribute of the filesystem, will be the same even after a backup and restore process, snapshot, or clone. To learn more, check out our block device mappings and device names on Linux instances documentation.

How to build a multi-Region AWS Security Hub analytic pipeline and visualize Security Hub data

Post Syndicated from David Hessler original https://aws.amazon.com/blogs/security/how-to-build-a-multi-region-aws-security-hub-analytic-pipeline/

AWS Security Hub is a service that gives you aggregated visibility into your security and compliance posture across multiple Amazon Web Services (AWS) accounts. By joining Security Hub with Amazon QuickSight—a scalable, serverless, embeddable, machine learning-powered business intelligence (BI) service built for the cloud—your senior leaders and decision-makers can use dashboards to empower data-driven decisions and facilitate a secure configuration of AWS resources

In organizations that operate at cloud scale, being able to summarize and perform trend analysis is key to identifying and remediating problems early, which leads to the overall success of the organization. Additionally, QuickSight dashboards can be embedded in dashboard and reporting platforms that leaders are already familiar with, making the dashboards even more user friendly.

With the solution in this blog post, you can provide leaders with cross-AWS Region views of data to enable decision-makers to assess the health and status of an organizations IT infrastructure at a glance. You also can enrich the dashboard with data sources not available to Security Hub. Finally, this solution allows you the flexibility to have multiple administrator accounts across several AWS organizations and combine them into a single view.

In this blog post, you will learn how to build an analytics pipeline of your Security Hub findings, summarize the data with Amazon Athena, and visualize the data via QuickSight using the following steps:

  • Deploy an AWS Cloud Development Kit (AWS CDK) stack that builds the infrastructure you need to get started.
  • Create an Athena view that summarizes the raw findings.
  • Visualize the summary of findings in QuickSight.
  • Secure QuickSight using best practices.

For a high-level discussion without code examples please see Visualize AWS Security Hub Findings using Analytics and Business Intelligence Tools.

Prerequisites

This blog post assumes that you:

  • Have a basic understanding of how to authenticate and access your AWS account.
  • Are able to run commands via a command line prompt on your local machine.
  • Have a basic understanding of Structured Query Language (SQL).

Solution overview

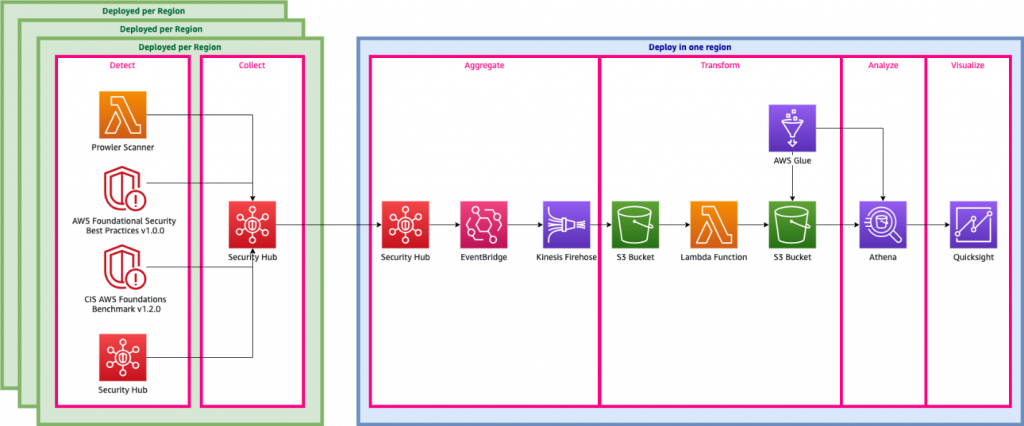
Figure 1 shows the flow of events and a high-level architecture diagram of the solution.

Figure 1. High level architecture diagram

Figure 1. High level architecture diagram

The steps shown in Figure 1 include:

  • Detect
  • Collect
  • Aggregate
  • Transform
  • Analyze
  • Visualize

Detect

AWS offers a number of tools to help detect security findings continuously. These tools fall into three types:

In this blog, you will use two built-in security standards of Security Hub—CIS AWS Foundations Benchmark controls and AWS Foundational Security Best Practices Standard—and a serverless Prowler scanner that acts as a third-party partner product. In cases where AWS Organizations is used, member accounts send these findings to the member account’s Security Hub

Collect

Within a region, security findings are centralized into a single administrator account using Security Hub.

Aggregate

Using the cross-Region aggregation feature within Security Hub, findings within each administrator account can be aggregated and continuously synchronized across multiple regions.

Ingest

Security Hub not only provides a comprehensive view of security alerts and security posture across your AWS accounts, it also acts as a data sink for your security tools. Any tool that can expose data via AWS Security Finding Format (ASFF) can use the BatchImportFindings API action to push data to Security Hub. For more details, see Using custom product integration to send findings to AWS Security Hub and Available AWS service integrations in the Security Hub User Guide.

Transform

Data coming out of Security Hub is exposed via Amazon EventBridge. Unfortunately, it’s not quite in a form that Athena can consume. EventBridge streams data through Amazon Kinesis Data Firehose directly to Amazon Simple Storage Service (Amazon S3). From Amazon S3, you can create an AWS Lambda function that flattens and fixes some of the column names, such as by removing special characters that Athena cannot recognize. The Lambda function then saves the results back to S3. Finally, an AWS Glue crawler dynamically discovers the schema of the data and creates or updates an Athena table.

Analyze

You will aggregate the raw findings data and create metrics along various grains or pivots by creating a simple yet meaningful Athena view. With Athena, you also can use views to join the data with other data sources, such as your organization’s configuration management database (CMDB) or IT service management (ITSM) system.

Visualize

Using QuickSight, you will register the data sources and build visualizations that can be used to identify areas where security can be improved or reduce risk. This post shares steps detailing how to do this in the Build QuickSight visualizations section below.

Use AWS CDK to deploy the infrastructure

In order to analyze and visualize security related findings, you will need to deploy the infrastructure required to detect, ingest, and transform those findings. You will use an AWS CDK stack to deploy the infrastructure to your account. To begin, review the prerequisites to make sure you have everything you need to deploy the CDK stack. Once the CDK stack is deployed, you can deploy the actual infrastructure. After the infrastructure has been deployed, you will build an Athena view and a QuickSight visualization.

Install the software to deploy the solution

For the solution in this blog post, you must have the following tools installed:

  • The solution in this blog post is written in Python, so you must install Python in addition to CDK. Instructions on how to install Python version 3.X can be found on their downloads page.
  • AWS CDK requires node.js. Directions on how to install node.js can found on the node.js downloads page.
  • This CDK application uses Docker for local bundling. Directions for using Docker can be found at Get Docker.
  • AWS CDK—a software-development framework for defining cloud infrastructure in code and provisioning it through AWS CloudFormation. To install CDK, visit AWS CDK Toolkit page.

To confirm you have the everything you need

  1. Confirm you are running version 1.108.0 or later of CDK.

    $ cdk ‐‐version

  2. Download the code from github by cloning the repository. cd into the clone directory.

    $ git clone [email protected]:aws-samples/aws-security-hub-analytic-pipeline.git

    $ cd aws-security-hub-analytic-pipeline

  3. Manually create a virtualenv.

    $ python3 -m venv .venv

  4. After the initialization process completes and the virtualenv is created, you can use the following step to activate your virtualenv.

    $ source .venv/bin/activate

  5. If you’re using a Windows platform, use the following command to activate virtualenv:

    % .venv/Scripts/activate.bat

  6. Once the virtualenv is activated, you can install the required dependencies.

    $ pip install -r requirements.txt

Use AWS CDK to deploy the infrastructure into your account

The following steps use AWS CDK to deploy the infrastructure. This infrastructure includes the various scanners, Security Hub, EventBridge, and Kinesis Firehose streams. When complete, the raw Security Hub data will already be stored in an S3 bucket.

To deploy the infrastructure using AWS CDK

  1. If you’ve never used AWS CDK in the account you’re using or if you’ve never used CDK in the us-east-1, us-east-2, or us-west-1 Regions, you must bootstrap the regions via the command prompt.

    $ cdk bootstrap

  2. At this point, you can deploy the stack to your default AWS account via the command prompt.

    $ cdk deploy –all

  3. While cdk deploy is running, you will see the output in Figure 2. This is a prompt to ensure you’re aware that you’re making a security-relevant change and creating AWS Identity and Access Management (IAM) roles. Enter y when prompted to continue the deployment process:

    Figure 2. CDK approval prompt to create IAM roles

    Figure 2. CDK approval prompt to create IAM roles

  4. Confirm cdk deploy is finished. When the deployment is finished, you should see three stack ARNs. It will look similar to Figure 3.

    Figure 3. Final output of CDK deploy

    Figure 3. Final output of CDK deploy

As a result of the deployed CDK code, Security Hub and the Prowler scanner will automatically scan your account, process the data, and send it to S3. While it takes less than an hour for some data to be processed and searchable in Athena, we recommend waiting 24 hours before proceeding to the next steps, to ensure enough data is processed to generate useful visualizations. This is because the remaining steps roll-up findings by the hour. Also, it takes several minutes to get initial results from the Security Hub standards and up to an hour to get initial results from Prowler.

Build an Athena view

Now that you’re deployed the infrastructure to detect, ingest, and transform security related findings, it’s time to use an Athena view to accomplish the analyze portion of the solution. The following view aggregates the number of findings for a given day. Athena views can be used to summarize data or enrich it with data from other sources. Use the following steps to build a simple example view. For more information on creating Athena views, see Working with Views.

To build an Athena view

  1. Open the AWS Management Console and ensure that the Region is set to us-east-1 (Northern Virginia).
  2. Navigate to the Athena service. If you’ve never used this service, choose Get Started to navigate to the Query Editor screen. Otherwise, the Query Editor screen is the default view.
  3. If you’re new to Athena, you also need to set up a query result location.
    1. Choose Settings in the top right of the Query Editor screen to open the settings panel.
    2. Choose Select to select a query result location.

      Figure 4. Athena settings

      Figure 4. Athena settings

    3. Locate an S3 bucket in the list that starts with analyticsink-queryresults and choose the right-arrow icon.
    4. Choose Select to select a query results bucket.

      Figure 5. Select S3 location confirmation

      Figure 5. Select S3 location confirmation

  4. Select AwsDataCatalog as the Data source and security_hub_database as the Database. The Query Editor screen should look like Figure 6.

    Figure 6. Empty query editor

    Figure 6. Empty query editor

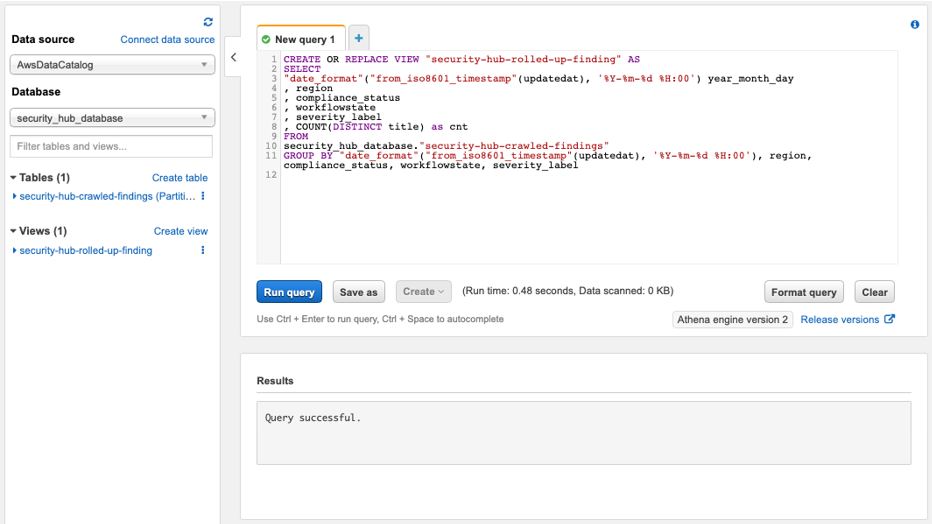
  5. Copy and paste the following SQL in the query window:

    CREATE OR REPLACE VIEW “security-hub-rolled-up-finding” AS
    SELECT

    “date_format”(“from_iso8601_timestamp”(updatedat), ‘%Y-%m-%d %H:00’) year_month_day
    , region
    , compliance_status
    , workflowstate
    , severity_label
    , COUNT(DISTINCT title) as cnt
    FROM
    security_hub_database.“security-hub-crawled-findings”
    GROUP BY “date_format”(“from_iso8601_timestamp”(updatedat), ‘%Y-%m-%d %H:00’), compliance_status, workflowstate, severity_label, region

  6. Choose the Run query button.

If everything is correct, you should see Query successful in the Results, as shown in Figure 7.

Figure 7. Creating an Athena view

Figure 7. Creating an Athena view

Build QuickSight visualizations

Now that you’ve deployed the infrastructure to detect, ingest, and transform security related findings, and have created an Athena view to analyze those findings, it’s time to use QuickSight to visualize the findings. To use QuickSight, you must first grant QuickSight permissions to access S3 and Athena. Next you create a QuickSight data source. Third, you will create a QuickSight analysis. (Optional) When complete, you can publish the analysis.

You will build a simple visualization that shows counts of findings over time separated by severity, though it’s also possible to use QuickSight to tell rich and compelling visual stories.

In order to use QuickSight, you need to sign up for a QuickSight subscription. Steps to do so can be found in Signing Up for an Amazon QuickSight Subscription.

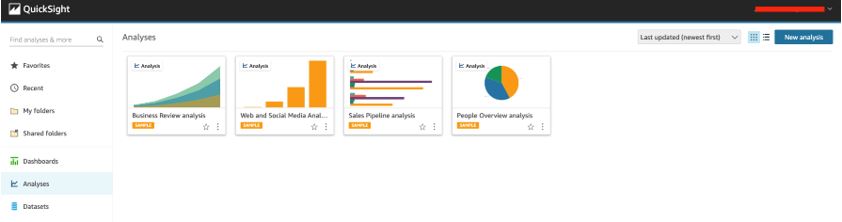
The first thing you need to do once logged in to QuickSight is create the data source. If this is your first time logging in to the service, you will be greeted with an initial QuickSight page as shown in Figure 8.

Figure 8. Initial QuickSight page

Figure 8. Initial QuickSight page

Grant QuickSight access to S3 and Athena

While creating the Athena data source will enable QuickSight to query data from Athena, you also need to enable QuickSight to read from S3.

To grant QuickSight access to S3 and Athena

  1. Inside QuickSight, select your profile name (upper right). Choose Manage QuickSight, and then choose Security & permissions.
  2. Choose Add or remove.
  3. Ensure the checkbox next to Athena is selected.
  4. Ensure the checkbox next to Amazon S3 is selected.
  5. Choose Details and then choose Select S3 Buckets.
  6. Locate an S3 bucket in the list that starts with analyticsink-bucket and ensure the checkbox is selected.
    Figure 9. Example permissions

    Figure 9. Example permissions

  7. Choose Finish to save changes.

Create a QuickSight dataset

Once you’ve given QuickSight the necessary permissions, you can create a new dataset.

To create a QuickSight dataset

  1. Choose Datasets from the navigation pane at left. Then choose New Dataset.

    Figure 10. Dataset page

    Figure 10. Dataset page

  2. To create a new Athena connection profile, use the following steps:
    1. In the FROM NEW DATA SOURCES section, choose the Athena data source card.
    2. For Data source name, enter a descriptive name. For example: security-hub-rolled-up-finding.
    3. For Athena workgroup choose [ primary ].
    4. Choose Validate connection to test the connection. This also confirms encryption at rest.
    5. Choose Create data source.
  3. On the Choose your table screen, select:
    Catalog: AwsDataCatalog
    Database: security_hub_database
    Table: security-hub-rolled-up-finding
  4. Finally, select the Import to SPICE for quicker analytics option and choose Visualize.

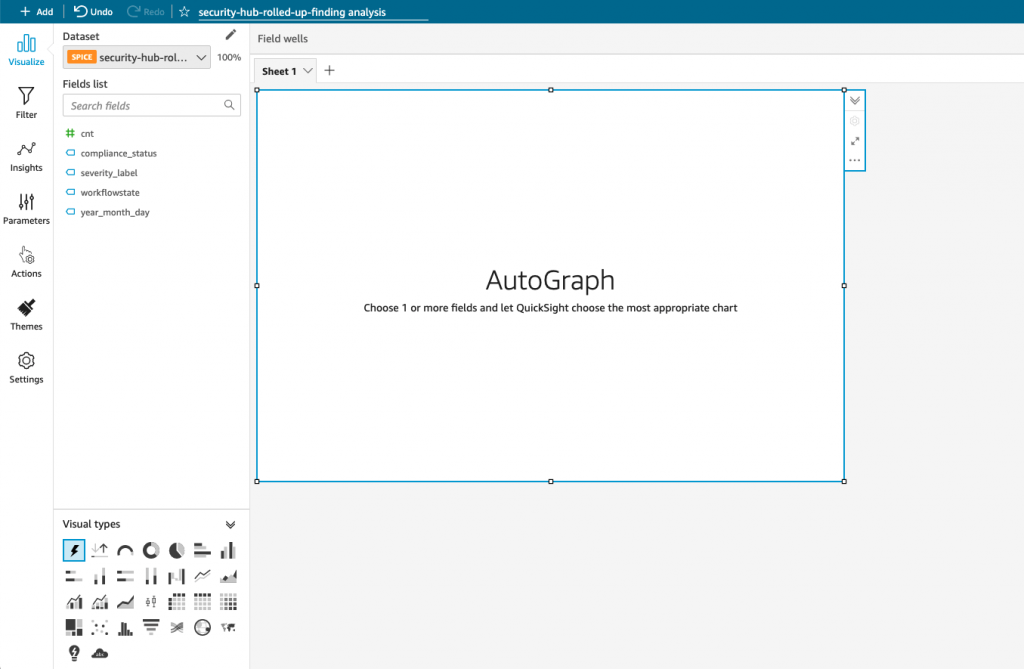
Once you’re finished, the page to create your first analysis will automatically open. Figure 11 shows an example of the page.

Figure 11. Create an analysis page

Figure 11. Create an analysis page

Create a QuickSight analysis

A QuickSight analysis is more than just a visualization—it helps you uncover hidden insights and trends in your data, identify key drivers, and forecast business metrics. You can create rich analytic experiences with QuickSight. For more information, visit Working with Visuals in the QuickSight User Guide.

For simplicity, you’ll build a visualization that summarizes findings categories by severity and aggregated by hour.

To create a QuickSight analysis

  1. Choose Line Chart from the Visual Types.

    Figure 12. Visual types

    Figure 12. Visual types

  2. Select Fields. Figure 13 shows what your field wells should look like at the end of this step.
    1. Locate the year_month_day_hour field in the field list and drag it over to the X axis field well.
    2. Locate the cnt field in the field list and drag it over to the Value field well.
    3. Locate the severity_label field in the field list and drag it over to Color field well.

      Figure 13. Field wells

      Figure 13. Field wells

  3. Add Filters.
    1. Select Filter in the left navigation panel.

      Figure 14. Filters panel

      Figure 14. Filters panel

    2. Choose Create one… and select the compliance_status field.
    3. Expand the filter and clear NOT_AVAILABLE and PASSED (Note: depending on your data, you might not have all of these statuses).
    4. Choose Apply to apply the filter.

      Figure 15. Filtering out findings that are not failing

      Figure 15. Filtering out findings that are not failing

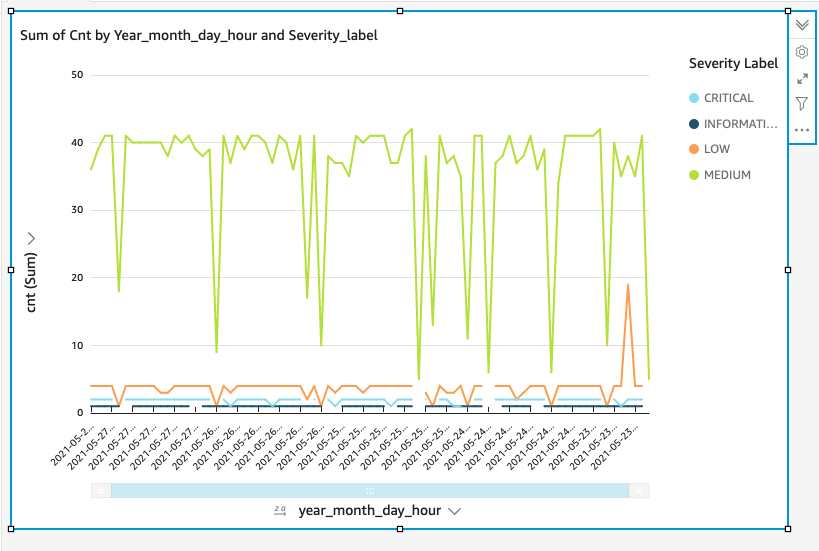
You should now see a visualization that looks like Figure 16, which shows a summary count of events and their severity.

Figure 16. Example visualization (note: this visualization has five days’ worth of data.)

Figure 16. Example visualization (note: this visualization has five days’ worth of data.)

Publish a QuickSight analysis dashboard (optional)

Publishing a dashboard is a great way to share reports with leaders. This two-step process allows you to share visualizations as a dashboard.

To publish a QuickSight analysis

  1. Choose Share on the application bar, then choose Publish dashboard.
  2. Select Publish new dashboard as, and then enter a dashboard name, such as Security Hub Findings by Severity.

You can also embed dashboards into web applications. This requires using the AWS SDK or through the AWS Command Line Interface (AWS CLI). For more information, see Embedding QuickSight Data Dashboards for Everyone.

Encouraged security posture in QuickSight

QuickSight has a number of security features. While the AWS Security section of the QuickSight User Guide goes into detail, here’s a summary of the standards that apply to this specific scenario. For more details see AWS security in Amazon QuickSight within the QuickSight user guide.

Clean up (optional)

When done, you can clean up QuickSight by removing the Athena view and the CDK stack. Follow the detailed steps below to clean up everything.

To clean up QuickSight

  1. Open the console and choose Datasets in the left navigation pane.
  2. Select security-hub-rolled-up-finding then choose Delete dataset.
  3. Confirm dataset deletion by choosing Delete.
  4. Choose Analyses from the left navigation pane.
  5. Choose the menu in the lower right corner of the security-hub-rolled-up-finding card.

    Figure 17. Example analysis card

    Figure 17. Example analysis card

  6. Select Delete and confirm Delete.

To remove the Athena view

  1. Paste the following SQL in the query window:

    DROP VIEW “security-hub-rolled-up-finding”

  2. Choose the Run query button.

To remove the CDK stack

  1. Run the following command in your terminal:

    cdk destroy

    Note: If you experience errors, you might need to reactivate your Python virtual environment by completing steps 3–5 of Use AWS CDK to deploy the infrastructure.

Conclusion

In this blog, you used Security Hub and QuickSight to deploy a scalable analytic pipeline for your security tools. Security Hub allowed you to join and collect security findings from multiple sources. With QuickSight, you summarized data for your senior leaders and decision-makers to give them the right data in real-time.

You ensured that your sensitive data remained protected by explicitly granting QuickSight the ability to read from a specific S3 bucket. By authorizing access only to the data sources needed to visualize your data, you ensure least privilege access. QuickSight supports many other AWS data sources, including Amazon RDS, Amazon Redshift, Lake Formation, and Amazon OpenSearch Service (successor to Amazon Elasticsearch Service). Because the data doesn’t live inside an Amazon Virtual Private Cloud (Amazon VPC), you didn’t need to grant access to any specific VPCs. Limiting access to VPCs is another great way to improve the security of your environment.

 
If you have feedback about this post, submit comments in the Comments section below. If you have questions about this post, start a new thread on the Security Hub forum. To start your 30-day free trial of Security Hub, visit AWS Security Hub.

Want more AWS Security how-to content, news, and feature announcements? Follow us on Twitter.

David Hessler

David Hessler

David is a senior cloud consultant with AWS Professional Services. He has over a decade of technical experience helping customers tackle their most challenging technical problems and providing tailor-made solutions using AWS services. He is passionate about DevOps, security automation, and how the two work together to allow customers to focus on what matters: their mission.

The collective thoughts of the interwebz