Post Syndicated from Talks at Google original https://www.youtube.com/watch?v=lG_fOLjKp_s
Courtès: What’s in a package
Post Syndicated from original https://lwn.net/Articles/870047/rss
Over at the Guix-HPC blog, Ludovic Courtès writes about trying to package the PyTorch machine-learning library for the Guix distribution. Building from source in a user-verifiable manner is part of the philosophy behind Guix, but there were a number of problems that were encountered:
The first surprise when starting packaging PyTorch is that, despite being on PyPI, PyTorch is first and foremost a large C++ code base. It does have a setup.py as commonly found in pure Python packages, but that file delegates the bulk of the work to CMake.
The second surprise is that PyTorch bundles (or “vendors”, as some would say) source code for no less than 41 dependencies, ranging from small Python and C++ helper libraries to large C++ neural network tools. Like other distributions such as Debian, Guix avoids bundling: we would rather have one Guix package for each of these dependencies. The rationale is manifold, but it boils down to keeping things auditable, reducing resource usage, and making security updates practical.
[$] A discussion on folios
Post Syndicated from original https://lwn.net/Articles/869942/rss
A few weeks ago, Matthew Wilcox might have guessed that his session
at the 2021 Linux
Plumbers Conference would be focused rather differently. But, as we reported earlier in September, his folio patch set ran into some, perhaps
unexpected, opposition and, ultimately, did not land in the mainline for
5.15. Instead of discussing how to use folios as part
of the File
Systems microconference, he led a discussion that was, at least in part, on the
path forward for them.
GNOME 41 released
Post Syndicated from original https://lwn.net/Articles/870031/rss
The GNOME project has announced the
release of GNOME 41.
The most notable changes this in release include an improved Software app, new multitasking settings, and enhanced power management features. With these changes, GNOME is smarter, more flexible, and offers a richer and more engaging experience than ever before.
The new release also comes with significant improvements for developers, including a new developer documentation website, a major new version of the Human Interface Guidelines, new features in the Builder IDE, GTK 4 enhancements, and much more.
Scaling Ad Verification with Machine Learning and AWS Inferentia
Post Syndicated from Julien Simon original https://aws.amazon.com/blogs/aws/scaling-ad-verification-with-machine-learning-and-aws-inferentia/
Amazon Advertising helps companies build their brand and connect with shoppers, through ads shown both within and beyond Amazon’s store, including websites, apps, and streaming TV content in more than 15 countries. Businesses or brands of all sizes including registered sellers, vendors, book vendors, Kindle Direct Publishing (KDP) authors, app developers, and agencies on Amazon marketplaces can upload their own ad creatives, which can include images, video, audio, and of course products sold on Amazon. To promote an accurate, safe, and pleasant shopping experience, these ads must comply with content guidelines.
Here’s a simple example. Can you figure out why two of the following ads would not be compliant?

The ad in the center doesn’t feature the product in context. It also shows the same product multiple times. The ad on the right looks much better, but it contains text, which is not allowed for this ad format.
New ad creatives come in many sizes, shapes, and languages, and at very large scale. Assuming it would even be possible, verifying them manually would be a complex, slow, and error-prone process. Machine learning (ML) to the rescue!
Using Machine Learning to Verify Ad Creatives
Each ad must be evaluated against many rules, which no single model could reasonably learn. In fact, it takes many models to check ad properties, for example:
- Media-specific models that analyze images, video, audio, and text that describe the advertised products.
- Content-specific models that detect headlines, text, backgrounds, and objects.
- Language-specific models that validate syntax and grammar, and flag unapproved language.
Some of these capabilities are readily available in AWS AI services. For example, Amazon Advertising teams use Amazon Rekognition to extract metadata information from images and videos.
Other capabilities require custom models trained on in-house datasets. For this purpose, Amazon teams labeled large ad datasets with Amazon SageMaker Ground Truth, using a combination of manual labeling, and automatic labeling with active learning. Using these datasets, teams then used Amazon SageMaker to train models, and deploy them automatically on real-time prediction endpoints with the AWS Cloud Development Kit (AWS CDK) and Amazon SageMaker Pipelines.
When a business uploads a new ad, relevant models are invoked simultaneously to process specific ad components, extract signals, and output a quality score. All scores are then consolidated, and sent to a final model that predicts whether the ad should be manually reviewed.
Thanks to this process, most new ads can be verified and published automatically, which means businesses can quickly promote their brand and products, and Amazon can maintain a high-quality shopping experience.
However, faced with a growing number of more complex models, Amazon Advertising teams started to look for a solution that could increase prediction throughput while reducing costs. They found it in AWS Inferentia.
What is AWS Inferentia?
Available in Amazon EC2 Inf1 instances, AWS Inferentia is a custom chip built by AWS to accelerate ML inference workloads, and optimize their cost. Each AWS Inferentia chip contains four NeuronCores. Each NeuronCore implements a high-performance systolic array matrix multiply engine, which massively speeds up typical deep learning operations such as convolution and transformers. NeuronCores are also equipped with a large on-chip cache, which helps to cut down on external memory accesses, reduce latency, and increase throughput.
Thanks to AWS Neuron, a software development kit for ML inference, AWS Inferentia can be used natively from ML frameworks like TensorFlow, PyTorch, and Apache MXNet. It consists of a compiler, runtime, and profiling tools that enable you to run high-performance and low latency inference. For many trained models, compilation is a one-liner with the Neuron SDK, not requiring any additional application code changes. The result is a high performance inference deployment, that can easily scale while keeping costs under control. You’ll find many examples in the Neuron documentation. Alternatively, thanks to Amazon SageMaker Neo, you can also compile models directly in SageMaker.
Scaling Ad Verification with AWS Inferentia
Amazon Advertising teams started compiling their models for Inferentia, and deploying them on SageMaker endpoints powered by Inf1 instances. They compared the Inf1 endpoints to the GPU endpoints they had been using so far. They found that large deep learning models like BERT run more effectively on Inferentia, which decreases latency by 30%, and reduces costs by 71%. A few months ago, ML teams working on Amazon Alexa came to the same conclusions.
What about prediction quality? GPU models are typically trained with single-precision floating-point data (FP32). Inferentia uses the shorter FP16, BF16, and INT8 data types, which can create slight differences in predicted output. Running both GPU and Inferentia models in parallel, teams analyzed probability distributions, tweaked prediction thresholds for their Inferentia models, and made sure that these models would predict ads just like GPU models did. You can learn more about these techniques in the Performance Tuning section of the documentation.
With these final adjustments out of the way, the Amazon Advertising teams started phasing out GPU models. All text data is now predicted on Inferentia, and the migration of computer vision pipelines is in progress.
AWS Customers Are Successful with AWS Inferentia
In addition to Amazon teams, customers also report very nice results on scaling and optimizing their ML workloads with Inferentia.
 Binghui Ouyang, Senior Data Scientist at Autodesk: “Autodesk is advancing the cognitive technology of our AI-powered virtual assistant, Autodesk Virtual Agent (AVA) by using Inferentia. AVA answers over 100,000 customer questions per month by applying natural language understanding (NLU) and deep learning techniques to extract the context, intent, and meaning behind inquiries. Piloting Inferentia, we are able to obtain a 4.9x higher throughput over G4dn for our NLU models, and look forward to running more workloads on the Inferentia-based Inf1 instances.”
 Paul Fryzel, Principal Engineer, AI Infrastructure at Condé Nast: “Condé Nast’s global portfolio encompasses over 20 leading media brands, including Wired, Vogue, and Vanity Fair. Within a few weeks, our team was able to integrate our recommendation engine with AWS Inferentia chips. This union enables multiple runtime optimizations for state-of-the-art natural language models on SageMaker’s Inf1 instances. As a result, we observed a 72% reduction in cost than the previously deployed GPU instances.”
Getting Started
You can get started with Inferentia and Inf1 instances today, either on Amazon SageMaker or with the Neuron SDK. This self-paced workshop walks you through both options.
Give it a try, and let us know what you think. As always, we look forward to your feedback. You can send it through your usual AWS Support contacts, post it on the AWS Forum for SageMaker, or on the Neuron SDK Github repository.
Optimizing your AWS Infrastructure for Sustainability, Part II: Storage
Post Syndicated from Katja Philipp original https://aws.amazon.com/blogs/architecture/optimizing-your-aws-infrastructure-for-sustainability-part-ii-storage/
In Part I of this series, we introduced you to strategies to optimize the compute layer of your AWS architecture for sustainability. We provided you with success criteria, metrics, and architectural patterns to help you improve resource and energy efficiency of your AWS workloads.
This blog post focuses on the storage layer of your AWS infrastructure and provides recommendations that you can use to store your data sustainably.
Optimizing the storage layer of your AWS infrastructure
Managing your data lifecycle and using different storage tiers are key components to optimizing storage for sustainability. When you consider different storage mechanisms, remember that you’re introducing a trade-off between resource efficiency, access latency, and reliability. This means you’ll need to select your management pattern accordingly.
Reducing idle resources and maximizing utilization
Storing and accessing data efficiently, in addition to reducing idle storage resources results in a more efficient and sustainable architecture. Amazon CloudWatch offers storage metrics that can be used to assess storage improvements, as listed in the following table.
| Service | Metric | Source |
| Amazon Simple Storage Service (Amazon S3) | BucketSizeBytes | Metrics and dimensions |
| S3 Object Access | Logging requests using server access logging | |
| Amazon Elastic Block Store (Amazon EBS) | VolumeIdleTime | Amazon EBS metrics |
| Amazon Elastic File System (Amazon EFS) | StorageBytes | Amazon CloudWatch metrics for Amazon EFS |
| Amazon FSx for Lustre | FreeDataStorageCapacity | Monitoring Amazon FSx for Lustre |
| Amazon FSx for Windows File Server | FreeStorageCapacity | Monitoring with Amazon CloudWatch |
You can monitor these metrics with the architecture shown in Figure 1. CloudWatch provides a unified view of your resource metrics.

Figure 1. CloudWatch for monitoring your storage resources
In the following sections, we present four concepts to reduce idle resources and maximize utilization for your AWS storage layer.
Analyze data access patterns and use storage tiers
Choosing the right storage tier after analyzing data access patterns gives you more sustainable storage options in the cloud.
- By storing less volatile data on technologies designed for efficient long-term storage, you will optimize your storage footprint. More specifically, you’ll reduce the impact you have on the lifetime of storage resources by storing slow-changing or unchanging data on magnetic storage, as opposed to solid state memory. For archiving data or storing slow-changing data, consider using Amazon EFS Infrequent Access, Amazon EBS Cold HDD volumes, and Amazon S3 Glacier.
- To store your data efficiently throughout its lifetime, create an Amazon S3 Lifecycle configuration that automatically transfers objects to a different storage class based on your pre-defined rules. The Expiring Amazon S3 Objects Based on Last Accessed Date to Decrease Costs blog post shows you how to create custom object expiry rules for Amazon S3 based on the last accessed date of the object.
- For data with unknown or changing access patterns, use Amazon S3 Intelligent-Tiering to monitor access patterns and move objects among tiers automatically. In general, you have to make a trade-off between resource efficiency, access latency, and reliability when considering these storage mechanisms. Figure 2 shows an overview of data access patterns for Amazon S3 and the resulting storage tier. For example, in S3 One Zone-IA, energy and server capacity are reduced, because data is stored only within one Availability Zone.

Figure 2. Data access patterns for Amazon S3
Use columnar data formats and compression
Columnar data formats like Parquet and ORC require less storage capacity compared to row-based formats like CSV and JSON.
- Parquet consumes up to six times less storage in Amazon S3 compared to text formats. This is because of features such as column-wise compression, different encodings, or compression based on data type, as shown in the Top 10 Performance Tuning Tips for Amazon Athena blog post.
- You can improve performance and reduce query costs of Amazon Athena by 30–90 percent by compressing, partitioning, and converting your data into columnar formats. Using columnar data formats and compressions reduces the amount of data scanned.
Reduce unused storage resources
Right size or delete unused storage volumes
As shown in the Cost Optimization on AWS video, right-sizing storage by data type and usage reduces your associated costs by up to 50 percent.
- A straightforward way to reduce unused storage resources is to delete unattached EBS volumes. If the volume needs to be quickly restored later on, you can store an Amazon EBS snapshot before deletion.
- You can also use Amazon Data Lifecycle Manager to retain and delete EBS snapshots and Amazon EBS-backed Amazon Machine Images (AMIs) automatically. This further reduces the storage footprint of stale resources.
- To avoid over-provisioning volumes, see the Automating Amazon EBS Volume-resizing blog post. It demonstrates an automated workflow that can expand a volume every time it reaches a capacity threshold. These Amazon EBS elastic volumes extend a volume when needed, as shown in the Amazon EBS Update blog post.
- Another way to optimize block storage is to identify volumes that are underutilized and downsize them. Or you can change the volume type, as shown in the AWS Storage Optimization whitepaper.
Modify the retention period of CloudWatch Logs
By default, CloudWatch Logs are kept indefinitely and never expire. You can adjust the retention policy for each log group to be between one day and 10 years. For compliance reasons, export log data to Amazon S3 and use archival storage such as Amazon S3 Glacier.
Deduplicate data
Large datasets often have redundant data, which increases your storage footprint.
- By turning on data deduplication for your Amazon FSx for Windows File Server, you will optimize data storage. For general-purpose file shares, storage space can be reduced by 50–60 percent through deduplication.
- If you have datasets residing in Amazon S3, you can automatically get rid of duplicates by using the FindMatches transform provided by AWS Lake Formation. See the Integrate and deduplicate datasets using AWS Lake Formation FindMatches blog post for more information on how to set it up.
Conclusion
In this blog post, we discussed data storing techniques to increase your storage efficiency. These include right-sizing storage volumes; choosing storage tiers depending on different data access patterns; and compressing and converting data.
These techniques allow you to optimize your AWS infrastructure for environmental sustainability.
This blog post is the second post in the series, you can find the first part of the series linked in the following section. In the next part of this blog post series, we will show you how you can optimize the networking part of your IT infrastructure for sustainability in the cloud!
Related information
Caroline Cocciardi | Leonardo’s Knots | Talks at Google
Post Syndicated from Talks at Google original https://www.youtube.com/watch?v=W90_yFl300w
Postgres 14: It’s The Little Things (Kerstiens)
Post Syndicated from original https://lwn.net/Articles/870015/rss
Craig Kerstiens highlights
some of the “little things” featured in the upcoming PostgreSQL 14
release.
And now in PostgreSQL 14 there is this seemingly small update,
pipeline mode, which, according to the docs, allows applications to
send a query without having to read the result of the previously
sent query. Taking advantage of the pipeline mode, a client will
wait less for the server, since multiple queries/results can be
sent/received in a single network transaction.
An update on Memory Safety in Chrome
Post Syndicated from original https://lwn.net/Articles/870014/rss
The Google security blog provides
an overview of what is being done to address memory-safety problems in
the Chrome browser.
In parallel, we’ll be exploring whether we can use a memory safe
language for parts of Chrome in the future. The leading contender
is Rust, invented by our friends at Mozilla. This is (largely)
compile-time safe; that is, the Rust compiler spots mistakes with
pointers before the code even gets to your device, and thus there’s
no performance penalty. Yet there are open questions about whether
we can make C++ and Rust work well enough together. Even if we
started writing new large components in Rust tomorrow, we’d be
unlikely to eliminate a significant proportion of security
vulnerabilities for many years.
What is an A/B Test?
Post Syndicated from Netflix Technology Blog original https://netflixtechblog.com/what-is-an-a-b-test-b08cc1b57962
Martin Tingley with Wenjing Zheng, Simon Ejdemyr, Stephanie Lane, and Colin McFarland
This is the second post in a multi-part series on how Netflix uses A/B tests to inform decisions and continuously innovate on our products. See here for Part 1: Decision Making at Netflix. Subsequent posts will go into more details on the statistics of A/B tests, experimentation across Netflix, how Netflix has invested in infrastructure to support and scale experimentation, and the importance of the culture of experimentation within Netflix.
An A/B test is a simple controlled experiment. Let’s say — this is a hypothetical! — we want to learn if a new product experience that flips all of the boxart upside down in the TV UI is good for our members.

To run the experiment, we take a subset of our members, usually a simple random sample, and then use random assignment to evenly split that sample into two groups. Group “A,” often called the “control group,” continues to receive the base Netflix UI experience, while Group “B,” often called the “treatment group”, receives a different experience, based on a specific hypothesis about improving the member experience (more on those hypotheses below). Here, Group B receives the Upside Down box art.
We wait, and we then compare the values of a variety of metrics from Group A to those from Group B. Some metrics will be specific to the given hypothesis. For a UI experiment, we’ll look at engagement with different variants of the new feature. For an experiment that aims to deliver more relevant results in the search experience, we’ll measure if members are finding more things to watch through search. In other types of experiments, we might focus on more technical metrics, such as the time it takes the app to load, or the quality of video we are able to provide under different network conditions.

With many experiments, including the Upside Down box art example, we need to think carefully about what our metrics are telling us. Suppose we look at the click through rate, measuring the fraction of members in each experience that clicked on a title. This metric alone may be a misleading measure of whether this new UI is a success, as members might click on a title in the Upside Down product experience only in order to read it more easily. In this case, we might also want to evaluate what fraction of members subsequently navigate away from that title versus proceeding to play it.
In all cases, we also look at more general metrics that aim to capture the joy and satisfaction that Netflix is delivering to our members. These metrics include measures of member engagement with Netflix: are the ideas we are testing helping our members to choose Netflix as their entertainment destination on any given night?
There’s a lot of statistics involved as well — how large a difference is considered significant? How many members do we need in a test in order to detect an effect of a given magnitude? How do we most efficiently analyze the data? We’ll cover some of those details in subsequent posts, focussing on the high level intuition.
Holding everything else constant
Because we create our control (“A”) and treatment (“B”) groups using random assignment, we can ensure that individuals in the two groups are, on average, balanced on all dimensions that may be meaningful to the test. Random assignment ensures, for example, that the average length of Netflix membership is not markedly different between the control and treatment groups, nor are content preferences, primary language selections, and so forth. The only remaining difference between the groups is the new experience we are testing, ensuring our estimate of the impact of the new experience is not biased in any way.
To understand how important this is, let’s consider another way we could make decisions: we could roll out the new Upside Down box art experience (discussed above) to all Netflix members, and see if there’s a big change in one of our metrics. If there’s a positive change, or no evidence of any meaningful change, we’ll keep the new experience; if there’s evidence of a negative change, we’ll roll back to the prior product experience.
Let’s say we did that (again — this is a hypothetical!), and flipped the switch to the Upside Down experience on the 16th day of a month. How would you act if we gathered the following data?
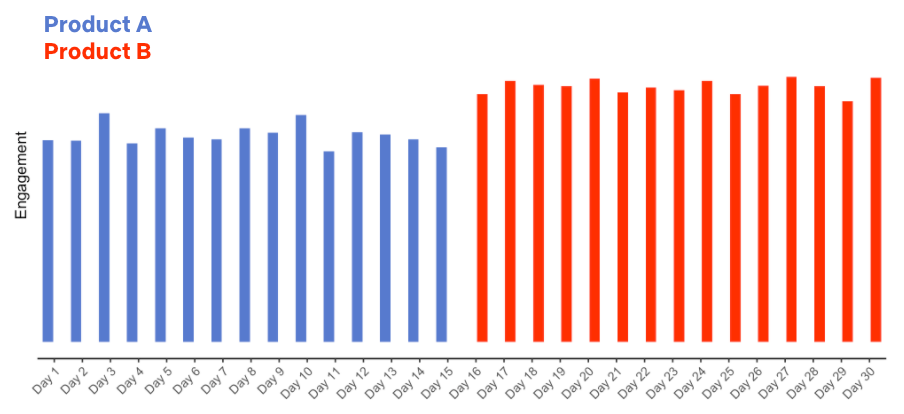
The data look good: we release a new product experience and member engagement goes way up! But if you had these data, plus the knowledge that Product B flips all the box art in the UI upside down, how confident would you be that the new product experience really is good for our members?
Do we really know that the new product experience is what caused the increase in engagement? What other explanations are possible?
What if you also knew that Netflix released a hit title, like a new season of Stranger Things or Bridgerton, or a hit movie like Army of the Dead, on the same day as the (hypothetical) roll out of the new Upside Down product experience? Now we have more than one possible explanation for the increase in engagement: it could be the new product experience, it could be the hit title that’s all over social media, it could be both. Or it could be something else entirely. The key point is that we don’t know if the new product experience caused the increase in engagement.
What if instead we’d run an A/B test with the Upside Down box art product experience, with one group of members receiving the current product (“A”) and another group the Upside Down product (“B”) over the entire month, and gathered the following data:

In this case, we are led to a different conclusion: the Upside Down product results in generally lower engagement (not surprisingly!), and both groups see an increase in engagement concurrent with the launch of the big title.
A/B tests let us make causal statements. We’ve introduced the Upside Down product experience to Group B only, and because we’ve randomly assigned members to groups A and B, everything else is held constant between the two groups. We can therefore conclude with high probability (more on the details next time) that the Upside Down product caused the reduction in engagement.
This hypothetical example is extreme, but the broad lesson is that there is always something we won’t be able to control. If we roll out an experience to everyone and simply measure a metric before and after the change, there can be relevant differences between the two time periods that prevent us from making a causal conclusion. Maybe it’s a new title that takes off. Maybe it’s a new product partnership that unlocks Netflix for more users to enjoy. There’s always something we won’t know about. Running A/B tests, where possible, allows us to substantiate causality and confidently make changes to the product knowing that our members have voted for them with their actions.
It all starts with an idea
An A/B test starts with an idea — some change we can make to the UI, the personalization systems that help members find content, the signup flow for new members, or any other part of the Netflix experience that we believe will produce a positive result for our members. Some ideas we test are incremental innovations, like ways to improve the text copy that appears in the Netflix product; some are more ambitious, like the test that led to “Top 10” lists that Netflix now shows in the UI.
As with all innovations that are rolled out to Netflix members around the globe, Top 10 started as an idea that was turned into a testable hypothesis. Here, the core idea was that surfacing titles that are popular in each country would benefit our members in two ways. First, by surfacing what’s popular we can help members have shared experiences and connect with one another through conversations about popular titles. Second, we can help members choose some great content to watch by fulfilling the intrinsic human desire to be part of a shared conversation.

We next turn this idea into a testable hypothesis, a statement of the form “If we make change X, it will improve the member experience in a way that makes metric Y improve.” With the Top 10 example, the hypothesis read: “Showing members the Top 10 experience will help them find something to watch, increasing member joy and satisfaction.” The primary decision metric for this test (and many others) is a measure of member engagement with Netflix: are the ideas we are testing helping our members to choose Netflix as their entertainment destination on any given night? Our research shows that this metric (details omitted) is correlated, in the long term, with the probability that members will retain their subscriptions. Other areas of the business in which we run tests, such as the signup page experience or server side infrastructure, make use of different primary decision metrics, though the principle is the same: what can we measure, during the test, that is aligned with delivering more value in the long-term to our members?
Along with the primary decision metric for a test, we also consider a number of secondary metrics and how they will be impacted by the product feature we are testing. The goal here is to articulate the causal chain, from how user behavior will change in response to the new product experience to the change in our primary decision metric.
Articulating the causal chain between the product change and changes in the primary decision metric, and monitoring secondary metrics along this chain, helps us build confidence that any movement in our primary metric is the result of the causal chain we are hypothesizing, and not the result of some unintended consequence of the new feature (or a false positive — much more on that in later posts!). For the Top 10 test, engagement is our primary decision metric — but we also look at metrics such as title-level viewing of those titles that appear in the Top 10 list, the fraction of viewing that originates from that row vs other parts of the UI, and so forth. If the Top 10 experience really is good for our members in accord with the hypothesis, we’d expect the treatment group to show an increase in viewing of titles that appear in the Top 10 list, and for generally strong engagement from that row.
Finally, because not all of the ideas we test are winners with our members (and sometimes new features have bugs!) we also look at metrics that act as “guardrails.” Our goal is to limit any downside consequences and to ensure that the new product experience does not have unintended impacts on the member experience. For example, we might compare customer service contacts for the control and treatment groups, to check that the new feature is not increasing the contact rate, which may indicate member confusion or dissatisfaction.
Summary
This post has focused on building intuition: the basics of an A/B test, why it’s important to run an A/B test versus rolling out a feature and looking at metrics pre- and post- making a change, and how we turn an idea into a testable hypothesis. Next time, we’ll jump into the basic statistical concepts that we use when comparing metrics from the treatment and control experiences. Follow the Netflix Tech Blog to stay up to date.

What is an A/B Test? was originally published in Netflix TechBlog on Medium, where people are continuing the conversation by highlighting and responding to this story.
A set of stable kernels
Security updates for Wednesday
Post Syndicated from original https://lwn.net/Articles/870002/rss
Security updates have been issued by Debian (grilo), Fedora (curl, firefox, mingw-python-pillow, python-pillow, python2-pillow, and webkit2gtk3), openSUSE (chromium, grafana-piechart-panel, kernel, libcroco, php-composer, and xen), Oracle (curl, kernel, and nss and nspr), Red Hat (nodejs:12), Slackware (alpine), SUSE (ghostscript, grafana-piechart-panel, kernel, and xen), and Ubuntu (linux, linux-hwe, linux-hwe-5.11, linux-hwe-5.4, linux-raspi, linux-raspi-5.4, and linux-raspi2).
Managing federated schema with AWS Lambda and Amazon S3
Post Syndicated from James Beswick original https://aws.amazon.com/blogs/compute/managing-federated-schema-with-aws-lambda-and-amazon-s3/
This post is written by Krzysztof Lis, Senior Software Development Engineer, IMDb.
GraphQL schema management is one of the biggest challenges in the federated setup. IMDb has 19 subgraphs (graphlets) – each of them owns and publishes a part of the schema as a part of an independent CI/CD pipeline.
To manage federated schema effectively, IMDb introduced a component called Schema Manager. This is responsible for fetching the latest schema changes and validating them before publishing it to the Gateway.
Part 1 presents the migration from a monolithic REST API to a federated GraphQL (GQL) endpoint running on AWS Lambda. This post focuses on schema management in federated GQL systems. It shows the challenges that the teams faced when designing this component and how we addressed them. It also shares best practices and processes for schema management, based on our experience.
Comparing monolithic and federated GQL schema
In the standard, monolithic implementation of GQL, there is a single file used to manage the whole schema. This makes it easier to ensure that there are no conflicts between the new changes and the earlier schema. Everything can be validated at the build time and there is no risk that external changes break the endpoint during runtime.
This is not true for the federated GQL endpoint. The gateway fetches service definitions from the graphlets on runtime and composes the overall schema. If any of the graphlets introduces a breaking change, the gateway fails to compose the schema and won’t be able to serve the requests.
The more graphlets we federate to, the higher the risk of introducing a breaking change. In enterprise scale systems, you need a component that protects the production environment from potential downtime. It must notify graphlet owners that they are about to introduce a breaking change, preferably during development before releasing the change.
Federated schema challenges
There are other aspects of handling federated schema to consider. If you use AWS Lambda, the default schema composition increases the gateway startup time, which impacts the endpoint’s performance. If any of the declared graphlets are unavailable at the time of schema composition, there may be gateway downtime or at least an incomplete overall schema. If schemas are pre-validated and stored in a highly available store such as Amazon S3, you mitigate both of these issues.
Another challenge is schema consistency. Ideally, you want to propagate the changes to the gateway in a timely manner after a schema change is published. You also need to consider handling field deprecation and field transfer across graphlets (change of ownership). To catch potential errors early, the system should support dry-run-like functionality that will allow developers to validate changes against the current schema during the development stage.
The Schema Manager

To mitigate these challenges, the Gateway/Platform team introduces a Schema Manager component to the workload. Whenever there’s a deployment in any of the graphlet pipelines, the schema validation process is triggered.
Schema Manager fetches the most recent sub-schemas from all the graphlets and attempts to compose an overall schema. If there are no errors and conflicts, a change is approved and can be safely promoted to production.
In the case of a validation failure, the breaking change is blocked in the graphlet deployment pipeline and the owning team must resolve the issue before they can proceed with the change. Deployments of graphlet code changes also depend on this approval step, so there is no risk that schema and backend logic can get out of sync, when the approval step blocks the schema change.
Integration with the Gateway
To handle versioning of the composed schema, a manifest file stores the locations of the latest approved set of graphlet schemas. The manifest is a JSON file mapping the name of the graphlet to the S3 key of the schema file, in addition to the endpoint of the graphlet service.
The file name of each graphlet schema is a hash of the schema. The Schema Manager pulls the current manifest and uses the hash of the validated schema to determine if it has changed:
{
   "graphlets": {
     "graphletOne": {
        "schemaPath": "graphletOne/1a3121746e75aafb3ca9cccb94f23d89",
        "endpoint": "arn:aws:lambda:us-east-1:123456789:function:GraphletOne"
     },
     "graphletTwo": {
        "schemaPath": "graphletTwo/213362c3684c89160a9b2f40cd8f191a",
        "endpoint": "arn:aws:lambda:us-east-1:123456789:function:GraphletTwo"
     },
     ...
  }
}
Based on these details, the Gateway fetches the graphlet schemas from S3 as part of service startup and stores them in the in-memory cache. It later polls for the updates every 5 minutes.
Using S3 as the schema store addresses the latency, availability and validation concerns of fetching schemas directly from the graphlets on runtime.
Eventual schema consistency
Since there are multiple graphlets that can be updated at the same time, there is no guarantee that one schema validation workflow will not overwrite the results of another.
For example:
- SchemaUpdater 1 runs for graphlet A.
- SchemaUpdater 2 runs for graphlet B.
- SchemaUpdater 1 pulls the manifest v1.
- SchemaUpdater 2 pulls the manifest v1.
- SchemaUpdater 1 uploads manifest v2 with change to graphlet A
- SchemaUpdater 2 uploads manifest v3 that overwrites the changes in v2. Contains only changes to graphlet B.
This is not a critical issue because no matter which version of the manifest wins in this scenario both manifests represent a valid schema and the gateway does not have any issues. When SchemaUpdater is run for graphlet A again, it sees that the current manifest does not contain the changes uploaded before, so it uploads again.
To reduce the risk of schema inconsistency, Schema Manager polls for schema changes every 15 minutes and the Gateway polls every 5 minutes.
Local schema development
Schema validation runs automatically for any graphlet change as a part of deployment pipelines. However, that feedback loop happens too late for an efficient schema development cycle. To reduce friction, the team uses a tool that performs this validation step without publishing any changes. Instead, it would output the results of the validation to the developer.

The Schema Validator script can be added as a dependency to any of the graphlets. It fetches graphlet’s schema definition described in Schema Definition Language (SDL) and passes it as payload to Schema Manager. It performs the full schema validation and returns any validation errors (or success codes) to the user.
Best practices for federated schema development
Schema Manager addresses the most critical challenges that come from federated schema development. However, there are other issues when organizing work processes at your organization.
It is crucial for long term maintainability of the federated schema to keep a high-quality bar for the incoming schema changes. Since there are multiple owners of sub-schemas, it’s good to keep a communication channel between the graphlet teams so that they can provide feedback for planned schema changes.
It is also good to extract common parts of the graph to a shared library and generate typings and the resolvers. This lets the graphlet developers benefit from strongly typed code. We use open-source libraries to do this.
Conclusion
Schema Management is a non-trivial challenge in federated GQL systems. The highest risk to your system availability comes with the potential of introducing breaking schema change by one of the graphlets. Your system cannot serve any requests after that. There is the problem of the delayed feedback loop for the engineers working on schema changes and the impact of schema composition during runtime on the service latency.
IMDb addresses these issues with a Schema Manager component running on Lambda, using S3 as the schema store. We have put guardrails in our deployment pipelines to ensure that no breaking change is deployed to production. Our graphlet teams are using common schema libraries with automatically generated typings and review the planned schema changes during schema working group meetings to streamline the development process.
These factors enable us to have stable and highly maintainable federated graphs, with automated change management. Next, our solution must provide mechanisms to prevent still-in-use fields from getting deleted and to allow schema changes coordinated between multiple graphlets. There are still plenty of interesting challenges to solve at IMDb.
For more serverless learning resources, visit Serverless Land.
FBI Had the REvil Decryption Key
Post Syndicated from Bruce Schneier original https://www.schneier.com/blog/archives/2021/09/fbi-had-the-revil-decryption-key.html
The Washington Post reports that the FBI had a decryption key for the REvil ransomware, but didn’t pass it along to victims because it would have disrupted an ongoing operation.
The key was obtained through access to the servers of the Russia-based criminal gang behind the July attack. Deploying it immediately could have helped the victims, including schools and hospitals, avoid what analysts estimate was millions of dollars in recovery costs.
But the FBI held on to the key, with the agreement of other agencies, in part because it was planning to carry out an operation to disrupt the hackers, a group known as REvil, and the bureau did not want to tip them off. Also, a government assessment found the harm was not as severe as initially feared.
Fighting ransomware is filled with security trade-offs. This is one I had not previously considered.
Another news story.
Rapid7 Technical Support: Building a Career Path With Endless Possibilities
Post Syndicated from Rapid7 original https://blog.rapid7.com/2021/09/22/rapid7-technical-support-building-a-career-path-with-endless-possibilities/

At Rapid7, our Technical Support teams deliver a world-class support experience to our customers across the globe. We have Support Moose on 4 continents, in 10 offices, and across 8 time zones, but we’re all one herd. So, how do we achieve this? We swarm on cases together each day, we collaborate with team members across the world, we’re learning constantly, and we live and breathe Never Done, one of our core values. For any team member, that means there are endless possibilities in what you can do at Rapid7, because the support for you is limitless.
We talked with a few of our Technical Support Engineers to hear firsthand about why they chose to join Rapid7, their career growth so far, and cool projects they’ve had the opportunity to work on!


How has Rapid7 supported your career growth?
“I joined Rapid7 as a part of the DivvyCloud acquisition. Going from being an individual contributor in a startup environment to a manager in a larger company is a big change. Rapid7 has done many helpful things to make that transition much smoother. Being a part of the Emerging Moose program, I have learned a lot on how to best manage my team in an effective and efficient manner. I have also had the opportunity to make an impact in the product development process, working closely with our Product and Engineering teams. Additionally, I have been supported throughout this entire process by my Director, Jayashri. She has pushed me to do things I wouldn’t have done on my own with regards to mentoring, networking, and using my voice to be an advocate for our customers and my team.” – Jenni Natiw
“Before I joined Rapid7, my job role was a cake decorator. I made and decorated bespoke cakes for events and parties, but I wanted a change in career. I started to study cybersecurity at a local college and ended up joining Rapid7 as an apprentice. Career growth so far has been incredible — from starting out with little to no IT experience, to working in a worldwide cybersecurity company as a technical support engineer. Rapid7 has got my foot into the door of IT, and my skills and experience have grown massively. I have learned so much on my journey so far in a short space of time and am excited to continue to learn and grow as a person.” – Steph Blair
What cool technology/projects have you had the opportunity to work on?
“I was given a project to redesign the current update servers Rapid7 uses. Specifically, I was tasked to propose a solution to future-proof the system, using services and technologies within Amazon Web Services (AWS). I then had to give a presentation in front of one of our Directors and Senior Managers.
This was great for learning more about AWS and to create a solution that would best serve Rapid7’s customers globally. I got to learn about creating instances in different regions to give more reach and failover, and about using load-balancing technologies. It was a very interesting project to get involved in.” – Mark Gottschalk
“Guru Card is the best project I have worked on. It’s like an automation technology to help my peers to identify and provide solutions to customers.” – Shan Yao
What made you most excited to join Rapid7, and what made you most excited to stay at Rapid7?
“From my interview stage, I could tell Rapid7 was not a traditional IT company. One of the questions put to me at the interview was about how I would get rid of space junk if I had all the resources in the world! When I was offered my position I was ecstatic, and I still feel so lucky to be involved with Rapid7. It was a significant career change, and I was excited to start learning and developing new skills within this industry. I’m most excited now for the opportunities that I have ahead of me with such a young and expanding company. I feel valued, and I’m part of a great close-knit team that I can always count on.” – Mark Gottschalk
“Originally, I had joined Rapid7 based on some really positive feedback from friends who had worked there previously, alongside my own personal drive to have a career in the cybersecurity space. I’m excited for my future working in Rapid7 due to the fast-paced environment where everyday feels like it presents a new challenge. I feel extremely fortunate to be a part of a great team whom I enjoy working alongside.” – Ryan Caren
“When I first joined my cybersecurity course in college, Rapid7 was brought up numerous times in regards to cybersecurity. From then, I did research myself and found out that this was a HUGE company with offices all around the world and could only ever imagine working somewhere like that! When I got accepted for a job I was very excited. I couldn’t believe it — I accepted straight away. From my first day at Rapid7, everyone has been so welcoming and friendly. It is such a great environment to work in. It’s not just about the work (although that is a huge part) — we take part in lots of other cool things like movie nights, nights out for dinner, mini golf, axe throwing, etc. It’s great to have a work/social balance and wind down after a day in the office. I can truly say that I have made friends for life and can’t wait to see what the future holds for me at Rapid7.” – Steph Blair
Interested in learning more and joining the team to support our audacious goal of growing 20% in 2021? Check out our open roles today!
Rapid7 Belfast Technical Support Team

Zabbix LatAm’s first anniversary
Post Syndicated from Fernanda Moraes original https://blog.zabbix.com/zabbix-latams-first-anniversary/15890/
In September 2020, Zabbix started operations from its office in Latin America, located in Brazil, in the city of Porto Alegre, state capital of Rio Grande do Sul. Since then, the office has strengthened its relationship with the community as a whole, in addition to expanding the network of companies that officially join the Zabbix Partnership Program.
It has been a year since we celebrated the arrival of our Zabbix office in Latin America and, throughout that first year, a number of challenges were set in our way. The first, the distance between continents, overcoming the need for closer proximity to our largest Zabbix community, which is Latin America. Also, the extremely atypical and sensitive context at the time we started our operations in the Latin American continent – which was the case with the emergence of the COVID-19 Pandemic.
Zabbix, as a globally recognized data collection and analysis platform, is fully Open Source. In other words, it is available and accessible to everyone who wants to learn about it and use it.
It’s simple, easy, and quick to install.
Its power goes far beyond IT infrastructure monitoring, allowing it to be used at different levels of any business or segment.
During this first year, the opening of the office has made it possible for the network of users, partners, customers, and other interested parties to have greater clarity about our business model and, in particular, in relation to the transversality that Zabbix provides for companies. This means that any organization, whatever its industry, needs technological support and to collect and assess business metrics. And Zabbix, in this context, is a solution that provides elements to support the specific needs of each area (sales, marketing, technology etc.).
In addition to that, we have seen the exponential growth of companies seeking to know more about our official partnership model, which – consequently – puts us head on with the intense work of strengthening and welcoming these organizations that officially arrive as Resellers, Certified Partners or even those who become Premium Partners.
It is these partners who, through a global network (250+ partners spread across 50+ countries), deliver quality services, certified professionals and supported directly by the manufacturer.
For our CEO at Zabbix LATAM, Luciano Alves, “in the current scenario and especially after the opening of our LatAm office, public and private Large Enterprises started to seek more information on how to access our official services. It is not uncommon for us to participate in meetings where clients report not being able to extract the full potential of Zabbix, precisely because they do not work alongside one of our accredited partners. Our role, together with our partners and customers network, is precisely to ensure that Zabbix services reach their final destination, with the highest possible quality. With this positioning, our partners now have the manufacturer at their side at all times, from the pre-sales process, specification and delivery of highly complex projects”.
The benefits experienced since arrival at the office include:
- Local language partner support and easy payment.
The LATAM Office Team is made up of professionals with excellent service, offering support to partners in Portuguese and Spanish, which facilitates communication with our contacts in the area. Also, payment is made in BRL (Brazil) or USD (other countries). We have reduced prices for services by approximately 40% for the Latin America region. Consequently, this becomes more attractive to partners and customers, as – currently – any and all business carried out is paid directly to the office in Brazil, without surcharges or exposure to exchange variations.
- Local Manufacturer Support
We are much closer to our partners and customers, making processes more agile and simplified.
- Direct training
Our partnership program aims at preparing partners so that they deliver Zabbix’s full potential within their region. Therefore, we have implemented actions to qualify knowledge about Zabbix. This means that they receive direct training from the office, focused on the business model, sales processes, latest updates, available features, and necessary technical skills.
- Events
The proximity of the office with the local culture allowed us to develop events that better meet the needs of users, partners, and potential customers. Also, partners have been sharing their experience, use cases and knowledge to strengthen their understanding of Zabbix and leverage business.
Estimates say that next year we will be possible to hold face-to-face meetings and also one of the most anticipated events by everyone in the region – Zabbix Conference LatAm, in two editions: Brazil and Mexico.
- A gift so we can celebrate together!
One of the biggest gifts we’ve decided to share, to celebrate Zabbix LatAm’s anniversary, is the free course for new Zabbix users: Zabbix Starter Week. The first edition closed last Friday (9/17), in Portuguese, and the next one takes place between September 27th and October 1st, in Spanish.
The goal is for new users to learn more about the platform and have the opportunity to apply in their daily lives the lessons learned there.
We continue to listen and seek to meet the wishes and needs not only of Partners, but also of the Zabbix LatAm Community as a whole. As a platform for worldwide use that has users, clients and projects on all continents and market segments, Zabbix is a necessary solution to support the technological and digital transformations we face.
As far as our office is concerned, the Zabbix Community in Latin America will always be supported so that we can grow together.
See you later!
1842 Retreat From Kabul
Post Syndicated from The History Guy: History Deserves to Be Remembered original https://www.youtube.com/watch?v=jtT7Z9QpMgU
Watch BEFORE you buy Reolink security cameras.
Post Syndicated from The Hook Up original https://www.youtube.com/watch?v=XXoTH1-78iA
“Отстрелването” на природата в България Бракониери простреляха царски орел навръх Деня на независимостта
Post Syndicated from Николай Марченко original https://bivol.bg/%D0%B1%D1%80%D0%B0%D0%BA%D0%BE%D0%BD%D0%B8%D0%B5%D1%80%D0%B8-%D0%BF%D1%80%D0%BE%D1%81%D1%82%D1%80%D0%B5%D0%BB%D1%8F%D1%85%D0%B0-%D1%86%D0%B0%D1%80%D1%81%D0%BA%D0%B8-%D0%BE%D1%80%D0%B5%D0%BB-%D0%BD.html
сряда 22 септември 2021

Очевидно независимостта на България все още не е достатъчна като историческа предпоставка за някои български граждани, които унищожават природата с цел финансови печалби и спортен интерес. Навръх Деня на независимостта…
New free resources for young people to become independent digital makers
Post Syndicated from Rik Cross original https://www.raspberrypi.org/blog/free-coding-resources-children-young-people-digital-making-independence/
Our mission at the Raspberry Pi Foundation is to help learners get creative with technology and develop the skills and confidence they need to make things that matter to them using code and physical computing. One of the ways in which we do this is by offering learners a catalogue of more than 250 free digital making projects! Some of them have been translated into 30 languages, and they can be used with or without a Raspberry Pi computer.


Over the last 18 months, we’ve been developing an all-new format for these educational projects, designed to better support young people who want to learn coding, whether at home or in a coding club, on their digital making journey.
Supporting learners to become independent tech creators
In the design process of the new project format, we combined:
- Leading research
- Experience of what works in Code Clubs, CoderDojos, and other Raspberry Pi programmes
- Feedback from the community
While designing the new format for our free projects, we found that, as well as support and opportunities to practise while acquiring new skills and knowledge, learners need a learning journey that lets them gradually develop and demonstrate increasing independence.


Therefore, each of our new learning paths is designed to scaffold learners’ success in the early stages, and then lets them build upon this learning by providing them with more open-ended tasks and inspirational ideas that learners can adapt or work from. Each learning path is made up of six projects, and the projects become less structured as learners progress along the path. This allows learners to practise their newly acquired skills and use their creativity and interests to make projects that matter to them. In this way, learners develop more and more independence, and when they reach the final project in the path, they are presented with a simple project brief. By this time they have the skills, practice, and confidence to meet this brief any way they choose!
The new content structure
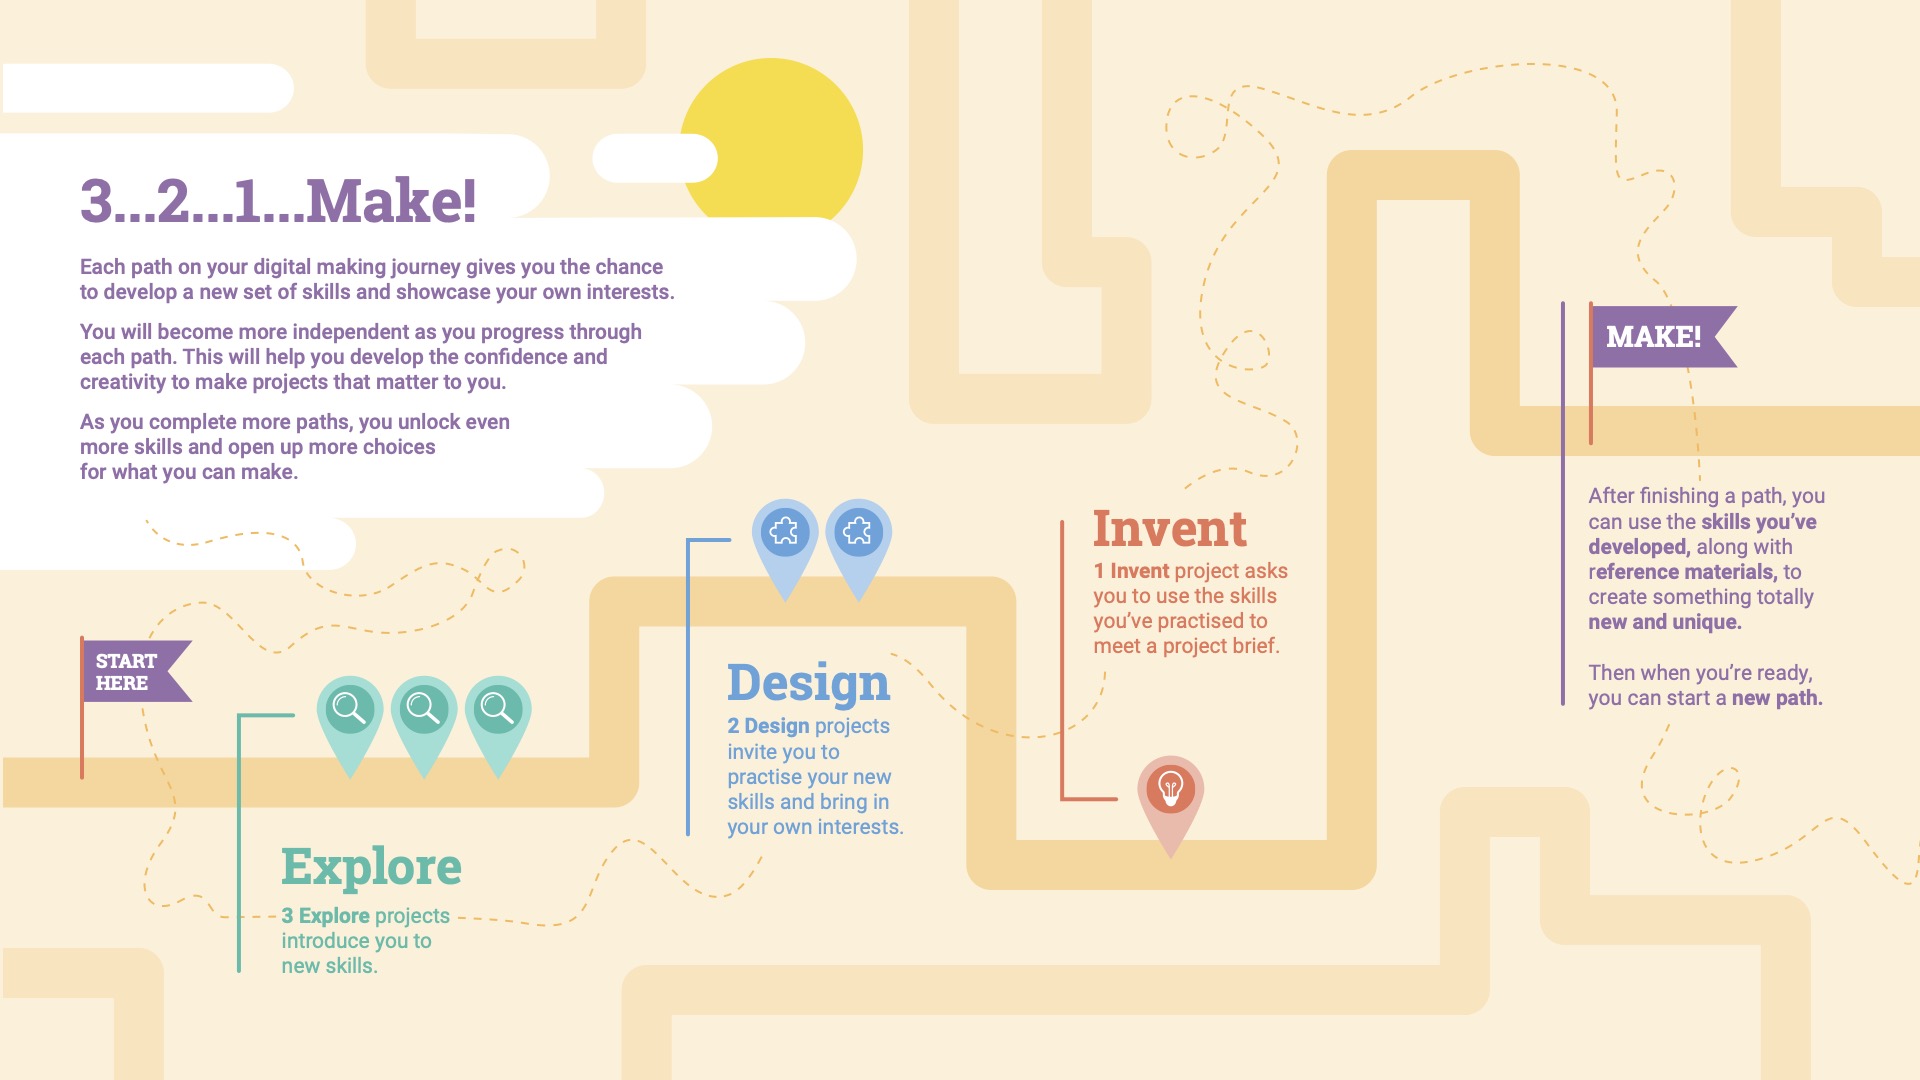
When a learner is ready to develop a new set of coding skills, they choose one of our new paths to embark on. Each path is made up of three different types of projects in a 3-2-1 structure:
- The first three Explore projects introduce learners to a set of skills and knowledge, and provide step-by-step instructions to help learners develop initial confidence. Throughout these projects, learners have lots of opportunity to personalise and tinker with what they’re creating.
- The next two Design projects are opportunities for learners to practise the skills they learned in the previous Explore projects, and to express themselves creatively. Learners are guided through creating their own version of a type of project (such as a musical instrument, an interactive pet, or a website to support a local event), and they are given code examples to choose, combine, and customise. No new skills are introduced in these projects, so that learners can focus on practising and on designing and creating a project based on their own preferences and interests.
- In the final one Invent project, learners focus on completing a project to meet a project brief for a particular audience. The project brief is written so that they can meet it using the skills they’ve learned by following the path up to this point. Learners are provided with reference material, but are free to decide which skills to use. They need to plan their project and decide on the order to carry out tasks.
As a result of working through a path, learners are empowered to make their own ideas and create solutions to situations they or their communities face, with increased independence. And in order to develop more skills, learners can work through more paths, giving them even more choice about what they create in the future.

More features for an augmented learning experience
We’ve also introduced some new features to add interactivity, choice, and authenticity to each project in a path:
- Real-world info box-outs provide interesting and relevant facts about the skills and knowledge being taught.
- Design decision points allow learners to make choices about how their project looks and what it does, based on their preferences and interests.
- Debugging tips throughout each project give learners guidance for finding and fixing common coding mistakes.
- Project reflection steps solidify new knowledge and provide opportunities for mastery by letting learners revisit the important learnings from the project. Common misconceptions are highlighted, and learners are guided to the correct answer.
- At the start of each project, learners can interact with example creations from the community, and at the end of a project, they are encouraged to share what they’ve made. Thus, learners can find inspiration in the creations of their peers and receive constructive feedback on their own projects.
- An open-ended upgrade step at the end of each project offers inspiration for young people to give them ideas for ways in which they could continue to improve upon their project in the future.
Access the new free learning content now
You can discover our new paths on our projects site right now!
We’ll be adding even more content soon, including completely new Python programming and web development paths!
As always, we’d love to know what you think: here’s a feedback form for you to share comments you have about our new content!
For feedback specific to an individual project, you can use the feedback link in the footer of that project’s page as usual.
The post New free resources for young people to become independent digital makers appeared first on Raspberry Pi.