Post Syndicated from The Atlantic original https://www.youtube.com/watch?v=3Lpcy_wffCc
The State of OpenSSL for pyca/cryptography
Post Syndicated from jake original https://lwn.net/Articles/1054258/
Paul Kehrer and Alex Gaynor, maintainers of the Python cryptography module, have put out some strongly
worded criticism of OpenSSL. It
comes from a talk they gave at the OpenSSL conference in October 2025 (YouTube video). The
post goes into a lot of detail about the problems with the OpenSSL code
base and testing, which has led the cryptography team to
reconsider using the library. “The mistakes we see in OpenSSL’s
” They go
development have become so significant that we believe substantial changes
are required — either to OpenSSL, or to our reliance on it.
further in the conclusion:
First, we will no longer require OpenSSL implementations for new functionality. Where we deem it desirable, we will add new APIs that are only on LibreSSL/BoringSSL/AWS-LC. Concretely, we expect to add ML-KEM and ML-DSA APIs that are only available with LibreSSL/BoringSSL/AWS-LC, and not with OpenSSL.
Second, we currently statically link a copy of OpenSSL in our wheels (binary artifacts). We are beginning the process of looking into what would be required to change our wheels to link against one of the OpenSSL forks.
If we are able to successfully switch to one of OpenSSL’s forks for our binary wheels, we will begin considering the circumstances under which we would drop support for OpenSSL entirely.
How Slack achieved operational excellence for Spark on Amazon EMR using generative AI
Post Syndicated from Avijit Goswami original https://aws.amazon.com/blogs/big-data/how-slack-achieved-operational-excellence-for-spark-on-amazon-emr-using-generative-ai/
At Slack, our data platform processes terabytes of data each day using Apache Spark on Amazon EMR on Amazon Elastic Compute Cloud (Amazon EC2), powering the insights that drive strategic decision-making across the organization.
As our data volume expanded, so did our performance challenges. With traditional monitoring tools, we couldn’t effectively manage our systems when Spark jobs slowed down or costs spiraled out of control. We were stuck searching through cryptic logs, making educated guesses about resource allocation, and watching our engineering teams spend hours on manual tuning that should have been automated. That’s why we built something better: a detailed metrics framework designed specifically for Spark’s unique challenges. This is a visibility system that gives us granular insights into application behavior, resource usage, and job-level performance patterns we never had before. We’ve achieved 30–50% cost reductions and 40–60% faster job completion times. This is real operational efficiency that directly translates to better service for our users and significant savings for our infrastructure budget. In this post, we walk you through exactly how we built this framework, the key metrics that made the difference, and how your team can implement similar monitoring to transform your own Spark operations.
Why comprehensive Spark monitoring matters
In enterprise environments, poorly optimized Spark jobs can waste thousands of dollars in cloud compute costs, block critical data pipelines affecting downstream business processes, create cascading failures across interconnected data workflows, and impact service level agreement (SLA) compliance for time-sensitive analytics.
The monitoring framework we’re examining captures over 40 distinct metrics across five key categories, providing the granular insights needed to prevent these issues.
How we ingest, process, and act on Spark metrics
To address the challenges of managing Spark at scale, we developed a custom monitoring and optimization pipeline—from metric collection to AI-assisted tuning. It begins with our in-house Spark listener framework, which captures over 40 metrics in real time across Spark applications, jobs, stages, and tasks while pulling critical operational context from tools such as Apache Airflow and Apache Hadoop YARN.
An Apache Airflow-orchestrated Spark SQL pipeline transforms this data into actionable insights, surfacing performance bottlenecks and failure points. To integrate these metrics into the developer tuning workflow, we expose a metrics tool and a custom prompt through our internal analytics model context protocol (MCP) server. This enables seamless integration with AI-assisted coding tools such as Cursor or Claude Code.
The following is the list of tools used for our Spark monitoring solution, which includes metric collection to AI-assisted tuning:
- Amazon Bedrock
- Amazon EMR
- Spark SQL
- Apache Airflow
- Apache Kafka
- FastAPI
- FastMCP
- Claude Code
- Apache Iceberg
The result is fast, reliable, deterministic Spark tuning without the guesswork. Developers get environment-aware recommendations, automated configuration updates, and ready-to-review pull requests.
Deep dive into Spark metrics collection
At the center of our real-time monitoring solution lies a custom Spark listener framework that captures thorough telemetry across the Spark lifecycle. Spark’s built-in metrics are often coarse, short‑lived, and scattered across the user interface (UI) and logs, which leaves four critical gaps:
- Consistent historical record
- Weak linkage from applications to jobs to stages to tasks
- Limited context (user, cluster, team)
- Poor visibility into patterns such as skew, spill, and retries
Our expanded listener framework closes these gaps by unifying and enriching telemetry with environment and configuration tags, building a durable, queryable history, and correlating events across the execution graph. It explains why tasks fail, pinpoints where memory or CPU pressure occurs, compares intended configurations to actual usage, and produces clear, repeatable tuning recommendations so teams can baseline behavior, minimize waste, and resolve issues faster. The following architecture diagram illustrates the flow of the Spark metrics collection pipeline.
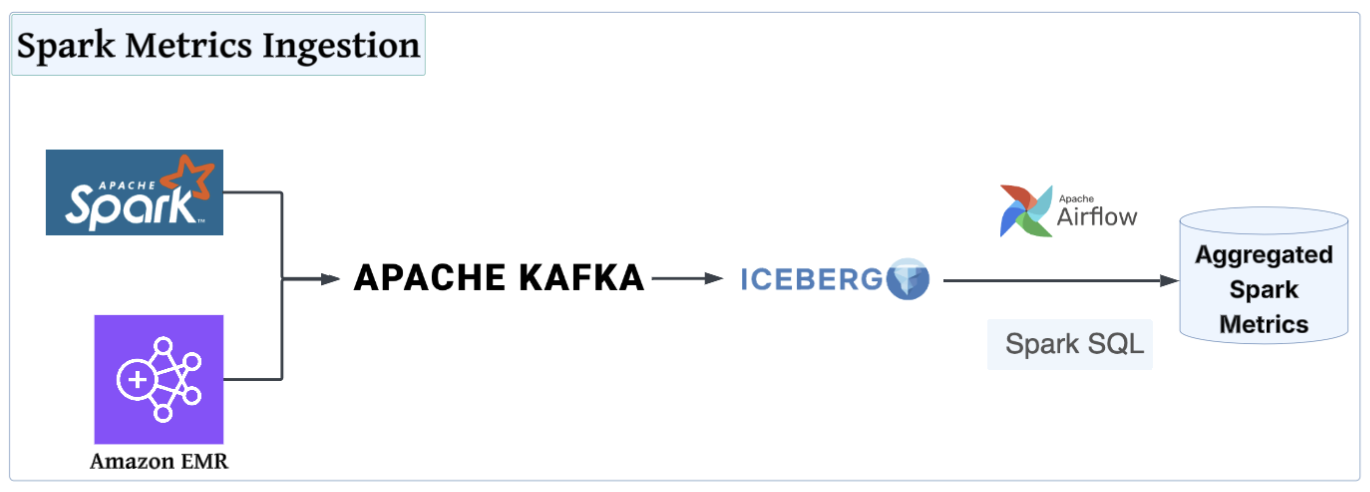
Spark listener
Our listener framework captures Spark metrics at four distinct levels:
- Application metrics: Overall application success/failure rates, total runtime, and resource allocation
- Job-level metrics: Individual job duration and status tracking within an application
- Stage-level metrics: Stage execution details, shuffle operations, and memory usage per stage
- Task-level metrics: Individual task performance for deep debugging scenarios
The following Scala example code shows the SparkTaskListener extends the class SparkListener to capture detailed task-level metrics:
Real-time streaming to Kafka
These metrics are streamed in real time to Kafka as JSON-formatted telemetry using a flexible emitter system:
From Kafka, a downstream pipeline ingests these records into an Apache Iceberg table.
Context-rich observability
Beyond standard Spark metrics, our framework captures essential operational context:
- Airflow integration: DAG metadata, task IDs, and execution timestamps
- Resource tracking: Configurable executor metrics (heap usage, execution memory)
- Environment context: Cluster identification, user tracking, and Spark configurations
- Failure analysis: Detailed error messages and task failure root causes
The combination of thorough metrics collection and real-time streaming has redefined Spark monitoring at scale, laying the groundwork for powerful insights.
Deep dive into Spark metrics processing
When raw metrics—often containing millions of records—are ingested from various sources, a Spark SQL pipeline transforms this high-volume data into actionable insights. It aggregates the data into a single row per application ID, significantly reducing complexity while preserving key performance signals.
For consistency in how teams interpret and act on this data, we apply the Five Pillars of Spark Monitoring, a structured framework that turns raw telemetry into clear diagnostics and repeatable optimization strategies, as shown in the following table.
| Pillar | Metrics | Key purpose/insight | Driving event |
|---|---|---|---|
| Application metadata and orchestration details |
|
Correlate performance patterns with teams and infrastructure to identify inefficiencies and ownership. |
|
| User-specified configuration |
|
Compare configuration as opposed to actual performance to detect over- and under-provisioning and optimizing costs. This is where significant cost savings often hide. | Spark event:
|
| Performance insights |
|
This is where the real diagnostic power lies. These metrics identify the three primary stoppers of Spark performance: skew, spill, and failures. | Spark event:
|
| Execution insights |
|
Understand runtime distribution, identify bottlenecks, and highlight execution outliers. | Spark event:
|
| Resource usage and system health |
|
Reveal memory inefficiencies and JVM-related pressure for cost and stability improvements. Comparing these against given configs helps identify waste and optimize resources. | Spark event:
|
AI-powered Spark tuning
The following architecture diagram illustrates the use of agentic AI tools to analyze the aggregated Spark metrics.
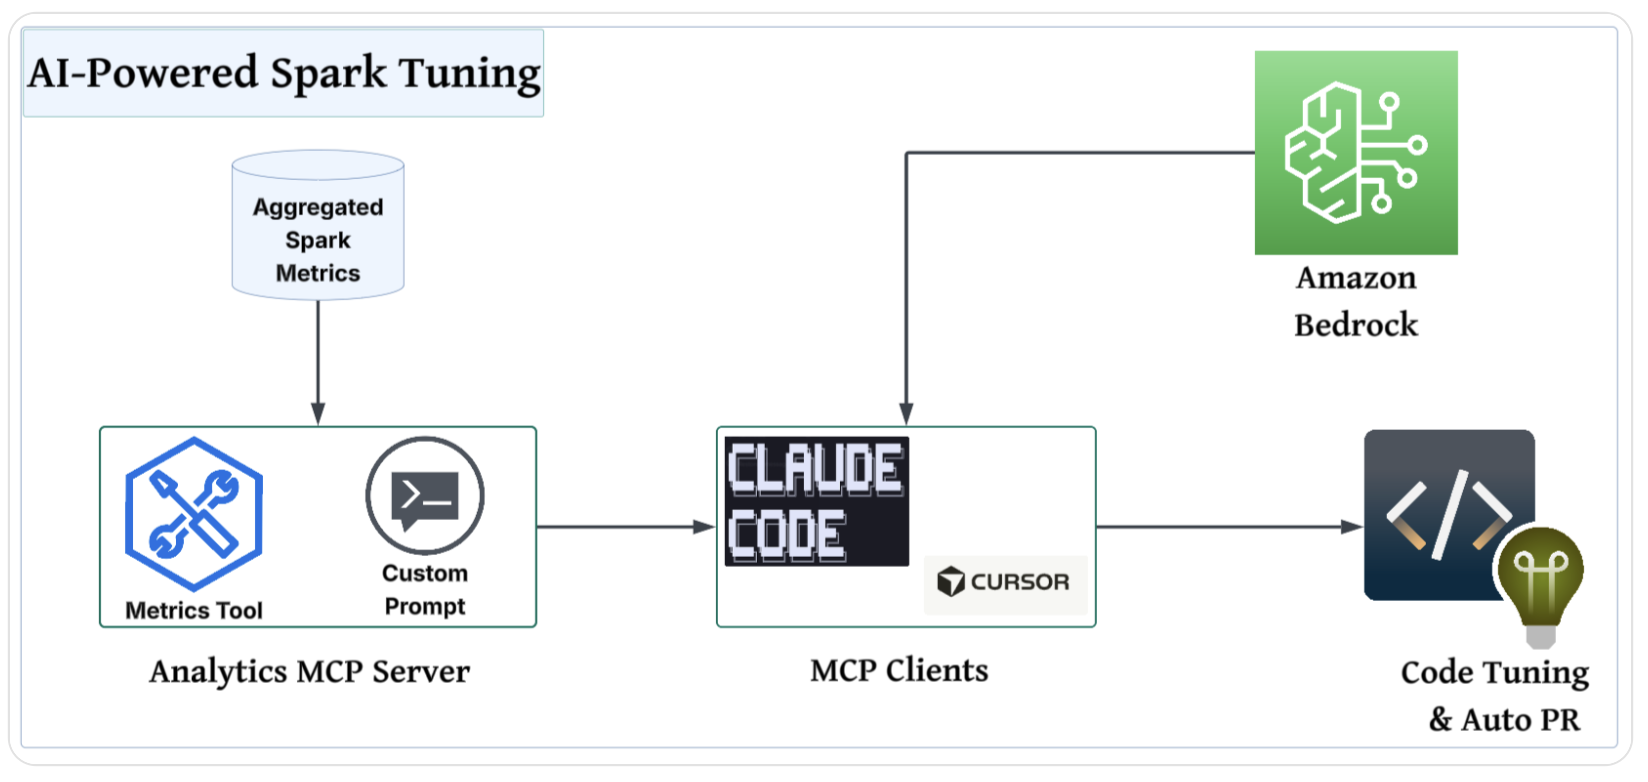
To integrate these metrics into a developer’s tuning workflow, we build a custom Spark metrics tool and a custom prompt that any agent can use. We use our existing analytics service, a homegrown web application that users can query our data warehouse with, build dashboards, and share insights. The backend is written in Python using FastAPI, and we expose an MCP server from the same service by using FastMCP. By exposing the Spark metrics tool and custom prompt through the MCP server, we make it possible for developers to connect their preferred assisted coding tools (Cursor, Claude Code, and more) and use data to guide their tuning.
Because the data exposed by the analytics MCP server might be sensitive, we use Amazon Bedrock in our Amazon Web Services (AWS) account to provide the foundation models to our MCP clients. This keeps our data more secure and facilitates compliance because it never leaves our AWS environment.
Custom prompt
To create our custom prompt for AI-driven Spark tuning, we design a structured, rule-based format that encourages more deterministic and standardized output. The prompt defines the required sections (application overview, current Spark configuration, job health summary, resource recommendations, and summary) for consistency across analyses. We include detailed formatting rules, such as wrapping values in backticks, avoiding line breaks, and enforcing strict table structures to maintain clarity and machine readability. The prompt also embeds explicit guidance for interpreting Spark metrics and mapping them to recommended tuning actions based on best practices, with clear criteria for status flags and impact explanations. The prompt means that the AI’s recommendations can be traced, reproduced, and actioned based on the provided data by tightly controlling the input-output flow and attempting to prevent hallucinations.
Final results
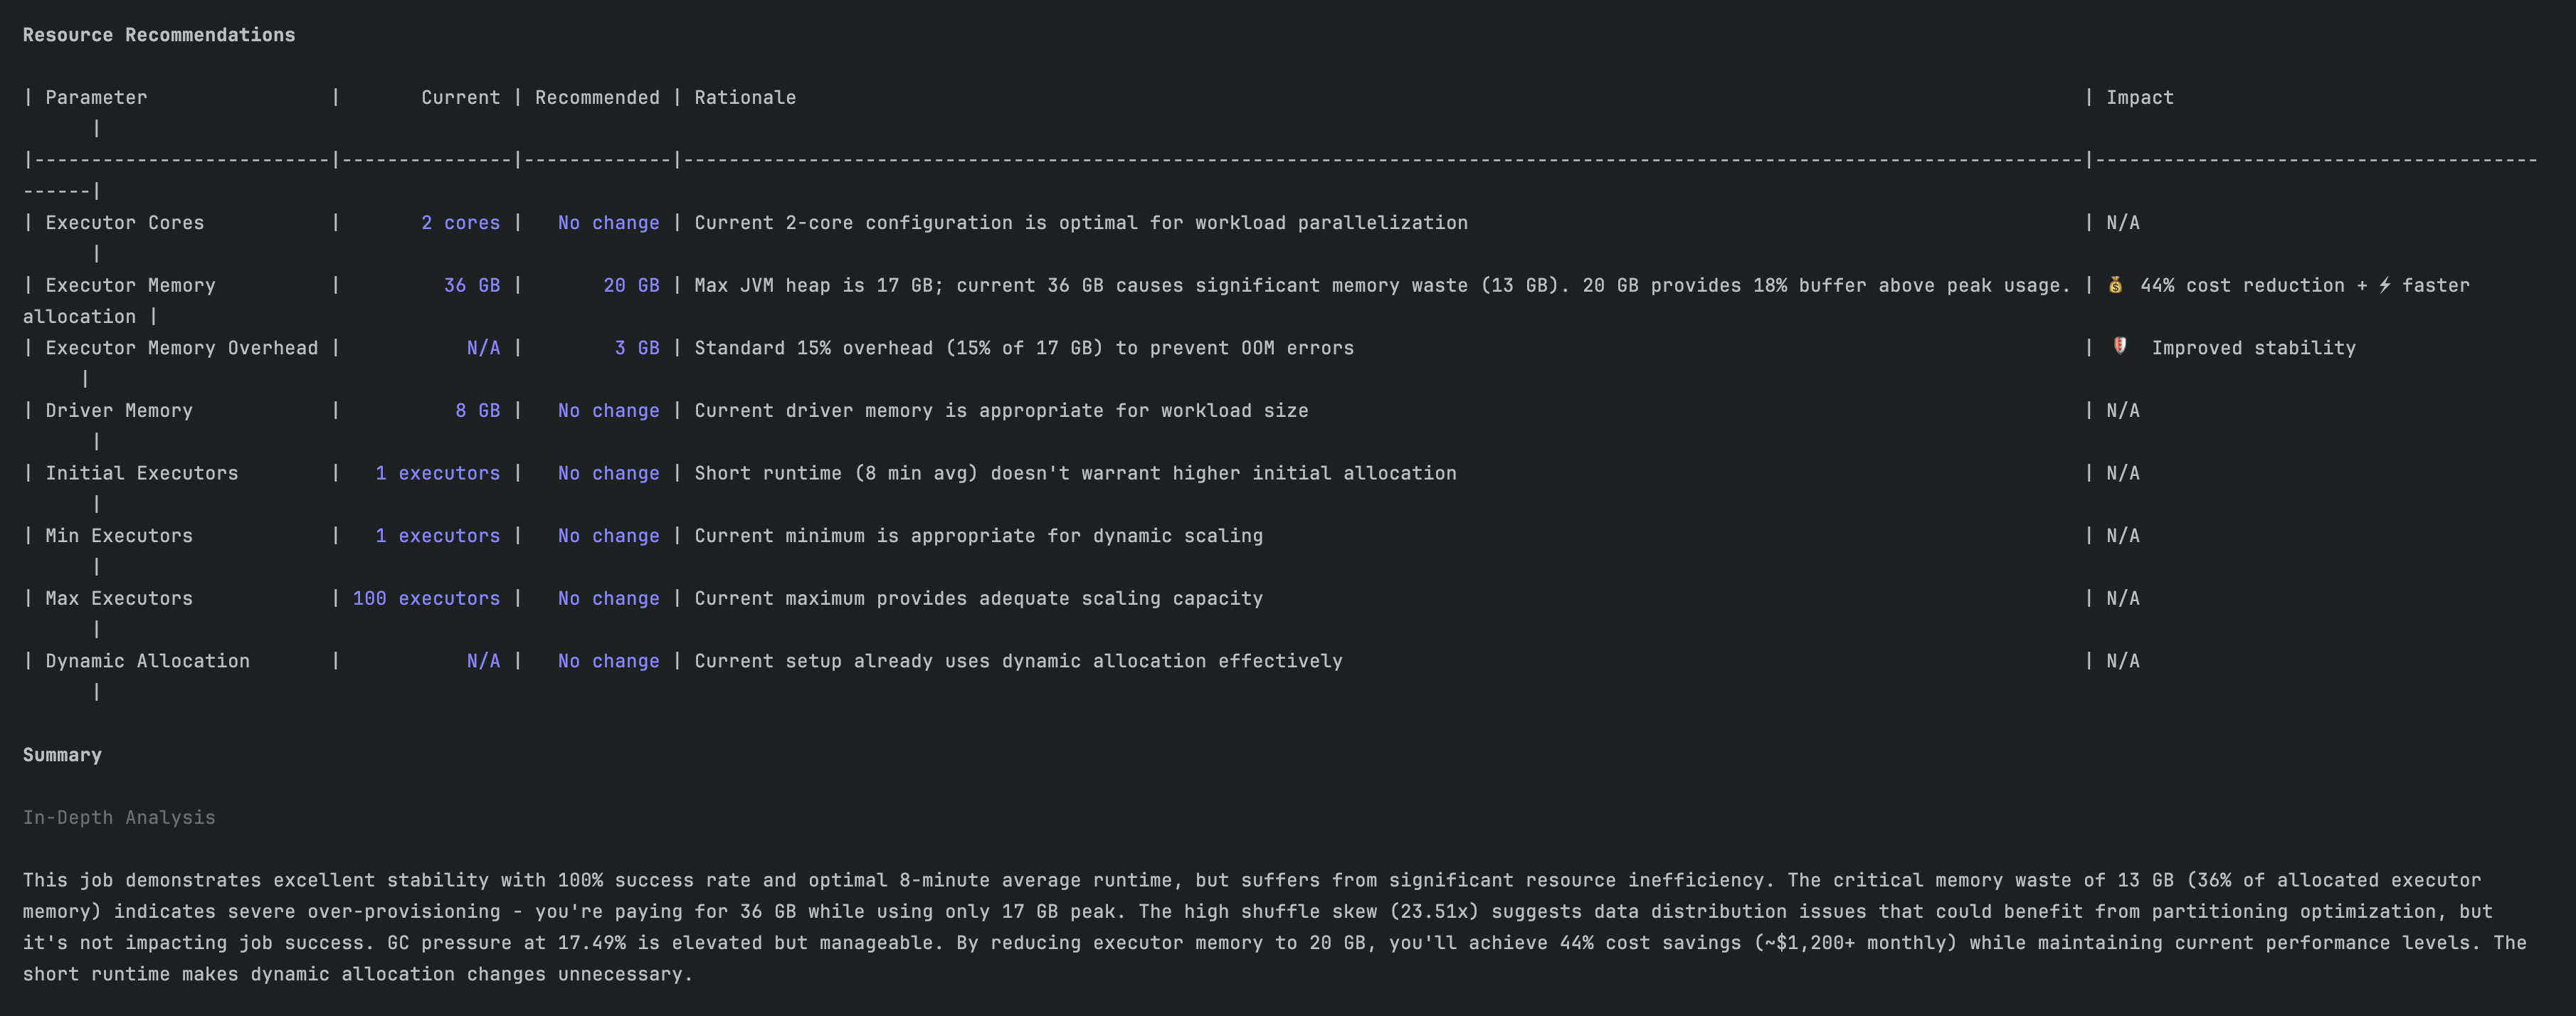
The screenshots in this section show how our tool performed the analysis and provided recommendations. The following is a performance analysis for an existing application.

The following is a recommendation to reduce resource waste.
The impact
Our AI-powered framework has fundamentally changed how Spark is monitored and managed at Slack. We’ve transformed Spark tuning from a high-expertise, trial-and-error process into an automated, data-backed standard by moving beyond traditional log-diving and embracing a structured, AI-driven approach. The results speak for themselves, as shown in the following table.
| Metric | Before | After | Improvement |
|---|---|---|---|
| Compute cost | Non-deterministic | Optimized resource use | Up to 50% lower |
| Job completion time | Non-deterministic | Optimized | Over 40% faster |
| Developer time on tuning | Hours per week | Minutes per week | >90% reduction |
| Configuration waste | Frequent over-provisioning | Precise resource allocation | Near-zero waste |
Conclusion
At Slack, our experience with Spark monitoring shows that you don’t need to be a performance expert to achieve exceptional results. We’ve shifted from reacting to performance issues to preventing them by systematically applying five key metric categories.
The numbers speak for themselves: 30–50% cost reductions and 40–60% faster job completion times represent operational efficiency that directly impacts our ability to serve millions of users worldwide. These improvements compound over time as teams build confidence in their data infrastructure and can focus on innovation rather than troubleshooting.
Your organization can achieve similar outcomes. Start with the basics: implement comprehensive monitoring, establish baseline metrics, and commit to continuous optimization. Spark performance doesn’t require expertise in every parameter, but it does require a strong monitoring foundation and a disciplined approach to analysis.
Acknowledgments
We want to give our thanks to all the people who have contributed to this incredible journey: Johnny Cao, Nav Shergill, Yi Chen, Lakshmi Mohan, Apun Hiran, and Ricardo Bion.
About the authors
Access Snowflake Horizon Catalog data using catalog federation in the AWS Glue Data Catalog
Post Syndicated from Andries Engelbrecht original https://aws.amazon.com/blogs/big-data/access-snowflake-horizon-catalog-data-using-catalog-federation-in-the-aws-glue-data-catalog/
This is a guest post by Andries Engelbrecht, Principal Partner Solutions Engineer at Snowflake, in partnership with AWS.
AWS announced a new catalog federation feature that allows you to directly access data from Snowflake Horizon Catalog through the AWS Glue Data Catalog. This integration enables you to discover and query Horizon Catalog data in Iceberg format through REST endpoints while applying fine-grained access controls using AWS Lake Formation. The new catalog federation combined with Snowflake’s catalog-linked database feature means users can access data stored across AWS and Snowflake from a single point of entry, reducing data movement and associated costs by eliminating the need to duplicate data across platforms.
In this post, we show you how to connect the AWS Glue Data Catalog to Snowflake Horizon Catalog and query the data using AWS analytics services. We cover how to set up catalogs in Horizon Catalog and configure required permissions, create and configure the federation connection in AWS Glue, implement fine-grained access controls using AWS Lake Formation, and finally, query federated tables using Amazon Athena. This step-by-step approach guides you through the complete process of establishing a integration between your Snowflake and AWS data environments.
Business examples and key benefits
Catalog federation enables several critical business scenarios while delivering key operational and strategic benefits.
Common examples
This federation capability addresses several key business scenarios:
- Governed, cross-platform analytics: Query data across AWS and Snowflake environments to improve data-driven decision making without data movement or duplication
- Data mesh implementation: Enable secure and federated data discovery while maintaining domain-oriented ownership
- Compliance management: Implement consistent access controls and auditing across platforms
Key benefits
- Operational efficiency: Eliminate data duplication and reduce Extract Transform Load (ETL) workloads
- Enhanced security: Centralize access control through AWS Lake Formation with fine-grained permissions
- Cost optimization: Minimize data transfer and storage costs across platforms
- Improved agility: Enable faster time to insights with direct query access
- Simplified governance: Maintain unified compliance and audit framework
Solution overview
The solution uses catalog federation in the AWS Glue Data Catalog to integrate with Snowflake Horizon Catalog. This integration supports both Snowflake Horizon, where the catalog is internal to Snowflake, and external catalogs such as Apache Polaris, Snowflake Open Catalog (a managed service that hosts Apache Polaris), and others.
The following diagram illustrates how AWS Glue Data Catalog federates with Snowflake Horizon Catalog, enabling customers to directly access Iceberg-format data managed by Snowflake Horizon Catalog through the Glue Data Catalog.
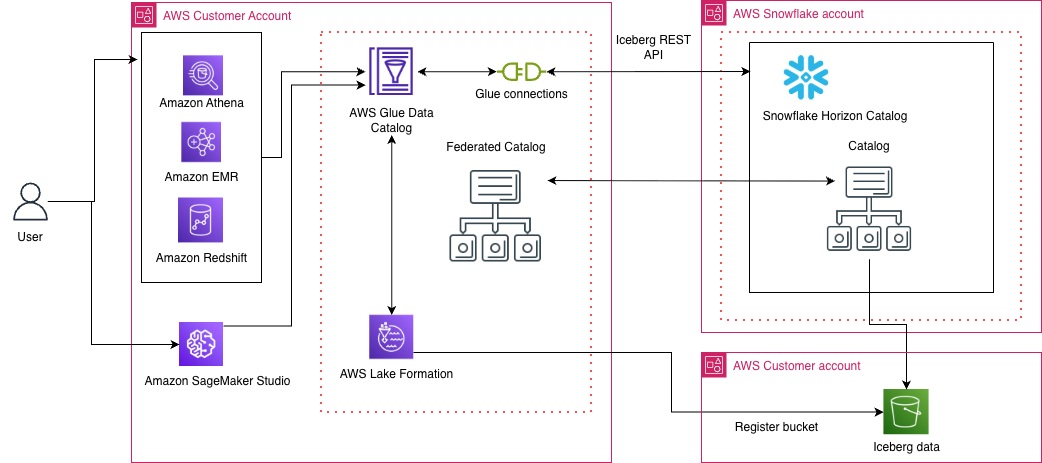
The integration works through three main components:
- Authentication: Uses OAuth2 credentials of Snowflake principal
- Access Control: AWS Lake Formation manages fine-grained permissions
- Query Access: AWS Analytics services like Amazon Athena can directly query the federated tables
Now, we walk through the step-by-step process of setting up this integration.
Prerequisites
Before you begin, confirm you have the following:
- A Snowflake account.
- (Optional) A Snowflake Open Catalog account.
- An AWS Identity and Access Management (IAM) role that is a Lake Formation data lake administrator in your AWS account. A data lake administrator is an IAM principal that can register Amazon S3 locations, access the Data Catalog, grant Lake Formation permissions to other users, and view AWS CloudTrail. See Create a data lake administrator for more information. This IAM role needs access to:
- Install or update the latest AWS Command Line Interface (CLI) version to run the AWS CLI commands. For instructions, refer to Installing or updating the latest version of the AWS CLI.
Configure Snowflake Horizon Catalog for Iceberg external access
Snowflake Horizon Catalog already supports managing Iceberg tables. For this walkthrough, you need to create Snowflake-managed Iceberg tables with data stored in Amazon S3.
Follow these steps in order:
- Create an external volume for S3: First, create an external volume that points to your S3 bucket where Iceberg table data is stored. Follow the instructions in Create External Volume(s) for the Iceberg Tables on S3.
- Create a database: Create a database to organize your tables. Refer to the Snowflake database creation documentation.
- Create a schema: Create a schema within your database following the Snowflake schema creation guide.
- Create an Iceberg table: Create your Iceberg table using the external volume. Follow the instructions to Create Iceberg Table.
After completing these steps, your Snowflake-managed Iceberg tables are ready to federate with AWS Glue Data Catalog.
Configure access control and authentication
To enable AWS Glue to access your Snowflake-managed Iceberg tables, you need to configure access control and obtain authentication credentials.
Step 1: Configure access control
Create a dedicated Snowflake role for external engine access to establish clear governance boundaries. Follow the instructions in Configure Access Control for external engines and set up the appropriate permissions for your Iceberg tables.
Step 2: Obtain an access token
Generate an access token for authenticating AWS Glue to Snowflake Horizon Catalog. Snowflake supports three authentication mechanisms:
- External OAuth
- Key-pair authentication
- Programmatic Access Token (PAT)
Choose the authentication method that best fits your security requirements and follow the corresponding Snowflake documentation to generate your credentials.
Catalog Federation supports OAuth or custom authentication. For details on using OAuth refer to Federate to Snowflake Iceberg Catalog.
For this post, we use custom authentication and generate access token using PAT. Replace role_name with the principal role and token_value with the principal’s Programmatic Access Token.
Note down the access token that is generated.
Step 3: Enable catalog federation
With access control configured and authentication credentials in hand, AWS Glue Catalog Federation can now connect to and access Snowflake’s Horizon Catalog.
Optional: Snowflake Open Catalog configuration
If you prefer to use Snowflake Open Catalog for Iceberg external access instead, refer to Sync a Snowflake-managed table with Snowflake Open Catalog for alternative setup instructions.
Setup Glue Catalog federation with Snowflake Horizon Catalog
Create a secret on AWS Secrets Manager
Log in to AWS console using the IAM role that has access to AWS Secrets Manager. Open Secrets Manager:
- Choose Store a new secret and select Other type of secret for the secret type.
- Set the key-value pair:
- Key:
BEARER_TOKEN - Value: The access token noted earlier
- Key:
- Choose Next and provide the secret name as horizon-secret.
- Complete the setup by choosing Store.
Alternatively, you can use the CLI to create the secret by running the following command.
Replace your-access-token and your-region with your actual values:
Create IAM role for catalog federation
As the catalog owner of a federated catalog in AWS Glue Data Catalog, you can use Lake Formation to implement comprehensive access controls for your data teams:
Access control options
You can implement access controls at different granularity levels depending on your governance needs:
- Coarse-grained: Table-level permissions
- Fine-grained: Column-level, row-level, and cell-level filtering
- Tag-based: Dynamic access based on data classification tags
Lake Formation requires an IAM role with permissions to access the underlying S3 locations of your external catalog.
Create an IAM role that enables the Glue Connection to access AWS Secrets Manager, VPC configurations (optional) and Lake formation to manage credential vending for S3 bucket/prefix.
Required permissions
- Secrets Manager access: The Glue connection requires permissions to retrieve secret values from Secrets Manager for OAuth tokens stored for your Snowflake service connection.
- Amazon Virtual Private Cloud (VPC) Access (optional): When using VPC endpoints to restrict connectivity to your Snowflake Open Catalog account, the Glue connection needs permissions to describe and use VPC network interfaces. This configuration ensures secure, controlled access to both your stored credentials and network resources while maintaining proper isolation through VPC endpoints.
- S3 bucket and AWS Key Management Service (KMS) key permission: The Glue connection requires S3 permissions to read certificates if used in the connection setup. Additionally, Lake Formation requires read permissions on the bucket/prefix where the remote catalog table data resides. If the data is encrypted using a KMS key, additional KMS permissions are required.
Setup steps:
Run the following command using AWS CLI by replacing the placeholder with your setup information:
Create a JSON file (e.g., trust-policy.json) with the following structure:
Use the aws iam create-role command, referencing the trust policy file:
First, create a JSON file (such as, permissions-policy.json) for the permissions:
Then, attach it to the role:
Create federated catalog in Glue Data Catalog
AWS Glue supports the SNOWFLAKEICEBERGRESTCATALOG connection type for connecting Glue Data Catalog with Snowflake Horizon Catalog and Snowflake Open Catalog. This Glue connector supports OAuth2 authentication and includes additional configuration parameters like CASING_TYPE to customize how AWS Glue Data Catalog discovers metadata in the Snowflake Horizon Catalog accounts.
Log in to your AWS console as a data lake admin and open the AWS Lake Formation console.
- Choose Catalog in the left navigation pane and select Create catalog.
- Choose the data source as Snowflake Horizon Catalog.

- Provide the following information:
- Name: Name of the federated catalog in Glue Catalog. For this post, we use federated_lakehousedb
- Catalog name in Snowflake: Catalog name existing in Snowflake Horizon Catalog, this should match exact name in Horizon catalog. For this post, we use LAKEHOUSEDB
- For Connection details, choose New connection configurations:
- Connection name: Name for the glue connection. For this post, we use federatedconnection1.
- Workspace URL: Horizon IRC url (format: https://<account_identifier>.snowflakecomputing.com)
- Casing type: choose Uppercase only
- Authentication:
- Authentication type: choose Custom. Alternatively, you can select OAuth2 authentication. For Custom authentication, an access token is created, refreshed, and managed by the customer’s application or system and stored using AWS Secrets Manager.
- OAuth Secret: Provide the secret manager ARN that was created in the previous step.

- If you have AWS PrivateLink setup and/or a proxy setup, you can provide network details under Settings for network configurations (optional).
- For Register Glue connection with Lake Formation:
- Choose the IAM role created earlier(LFDataAccessRole) to manage data access using Lake Formation.
To test the connection, choose Run test. After the connection information is validated, it shows as successful.

You can now create the catalog by selecting Create catalog.
Alternatively, you can use AWS CLI to create connection and catalog using example commands:
After the catalog is created, the Horizon databases and tables are listed under the federated catalog.
You can implement fine grained access control on the tables by applying row/column filter using Lake Formation.
Query the data using Athena query editor:
Open the Amazon Athena console and run the following query to access the federated Horizon table:
Clean up
To clean up your resources, complete the following steps:
- Drop the Snowflake Database with Cascade.
- Drop External Volume created for Iceberg Tables on S3.
- Drop the resources in Glue Data Catalog and Lake Formation created for this post.
- Delete the IAM roles and S3 buckets used for this post.
- Delete any VPC, KMS keys if used for this post setup.
Conclusion
In this post, we demonstrated how to establish a secure connection between AWS Analytics services and Snowflake Horizon Catalog, enabling you to access your data from a single connected and governed view. You learned how to:
- Configure catalog federation between AWS Glue Data Catalog and Snowflake Horizon Catalog
- Set up OAuth2 authentication for secure access
- Grant access to Iceberg table in Snowflake Horizon Catalog using AWS Lake Formation
- Query federated tables using Amazon Athena
You can follow the same steps to establish a secure connection with open-source catalog options such as Snowflake Open Catalog, a managed service for Apache Iceberg. Remember to clean up any resources you created while following this tutorial to avoid ongoing charges.
To further explore this solution in your environment, consider the following resources:
- AWS Glue announces catalog federation for remote Apache Iceberg catalogs
- Federate to Snowflake Iceberg Catalog
- Introducing catalog federation for Apache Iceberg tables in the AWS Glue Data Catalog
These resources can help you to implement and optimize this integration pattern for your specific use case. As you begin this journey, remember to start small, validate your architecture with test data, and gradually scale your implementation based on your organization’s needs. Stay tuned for future workshops and resources.
About the authors
Hacking Wheelchairs over Bluetooth
Post Syndicated from Bruce Schneier original https://www.schneier.com/blog/archives/2026/01/hacking-wheelchairs-over-bluetooth.html
Researchers have demonstrated remotely controlling a wheelchair over Bluetooth. CISA has issued an advisory.
CISA said the WHILL wheelchairs did not enforce authentication for Bluetooth connections, allowing an attacker who is in Bluetooth range of the targeted device to pair with it. The attacker could then control the wheelchair’s movements, override speed restrictions, and manipulate configuration profiles, all without requiring credentials or user interaction.
Minisforum MS-S1 Max Review – The Best Ryzen AI Max Mini-PC Yet
Post Syndicated from Ryan Smith original https://www.servethehome.com/minisforum-ms-s1-max-review-the-best-ryzen-ai-max-mini-pc-yet/
The Minisforum MS-S1 Max is the best AMD Ryzen AI Max+ 395 system we have tested. Here is what sets this AMD Strix Halo 128GB AI mini PC apart
The post Minisforum MS-S1 Max Review – The Best Ryzen AI Max Mini-PC Yet appeared first on ServeTheHome.
Scapa Flow: Diving Mecca of Scotland
Post Syndicated from Geographics original https://www.youtube.com/watch?v=MOXrwzQ_QCM
[$] Format-specific compression with OpenZL
Post Syndicated from jake original https://lwn.net/Articles/1053018/
Lossless data compression is an important tool for reducing the storage
requirements of the world’s ever-growing data sets. Yann Collet developed
the LZ4
algorithm and designed the Zstandard (or Zstd)
algorithm; he came to the 2025
Open Source Summit Japan in Tokyo to talk about where data compression
goes from here. It turns out that we have reached a point where
general-purpose algorithms are only going to provide limited improvement;
for significant increases in compression, while keeping computation costs
within reason for data-center use, turning to format-specific techniques
will be needed.
MINISFORUM bringing the HEAT at CES 2026
Post Syndicated from Crosstalk Solutions original https://www.youtube.com/shorts/Mbz5AB5RCwU
Upcoming Speaking Engagements
Post Syndicated from Bruce Schneier original https://www.schneier.com/blog/archives/2026/01/upcoming-speaking-engagements-52.html
This is a current list of where and when I am scheduled to speak:
- I’m speaking at the David R. Cheriton School of Computer Science in Waterloo, Ontario, Canada on January 27, 2026, at 1:30 PM ET.
- I’m speaking at the Université de Montréal in Montreal, Quebec, Canada on January 29, 2026, at 4:00 PM ET.
- I’m speaking and signing books at the Chicago Public Library in Chicago, Illinois, USA, on February 5, 2026, at 6:00 PM CT.
- I’m speaking at Capricon 46 in Chicago, Illinois, USA. The convention runs February 5-8, 2026. My speaking time is TBD.
- I’m speaking at the Munich Cybersecurity Conference in Munich, Germany on February 12, 2026.
- I’m speaking at Tech Live: Cybersecurity in New York City, USA on March 11, 2026.
- I’m giving the Ross Anderson Lecture at the University of Cambridge’s Churchill College at 5:30 PM GMT on March 19, 2026.
- I’m speaking at RSAC 2026 in San Francisco, California, USA on March 25, 2026.
The list is maintained on this page.
[$] Debian discusses removing GTK 2 for forky
Post Syndicated from jzb original https://lwn.net/Articles/1051006/
The Debian GNOME team would like to remove the GTK 2 graphics
toolkit, which has been unmaintained upstream for more than five
years, and ship Debian 14 (“forky”) without it. As one might
expect, however, there are those who would like to find a way to keep
it. Despite its age and declared obsolescence, quite a few Debian
packages still depend on GTK 2. Many of those applications are
unlikely to be updated, and users are not eager to give them
up. Discussion about how to handle this is ongoing; it seems likely
that Debian developers will find some way to continue supporting
applications that require GTK 2, but users may have to look
outside official Debian repositories.
Z-Wave Isn’t Dead — Here’s Why It Still Matters (ZWA-2 + Real Range Test)
Post Syndicated from BeardedTinker original https://www.youtube.com/watch?v=GIrMwL8vjeU
Trump Has Redefined Presidential Scandal | The David Frum Show
Post Syndicated from The Atlantic original https://www.youtube.com/watch?v=8UYEaDYuCw8
Why I Didn’t Buy This Nikon Z Camera
Post Syndicated from Matt Granger original https://www.youtube.com/watch?v=1-hso14lvTk
Radicle 1.6.0 released
Post Syndicated from jzb original https://lwn.net/Articles/1054171/
Version
1.6.0 of the Radicle peer-to-peer, local-first code collaboration
stack has been released. Notable changes in this release include
support for systemd
credentials, use of Rust’s clap crate for
parsing command-line arguments, and more. LWN covered the project in March
2024.
Security updates for Wednesday
Post Syndicated from jzb original https://lwn.net/Articles/1054167/
Security updates have been issued by AlmaLinux (sssd), Debian (linux-6.1 and python-parsl), Fedora (chezmoi, complyctl, composer, and firefox), Oracle (kernel), Red Hat (buildah, libpq, podman, postgresql, postgresql16, postgresql:13, postgresql:15, and postgresql:16), SUSE (avahi, curl, ffmpeg-4, ffmpeg-7, firefox, istioctl, k6, kubelogin, libmicrohttpd, libpcap-devel, libpng16, libtasn1-6-32bit, matio, ovmf, python-tornado6, python311-Authlib, and teleport), and Ubuntu (angular.js, python-urllib3, and webkit2gtk).
Reducing Cloud Chaos: Rapid7 Partners with ARMO to Deliver Cloud Runtime Security
Post Syndicated from Joel Alcon original https://www.rapid7.com/blog/post/cds-reducing-cloud-chaos-rapid7-partners-with-armo-delivering-cloud-runtime-security
Rapid7 has partnered with ARMO, a leader in cloud infrastructure and application security based on runtime data, to offer Cloud Runtime Security. The new offering, currently in beta, extends our vulnerability and exposure management solution, Exposure Command, into the moment where cloud risk becomes real: while applications and workloads are running. The solution does this with several differentiators that map directly to what security leaders need most: signal accuracy and response speed.
Introducing Rapid7 Cloud Runtime Security
Rapid7 Cloud Runtime Security combines kernel-level observability with AI-powered behavioral analysis to create a continuous, threat-aware defense layer within all cloud environments.
The solution provides:
-
AI-driven behavioral baselines for container activity. Because services, teams, and software releases create constant change, static policies can quickly become irrelevant and overly noisy. Cloud runtime security augmented by AI helps establish a behavioral baseline of what “normal” looks like for workload activity. This baseline becomes the standard for identifying deviations that indicate active exploits. This becomes even more critical for AI workloads in which runtime is the only place to understand behavior.
-
Root-cause in every risk finding. When a threat is detected, the platform does not just create noise by firing an alert. Instead, it reconstructs the entire event with root-cause insights by linking application-layer activity (like a SQL injection) to infrastructure-level changes (like a container escape). It also provides a natural-language narrative of the attack, showing exactly what happened, which credentials were used, and which resources were accessed.
-
Connected dots across the entire cloud ecosystem. From cloud and Kubernetes events, clusters APIs, container and workload processes, to individual lines of code, the solution displays the entire attack story. Instead of sifting through siloed, disparate security tools that each present different alerts, teams gain a single source of objective truth for faster forensic analysis.
-
Deep application-layer visibility. Instantly detect and respond to common attacks, including SQL injections, command injections, local file inclusion (LFIs), and server-side request forgery (SSRF) that regular endpoint detection and response (EDR) tools overlook because their visibility is limited to the host and process level.
-
Orchestrated automated response to detected anomalies. Detection is only part of the full battle. Speed is the difference between a contained event and a disruptive, expensive data breach. The solution automatically terminates malicious processes, pauses compromised containers, isolates namespaces, or blocks egress to prevent an attacker’s lateral movement.
Rapid7 Cloud Runtime Security enables orchestrated automated response when anomalies are detected, enabling teams to quickly mobilize and contain threats.
Security amidst the chaos
Chaos is the natural state of cloud environments, where instances frequently shut down and containers constantly change. In these environments, chaos isn’t a deficiency, but an inherent characteristic of distributed systems. Containers spin up and down constantly, deployments change multiple times per day, images get rebuilt and redeployed, identities and permissions drift, and workloads inherit misconfigurations at scale
Traditional vulnerability management (VM) was designed to protect static, on-prem technology architectures. Periodic scans, CVSS scores, and reactive patching have been effective here, but point-in-time snapshots and reactive remediation strategies collapse in dynamic, highly-distributed cloud environments for the following reasons:
-
Blind spots. Ephemeral cloud resources can spin up, perform a task, and disappear in minutes. If a vulnerable container exists for only 10 minutes between a scheduled scan, traditional VM tools will miss it and an automated attacker script will find and exploit it in seconds.
-
Missing context. Network scanners find CVEs, but they often lack contextual awareness. For instance, a ‘critical’ vulnerability may represent a low risk in a library that exists on an isolated container with no internet access. Conversely, a ‘medium’ vulnerability on a public-facing server with an over-privileged IAM role can be a catastrophic exploit.
-
Misconfigurations. In the cloud, vulnerabilities can live on unpatched software, but also arise from misconfigured systems. Consider a fully patched server that is compromised because of an open S3 bucket or a broad IAM policy. According to Gartner, “through 2026, nonpatchable attack surfaces will grow from less than 10% to more than half of the enterprise’s total exposure, reducing the impact of automated remediation practices1.”
-
AI-driven complexity. AI is accelerating innovation cycles, and as organizations push out more code, AI has introduced several new dimensions to the attack surface. These can include vulnerabilities that trick LLM models into revealing sensitive data or bypassing security controls.
The new baseline for modern cloud security
As modern cloud environments are constantly changing, security teams need to know in real time when exposures become active threats. Rather than toiling over a ‘high’ or ‘critical’ vulnerability, they prioritize remediation actions based on the paths that lead to compromise. This is because a vulnerability can become a critical exposure when the conditions around it make it reachable, exploitable, and high impact. Savvy security teams use exposure management solutions to assess whether they are likely to get compromised, then lean on cloud runtime platforms to identify, in real-time, whether they are actively compromised. As a result, the best security programs now run on a “two-engine” model:
-
Predictive and preemptive with exposure management. This risk-forecasting layer discovers, prioritizes, and guides action on the exposures most likely to lead to material impact. Organizations utilize exposure management solutions to identify which exposures should be addressed first, the shortest paths to breach, and the remediation activities that most reduce risk.
-
Real-time and proactive with runtime security. This threat-reality layer detects anomalous behavior as it happens and supports immediate containment actions. Organizations use runtime security solutions to assess whether an exposure is actively being exploited, the configuration changes that may have led to the exposure, and the actions that need to be taken to contain the threat.
On their own, each part of the engine is valuable, but exposure management without runtime can cause teams to overlook active threats; runtime without exposure context can drown teams in noisy alerts. Together, these solutions enable teams to prioritize what matters most and respond instantly when it becomes active.
Visit our cloud security pages to learn more about how Rapid7 empowers teams to proactively manage risk, accelerate DevSecOps, and enforce compliance across multi-cloud environments.
1 Gartner, Predicts 2023: Enterprises Must Expand From Threat to Exposure Management, Jeremy D’Hoinne, Pete Shoard, Mitchell Schneider, John Watts, December 2022
Fire Aboard USS Enterprise, 1969
Post Syndicated from The History Guy: History Deserves to Be Remembered original https://www.youtube.com/watch?v=-nfbgKOnDrM
Comic for 2026.01.14 – Jupiter
Post Syndicated from Explosm.net original https://explosm.net/comics/jupiter
New Cyanide and Happiness Comic
Coolest Projects 2026: Opens for entries in January!
Post Syndicated from Helen Gardner original https://www.raspberrypi.org/blog/coolest-projects-2026-opens-for-entries-in-january/
Coolest Projects is our global technology showcase for young people up to age 18. It’s a place where young creators share the brilliant things they’ve made using digital technology — from first-ever Scratch projects and coding for fun experiments to ambitious robotics builds — with a global audience. Everyone who takes part receives certificates and rewards to celebrate their achievements.
What you need to know about Coolest Projects 2026
Coolest Projects is open to any young person, anywhere in the world. Creators can submit their tech projects to our online showcase, explore the global project gallery, and join our special celebration livestream. There are in-person events in some countries for local creators, too (find out more below).

By taking part in Coolest Projects, young people can:
- Join an international community of digital makers
- Represent their country on a global stage
- Receive feedback on their creations
- Earn certificates to recognise their achievements
- Celebrate their progress at our livestream event on 24 June 2026
It is completely free to take part in Coolest Projects, and we welcome all kinds of digital technology projects — from first attempts to an ambitious STEM project or advanced build. Projects don’t need to be finished to be submitted.
Creators can enter a project into one of seven categories: Scratch, Games, Hardware, Web, Mobile Apps, Advanced Programming, and the emergent category of AI.
How Coolest Projects makes a difference
The findings from the Coolest Projects 2025 Impact report offer clear, evidence-based insights into how Coolest Projects builds confidence, creativity, and a sense of belonging for young people around the world. In 2025, almost 12,000 young people from 41 countries took part in Coolest Projects online, a 57% increase on the previous year. This year, we’re excited to welcome even more creators to the Coolest Projects community.

Our annual evaluation shows that Coolest Projects continues to have a powerful impact on young digital creators worldwide. In 2025:
- 100% of mentors and 72% of young people taking part in the online showcase said their confidence in digital making increased
- 83% of young people felt inspired to continue learning and participating in computing after taking part
- 74% of young creators and 100% of mentors said Coolest Projects helped them or their team feel a sense of belonging in computing
- 80% of surveyed young people said seeing projects from around the world made them feel part of a larger community of makers
Creators told us how proud they felt sharing their work:
“It feels like I’m being noticed!” – Young creator, UK
“I enjoyed presenting my project and seeing so many creative ideas from others.” – Young creator, India
With many early-stage makers joining for the first time, including 55% of young people at in-person events, Coolest Projects continues to be an accessible entry point into the world of digital creativity.

We’re also proud to see growing participation from girls who code, who tell us they value the chance to share their ideas and be inspired by others. At in-person events, girls made up 63% of creators in India, 50% in the US, 39% in Ireland, and 37% in the UK.
Find out more about the incredible creativity and collaboration from mentors and makers worldwide in our 2025 Impact report: rpf.io/cp-impact-2025
How to take part in Coolest Projects
- Come up with an idea — or choose something you’ve already made for school or a science fair project. Whether it started as a small classroom task or a personal coding challenge, any tech creation can be part of Coolest Projects. Our projects site offers hundreds of free, step-by-step guides — ideal for beginners, mentors, and anyone looking for engaging STEM activities for kids. The 2025 online gallery is also a great place to find inspiration for your next cool coding project.
- Select your category. Our category pages break down each of the seven categories, including our AI category.
- Work on the project individually or with friends. Young people can take part individually or in teams of up to five.
- Submit it via the Coolest Projects website by 27 May 2026. We encourage creators to take part in both the online showcase and their local in-person event — find the dates below.
- See your project showcased in our online gallery.
- Join the celebration livestream to discover creations from around the world on 24 June 2026.

Group codes for mentors entering multiple projects online
If you’re entering several projects on behalf of your group, you can create a group code to link young people’s projects to your account.
Here’s a quick reminder of how it works:
- Sign up or log in: Use your Raspberry Pi account or create a new one.
- Create a group: Add your group details, including name and country.
- Share your group code: Young people enter the code on their project submission form.
- Review and submit: View all linked projects in your group dashboard.
There is no limit to the number of young people who can submit through one group code.
If you’d like a full walkthrough, watch our step-by-step group code ‘how-to’ video.
Whether your coders are beginners or experienced digital makers, there are lots of resources to support them. Visit the Coolest Projects guidance page for mentor guides, session plans, and more.
Coolest Projects in-person events in 2026
Alongside the global online showcase, Coolest Projects events will take place in several countries again this year. We encourage creators to take part in both their local in-person event and the global showcase.

Save the date for:
- Coolest Projects Belgium – 14 March
- Coolest Projects Japan – 29 March
- Coolest Projects USA (Minnesota) – 11 April
- Coolest Projects Ireland – 25 April
- Coolest Projects USA (Georgia) – 2 May
- Coolest Projects UK – 16 May
- Coolest Projects Sudan (held in Egypt) – 12 August
- Coolest Projects Nigeria – 29 August
More dates coming soon for:
- Coolest Projects Canada
- Coolest Projects India
- Coolest Projects Indonesia
- Coolest Projects Malaysia
- Coolest Projects South Africa
- Coolest Projects Sri Lanka
Sign up to the Coolest Projects newsletter to be the first to hear about events near you.
We can’t wait to see what your young people create
Whether your young people already have something they’re excited to share or they’re ready to start something new, Coolest Projects is the perfect place to celebrate their creativity, problem solving, and imagination.
We can’t wait to see the incredible projects they bring to Coolest Projects 2026.
The post Coolest Projects 2026: Opens for entries in January! appeared first on Raspberry Pi Foundation.