Post Syndicated from xkcd.com original https://xkcd.com/3059/

Post Syndicated from xkcd.com original https://xkcd.com/3059/
Post Syndicated from The History Guy: History Deserves to Be Remembered original https://www.youtube.com/watch?v=Mh2F_ShjekQ
Post Syndicated from aostan original https://aws.amazon.com/blogs/compute/architecting-for-seamless-on-premises-connectivity-with-aws-outposts-servers/
This post is written by Mark Nguyen, Principal Solutions Architect, AWS and Ryan Fillis, Solutions Architect, AWS.
AWS Outposts brings native AWS services, infrastructure, and operating models to virtually any data center, co-location space, or on-premises facility. Deploying Outposts servers in your environment necessitates additional considerations regarding local network connectivity and Amazon Elastic Compute Cloud (Amazon EC2) instance networking. This post demonstrates the scalability of Outposts servers through automation and the deployment of Amazon EC2 network interfaces. This reduces the number of manual steps required to configure an Outposts server.
This post details physically connecting your servers to your Local Area Network (LAN) and the networking options available for EC2 instances running on Outposts. We cover the physical cabling options, virtual networking components such as VPCs and subnets, and walkthrough an example setup for an EC2 instance with a user-data script to route traffic locally over your on-premises network.
This post assumes that you have some familiarity with Outposts servers. If you would like a general refresher, observe What is AWS Outposts. For more information about how to provision your Outposts server, see Installing an AWS Outposts server.
When launching an EC2 instance on an Outposts server a single interface is created for network connectivity. This default setting, depicted in the following diagram, is the most direct method for your instance to communicate externally.

Figure 1: Simple network connectivity on an Outposts server
When deploying an EC2 instance to an Outposts server, there are certain differences in using the default Elastic Network Interface (ENI) as compared to deploying in an AWS Region. Understanding these differences is critical before modifying the network configuration, which you do in the next step.
ENI differentiators between Outposts servers and the Region:
Outposts servers allow you to communicate through the Local Network Interface (LNI) in addition to the ENI. The LNI is a logical networking component that connects the Amazon EC2 instances in your Outposts subnet to your on-premises network.
The Outposts server EC2 instance local communications characteristics:
aws ec2 modify-subnet-attribute \
--subnet-id subnet-1a2b3c4d \
--enable-lni-at-device-index 1

Figure 2: Example scenario topology
In the example scenario, we want to launch an Amazon Linux 2023 instance and route all default traffic through the local network. Eth0 is the primary interface (ENI) and is used for traffic towards the Region. Eth1 is the LNI and is used for all other traffic. A user-data script is used to make the necessary routing changes at launch.
Here is a sample user-data script. These commands run as root so there is no need to prepend each command with sudo.
User data script (my_userdata.txt):
#!/bin/bash
route add -net 172.31.0.0/16 gw 172.31.239.1
route del default gw 172.31.239.1
cp -RL /run/systemd/network/* /etc/systemd/network/
echo -e '\n[Route]\nDestination=172.31.0.0/16\nGateway=172.31.239.1\nGatewayOnLink=yes' >> /etc/systemd/network/70-ens5.network
sed -i -e 's/UseGateway=true/UseGateway=false/g' /etc/systemd/network/70- ens5.network.d/eni.conf
We can break down this script to observe the intent of each command:
route add -net 172.31.0.0/16 gw 172.31.239.1
route del default gw 172.31.239.1
When an instance is launched on Outposts server, the instance automatically has a default route that points toward the VPC through the ENI. In the example scenario, the desired configuration is to have all default traffic go through the LNI toward our on-premises LAN, not through the ENI. To accomplish this routing behavior for the ENI, we have to add a route toward the VPC and remove the default route. The first line adds a route through the VPC (172.31.0.0/16), using 172.31.239.1 as the gateway. The second line removes the default route that uses 172.31.239.1 (via the ENI) as the gateway.
Traffic not destined for the VPC routes through the LNI. This includes all local traffic and internet-bound traffic. The local network’s DHCP server provides a default-gateway in its DHCP lease. Therefore, there is already a default route assigned to the LNI. This steers any traffic without a more specific route, including internet traffic, toward the LNI.
Next, the user-data script makes the network settings persistent after reboot. The procedure varies depending on your OS. In the case of Amazon Linux 2023, it uses systemd-networkd.
cp -RL /run/systemd/network/* /etc/systemd/network/
This command copies the configuration files from the /run/systemd/network/ folder to /etc/systemd/network/. The configuration files in the /etc/systemd/network/ folder override the default settings and load during boot. The next is step is to modify the newly copied network configuration files.
echo -e '\n[Route] \nDestination=172.31.0.0/16 \nGateway=172.31.239.1 \nGatewayOnLink=yes' >> /etc/systemd/network/70-ens5.network
In this case the ENI is ens5. This line appends the static route section to the 70-ens5.network configuration file. This makes the static route added earlier in the script (route add -net 172.31.0.0/16 gw 172.31.239.1) persistent across reboots.
sed -i -e 's/UseGateway=true/UseGateway=false/g' /etc/systemd/network/70- ens5.network.d/eni.conf
Next, the user-script edits the configuration file, eni.conf, such that the default route isn’t used for the ENI at bootup. This is accomplished using sed to search and replace true with false for the UseGateway parameter.
Now that the user-data script has been created, use the AWS Command Line Interface (AWS CLI) to launch an EC2 instance:
aws ec2 run-instances \
--image-id ami-051f8a213df8bc089 \
--count 1 \
--instance-type c6id.xlarge \
--key-name my_key \
--user-data file://my_userdata.txt \
--network-interfaces '[ \
  { "DeviceIndex":0, "SubnetId":"subnet-0ca6abe6b34adfcce", "Groups": ["sg-0a9f8c2200c0a56f1"] }, \
  { "DeviceIndex":1, "SubnetId":"subnet-0ca6abe6b34adfcce", "Groups": ["sg-0a9f8c2200c0a56f1"] }]' \
--tag-specifications '[{ "ResourceType":"instance","Tags":[ \
  { "Key":"Name", "Value":"server1" } ] }]'
We can break down the parameters used in the preceding command:
--image-id ami-051f8a213df8bc089 \
This specifies the Amazon Machine Image (AMI) ID. ami-051f8a213df8bc089 is the AMI ID for Amazon Linux 2023 in us-east-1.
--count 1 \
This specifies how many EC2 instances to launch. You can launch multiple at the same time.
--instance-type c6id.xlarge
This specifies the instance type. By default, Outposts 2U servers are slotted with the c6id.8xlarge instance type and Outposts 1U servers are slotted with the c6gd.8xlarge instance type. You can adjust the slotting assignment during the ordering process or you can change the slotting assignment later by using the Self-service Capacity Management feature for AWS Outposts.
--key-name my_key
This specifies the public RSA key that is added to your EC2 instance. This key must already be defined in the same Region of your AWS account.
--user-data file://my_userdata.txt
This specifies the filename that contains your user-data script (that was created previously).
{ "DeviceIndex":0, "SubnetId":"subnet-0ca6abe6b34adfcce", "Groups": ["sg-0a9f8c2200c0a56f1"] }, \
{ "DeviceIndex":1, "SubnetId":"subnet-0ca6abe6b34adfcce", "Groups": ["sg-0a9f8c2200c0a56f1"] }]' \
This specifies the network interface configuration. By default, a single network interface, the ENI, is created. This example calls for a second interface for the LNI. DeviceIndex:0 is for the ENI and doesn’t change. DeviceIndex:1 is for the LNI, which we defined when we enabled LNI for the subnet (--enable-lni-at-device-index 1). The SubnetId refers to the subnet that was created on the Outposts server. If you want to deploy to a different Outposts server, then change the SubnetId. Groups refer to the security group that you would like assigned to the ENI. Security groups aren’t supported for the LNI, thus the security group specified for DeviceIndex:1 is only to comply with the command syntax check. A security group will not be applied to the LNI.
--tag-specifications '[{ "ResourceType":"instance","Tags":[ \
{ "Key":"Name", "Value":"server1" } ] }]'
This assigns a name to the EC2 instance, which in this case is server1.
AWS Outposts servers allow you to run native AWS services on-premises by providing local compute. This supports workloads with low latency and data residency requirements through on-premises processing.
Although Outposts servers integrate seamlessly with the AWS cloud, there are some unique networking considerations when deploying in your data center environment. Amazon EC2 instances on the Outposts server can route traffic over the AWS global network, but you can also enable Local Network Interfaces (LNIs) to directly access your on-premises networks.
In this post we’ve demonstrated using user-data scripts during instance launch to automate hybrid cloud networking flows tailored to your requirements. With proper planning, you can use the benefits of consistent AWS services and tooling while maintaining connectivity to your existing on-premises infrastructure.
Ready to get started with hybrid cloud networking on Outposts servers? Check out the Outposts server documentation and best practices guide to begin planning your on-premises deployment.
Post Syndicated from jzb original https://lwn.net/Articles/1012453/
Mozilla’s actions have been rubbing many Firefox fans the
wrong way as of late, and inspiring them to look for alternatives.
There are many choices for users who are looking for a browser that
isn’t part of the Chrome monoculture but is full-featured and suitable
for day-to-day use. For those who are willing to stay in the Firefox
“family” there are a number of good options that have taken vastly
different approaches. This includes GNU IceCat, Floorp, LibreWolf, and Zen.
Post Syndicated from Taylor Jacobsen original https://aws.amazon.com/blogs/aws/new-year-new-heroes-march-2025/
As we dive into 2025, we’re thrilled to announce our latest group of AWS Heroes! These exceptional individuals have demonstrated outstanding expertise and innovation, and are committed to sharing knowledge. Their contributions to the AWS community are greatly appreciated, and today we’re excited to celebrate them.
 Container Hero Ahmed Bebars is a Principal Engineer at The New York Times, where he leads the design and delivery of scalable developer platforms that enhance productivity and empower engineering teams. With deep expertise in containers, Kubernetes, and cloud-native technologies, Ahmed builds robust infrastructure solutions that streamline development workflows and support innovation. As an active member of the AWS and Cloud Native communities, he frequently shares his expertise at events like KubeCon, AWS re:Invent, AWS Community Days, and Kubernetes Community Days. Through his initiative, “Level Up with Ahmed,” he shares practical insights and resources to help engineers grow their skills and stay ahead in the evolving tech landscape.
 Community Hero Badri Narayanan Kesavan is an Engineering Lead and Solutions Architect with over a decade of professional experience, specializing in AWS Cloud solutions, platform engineering, and DevOps automation. Badri’s passion lies in learning and sharing with the community. He has delivered several talks at AWS Singapore Summit, AWS Summit ASEAN 2023, AWS Community Days, and various user group meetups. As an active AWS community leader, he organizes meetups and workshops under the AWS Singapore User Group where he regularly conducts sessions on diverse AWS topics, engaging a wide audience to foster innovation and collaboration. He has also authored the book “Mastering Amazon EC2)” which is a comprehensive guide to building robust and resilient applications on Amazon Elastic Compute Cloud (Amazon EC2).
 Community Hero Marcelo Paiva has over 30 years of experience in technology and is the CTO at Softprime Soluções, leading product development and research in digital biometrics, facial recognition, and artificial intelligence (AI). With more than a decade working with cloud computing, he specializes in building scalable and innovative solutions using AWS. Passionate about tech communities, Marcelo founded the AWS User Group in Goiânia in 2018, helping grow the local community. Today, he organizes events such as JoinCommunity and Cloud Summit Cerrado, fostering learning and networking in the Cerrado region.
 Community Hero Raphael Jambalos manages the Cloud Native development team at eCloudValley Philippines. His team has implemented dozens of cloud-native applications across multiple industries for customers in the Philippines. He is active in helping the AWS User Groups grow in the Philippines, and is passionate about connecting with the community beyond Manila. In his free time, he loves to read books and write about cloud technologies on his Dev.to blog.
 Container Hero Stav Ochakovski is a DevOps Engineer at Beacon and a cybersecurity expert, managing highly scalable multi-cloud environments. With a background in DevOps engineering and instruction, Stav seamlessly transitioned into the dynamic cybersecurity start-up scene. A champion of container technologies and Amazon Elastic Kubernetes Service (Amazon EKS), she brings deep expertise in Kubernetes, CI/CD pipelines, and logging solutions to the AWS community. Stav actively shares her expertise by speaking at AWS community events, as well as security and container conferences. She is also a leader of the Israel AWS User Group and is a pastry-chef school graduate and licensed skipper.
Visit the AWS Heroes website if you’d like to learn more about the AWS Heroes program, or to connect with a Hero near you.
— Taylor
Post Syndicated from Matt Granger original https://www.youtube.com/watch?v=pCHZJ6KMFZQ
Post Syndicated from Patrick Kennedy original https://www.servethehome.com/intel-xeon-6-high-priority-and-low-priority-cores-explained/
Many new Intel Xeon 6700P SKUs have high-priority and low-priority core options with very different base frequencies. We explain why and how
The post Intel Xeon 6 High-Priority and Low-Priority Cores Explained appeared first on ServeTheHome.
Post Syndicated from Pat Patterson original https://www.backblaze.com/blog/experimenting-with-deepseek-backblaze-b2-and-drive-stats/

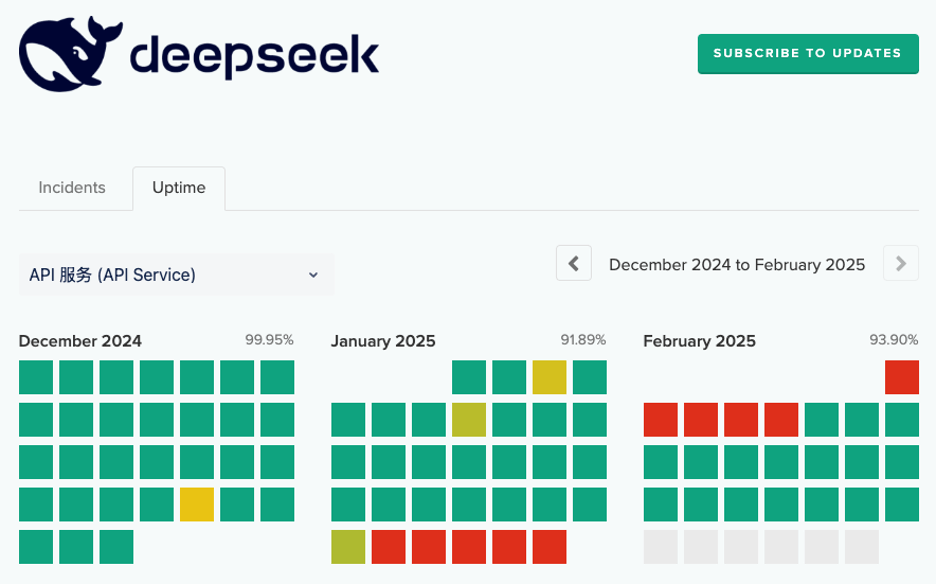
As we explained in our recent blog post, AI Reasoning Models: OpenAI o3-mini, o1-mini, and DeepSeek R1, Chinese startup DeepSeek caused a stir when it released its R1 reasoning model in January of this year. Interestingly, DeepSeek R1 has an OpenAI-compatible API, so applications written for OpenAI should work with DeepSeek R1 with just a configuration change. Since I had a suitable sample app all ready to go, I decided to put their claim to the test.
A major difference between DeepSeek and OpenAI is cost. At the time of writing, DeepSeek charges $0.55 per million input tokens and $2.19 per million output tokens for its R1 model. That’s about 3.6% of OpenAI’s $15.00 per million input tokens and $60.00 per million output tokens for its flagship o1 reasoning model, and about half of o3-mini’s $1.10 per million input tokens and $4.40 per million output tokens.
Set against this is the fact that, in using the DeepSeek platform’s API, you are sending your data to a startup located in China that has been accused by OpenAI of “inappropriately” basing its work on the output of OpenAI’s models. It’s up to you, and your organizations’ data governance policy, whether the trade-off is worthwhile.
Another consideration is the ability to run DeepSeek’s models locally, on your own infrastructure, or, more likely, your chosen provider’s infrastructure, rather than sending requests to the DeepSeek platform. Spinning up my own DeepSeek instance was out of scope for this blog post, but I’ll likely return to it in a future blog post.
Last month, I explained how you can build an AI agent with Backblaze B2, LangChain, and Drive Stats, walking you through a simple chatbot that can answer questions based on our Drive Stats data set—11 years of metrics gathered from the Backblaze B2 Cloud Storage platform’s fleet of hard drives. In that example, the chatbot accepted a natural language question, used OpenAI’s GPT‑4o mini large language model (LLM) to generate a SQL query that might help provide an answer, executed the query against the Drive Stats data set via the Trino SQL engine, and then used OpenAI again to interpret the result set and either repeat the query-interpret cycle, or generate a natural language answer.
I copied the Jupyter notebook from that example and used it as the basis for investigating the feasibility of swapping out OpenAI for DeepSeek. The DeepSeek version of the notebook contains the full source code of my experiments; I’ll include relevant extracts here, edited for clarity.
Since I used the LangChain AI framework, which provides a layer above a range of AI models, the only place that OpenAI surfaced in my code was in creating an instance of LangChain’s ChatOpenAI wrapper:
# OPENAI_API_KEY must be defined in the .env file
load_dotenv()
llm = ChatOpenAI(model="gpt-4o-mini")
The ChatOpenAI class contains all the code required to communicate with OpenAI via its API.
According to the DeepSeek documentation, all you should need to do is:
OPENAI_API_KEY environment variable.https://api.deepseek.com.If this reminds you of the steps for using Backblaze B2’s S3-compatible API, you’re not alone. The OpenAI API has become a de facto standard for integrating with LLMs in much the same way as Amazon’s S3 API allows an ecosystem of apps and tools to interoperate with object storage systems from a variety of vendors.
Looking at the DeepSeek documentation, you can use one of two models, deepseek-reasoner (aka DeepSeek R1) or deepseek-chat. Let’s see what the much-talked-about DeepSeek R1 came up with.
To make it easy to use both the OpenAI and DeepSeek notebooks, I created a second entry in the .env file for the DeepSeek API key, and copied it to the OpenAI environment variable in the notebook code:
# The .env file needs at least DEEPSEEK_API_KEY, and may also contain
# OPENAI_API_KEY. Move the DeepSeek API key to the OpenAI environment
# variable
load_dotenv()

os.environ["OPENAI_API_KEY"] = os.environ.pop("DEEPSEEK_API_KEY")

llm = ChatOpenAI(model="deepseek-reasoner", base_url='https://api.deepseek.com')
As I set about repeating the steps from the Jupyter notebook that supported my previous blog post, I was disappointed to see DeepSeek fall at the very first hurdle: generating a SQL query for a simple natural language question. Here is the code:
question = {"question": "How many drives are there?"}

write_query(question)
Looking back at the original notebook, OpenAI’s response was valid SQL, although it didn’t have enough information to construct the correct query:
{'query': 'SELECT COUNT(*) AS drive_count FROM drivestats'}
DeepSeek, on the other hand, responded with a Python stack trace and this error:
openai.UnprocessableEntityError: Failed to deserialize the JSON body into the target type: response_format: response_format.type `json_schema` is unavailable now at line 1 column 13827
What went wrong? Searching for the error turns up a comment from a LangChain engineer explaining that we should use BaseChatOpenAI rather than ChatOpenAI since it “[…] accommodates many APIs that are similar to OpenAI. It uses tool calling for structured output by default.”
So, we can redefine llm accordingly, and try generating a query again:
llm = BaseChatOpenAI(model="deepseek-reasoner", base_url='https://api.deepseek.com')

write_query(question)
Unfortunately, DeepSeek returns another error:
BadRequestError: Error code: 400 - {'error': {'message': 'The last message of deepseek-reasoner must be a user message, or an assistant message with prefix mode on (refer to https://api-docs.deepseek.com/guides/chat_prefix_completion).', 'type': 'invalid_request_error', 'param': None, 'code': 'invalid_request_error'}}
Looking back at the AI agent code, we can see that we used an off-the-shelf prompt from the LangChain Prompt Hub that provides the model with a single, system, message:
================================ System Message ================================

Given an input question, create a syntactically correct {dialect} query to run to help find the answer. Unless the user specifies in his question a specific number of examples they wish to obtain, always limit your query to at most {top_k} results. You can order the results by a relevant column to return the most interesting examples in the database.

Never query for all the columns from a specific table, only ask for a few relevant columns given the question.

Pay attention to use only the column names that you can see in the schema description. Be careful to not query for columns that do not exist. Also, pay attention to which column is in which table.

Only use the following tables:
{table_info}

Question: {input}
Does this mean that DeepSeek is not, in fact, API-compatible with OpenAI? I would argue that it does not. DeepSeek implements the same API request/response syntax as OpenAI, but it is a different platform. Some variation in semantics is to be expected. We see similar variations between Backblaze B2 and Amazon S3; for example, the S3 PutObjectAcl operation sets the access control list (ACL) for an object in a bucket. Amazon S3’s access management model allows you to manipulate an object’s ACL independently of its bucket—for example, you can put a private object in a public bucket, and vice versa.
This flexibility comes with a cost: It becomes difficult to reason about the visibility of data. In fact, AWS now recommends “that you keep ACLs disabled, except in unusual circumstances where you need to control access for each object individually.”
Backblaze B2’s model is much simpler: You control access at the bucket level, and all objects have the same ACL as their bucket. Backblaze B2 implements the PutObjectAcl operation, but, if you try to set an object’s ACL to any other value than its bucket’s ACL, the service responds with an error.
Returning to the AI agent code, we can replace the single-system-message prompt with one that combines a system message with a user message:
import textwrap
from langchain_core.prompts import ChatPromptTemplate

query_prompt_template = ChatPromptTemplate([
    ("system", textwrap.dedent("""Given an input question, create a
    syntactically correct {dialect} query to run to help find the answer.
    Unless the user specifies in his question a specific number of examples
    they wish to obtain, always limit your query to at most {top_k} results.
    You can order the results by a relevant column to return the most
    interesting examples in the database.

    Never query for all the columns from a specific table, only ask for a the
    few relevant columns given the question.

    Pay attention to use only the column names that you can see in the schema
    description. Be careful to not query for columns that do not exist. Also,
    pay attention to which column is in which table.

    Only use the following tables:
    {table_info}""")),
    ("human", "Question: {input}"),
])
Trying the write_query() call for a third time, this is the response:
BadRequestError: Error code: 400 - {'error': {'message': 'deepseek-reasoner does not support Function Calling', 'type': 'invalid_request_error', 'param': None, 'code': 'invalid_request_error'}}
A third error! What is this “function calling” that deepseek-reasoner does not support? A helpful article on the topic at the Hugging Face AI community explains:
Function calling is a powerful capability that enables Large Language Models (LLMs) to interact with your code and external systems in a structured way. Instead of just generating text responses, LLMs can understand when to call specific functions and provide the necessary parameters to execute real-world actions.
Unfortunately, that is exactly our use case. It’s becoming clear that DeepSeek R1 is not the correct tool for implementing an AI agent—we’ve been trying to use a chisel as a screwdriver!
As its name suggests, the deepseek-chat model is more appropriate for this application. The DeepSeek documentation tells us that it is based on DeepSeek-V3, released in December 2024. DeepSeek-V3 is priced at $0.27 per million input tokens and $1.10 per million output tokens; this is actually more expensive than the GPT-4o mini model I used for the OpenAI agent example ($0.15 per million input tokens, $0.600 per million output tokens), but how does it compare? Let’s take a look.
First, we need to edit the LLM creation code again to set the model name:
llm = BaseChatOpenAI(model="deepseek-chat", base_url='https://api.deepseek.com')
Now we can run write_query() again. It’s immediately clear that it’s a better fit than its “big brother:”
{'query': 'SELECT COUNT(*) AS total_drives FROM drivestats LIMIT 10'}
As with the OpenAI agent, this query is well-formed SQL, but it’s not answering the question we set—it’s giving us the total number of rows in the dataset, rather than the number of drives. Also, it’s a little odd to have a LIMIT clause in a SELECT COUNT(*) query, but it’s legal SQL, and the agent is following its instructions very literally: always limit your query to at most {top_k} results, where we set top_k to 10.
question = {"question": "Each drive has its own serial number. How many drives are there?"}

query = write_query(question)

{'query': 'SELECT COUNT(DISTINCT serial_number) AS total_drives FROM drivestats'}
So far, so good!
I’ll skip some intermediate steps here—they are all in the Jupyter notebook if you want to review them, or run them for yourself—and look at how a simple LangChain graph, built on the DeepSeek LLM, answered the question: “Each drive has its own serial number. How many drives did each data center have on 9/1/2024?”
The OpenAI version generated an invalid query, comparing the date column with the string ’2024-09-01’ without using the required DATE type identifier, but DeepSeek generates a correct SQL query and provides a useful natural language response:
/SELECT datacenter, COUNT(DISTINCT serial_number) AS drive_count FROM drivestats WHERE date = DATE ‘2024-09-01’ GROUP BY datacenter ORDER BY drive_count DESC LIMIT 10
[(‘phx1’, 89477), (‘sac0’, 78444), (‘sac2’, 60775), (”, 24080), (‘iad1’, 22800), (‘ams5’, 16139)]
On September 1, 2024, the data centers had the following number of drives:
These are the top data centers with the highest drive counts on that date.
DeepSeek scores a point!
Moving on to the ReAct AI Agent, which allows the LLM to perform multiple SQL queries in generating an answer to a question, DeepSeek performs similarly to OpenAI. Given the question, “Each drive has its own serial number. What is the annualized failure rate of the ST4000DM000 drive model?”, the DeepSeek agent provides the overall failure rate rather than the annualized failure rate (AFR).
When we provide explicit instructions for calculating AFR in its prompt, the DeepSeek agent provides the correct result, identical, in fact, to the OpenAI agent’s response:
The annual failure rate (AFR) for the ST4000DM000 drive model is approximately 2.63%.
However, when given the question, “What was the annual failure rate of the ST8000NM000A drive model in Q3 2024?”, the DeepSeek agent gives us:
[(1.6100573445081607,)]
While OpenAI responds:
The annual failure rate (AFR) of the ST8000NM000A drive model in Q3 2024 is approximately 1.61%.
Wrapping up the investigation, the final question from the OpenAI notebook is more complex:
Considering only drive models which had at least 100 drives in service at the end of the quarter and which accumulated 10,000 or more drive days during the quarter, which drive had the most failures in Q3 2024, and what was its failure rate?
Impressively, the OpenAI agent constructed a well-formed SQL query and provided the correct response:
The drive model with the most failures in Q3 2024 is the TOSHIBA MG08ACA16TA, which had 181 failures. Its failure rate during this period was approximately 1.84%.
BadRequestError: Error code: 400 - {'error': {'message': "An assistant message with 'tool_calls' must be followed by tool messages responding to each 'tool_call_id'. (insufficient tool messages following tool_calls message)", 'type': 'invalid_request_error', 'param': None, 'code': 'invalid_request_error'}}
During task with name 'agent' and id '0aa26ba6-a3ee-ced1-de4d-b60ed7fbca99'
The phrase “insufficient tool messages” suggested that the DeepSeek LLM might need to be reconfigured to allow more tokens. According to the documentation on models and pricing, the deepseek-chat model supports a maximum of 8K output tokens, but defaults to 4K if max_tokens is not specified.
Recreating the DeepSeek wrapper object and agent accordingly, I gave it the last question again:
llm = BaseChatOpenAI(model="deepseek-chat", base_url='https://api.deepseek.com', max_tokens=8192, **extra_kwargs)

agent_executor = create_react_agent(llm, tools, state_modifier=system_message)

response = agent_executor.invoke(
    {"messages": [{"role": "user", "content": "Considering only drive models which had at least 100 drives in service at the end of the quarter and which accumulated 10,000 or more drive days during the quarter, which drive had the most failures in Q3 2024, and what was its failure rate?"}]}
)

# Show the SQL query sent to the database
print(response['messages'][-3].tool_calls[0]['args']['query'])

# Show the final response message
display_markdown(response['messages'][-1].content, raw=True)
This time, DeepSeek was able to generate a similar SQL query to OpenAI:
WITH drive_counts AS (
    SELECT model, COUNT(DISTINCT serial_number) AS drive_count
    FROM drivestats
    WHERE date >= DATE '2024-07-01' AND date <= DATE '2024-09-30'
    GROUP BY model
    HAVING COUNT(DISTINCT serial_number) >= 100
), drive_days AS (
    SELECT model, COUNT(*) AS total_drive_days
    FROM drivestats
    WHERE date >= DATE '2024-07-01' AND date <= DATE '2024-09-30'
    GROUP BY model
    HAVING COUNT(*) >= 10000
), failures AS (
    SELECT model, COUNT(*) AS failure_count
    FROM drivestats
    WHERE date >= DATE '2024-07-01' AND date <= DATE '2024-09-30' AND failure = 1
    GROUP BY model
)
SELECT d.model,
       f.failure_count,
       100 * (CAST(f.failure_count AS DOUBLE) / (CAST(d.total_drive_days AS DOUBLE) / 365)) AS annual_failure_rate
FROM drive_days d
JOIN failures f ON d.model = f.model
JOIN drive_counts dc ON d.model = dc.model
ORDER BY f.failure_count DESC
LIMIT 1
With a correct response:
To answer the question:
The drive model with the most failures in Q3 2024 is TOSHIBA MG08ACA16TA, which had 181 failures. The annualized failure rate (AFR) for this model during that quarter was 1.84%.
Success! But, unfortunately, this isn’t the whole story.

I originally set out to write this blog post at the end of January, but the DeepSeek platform website had gone offline by January 30, so I couldn’t even start until I was able to sign up for an API key on February 5.
Given my shiny new API key, and DeepSeek’s claims of OpenAI API compatibility, I naïvely expected to be able to work through my earlier OpenAI notebook and write up the results in a couple of days. The reality was more like two weeks.
In this blog post I’ve detailed some of the error messages I encountered along the way, but I saw many more that pointed to the DeepSeek API simply being overwhelmed with traffic. For example, for over a day, when the status page reported no issues, most API requests to DeepSeek terminated after a minute with the error message:
json.decoder.JSONDecodeError: Expecting value: line 1 column 1 (char 0)
A time-consuming investigation revealed that this was caused by the DeepSeek API returning the 200 status code and headers as if the request was successful, then hanging for a minute before terminating the connection without returning any actual data. The calling code saw the 200 as success and tried to decode the non-existent API response body, resulting in the error.
I saw several more instances of intermittent errors that all seemed to point in the same direction: DeepSeek needs to add capacity to its API platform. Notably, the platform seemed faster and more stable on a Saturday morning, U.S. Pacific time, the early hours of Sunday morning in China.
At present, I would have to classify the DeepSeek-V3 API as “promising, but somewhat flaky.” An agent invocation that succeeds one minute could fail the next with any of a range of error messages. That’s a shame, since when it does work, for instance, in creating the SQL query for the final question above, it tends to work very well.
One final caveat: This is a dynamic field; frameworks and services are literally being updated on a daily basis. For example, since yesterday, as I write this, four of the notebook’s module dependencies have been updated. I encourage you to experiment for yourself as your mileage will almost certainly vary, hopefully in a positive direction.
The post Experimenting with DeepSeek, Backblaze B2, and Drive Stats appeared first on Backblaze Blog | Cloud Storage & Cloud Backup
Post Syndicated from Ashwin Mohan original https://github.blog/engineering/platform-security/finding-leaked-passwords-with-ai-how-we-built-copilot-secret-scanning/
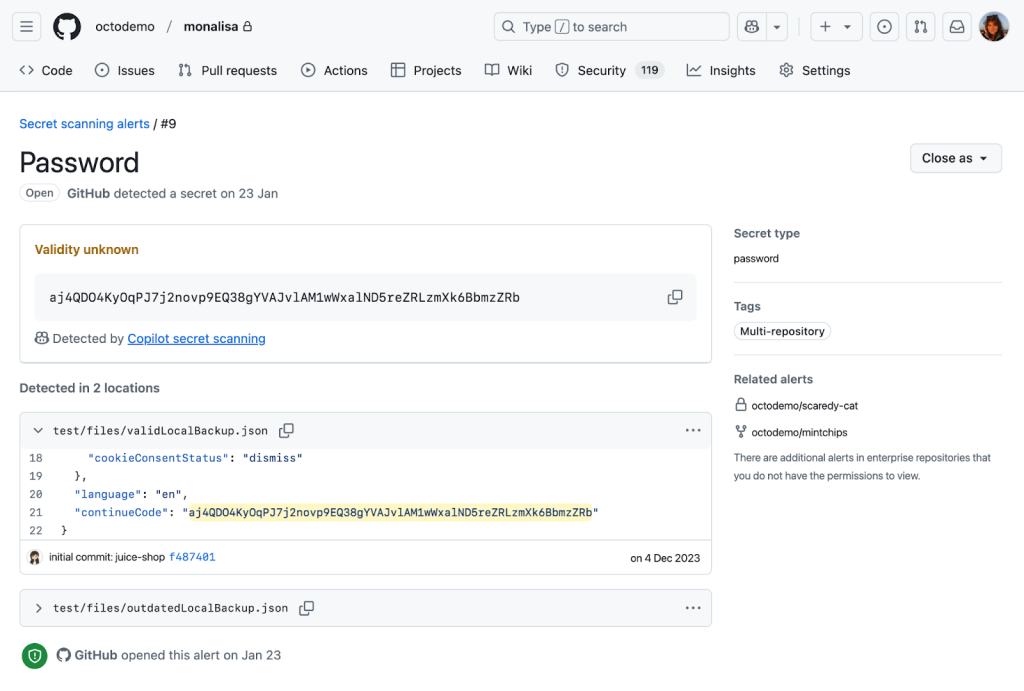
In October 2024, we announced the general availability of Copilot secret scanning, leveraging AI to detect generic passwords in users’ codebases. This post describes how Copilot secret scanning works under the hood, the challenges we ran into when developing it, and the framework we use for testing and iteration.
Copilot secret scanning is a feature of GitHub Secret Protection, which protects millions of repositories on GitHub by detecting hundreds of pattern types through our partner program. The precision of these detections is paramount for security teams and developers when dealing with security alerts. Historically, our detection approach has relied on regular expressions, which is an effective method for identifying secrets with strict, provider-minted formats. However, this method struggles with the nuanced and varied structures of generic passwords, often generating excessive noise for security teams and developers.
We now detect generic passwords with GitHub Copilot, using AI to analyze context—such as the usage and location of a potential secret—to limit noise and deliver relevant alerts that are critical to the health and security of your repositories.
Getting to the point where we were confident in our password precision was a journey over many test cases, prompt iterations, and model changes. Let’s dive in to explore what we learned along the way and find out where we’re going.
At the core of Copilot secret scanning lies a request to a large language model (LLM), expressed through an LLM prompt consisting of:
Our first iteration of the prompt used the few-shot prompting technique, which provides the LLM with example inputs and outputs to demonstrate how to perform the task. We wanted a resource-effective model to run the detections at scale and landed on GPT-3.5-Turbo. In parallel, we developed a basic offline evaluation framework, including manually curated test cases with both positive and negative findings, to help us validate that our approach was sound before deploying it to customers.
We deployed this first iteration to our private preview participants and immediately noticed a problem. While it worked reasonably well at identifying credentials in our offline evaluation, it would fail spectacularly in some customer repositories. The model had difficulty interpreting file types and structures not typically seen in the conventional coding languages and patterns that LLMs train on.
This experience revealed the complexity of the problem and the limiting nature of LLMs. We had to reevaluate our approach.
In response to these initial results, we enhanced the offline evaluation framework in a few key ways. First, we added reports from private preview participants to increase the diversity of our test cases. Next, we enhanced the framework so that we could visually identify and analyze deviations resulting from model or prompt changes. This allowed us to better see the impact of customizing different steps in our prompting strategy. Finally, we leveraged the GitHub Code Security team’s evaluation processes to create a data collection pipeline, and used GPT-4 to create our own test cases based on learnings from existing secret scanning alerts in open source repositories.
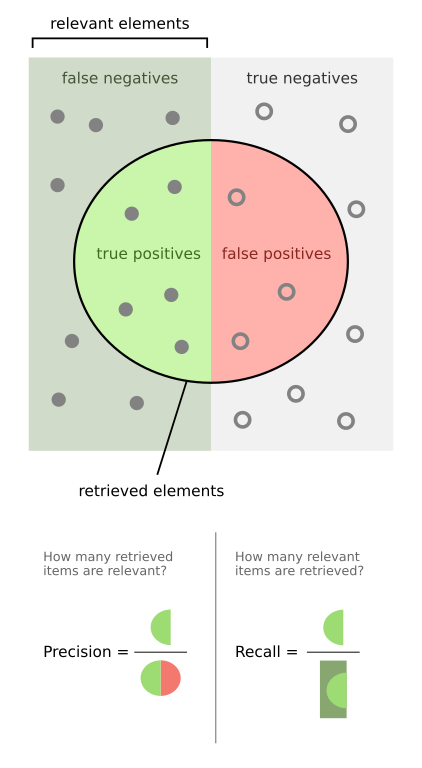
This improved offline evaluation and gave us the breadth needed to measure both precision and recall. Precision is the ability to find secrets more accurately, with concerns to the false positive rate, while recall is the ability to find secrets more reliably, with concerns to the false negative rate.
From here, we ran a series of experiments to evaluate detection quality:
More specifically, we started experimenting with a few different mechanisms to improve our detection with the LLM.
We tried voting (asking the model the same question many times), which allowed for more deterministic responses but had no material impact on our precision.
We also tried using a larger model (GPT-4) trained on a larger set of parameters as a confirming scanner, to validate the accuracy of candidates found by GPT-3.5-Turbo. This helped improve precision without reducing our recall, but was also more resource intensive.
We also tried a few different prompting strategies, such as Fill-in-the-Middle, Zero-Shot, and Chain-of-Thought. We ended up collaborating with our colleagues at Microsoft and used their MetaReflection technique, a novel offline reinforcement learning technique that allows experiential learnings from past trials to come up with a hybrid Chain of Thought (CoT) and few-shot prompt that improves precision with a small penalty in recall.
We ultimately ended up using a combination of all these techniques and moved Copilot secret scanning into public preview, opening it widely to all GitHub Secret Protection customers. This brings us to our next hurdle: scale.
Secret scanning not only scans incoming Git pushes, but also your entire Git history on all branches. With each new customer, the necessary resources increase linearly. Rather than simply expanding LLM capacity, we focused on striking the most effective balance between value and cost to ensure optimal performance and efficiency. Before tackling how we managed the resources, we tried to find ways to reduce resource usage itself by:
While some of these efforts proved fruitful, such as limiting the content we scanned, other efforts were less effective. For example, breaking down content into smaller pieces didn’t have much of an impact, while using a more powerful model did.
Ultimately, the most impactful change came from creating a workload-aware request management system that allowed us to maximize and equitably share LLM capacity against the variety of different workloads we run during scans.
In building the system, we noticed a fundamental problem that needed addressing in our capacity management: assigning specific rate limits to individual workloads (such as scanning incoming Git commits or scanning the full history) was suboptimal. As each workload was tied to specific traffic patterns—Git commits, for example, tend to correlate with working hours, while full history scanning correlates with discrete events like a security manager or administrator enabling the feature on a new organization—it was easy to land in a situation where an individual workload could run into rate limits within its operational context, leaving additional resources available elsewhere unused.
We drew significant inspiration from existing solutions in this space, such as Doorman, GitHub’s own Freno, and various other weighted, fair-priority, queue-related algorithms. We came up with an algorithm that allows us to set a range of limits for each workload, preventing the workload from completely overwhelming the LLM, while allowing it to tap into resources from other workloads going unused at the moment. This strategy was so effective at maximizing utilization that we ended up using it within Copilot Autofix and security campaigns as well.
Achieving confidence in detection quality was crucial for moving Copilot secret scanning to general availability. We implemented a mirror testing framework that ran our prompt and filtering changes against a subset of repositories that participated in our public preview. Rescanning these repositories with our latest improvements allowed us to assess the change in real alert volumes and false positive resolutions, without impacting users.
We found a huge drop in detections and false positives with very few missing real passwords. In some cases, we saw a 94% reduction in false positives across organizations! This before-and-after comparison indicated that all the different changes we made during private and public preview led to increased precision without sacrificing recall, and that we were ready to provide a reliable and efficient detection mechanism to all GitHub Secret Protection customers.
Copilot secret scanning is now detecting passwords on nearly 35% of all GitHub Secret Protection repositories. We’re continuing to monitor performance and apply lessons learned as we leverage the tooling we created along the way:
These learnings are also shared across Copilot Autofix, which continues to expand coverage for code scanning alerts and helps development teams remediate code scanning alerts quickly.
Since our general availability launch, enablement for Copilot secret scanning has been included in security configurations, allowing you to control which repositories are detecting secrets across your organizations or enterprise. We’re dedicated to continuous improvement through ongoing monitoring, mirror testing, and approach refinement based on customer feedback and detection trends. Copilot secret scanning serves as a critical component for robust application security and will evolve to meet the dynamic needs of our users.
Copilot secret scanning is a feature of GitHub Secret Protection, which offers enterprise-ready solutions for preventing accidental secret exposure in your repositories. GitHub Secret Protection is available to purchase starting April 1, 2025.
The post Finding leaked passwords with AI: How we built Copilot secret scanning appeared first on The GitHub Blog.
Post Syndicated from Stephen Fewer original https://blog.rapid7.com/2025/03/04/etr-multiple-zero-day-vulnerabilities-in-broadcom-vmware-esxi-and-other-products/

On Tuesday, March 4, 2025, Broadcom published a critical security advisory (VMSA-2025-0004) on 3 new zero-day vulnerabilities affecting multiple VMware products, including ESXi, Workstation, and Fusion. The most severe of the vulnerabilities is CVE-2025-22224, a critical vulnerability in ESXi and Workstation. Notably, these are not remotely exploitable vulnerabilities — they require an attacker to have existing privileged access on a VM that is running on an affected VMware hypervisor.
Broadcom has published an FAQ with additional information for VMware customers.
All 3 vulnerabilities were reported to Broadcom by Microsoft Threat Intelligence Center. Broadcom’s advisory indicates for all 3 CVEs that Broadcom “has information to suggest that exploitation has occurred in the wild.” Shortly after Broadcom published their advisory, the U.S. Cybersecurity and Infrastructure Security Agency (CISA) added all 3 CVEs to the Known Exploited Vulnerabilities (KEV) list.
Based on the information in the advisory, it appears that the 3 vulnerabilities can be chained together: “This is a situation where an attacker who has already compromised a virtual machine’s guest OS and gained privileged access (administrator or root) could move into the hypervisor itself.”
There is no known public exploit code for any of the CVEs at time of publication. Nevertheless, given that ESXi hypervisors are popular targets for both financially motivated and state-sponsored adversaries, Rapid7 recommends applying vendor-supplied fixes on an expedited basis.
The following products are vulnerable to CVE-2025-2224, CVE-2025-22225, and CVE-2025-2226:
The following products are vulnerable to CVE-2025-22224 and CVE-2025-22226:
The following product is vulnerable to CVE-2025-22226:
For the most complete information on affected and fixed versions, see Broadcom’s advisory and FAQ.
InsightVM and Nexpose customers will be able to assess their exposure to CVE-2025-22224, CVE-2025-22225, and CVE-2025-22226 on Broadcom VMware ESXi hypervisors, Fusion, and Workstation products with vulnerability checks expected to be available in today’s (Tuesday, March 4) content release.
Post Syndicated from LastWeekTonight original https://www.youtube.com/watch?v=hv4FmQzPh-0
Post Syndicated from corbet original https://lwn.net/Articles/1012947/
Version
136.0 of the Firefox browser has been released. Changes include a new
vertical tab layout, an automatic attempt to upgrade HTTP connections to
HTTPS, support for AMD GPUs on Linux, an Arm64 port for Linux, and more.
Post Syndicated from Анета Василева original https://www.toest.bg/nedorazumenieto-brutalistat/

Ще започна директно. Този филм е толкова сбъркан, че не заслужава дори статия, камо ли награди, но тъй като вече събра немалко (включително „Сребърен лъв“ във Венеция и няколко „Златен глобус“) и беше един от основните фаворити за „Оскар“ за най-добър филм, ето няколко причини да го подминете.
Разбира се, наясно съм, че практически всички архитекти вече са го гледали. В крайна сметка толкова рядко се появяват игрални филми за архитектура с главни герои архитекти. Аз лично го гледах през ноември, на една от двете му прожекции на „Киномания“. Салонът беше пълен с колеги, които после мълком си излязоха объркани. Надявах се филмът да остане там, из фестивалните епизодични прожекции, а не да шества из българските молове, при това не само в София. Но вижте какво правят агресивният пиар и няколко незаслужени награди.
Та ето само малко от всичко, което не е наред в този филм, а то показва и какво не е наред по принцип в разбирането на хората (и на Холивуд) що е то архитектура и какво правят архитектите.
Унгарски архитект модернист (Ейдриън Броуди), завършил „Баухаус“ и оцелял от Холокоста, емигрира в САЩ след края на Втората световна война, за да се сблъска с американската мечта. Сред перипетии, унижения, работа по строежи и лични драми той се опитва да завърши сградата на живота си в провинциална Пенсилвания – нещо като амбициозно читалище с театър, училище и параклис в едно, в памет на майката на местния милионер Лий ван Бюрен (Гай Пиърс).
Такъв архитект реално не е съществувал, но историята е комбинация от много до болка познати. Обзалагам се, че сценарият е писан с изкуствен интелект, който е захранен с ключовите думи „архитектура“, „драма“, „нещо яко и популярно“ и е насипал
Първо имаме „Баухаус“, защото е известна трагичната съдба на най-влиятелната немска архитектурно-дизайнерска школа, създала модерното дизайн лице на ХХ в. и затворена от Хитлер през 1933 г. Нашият трагичен герой Ласло Тот е завършил „Баухаус“, разбира се, и става най-известният унгарски архитект модернист преди войната – очевидно на крехка възраст. Той е евреин – както немалко от завършилите и преподавалите в „Баухаус“. Макар че той емигрира не от нацистка Германия (като – познахте – архитектите от „Баухаус“), а от вече социалистическа Унгария през 1947 г., след като е оцелял в концентрационен лагер.
Исторически факт е, че идването на власт на Хитлер в Германия и окончателното затваряне на училището принуждават голяма част от либерално настроените и неудобни за нацистите преподаватели и студенти в „Баухаус“ да напуснат страната. Така идеите на немската школа и европейския модернизъм стигат до много държави, включително САЩ.
Тук вече линията „Баухаус“ се поизчерпва. Защото, факт – всички емигранти от „Баухаус“ в Щатите са радушно приети и оформят американската архитектурна култура за десетилетия. Те преподават в престижни университети, проектират важни сгради и създават масовия глобален модернизъм – или т.нар. интернационален стил. Нашият герой обаче се оказва неприет модернист в следвоенна Филаделфия, където модернизъм се строи още от 30-те години на ХХ в. и където архитектурните студиа с удоволствие биха взели най-талантливия унгарски модернист емигрант. Уви. Сценарият тук завива в друга, неочаквано драматична посока. Ласло не проектира сгради. Той прави мебели, работи по строежи, после като чертожник, но си остава беден и неприет. Докато не среща своя богат меценат.
После имаме Аза. Големият архитект визионер и индивидуалист, който мачка всичко по пътя си, убеден в собствената си правота. Тук безсъмнено „Бруталистът“ смело заема от един друг ужасен филм с главен герой архитект – „Изворът“ (1949), по едноименния роман на Айн Ранд. Хауърд Роурк отново е неразбран архитект модернист, който отхвърля смело поръчки за небостъргачи, изнасилва жени и взривява жилищни комплекси. Но поне е изигран от Гари Купър.
И накрая имаме Венецианското биенале – най-влиятелното събитие в архитектурния свят, в който архитектите имат свое специално биенале от 1980 г. до днес, на всеки две години. Именно там и именно през 1980 г. нашият фикционален архитектурен модернист Ласло Тот получава първото си публично признание със специална изложба в негова чест. Само че (да се върнем към фактите) Първото архитектурно биенале с куратор Паоло Портогези е на тема La presenza del passato („Присъствието на миналото“) и до голяма степен теоретизира и легитимира архитектурния постмодернизъм на 80-те – онзи игрив колажен дух на епохата. На подобно събитие място за изложба на стар модернист с поведение на герой, тръгнал на важна мисия, не би могло да има.
Сега за брутализма.
Дори плакатът му е копие на плаката на Йоост Шмит за първата официална публична изложба на „Баухаус“ през 1923 г. Отново напомням за всички, които не са архитектурни историци: „Баухаус“ не е брутализъм. (Защо сценаристът и режисьор Брейди Корбет и неговата сътрудничка Мона Фастволд очевидно не са се консултирали с архитектурни историци, е отделен въпрос.)


Плакатите на „Бруталистът“ и Йоост Шмит
Никой във филма не говори за брутализма директно, разбира се (освен в заглавието). Нашият герой работи във време, когато брутализъм все още няма, а влиянието на Марсилската единица на Льо Корбюзие не е достигнало до Щатите. Брутализмът започва първо в Европа и Великобритания като реакция именно срещу интернационалния модернизъм на „Баухаус“ и се разпространява масово през 60-те и 70-те години в цял свят.
Добре, ще кажете, Ласло просто е изпреварил времето си, той е гений. Има брутална съдба и работи с любимия материал на бруталистите – видимия бетон.
Да, брутализмът е опит за формулиране на една нова модерност, но последователите му издигат в кумир етиката, моралната проблематика, с която трябва да бъде наситена архитектурата. Въстават срещу самоцелната естетика. Привърженици са на „честните материали“, които оформят образа на сградата с реалните си, неестетизирани допълнително характеристики. Но последното нещо, от което се интересува Ласло Тот, са социалните проблеми. Той е творец с главно Т.
Обаче брутализмът е секси. И е сред най-устойчивите архитектурни клишета. Всеки аматьор с претенции да се интересува от архитектура ги познава, притежава по някоя от чудесните тежки книги с бетонни сгради, излезли през последните години, и знае, че това е любимото течение, което всички „обикновени хора“ обичат да мразят, а всички архитекти обожават. Е, и помощникът – изкуствен интелект, на нашия Брейди Корбет очевидно знае същото.
Но продължавам.
Как е възможно при толкова много секси бетонни сгради в цял свят да извикаш продуктовия дизайнер на филма American Hustle да ти направи макет на магнум опуса на Ласло Тот и да снимаш тази най-велика сграда на нашия герой сред най-неубедителната строителна площадка, която съм виждала? Тази сграда освен това няма нищо общо с великите бетонни чудовища на епохата, а е микс между монументализма на Луис Кан и крематориум и най-вероятно е проектирана с програмата за изкуствен интелект Midjourney.
Вместо да снимаш реална архитектура в реална среда. Ама попитайте всички автори на рекламни автомобилни клипове, фотографи на модни сесии и режисьори на филми за Джеймс Бонд какъв перфектен фон е истинският бетон на истинските сгради на брутализма. Какви са тези неубедителни колонади като от шпаклован гипсокартон? Какви са тези абсурдни колони като в подземните цистерни на Истанбул?


Кадри от „Бруталистът“
И накрая – тема, която аз, която не съм филмов критик, не би следвало да коментирам. Но хайде, след като филмовите критици спокойно коментират и архитектурата в този филм, нека да напиша нещо и за „филмовото майсторство“.
От филм за архитектура очаквах по-добра кинематография и със сигурност – декори. Да, признавам, кадрите с пристигането в Ню Йорк бяха впечатляващи (и отново повлияни от диагоналите на „Баухаус“, руските конструктивисти и техните филми и плакати). Като цяло, в първата част на този съсипващо дълъг филм действително имаше атмосфера и емоция. Може би защото още не беше дошла архитектурата.
Но какво се случва с героите след това? Ами те остават недоразвити и неубедителни.
Как е възможно за толкова време ние така и да не разберем какво движи главния герой архитект – отвъд кахърния му вид и насилена наркозависимост. Този човек нито веднъж не заговори за архитектура, защо и как прави нещата. Той говори за бетона, да, колко красота има в неговата суровост, но така и не разбрахме защо иска да прави обществен център като концлагер и църква като крематориум, освен защото е с травма (за която също не говори, както и останалите герои от филма мълчат за своите си травми).
Има обаче нещо добро в този филм. И то се случва в Италия.
Кариерите в Карара са впечатляващ декор на най-важното послание на филма. Че всеки творец е всъщност слуга и придворен шут на онзи, който поръчва и плаща за неговото изкуство. Който може да му поръча библиотека, после да го изгони, после да го върне, за да проектира сградата на живота си, и да го подслони като средновековен феодал на масата си, за да го забавлява с артистични разговори на вечеря. И накрая може да прави каквото си иска с него – включително да го изнасили в мраморните кариери на Карара.
Post Syndicated from corbet original https://lwn.net/Articles/1012916/
Version 6.10 of the Incus container-management system has been released.
New features include better Let’s Encrypt support, API-wide filtering,
IOMMU support in virtual machines, and more. See this
announcement for details.
Post Syndicated from corbet original https://lwn.net/Articles/1012915/
Security updates have been issued by AlmaLinux (kernel), Mageia (x11-server), Red Hat (emacs and webkit2gtk3), SUSE (ffmpeg-7, govulncheck-vulndb, kernel, and skopeo), and Ubuntu (cmark-gfm, erlang, krb5, linux-gcp-6.8, linux-raspi, linux-kvm, lucene-solr, postgresql-12, postgresql-14, postgresql-16, raptor2, spip, tomcat7, and wpa).
Post Syndicated from Rapid7 original https://blog.rapid7.com/2025/03/04/building-a-high-performance-team-in-india-meet-swami-nathan/

Swami Nathan has a track record of building new teams from scratch for global companies. Through his experiences, he’s identified what it takes to build not just any team – but a high performing team that drives innovation and growth for business while propelling career trajectories for those who take the ride. His experience in breaking down silos in tech, driving optimization, and increasing developer & business agility make him the perfect fit to lead the Rapid7 team in Pune, India.
“In today’s world, innovation in areas like Artificial Intelligence and Machine Learning are fundamentally changing the technology landscape at a rapid pace. We need to think about ways to become more nimble in our products, our engineering, and in our ability to listen to our customers so we can stay ahead of the curve. At Rapid7, we want to be on the forefront of this evolution, so we can continue to deliver value to our customers and build a more secure digital future.”
Rapid7’s culture of collaboration, continuous improvement, and customer centricity provides the ideal environment for building exceptional teams. This environment creates unprecedented opportunities for those seeking to advance their careers and make meaningful contributions through their work.
“When you join a company, you are automatically part of a team. Becoming a high performing team requires a lot of work on the ground, and it’s a transformational journey every colleague must participate in. Along the way, there is a unique opportunity for every person to uplevel their skills and their profile. The experiences and unique challenges you are going to have, with a company that has the right culture and support systems in place, in an industry where there is an incredible amount of innovation, create an opportunity that not many people have access to, in their careers.”
Swami shares a few key characteristics that stand out among high performing teams.
Some teams have an imaginary boundary when it comes to what they can or cannot do. On a high performing team, there is no boundary to what is possible. Instead, they will question limitations and ask, ‘why not?’
As the team begins to grow, they will not accept a B or C level player to join their team. Instead of wanting to be the smartest person in the room, high performing team members actively seek out colleagues they can learn from and who will contribute to the high level of performance.
“There are a few natural side effects when these things happen. First, you improve talent density across your entire company. Green employees are ramping quickly and learning from experts. Seasoned employees are simultaneously coaching those around them, while continuing to uplevel themselves. Second, you drive engagement and collaboration. High performing teams are inspired by the people they work with. They get up in the morning and are motivated for the day ahead because they genuinely look forward to coming to the office and collaborating in person.”
As Rapid7 builds our team, there are key qualities they look for in candidates. For engineers and developers specifically, Swami shares the characteristics he looks for.
Building a product requires a variety of teams who are experts at different phases of the process. Instead of caring solely about their own domain, it’s important for engineers to have a sense of shared ownership over what they are delivering to customers. Great developers may not know everything about QA and testing, but they care enough about what they deliver to understand their role in building a quality product.
The ability to learn and take feedback is essential, especially for those who are early in their career and have not yet developed their technical skills. Being brave enough to ask questions and challenge the status quo will lay a foundation upon which they can build their technical skills.
Having the ability to influence is oftentimes associated with hierarchy or title. Swami challenges this belief and shares that if you have a point of view, are well researched, and can speak intelligently to your stakeholders, these are the factors that determine impact, regardless of your title. A bias for action means that you are looking to take the next step. You are proactive in moving things forward, breaking audacious goals into smaller milestones and action items. If someone can possess these two abilities, Swami knows they are someone who is capable of driving incredible impact in their team, and across the business.
Swami joins as the first official full time employee of Rapid7 in India. So what was it that inspired him to take this new role? He credits the experience he has with company executives, and a shared system of beliefs and values with his decision to take the helm in Pune.
“As I was talking with the CEO, and our executive teams, the topics we spoke about did not feel like a traditional interview. Instead, we talked about who we each were as people, and what Rapid7 stands for as a company. As those conversations continued, I was pulled into the culture very naturally. Having a new office in India be strategically tied to the mission and purpose of the business, and how it will help drive such a positive impact for our customers was something that was really inspiring for me.”
Beyond the executive team, Swami shares a common thread that speaks to the company culture and values in action. “My experiences with the executive team and with other leaders across different business areas are all very consistent in terms of how they envision the future of our business. People willingly share information and historical context on their area of expertise, which gives me valuable insights into what we are working to achieve, and what we need as we build our team. It’s not easy to build this kind of consistency in a global organization, so that has continued to impress me throughout my journey here.”
“What we are looking to do at Rapid7 India is impressive. We are planning for rapid growth this year (which by the way, is less than 10 months!). We don’t want to just build an office in Pune to grow our company headcount – we’re focused on growing high quality talent in a way that enables us to have a positive impact on customers, and deliver to critical business needs. This is a transformational journey that you won’t have anywhere else. We’re thrilled to offer the chance to be one of the first team members in India, contributing to a high performing team, experiencing tremendous personal growth, and delivering critical products and services to our customers.”
Learn more about working at Rapid7 in Pune here.
Post Syndicated from Bruce Schneier original https://www.schneier.com/blog/archives/2025/03/trojaned-ai-tool-leads-to-disney-hack.html
This is a sad story of someone who downloaded a Trojaned AI tool that resulted in hackers taking over his computer and, ultimately, costing him his job.
Post Syndicated from Michael Kammer original https://blog.zabbix.com/building-a-monitoring-dashboard-which-metrics-to-track/29777/
A well-designed monitoring dashboard is the key to helping users process, interact with, and analyze data. Done right, it allows key decision-makers to track metrics and gain insights in an organized, easy-to-read format, while giving technical teams complete visibility into IT performance at a single glance. Done wrong, it creates information overload, with too much of everything – too many graphs, colors, widgets, and other sources of information, making it at best deceptive and at worst completely useless.
Obviously, there’s no dashboard big enough to display every possible metric for every possible stakeholder, which is why the key to making a well-organized, informative dashboard that doesn’t confuse the viewer is knowing which metrics to track. By sticking to the absolute “must haves,” you’ll make sure that users can find mission-critical information first. But how should you choose which metrics to track? We’ve put our hard-won dashboard expertise to work and identified four key metric groups that no dashboard should be considered complete without.
System uptime and availability. Availability is one of the most important metrics you can use to determine your network’s performance, because it’s a metric that everyone can see the effects of immediately. For a business, it’s critical when it comes to making sure that the services provided to users are consistently available.
Overall resource utilization (CPU, memory, disk storage, etc.). Think of tracking resource utilization like keeping tabs on your phone’s battery life. You need to track CPU, memory, disk storage, and network usage to keep everything running smoothly. Keeping an eye on those metrics will help you fix small issues before they turn into gigantic problems.
Top critical issues or alerts. Speaking of problems, they can and will happen – and when they do, you’ll naturally want to know about them as soon as possible. An alert can be as simple as a notification of a system update, or it can draw attention to an unusual spike in errors. It could also call attention to a major emergency that demands immediate attention. Either way, no effective dashboard is complete without them.
SLA compliance status. If you’re running a business, monitoring SLA compliance status lets you see service availability and performance, which in turn guarantee customer satisfaction. It allows for quick detection of issues, making proactive management and resolution possible before customers feel any impact.
Server performance (CPU, RAM, disk I/O). Tracking the response time, central processing unit (CPU) utilization, memory consumption, and network bandwidth of a server helps guarantee a functional user experience. It involves keeping an eye on CPU and RAM utilization, disk I/O (input and output operations involving a physical disk), plus a variety of other sub-metrics.
Application health. Monitoring application health involves collecting, analyzing, and interpreting data about an application’s performance, availability, and behavior. It’s mission-critical because it can help you detect and troubleshoot problems, optimize resource utilization, and provide the application’s users with the quality experience they expect.
Storage usage and trends. Keeping track of storage usage on your dashboard gives you a real-time view of storage metrics as well as predictive analytics (useful for capacity planning) and proactive issue detection, across on-premise and cloud storage environments. Like so many other monitored metrics, its purpose is to maintain optimal storage performance while preventing potential issues before they impact any business operations.
Database performance metrics. Basically, database monitoring is how you measure what you want to improve. It’s what you do before you start performance tuning. Keeping track of your database on your dashboard makes this possible by collecting performance metrics, so that you’re always aware of whether your database can fully support your applications and respond quickly to queries.
Bandwidth utilization and traffic patterns. Bandwidth refers to the maximum data transmission rate on a network at a particular time. Having this metric on your dashboard will let you easily track the amount of bandwidth your network is using and make you immediately aware if you run over the bandwidth threshold.
Latency and packet loss. Latency, or network delay, is a network performance metric that measures the amount of time it takes to transfer data from one destination to another. Consistent delays or unusual spikes in delay time usually mean that you have a major network performance issue. Tracking latency and packet loss on your dashboard will let you know if data transfers are taking too long, while also helping you make sure that any lost data packets get to their destinations.
Interface status and error rates. A network interface can be either networking hardware or a software interface. Monitoring them on your dashboard lets you see each and every network device, and tracking their performance is important when it comes time to identify the root causes of poor performance and network bottlenecks.
Firewall and VPN tunnel status. Monitoring the status of Firewalls and VPN tunnels is important because (among other things) it keeps you aware of whether your VPN tunnel interface is up and available for passing traffic, and whether the destination IP address being monitored is reachable. At the same time, you’ll also have access to real-time information about how your firewall is working, which will keep you aware of any security holes or incorrect settings before they become major problems.
Unauthorized access attempts. Unauthorized access is a big risk to businesses, jeopardizing sensitive data and disrupting operations. You can track attempts by unauthorized users to gain access to any website, server, device, or app by monitoring user activity on your dashboard. This data can also be labeled and sorted so that you can easily interpret it at a glance.
Endpoint security status (AV, patching). Endpoints are basically any devices that connect to networks, including laptops, mobile phones, and IoT devices. The more of them you have, the greater your chances of data loss and cyber threat entry. Monitoring the critical junctures of endpoints on your dashboard will help you identify and prevent threats while making sure that you have quick response measures in place to protect your data and systems.
Compliance and audit logs. Compliance and audit logs are there to make sure errors are noticed and fixed, keep you compliant with regulatory requirements, improve business security, and detect fraud. Monitor them on your dashboard, and you’ll have real-time visibility into your compliance posture as well as immediate alerts when a potential violation is detected.
Active security alerts or anomalies. Continuously keeping an eye on your systems and network lets you detect threats (anything from malware to abnormal activities and unauthorized access) before they escalate and cause real damage. In turn, this helps you maintain user trust, avoid downtime, and comply with data security regulations.
These metrics should give any dashboard a solid foundation that can be easily customized to meet specific business or operational goals.
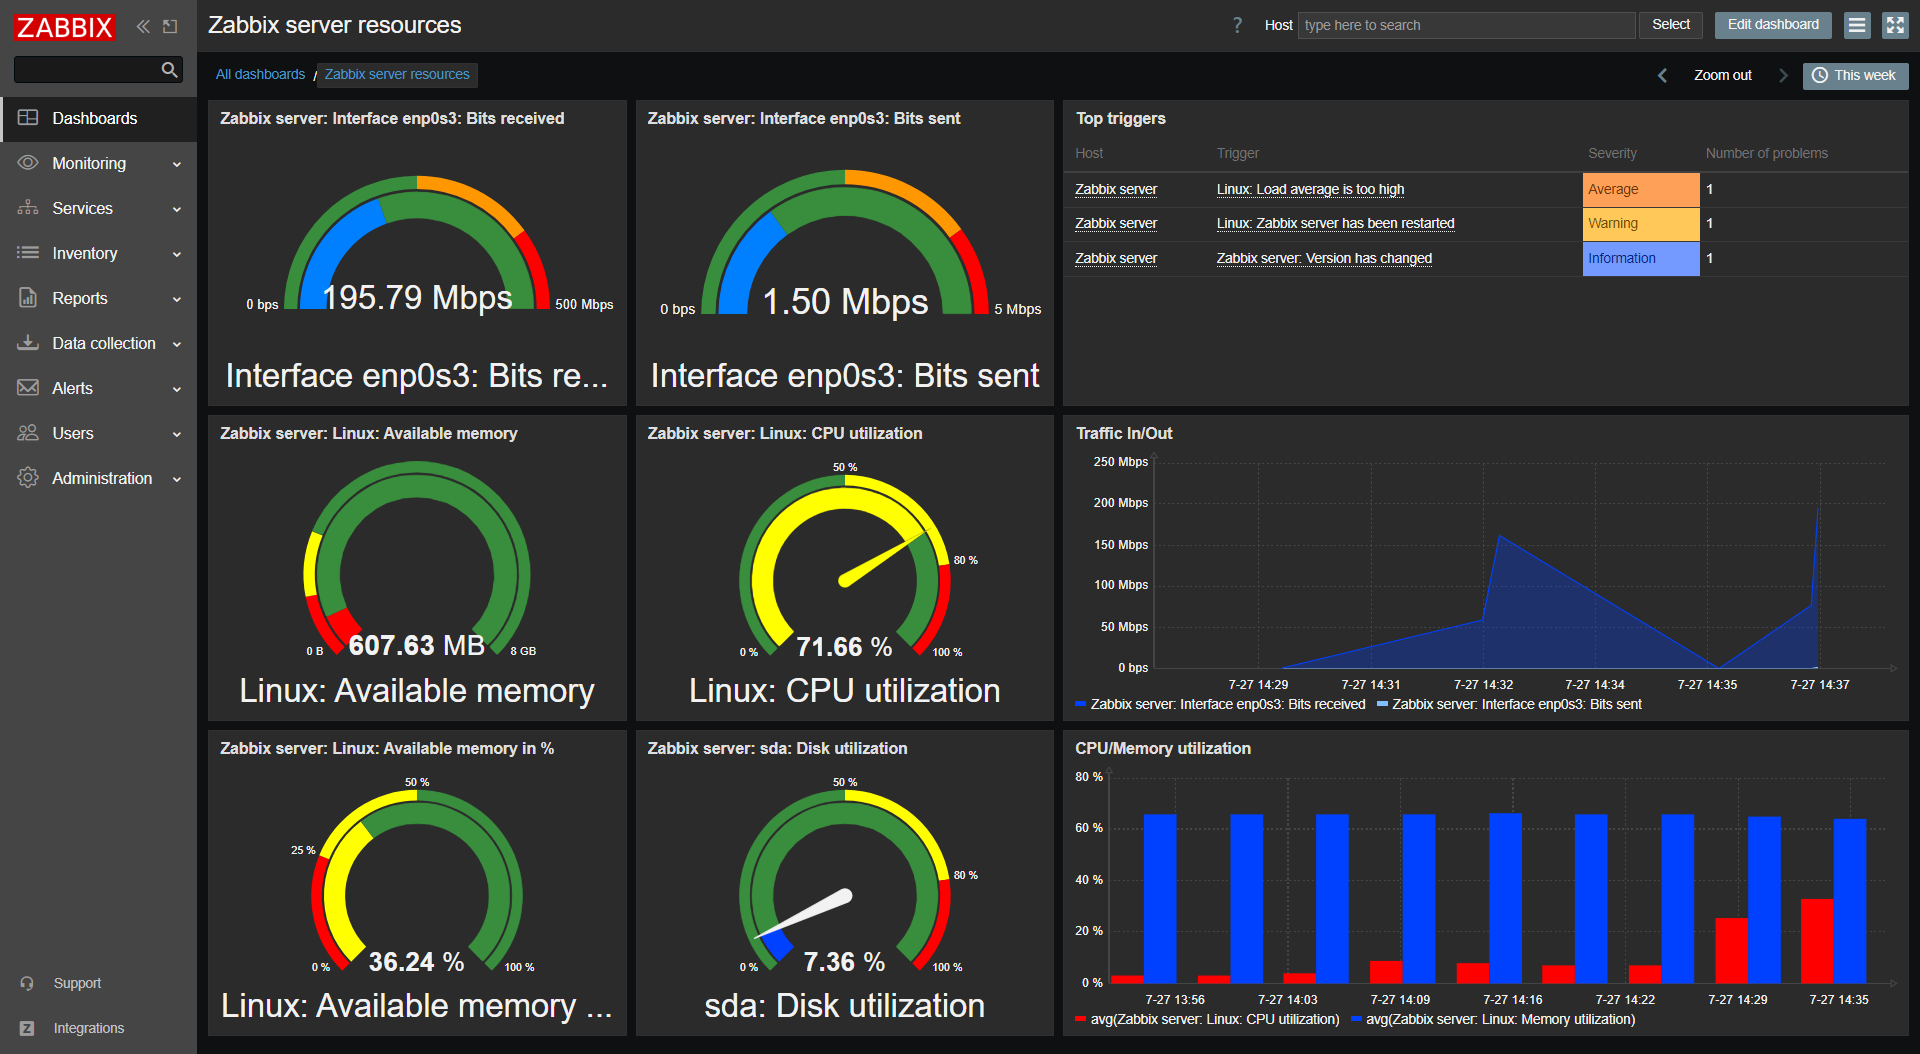
One of Zabbix’s most important features has always been our easily customizable dashboards, which allow users to see and analyze even the most complex monitoring data at a single glance. When it’s time to keep tabs on the essential metrics we identified above, Zabbix dashboards allow anyone (or any infrastructure team) to efficiently monitor network performance, manage resource usage, and guarantee device/application availability.
Zabbix’s graphing and visualization features make it easy to see historical trends and make comparisons. You can choose whatever visualization format is best for a particular set of data, including line graphs, bar charts, pie charts, gauges, and more. Not only that, Zabbix dashboard widgets can communicate with each other, serve as data sources for other widgets, and dynamically update the information they display based on the data source.
To learn more about the flexibility of Zabbix dashboards and see how they can help you track just about any metric imaginable, contact us.
The post Building a Monitoring Dashboard: Which Metrics to Track? appeared first on Zabbix Blog.
Post Syndicated from The Atlantic original https://www.youtube.com/watch?v=VLKqsUpp8Lo
Post Syndicated from Explosm.net original https://explosm.net/comics/nice-jorts
New Cyanide and Happiness Comic