Post Syndicated from The Atlantic original https://www.youtube.com/shorts/1w98fI6yP4o
Production-Ready Autonomous Incident Resolution with AWS DevOps Agent (now GA) and Datadog MCP Server
Post Syndicated from Nina Chen original https://aws.amazon.com/blogs/devops/production-ready-autonomous-incident-resolution-with-aws-devops-agent-now-ga-and-datadog-mcp-server/
This post was co-written with Bharadwaj Tanikella (AI/ML Product Engineering Leader) and Mohammad Jama (Product Marketing Manager) from Datadog.
In December 2025, we showed how AWS DevOps Agent and Datadog MCP Server could work together to autonomously correlate monitoring data with the infrastructure deployed and configured on AWS to resolve incidents in minutes instead of hours. Since then, Datadog MCP Server has reached general availability as the standard way for AI agents to access Datadog’s monitoring platform. Today, AWS DevOps Agent is generally available, giving teams a production-ready path to autonomous incident resolution across AWS, multicloud and on-premises environments.
What’s New: From Preview to GA
As engineering teams adopt AI-powered tools and build services that leverage AI agents, they want to extend their AI capabilities to incorporate familiar observability data and workflows. AI agents, however, often struggle with traditional API endpoints, causing them to miss the very context they need to resolve incidents effectively. Datadog MCP Server solves this by acting as a bridge between your observability data in Datadog and any AI agent that supports the Model Context Protocol (MCP). Now generally available, the MCP Server ingests prompts from users and AI agents and maps them to the corresponding Datadog resources and data. Under the hood, it handles authentication, HTTP request routing, endpoint selection, and response formatting so that agents receive highly relevant context without the brittleness of direct API calls. It supports modular toolsets so you can connect only the capabilities you need, from core observability data (logs, metrics, traces, dashboards, monitors, incidents) to specialized domains like APM trace analysis, security scanning, database monitoring, and CI/CD pipeline visibility.
Even with reliable access to observability data, incident response remains a manual, reactive process. On-call engineers must piece together the root cause of the incident from multiple data sources, draft mitigation plans, coordinate across teams, and then repeat the cycle when similar issues recur. This reactive approach does not scale as applications grow more complex and distributed.
AWS DevOps Agent changes this by introducing autonomous, always-on incident triage and investigation to your operations. AWS DevOps Agent is your always-available operations teammate that resolves and proactively prevents incidents, optimizes application reliability and performance, and handles on-demand SRE (Site Reliability Engineer) tasks across AWS, multicloud, and on-prem environments. It learns your resources and their relationships, correlates telemetry, code, and deployment data across your environment, and drives systematic improvements that prevent future incidents. Now, this also has several new capabilities that were not available during preview. It coordinates incident response automatically through channels like Slack, PagerDuty, and ServiceNow, keeping the right people informed without manual effort. It also delivers proactive prevention recommendations that address root causes before they lead to repeat incidents. In addition, DevOps Agent now supports multicloud and on-premises environments, extending its reach beyond AWS-only workloads to meet teams wherever their infrastructure runs.
With its built-in Datadog MCP Server integration, AWS DevOps Agent can pull the right Datadog context during an investigation, such as searching error logs, analyzing span-level latency, and reviewing recent deployment events. Together, these new features give engineering teams a fully integrated, production-ready workflow for autonomous incident resolution across AWS and Datadog.
Setting Up and Using AWS DevOps Agent with Datadog
In this section, we will guide you through the steps required to enable Datadog MCP Server in your AWS DevOps Agent account and configure it for incident resolution.
Pre-requisites
For this walkthrough, you should have access to and understanding of the following:
- An AWS account
- Agent Space role – for basic service operations
- Agent Space web app role – for using the Agent Space web app functionality
- (Optional) Secondary source account roles if monitoring multiple AWS accounts. Refer to the DevOps Agent user guide for the details on setting up these roles.
- A Datadog account
- Access to Datadog MCP Server
Setting up Datadog in the AWS DevOps Agent Console
- Start in the AWS DevOps Agent console by connecting your Datadog account.
- Navigate to Capability Providers, select the Datadog integration panel and click Register button.
- Enter Server Name, Endpoint URL, an optional Description, and click the Next button.
- AWS DevOps Agent validates the connection and displays a confirmation message.
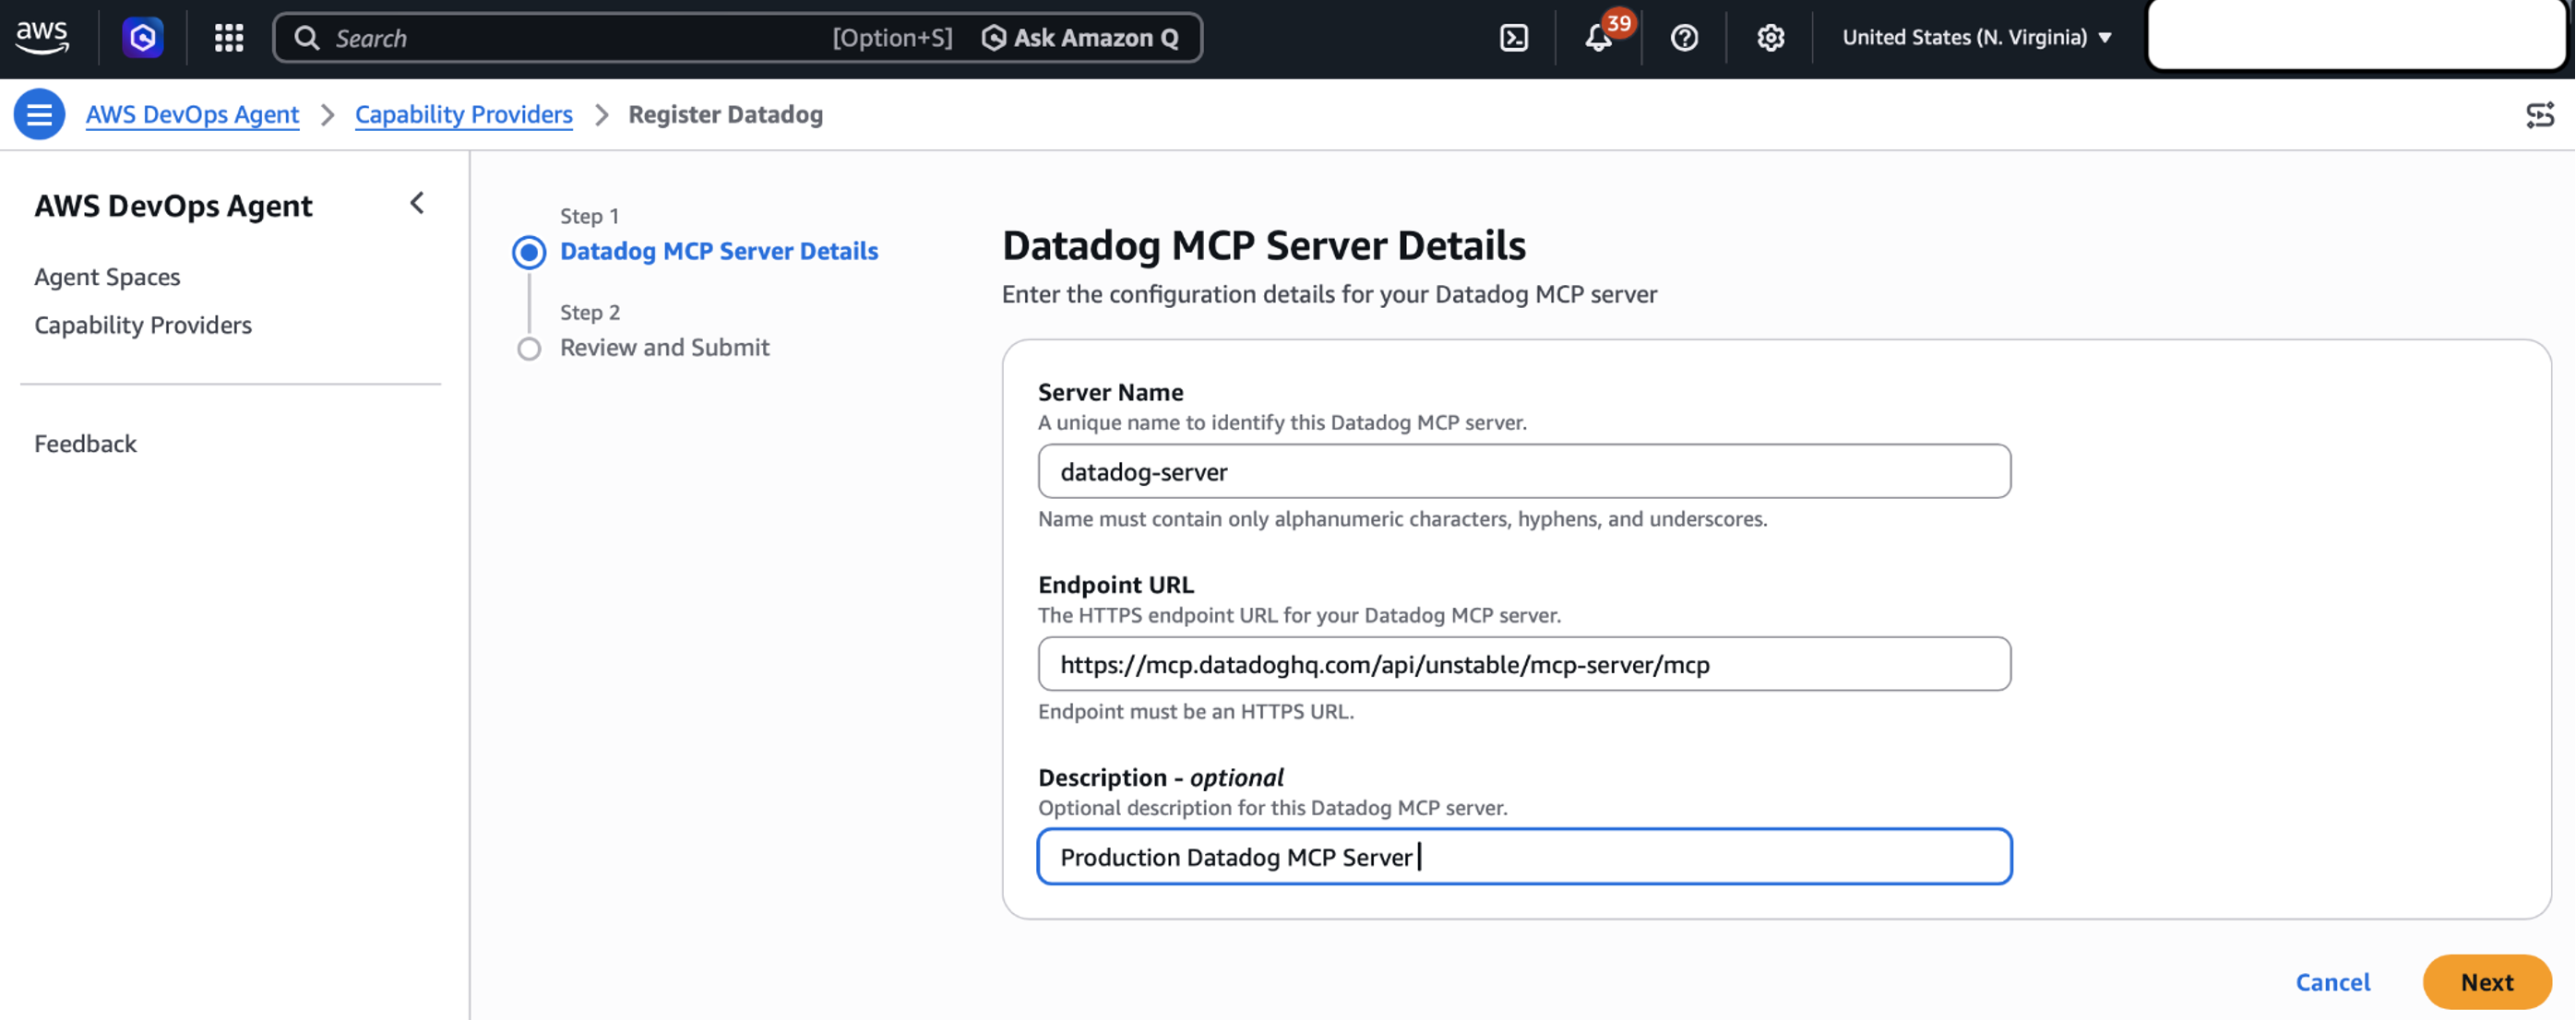
Figure 1: Setting up Datadog MCP Server in AWS DevOps Agent Console
Create an AWS DevOps Agent Space
Create an Agent Space in your primary AWS account to serve as the operational hub for incident investigations.
- Open the AWS DevOps Agent console in us-east-1.
- Choose Create Agent Space and provide a meaningful name and description.
- Configure the required IAM role that grants AWS DevOps Agent access to your AWS resources. You can use the automated role creation process or create the role manually.
- After your Agent Space is ready, add the Datadog MCP Server as a telemetry source to enable comprehensive incident investigation.
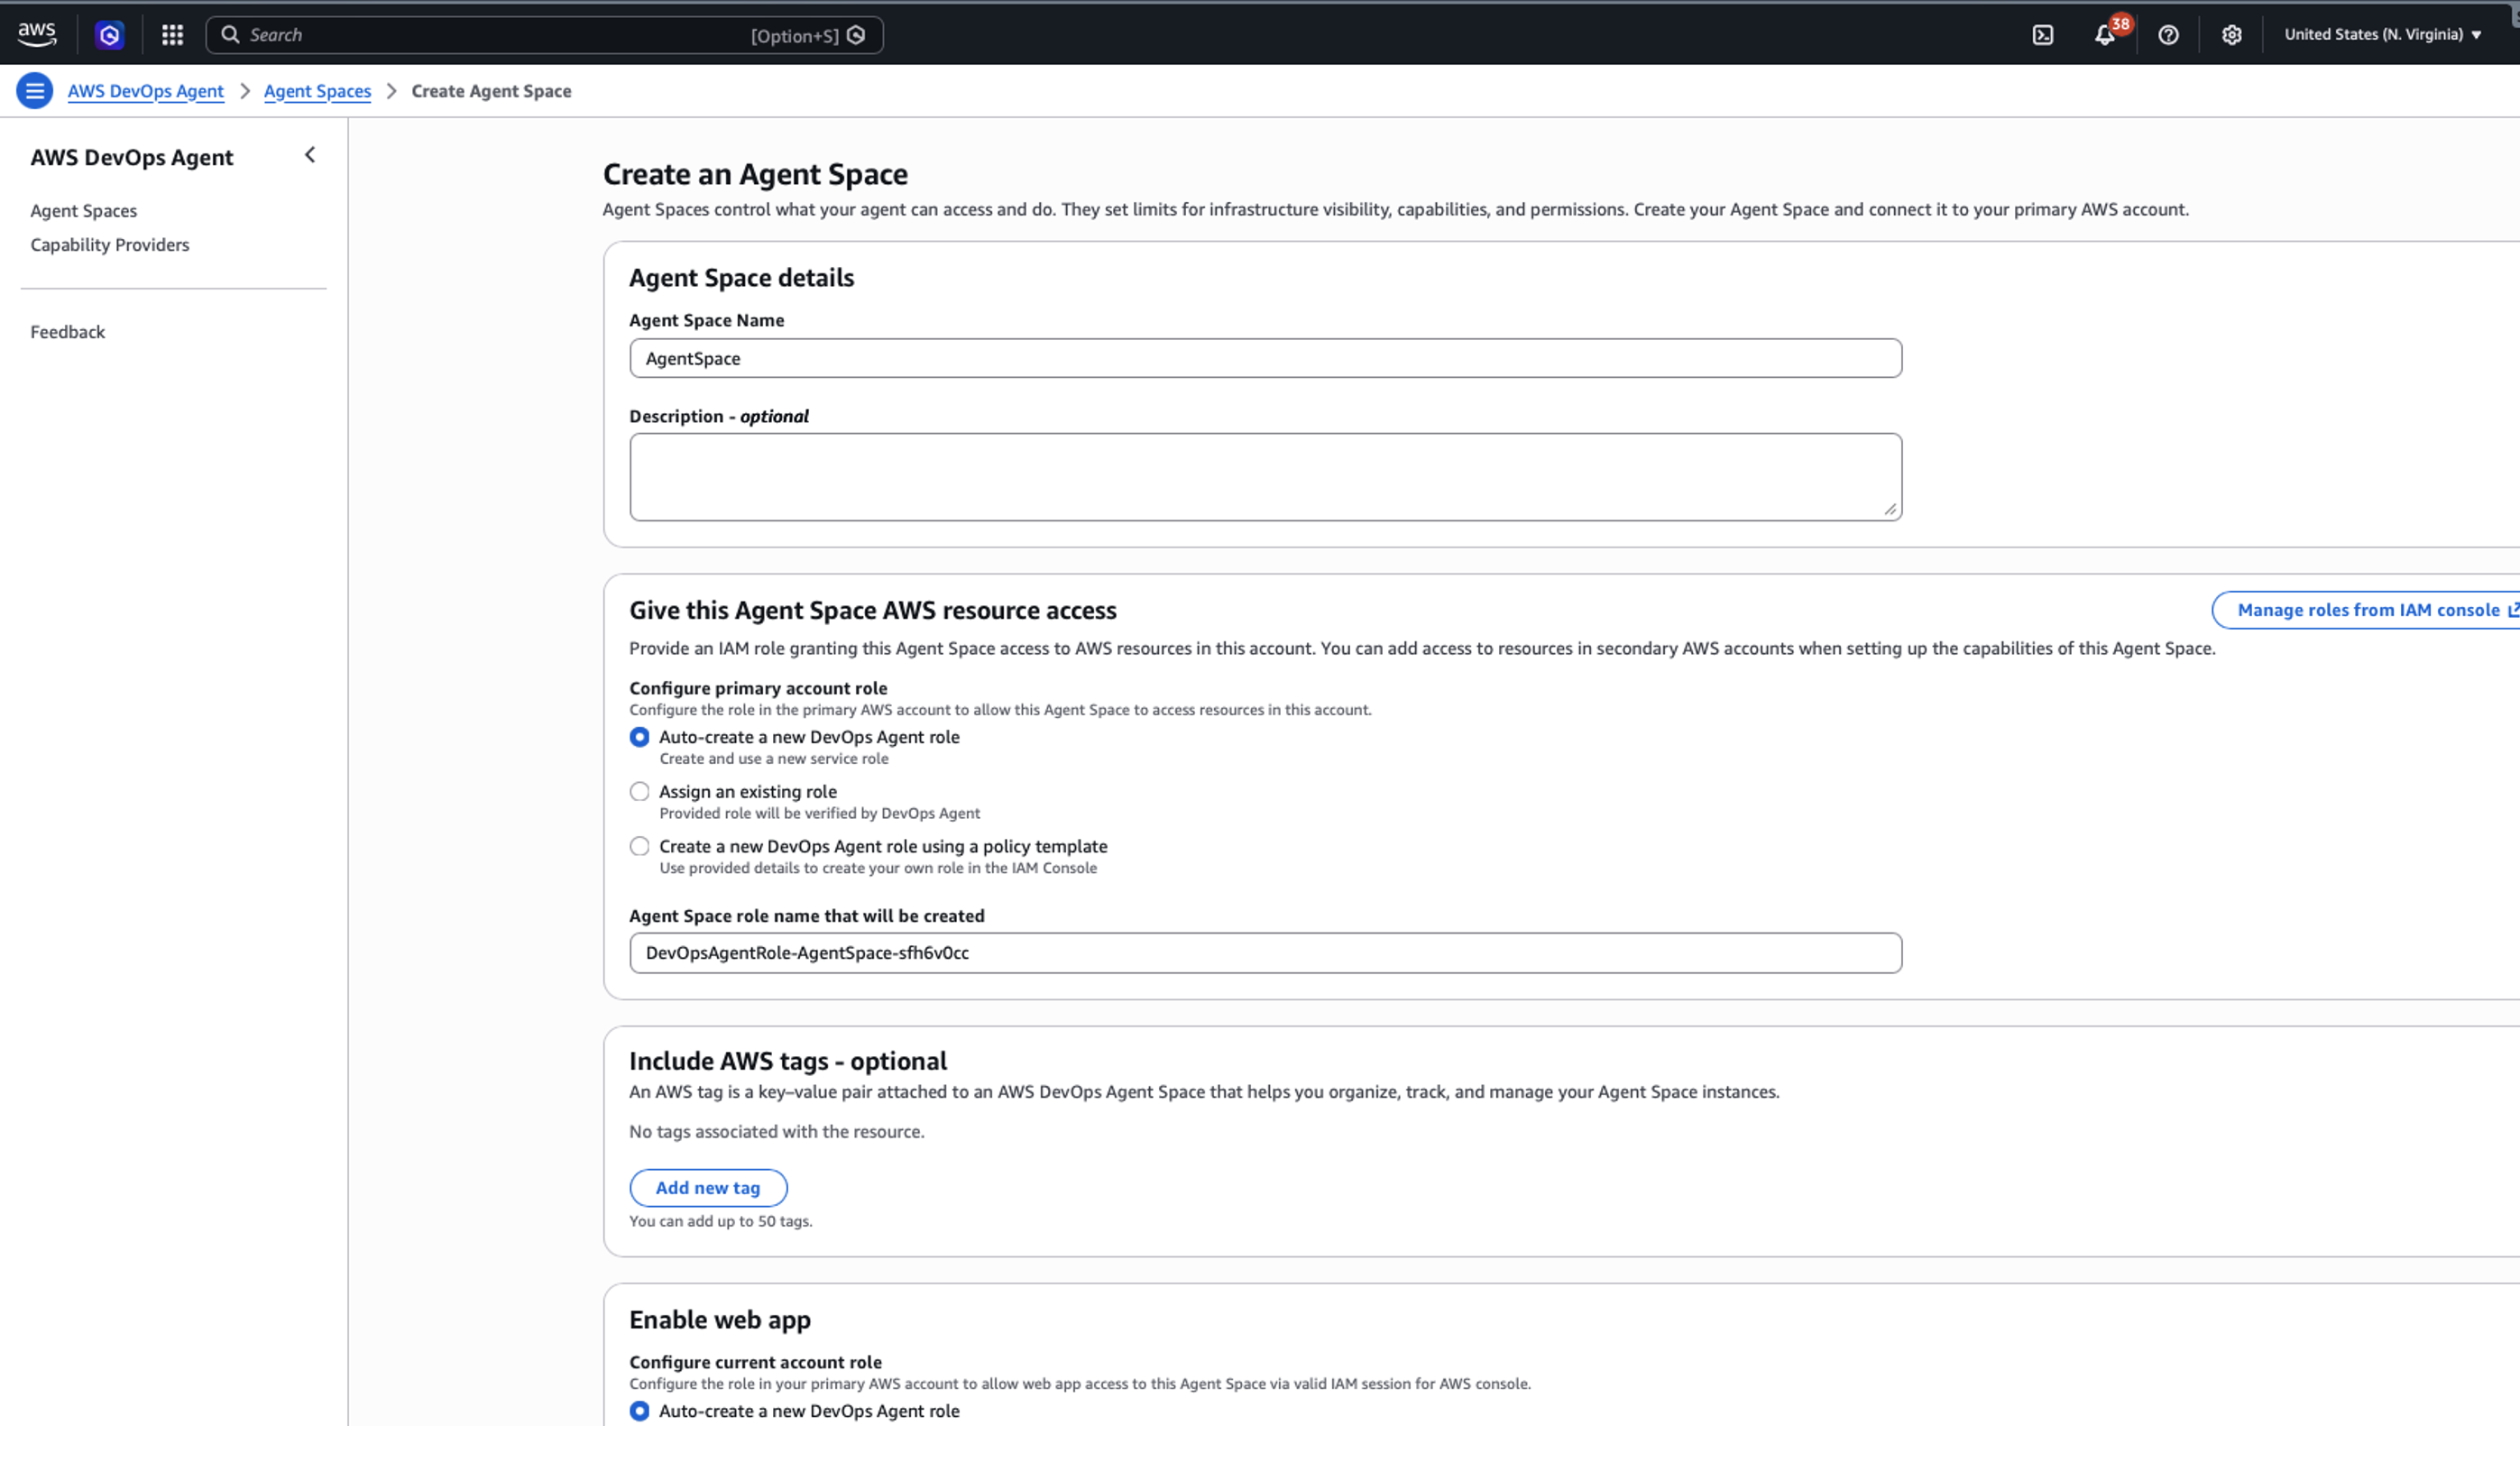
Figure 2: Creating an AWS DevOps Agent in Agent Space
Real-World Example: Resolving Errors
Let’s walk through how AWS DevOps Agent and Datadog work together to resolve a production incident. In this scenario, Datadog monitors detect a spike in Amazon API Gateway 5XX errors affecting downstream services.
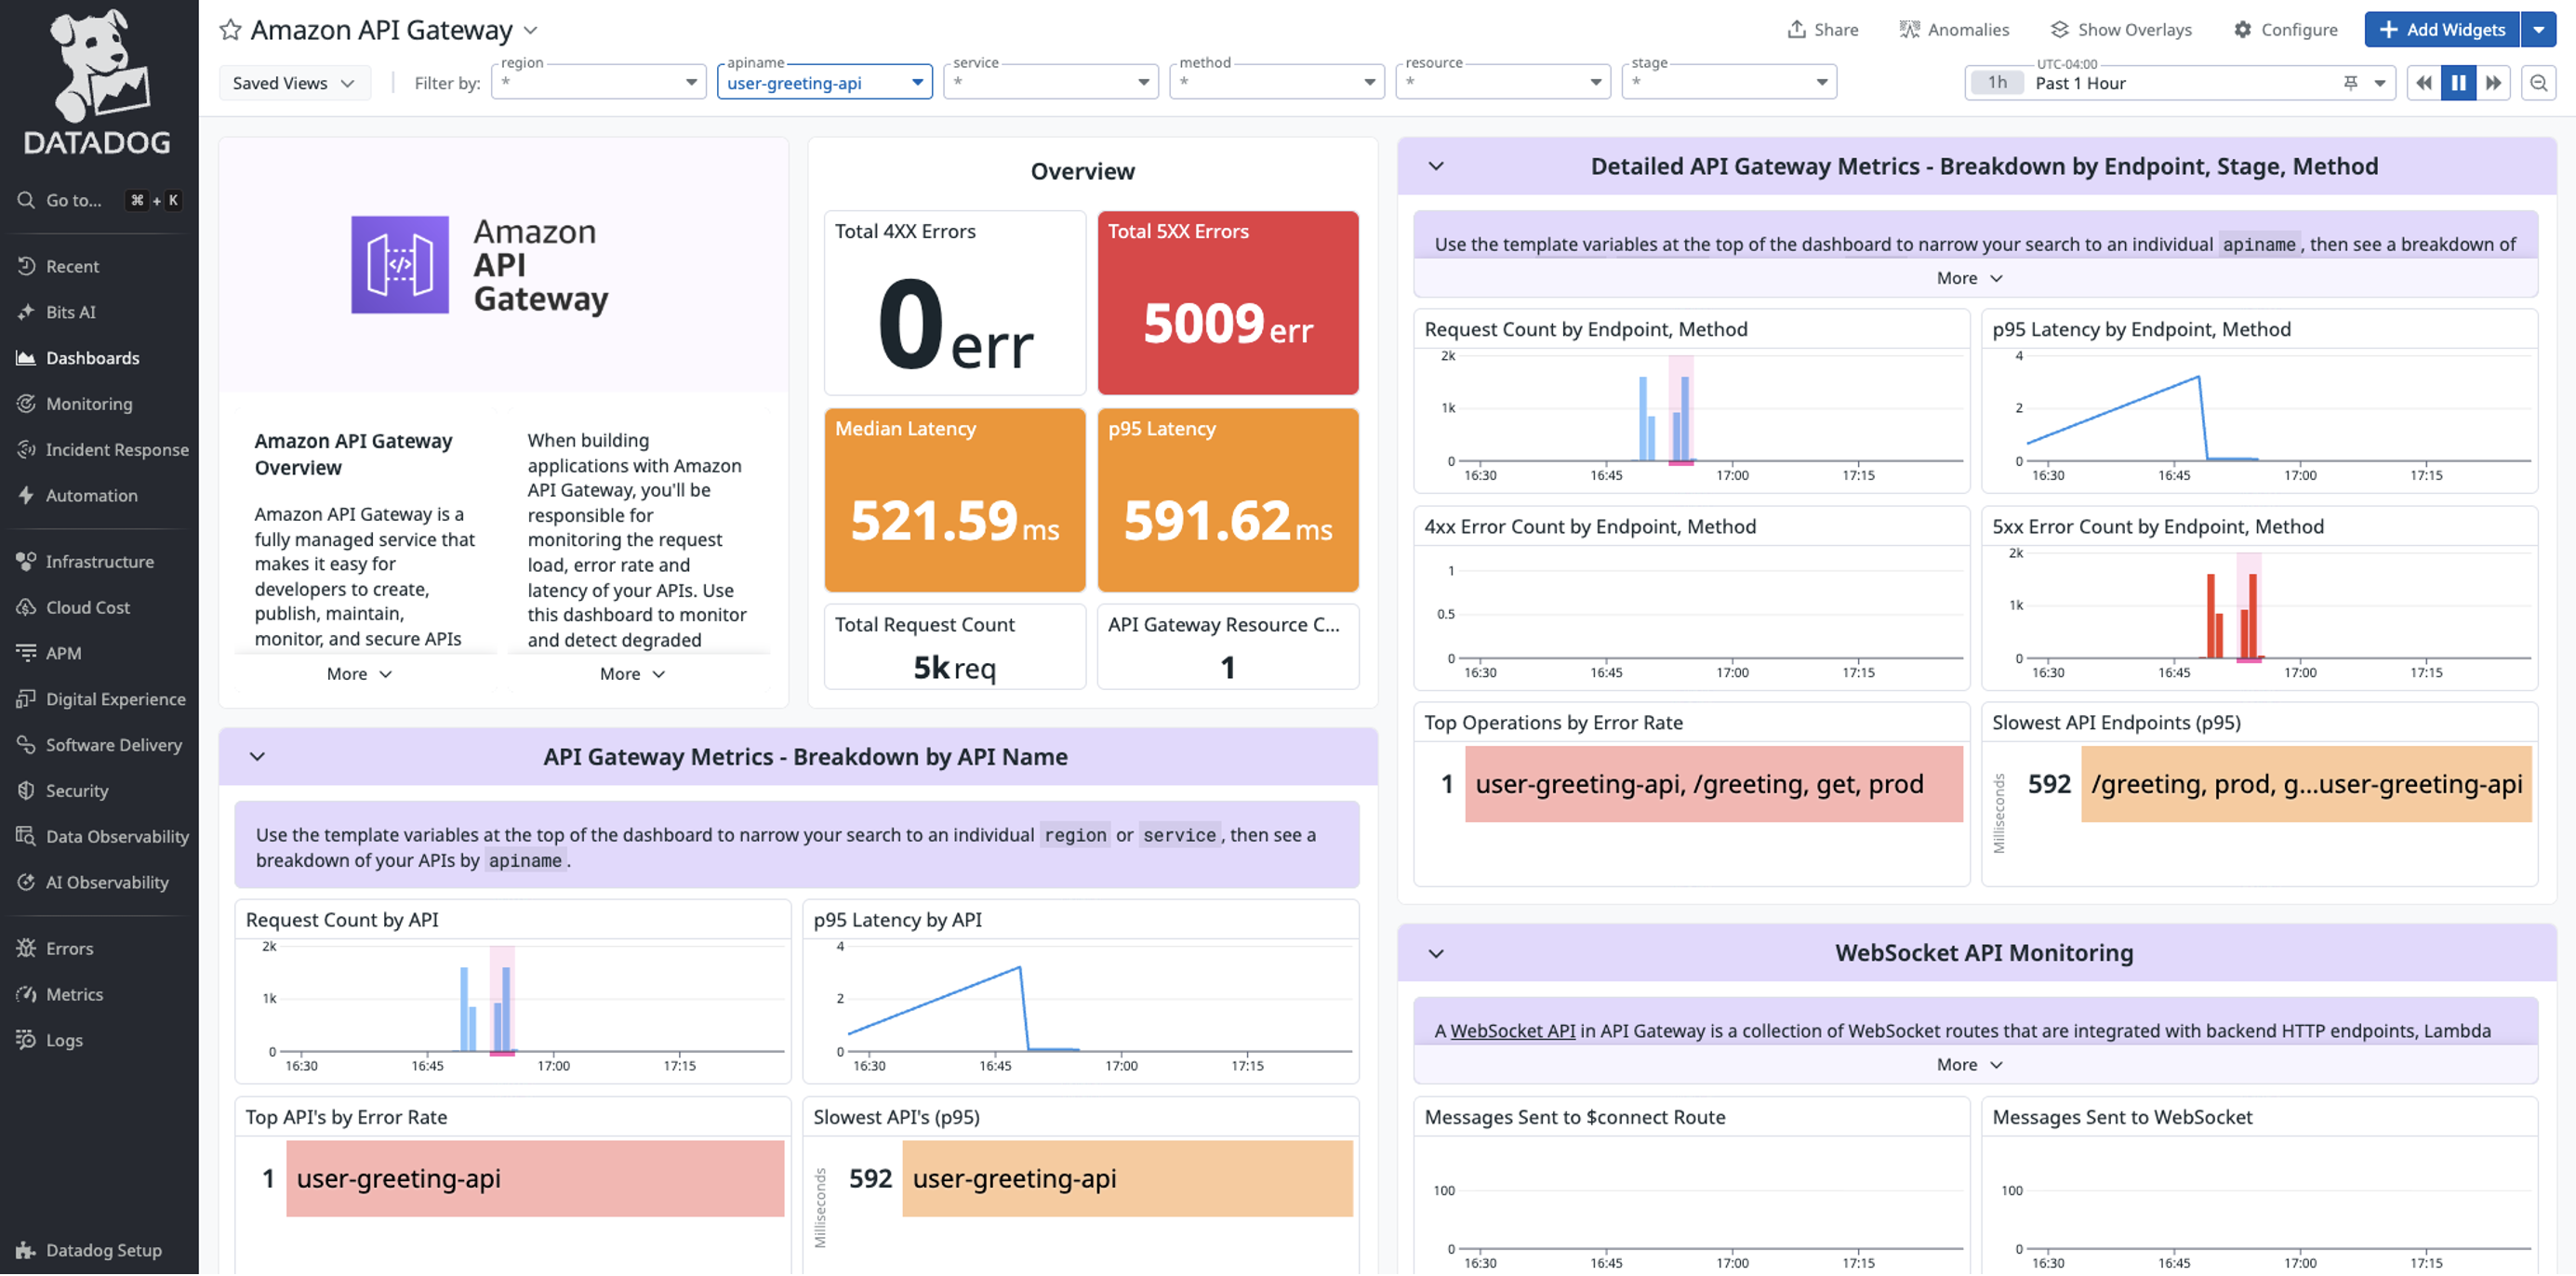
Figure 3: Sample 5xx errors in Datadog
Investigating errors from Incident with Datadog MCP Server and AWS DevOps Agent
When the 5xx alert triggers, AWS DevOps Agent automatically analyzes the incident using both Datadog metrics and API Gateway logs. Through the investigation chat interface, an engineer guides AWS DevOps Agent to examine the API Gateway configuration. The agent correlates API Gateway and AWS Lambda execution logs, quickly identifying error patterns.
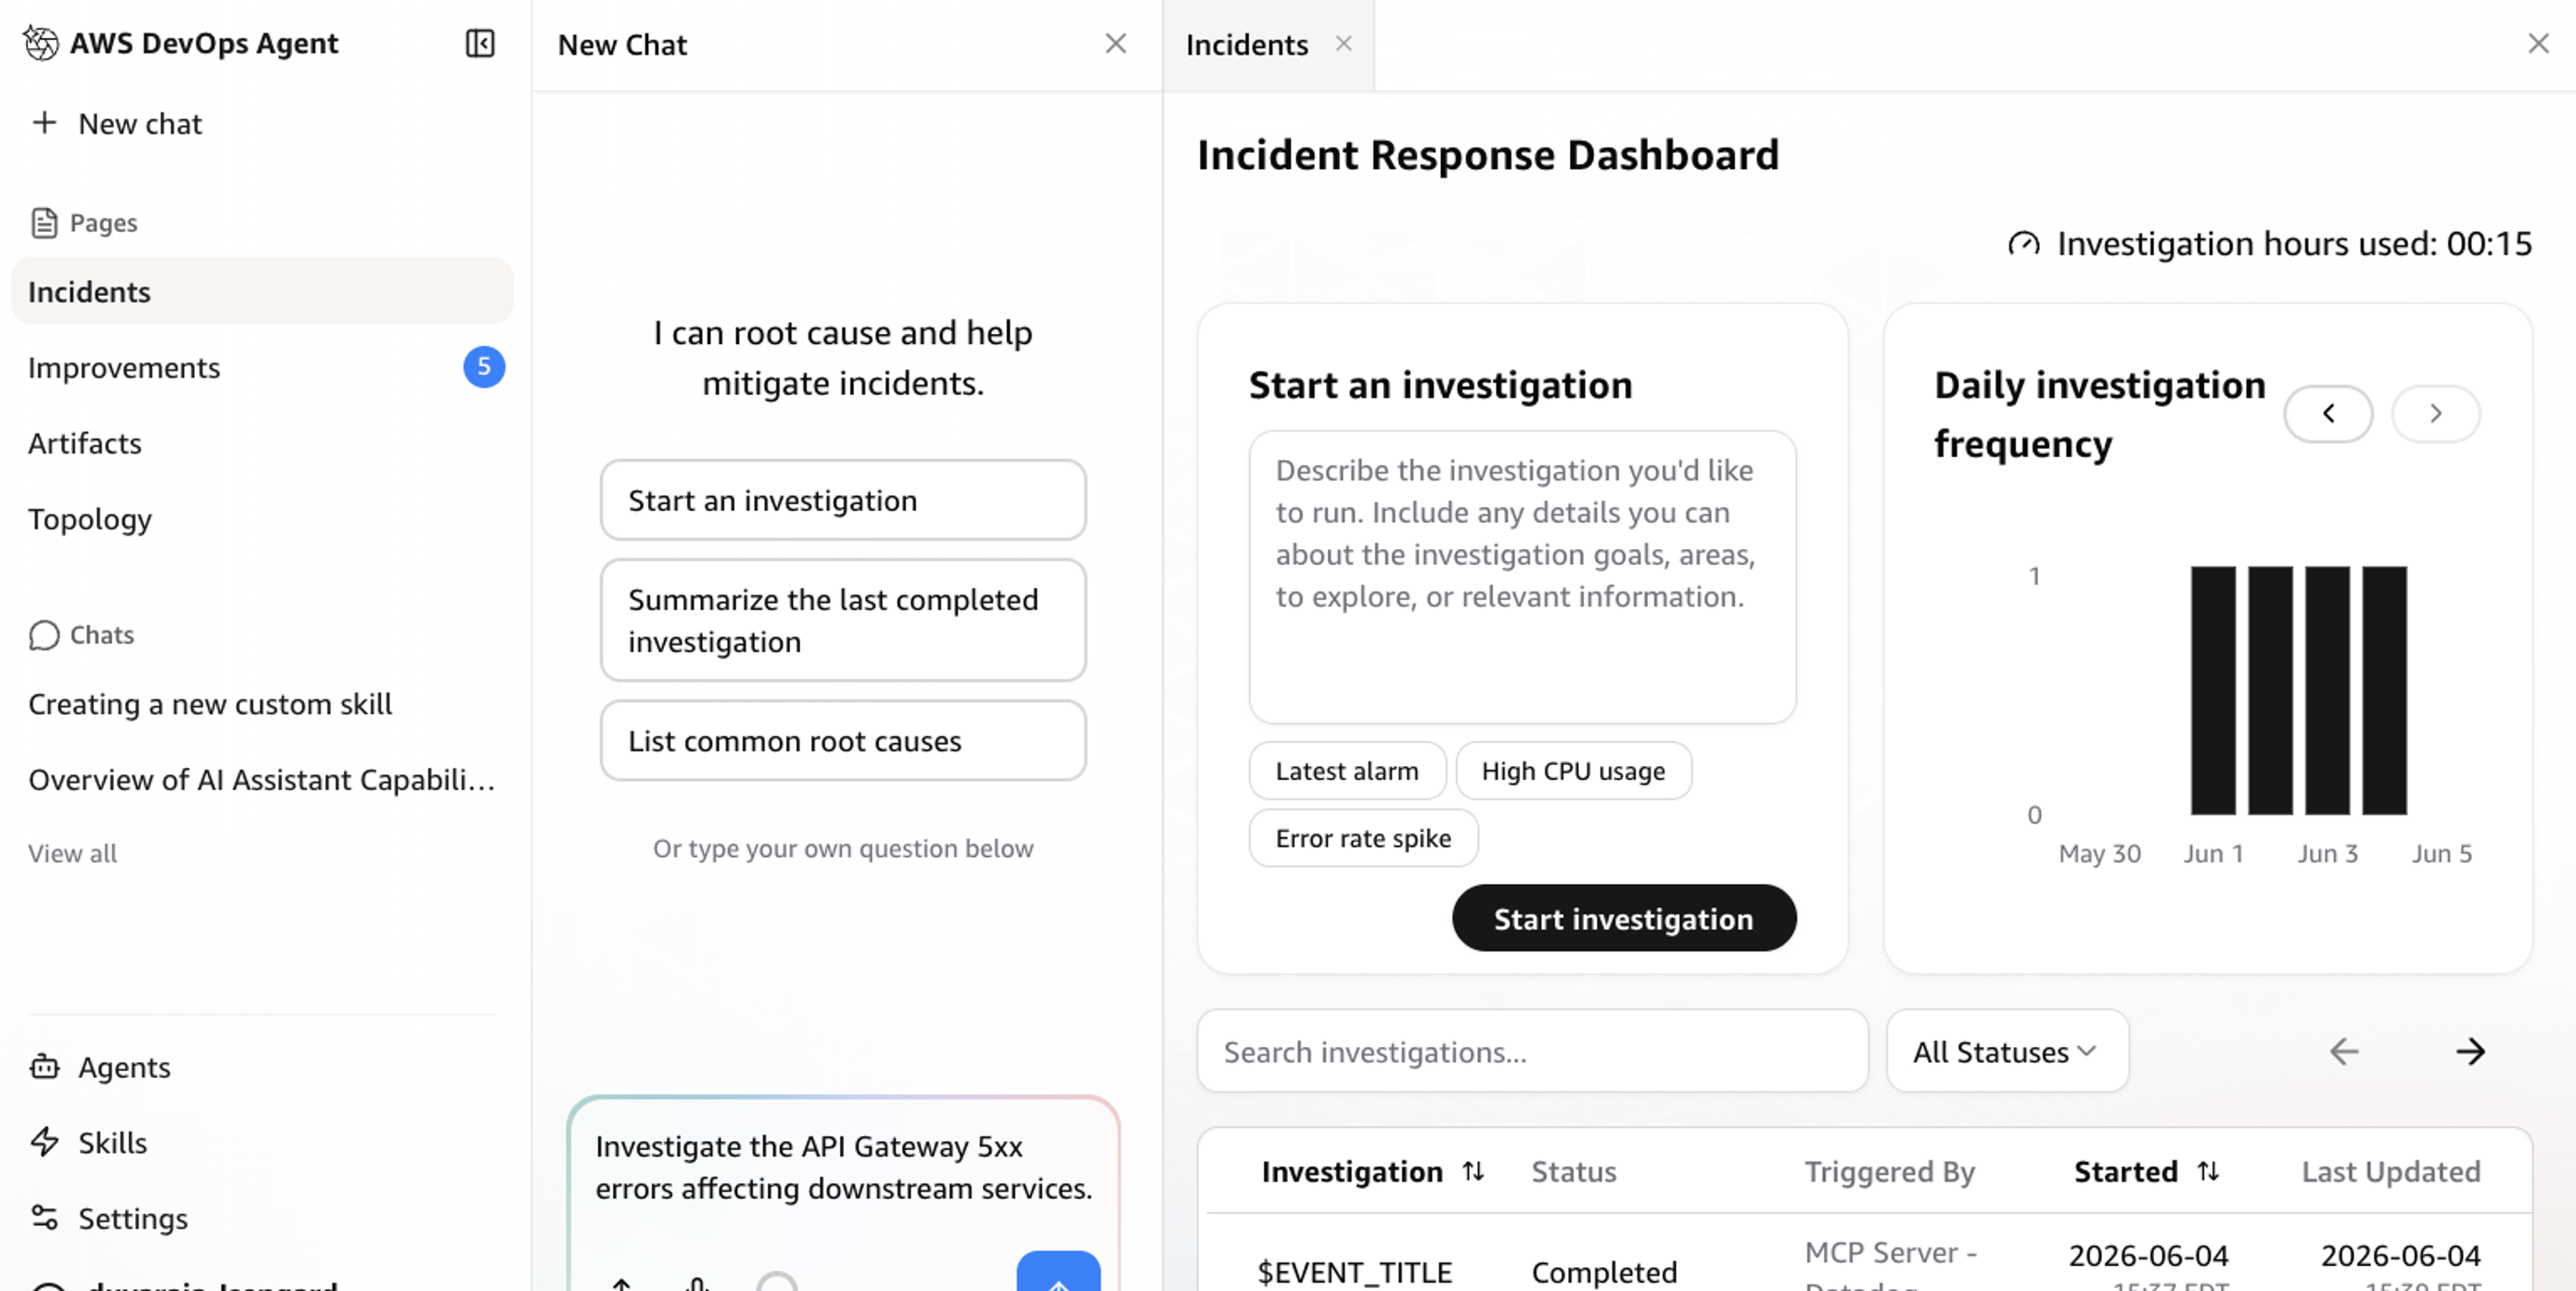
Figure 4: Investigating an incident with AWS DevOps Agent and Datadog MCP Server
Resolving issue
AWS DevOps Agent helps identify potential misconfigurations in the Lambda and Amazon DynamoDB integration and suggests immediate fixes. The agent documents all findings and actions in an incident investigation, backed by telemetry from both Datadog and AWS services. After resolution, AWS DevOps Agent generates a detailed analysis report with specific recommendations to prevent similar incidents.
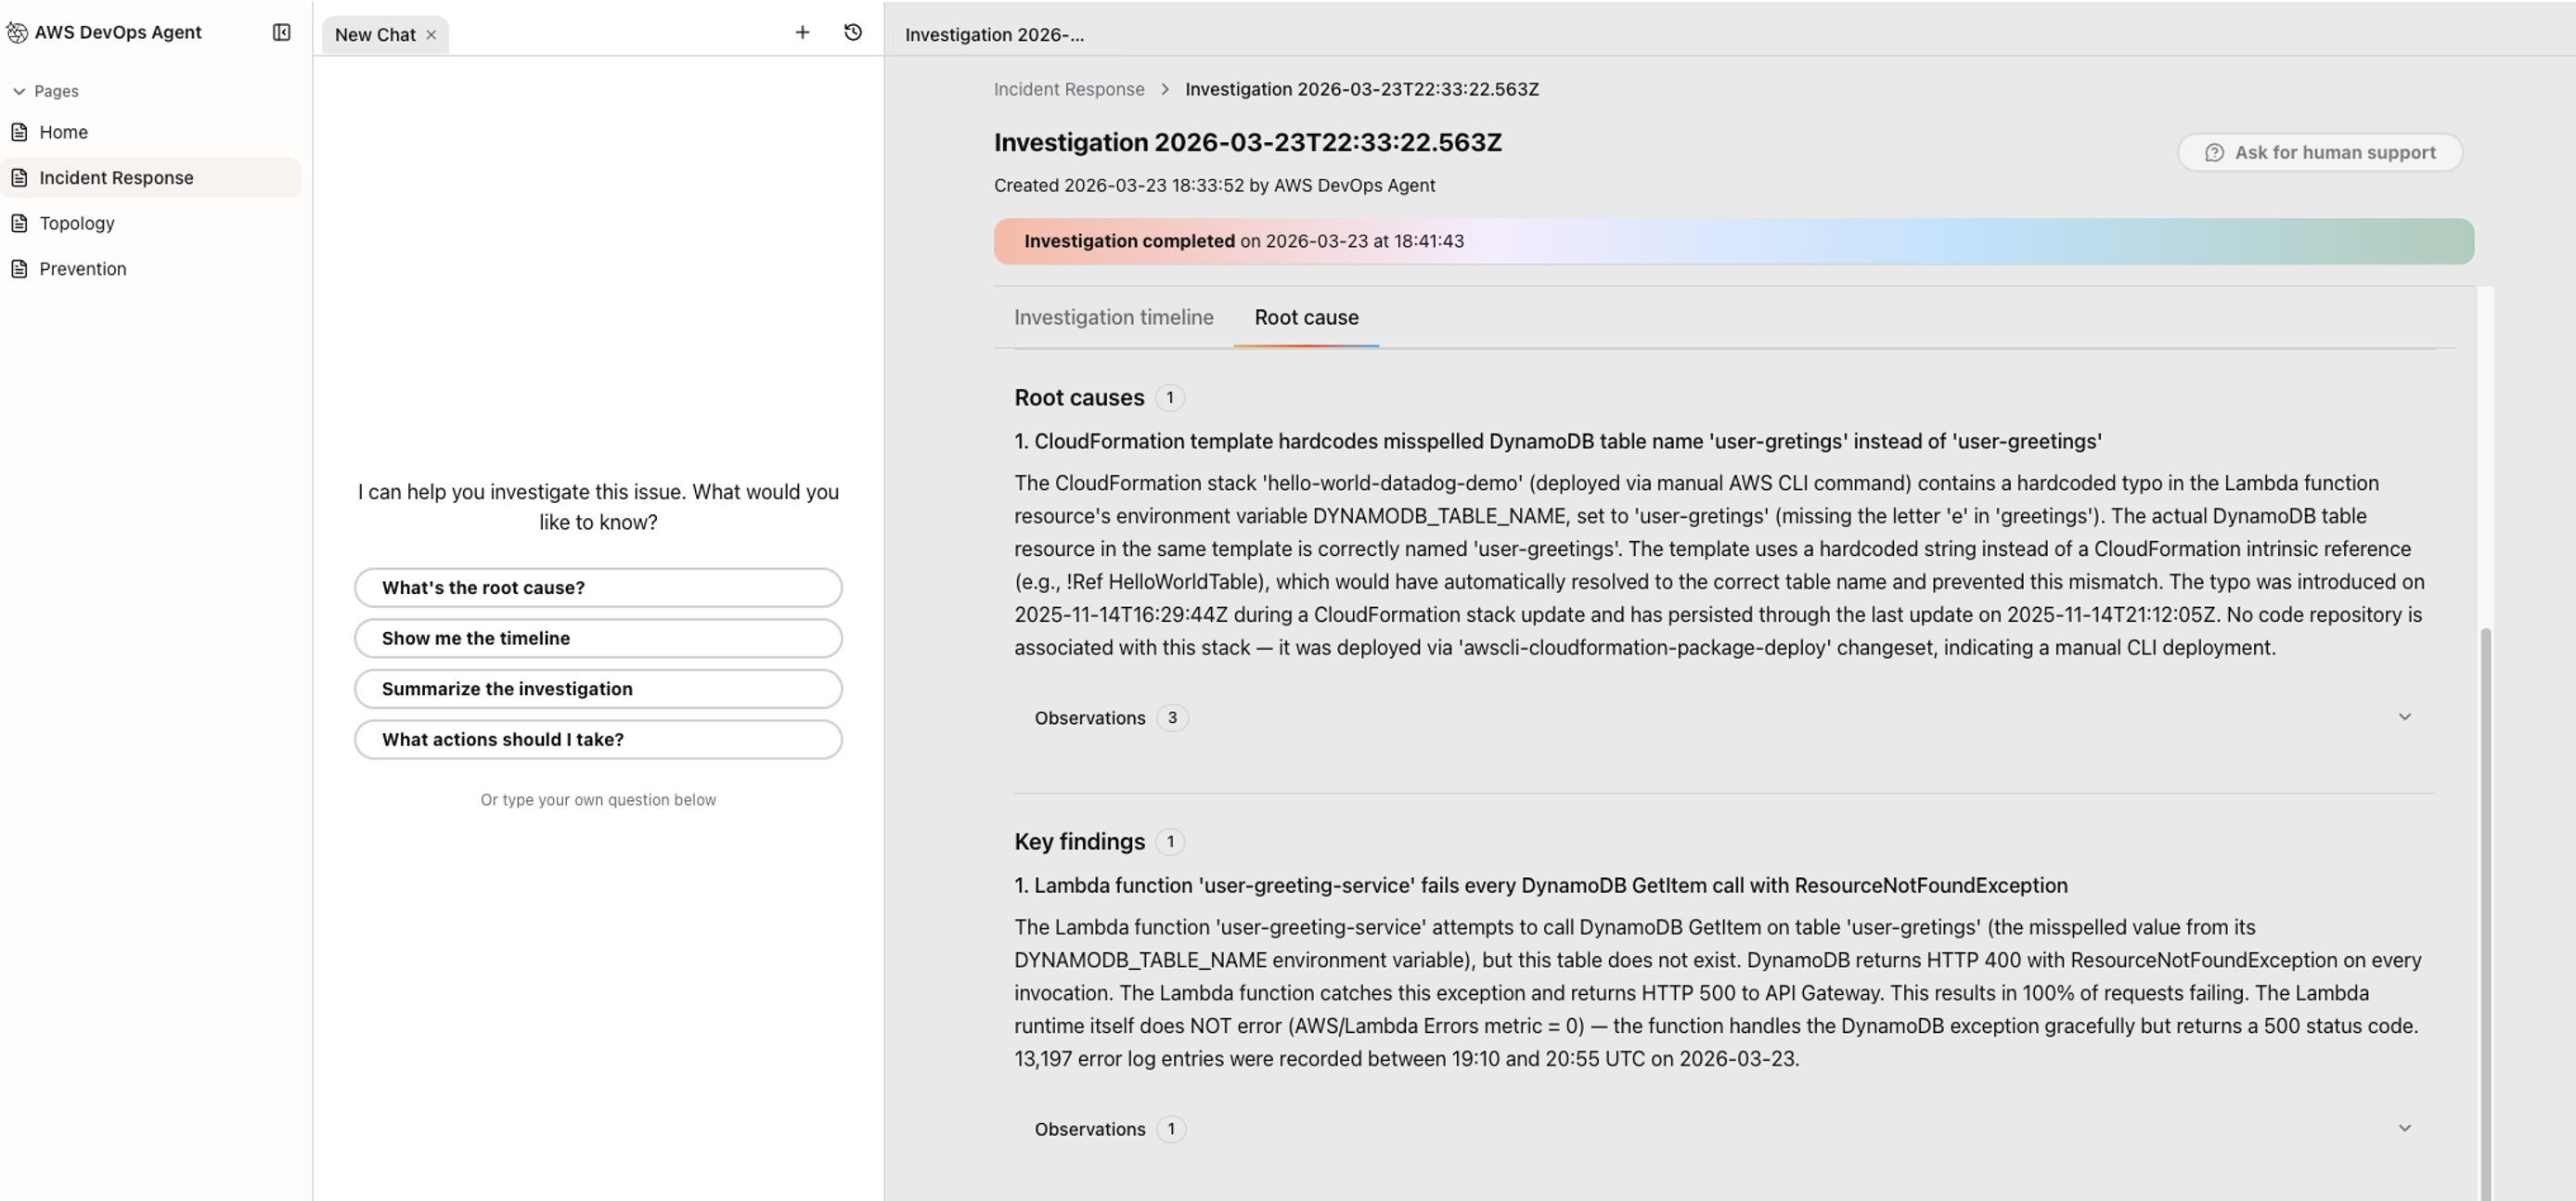
Figure 5: Investigation summary produced by AWS DevOps Agent
Mitigation plans
After completing investigation, AWS DevOps Agent goes beyond identifying the root cause — it generates a detailed mitigation plan with step-by-step remediation guidance specific to the incident. Beyond immediate fixes, the plan includes longer-term prevention recommendations such as adding retry logic, implementing circuit breakers, or adjusting capacity thresholds to reduce the risk of recurrence.
This shifts the on-call experience from reactive to proactive. Instead of context-switching across multiple tools to build a remediation plan from scratch, engineers get a ready-to-execute plan they can review, refine, and route through existing change management workflows — keeping stakeholders informed as fixes are implemented. Over time, AWS DevOps Agent learns from resolved incidents across your environment, making its mitigation plans increasingly precise by recognizing patterns, referencing past resolutions, and surfacing preventive measures before similar issues repeat. AWS DevOps Agent also leverages its deep understanding of your environment, enabling you to dive deeper into your application environment, beyond just asking questions, to create, save, and share custom charts and reports.
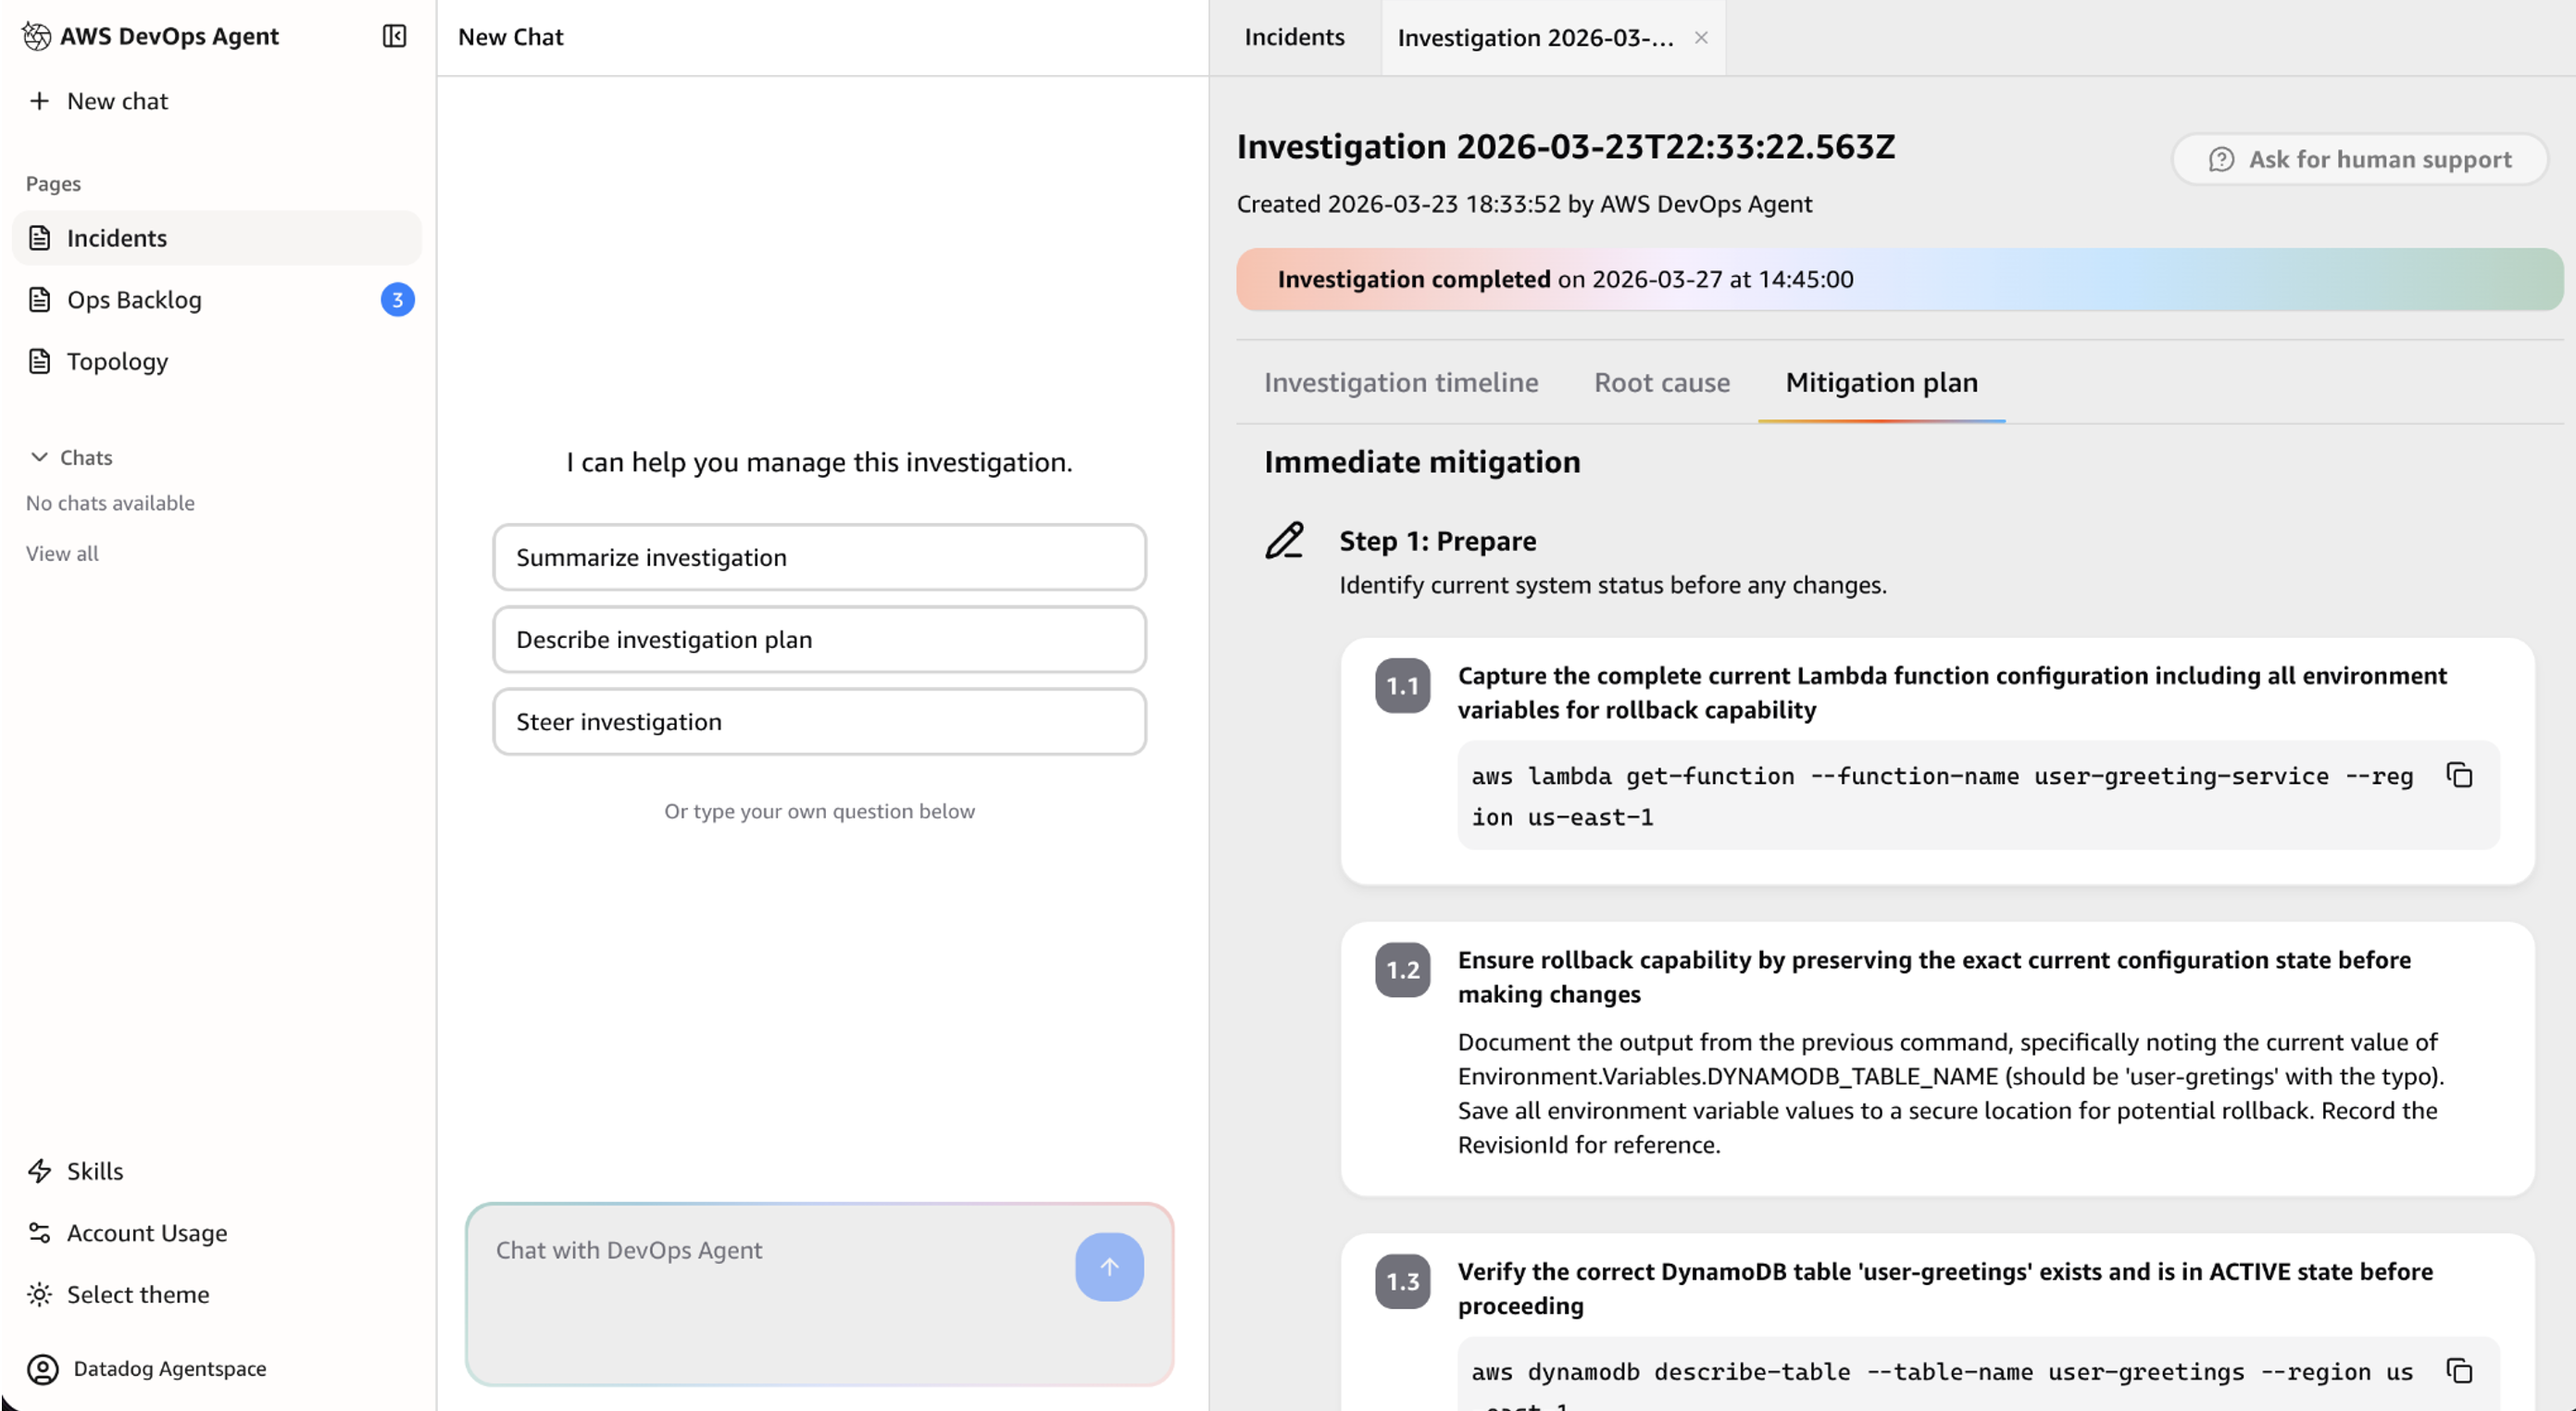
Figure 6: Mitigation plan generated by AWS DevOps Agent
Prevention
AWS DevOps Agent can evaluate recent incidents to identify improvement opportunities that prevent future incidents and reduce Mean Time To Detection (MTTD) and Mean Time to Recovery (MTTR).
- Navigate to the Improvements page in the AWS DevOps Agent web app
- Click Run Now. Once its completed, it displays a personalized incident prevention recommendation, as displayed in Figure 7 below. Note: The “Run Now” button may not produce visible results immediately. Prevention analysis runs asynchronously in the background and results may take time to appear. This is expected since the feature is designed for production environments with longer incident histories.
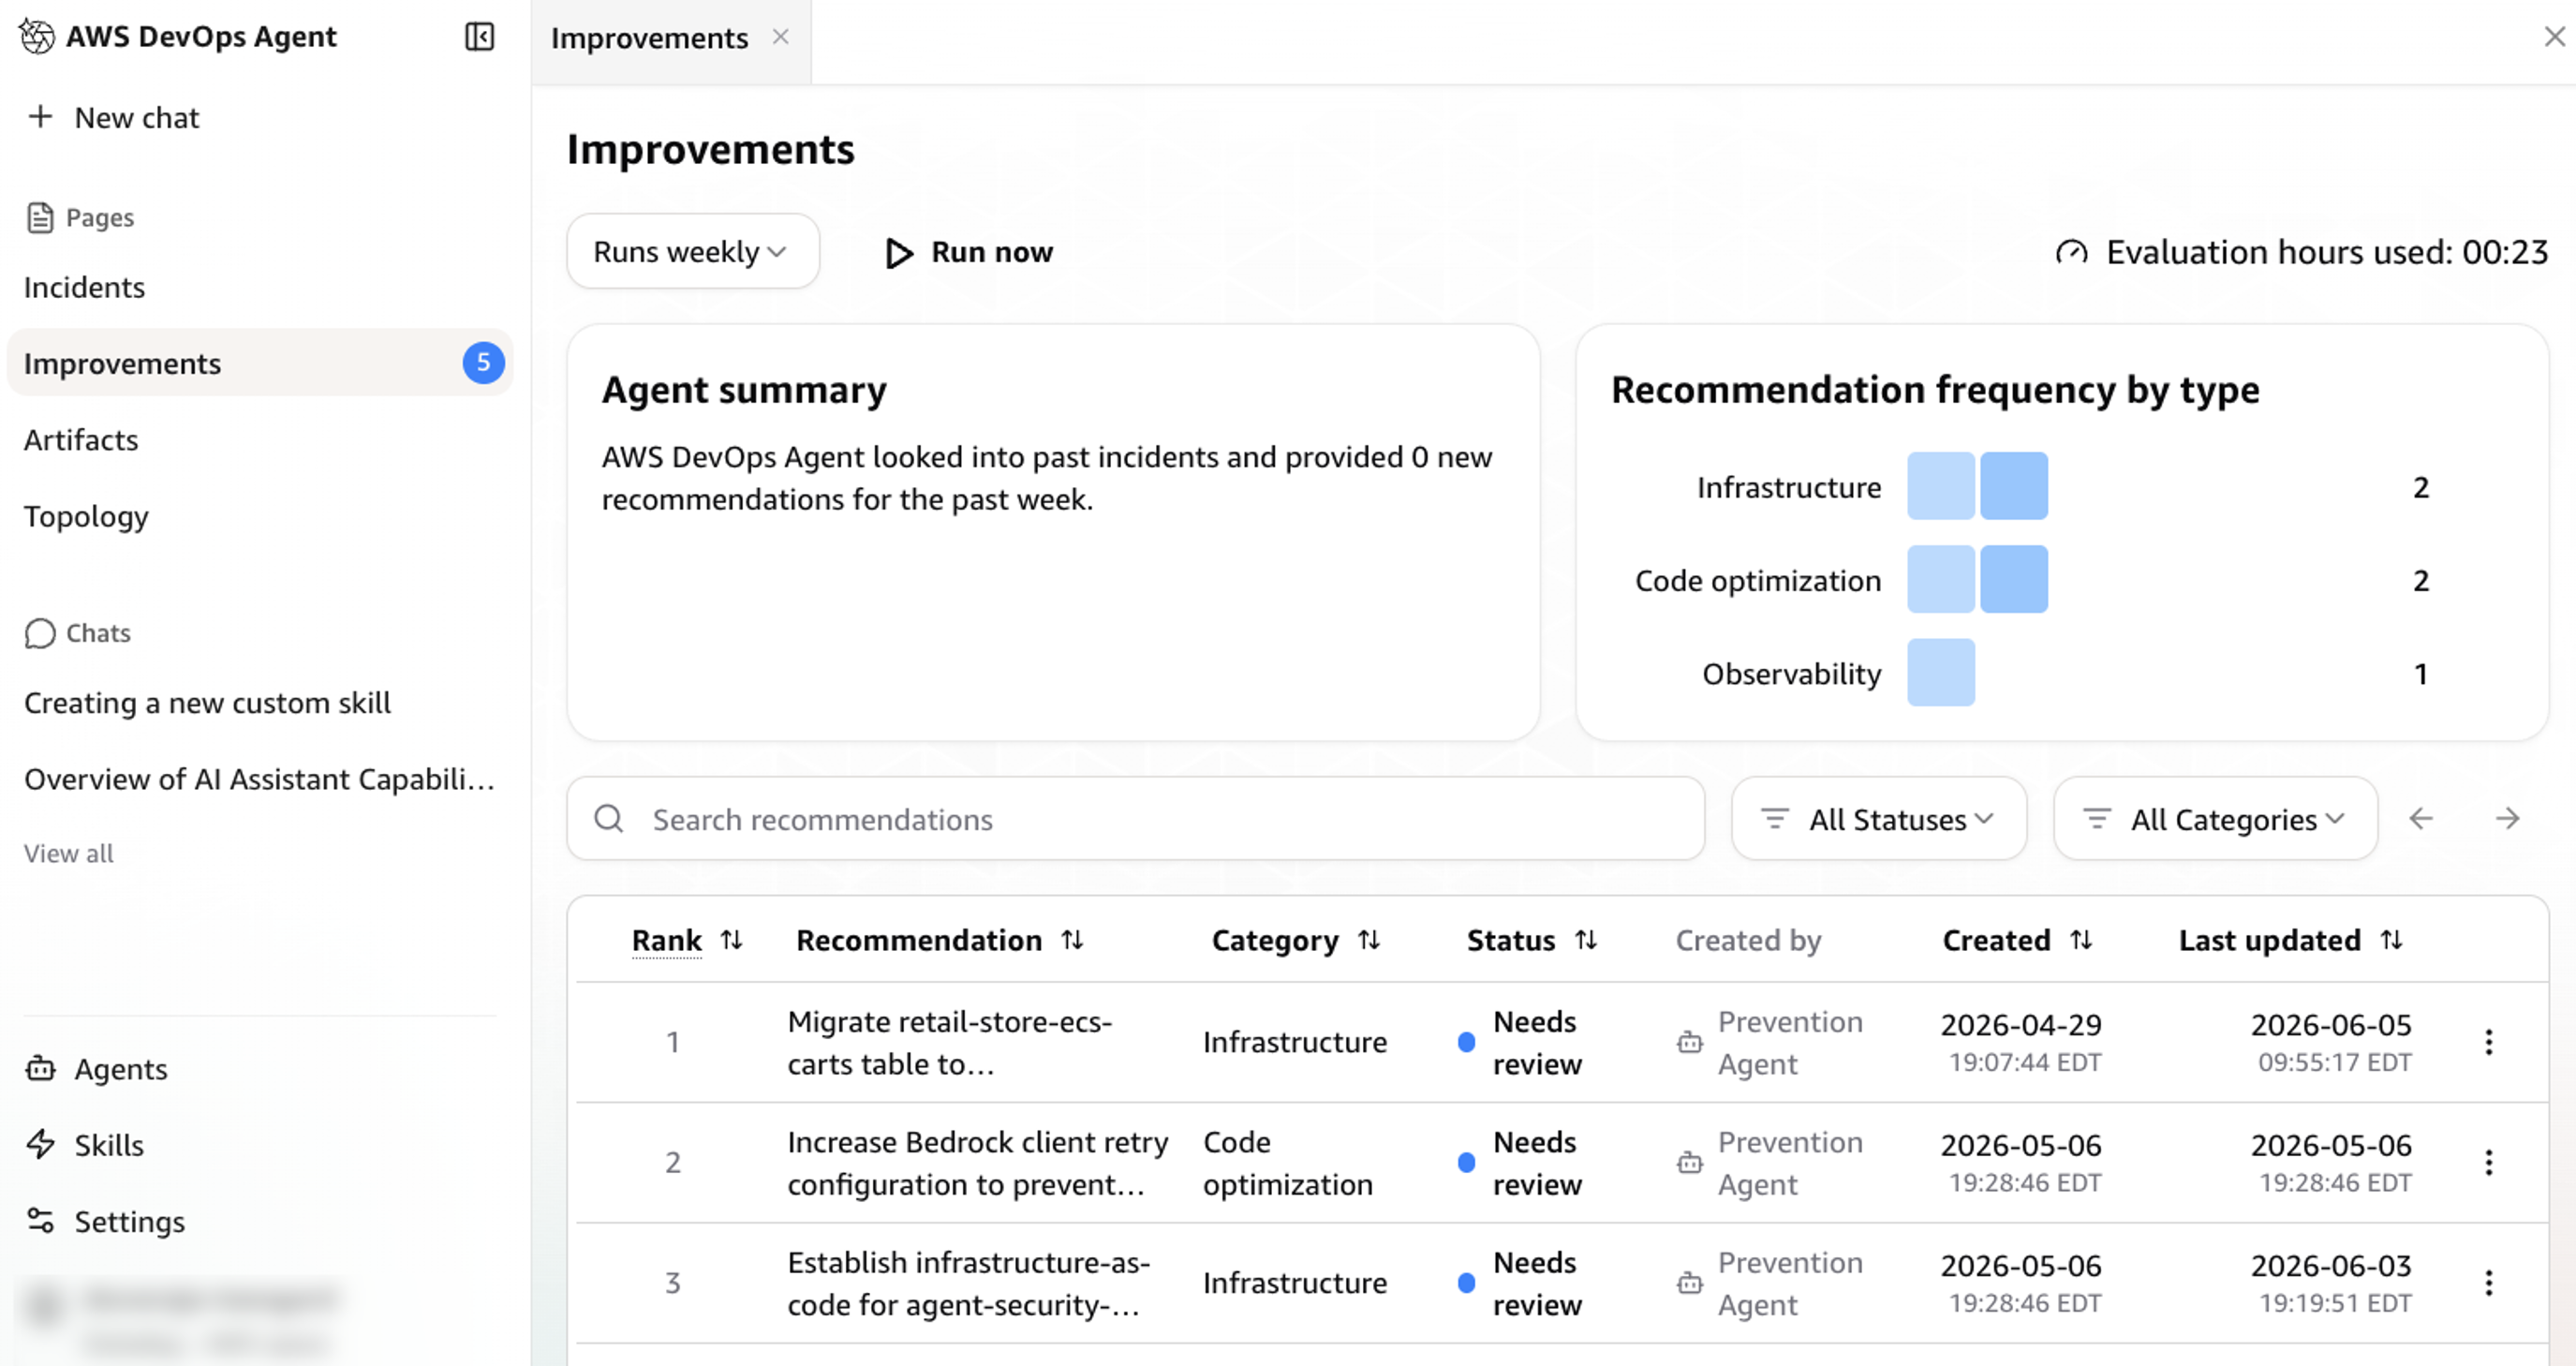
Figure 7: Personalized incident prevention recommendation from AWS DevOps Agent
Cleanup
When you’re done using the integration, you can clean up your resources by following these steps:
- Delete your Agent Space from the AWS DevOps Agent console
- Remove the Datadog MCP Server connection from your Capability Providers
- Delete the IAM roles created for the Agent Space
- (Optional) If you created additional source account roles, remove those as well
Conclusion
With Datadog MCP Server and AWS DevOps Agent now generally available, this integration automatically correlates Datadog logs, metrics, and traces with AWS telemetry, code, and deployment data, giving teams an autonomous investigation that identifies root causes, delivers actionable mitigation plans, and recommends preventive improvements. Early adopters have seen resolution times drop from hours to minutes and deeper root cause analysis across AWS, multicloud and hybrid environments. To learn more, check out the AWS DevOps Agent.
Datadog is an AWS Specialization Partner and AWS Marketplace Seller that has been building integrations with AWS services for over a decade, amassing a growing catalog of 100+ AWS and 1000+ built-in integrations. This new AWS DevOps Agent and Datadog MCP Server integration builds upon Datadog’s strong track record of AWS partnership success. If you’re not already using Datadog, you can get started with a 14-day free trial via the AWS Marketplace.
Announcing Amazon EC2 G7 instances accelerated by NVIDIA RTX PRO 4500 Blackwell Server Edition GPUs
Post Syndicated from Daniel Abib original https://aws.amazon.com/blogs/aws/announcing-amazon-ec2-g7-instances-accelerated-by-nvidia-rtx-pro-4500-blackwell-server-edition-gpus/
Today, we’re announcing the general availability of Amazon Elastic Compute Cloud (Amazon EC2) G7 instances, delivering high performance GPU acceleration for AI inference, graphics, and data analytics workloads.
AWS is the first major cloud provider to support NVIDIA RTX PRO 4500 Blackwell Server Edition GPUs. G7 instances are accelerated by these GPUs with custom sixth-generation Intel Xeon Scalable processors, delivering up to 4.6x AI inference performance and up to 2.1x graphics performance compared to G6 instances. G7 instances also deliver faster performance for GPU-accelerated analytics on Amazon EMR on Amazon Elastic Kubernetes Service (Amazon EKS). G7 instances are well suited for a broad range of GPU-enabled workloads including AI inference, graphics rendering, video transcoding and analytics, spatial computing, virtual desktop infrastructure (VDI), and data analytics.
Here are improvements of G7 instances compared to previous generation:
- Faster GPU memory – NVIDIA RTX PRO 4500 Blackwell Server Edition GPUs offer 1.33 times the GPU memory capacity and 2.45 times the GPU memory bandwidth compared to G6 instances. With 32 GB of GPU memory per GPU, 5th Gen Tensor Cores, and 4th Gen RT Cores, G7 instances deliver enhanced AI inference and graphics performance.
- High performance networking and storage – G7 instances come with 700 Gbps of EFA-enabled networking throughput (7x compared to G6) enabling the low-latency, high-bandwidth connectivity that AI inference, graphics-intensive applications, and GPU-accelerated data analytics workloads need to perform at their best. G7 instances support up to 7.6 TB local NVMe SSD storage, enabling you to keep large models and datasets close to compute, reduce data transfer overhead, and improve throughput.
- Advanced video encoding and decoding engines – Ninth-generation NVENC and sixth-generation NVDEC engines support 4:2:2 encoding and decoding for high-resolution video workflows, delivering 1.5x concurrent video streams compared to previous-generation G6 instances.
EC2 G7 instance specifications
G7 instances feature up to 8 NVIDIA RTX PRO 4500 Blackwell Server Edition GPUs with up to 256 GB of total GPU memory (32 GB of memory per GPU) and custom Intel Xeon Scalable processors. They also are available in 7 sizes and support up to 192 vCPUs, up to 700 Gbps of network bandwidth, up to 768 GiB of system memory, and up to 7.6 TB of local NVMe SSD storage.
Here are the specs:
| Instance name | GPUs | GPU memory (GB) | vCPUs | Memory (GiB) | Storage | EBS bandwidth (Gbps) | Network bandwidth (Gbps) |
| g7.2xlarge | 1 | 32 | 8 | 32 | 1 x 600 | Up to 8 | Up to 60 |
| g7.4xlarge | 1 | 32 | 16 | 64 | 1 x 600 | 8 | Up to 100 |
| g7.8xlarge | 1 | 32 | 32 | 128 | 1 x 950 | 16 | Up to 100 |
| g7.12xlarge | 2 | 64 | 48 | 192 | 1 x 1900 | 20 | 175 |
| g7.24xlarge | 4 | 128 | 96 | 384 | 1 x 3800 | 40 | 350 |
| g7.48xlarge | 8 | 256 | 192 | 768 | 2 x 3800 | 80 | 700 |
| g7.metal* | 8 | 256 | 192 | 768 | 2 x 3800 | 80 | 700 |
* Coming soon
G7 instances support NVIDIA GPUDirect P2P for multi-GPU sizes, NVIDIA GPUDirect RDMA with EFA, and GPUDirect RDMA with EFA for Amazon FSx for Lustre, enabling low-latency GPU-to-GPU communication for multi-GPU and multi-node workloads.
To get started with G7 instances, you can use the AWS Deep Learning AMIs (DLAMI) or NVIDIA Workstation AMIs with prepackaged GPU drivers for your AI inference and graphics workloads. To use G7 instances with Amazon EKS, build EKS AMIs with NVIDIA driver version R595 with EKS-provided automation. G7 instances support multiple operating systems including Amazon Linux, Ubuntu, RHEL, and Windows Server, with comprehensive NVIDIA driver integration providing compatibility with industry-standard graphics libraries including DirectX, Vulkan, and OpenGL.
Get started today
You can start using Amazon EC2 G7 instances today in two AWS regions: US East (Ohio) and US West (Oregon). To check future Regional expansion plans, look up the instance type in the CloudFormation resources tab on the AWS Capabilities by Region page.
G7 instances are offered through multiple purchasing options, including On-Demand, Savings Plans, and Spot Instances. Dedicated Instances are also supported for the 12xlarge, 24xlarge, and 48xlarge sizes. For detailed pricing, visit the Amazon EC2 Pricing page.
Ready to get started? Launch G7 instances from the Amazon EC2 console. For more details, head over to the Amazon EC2 G7 instances page. We’d love to hear your feedback. Share it on AWS re:Post for EC2 or reach out through your usual AWS Support contacts.
– Daniel Abib
Amazon ECS introduces new high-resolution metrics for faster service auto scaling
Post Syndicated from Channy Yun (윤석찬) original https://aws.amazon.com/blogs/aws/amazon-ecs-introduces-new-high-resolution-metrics-for-faster-service-auto-scaling/
Amazon Elastic Container Service (Amazon ECS) service auto scaling automatically adjusts task counts to meet workload demand with comprehensive scaling policies, including predictive scaling for recurring traffic patterns, scheduled scaling for planned events, and target tracking to scale dynamically on real-time metrics.
You can choose proactive scaling by using predictive scaling (automatic) and scheduled scaling (customer-defined), or reactive scaling by using target tracking with just a target to scale on. Amazon ECS service auto scaling adjusts the number of tasks in an ECS service based on Amazon CloudWatch metrics, such as average CPU/Memory usage, request count per target, a custom metric such as queue depth, or demand surges by using advanced machine learning (ML) algorithms.
With today’s launch, Amazon ECS service auto scaling now detects and responds to load changes faster with support for high resolution (20-second) metrics and metric publishing optimizations. In AWS benchmarking tests, time to trigger scale-out improved from 363 seconds to 86 seconds (76% faster, 4.2x), and total time to scale and provision new tasks improved from 386 seconds to 109 seconds (72% faster, 3.5x)
This launch delivers three key benefits for your applications:
- Improved performance and reliability: Faster scaling means, your application responds faster to demand surges, reducing latencies or failures for end users during demand surges.
- Right-size without compromise: Depending on the workload, you can reduce baseline task counts because scale-out now happens fast enough to handle traffic spikes without preemptive capacity padding. This directly reduces compute costs while maintaining application performance and availability.
- Simpler scaling configuration: Target tracking with high-resolution metrics delivers the aggressive scaling behavior that previously required custom scaling configurations, such as usage of step-scaling policies. One configuration change replaces custom engineering work.
How it works
To use ECS faster service auto scaling, first enable high-resolution metrics for your ECS service, and then configure a target tracking scaling policy which uses high-resolution metrics. ECS faster service autoscaling works across all compute options on ECS: AWS Fargate, ECS Managed Instances, and Amazon Elastic Compute Cloud (Amazon EC2). You can enable these metrics when you create or update your ECS service in the Amazon ECS console, or using AWS SDKs and tools, and AWS CloudFormation.
When you create a service in the console, add 20-seconds resolution metrics in the Monitoring configuration section. These metrics incur additional CloudWatch costs while the standard resolution (60-seconds) is free.
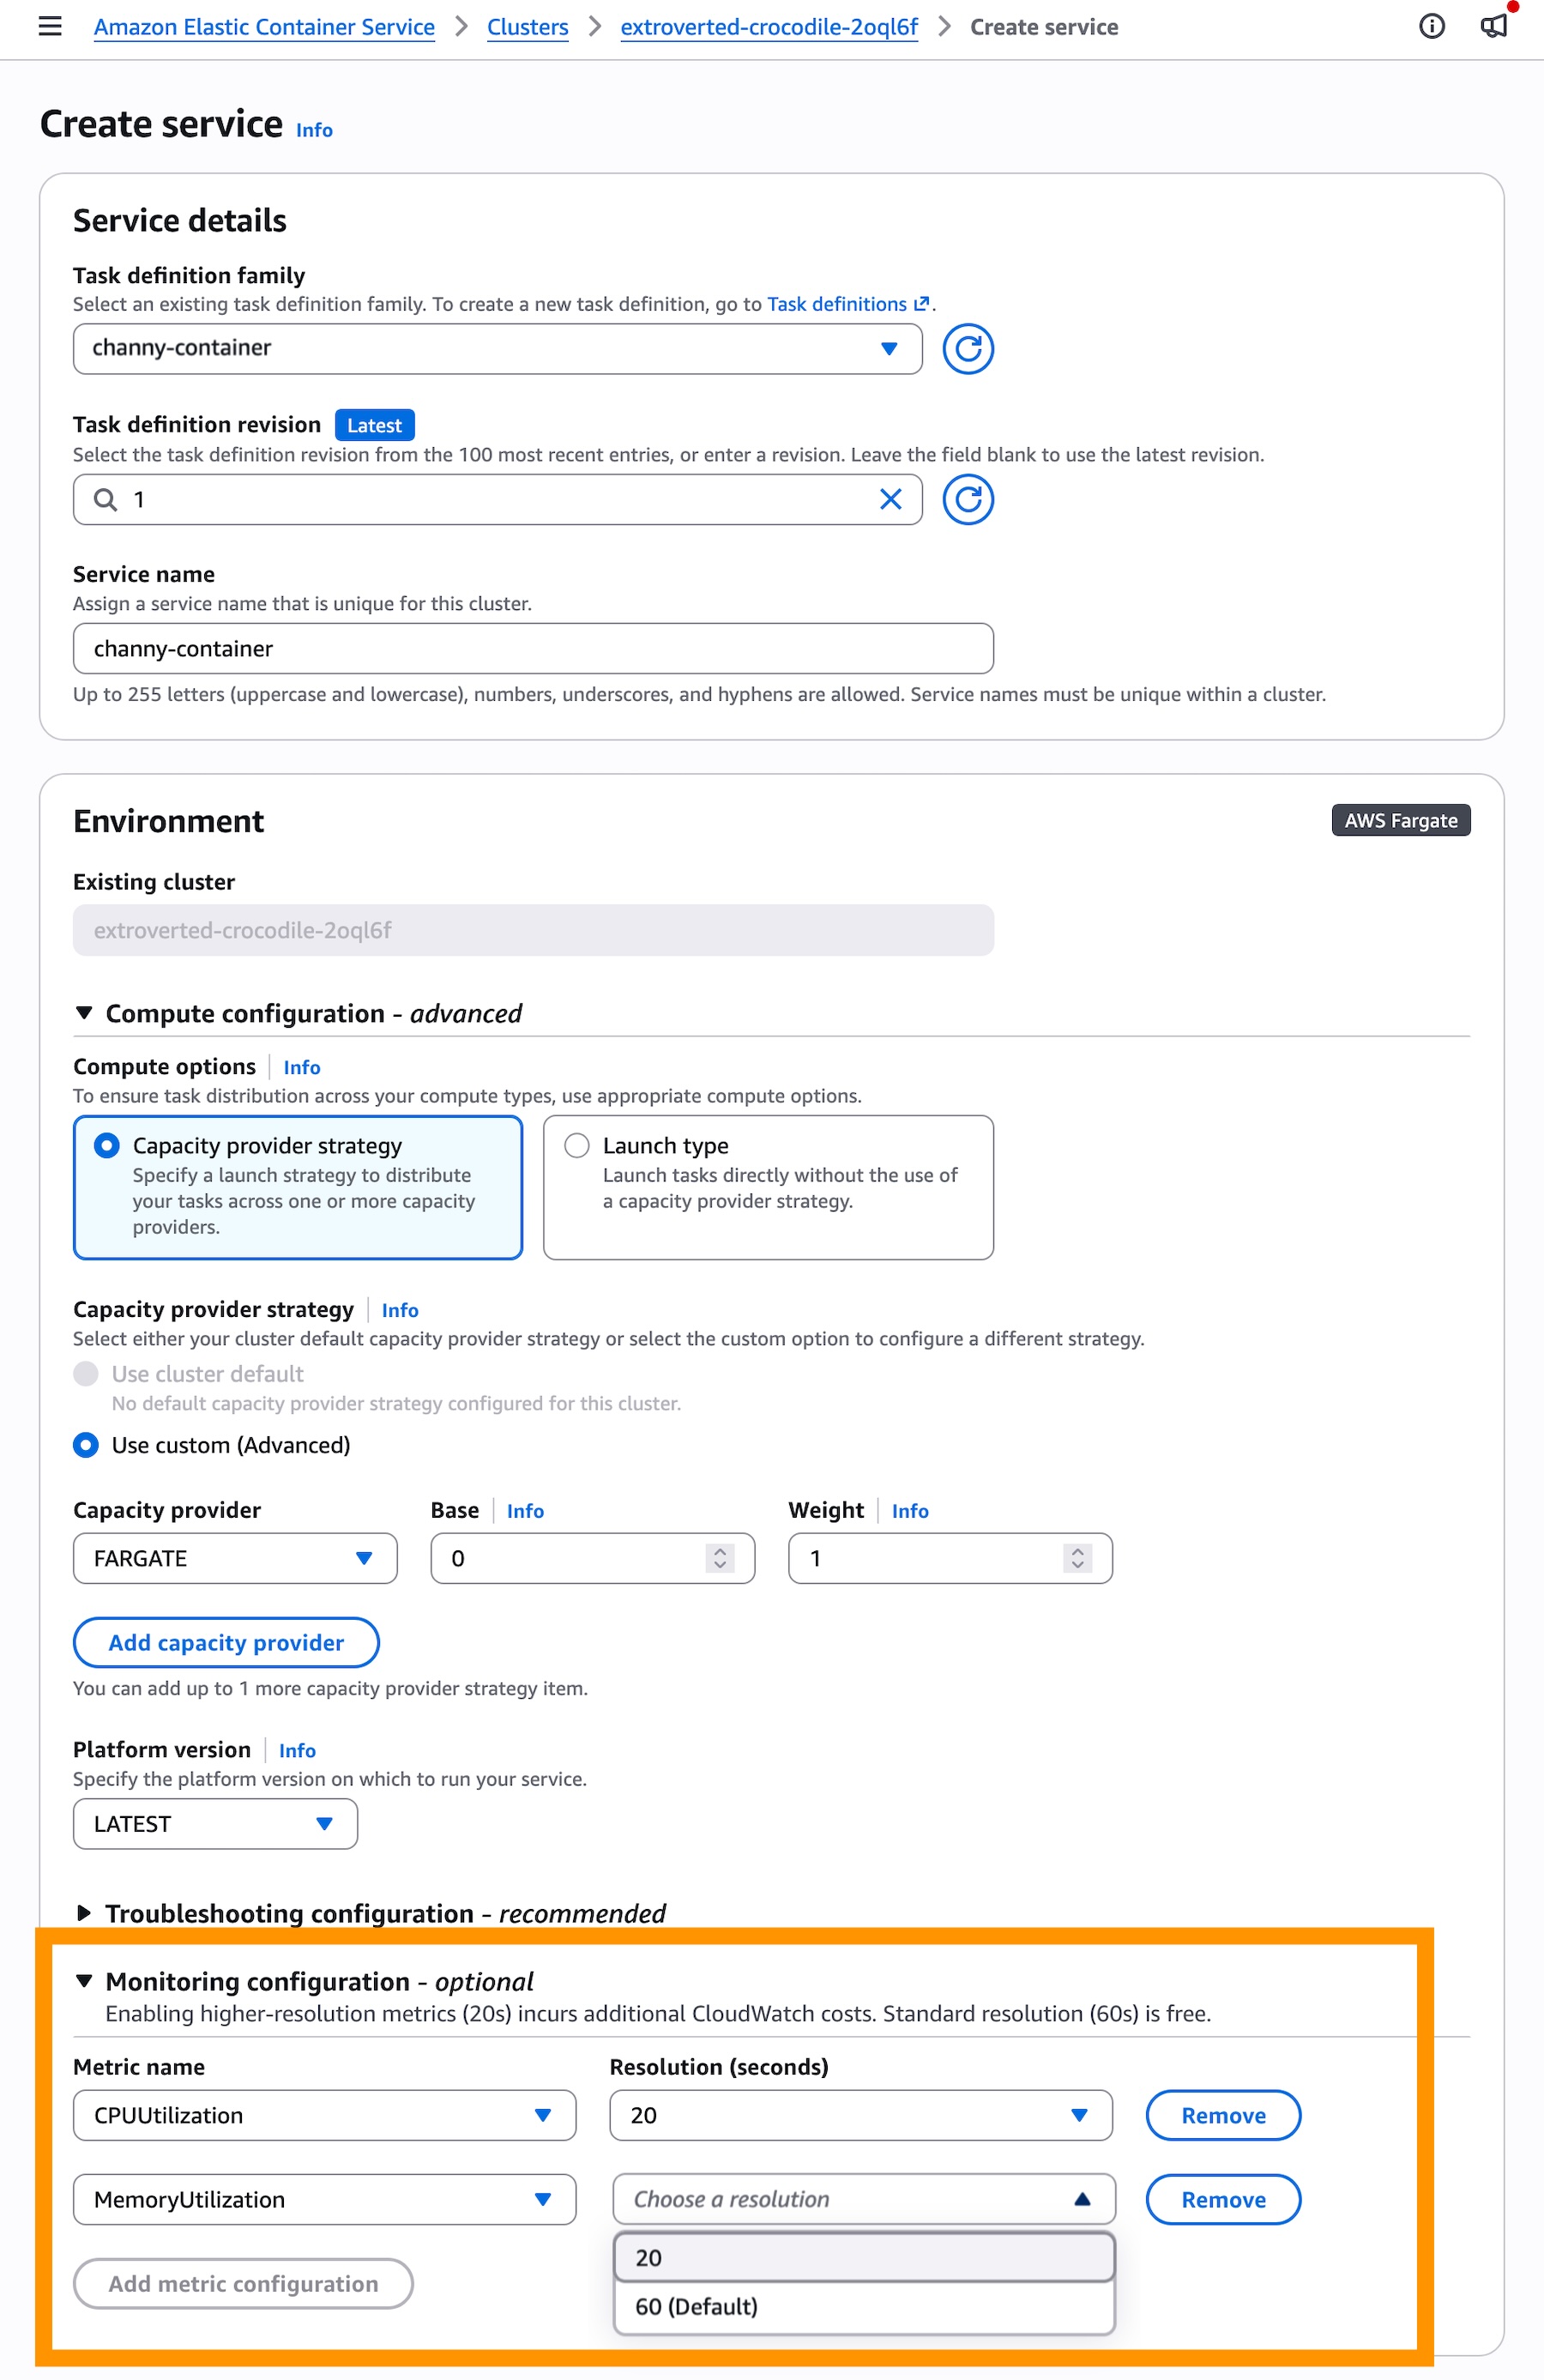
In the Service auto scaling section, check Use service auto scaling and choose Target Tracking for the scaling policy type to use real-time data to scale the number of tasks that your service runs based on demand.
Then, choose a Scaling policy type for the target tracking. You can select ECSServiceAverageCPUUtilizationHighResolution or ECSServiceAverageMemoryUtilizationHighResolution as new metrics.
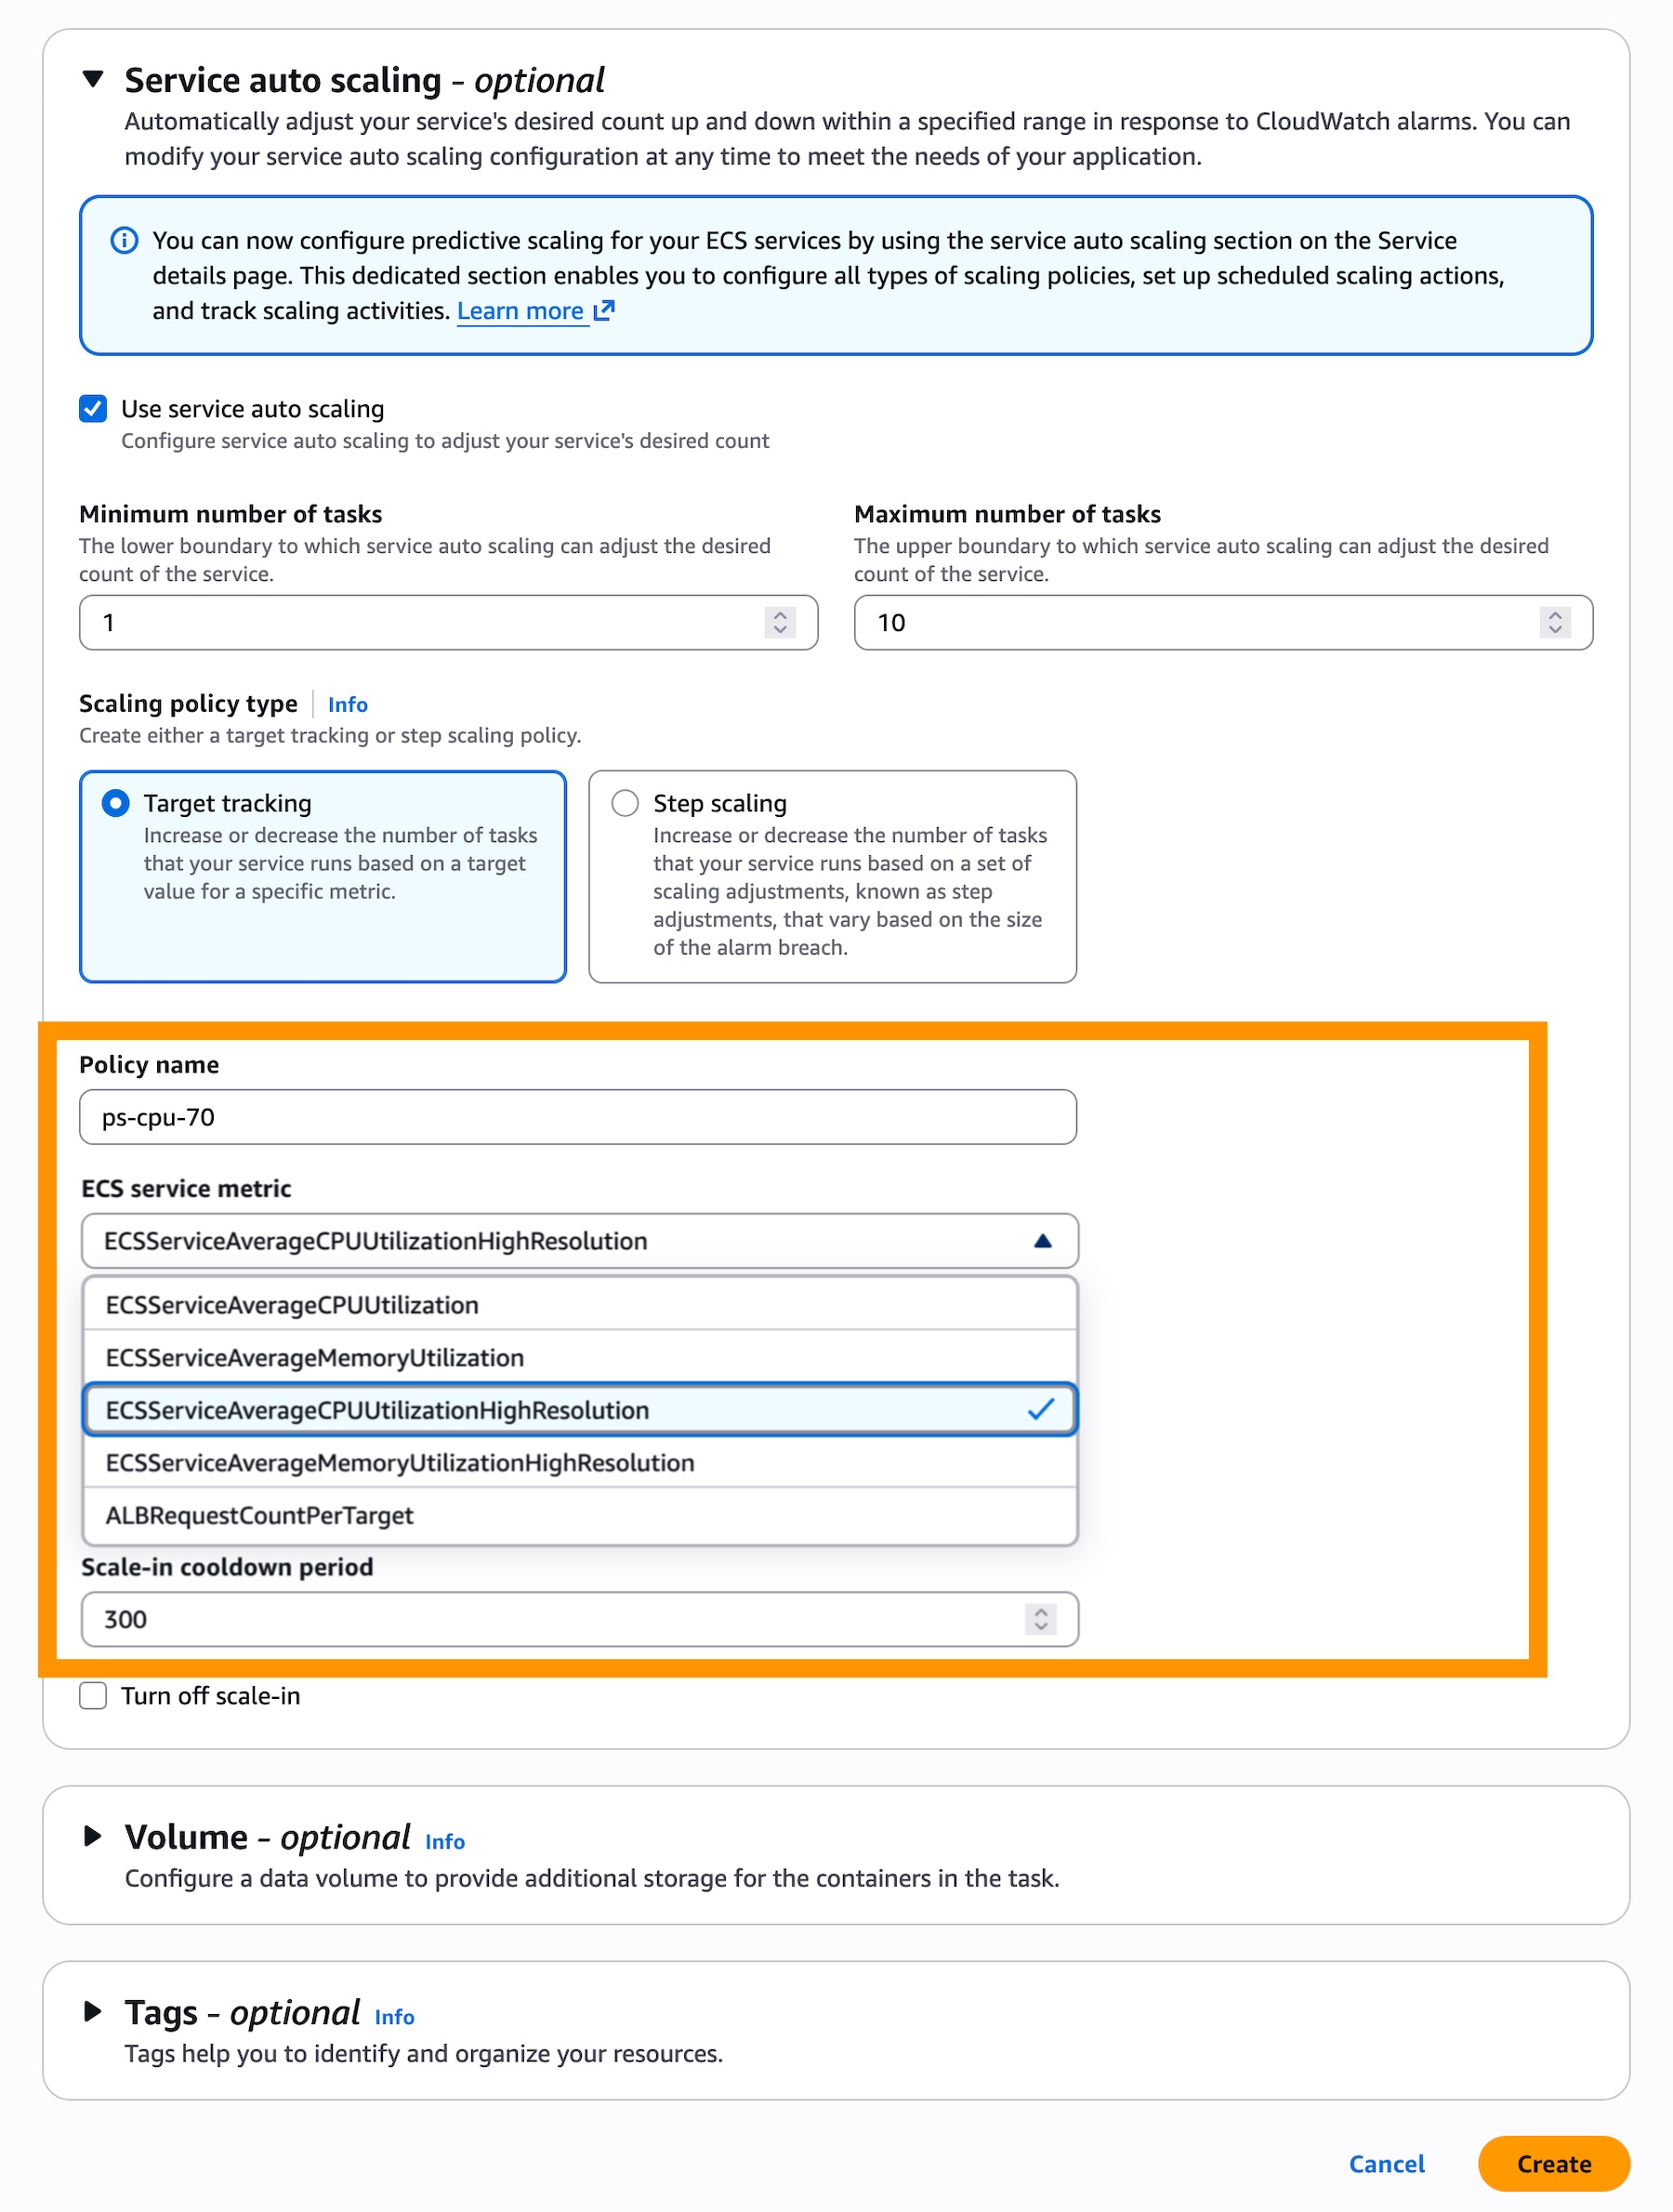
That’s it – your ECS service will use high resolution metrics for auto scaling.
To update an existing ECS service to use faster auto scaling, you first need to configure high resolution metrics via Update Service. Once deployment completes, your service will generate high-resolution metrics. You can then go to the Service and auto scaling tab from your service details to update scaling policy to use higher resolution metrics.
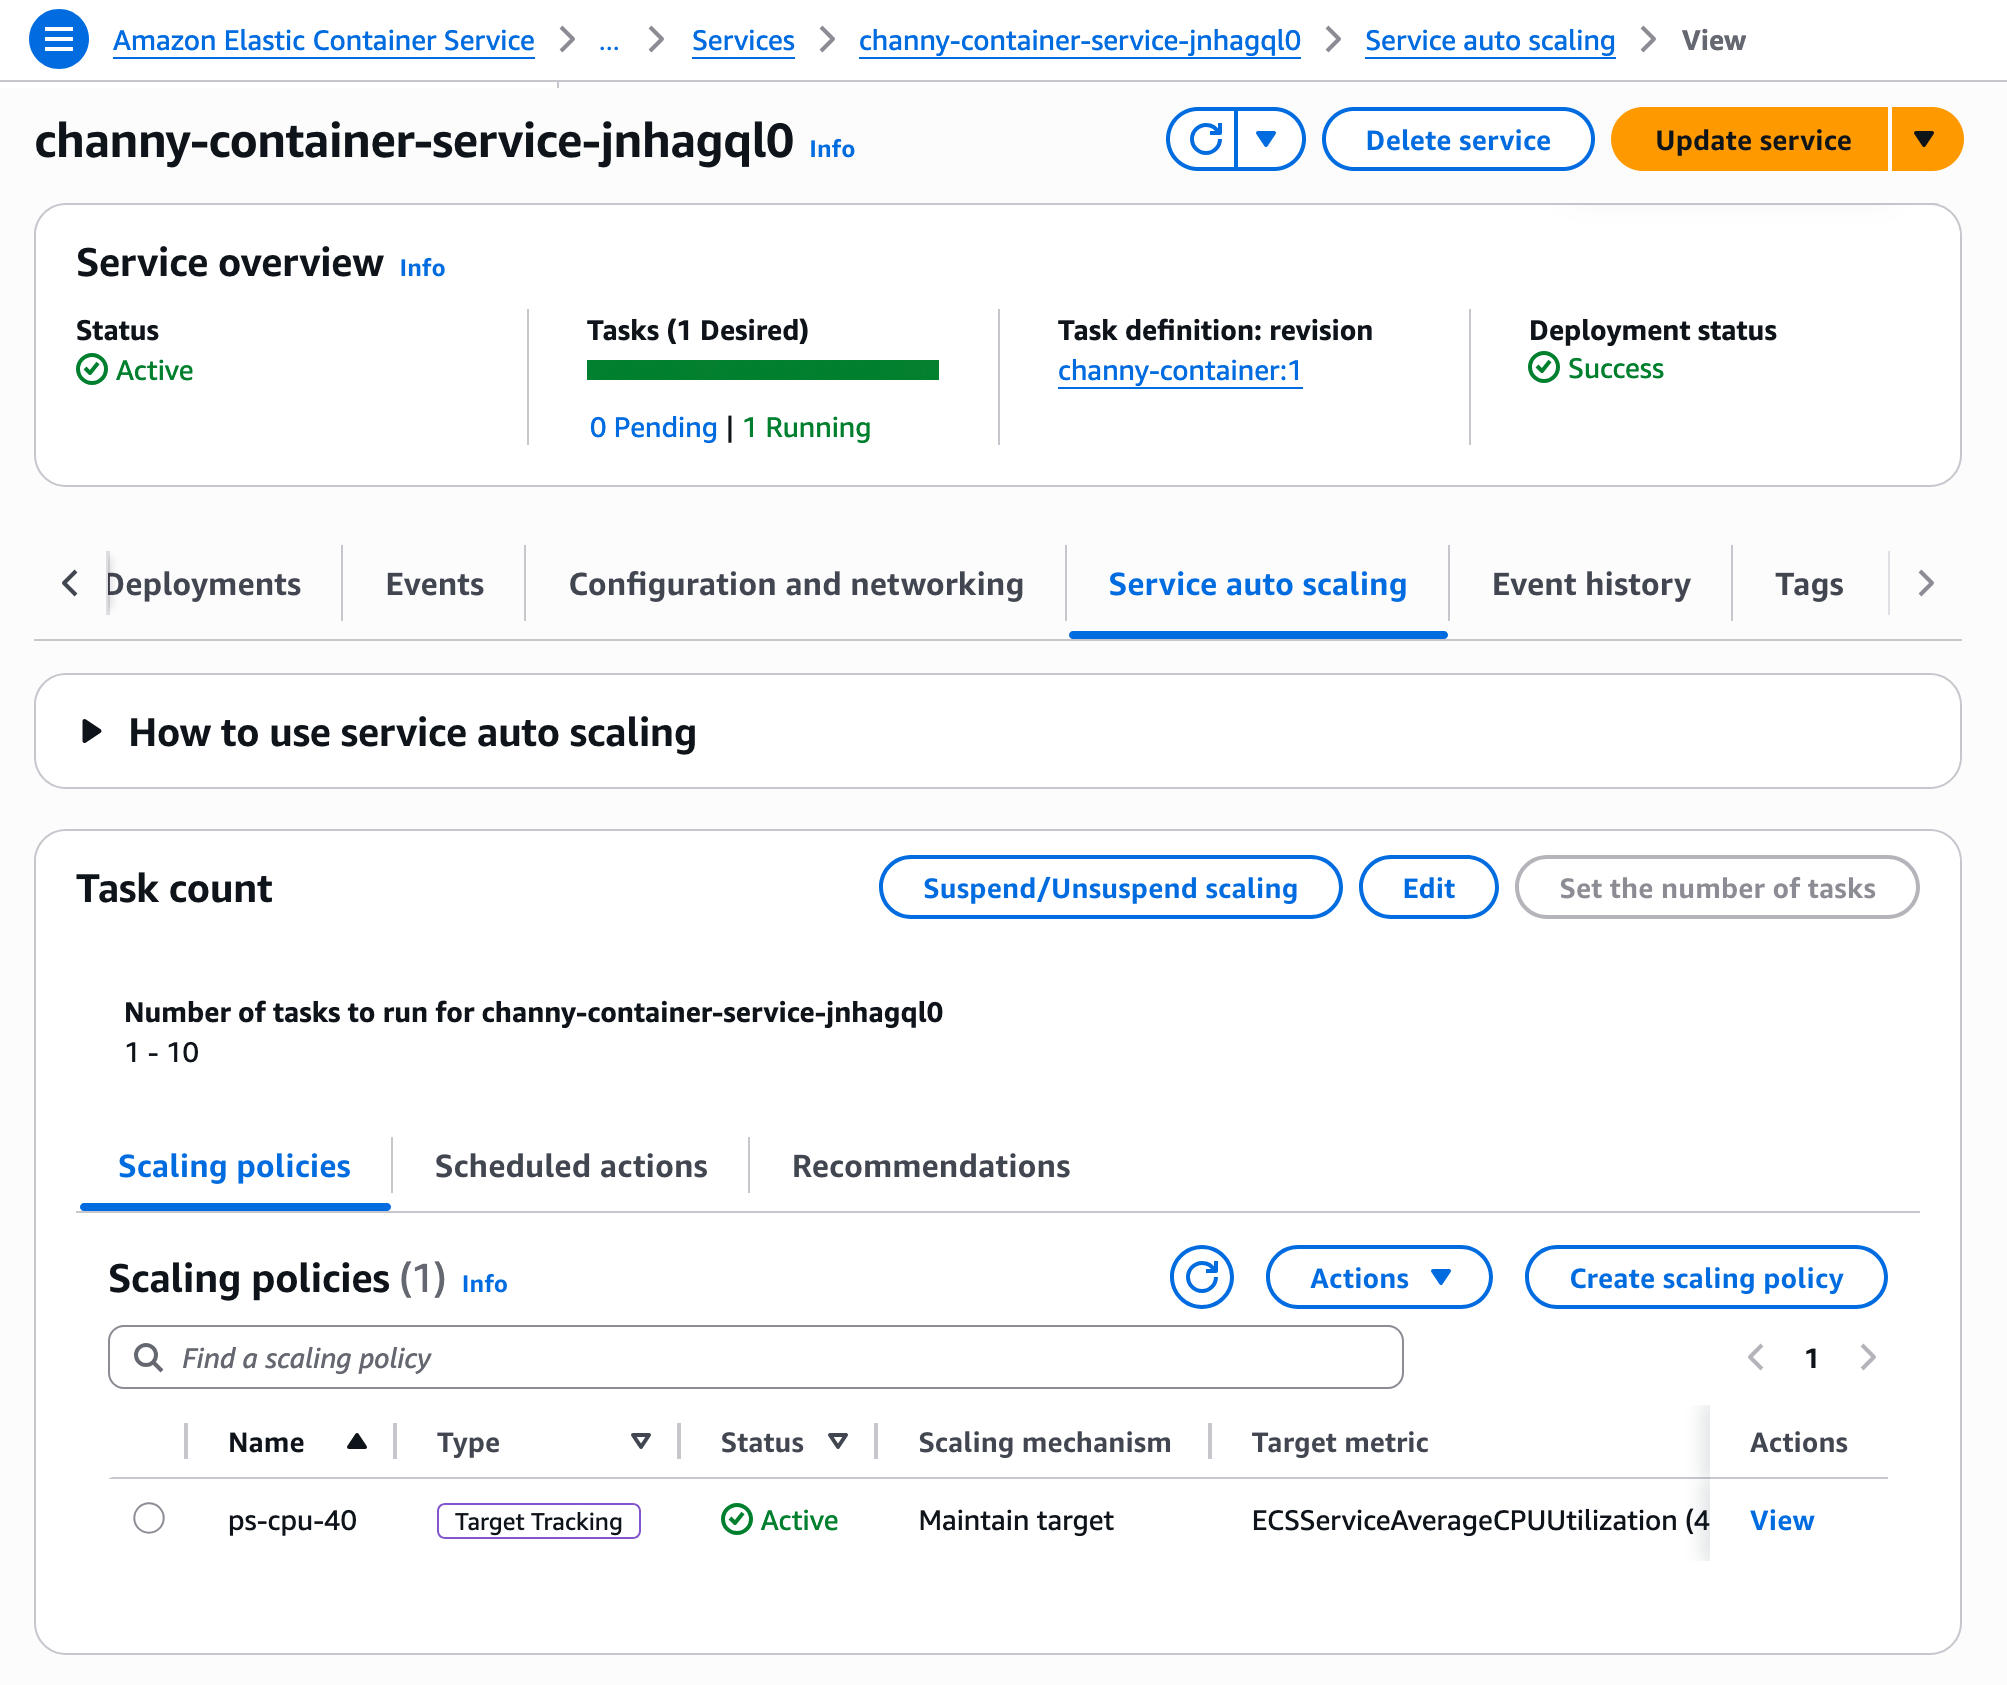
That’s all you need. Your ECS service now evaluates scaling decisions at 20-second intervals.
You can also use the AWS Command Line Interface (AWS CLI) to enable new metrics in your ECS service through Application Auto Scaling. To learn more, visit the faster auto scaling documentation.
Now available
Faster service autoscaling with high-resolution metrics for Amazon ECS is available today. The feature itself has no additional cost, but high-resolution CloudWatch metrics introduce a new pricing dimension. For details, see the CloudWatch pricing page.
Give it a try today and send feedback to AWS re:Post for ECS or through your usual AWS Support contacts.
— Channy
This is the New Intel E835 NIC Lineup from HPE Discover 2026
Post Syndicated from Patrick Kennedy original https://www.servethehome.com/this-is-the-new-intel-e835-nic-lineup-from-hpe-discover-2026/
At HPE Discover 2026, we saw the new Intel E835 cards for lower-power and lower-cost 25GbE to 200GbE networking
The post This is the New Intel E835 NIC Lineup from HPE Discover 2026 appeared first on ServeTheHome.
Accelerate security investigations with Kiro CLI
Post Syndicated from Sibasankar Behera original https://aws.amazon.com/blogs/security/accelerate-security-investigations-with-kiro-cli/
When a security event occurs in your Amazon Web Services (AWS) environment, rapid response is critical. However security teams often struggle with time-consuming, manual processes that slow down investigations. Analysts must recall complex AWS Command Line Interface (AWS CLI) syntax for multiple services, manually correlate findings across Amazon GuardDuty, AWS CloudTrail, and other security tools, and document every investigation step for compliance requirements. They make critical decisions under pressure while active threats continue. For analysts without deep AWS expertise, these challenges are even more pronounced, creating bottlenecks in your security operations.
Kiro is an AI-powered coding assistant that helps users write, understand, and optimize code through integrated development environment (IDE) and command line integrations. Beyond traditional development tasks, it offers AWS-specific expertise including architecture guidance, best practices, cost optimization recommendations, and service documentation navigation. Kiro CLI puts Kiro’s full capabilities in your terminal, making it a natural fit for security operations workflows. For example, with built-in tools, Kiro CLI can be used to help with investigation of a GuardDuty finding—it will propose the appropriate AWS CLI commands, explain what each command does, and wait for your approval before executing. This approach lets you focus on analyzing threats rather than figuring out how to investigate them.
This blog post demonstrates how to use Kiro CLI to conduct a security investigation following the AWS Security Incident Response Guide framework. This framework organizes incident response into five phases:
- Preparation: Having the right tools and processes in place before an incident occurs
- Detection and analysis: Identifying security events and understanding their scope
- Containment: Limiting the impact of an incident and preventing further damage
- Eradication and recovery: Removing threats and restoring normal operations
- Post-incident activity: Learning from incidents to improve future response
You’ll see how you can use Kiro CLI to triage GuardDuty findings, assess impacted Amazon Elastic Compute Cloud (Amazon EC2) resources, analyze AWS CloudTrail logs, and generate remediation scripts. By the end of this post, you’ll learn how to use Kiro CLI to run security investigations in minutes rather than hours — without skipping steps.
Prerequisites
Before getting started, confirm you have the following:
- Install Kiro CLI (available for macOS, Linux and Windows)
- Kiro access, either:
- Create a free AWS Builder ID account
- Use your organization’s Kiro Pro subscription
- AWS CLI: Configure using one of the methods in Configuring settings for the AWS CLI. Kiro CLI uses the default AWS CLI profile (or the profile specified by the
AWS_PROFILEenvironment variable) to interact with AWS resources and will request your approval before executing any actions.
Solution overview
To show Kiro CLI in action, we investigate a GuardDuty finding end to end — following the AWS Security Incident Response Guide framework through the following steps.
- Discovery: Retrieve and analyze a high-severity GuardDuty finding
- Resource analysis: Examine EC2 instance configuration, security groups, and AWS Identity and Access Management (IAM) permissions
- Containment: Isolate the compromised instance and revoke excessive permissions
- Evidence preservation: Create forensic snapshots using Amazon Elastic Block Store (Amazon EBS) snapshots
- Scope assessment: Analyze CloudTrail logs to determine event scope
- Proactive defense: Establish automated alerting using Amazon Simple Notification Service (Amazon SNS) and Amazon EventBridge
- Knowledge capture: Create reusable investigation workflows through steering files
Throughout this investigation, Kiro CLI will propose commands, explain their purpose, wait for approval, and automatically document findings—transforming an inefficient manual process into a guided, efficient workflow.
Kiro CLI combines AI reasoning with deep AWS knowledge to analyze security findings, correlate evidence across services, and propose appropriate AWS CLI commands at each step of an investigation. While this AI-powered approach accelerates investigations, it’s important to validate outputs and recommendations before taking action. The specific commands and analysis shown in this walkthrough are examples—your results will vary based on your specific findings and environment configuration.
The investigation: From alert to resolution
In this section, we walk you through the phases of an investigation, from discovery through analysis.
Discovery: A high-severity GuardDuty finding
Our investigation began with a GuardDuty finding requiring immediate attention. Rather than manually constructing AWS CLI commands, we used Kiro CLI’s natural language interface:
This single prompt establishes the entire investigation framework, as shown in Figure 1. By requesting step-by-step approval, we maintain control while benefiting from AI guidance. The documentation requirement helps ensure that we’re building an audit trail in real-time for compliance requirements.
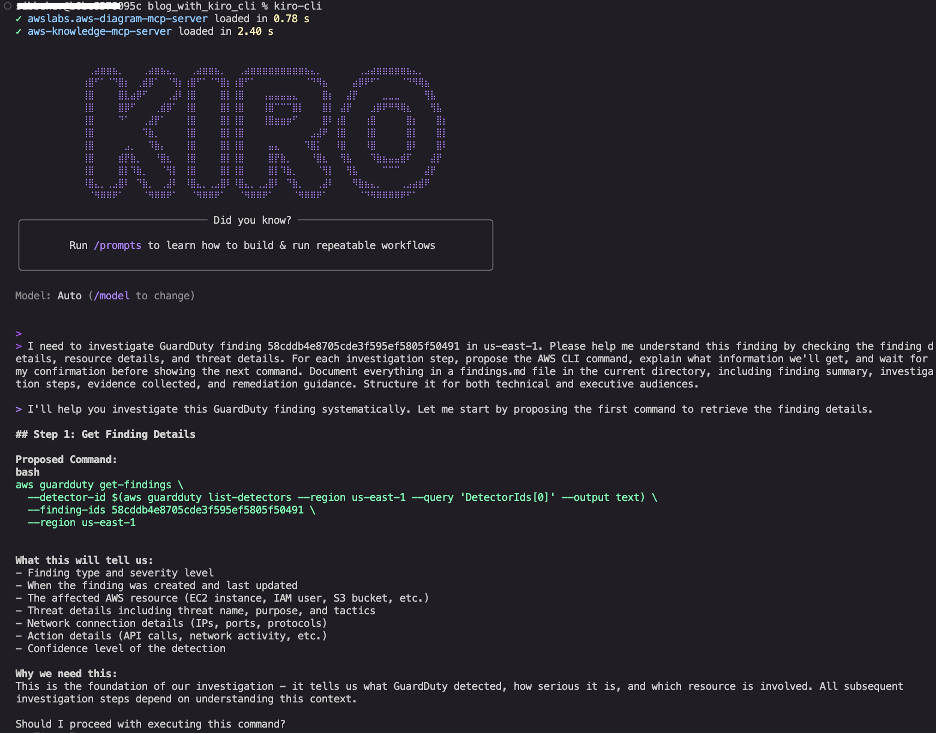
Figure 1: Kiro CLI interface showing the initial investigation prompt and proposed first command to retrieve GuardDuty detector ID and finding details
Kiro CLI proposed retrieving the detector ID and complete finding details. After approval, it executed the commands and revealed critical information, as shown in Figure 2.Key findings:
- Type: CryptoCurrency:EC2/BitcoinTool.B!DNS
- Severity: HIGH (8.0)
- Instance: i-05447e6dacd0a7e7e (m5.xlarge)
- Threat: 617 DNS queries to pool.minergate.com
- Timeline: Started 9 minutes after instance launch
We can see that it took 9 minutes from instance launch to mining activity, which suggests automated event rather than manual action. This timeline information, automatically extracted and highlighted by Kiro CLI, helps security teams understand event patterns.
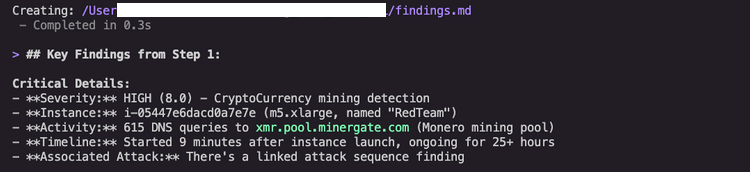
Figure 2: GuardDuty finding details showing HIGH severity cryptocurrency mining detection with threat indicators and timeline
Resource and scope analysis
Kiro CLI proposed investigating the EC2 instance configuration, security groups, IAM permissions, and checking for additional findings. This proactive suggestion demonstrates Kiro CLI’s understanding of security investigation workflows, it knows that understanding the potential impact requires examining not just what the unauthorized user did, but what might possibly be a next step in a typical threat scenario.
The following information is also shown in Figure 3.
Instance configuration: Kiro CLI retrieved the instance details, revealing:
- Amazon Linux 2023 AMI
- Instance Metadata Service version 2 (IMDSv2) required (good security posture)
- Public IP address with unrestricted outbound access
- IAM instance profile attached
Security group assessment: Kiro CLI analyzed the security group rules and identified:
- No inbound rules
- Unrestricted outbound access to 0.0.0.0/0, enabling mining traffic
IAM permission analysis: Kiro CLI examined the instance profile and attached role policies, uncovering a critical security risk:
- Critical finding: AdministratorAccess policy attached to the EC2 instance profile
- Full AWS account access from compromised instance
- Potential for complete account takeover
While the observed activity is cryptocurrency mining, the attached AdministratorAccess policy means the unauthorized user could have exfiltrated data, created backdoors, or compromised other resources. This highlights why least-privilege IAM policies are critical. Even if an instance is compromised, limited permissions help reduce the potential impact.
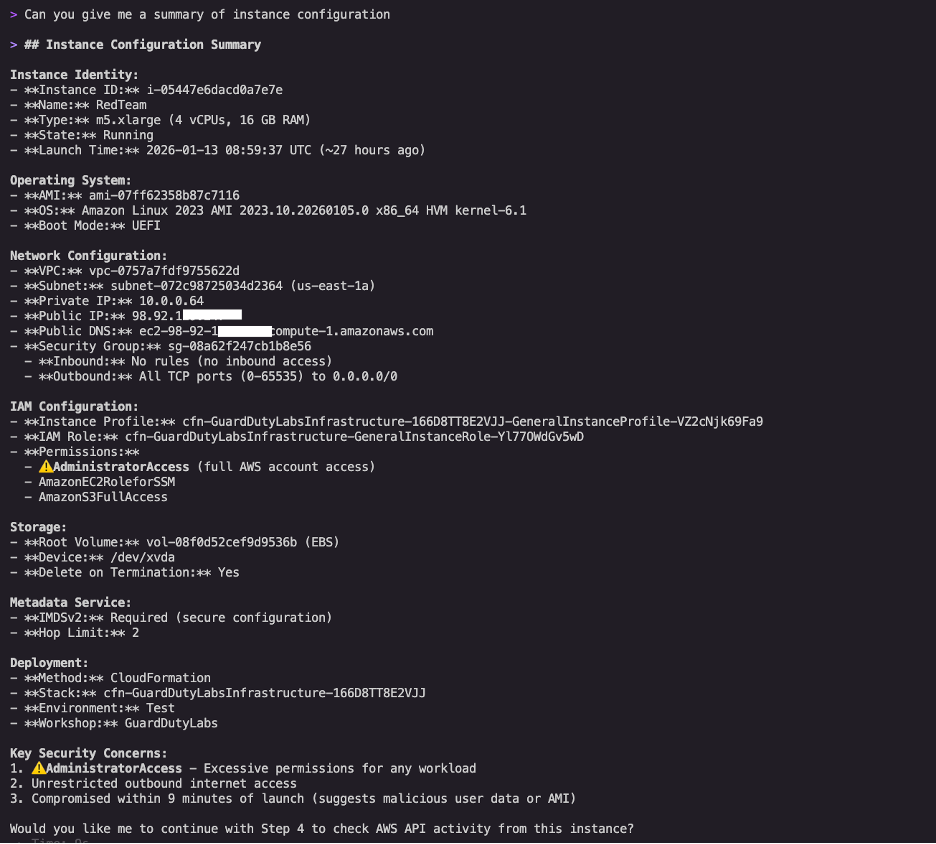
Figure 3: Kiro CLI’s instance configuration summary highlighting the AdministratorAccess policy, unrestricted outbound access, and multiple concurrent security findings
Scope assessment: Kiro CLI checked for additional unexpected activity and discovered seven security findings on this single instance, indicating a multi-vector attack, as shown in Figure 4.
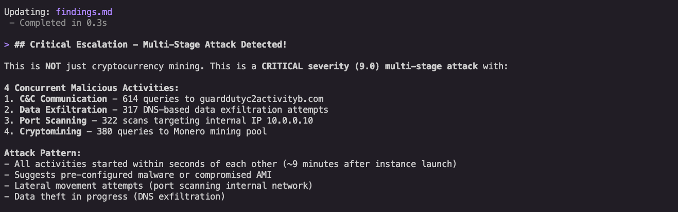
Figure 4: Kiro CLI’s summary highlighting a multi-vector attack.
Containment actions
Kiro CLI proposed a systematic remediation plan aligned with the knowledge obtained by following AWS Security Incident Response Guide’s containment strategy, as shown in Figure 5.
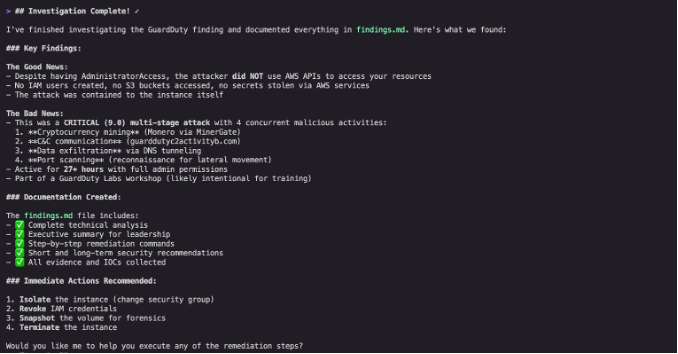
Figure 5: Kiro CLI’s summary of the investigation and recommendations for immediate actions.
Instance isolation: Kiro CLI produced commands to create an isolation security group with no inbound or outbound rules (as shown in Figure 6), then applied it to the compromised instance. This containment step stops new connections without destroying evidence. However, it’s important to understand that security groups are stateful and use connection tracking. When you change security group rules, existing connections aren’t immediately interrupted and continue to allow packets until they time out.
This means that if an unauthorized user has an active connection to the instance, that connection might persist temporarily even after applying the isolation security group. For immediate interruption of all traffic including active connections, consider also implementing network access control lists (NACLs), which are stateless and don’t track connection state. Unlike security groups, NACLs can immediately break existing connections when rules are applied. While NACLs operate at the subnet level (broader scope than instance-level security groups), they provide an additional layer of defense that helps ensure network isolation.
This scenario illustrates an important principle: while AI-powered tools such as Kiro CLI can help you respond more quickly by generating appropriate commands, it’s critical to keep a human in the loop who understands these nuances. Kiro CLI might not have complete information about edge cases, so security professionals should validate recommendations and consider additional controls based on their expertise and the specific threat scenario.
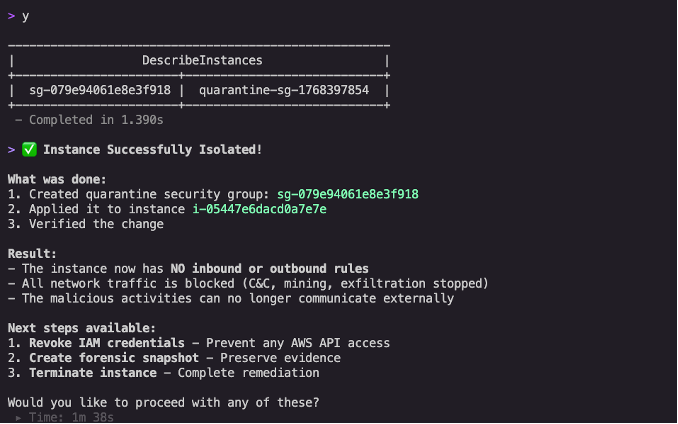
Figure 6: Instance successfully isolated with confirmation showing no inbound or outbound rules, blocking all network traffic including command-and-control (C&C) communications and mining activity
Privilege revocation: Kiro CLI generated commands to attach a deny-all policy to the compromised IAM role (as shown in Figure 7). The AI assistant explained that even though the AdministratorAccess policy remains attached, the deny-all policy takes precedence because of the evaluation logic used by IAM, where explicit denies always override any allows. This immediately revoked all permissions while preserving the original configuration for forensic analysis.
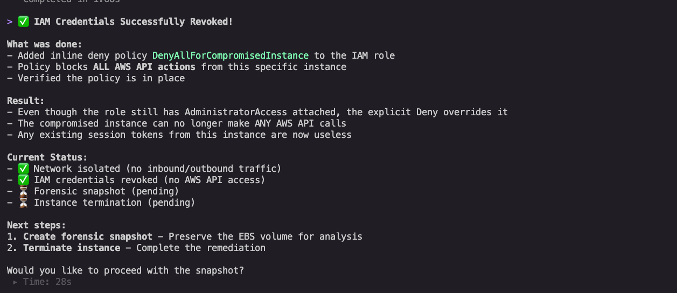
Figure 7: IAM credentials revocation confirmation with current status checklist showing network isolated, IAM credentials revoked, and forensic snapshot pending
Evidence preservation
Before making mutating changes, Kiro CLI recommended creating a forensic snapshot of the compromised instance’s Amazon EBS volume (as shown in figure 8). This step can be missed when teams are under pressure to contain an active threat, but it’s critical for post-incident analysis and potential legal proceedings.
Memory preservation decision: We chose to leave the instance running in its isolated state rather than stopping it immediately. Stopping an EC2 instance results in loss of volatile memory containing forensic evidence such as running processes, network connections, loaded malware, and encryption keys. By maintaining the instance in an isolated security group with all network access blocked, we neutralized the threat while preserving the ability to conduct deeper forensic investigation if needed.
Volatile memory often contains evidence that explains how an event occurred, malware binaries, decryption keys, or command-and-control (C&C) communications that disappear when an instance stops. This decision point illustrates the balance between immediate threat elimination and thorough investigation.
Capturing volatile memory requires specialized tools and techniques. For Linux instances, LiME (Linux Memory Extractor) can capture physical memory, while Windows instances can use tools like Winpmem. After being captured, memory dumps can be analyzed using Volatility, an open source memory forensics framework. Forensics tools should be pre-installed on your systems to avoid changes being made during the evidence gathering process. AWS provides guidance on automating forensic kernel module builds for Amazon Linux EC2 instances to streamline this process.
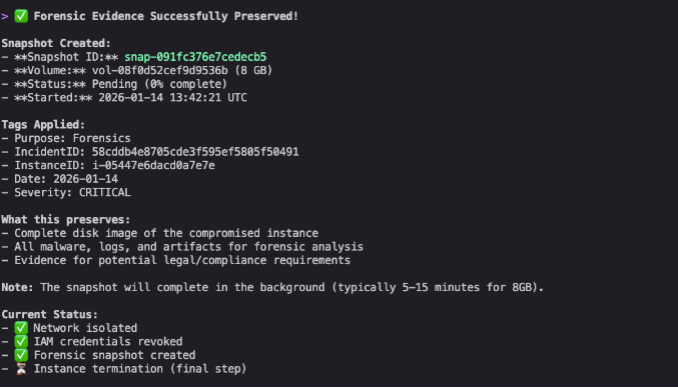
Figure 8: Forensic snapshot creation confirmation with proper tagging including purpose, incident ID, and severity for evidence preservation
CloudTrail analysis
To understand the full scope of compromise, we asked Kiro CLI to analyze CloudTrail logs. The AI assistant identified available CloudTrail trails and proposed queries to find any API calls made from the compromised instance using its temporary credentials (as shown in Figure 9).
CloudTrail analysis is often the most time-consuming part of incident investigation, requiring analysts to construct complex queries and correlate events across time. Kiro CLI automates this process, immediately identifying the relevant log sources and proposing appropriate queries.
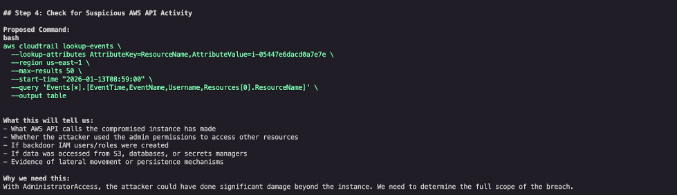
Figure 9: Kiro CLI identifying available CloudTrail trails and proposing targeted queries
Kiro CLI found no unexpected API calls originating from the instance credentials—no IAM users created, no S3 buckets accessed, and no secrets stolen. The event appeared limited to cryptocurrency mining activity conducted through DNS queries, with no evidence of data exfiltration or lateral movement.
Figure 10: Investigation results from Kiro CLI
This shows the value of thorough CloudTrail analysis: even when initial findings suggest a contained threat, confirming the absence of broader compromise is essential before closing an investigation.
Building proactive defenses
The AWS Security Incident Response Guide emphasizes that preparation is the foundation of effective incident response. With the immediate threat contained, we used Kiro CLI to strengthen our preparation phase by establishing automated alerting for future incidents.
As shown in Figure 11, we used natural language to request
Kiro CLI understood the requirement and proposed a multi-step solution involving Amazon SNS and EventBridge:
- Create an SNS topic for GuardDuty alerts
- Subscribe an email address to the topic
- Create an EventBridge rule to trigger on high-severity findings (severity greater than or equal to 7.0)
- Configure the SNS topic as the EventBridge target
- Grant EventBridge permissions to publish to the SNS topic
Building automated alerting requires understanding multiple AWS services, their interactions, and correct configuration syntax. Kiro CLI translates a straightforward natural language request into a complete, production-ready solution.
Auto-correction and testing: When setting up complex integrations, commands can fail because of permission issues, incorrect Amazon Resource Name (ARN) references, or malformed JSON policies. Kiro CLI automatically detects these failures and proposes corrected commands.
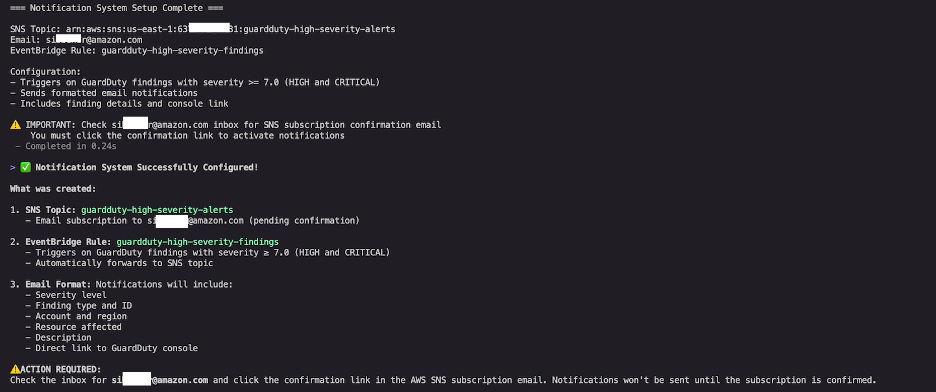
Figure 11: Notification system setup completion showing SNS topic created, EventBridge rule configured, and confirmation that notifications will trigger on HIGH and CRITICAL severity findings
You can also prompt Kiro CLI to test the setup: Test this notification system to verify it’s working correctly. Kiro CLI will verify that the SNS subscription is confirmed, check that the EventBridge rule is properly configured, validate IAM permissions, identify any misconfigurations, and publish a test event to verify end-to-end functionality. This intelligent error handling means security teams can confidently deploy automation without manual troubleshooting.
Creating reusable investigation workflows
With the immediate threat contained and proactive defenses in place, we then used Kiro CLI to create a reusable steering file that codifies this investigation workflow for future incidents. Steering files are Markdown files stored in .kiro/steering/ that act as persistent memory for Kiro CLI, helping security teams capture institutional knowledge and standardize response procedures. To share them across your team, add them to a Git repository or publish them to your documentation system like Confluence — the same places you’d keep any other runbook.
We recommend running the full investigation and generating the steering file in the same Kiro CLI session. This way, the steering file captures the exact steps, commands, and decisions from your investigation. Navigate the process the way that fits your organization — the steering file will reflect your workflow, not a generic template.
We asked Kiro CLI:
Kiro CLI generated a detailed steering file at .kiro/steering/guardduty-incident-response.md that includes:
- Investigation phases aligned with the AWS Security Incident Response Guide
- AWS CLI command patterns for GuardDuty, Amazon EC2, IAM, and CloudTrail
- Documentation requirements and approval gates
- Containment, eradication, and evidence preservation procedures
This is the example steering file that was created by Kiro cli:
Traditional incident response playbooks are static documents that quickly become outdated. Kiro CLI steering files are executable playbooks that guide AI-assisted investigations with consistency while remaining flexible enough to adapt to specific scenarios. Steering files stay current because updating them is part of the workflow, not a separate task. When you adjust your investigation process, ask Kiro CLI to update the steering file at the end of the session. It captures your changes, and you share the updated version with the team through Git or Confluence — everyone works from the latest version.
Conclusion
Security incidents require accurate and rapid response, but traditional investigation workflows create bottlenecks that extend mean time to respond (MTTR). By following the framework provided by the AWS Security Incident Response Guide and using Kiro CLI’s AI-powered capabilities, you can transform incident response from reactive to proactive, well-documented operations.
In this post, we demonstrated how Kiro CLI accelerates each phase of the incident response lifecycle—from initial detection and analysis through containment, eradication, and recovery. You learned how to use natural language prompts to investigate GuardDuty findings, analyze compromised resources, implement containment measures, preserve forensic evidence, and establish automated alerting for future incidents. The steering file capability helps your team embed hard-won expertise in reusable workflows that benefit analysts at all skill levels.
Whether you’re investigating alerts, building defenses, or documenting procedures, Kiro CLI provides the expertise and automation to respond faster, learn continuously, build better defenses, and document thoroughly. When commands fail or configurations are wrong, Kiro CLI identifies the issue and corrects it, reducing time spent troubleshooting.
If you have feedback about this post, submit comments in the Comments section below.
Atlantic Reads: The Housewives Underground with Kaitlyn Tiffany
Post Syndicated from The Atlantic original https://www.youtube.com/watch?v=rweZ0dylUJU
Build your own vulnerability harness
Post Syndicated from Dan Jones original https://blog.cloudflare.com/build-your-own-vulnerability-harness/
A few weeks ago, we published our initial findings from Project Glasswing, looking at what happens when you point frontier security models at an enterprise codebase. We also explored how our defensive structures adapt to protect our infrastructure and customers from threats posed by frontier AI. Since then, the AI ecosystem has continued to shift rapidly — developers who’ve built tightly around a single model have already experienced what happens when that model is no longer available or gets superseded by a more capable one. These market shifts only reinforce our core thesis: no matter which underlying model is leading the pack on any given day, the future of agentic workflows will not be found in standalone models, prompts, or single-agent sessions.
Moving from a localized security “skill” to a continuous, fleet-wide scanning pipeline requires an architecture where models are treated as interchangeable components. Relying on a single model inherently limits defensive coverage, as the same system will tend to look at code paths through the exact same lens. To counter this, models should be frequently interchanged and cross-tested. By varying the models across the pipeline — such as using one model for initial discovery and an entirely different one for validation — we can ensure that vulnerabilities are cross-checked by distinct sets of logic. Furthermore, a true enterprise-scale harness must look beyond isolated repositories to trace vulnerabilities across cross-repo dependencies, ultimately filtering thousands of raw candidates down to a trusted, triaged queue of actionable fixes.
This post serves as a practical look at how to build that model-agnostic layer, focusing on how we manage state controls, eliminate false positives, and coordinate end-to-end triage at scale.
The first post made the case for why generic coding agents can’t do this job. The main issue is that agents only hold one hypothesis at a time, fill their context window after covering a sliver of a real repo, and then lose information during context compaction. For more details, read that post.
Before we move forward, we would like to answer two likely questions.
“Why not use subagents instead of a harness?” Subagents are useful, and they are a good starting point. But security analysis needs hundreds of separate investigations that survive across runs, don’t share a context window, and can be re-scoped and cross-referenced later. It needs persistence, deduplication, resumability, and eventually fleet-wide dependency tracing. That’s an orchestration problem, and a prompt can’t get you there.
“Is this blog post just an ad for frontier models?” No. Our approach centers on the harness, not the model. When it comes to vulnerability discovery, we run it with whatever frontier model is currently best at what we need. When we point different models at the same target, they each turn up a different share of the bugs. The harness is the bit that lasts. If you build your own system, design it to be model-agnostic from day one. This will allow you the freedom to use any model of choice without constraints.
We started with a ~450-line security-audit skill that we ran on a single repository, and adjusted the prompts until we surfaced real bugs. Later, we added the orchestration that became the plumbing of the entire system. The real value lives in the prompts themselves, and our prompts continue to carry the initial skill’s attacker scenarios, bug classes, and anti-pattern detections nearly unchanged.
The skill was written to run a 7-phase audit in one session:
-
Three parallel research agents do recon and write an
architecture.md. -
One Hunter agent runs per class attack, trying to break the code rather than review it.
-
Adversarial validators try to disprove each finding.
-
The survivors are written up as a human-readable vulnerability report.
-
They’re also emitted as
findings.jsonagainst a schema, and a mechanical check validates that file. -
Finally, a fresh agent independently re-verifies every finding against the source.
-
The surviving, re-verified findings are submitted to the ingest API.
That first skill maps almost directly onto the later harness:
|
Skill phase |
Harness stage |
|---|---|
|
Recon agents write |
Recon |
|
Hunters run per attack class |
Hunt |
|
Validators disprove findings |
Validate |
|
Surviving findings become a report |
Report |
|
|
Mechanical validation of line numbers and functions in findings |
|
Fresh agent re-verifies findings |
Independent validation |
The skill worked, but it quickly revealed its limits. Looking at the coverage metrics, a single run finds only about half the bugs you’d catch across multiple runs. In our experience the ones it did find skewed toward the simpler and less subtle. Once your process is basically “run it ten times and diff by hand,” you probably need to start looking at a real harness.
While running and fine-tuning the skill, we ran into three walls:
-
Context exhaustion: An hour in, the context window fills up and the model will cannibalize its own memory, instantly forgetting the bugs it spent all morning tracking down. We broke this bottleneck by externalizing the state entirely, treating the LLM as a stateless compute engine.
-
Persistence: A crash mid-run means starting over. Losing hours of work to one AI rate-limit error or connection flakiness is an incredibly expensive way to realize you need a better architecture.
-
Cross-repo reasoning: A single repo session is completely blind to the relationships between applications that consume it, and the number of bugs that surface when you inspect the interface between components is probably more than one might expect.
ADVICE: A real but minimal harness consists of just Recon, Hunt, and Validate stages kept in a database, alongside a separate Validator that can’t file its own findings. You should skip cross-repo tracing entirely until you have more than one repository that matters. Skip a dedicated Deduplication agent until you are actively drowning in noise. Start with a skill in your development environment, get your prompts working well, and only build the next architectural stage when not having it is the specific thing slowing you down.
Most AI security write-ups in this space are about a single repo or a curated benchmark; running a whole fleet this way, with cross-repo tracing, isn’t something we’ve seen written up elsewhere. Our codebase spans a massive mix of languages — Rust, Go, C, Lua, TypeScript and Python, alongside various configuration management systems, static configs, and all sorts of additional context. So we had to come up with something new that worked for us. Going from that first slash-command run to a fleet scanner that could cover 128 distinct repos, automatically finding and interrogating relevant dependencies, took about six weeks. Codification was mostly mechanical: we lifted each phase of the skill into its own agent, put a database behind it and an orchestrator in front. The mapping was almost one-to-one.
The entire fleet runs on one unified harness with no per-language tuning and traces the dependencies between repos. While offloading syntax to a model makes the system language-agnostic, the differentiator is its ability to trace dependencies between repos. The harness itself doesn’t care if it’s looking at C pointers or a TypeScript file; it focuses on the higher-level logic of security orchestration. This allows us to scale across hundreds of different codebases, without having to write custom language parsing.
Our entire vulnerability research workflow is built on a two-stage operational framework: the Vulnerability Discovery Harness (VDH) and the Vulnerability Validation System (VVS).
The VDH functions as our discovery engine, proactively scanning codebases to surface potential security issues. Once bugs enter the VVS, which allows multiple harnesses to feed into it, they go through stages of Deduplication, Judgment, and finally Fixing, as we’ll talk about later.
We use one model for VDH, but we use a completely different model for VVS, so the models are effectively double-checking each other. There is an obvious security benefit to this: by forcing Model B (VVS) to judge the output of Model A (VDH), you ensure that the finding is evaluated by an entirely different set of logical weights and training data — one that acts as an unbiased, adversarial third party whose sole job is to ruthlessly stress-test Model A’s assumptions. And operationally, we benefit from treating model providers like interchangeable commodities. Model providers can change temperature, caching, and inference effort budgets over time, even within one model version. Instead of building a system that depends on a model behaving predictably over time, our harness is built to absorb downstream volatility without breaking.
The first post covered what each agent/stage is for, so we’ll talk about the parts it didn’t: the glue between stages, and the handful of details that decide whether any of it works.
|
Agent/stage |
Primary Role |
Sub-agents / Tooling |
|---|---|---|
|
Recon |
Maps out the target architecture and maps potential threat vectors |
3 parallel Recon sub-agents write |
|
Hunt |
Runs per-class attacks, compiles fragments, probes binaries |
It spawns siblings (these handle between 9% and 20% of fleet-wide tasks depending on the model). It reaches out to and writes to the Wishlist tool. |
|
Validate |
Mechanically checks the finding, then adversarially disproves it |
Runs in two passes: plain code handles the initial schema/path checks, then a single isolated agent tries to disprove the finding before it can be filed. |
|
Gapfill |
Generates new hunt tasks for empty coverage cells |
Enqueues fresh hunt tasks for any under-tested (area × attack-class) cells that still look thin |
|
Dedup |
Identifies and consolidates overlapping findings |
Combines deterministic code and agents to cluster findings by root cause, folding them together in real time |
|
Trace |
Walks dependency graph; spawns consumer-repo tasks |
Walks the graph to add hunt tasks inside every identified consumer repo to make sure cross-repo bugs are caught |
|
Feedback |
Learns from pre-existing reports and optimizes future runs |
Takes validation failures, shallow runs, and repeated misses, and instantly rewrites queued prompts to make future tasks sharper. |
|
Report |
Renders human-readable report |
Just a script, no model required |
Table 1: Vulnerability Discovery Harness (VDH)
Stages four through eight run as a continuous producer-consumer loop. As the initial hunt progresses, the Gapfill, Feedback and Trace agents generate new tasks; Dedup folds overlapping findings back together and the rest of the loop keeps consuming the queue. This ensures a vulnerability discovered late in the cycle is still validated, reported and checked against other code to make sure it doesn’t contain the same bug, all within the same run.
Splitting the pipeline this way guarantees strict context controls. If you fill the context window, the model starts hallucinating. We keep each agent’s job hyper-focused, keeping context usage below 25% of the total window. A naive “read all files” approach will blow past this limit every single time.
One thing that caught us out was that persistence needs to be factored in before parallelism. You do not want to throw away a five-hour run because of an unforeseen error. Every stage writes to one SQLite database keyed by (run_id, repo, stage). Any stage can resume, retry, or get pulled into a later run without redoing work. Findings are streamed and saved as they happen, so a crash costs you the task in flight and nothing else.
ADVICE: Sometimes a transient API error comes back as text in the (200 OK) response stream instead of throwing a code exception. To the orchestrator, this looks exactly like a task that finished cleanly. You must explicitly classify the response text, not just trust the exception type, or you end up logging empty runs as successes.
During the Recon stage, the agent writes the threat model instead of being handed one. Beyond about ten built-in attack classes (many forms of injection, memory corruption, protocol parsing, timing side channels, and others), the Recon agent can invent repo-specific classes on the spot, each with its own methodology. It writes a custom taxonomy tailored specifically to that codebase, which is used to more tightly scope the Hunter agents.
Reading source code isn’t enough to understand how it behaves under stress, especially for subtle undefined-behavior bugs in C and other lower-level languages. The Hunter agents move past code reading and transition into active execution. They compile fragments, build small versions, and attack them. The biggest jump in quality came from giving Hunters a sandbox (built on unshare) to crash binaries.
ADVICE: If the harness itself runs inside Docker, that sandbox needs seccomp=unconfined and apparmor=unconfined or it will silently fail to start. It’s a one-line fix that saves you a day of head-scratching if you aren’t an expert in nested containerization, like us.
Beyond the core pipeline stages, we added two specialized mechanisms that grant the Hunters significant autonomy to adapt their focus and request external resources without derailing an ongoing analysis:
Sibling Forking: This helps ensure that if a Hunter agent trips over an interesting code path that is outside the current scope, it doesn’t wander off track. It uses a tool call to fork a sibling agent with a precise structural seed. Fleet-wide, this accounts for roughly 9% of tasks, though the rate is highly model-dependent — from near-zero to about a fifth, depending on which model is hunting.
The Wishlist: When an agent needs a tool it doesn’t have, often a Validator confirming a Proof of Concept (PoC) or a Hunter wanting to build something (like a specific build environment, a VM, or some prod config files), it writes to a central wishlist. It provides enough context for the system to automatically re-run that exact task once a human provides the dependency. Some of these can be partly self-healing: if the container needs to be rebuilt with some changes, this can autonomously happen after the run by having a generic coding harness monitor the logs.
The wishlist has been written to 25,472 times across 128 repos since the wishlist was added, and it’s the main way the agents talk back to us. One that landed while we were writing this: “I need a FreeBSD VM to confirm this PoC end-to-end.“
After the initial cleanup, a Tracer agent checks how different software components are connected. It looks for a specific path: can a potential attacker send harmful input from the outside to a vulnerable part of the system? If the answer is yes, the Tracer agent automatically spawns fresh hunt tasks inside the consumer repository. To make this work, you need a unified, cross-repo symbol index and an accurate dependency graph. This allows you to uncover deep, systemic flaws that a standard single-repo scan would miss.
Running our harness across an entire fleet of repos revealed two lessons that only surfaced when this was done at scale.
First, deduplication is its own problem, big enough to need its own agents. When you are scanning a handful of repositories, you can manually eyeball overlapping bugs. Simple string matching or file-path checks won’t save you here. Determining whether two complex logic flaws are actually the exact same root bug sounds trivial, but it isn’t. It requires so much cognitive reasoning that we had to deploy dedicated Dedup agents just to clean up the noise, along with their own heuristics and ways of reducing the work.
The second is to not wire in static analysis early. We plumbed Semgrep all the way through, and the Hunters invoked it zero times in a month of runs. They would rather read and run the code. The wishlist, by contrast, was the single most-used tool in the system. It’s worth paying attention to what the agents actually reach for, rather than what you think they’ll want.
The agent will edit the source code so its own exploit works, then triumphantly report the bug it just created. It will write a test that proves something entirely tautological like “exec() executes things, therefore critical vulnerability”. Or it builds an exploit that runs fine but proves nothing, because the threat model behind it is nonsense. If your harness doesn’t actively fight this, all you’ve built is a faster way to produce junk.
A Hunter has to state the threat model before it’s allowed to file anything. It has to define exactly who the attacker is, and what boundary the vulnerability crosses or what assumption it breaks. The output schema ordering enforces it. This requirement eliminates the vacuous findings, the “if a user has database write access, they can write to the database” kind.
Every confirmed finding ships with a PoC written as a test that runs against the original, untouched codebase. This prevents the agent from editing the source files to force an exploit to land. If there is no working PoC, we treat the finding as fake. In practice, that’s a Hunter compiling a thirty-line parsing loop, running it with memory protection enabled, and demonstrating that the incorrect read stride is originating from a stack address rather than the expected message body. You can re-run it yourself. Furthermore, every confirmed finding must also ship a proposed patch. What actually reaches our review queue is a verified bug, a working test, and a functional git diff, not just a vague text description of a problem.
Before an exploit path survives, deterministic code (written in plain code, not another model) mechanically verifies that the cited files and paths actually exist, and confirms that both the patch and the test parse correctly. This Validator cannot log findings of its own; its sole job is to aggressively disprove the Hunter‘s theory. If a Hunter is allowed to grade its own homework, it will confidently validate everything it outputs.
We don’t claim a false-negative rate for our system. There’s no labeled set of every real bug in a codebase, so any claimed recall number is entirely speculative. What we can watch is whether re-runs keep turning up new bugs (they do) and whether coverage is still growing across runs. It’s all a proxy, as you don’t know for sure how many bugs exist in a single codebase, but it’s a good-enough way of measuring effectiveness.
A finding coming out of the harness is just the start of the triage process, with all discoveries landing in a single, shared VVS that currently holds 13,841 findings across 145 repos in total. Triaging that volume is its own massive engineering problem, and it matters just as much as the hunting. That triage engine runs on a different model from the harness, broken down into three distinct jobs.
|
Agent/stage |
Primary role |
Spawns/ sub-agents/tooling |
|---|---|---|
|
Dedup |
Identifies if a vulnerability is already in the system, or raised as internal Jira ticket already |
Deterministic: plain code builds inverted indexes over files, functions, trust boundaries, and rare tokens, then hands each finding a short candidate list Probabilistic: Dedup agent reasons over that short list, Stable cross-run key reopens existing records |
|
Judgment |
Production reachability and validation |
Single agent — builds context about the bug from MCP servers, to get the shape of what the service looks like in production. Searches the wiki, Jira, git, config, and all available other sources to try and understand whether a bug is truly applicable to our production environment, and then score the vulnerability against this. It also validates the bug against source code to understand if the bug still exists on the latest main branch. |
|
Fixing |
Generates patches, runs regression tests |
Runs the regression test before and after (filtered to the affected test; full suite only when per-test filtering isn’t available). It requires a clean fail→pass flip on the target test to clear the gate. If the post-patch test fails, or if a global run detects downstream regressions, the commit is automatically blocked and flagged for human intervention. |
Table 2: Vulnerability Validation System (VVS)
Comparing every single finding against every other finding using an LLM scales at O(N^2), which falls apart completely at scale. To keep the model off the critical path, deterministic code builds inverted indexes over the structured data (touched files/functions, trust boundary, rare tokens) to generate a short list of real candidates. Only then does an agent look at that short list to see if a single fix would close several of them. Stable cross-run keys ensure re-found bugs reopen existing records rather than spawning new ones.
Judgment is a second, independent pass over what survived. The agent rechecks the latest information, pulling from deployment, environment, and config context to determine if the code path is reachable in prod, and identify the repo owner. This process filters “exploitable now” from “real but latent” and from “real but filed against the wrong component.” It’s moving a pile of chaotic findings into a risk-driven orchestration workflow.
The Fixer takes the proposed patch and unit tests, rewrites them to match the repo’s style, applies the diff, and runs targeted tests. A clean fail→pass flip is the ideal and the only auto-cleanup case; a failing post-patch test blocks the commit. The Fixer never merges code on its own; a human must review the branch. This gate is the non-negotiable, human-in-the-loop safeguard that enables a clean, unbreakable cryptographic trail for change management compliance. Left to patch freely, a model will happily fix a security bug while quietly breaking an unrelated feature or adding dozens of new bugs.
Across all three triage jobs, each agent is confined to one narrow task wrapped in deterministic bookkeeping code, and nothing writes to production without a human signing off on a dry run. While this pipeline moves the engineering bottleneck from finding bugs to reviewing and landing fixes, the Fixer remains the youngest and slowest part of the system.
Running hundreds of agents over a fleet of repos is not cheap, but at least the shape of the spend is predictable. Almost all of the compute budget goes directly into the hunt stage. This makes Gapfill our cost-to-coverage lever, as each additional pass costs roughly half as much as the initial hunt.
Because the cost per repository varies wildly, we budget per repo rather than per run. We enforce a strict task cap per repository and spin up a worker pool of anywhere from 50 to 200 workers. That way you can spend money on the repos that are actually finding things, and not waste it on the ones that aren’t.
It’s also why, for us, the big scans are a periodic backlog sweep and not a per-PR check. A full scan of a complex repo can take hours; the worst run took just over 14 hours. Cheaper, smaller harnesses are the right tool for that job.
We measure our system’s effectiveness by tracking how efficiently our automated pipeline filters deliberate engineering noise into high-quality, actionable findings. Because we intentionally tune our Hunters to over-report subtle primitives that could be chained into larger attacks, our true indicator of success is how sharply we can refine that initial mountain of raw data, before it ever reaches a human.
To gauge this, we track exactly how many raw findings survive each validation stage over time. Thanks to better context injection from our Recon phase, our initial validation rejection rate dropped from 40% down to 11%, while the share of high-integrity findings climbed from 35% to 58% (representing ~12,057 lifetime findings).
Here’s the lifetime breakdown from raw candidates to actionable findings, at the point in time this blog post was written.

Vulnerability Discovery Harness (VDH)
- Raw candidates: Everything the discovery harness emitted before independent validation.
- Needs repro: Findings that appeared plausible but required manual reproduction before being trusted.
- Rejected at validation: The validator disproved the threat model, exploit path, affected code, or evidence.
- Duplicates: Candidates collapsed onto another finding from the same harness.
- Survived validation: Findings that passed the independent validation gate and moved into the VVS.
- Bugs that went elsewhere: Findings deliberately routed outside this flow.
Vulnerability Validation System (VVS)
- Another vulnerability harness: Other automated sources feeding the same validation system.
- Total bugs in system: The combined pool after ingest.
- Duplicates: Findings the dedup pass identified as already covered by another canonical finding or ticket.
- Wrong repo / other / not a risk: The noise bucket: misattributed findings, defense-in-depth, or latent risks.
- Bugs sent to teams: Finalized, clean findings ready for remediation.
- Judged Internet-exploitable: High-urgency findings a realistic attacker could trigger in production.
- Not judged Internet-exploitable: Lower-urgency, actionable bugs (production issues, dependency risks, or config errors).
- Final severity split: The categorization used to assign priority for the engineering teams.
The core metric of the harness isn’t a speculative recall score — it’s keeping the number of unconfirmed findings in front of real humans as close to zero as possible. The architecture needs to be a relentless filtering funnel.
-
Out of 20,799 raw candidates generated by VDH, only about 12,057 survived validation.
-
When these were pushed into the VVS, joining findings from another harness, the central pool was brought to 13,841.
-
The Dedup agent folded away 5,442 findings as duplicates.
-
1,154 were routed to the queue as ‘wrong-repo’ or ‘low-risk’ and were recycled back into the system where appropriate.
-
Ultimately this left 7,245 actionable findings for engineering teams to act on.
Traditional compliance rules dictate arbitrary remediation windows based entirely on a static CVSS score (e.g., “Fix all Highs in 30 days”). Our contextual judgment layer turns this compliance checkbox into actual risk management.
The architecture is capable of tracking findings back to their origin, meaning that fixing a single root cause resolves an entire cluster of findings rather than just patching individual issues. VDH system performance is also measured by dividing repos into (area x attack-class) cells and running the Gapfill agent iteratively until it stops producing findings. Whenever we update an underlying prompt, we test it against a held-out repository to see if that total coverage cell number actually moves.
The harness wires automated health signals to catch system failures early in the pipeline. If a hunt finished suspiciously fast and fails to spawn sub-hunts or gap tasks, it usually indicates a crashed dependency rather than a clean codebase. To remedy this, the system flags any Hunter agent that finishes with zero findings as “shallow” and immediately requeues it for a new run.
Finally, our system’s robustness is reinforced by the independent triage pass described earlier. By re-judging all submissions with a different model and separate logical weights, we ensure an unbiased, adversarial verification that is decoupled from the specific model used for discovery, providing a trust layer that persists regardless of which model is in use.
None of this is finished. We change our system constantly, and it is nowhere near a perfect science. But raw candidate findings are cheap now, and the only work worth doing is turning them into sound, verifiable code fixes.
Building your own harness means accepting that AI models are volatile, but your orchestration layer doesn’t have to be. By decoupling your security logic from any single provider, forcing adversarial verification, and automating your triage pipeline, you can turn a mountain of LLM noise into a reliable, fleet-wide defense engine.
Every codebase is a little different, so to show you how this actually works in the real world, we mapped out a realistic benchmark based on a standard repo run. Keep in mind that this represents a single pass on one repo; over time, as the continuous fleet-wide loop deduplicates, filters, and recycles findings, it reduces the volume of lifetime candidates by roughly 65%.
Engineering hours saved via automated patching: Rather than focusing on static baselines, we measure the health of our pipeline by its technical throughput, processing velocity, and its ability to eliminate the manual triage bottleneck:
-
Initial Validation Cut: For a standard repository (~30k lines of code), this yields 100 initial findings, with a full run taking 3-4 hours, maintaining a hyperfocused context window throughout.
-
Compression: The Deduplication and Contextual Judgment Layers process these candidates in parallel. Within 3 hours, the system compresses and refines the batch of findings from ~100 raw candidates to 80 distinct, high-fidelity bugs.
-
Remediation: The automated Fixer processes these 80 distinct bugs at an average rate of 5 minutes per bug. In total, the system can discover, validate, deduplicate, and open functional pull requests in approximately 14 hours.
Shrinking mean-time-to-resolve for critical flaws: Of course, you can’t dump 80 patches into production all at once without breaking things. To keep deployments safe, our system uses a tiered rollout:
-
Critical Exposure Containment: The system isolates the critical, high, and exploitable bugs (avg. 10 out of 80). We fast-track these for a human review and introduce them into release cycles, getting them fully patched in production in 5 days.
-
Incremental Hardening: The remaining latent risks, minor config anomalies, and lower-urgency bugs are incrementally rolled into prod over a 15-20 day window to guarantee platform stability.
These findings are the result of an isolated, ring-fenced research experiment designed to stress-test our code. They do not represent active, unpatched vulnerabilities in our live production environment.
Because the harness runs constantly in our test environments, these specific numbers are completely out of date by the time you’re reading this. Every single bug surfaced by the pipeline came attached to a working test case to demonstrate the bug and a draft patch. Our security teams are systematically processing the reports and applying the necessary fixes, meaning the Cloudflare products you use every day are already actively hardened against these vectors.
Along with this blog post, we’re releasing the initial skill we used to develop the harness, it’s been slightly cleaned up before release so it’s easier to understand and integrate, but the skill itself remains substantially the same. Hopefully the harness itself will follow shortly. This could be a starting point for your own vulnerability harness, your own skill, or whatever suits your needs best:
github.com/cloudflare/security-audit-skill
If your team is working on the same problems and would like to compare notes, reach out to us at [email protected].
UK Election & Restore Britain #lastweektonight
Post Syndicated from LastWeekTonight original https://www.youtube.com/shorts/daIllJyV52M
Добре дошли в държавния регрес!
Post Syndicated from Светла Енчева original https://www.toest.bg/dobre-doshli-v-durzhavniya-regres/

България навлиза в нов етап на отношение към човешките права и демокрацията. Повод за тази констатация е поведението на държавата спрямо Шествието за семейството – събитие, чиято основна мисия е отрицанието на „София прайд“. Тази теза може да изглежда пресилена, но отношението на една власт към ЛГБТИ+ хората е лакмус за отношението ѝ към демократичните ценности изобщо. Виждаме го в Русия, виждаме го в САЩ, виждаме го и в Унгария, където новото проевропейско правителство на Петер Мадяр премахна забраната на прайда, наложена от предшественика му Виктор Орбан.
Греъм Рийд: Правата на ЛГБТ хората са барометър за бъдещето на човешките права
Разговор на Боян Константинов с Греъм Рийд, независимият експерт на ООН по защита от насилие и дискриминация въз основа на сексуалната ориентация и джендърната идентичност. От интервюто става ясно, че защитата на правата на ЛГБТ хората е важна не само за тях, а за демокрацията изобщо.
Още от началото си през 2008 г. „София прайд“ е съпътстван от антипрояви.
През първите години те представляваха основно опити за физическа агресия (възпирани от многото жандармеристи по време на самия прайд, но успешни в малките улички, докато участниците се разотиваха).
После дойде времето на организираните антишествия. През 2018 г. се проведе първият Поход за семейството. По-късно между организаторите му настъпи разкол и в резултат през 2021 г. възникна още една антипроява – Шествие за семейството. Двата антипрайда се провеждаха паралелно до 2026 г., когато ресурсите се концентрираха в Шествието, а Походът развя бяло знаме.
За първи път обаче през 2026 г. Шествието за семейството се ползва с държавна подкрепа и е под егидата на Българската православна църква (БПЦ). А давайки заявка, че от догодина БПЦ ще поеме изцяло организацията на събитието, патриарх Даниил го измъкна изпод краката на досегашните организатори (основно евангелисти), както те навремето постъпиха с Поход за семейството.
По прайда ще ги познаете
Да забраниш нещо и така да го направиш още по-популярно си е талант. Виктор Орбан успя да стори точно това със забраната на прайда в Будапеща, на който са присъствали „само“ около 200 000 души – много повече от обикновено. Защо се случи така? От Светла Енчева.
Три етапа на отношението към равните права
Трансформациите на мобилизацията срещу „София прайд“ са израз на три етапа в отношението към равните права в посттоталитарна България. Тук ще скицирам основните им характеристики, но отделни елементи от всеки етап може да се видят и в останалите. Важното обаче са водещите признаци и общият дух на всеки от етапите.
Първи етап. Демократи сме, но се правим на разсеяни
След 1989 г. България, поне на декларативно равнище, се стреми да стане част от общността на демократичните държави. Още в края на следващата година Великото народно събрание приема решения (публикувани в бр. 3 на Държавен вестник от 11 януари 1991 г.), че страната иска да стане пълноправен член на Европейските общности, както и да приеме основополагащи документи на европейското законодателство, включително Европейската конвенция за правата на човека. От 2000 г. България води преговори за членство в ЕС, а от 2007 г. става част от Съюза.
Тези процеси са съпътствани и от необходими – с оглед на целите на страната – промени в законодателството. През 2004 г. например влиза в сила Законът за защита от дискриминация (ЗЗД), а през следващата година в него са включени и признаците на дискриминация, между които е и сексуалната ориентация. През 2015 г. и промяната на пола влиза като защитен признак в заключителните разпоредби на ЗЗД. Изобщо, изглежда, че неизбежното развитие на страната е в посока към повече равни права.
В същото време защитата на представителите на уязвими и дискриминирани групи остава предимно на хартия. Нито сегрегацията на ромите е премахната, нито се осигуряват достъпна среда и нужната подкрепа за хората с увреждания, нито институциите разпознават хомофобията и защитават пострадалите от нея.
Не се приемат и закони, които реално да са стъпка в посока към равни права (например регистрирано партньорство за ЛГБТИ+ хората). Широко разпространено е схващането, че равните права са всъщност „привилегии“ за малцинствените групи.
Трансът на Върховния касационен съд
28 съдии от ВКС забраниха възможността за юридическа смяна на пола и на практика предопределиха изхода от десетки дела, чакащи решение. Не че хората нямат право да водят подобни дела, просто е ясно, че няма да завършат в тяхна полза. Какво още ни казва решението на ВКС – от Светла Енчева.
Втори етап. „Традиционните ценности“ превземат правото
Началото на втория етап бележи дезинформационната кампания срещу Конвенцията на Съвета на Европа за превенция и борба с насилието над жени и домашното насилие, по-известна като Истанбулската конвенция, от края на 2017 и началото на 2018 г. Тази кампания беше юридически скрепена от най-висшите съдилища в България.
През 2018 г. Конституционният съд (КС) постанови, че съществуват само два пола, биологичният пол е конституционен, а единствената социална роля на жената е да бъде майка.
През 2021 г. пък КС отсъди, че полът според Конституцията има само биологичен смисъл и няма социално изражение. В решението точно 30 пъти става дума за традиционно и традиции, макар в Основния закон традиционното да се споменава само веднъж – когато се казва, че традиционната религия в България е източноправославното вероизповедание.
През 2023 г. Върховният касационен съд (ВКС) излезе с тълкувателно решение, с което де факто забрани юридическата смяна на пола на транс хората. По-точно, въпреки че хора в България са променяли юридическия си пол в продължение на няколко десетилетия, ВКС каза, че българското право не предвижда такава възможност.
И така, в период от няколко години най-важното нещо в българското право се оказаха традиционните ценности, за които не пише нищичко в Конституцията, и бракът между мъж и жена.
Постепенно самото българско право някак започна да се възприема като традиционно (каквото то няма как да бъде). Така например забраната на т.нар. ЛГБТ пропаганда в училище беше аргументирана с някаква несъществуваща „българска правна традиция“.
Въпреки тежненията към традиционното обаче, през втория етап не се поставят под съмнение геополитическата и ценностната ориентация на България. Затова този етап е междинен.
Трети етап. Църквата и държавата са едно, а модерното е лошо
В третия етап, в който навлиза България в момента, „традиционните ценности“ са превзели властта и открито се противопоставят на демокрацията. Засега това все още изглежда парадоксално, така че много хора си задават рационални въпроси:
- Защо държавата подкрепя едно хомофобско шествие?
- Защо оркестърът на гвардейците (които са част от българската армия) участва в хомофобското шествие, след като според собствените си правила не трябва да е там?
- Защо военният министър изпълнява желанието на патриарх Даниил оркестърът да участва в шествието, след като България е светска държава?
- Защо хора, които са се развеждали (например Румен Радев), и такива, които не са се женили и нямат деца (например Слави Василев и Пламен Мирянов-син), са толкова ревностни радетели на семейните ценности?
- Защо се говори за традиционни семейства от майка, баща и децата им, след като истинските традиционни семейства са нещо много по-различно – те включват целия род, а семейството само от родители и децата им датира от буржоазната епоха?
- Какво включват т.нар. традиционни ценности, освен че хора от един и същи пол не трябва да се женят и че полът е само биологичен?
Само че тези въпроси са доста закъснели. Почвата за това, което наблюдаваме, се подготвя отдавна. Чрез постепенното навлизане на БПЦ в държавата, въпреки че според Конституцията България е светска, чрез параклисите в училищата, въпреки че и образованието по закон е светско, чрез решенията на КС и ВКС, чрез умилителния език на мейнстрийм медиите, когато става въпрос за православни празници, ритуали и инициативи.
И не на последно място – чрез липсата на съпротива.
Защо Истанбулската конвенция отново е на дневен ред
Европейският парламент ратифицира Истанбулската конвенция. Какво точно означава това и какво следва за България от тази ратификация? Светла Енчева обяснява.
Една програмна позиция
За да стане по-ясна същността на новия етап в отношението към равните права и демокрацията, е добре да обърнем внимание на изказването на Слави Василев в парламента по повод Шествието за семейството. Защото то изразява позицията на управляващата партия „Прогресивна България“ (ПБ) – не само по конкретната тема, а и за посоката, в която трябва да върви България.
В декларацията се казва, че
съхраняването на традиционното семейство не е просто въпрос на личен избор, а стълб на националната ни сигурност.
Защо? Защото сме „във времена на ценностна дезориентация, социална фрагментация и тежка демографска криза“. Новата власт, значи, ще ориентира ценностно интимния ни живот в името на националната сигурност. И трябва да се сбогуваме с личния избор.
Спрямо какво ще се извърши ценностното ни преориентиране? Според Василев съществува „огромно множество“ българи, отстояващо традиционните ценности и семейството. То обаче е мълчаливо и не получава трибуна (дори на вас и мен да ни изглежда, че позицията му е доминираща в публичното говорене). Ценностите на малцинствата, значи, трябва да бъдат напаснати към мнозинството, както и българското и международното законодателство трябва да отстъпят пред него. Такова мнозинство, каквото си го представя ПБ (докато реалното мнозинство в България прави деца нетрадиционно – без брак).
В същото време, макар че в началото на декларацията личният избор е заклеймен, после в нея се казва, че ПБ
застава зад правото на всички български родители да възпитават децата си в съответствие със своите морални, религиозни, философски убеждения без външен идеологически натиск.
Тук под „всички български родители“ не трябва да се разбират действително всички, а само онези, които са част от мълчаливото, според управляващите, мнозинство – за да няма ценностна дезориентация. Тоест родителите „имат право“ да възпитават децата си в съответствие само с правилните според ПБ убеждения. В противен случай стават заплаха за националната сигурност.
В декларацията два пъти се заклеймява модерното.
В нея се казва, че да се „деконструират традициите, семейството и вярата“ е „модерно напоследък“, както и че бъдещето на България „не се кове в модерните за текущия момент идеологически течения“.
Какво означава „напоследък“ и кой е „текущият момент“? Изобщо, откога демократичните страни се развиват според тези либерални ценности, които консервативният обрат, част от който е ПБ, отрича?
Да помислим. Преди 36 години, през 1990 г., Световната здравна организация премахва хомосексуалността от списъка на заболяванията и може да се каже, че през следващите три десетилетия либералните ценности са доминиращи. През 1990 г. Слави Василев е бил на шест годинки. Още по-рано – към края на 60-те години на ХХ в. – настъпва сексуалната революция. Тогава Василев още не е бил роден. Борбата на жените за равни права пък датира от още по-рано – тя е на повече от век.
ПБ анихилира цяла епоха, свеждайки я до „напоследък“ и „текущия момент“, в името на идеята за една традиционност, каквато никога не е съществувала.
Педофилията, срещу която се протестира, и педофилията, за която се мълчи
Гражданският гняв, изразяващ се в протести срещу насилието над деца и срещу неработещата държава, е абсолютно оправдан. Но е важно, когато си отваряме очите за едно, да не ги затваряме за друго. От Светла Енчева.
Какво да очакваме?
Декларацията на политическата сила, именувала се „Прогресивна България“, задава ясна посока към консервативен традиционализъм в стил Русия на Путин. Няма смисъл да търсим логика и да спорим с аргументи – щом „прогресивното“ е регресивно, всичко останало ще е също толкова абсурдно. А и на ценности не може да се възразява рационално – особено ако никой не ни казва кои са те точно, освен че са „традиционни“ и „семейни“.
Така смисленият обществен дебат става невъзможен. От нас се иска да вярваме, да сме послушни, да сме слепи за лицемерието и да не задаваме въпроси.
А ако патриархът си е пожелал гвардейски оркестър на хомофобско шествие и го е получил, какво друго би могъл да поиска той и да му се даде? На първо място – задължително обучение по религия в училище, разбира се. Но и какво ли още не. Например забрана на „София прайд“. Или на небогоугодните НПО-та. Или на абортите. Или затвор за „накърняване на религиозните чувства“ – като в Русия. Или премахване на онзи досаден текст от Конституцията, според който религията е отделена от държавата. И т.н.
Впрочем дори не е нужно патриарх Даниил да пожелае някои от тези неща, за да се изпълнят. Ако дневният ред на ПБ е България да се отдалечи от демократичния свят, който понастоящем се олицетворява основно от ЕС, това ще е посоката на развитие.
Освен ако новата власт не срещне решителен отпор. Но такъв засега не се очертава.
Смятащите се за демократични партии са в конформистки ступор. „Да, България“ дори оттегли предложението си за премахване на забраната на т.нар. ЛГБТ пропаганда в училище.
Гражданите – критичното мнозинство от тях – смята, че сериозната борба е срещу корупцията и олигархията, а не за свободата им. Когато ограничаването на права стигне и до тях – а то ще стигне, ако се върви в зададената от ПБ посока, – може вече да е късно. А за да се оправят нещата, ако това изобщо е възможно, може би ще се наложи първо съвсем да се объркат, та да стане непоносимо за всички.
Spring 2026 SOC 1 and 2 reports are now available in OSCAL format
Post Syndicated from Thomas Fischer original https://aws.amazon.com/blogs/security/spring-2026-soc-1-and-2-reports-are-now-available-in-oscal-format/
Amazon Web Services (AWS) is excited to release the Spring 2026 System and Organization Controls (SOC) 1 and 2 reports in machine-readable OSCAL format alongside the PDF version of the reports. The reports cover 188 services over the 12-month period from April 1, 2025 to March 31, 2026, giving customers a full year of assurance. These reports demonstrate our continuous commitment to adhering to the heightened expectations of cloud service providers.
AWS is the first major cloud provider to offer key compliance reports to customers in the National Institute of Standards and Technology’s (NIST) Open Security Controls Assessment Language (OSCAL), as of June 2026. OSCAL is an open source, machine-readable (JSON) format for security information. The SOC 1 and SOC 2 report package in OSCAL format is now available as a distinct package in AWS Artifact, marking a milestone toward open, standards-based compliance automation. This machine-readable version of the SOC report package enables workflow automation to reduce manual processing time and modernize security and compliance processes. Your use cases for this content are innovative, and we want to hear about them through the contact information found in the OSCAL report package.
You can download the Spring 2026 SOC 1 and 2 reports in OSCAL format through AWS Artifact, a self-service portal for on-demand access to AWS compliance reports. Sign in to AWS Artifact in the AWS Management Console, or learn more at Getting Started with AWS Artifact. The SOC 3 report can be found on the AWS SOC Compliance page and in AWS Artifact.
AWS strives to continuously bring services into the scope of its compliance programs to help customers meet their architectural and regulatory needs. You can view the current list of services in scope on our Services in Scope page. As an AWS customer, you can reach out to your AWS account team if you have any questions or feedback about SOC compliance.
To learn more about AWS compliance and security programs, see AWS Compliance Programs.
If you have feedback about this post, submit comments in the Comments section below.
На второ четене: „Да си мъж“
Post Syndicated from original https://www.toest.bg/na-vtoro-chetene-2/
„Да си мъж“ от Никол Краус

превод от английски Владимир Германов, София: изд. „Кръг“, 2023
Чудесният сборник с разкази на Никол Краус беше изненада дори за читателка като мен, на която се налага уж по-внимателно да следи издаваната у нас литература. Не само mea culpa все пак, защото, макар въпросната книга да е излязла през 2023 г. на български, а преди това да са преведени и два други романа на тази световноизвестна американска писателка (в „Колибри“), българският Google не открива нищо повече – отзиви, статии, ревюта, интервюта – освен това, че изданията се продават. (Край на кратката вметка относно подминаването или недостатъчното говорене за хубави книги.)
„Да си мъж“ е първият опит в краткия разказ на Краус след четири романа преди това, преведени на десетки езици, и последната ѝ написана до момента книга. Отличена е с британската награда „Уингейт“ за най-добро представяне на еврейството в художествената или нехудожествената литература (сред лауреатите ѝ са Зейди Смит, Зебалд, Етгар Керет, Давид Гросман, Амос Оз). Прекрасният превод на сборника е дело на Владимир Германов за издателство „Кръг“, което напоследък се утвърди във внимателния подбор на знакови разказвачи, сред които Алис Мънро, Тобаяс Улф, Шърли Джаксън, Лусия Бърлин, Сергей Лебедев и др.
Хилядолетната еврейска история; археологическото дълбаене в библейските руини; нацизмът; бедствените пожари в Калифорния; антиутопичните мерки от времето след 11 септември, очакваният край на света през 2000-та… – мащабният страничен фон в много от тези разкази е несъразмерен с микрокосмоса на сюжетите, вгледани в семейното и интимното. В писането на Краус обаче животът като че ли е езикът, запълващ пространството между двете, а случилото се (същината на наратива, така да се каже) винаги сякаш е някъде другаде – в предходното, в преразказаното, във въобразеното, в изпуснатото, в изместеното. В онова, което липсва в тези истории. И ако те имат някакво послание, то е, че
истинското свидетелстване често настъпва много след онова, на което си бил непосредствен свидетел.
Много от разказите в сборника действително са за невидяното – именно то е обект на разказването. В много от случаите разказвач(к)ите са станали очевидци единствено на последиците от това, до което разказът им никога няма да проникне. Той остава някак миражен, плод на предполагаемото, което след тях читателят следва сам да си довъобрази. „Събитието“ не е непременно част от сюжета, невинаги има нужда да бъде назовано или дефинирано, ала осезаването му (не дори осъзнаването) неизбежно просветва в „бавното пресъхване на разбирането“ с годините. Не виждаме ли в крайна сметка у другите само страничните ефекти от тяхното живеене, само остатъците или излишъците от преживяното?

В това дискретно (в най-ангажиращия смисъл на определението) интелектуално-чувствено четиво сюжетите се движат между Тел Авив, Ню Йорк, Лос Анджелис, Южна Америка, Европа – географски; между различните възрасти и поколения – времево; между половете и семейните роли – социално; между куп реалии, изкуства и заглавия – културно; между съзряването, сексуалността, заедността, себепознанието, властта, раздялата, стареенето и умирането – екзистенциално. Макар и уж различни, историите звучат споено, почти като роман – не само тематично, но и защото идентичностите на героите като че ли преливат, маркерите на житейския опит, характерите, интересите са сходни и повторими. Краус не само не се страхува от тази смътна неотличимост, а напротив – търси архетипите в редящите се вътрешни пейзажи.
Поради горното вероятно има опасност писането ѝ тук да се стори еднообразно или монотонно на някои читатели, включително заради еднаквия стил и глас във всеки от разказите. Но силата на тази проза се крие именно в привидната непрекъснатост, в нейния минорен интензитет, в понякога почти унилото носене по историите, в отказа от самоцелно разнообразие за сметка на един определен житейски и емоционален регистър. Просто, както установява една от героините, когато екранът на един приключващ филм най-сетне почернява, той
всъщност изобщо не е черен. Ако се вгледаш, ще видиш падащия дъжд.
Краус не показва явно емоционално пристрастие към героите си, но прозата ѝ звучи – и всъщност вероятно до голяма степен е – автофикционална. Ако можем да използваме разграничението, което една от героините ѝ прави между два типа фотографски поглед – на Уокър и Арбъс, – то бихме могли да определим писателския ѝ подход като смесица от двете: от едната страна имаме „отказ от състрадание в полза на студената яснота“, от другата – „някой, който се самоидентифицира с обектите си на ужасяващо ниво“.
Характерен за Краус е смътният финал, символичен дори в отказа ѝ от него. „Финал“ в смисъла на продължаване, на фино и невидимо пренастройване или тихо заемане на позиция в баналността на житейската драма, лишена тук от всякаква драматичност. Така както (по отношение на разтрогнатите бракове – чест мотив в разказите),
хаосът на прекъснатото и обърнатото наопаки, на анулирането и унищоженото, по вълшебен начин се превръщаше в порядък с простото попълване на някакви документи в официалните архиви на еврейския съд.
Зад подписа под тях – бележещ ясен, окончателен финал – се крие цялата невъзможна за разказване и приключване история.
В почти всеки разказ на Краус има и един епифаничен, трансформационен по същността си момент, бележещ усещането за преминаване; момент толкова безшумен и призрачен, че понякога е сведен до единичен жест (докосване по косата, размяна на легла, прескачане, поглед, предложение да облечеш нечие палто в студа и т.н.), който лесно би могъл да бъде пропуснат като дребна брънка в движенията на сюжета. Наблюдава се също едно по същността си отложено във времето „квантово заплитане“ – повтаряне, наследяване, възприемане на съдби, на социални и семейни роли, на характери. Докато осъзнаеш
как някой може да ти се случи, и това случване да съзрее половин живот по-късно, да изригне, да се представи.
Сигурно не е случайно, че един от героите, археолог, разравя именно древните останки на Мегидо – символ на вечния конфликт, на Армагедон. По своята същност това е място не само на древното минало – то извиква мисълта и за едно метафорично разкопаване на бъдещето, за една археология на предстоящото. Защото значимостта му е много повече в идното, като място на очаквания Апокалипсис, на предвкусвания и засега отлаган край на краищата. Тази неизбежна зараза на сегашното и бъдещото от „безкрайната мъдрост на мъртвите“ не може лесно да бъде отхвърлена. Де факто никой от героите, почти всичките евреи, не съществува извън структурата на вече преживяното, семейното, историческото, религиозното, езиковото; всеки мъкне багажа на еврейството („не бе успял да стане изцяло себе си, вместо това се бе поддал на древен натиск“).
Относно горното друг един от героите, историк, отбелязва, че „има повече от достатъчно [еврейска и не само – б.а.] история“, но парадоксално, той няма какво да успее да предаде на новородения си внук от това смазващо познание, няма какво от него да бъде послушано и най-вече почетено. Може би едно от най-силните осъзнавания в сборника е именно неговото: че мощното присъствие на предците, на родителите прикрива неяснотата, върху която е построено всичко. Без него тази вездесъща неяснота може да ни залее и съкруши.
Дългогодишният интерес на Краус към Израел и еврейската идентичност (нейната едновременна неуловимост и неизбежност; фикция и тегоба; убежище и тежест) преминава през целия сборник, без отделянето на поколенията поради емиграцията да е първосигнално проблематизирано, без леснотата на носталгията и патриотизма. И все пак усещането е, че сърцето на историите и на разказвачите е там, в конкретната картография на Светите земи. Както установява една от героините за баща си, той само е „отсядал“ в Америка, но е „живял“ в Тел Авив. Впрочем, макар родена и израсла в САЩ и с корени другаде в Европа, Краус показва изключително достоверни познания за съвременен Израел; позволява си да прави и много остри политически намеци с основанието, което има за критика запознатият, тамошният. На фона на обсебващото чувство за надвременност в разказите ѝ тук-и-сегато винаги присъства чрез конкретни реалии.
Макар разказвач(к)ите по-често да са в позицията на тези, които са заминали, които не са у дома и са в ролята на научаващи новините оттам, фокусът е повече върху останалото и останалите, върху другите. „Дом“ остава имагинерно, флуидно място. Нещо в състояние на суперпозиция. Нещо, което може да размениш или смениш. Или да откриеш много по-късно – във или вместо нещо друго и някой друг. „Ако има нещо като душа, колкото и да е изкривена, къде би се върнала?“, пита се една от героините. И това е толкова еврейски въпрос.
Струва ми се, че „Да си мъж“ е сборник за човешкото оцеляване в абсолютно лишения от мелодраматичност и размах смисъл на тази дума.
Противогазите в един от разказите в крайна сметка се оказват ненужни – оцеляването ще стане и без тях; понякога просто носим защитите си, без да знаем, че всъщност трябва да оцелеем от самите тях. Така както и да бъдеш намерен невинаги означава да бъдеш самия себе си в намереното.
Или може би в крайна сметка думата е просто „свикване“…
[Знам] че ще свикна да прескачам непознатия, когато отивам към кухнята, защото така живеят хората, прекрачват небрежно подобни неща, докато престанат да са бреме и стане възможно да ги забравят напълно.
Никой от нас не чете единствено най-новите книги. Тогава защо само за тях се пише? „На второ четене“ е рубрика, в която отваряме списъците с книги, публикувани преди поне година, четем ги и препоръчваме любимите си от тях. За нея медията „Тоест“ е отличена с Националната награда „Христо Г. Данов“ (2025) за принос в представянето на българската книга.
Рубриката е част от партньорската програма Читателски клуб „Тоест“, благодарение на която активните дарители на „Тоест“ получават 20% отстъпка от коричната цена на всички книги на включените издателства. Изборът на заглавия обаче е единствено на авторите Стефан Иванов, Севда Семер и Антония Апостолова, които биха ви препоръчали тези книги и ако имаше как да се разходите с тях в книжарницата.
The Software Freedom Conservancy’s LLM-backed generative AI recommendations
Post Syndicated from jzb original https://lwn.net/Articles/1078521/
The Software Freedom
Conservancy (SFC) has announced
the release of its recommendations
for using LLM-backed generative AI systems for FOSS
contributions. The recommendations were created by the SFC and
volunteers from the free-software community.
The recommendations reflect the extremely difficult dilemmas that
these systems pose for FOSS contributors. SFC and its volunteers
understand that FOSS developers are approaching LLM-gen-AI from a
variety of perspectives. The recommendations offer practical
assistance to minimize the damage caused by using proprietary systems,
whether FOSS contributors reject LLM-gen-AI or choose (voluntarily or
by employer mandate) to use them.These recommendations are best practices (but not definitions or
requirements) that SFC and its volunteers formulated after careful
study of the growing LLM-gen-AI use among FOSS contributors. SFC will
follow these recommendations with a series of supporting materials,
including documents, online tutorials, public Q&As, podcasts,
and other community engagement. We will routinely refine our
recommendations and continue to support FOSS contributors as they
navigate this difficult landscape.
Russell Crowe & Blockbuster: Last Week Tonight with John Oliver (Bonus Segments)
Post Syndicated from LastWeekTonight original https://www.youtube.com/watch?v=8qUxl3rl53M
How Trump’s Immigration Policies Could Backfire Among Florida Cubans
Post Syndicated from The Atlantic original https://www.youtube.com/shorts/d14Ql0YrRpo
UniFi Protect NVR G2 – Needs more AI
Post Syndicated from digiblur DIY original https://www.youtube.com/watch?v=6GBiaOtR_Wg
Why Security Teams Need To Start Earlier
Post Syndicated from Tom Caiazza original https://www.rapid7.com/blog/post/it-why-security-teams-need-to-start-earlier
Security leaders are facing an unusual set of circumstances. The drumbeat for better security prioritization has been rising for years in boardrooms around the world. The desire is there, but the processes of the past aren’t meeting the needs of the new moment we find ourselves in.
That gap is not a technology problem. It’s an operating model problem.
At the opening keynote of Rapid7’s 2026 Global Cybersecurity Summit, Craig Adams, Chief Product Officer, Rapid7, Brian Castagna, CSO, Rapid7 and IDC’s Research VP, Craig Robinson framed a simple idea: cyber defense needs to start earlier.
For more on this, download our new ebook, Preemptive Security: From Resilience to Action.
Complexity is outpacing control
Security environments have never been more connected or more difficult to manage. Cloud adoption, SaaS sprawl, third-party dependencies, and identity growth have expanded the attack surface in ways most programs were not designed to handle. Many teams have responded by adding more tools and more telemetry. This has resulted in more fragmentation, more dashboards, and more opportunities for important information to slip through the cracks.
Teams are spending more time stitching context together than they are effectively reducing risk. This shows up in daily operations with analysts moving between multiple systems to validate alerts, and leaders lacking the clear picture to explain risk to the business. In a time when exposure management and detection & response can live on one platform, that level of fragmentation makes no sense.
Reactive security creates operational drag
The traditional model still dominates most security programs. It goes like this (stop us if you’ve heard this before): 1) Detect an alert. 2) Investigate. 3) Contain. 4) Recover. 5) Repeat, forever.
Sounds simple, right? And it worked great when environments were simpler and attackers moved slower. That is no longer the case.
Today, initial access often happens quietly through identity abuse or misconfiguration. Attack paths form before an alert even fires. By the time a signal reaches the security team, attackers may already be moving laterally or accessing sensitive systems. This creates a cycle of constant response without consistent risk reduction. Teams get better at handling incidents but struggle to remove the conditions that enable them.
Security operations centers can receive thousands of alerts per day, many of which are low value or false positives. This leaves analysts spending hours triaging signals instead of focusing on the exposures most likely to lead to impact.
More alerts do not make you safer. They create drag. Better context creates better outcomes.
The issue is prioritization, not visibility
Most organizations are not lacking data. They are lacking the clarity needed to understand the data they have and contextualize it as it relates to their business. Telemetry alone does not answer the question that matters most: what should we do first?
Attackers look for the most effective path into an environment, often combining smaller weaknesses across assets, identities, and systems until they create meaningful access. Security teams need a similarly connected view, one that helps them understand which exposures are exploitable, which assets are most critical, and how those risks relate across the environment. When teams can see that full picture, they can focus remediation on the issues most likely to be used in a real attack, making risk reduction more targeted, efficient, and defensible.
The result is effort without impact.
Why security needs to start earlier
The summit’s keynote message is direct: meaningful action must move earlier in the lifecycle.
Preemptive Security introduces an operating model designed for that shift. It connects four core elements:
-
Exposure management to identify and prioritize risk
-
Managed detection and response (MDR) to monitor and act
-
Artificial intelligence to reduce noise and accelerate analysis
-
Human expertise to validate and decide
Together, these capabilities create a system that acts before risk becomes impact. Instead of waiting for alerts, teams identify likely breach paths. Instead of reacting to incidents, they reduce exposure ahead of time. Instead of managing disconnected tools, they operate with shared context and clear priorities. Detection and response becomes one leg of the stool with exposure management taking the lead in reducing risk before it becomes an emergency.
What changes for security leaders
For CISOs and security leaders, this shift means designing programs around likely attack paths, not isolated findings. It means prioritizing investments based on risk reduction, not tool coverage and enabling teams to act decisively without increasing headcount or complexity.
It also changes how success is measured. The goal is fewer surprises, faster containment and reduced exposure before exploitation. It means starting earlier, to increase the likelihood of success. These are outcomes the business understands.
A new starting point for security
Ultimately, the environment has changed faster than the operating model. So the operating model needs to change. Luckily, there’s a proven path forward that can prevent the attacks from bad actors already moving in earlier, using technology to scale their operations, and exploiting small weaknesses to get a foothold.
Preemptive Security provides the framework to close that gap. It helps teams reduce noise, focus on what matters, and act with confidence before disruption occurs. Security does not start with an alert. It starts with understanding risk early enough to do something about it.
Watch the keynote on demand or download the eBook, Preemptive Security: From Resilience to Action, to explore the model in more detail.
[$] The first half of the 7.2 merge window
Post Syndicated from corbet original https://lwn.net/Articles/1078068/
The 7.2 merge window started with the 7.1
kernel release on June 14. As of this writing, just over 7,000
non-merge changesets have been pulled into the mainline for the next kernel
release. Many of the core subsystems have been pulled at this point,
meaning that most of the changes that can be expected in 7.2 have now come
into focus.
Will Americans Ever Lose Their Grip on the Handshake?
Post Syndicated from The Atlantic original https://www.youtube.com/shorts/bd13aZ21kZI
Mastodon 4.6 released
Post Syndicated from corbet original https://lwn.net/Articles/1078466/
Version
4.6 of the Mastodon fediverse platform has been released.
The headliner of this release is Collections, a way to create and
share curated collections of profiles. Part of Mastodon’s work
ethos is our commitment to trust and safety, so we’ve put a lot of
thought and care into the design of this feature to avoid some of
the pitfalls and abuse people have experienced with similar
features on other platforms, while focusing on its primary goal:
Helping new users discover more of the Fediverse.
Other new features include support for subscribing to posts via email, the
ability to generate a “year in review” post, accessibility improvements,
and more.