Post Syndicated from Explosm.net original https://explosm.net/comics/moment
New Cyanide and Happiness Comic
Post Syndicated from Explosm.net original https://explosm.net/comics/moment
New Cyanide and Happiness Comic
Post Syndicated from Channy Yun (윤석찬) original https://aws.amazon.com/blogs/aws/new-amazon-ec2-p6e-gb200-ultraservers-powered-by-nvidia-grace-blackwell-gpus-for-the-highest-ai-performance/
Today, we’re announcing the general availability of Amazon Elastic Compute Cloud (Amazon EC2) P6e-GB200 UltraServers, accelerated by NVIDIA GB200 NVL72 to offer the highest GPU performance for AI training and inference. Amazon EC2 UltraServers connect multiple EC2 instances using a dedicated, high-bandwidth, and low-latency accelerator interconnect across these instances.
The NVIDIA Grace Blackwell Superchips connect two high-performance NVIDIA Blackwell tensor core GPUs and an NVIDIA Grace CPU based on Arm architecture using the NVIDIA NVLink-C2C interconnect. Each Grace Blackwell Superchip delivers 10 petaflops of FP8 compute (without sparsity) and up to 372 GB HBM3e memory. With the superchip architecture, GPU and CPU are colocated within one compute module, increasing bandwidth between GPU and CPU significantly compared to current generation EC2 P5en instances.
With EC2 P6e-GB200 UltraServers, you can access up to 72 NVIDIA Blackwell GPUs within one NVLink domain to use 360 petaflops of FP8 compute (without sparsity) and 13.4 TB of total high bandwidth memory (HBM3e). Powered by the AWS Nitro System, P6e-GB200 UltraServers are deployed in EC2 UltraClusters to securely and reliably scale to tens of thousands of GPUs.
EC2 P6e-GB200 UltraServers deliver up to 28.8 Tbps of total Elastic Fabric Adapter (EFAv4) networking. EFA is also coupled with NVIDIA GPUDirect RDMA to enable low-latency GPU-to-GPU communication between servers with operating system bypass.
EC2 P6e-GB200 UltraServers specifications
EC2 P6e-GB200 UltraServers are available in sizes ranging from 36 to 72 GPUs under NVLink. Here are the specs for EC2 P6e-GB200 UltraServers:
| UltraServer type | GPUs |
GPU memory (GB) |
vCPUs | Instance memory (GiB) |
Instance storage (TB) | Aggregate EFA Network Bandwidth (Gbps) | EBS bandwidth (Gbps) |
| u-p6e-gb200x36 | 36 | 6660 | 1296 | 8640 | 202.5 | 14400 | 540 |
| u-p6e-gb200x72 | 72 | 13320 | 2592 | 17280 | 405 | 28800 | 1080 |
P6e-GB200 UltraServers are ideal for the most compute and memory intensive AI workloads, such as training and inference of frontier models, including mixture of experts models and reasoning models, at the trillion-parameter scale.
You can build agentic and generative AI applications, including question answering, code generation, video and image generation, speech recognition, and more.
P6e-GB200 UltraServers in action
You can use EC2 P6e-GB200 UltraServers in the Dallas Local Zone through EC2 Capacity Blocks for ML. The Dallas Local Zone (us-east-1-dfw-2a) is an extension of the US East (N. Virginia) Region.
To reserve your EC2 Capacity Blocks, choose Capacity Reservations on the Amazon EC2 console. You can select Purchase Capacity Blocks for ML and then choose your total capacity and specify how long you need the EC2 Capacity Block for u-p6e-gb200x36 or u-p6e-gb200x72 UltraServers.
Once Capacity Block is successfully scheduled, it is charged up front and its price doesn’t change after purchase. The payment will be billed to your account within 12 hours after you purchase the EC2 Capacity Blocks. To learn more, visit Capacity Blocks for ML in the Amazon EC2 User Guide.
To run instances within your purchased Capacity Block, you can use AWS Management Console, AWS Command Line Interface (AWS CLI) or AWS SDKs. On the software side, you can start with the AWS Deep Learning AMIs. These images are preconfigured with the frameworks and tools that you probably already know and use: PyTorch, JAX, and a lot more.
You can also integrate EC2 P6e-GB200 UltraServers seamlessly with various AWS managed services. For example:
Now available
Amazon EC2 P6e-GB200 UltraServers are available today in the Dallas Local Zone (us-east-1-dfw-2a) through EC2 Capacity Blocks for ML. For more information, visit the Amazon EC2 pricing page.
Give Amazon EC2 P6e-GB200 UltraServers a try in the Amazon EC2 console. To learn more, visit the Amazon EC2 P6e instances page and send feedback to AWS re:Post for EC2 or through your usual AWS Support contacts.
— Channy
Post Syndicated from Amit Maindola original https://aws.amazon.com/blogs/big-data/develop-and-monitor-a-spark-application-using-existing-data-in-amazon-s3-with-amazon-sagemaker-unified-studio/
Organizations face significant challenges managing their big data analytics workloads. Data teams struggle with fragmented development environments, complex resource management, inconsistent monitoring, and cumbersome manual scheduling processes. These issues lead to lengthy development cycles, inefficient resource utilization, reactive troubleshooting, and difficult-to-maintain data pipelines.These challenges are especially critical for enterprises processing terabytes of data daily for business intelligence (BI), reporting, and machine learning (ML). Such organizations need unified solutions that streamline their entire analytics workflow.
The next generation of Amazon SageMaker with Amazon EMR in Amazon SageMaker Unified Studio addresses these pain points through an integrated development environment (IDE) where data workers can develop, test, and refine Spark applications in one consistent environment. Amazon EMR Serverless alleviates cluster management overhead by dynamically allocating resources based on workload requirements, and built-in monitoring tools help teams quickly identify performance bottlenecks. Integration with Apache Airflow through Amazon Managed Workflows for Apache Airflow (Amazon MWAA) provides robust scheduling capabilities, and the pay-only-for-resources-used model delivers significant cost savings.
In this post, we demonstrate how to develop and monitor a Spark application using existing data in Amazon Simple Storage Service (Amazon S3) using SageMaker Unified Studio.
This solution uses SageMaker Unified Studio to execute and oversee a Spark application, highlighting its integrated capabilities. We cover the following key steps:
For this walkthrough, you must have the following prerequisites:
Complete the following steps to create an EMR Serverless compute environment to build your Spark application:


It takes a few minutes to spin up the EMR Serverless application. After it’s created, you can view the compute in SageMaker Unified Studio.

The preceding steps demonstrate how you can set up an Amazon EMR Serverless application in SageMaker Unified Studio to run interactive PySpark workloads. In subsequent steps, we build and monitor Spark applications in an interactive JupyterLab workspace.
In this section, we build a Spark application using the TPC-DS dataset within SageMaker Unified Studio. With Amazon SageMaker Data Processing, you can focus on transforming and analyzing your data without managing compute capacity or open source applications, saving you time and reducing costs. SageMaker Data Processing provides a unified developer experience from Amazon EMR, AWS Glue, Amazon Redshift, Amazon Athena, and Amazon MWAA in a single notebook and query interface. You can automatically provision your capacity on Amazon EMR on Amazon Elastic Compute Cloud (Amazon EC2) or EMR Serverless. Scaling rules manage changes to your compute demand to optimize performance and runtimes. Integration with Amazon MWAA simplifies workflow orchestration by alleviating infrastructure management needs. For this post, we use EMR Serverless to read and query the TPC-DS dataset within a notebook and run it using Amazon MWAA.
Complete the following steps:
The notebook takes about 30 seconds to initialize and connect to the space.
After the Spark session starts and execution logs start to populate, you can explore the Spark UI and driver logs to further debug and troubleshoot Spark progra The following screenshot shows an example of the Spark UI.
  The following screenshot shows an example of the driver logs.
  The following screenshot shows the Executors tab, which provides access to the driver and executor logs.
In each cell of your notebook, you can expand Spark Job Progress to view the stages of the job submitted to EMR Serverless for a specific cell. You can see the time taken to complete each stage. In addition, if a failure occurs, you can examine the logs, making troubleshooting a seamless experience.

Because the files are partitioned based on date key column, you can observe that Spark runs parallel tasks for reads.


On the Jobs tab of the Spark UI, you can see a list of complete or actively running jobs, with the following details:
You can choose the job to view more details, particularly around the stages. Our job has two stages; a new stage is created whenever there is a shuffle. We have one stage for the initial reading of each dataset, and one for the aggregation.  In the following example, we run some TPC-DS SQL statements that are used for performance and benchmarks:
You can monitor your Spark job in SageMaker Unified Studio using two methods. Jupyter notebooks provide basic monitoring, showing real-time job status and execution progress. For more detailed analysis, use the Spark UI. You can examine specific stages, tasks, and execution plans. The Spark UI is particularly useful for troubleshooting performance issues and optimizing queries. You can track estimated stages, running tasks, and task timing details. This comprehensive view helps you understand resource utilization and track job progress in depth.

In this section, we explained how you can EMR Serverless compute in SageMaker Unified Studio to build an interactive Spark application. Through the Spark UI, the interactive application provides fine-grained task-level status, I/O, and shuffle details, as well as links to corresponding logs of the task for this stage directly from your notebook, enabling a seamless troubleshooting experience.
To avoid ongoing charges in your AWS account, delete the resources you created during this tutorial:
In this post, we demonstrated how the next generation of SageMaker, combined with EMR Serverless, provides a powerful solution for developing, monitoring, and scheduling Spark applications using data in Amazon S3. The integrated experience significantly reduces complexity by offering a unified development environment, automatic resource management, and comprehensive monitoring capabilities through Spark UI, while maintaining cost-efficiency through a pay-as-you-go model. For businesses, this means faster time-to-insight, improved team collaboration, and reduced operational overhead, so data teams can focus on analytics rather than infrastructure management.
To get started, explore the Amazon SageMaker Unified Studio User Guide, set up a project in your AWS environment, and discover how this solution can transform your organization’s data analytics capabilities.
In the following sections, we discuss how to run a workload on a schedule and provide details about the TPC-DS dataset for building the Spark application using EMR Serverless.
In this section, we deploy a JupyterLab notebook and create a workflow using Amazon MWAA. You can use workflows to orchestrate notebooks, querybooks, and more in your project repositories. With workflows, you can define a collection of tasks organized as a directed acyclic graph (DAG) that can run on a user-defined schedule.Complete the following steps:

You will be redirected to the JupyterLab notebook with a new DAG called untitled.py created under the /src/workflows/dag folder.
tpcds_data_queries.py.NOTEBOOK_PATH. This should be in src/<notebook_name>.ipynb. Note the name of the automatically generated dag_id; you can name it based on your requirements.
To test, you can trigger a manual run of your workload.
You can monitor the success of your job on the Runs tab.

To debug your notebook job by accessing the Spark UI within your Airflow job console, you must use EMR Serverless Airflow Operators to submit your job. The link is available on the Details tab of your query.
This option has the following key limitations: it’s not available for Amazon EMR on EC2, and SageMaker notebook job operators don’t work.
You can configure the operator to generate one-time links to the application UIs and Spark stdout logs by passing enable_application_ui_links=True as a parameter. After the job starts running, these links are available on the Details tab of the relevant task. If enable_application_ui_links=False, then the links will be present but grayed out.
Make sure you have the emr-serverless:GetDashboardForJobRun AWS Identity and Access Management (IAM) permissions to generate the dashboard link.
Open the Airflow UI for your job. The Spark UI and history server dashboard options are visible on the Details tab, as shown in the following screenshot.

The following screenshot shows the Jobs tab of the Spark UI.

To use the TPC-DS dataset to run the Spark application against a dataset in an S3 bucket, you need to copy the TPC-DS dataset into your S3 bucket:
$YOUR_S3_BUCKET with your S3 bucket name. We suggest you export YOUR_S3_BUCKET as an environment variable:$YOUR_S3_BUCKET with your S3 bucket name: Amit Maindola is a Senior Data Architect focused on data engineering, analytics, and AI/ML at Amazon Web Services. He helps customers in their digital transformation journey and enables them to build highly scalable, robust, and secure cloud-based analytical solutions on AWS to gain timely insights and make critical business decisions.
 Abhilash is a senior specialist solutions architect at Amazon Web Services (AWS), helping public sector customers on their cloud journey with a focus on AWS Data and AI services. Outside of work, Abhilash enjoys learning new technologies, watching movies, and visiting new places.
Post Syndicated from Channy Yun (윤석찬) original https://aws.amazon.com/blogs/aws/introducing-aws-builder-center-a-new-home-for-the-aws-builder-community/
We really love builders at AWS. We’re constantly thinking of new ways to help technical communities thrive and create spaces like AWS Developer Center and community.aws where people can connect and share their knowledge and experiences.
Today, we’re announcing AWS Builder Center, a new home for builders to access all builder resources, engage with the AWS community, and provide feedback or product suggestions to AWS product teams. This new experience also integrates the previous AWS Developer Center and community.aws.

There are a variety of exciting features so let us discover some of them.
Your voice matters: Introducing Wishlist
One of the most exciting new features, in my opinion, is Wishlist. You can now submit your wishes for new features or improvements you’d like to see in AWS services. Others can discover and vote on these wishes while also creating their own.

You can influence product roadmap collectively as a community and help us shape the future of AWS services. You can share ideas, suggestions, feature proposals, or challenges while operating AWS services, with the ability for the AWS community to upvote ideas and highlight the most sought-after improvements. Our internal teams will keep an eye on these and bring the most popular wishes to the attention of our service teams, making your voice an integral part of our product development process.
Connect people in the AWS community
On the Connect page, you’ll find many opportunities to connect directly with AWS Heroes and AWS Community Builders. You can explore and join AWS User Groups and AWS Cloud Clubs near your cities around the world.

On top of that, you can bookmark this page as your centralized hub for finding upcoming community events, making it easy to find opportunities to learn and network in your local area and meet like-minded builders who share your interests.
 Speaking of following people, AWS Builder Center makes it really straightforward to connect and engage with others, serving as the central hub for the AWS technical community. It brings together all the different ways that you can connect with fellow builders. For example, the Who to Follow section introduces you to AWS Heroes, Community Builders, and active community members who are sharing their knowledge and expertise in your areas of interest.
Explore our AWS hands-on resources
On the Build page, you’ll discover ways to get familiar with AWS with hands-on experience such as interactive learning resources designed for every skill level such as AWS Tutorials and AWS Workshops. You can explore generative AI and agentic AI services playground and find the AWS Free Tier to try out AWS services free of charge up to specified limits for each service.

Choose the Toolbox page and discover the latest tools, programming language resources, and Open Source projects for AWS. The Toolbox has everything you need to get your project scaffolded and up and running.

To improve the build experience for builders, we plan to expand Builder Center’s built-in offerings such as creating dedicated groups and forums for collaborating on a particular topic, run workshops for hands-on labs, and various service playgrounds where builders can freely experiment with AWS services.
Supporting your builder journey
The new Learn section serves as your gateway to skill development, bringing together everything you need to expand your AWS expertise. Here, you can explore learning and training resources, workshops, gamified experiences, and more to make your journey of building on AWS both educational and engaging.

Choose the Topics page, where you can explore and discover more content. You can explore content by topics and tags. There is a featured and trending topics section that helps you to stay connected with what’s capturing the community’s attention right now.

Built-in localization for your spoken language
AWS Builder Center breaks down language barriers with comprehensive localization support. All content published in the Builder Center is automatically available in 16 languages, and user-generated content, such as posts, comments, or wishes, can be machine-translated on demand using Translate. So, you can collaborate with builders worldwide, sharing knowledge and experiences across language boundaries.

By default, all content will be displayed in based on the language that your browser is set to. But, you can override this by visiting the settings page and choosing the language that you want AWS Builder Center to use by default.
Sign up and build your profile now
 AWS Builder Center gives you a more personalized and comprehensive way to showcase your AWS journey. Your unique profile comes with a custom URL and shareable QR code, making it straightforward to connect with others and share your presence in the AWS community.
All your posts, wishes, and meaningful interactions are organized within a centralized view so you can easily check them. In the Manage profile page, you can customize your profile, add specific interests and areas of expertise, helping you connect with builders who share your passions. Profile management is seamless: it synchronizes across all AWS services using AWS Builder ID, ensuring your identity remains consistent wherever you engage with AWS offerings.
Visit builder.aws.com, sign up with AWS Builder ID, and claim your unique alias to access all features, including content creation, Wishlist, and community engagement tools.
AWS Builder Center was designed to help you connect, learn, and build with fellow AWS builders, so enjoy your journey together!
Post Syndicated from Mehdi Amrane original https://aws.amazon.com/blogs/compute/orchestrating-document-processing-with-aws-appsync-events-and-amazon-bedrock/
Many organizations implement intelligent document processing pipelines in order to extract meaningful insights from an increasing volume of unstructured content (such as insurance claims, loan applications and more). Traditionally, these pipelines require significant engineering efforts, as the implementation often involves using several machine learning (ML) models and orchestrating complex workflows.
As organizations integrate these pipelines to customer facing applications (such as web applications for customers to upload documents such as insurance claims, loan approval documents and more), they set goals to provide insights in real time to increase the end customer experience. These organizations also aim to run and scale these workloads with minimal operational overhead and optimizing on costs. In addition, these organizations require the implementation of common security practices such as identity and access management, to make sure that only authorized and authenticated users are allowed to perform specific actions or access specific resources.
In this post, we show you a solution to simplify the creation of an intelligent document processing pipeline, with a web application for customers to upload their files (documents and images) and derive insights from it (summarization, fields extraction and classification). The solution primarily use serverless technologies, it includes a web socket to receive insights in real time and offers several benefits, such as automatic scaling, built-in high availability, and a pay-per-use billing model to optimize on costs. The solution also includes an authentication layer and an authorization layer to manage identities and permissions.
In this post, we provide an operational overview of the solution, and then describe how to set it up with the following services:
The solution architecture is illustrated in the following diagram:
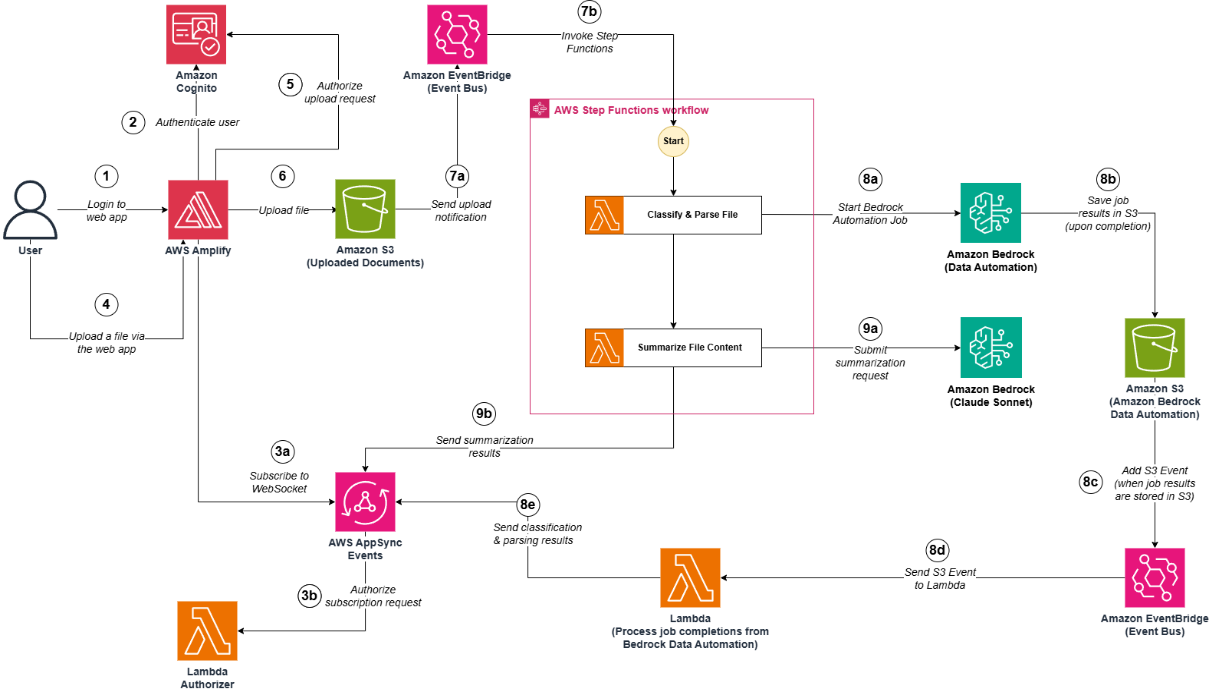
Step 1: The user authenticates to the web application (hosted in AWS Amplify).
Step 2: Amazon Cognito validates the authentication details. After this, the user is now logged in the web application.
Steps 3aand 3b:
Step 4: The user uploads a file (document or image) using the web application.
Step 5: The web application (hosted in AWS Amplify) calls Amazon Cognito (identity pool) to confirm that the user is authorized to upload a file.
Step 6: The file is uploaded in an Amazon S3 bucket.
Steps 7a and 7b: Upon reception of an Amazon S3 upload event (which notifies that the file was uploaded in the Amazon S3 bucket) in the default Amazon Event Bridge bus, an Amazon Event Bridge bus rule triggers the execution of an AWS Step Functions state machine to start the orchestration workflow.
Step 8 (Step to extract fields from a file and classify it):
Steps 9a and 9b: The second AWS Lambda function submits a prompt to an Amazon Bedrock foundation model (Sonnet 3), to request a summarization in streaming of the uploaded file. The AWS Lambda function publishes the streaming data to the web socket.
After Step 8e and Step 9b, the user can now consult the summarization result and extraction insights of the uploaded file in the web application.
To follow along and set up this solution, you must have the following:
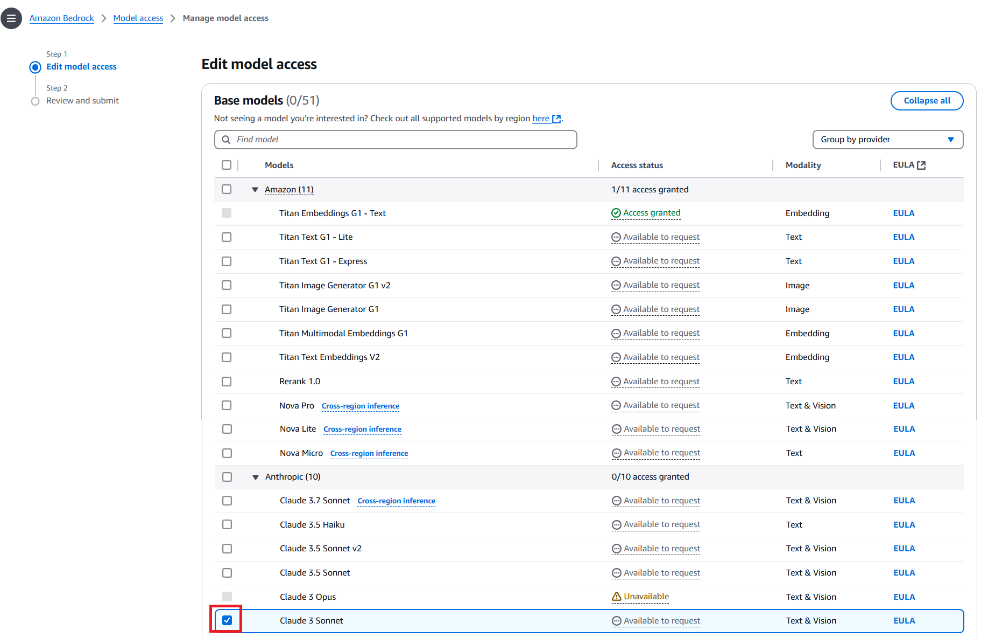
Note: Deploying this solution will incur costs. Review the pricing page of each AWS service used in this post for details on costs. The cost of running this solution will primarily depend on:
In this section, we setup an Amazon Bedrock Data Automation project and an Amazon Bedrock blueprint.
A project contains a list of blueprints, and each blueprint defines the fields to extract from different types of files (such as documents or images). In this post, we define a blueprint for a driving license.
Complete the following steps to create an Amazon Bedrock Data Automation project and a driving license blueprint:
sample-create-idp-with-appsyncevents-and-amazonbedrock folder
setup-bda-project.sh to create an Amazon Bedrock Data Automation project and a sample driving license blueprint:
In this section, we create the following resources:
Complete the following steps to create the web socket and the orchestration backend of the solution, using AWS CloudFormation templates:
create-cognito-userpool.sh script:
In this section, we create a user in our Amazon Cognito user pool. This user will log in to our web application.
Run the script create-cognito-testuser.sh to create the user (make sure to provide your email address):
After you create the user, you should receive an email with a temporary password in this format: “Your username is #your-email-address# and temporary password is #temporary-password#.”
Keep note of these login details (email address and temporary password) to use later when testing the web application.
In this section, we build a web application using AWS Amplify and publish it to make it accessible through an endpoint URL.
Complete the following steps to create the web application:
create-webapp.sh to create the web application with AWS Amplify:
deploy.sh to deploy the web application
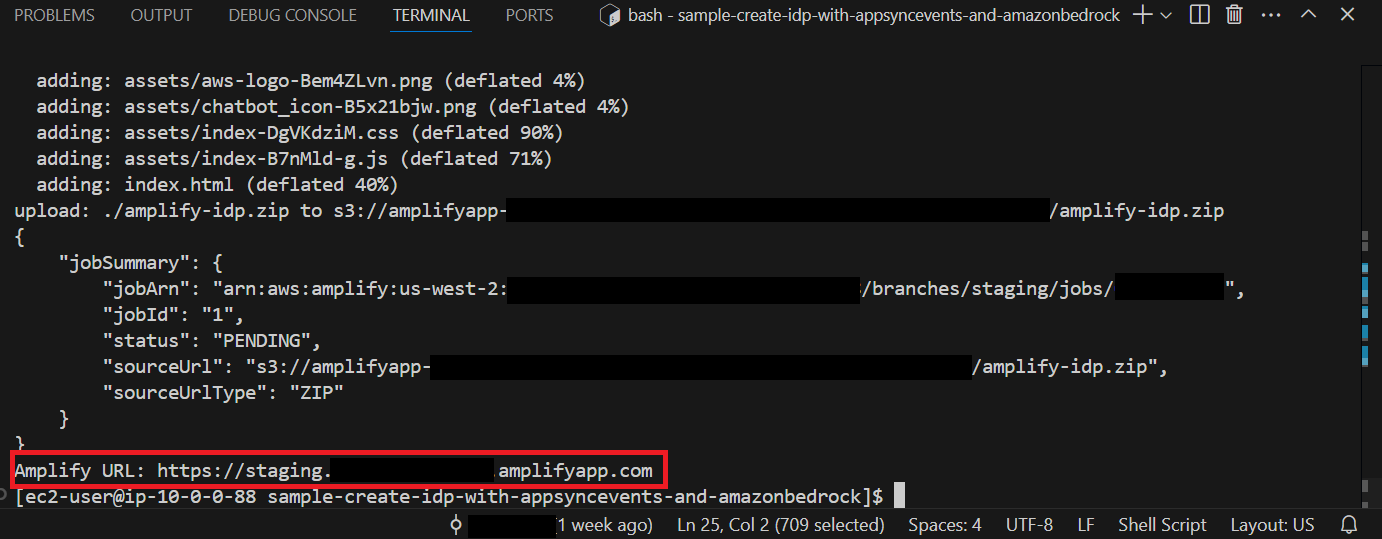
The web application is now available for testing and a URL should be displayed, as shown in the following screenshot. Take note of the URL to use in the following section.
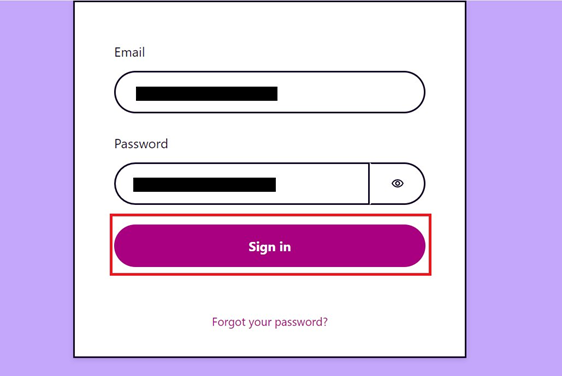
In this section, we test the web application and upload a file to be processed:
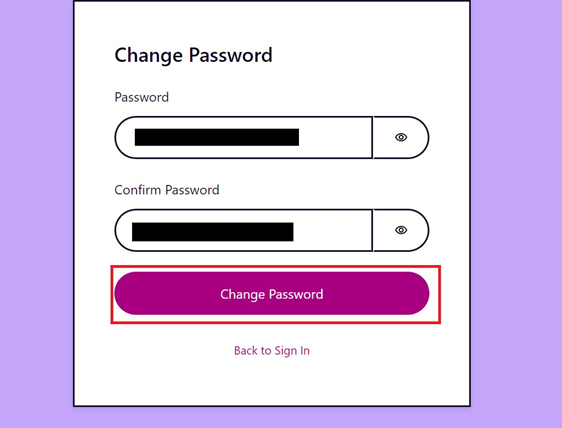
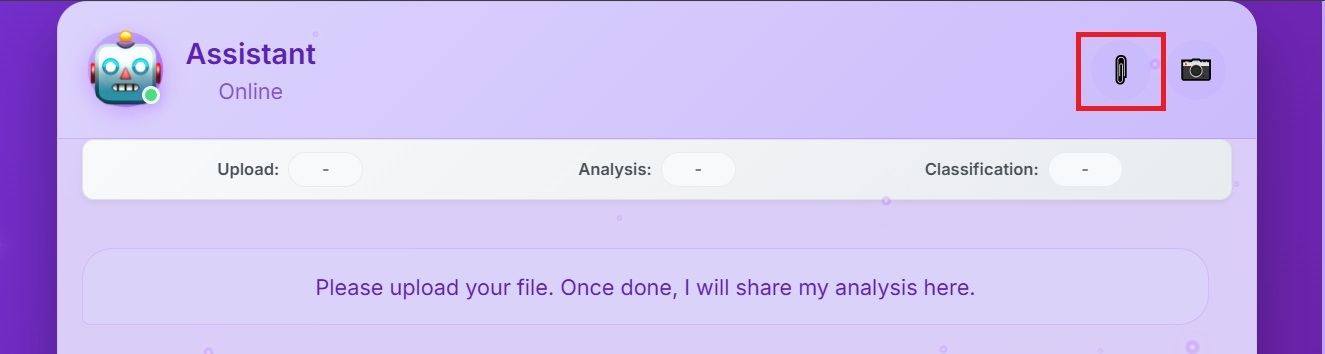
Once the file is uploaded, you should start receiving responses in the web application. When all the operations are completed, you should see a result equivalent to what is shown in the following screenshot:
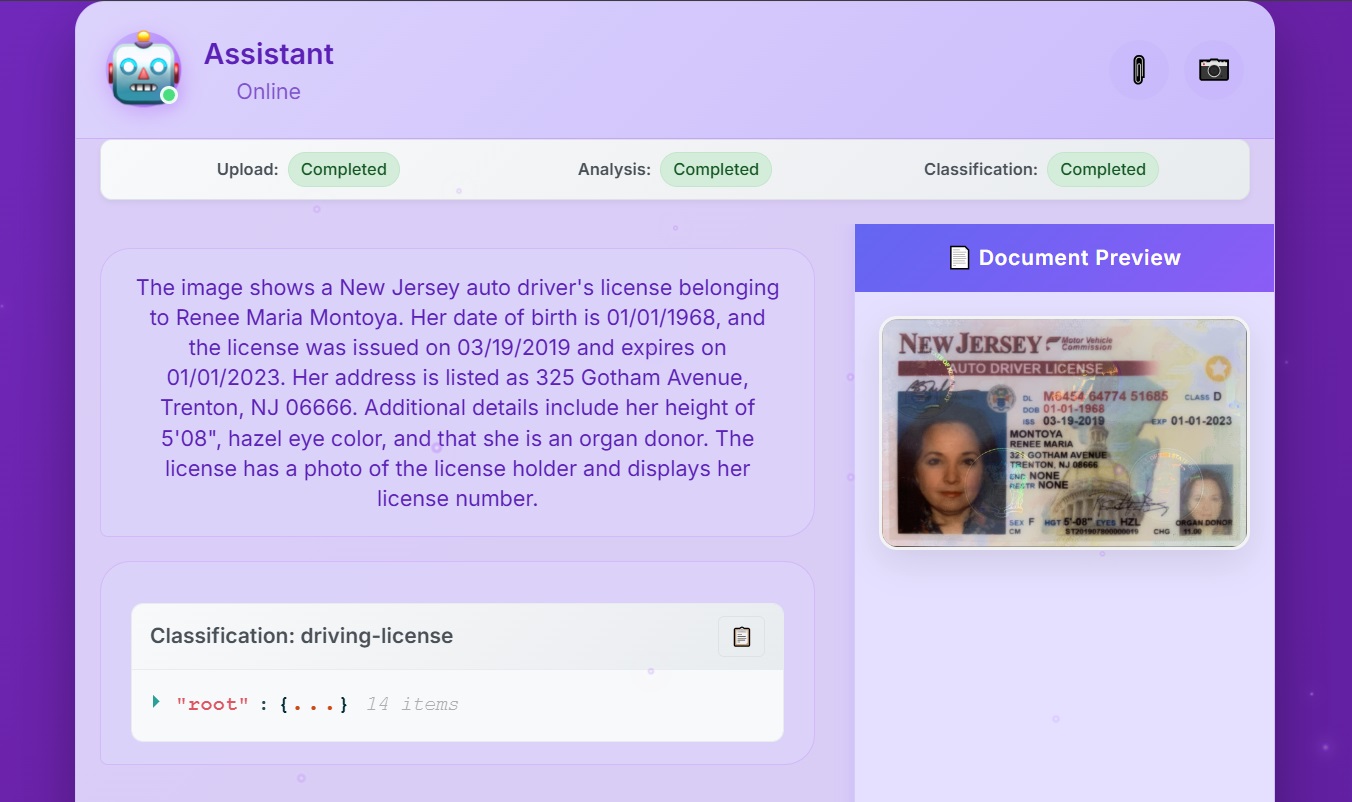
Note: If you are planning to use other driving license sample images with other formats, you may have to update the existing Bedrock Data Automation blueprint we created earlier or define a new blueprint in your Bedrock Data Automation project we created earlier for these new images to work. For more information, please review the Bedrock Data Automation documentation.
To make sure that no additional cost is incurred, remove the resources provisioned in your account. Make sure you’re in the correct AWS account before deleting the following resources.
Important note: You should exercise caution when performing the preceding steps. Make sure you are deleting the resources in the correct AWS account.
You can either navigate to the AWS CloudFormation console to delete the CloudFormation stacks associated to the resources provisioned or use the cleanup helper script cleanup.sh available at the root of the sample-create-idp-with-appsyncevents-and-amazonbedrock folder:
In this post, we walked through a solution to create a document processing pipeline, with a web application using serverless services. Via the web application, we were able to upload a file and receive responses in real time for different types of operations (summarization, extraction of specific fields and classification). First, we created an Amazon Bedrock Data Automation project (with a driving license blueprint). Then we created a web socket along with an orchestration solution using a state machine (AWS Step Functions and AWS Lambda functions). We also configured a user pool to grant a user access to the web application. Finally, we created the frontend of the web application in AWS Amplify.
To dive deeper into this solution, a self-paced workshop is available in AWS Workshop Studio.
Post Syndicated from Crosstalk Solutions original https://www.youtube.com/shorts/AhZyygqJ8Rg
Post Syndicated from jzb original https://lwn.net/Articles/1029313/
Version
3.3 of the Amarok music
player has been released. This is the first release of Amarok based on
KDE Frameworks 6
and Qt 6. Amarok 3.3
also includes a major rework of its audio engine to use GStreamer for audio
playback.
The reworked audio engine provides unified feature set for all users
and should provide a solid and future-proof sonic experience for years
to come. Notable improvements have also landed to the database system:
improved character set support helps with e.g. emojis in podcast
descriptions and other very exotic symbols, date handling has been
improved (‘year 2038 problem’), and various other potential and actual
database-related issues have been fixed.
Post Syndicated from jzb original https://lwn.net/Articles/1029312/
The AlmaLinux project has announced
new upgrade paths for its ELevate utility, which
allows users to upgrade between major versions of Red Hat Enterprise
Linux derivatives. The new paths include upgrades from AlmaLinux 9
to AlmaLinux 10 and CentOS Stream 9 to
CentOS Stream 10, with support for EPEL, Docker CE, and
PostgreSQL third-party package repositories. LWN covered ELevate last
year.
Post Syndicated from David Johnson original https://www.backblaze.com/blog/ai-in-the-open-cloud-optimizing-storage-for-ai-ml-workloads/

In a recent survey, a staggering 82% of IT leaders reported experiencing performance issues with their AI workloads within the past year, primarily due to bandwidth and data processing limitations. At the same time, 93% agreed that there’s a greater expectation within their organizations for IT leaders to minimize time-to-revenue for their AI-driven IT infrastructure.
These statistics highlight the predicament that most AI infrastructure and operations teams face today: the challenge of balancing scalability with performance while staying on budget with two of their most expensive operational expense (OpEx) line item costs. Organizations are looking for their AI initiatives to pay off, while IT teams struggle to overcome the unique data challenges they face across the AI model/workload lifecycle—including scalability, performance, and cost management.
Want to take a deeper dive into the world of object storage? Check out our latest ebook, “Why Object Storage is Ideal for AI Workloads,” and discover the advantages this architecture has to offer across the model lifecycle.

Choosing the right object storage provider is one of the most consequential decisions infrastructure teams make when building AI‑powered applications. A mis-step can introduce hidden costs, brittle performance, and operational friction that put the brakes on time‑to‑insight and undermine ROI. Selecting or transitioning between cloud-based object storage providers demands careful consideration, as capabilities can vary significantly.
To ensure your AI infrastructure is robust and cost-effective, thoroughly evaluate providers based on several critical factors:
Performance is critical when selecting a cloud-based object storage provider for AI data. Low latency and high throughput in particular are key as they ensure rapid data access and processing. Low latency minimizes delays in distributing data to GPU clusters, dramatically enhancing training and inference efficiency. Meanwhile, high throughput prevents bottlenecks and improves overall system performance when working with the massive datasets typical of AI applications.
Reliability is foundational. Even minor downtime can severely impact productivity, halt critical AI processes, and delay strategic objectives. Providers must offer clear service level agreements (SLAs) ensuring high availability, typically at 99.9% uptime or higher. Redundant architectures, data replication across regions, and reliable backup strategies are essential to maintain continuous and uninterrupted data access. Finally, when selecting a cloud-based object storage solution, data durability is table stakes.
Budget predictability is crucial for infrastructure planning and growth forecasting. Complex pricing structures, minimum retention periods, hidden fees for data transfers (egress), API requests, and retrieval charges can quickly erode cost-effectiveness. Providers should offer clear, simple pricing structures with explicit, predictable costs for all services involved. Ideally, charges for common activities such as data retrieval, ingress, and transactions should be minimized or eliminated to facilitate efficient AI workflows without unexpected budget impacts.
Rapid, consistent data accessibility is non-negotiable for AI applications, especially during model training and inference, where delays can significantly degrade performance and outcomes. Providers offering “cold” storage tiers may appear economical upfront but introduce retrieval latency that could hamper time-sensitive applications. Opting for “hot” or always-on storage tiers ensures data remains immediately accessible without incurring delays, essential for high-performance AI workloads. Data portability is another important consideration for AI workloads, as the ability to freely transfer data to the GPU cloud (or clouds) of your choosing greatly increases flexibility and reduces the risk of lock-in.
AI initiatives typically experience fluctuating data storage demands, requiring infrastructure that can seamlessly scale with growth. Effective providers offer a scalable storage model capable of handling rapid expansions in data volume without performance degradation or significant architectural changes. Elastic scalability ensures that infrastructure teams can effortlessly manage peaks in data collection, processing, and model training demands.
Security considerations cannot be overstated, particularly when dealing with sensitive or regulated data. Providers must demonstrate rigorous security standards, including data encryption (at rest and in transit), comprehensive access controls, detailed audit logs, and certifications such as SOC 2 compliance. These measures collectively ensure data integrity, protect against breaches, and ensure compliance with regulatory standards.
The open cloud is a cloud architecture and philosophy rooted in interoperability, data portability, and freedom from vendor lock-in. Unlike proprietary cloud ecosystems that tether customers to a single provider’s toolsets, APIs, and infrastructure, the open cloud is designed to enable seamless integration across platforms, tools, and environments. It supports open standards and APIs, gives users full control over their data, and allows organizations to choose best-in-class services without being locked into a single ecosystem.
In practical terms, the open cloud supports flexible data movement across public clouds, private clouds, and on-prem environments. It gives organizations the autonomy to mix and match services (e.g., compute from one provider, storage from another) and shift workloads as business or technical needs evolve—without punitive costs or excessive reconfiguration.
As organizations accelerate AI adoption, the open cloud offers clear, strategic advantages across every phase of the AI lifecycle—from data ingestion and preprocessing to training, tuning, and inference.
The Backblaze B2 Cloud Storage platform facilitates smooth integration across various AI tools and platforms, and with Backblaze B2 Overdrive, you get a product designed to move exabyte-scale datasets at up to terabit speeds without the eye-watering price tag.
B2 Overdrive gets you all the above, plus it offers a specialized solution at a fraction of competitors’ costs. Here’s what you get:
It’s built on the foundation of our always-hot cloud storage infrastructure, with no minimum file size requirements, no deletion fees, and powerful features like Event Notifications so you can build responsive and automated workflows. We’ll be sharing some of the innovations under the hood in the coming months—so, stay tuned to our series on the engineering behind performance.
The post AI in the Open Cloud: Optimizing Storage for AI/ML Workloads appeared first on Backblaze Blog | Cloud Storage & Cloud Backup
Post Syndicated from BeardedTinker original https://www.youtube.com/watch?v=O-qtc2eLkts
Post Syndicated from Enrique Salgado Hernández original https://aws.amazon.com/blogs/big-data/perform-per-project-cost-allocation-in-amazon-sagemaker-unified-studio/
Amazon SageMaker Unified Studio is a single data and AI development environment where you can find and access your data and act on it using AWS resources for SQL analytics, data processing, model development, and generative AI application development.
SageMaker Unified Studio is part of the next generation of Amazon SageMaker. SageMaker brings together AWS artificial intelligence and machine learning (AI/ML) and analytics capabilities and delivers an integrated experience for analytics and AI with unified access to data.
With SageMaker Unified Studio, you can create domains and projects, providing a single interface to build, deploy, execute, and monitor end-to-end workflows. This approach helps drive collaboration across teams and facilitates agile development.
SageMaker Unified Studio implements resource tagging when AWS resources are provisioned. You can use these tags to track and allocate costs for the various resources created as part of the domains and projects within SageMaker Unified Studio.
This post demonstrates how to perform cost allocation using these resource tags, so finance analysts and business analysts can implement and follow Financial Operations (FinOps) best practices to control and track cloud infrastructure costs.
The following diagram illustrates how tagging works within SageMaker domains.

Before reviewing the implementation details, let’s explore several key SageMaker concepts: domain, project, project profile, and environment blueprint. For more information, refer to the SageMaker Unified Studio Administrator Guide.
For effective cost tracking and allocation, make sure your SageMaker resources have proper tags. You can configure these as cost allocation tags to group and filter across AWS Billing and Cost Management tools (such as AWS Cost Explorer and AWS Data Exports).
As of this writing, SageMaker domains support tagging at the blueprint, domain, project, and environment level. When you create projects or add resources within an existing project, the following tags are automatically added to resources through CloudFormation resource tags, configured for each blueprint stack:
To track costs in SageMaker Unified Studio, you will perform the following steps:
This post requires the following configurations in your AWS account:
Either legacy AWS Cost and Usage Reports (AWS CUR) with Amazon Athena integration or Data Exports configured and integrated with Athena for queries. For setup instructions, refer to creating Data Exports.
Complete the following steps to set up your domain and project:
After domain creation, you will be redirected to the domain overview page.


After the project is created, you will be redirected to the project overview page. Record the project ID and domain ID.

As mentioned earlier, to track costs in SageMaker Unified Studio, you must configure cost allocation tags. Refer to Organizing and tracking costs using AWS cost allocation tags for more information about this feature.
Complete the following steps:
AmazonDataZoneDomainAmazonDataZoneProjectAmazonDataZoneEnvironmentAmazonDataZoneBlueprintThe AmazonDataZoneProject and AmazonDataZoneDomain tags correspond to the project and domain ID values you recorded earlier.

Cost allocation tags configuration doesn’t apply retroactively. If you want to monitor costs associated with these tags in the AWS Billing and Cost Management tools before the activation date, you must request a cost allocation tag backfill. The backfill operation can take several hours to complete.
This section explains how to generate costs associated with the underlying data backend (Amazon Redshift in this case) to examine them using AWS billing tools. You can skip this section if you’re tracking costs on an active project.
To generate costs, we use the table structure used in the Redshift Immersion Labs. Refer to Create Tables for more details.
To run queries in SageMaker Unified Studio, follow these steps:

dev database.project schema.

After running these steps, you will have generated some Amazon Redshift costs that will be present for further analysis in AWS Billing and Cost Management tools. However, these tools (Cost Explorer and Data Exports) are refreshed least one time every 24 hours, so you might need to wait up to 24 hours before proceeding to the next section.
With the cost allocation tags enabled, you can use AWS Billing and Cost Management tools to analyze and track costs, including Cost Explorer and Data Exports. For more information about using these tools, refer to the AWS Billing and Cost Management User Guide.
You can check your SageMaker Unified Studio costs using Cost Explorer. With this tool, you can view and analyze your costs and usage through an interface with pre-built filters and aggregation capabilities for various metrics. For more information, refer to the Analyzing your costs and usage with AWS Cost Explorer.
To access Cost Explorer, complete the following steps:
AWS can take up to 24 hours to prepare your cost data.
AmazonDataZoneProject).
The following screenshot shows a sample report.


AmazonDataZoneProject and choose the value of the project you want to inspect (in this case, 4z9d694nbsnyqx).
The results should look similar to the following screenshot.

With Data Exports, you can query your cost and usage in AWS with the maximum flexibility degree compared to other tools such as Cost Explorer. It provides a comprehensive set of measures and dimensions that you can include in the export to create a personalized report. This report is then delivered to Amazon Simple Storage Service (Amazon S3) so you can configure it with Athena, so it can be queried using SQL or business intelligence (BI) tools such as Amazon QuickSight.
This post assumes you have already configured a data export and you have it integrated with Athena (refer to Processing data exports for more information). For instructions on setting up CUR and Athena integration, refer to Creating reports.
Use the following query to check costs by project:
Results will look similar to the following screenshot on the Athena console.

The preceding query shows your costs grouped by:
To check costs for a specific SageMaker Unified Studio project (for example, the sample project 4z9d694nbsnyqx created during this walkthrough), you can use the following query:
If you enabled Athena to work with Data Exports, you can also configure QuickSight to query this data source. With QuickSight, you can create interactive dashboards to track SageMaker costs in SageMaker Unified Studio at scale.
To create CUR dashboards in QuickSight, first complete the following steps:

The next step is to create a dataset in QuickSight using a SQL query. For instructions on creating a dataset with SQL, refer to Using SQL to customize data. Use the following SQL expression:

The preceding query includes only cost and usage data that’s tagged with either user_amazon_data_zone_environment or user_amazon_data_zone_project to focus on SageMaker associated costs. To include other AWS costs, you must modify these filters.
Using the authoring capabilities of QuickSight, you can create interactive dashboards where business stakeholders can explore and track costs associated with SageMaker Unified Studio projects. You can use these dashboards to review relevant cost metrics at a glance that are derived from the Data Exports dimensions and metrics included in your dataset, as shown in the following screenshot. For more information about adding visuals to analyses, refer to Adding visuals to Amazon QuickSight analyses.

The preceding example shows a dashboard built using QuickSight connected to a Data Exports dataset. The dashboard contains the following visuals:
Using this approach (QuickSight and Data Exports), you can create highly customizable dashboards to explore and monitor your SageMaker Unified Studio costs. Furthermore, you can create automated reports using the QuickSight reporting feature to send these by email to the relevant stakeholders.
Delete the resources you created as part of this post when you’re done with them to avoid monthly charges. This includes SageMaker resources, created Data Export reports and the QuickSight subscription (in case it was created to visualize costs).
For more information about managing Data Exports, refer to Deleting exports.
delete to confirm.IMPORTANT NOTE: Before unsubscribing, make sure you backed up any dashboards or analyses you want to keep. After deletion, you can’t recover your QuickSight assets. For more information about managing your QuickSight subscription, refer to Deleting your Amazon QuickSight subscription and closing the account.
Managing costs on a unified platform like SageMaker can seem challenging because it aggregates many tools and services with different cost models. In this post, we showed how to use AWS Billing and Cost Management tools to aggregate and categorize costs across the various services used within SageMaker. With this approach, you can monitor and track respective service costs, either in aggregate or focusing on a particular project.
Start taking control of your analytics and ML costs today. With AWS Billing and Cost Management tools with SageMaker, you can:
For further reading, refer to Analyzing your costs and usage with AWS Cost Explorer and Processing Data Exports (using Athena).
 Enrique Salgado Hernández is a Senior Specialist Solutions Architect at AWS with more than 10 years of experience working in the cloud. He specializes in designing and implementing large-scale analytics architectures across various industry sectors. He is passionate about working with customers to solve their problems by supporting them during their cloud journey.
 Angel Conde Manjon is a Senior EMEA Data & AI PSA, based in Madrid. He previously worked on research related to data analytics and AI in diverse European research projects. In his current role, Angel helps partners develop businesses centered on data and AI.
Post Syndicated from jake original https://lwn.net/Articles/1028299/
It is no secret that the Python packaging world is at something of a
crossroads; there have been debates and discussions about the packaging
landscape that started long before our 2023
series describing some of the difficulties. There has been progress
since then—and incremental improvements all along, in truth—but a new
initiative is looking to overhaul packaging for the language. At PyCon US 2025, Barry Warsaw and
Jonathan Dekhtiar gave a presentation on the WheelNext project, which is a community
effort that aims improve the experience for users and providers of Python
packages while also working with toolmakers and other parts of the
ecosystem to “reinvent the wheel
“. While the project’s name refers
to Python’s wheel
binary distribution format, its goals stretch much further than simply the
format.
Post Syndicated from jzb original https://lwn.net/Articles/1029278/
Security updates have been issued by AlmaLinux (container-tools:rhel8, jq, kernel, podman, python-setuptools, socat, and thunderbird), Gentoo (Chromium, Google Chrome, Microsoft Edge. Opera, ClamAV, Git, NTP, REXML, and strongSwan), Oracle (buildah, gnome-remote-desktop, ipa, jq, kernel, podman, python-setuptools, ruby:3.3, socat, uek-kernel, and xorg-x11-server-Xwayland), SUSE (kernel), and Ubuntu (freerdp3, git, gnupg2, linux-aws, linux-oracle, linux-azure, linux-azure, linux-azure-6.11, linux-fips, linux-aws-fips, linux-azure-fips, linux-gcp-fips, linux-ibm-5.15, linux-intel-iotg, linux-nvidia-tegra,
linux-nvidia-tegra-5.15, linux-nvidia-tegra-igx, linux-kvm, linux-lowlatency, linux-oem-6.11, and onionshare).
Post Syndicated from Sam Sabinash original https://www.servethehome.com/sandisk-extreme-portable-ssd-an-external-2tb-usb-type-c-ssd/
We review the SanDisk Extreme Portable SSD. We see how this external 2TB USB Type-C SSD performs compared to drives from Samsung and Crucial
The post SanDisk Extreme Portable SSD an External 2TB USB Type-C SSD appeared first on ServeTheHome.
Post Syndicated from The Atlantic original https://www.youtube.com/watch?v=puUrR3nwoSI
Post Syndicated from The History Guy: History Deserves to Be Remembered original https://www.youtube.com/watch?v=-RHooQZzR0I
Post Syndicated from Bruce Schneier original https://www.schneier.com/blog/archives/2025/07/yet-another-strava-privacy-leak.html
This time it’s the Swedish prime minister’s bodyguards. (Last year, it was the US Secret Service and Emmanuel Macron’s bodyguards. in 2018, it was secret US military bases.)
This is ridiculous. Why do people continue to make their data public?
Post Syndicated from The History Guy: History Deserves to Be Remembered original https://www.youtube.com/shorts/6Ty71X_f6j4
Post Syndicated from Explosm.net original https://explosm.net/comics/confidence
New Cyanide and Happiness Comic
Post Syndicated from xkcd.com original https://xkcd.com/3113/