How We Reduced the Impact of Zombie Clients

Post Syndicated from Let's Encrypt original https://letsencrypt.org/2025/06/04/how-we-reduced-the-impact-of-zombie-clients/

Every night, right around midnight (mainly UTC), a horde of zombies wakes up and clamors for … digital certificates!

The zombies in question are abandoned or misconfigured Internet servers and ACME clients that have been set to request certificates from Let’s Encrypt. As our certificates last for at most 90 days, these zombie clients’ software knows that their certificates are out-of-date and need to be replaced. What they don’t realize is that their quest for new certificates is doomed! These devices are cursed to seek certificates again and again, never receiving them.

But they do use up a lot of certificate authority resources in the process.

The Zombie Client Problem

Unlike a human being, software doesn’t give up in frustration, or try to modify its approach, when it repeatedly fails at the same task. Our emphasis on automation means that the vast majority of Let’s Encrypt certificate renewals are performed by automated software. This is great when those renewals succeed, but it also means that forgotten clients and devices can continue requesting renewals unsuccessfully for months, or even years.

How might that happen? Most often, it happens when a device no longer has a domain name pointed to it. The device itself doesn’t know that this has changed, so it treats renewal failures as transient even though they are actually permanent. For instance:

  • An organization may have allowed a domain name registration to lapse because it is no longer needed, but its servers are still configured to request certs for it.
  • Or, a home user stopped using a particular dynamic-DNS domain with a network-attached storage device, but is still using that device at home. The device doesn’t realize that the user no longer expects to use the name, so it keeps requesting certs for it.
  • Or, a web hosting or CDN customer migrated to a different service provider, but never informed the old service provider. The old service provider’s servers keep requesting certs unsuccessfully. If the customer was in a free service tier, there might not be invoices or charges reminding the customer to cancel the service.
  • Or any number of other, subtler changes in a subscriber’s infrastructure, such as changing a firewall rule or some webserver configuration.

At the scale of Let’s Encrypt, which now covers hundreds of millions of names, scenarios like these have become common, and their impact has become substantial. In 2024, we noticed that about half of all certificate requests to the Let’s Encrypt ACME API came from about a million accounts that never successfully complete any validations. Many of these had completed validations and issued certificates sometime in the past, but nowadays every single one of their validation attempts fails, and they show no signs that this will change anytime soon.

Unfortunately, trying to validate those futile requests still uses resources. Our CA software has to generate challenges, reach out and attempt to validate them over the Internet, detect and report failures, and record all of the associated information in our databases and audit logs. And over time, we’ve seen more and more recurring failures: accounts that always fail their issuance requests have been growing at around 18% per year.

In January, we mentioned that we had been addressing the zombie client problem through our rate limit system. This post provides more detail on that progress. 

Our Rate Limit Philosophy

If you’ve used Let’s Encrypt as a subscriber, you may have run into one of our rate limits at some point, maybe during your initial setup process. We have eight different kinds of rate limits in place now; as our January post describes, they’ve become more algorithmically sophisticated and grown to address a wider range of problems. A key principle for Let’s Encrypt is that our rate limiting is not a punishment. We don’t think of rate limits as a way of retaliating against a client for misbehavior. Rate limits are simply a tool to maximize the efficient use of our limited resources and prevent people and programs from using up those resources for no constructive purpose.

We’ve consistently tried to design our rate limit mechanisms in line with that philosophy. So if a misconfiguration or misunderstanding has caused excessive requests in the past, we’re still happy to welcome the user in question back and start issuing them certificates again—once the problem has been addressed. We want the rate limits to put a brake on wasteful use of our systems, but not to frustrate users who are actively trying to make Let’s Encrypt work for them.

In addition, we’ve always implemented our rate limits to err on the side of permissiveness. For example, if the Redis instances where rate limits are tracked have an outage or lose data, the system is designed to permit more issuance rather than less issuance as a result.

We wanted to create additional limits that would target zombie clients, but in a correspondingly non-punitive way that would avoid any disruption to valid issuance, and welcome subscribers back quickly if they happened to notice and fix a long-time problem with their setups.

In planning a new zombie-specific response, we decided on a “pausing” approach, which can temporarily limit an account’s ability to proceed with certificate requests. The core idea is that, if a particular account consistently fails to complete validation for a particular hostname, we’ll pause that account-hostname pair. The pause means that any new order requests from that account for that hostname will be rejected immediately, before we get to the resource-intensive validation phase.

This approach is more finely targeted than pausing an entire account. Pausing account-hostname pairs means that your ability to issue certs for a specific name could be paused due to repeated failures, but you can still get all of your other certs like normal. So a large hosting provider doesn’t have to fear that its certificate issuance on behalf of one customer will be affected by renewal failures related to a problem with a different customer’s domain name. The account-specificity of the pause, in turn, means that validation failures from one subscriber or device won’t prevent a different subscriber or device from attempting to validate the same name, as long as the devices in question don’t share a single Let’s Encrypt account.

In September 2024, we began applying our zombie rate limits manually by pausing about 21,000 of the most recurrently-failing account-hostname pairs, those which were consistently repeating the same failed requests many times per day, every day. After implementing that first round of pauses, we immediately saw a significant impact on our failed request rates. As we announced at that time, we also began using a formula to automatically pause other zombie client account-hostname pairs from December 2024 onward. The associated new rate limit is called “Consecutive Authorization Failures per Hostname Per Account” (and is independent of the existing “Authorization Failures per Hostname Per Account” limit, which resets every hour).

This formula relates to the frequency of successive failed issuance requests for the same domain name by the same Let’s Encrypt account. It applies only to failures that happen again and again, with no successful issuances at all in between: a single successful validation immediately resets the rate limit all the way to zero. Like all of our rate limits, this is not a punitive measure but is simply intended to reduce the waste of resources. So, we decided to set the thresholds rather high in the expectation that we would catch only the most disruptive zombie clients, and ultimately only those clients that were extremely unlikely to succeed in the future based on their substantial history of failed requests. We don’t hurry to block requesters as zombies: according to our current formula, client software following the default established by EFF’s Certbot (two renewal attempts per day) would be paused as a zombie only after about ten years of constant failures. More aggressive failed issuance attempts will get a client paused sooner, but clients will generally have to fail hundreds or thousands of attempts in a row before they are paused.

Most subscribers using mainstream client applications with default configurations will never encounter this rate limit, even if they forget to deactivate renewal attempts for domains that are no longer pointed at their servers. As described below, our current limit is already providing noticeable benefits with minimal disruption, and we’re likely to tighten it a bit in the near future, so it will trigger after somewhat fewer consecutive failures.

Self-Service Unpausing

A key feature in our zombie issuance pausing mechanism is self-service unpausing. Whenever an account-hostname pair is paused, any new certificate requests for that hostname submitted by that account are immediately rejected. But this means that the “one successful validation immediately resets the rate limit counter” feature can no longer come into effect: once they’re paused, they can’t even attempt validation anymore.

So every rejection comes with an error message explaining what has happened and a custom link that can be used to immediately unpause that account-hostname pair and remove any other pauses on the same account at the same time. The point of this is that subscribers who notice at some point that issuance is failing and want to intervene to get it working again have a straightforward option to let Let’s Encrypt know that they’re aware of the recurring failures and are still planning to use a particular account. As soon as subscribers notify us via the self-service link, they’ll be able to issue certificates again.

Currently, the user interface for an affected subscriber looks like this:
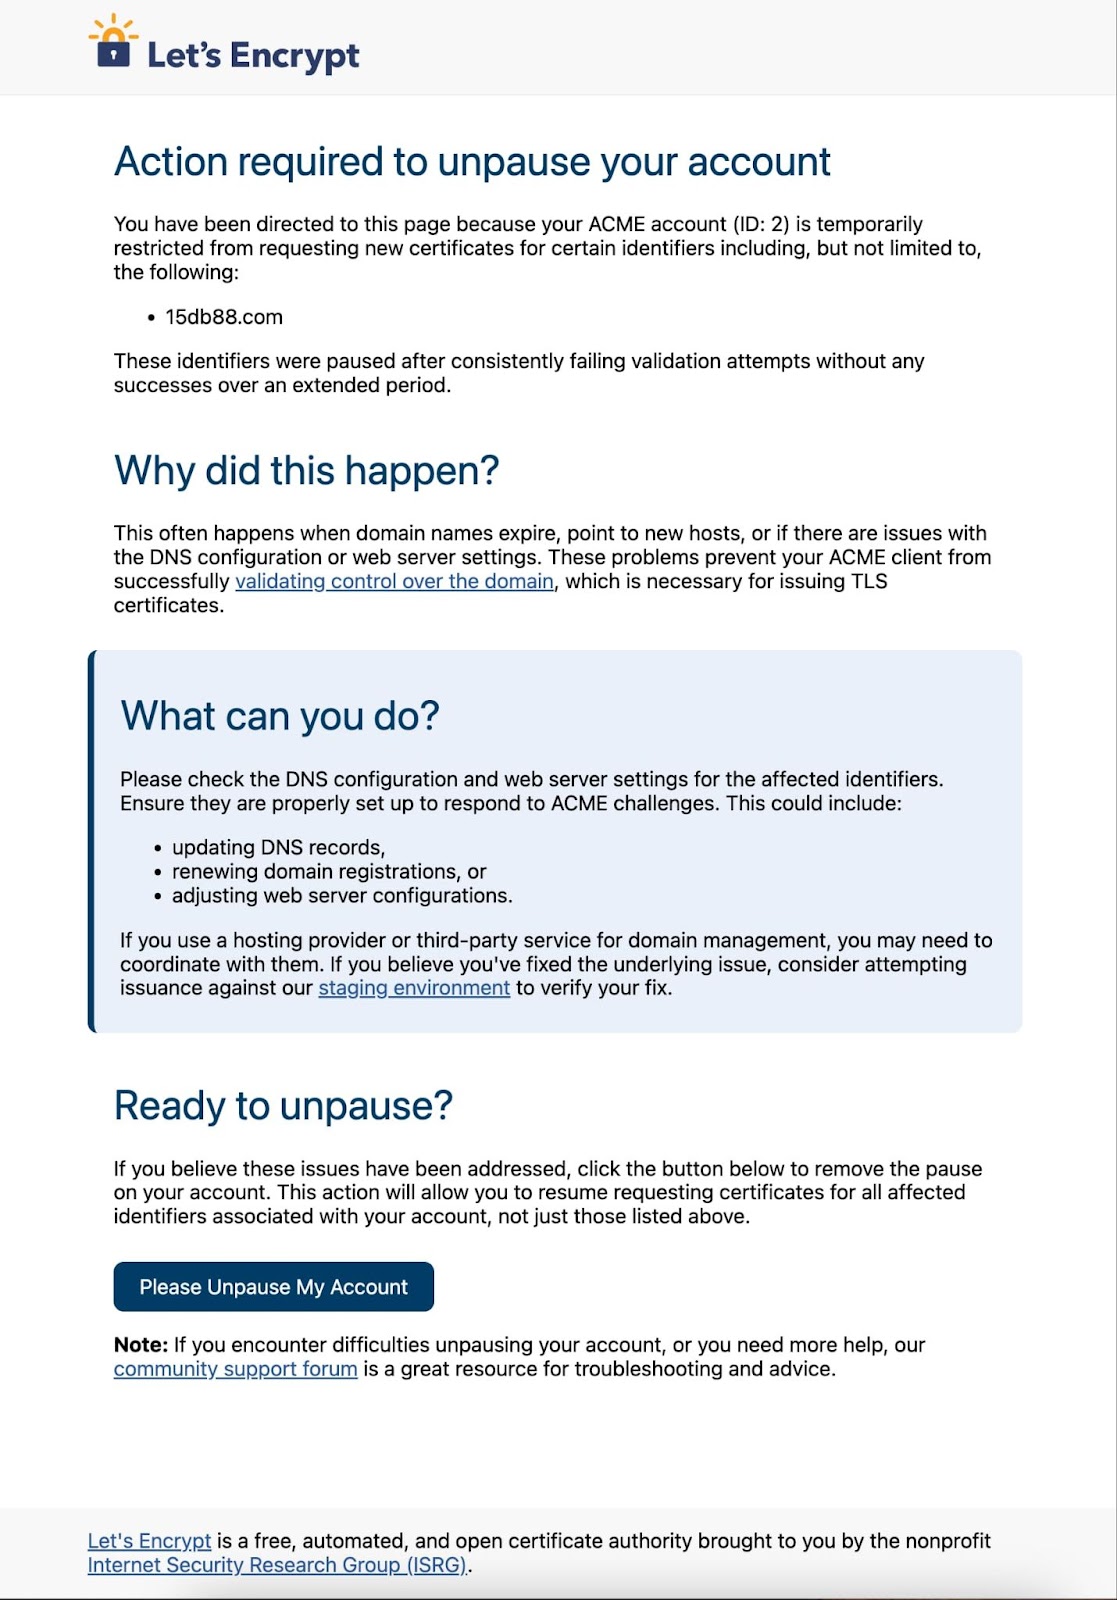
Let's Encrypt unpause interface

This link would be provided via an ACME error message in response to any request that was blocked due to a pause account-hostname pair.

As it’s turned out, the unpause option shown above has only been used by about 3% of affected accounts! This goes to show that most of the zombies we’ve paused were, in fact, well and truly forgotten about.

However, the unpause feature is there for whenever it’s needed, and there may be cases when it will become more important. A very large integration could trigger the zombie-related rate limits if a newly-introduced software bug causes what looks like a very high volume of zombie requests in a very short time. In that case, once that bug has been noticed and fixed, an integrator may need to unpause its issuance on behalf of lots of customers at once. Our unpause feature permits unpausing 50,000 domain names on a single account at a time, so even the largest integrators can get themselves unpaused expeditiously in this situation.

Conclusion

We’ve been very happy with the results of our zombie mitigation measures, and, as far as we can tell, there’s been almost no impact for subscribers! Our statistics indicate that we’ve managed to reduce the load on our infrastructure while causing no detectable harm or inconvenience to subscribers’ valid issuance requests.

Since implementing the manual pauses in September and the automated pauses in December, we’ve seen:

  • Over 100,000 account-hostname pairs have been paused for excessive failures.
  • We received zero (!) associated complaints or support requests.
  • About 3,200 people manually unpaused issuance.
  • Failed certificate orders fell by about 30% so far, and should continue to fall over time as we fine-tune the rate limit formula and catch more zombie clients.

The new rate limit and the self-service unpause system are also ready to deal with circumstances that might produce more zombie clients in the future. For instance, we’ve announced that we’re going to be discontinuing renewal reminder emails soon. If some subscribers overlook failed renewals in the future, we might see more paused clients that result from unintentional renewal failures. We think taking advantage of the existing self-service unpause feature will be straightforward in that case. But it’s much better to notice problems and get them fixed up front, so please remember to set up your own monitoring to avoid unnoticed renewal failures in the future.

If you’re a subscriber who’s had occasion to use the self-service unpause feature, we’d love your feedback on the Community Forum about your experience using the feature and the circumstances that surrounded your account’s getting paused.

Also, if you’re a Let’s Encrypt client developer, please remember to make renewal requests at a random time (not precisely at midnight) so that the load on our infrastructure is smoothed out. You can also reduce the impact of zombie renewals by repeating failed requests somewhat less frequently over time (a “back-off” strategy), especially if the failure reason makes it look like a domain name may no longer be in use at all.

Introducing managed query results for Amazon Athena

Post Syndicated from Guy Bachar original https://aws.amazon.com/blogs/big-data/introducing-managed-query-results-for-amazon-athena/

Amazon Athena makes it simple to analyze data without having to set up and manage data processing infrastructure. However, traditionally, you needed to set up an Amazon Simple Storage Service (Amazon S3) bucket to store query results before they could run queries with Athena. The need arose to make it even simpler to start using Athena, with fewer setup steps.

That’s why we’re thrilled to introduce managed query results, a new Athena feature that automatically stores, secures, and manages the lifecycle of query result data for you at no additional cost. Managed query results simplifies your user experience by removing the need to create or choose an S3 bucket in your account to hold results before you run queries. It helps reduce your monthly cost by shifting temporary storage of query results from your S3 bucket to Athena, and eliminates the need for separate processes to delete query result data from your S3 bucket after it’s no longer needed. Now, Athena offers both service managed, temporary result storage and customer managed Amazon S3 storage options to meet different needs.

What’s more, using managed query results doesn’t require complex changes to applications that read query results from existing Athena interfaces, and increases data security. Access to managed query result data is now associated with AWS Identity and Access Management (IAM) permissions scoped to individual Athena workgroups, instead of S3 buckets. Additionally, you can automatically encrypt result data with AWS Key Management Service (AWS KMS) using AWS owned or customer managed keys.

In this post, we demonstrate how to get started with managed query results and, by removing the undifferentiated effort spent on query result management, how Athena helps you get insights from your data in fewer steps than before.

Solution overview

When you use managed query results, you no longer need to create and choose S3 buckets to store query results, or manage lifecycle rules to make sure the result data is eventually cleaned up. The following are some scenarios where this is beneficial:

  • Financial analysts working in teams analyzing market data, each covering different investment areas or financial instruments, might use different workgroups for different kinds of analyses or projects. Now, analysts don’t need to spend time setting up S3 buckets or worry about cleaning up query results when their work is done.
  • Compliance teams can run audit queries on transaction data for regulatory reporting while making sure only authorized team members can access sensitive query results through IAM permissions. Because query results are cleaned up automatically, the compliance team no longer requires separate processes to delete query result data.
  • Data and analytics and platform automation teams who are responsible for streamlined onboarding of new users and teams no longer need to configure individual S3 buckets and permissions for different users and teams, simplifying their automation code.

The following are some of the key features of managed query results in Athena:

  • It removes the need to choose an S3 bucket location before you run queries.
  • There is no additional cost to store your query results, and query results are automatically deleted after a period of time, reducing management overhead from separate bucket cleanup processes.
  • It’s straightforward to get started: new and preexisting workgroups can be seamlessly configured to use managed query results. You can have a mix of Athena managed and customer managed query results in your AWS account.
  • You can use streamlined IAM permissions with access to read results using GetQueryResults and GetQueryResultsStream tied to individual workgroups.
  • Query results are automatically encrypted with your choice of AWS owned or customer managed KMS keys.

Let’s walk through how to get started with managed query results.

Configure your workgroup

Complete the following steps to configure your workgroup:

  1. On the Athena console, choose Workgroups in the navigation pane.
  2. Choose Create workgroup.

Alternatively, you can select an existing workgroup and choose Edit.

  1. For Query result configuration, select Athena managed.
  2. Navigate to the Athena console. To create a new workgroup, in the Workgroups page select the Create Workgroup button. To edit an existing workgroup, select a workgroup from the list and in the workgroup detail page, select the Edit button. Under Query result configuration section, you will see the option for Athena managed:
  3. For Encrypt query results, choose your preferred encryption method

Query result configuration

Figure 1: Query result configuration

Step 2: Configure Encryption

Choose your preferred encryption method for query results:

    1. Encrypt using an AWS owned key – This is the default option. It indicates that you want query results to be encrypted and decrypted by an AWS owned key.
    2. Encrypt using a customer managed key – Choose this option if you want to encrypt and decrypt query results with your own key. To have Athena use your customer managed key, specify the Athena service in the Principal elements of the key policy. For more information, see Setup an AWS KMS key policy for managed storage. To run queries, the user querying data needs permission to access your key.

Query your data

After you’ve configured your workgroup for managed query results, you can immediately start running queries. Let’s run a sample query against the AWS Cost and Usage Report.

The Athena console banner indicates that our workgroup, demo-workgroup, was updated to use managed query results. Our query ran successfully, and we didn’t need to set up an S3 bucket. To download these results, choose Download results CSV.

Running a query against the Cost and Usage report in the Athena console

Figure 2: Running a query against the Cost and Usage report in the Athena console

You can access these results through the Athena console and using the Athena APIs.

Accessing the query results via the Athena API

Figure 3: Accessing the query results via the Athena API

Conclusion

In this post, we introduced managed query results, a new Athena feature that streamlines the query experience through automated storage of query results, provides automatic cleanup, and limits query result access with IAM permissions. Managed query results reduces operational overhead, empowering both data analysts running interactive queries and teams building complex analytics pipelines to focus on deriving insights rather than managing infrastructure. We demonstrated how to configure workgroups for managed storage and effectively use this feature in query scenarios.

To start using managed query results with Athena, simply configure your workgroups through the Athena console or APIs. For more information, see Managed query results.


About the Authors

Guy Bachar is a Sr. Solutions Architect at AWS. He specializes in assisting capital markets and FinTech customers with their cloud transformation journeys. His expertise encompasses identity management, security, and unified communication.

Sayan Chakraborty is a Sr. Solutions Architect at AWS. He helps large enterprises build secure, scalable, and performant solutions on AWS. With a background in enterprise and technology architecture, he has experience delivering large-scale digital transformation programs across a wide range of industry verticals.

Darshit Thakkar is a Technical Product Manager at AWS and works out of Boston, Massachusetts. He works closely with customers to understand how they use data, and drives product innovations that make data more actionable at scale.

Dynamically routing requests with Amazon API Gateway routing rules

Post Syndicated from Anton Aleksandrov original https://aws.amazon.com/blogs/compute/dynamically-routing-requests-with-amazon-api-gateway-routing-rules/

Effective API management and routing capabilities are crucial for organizations managing complex application architectures. Whether you’re a technology company rolling out new API versions to millions of users, or a financial services organization conducting A/B tests to optimize customer experiences, the ability to route API traffic dynamically and efficiently is essential.

Today, Amazon API Gateway announces support for dynamic routing rules for custom domain names in all supported AWS Regions. This new capability enables you to route API requests based on HTTP header values, either independently or in combination with URL paths. In this post, you will learn how to use this new capability to implement routing strategies such as API versioning and gradual rollouts without modifying your API endpoints.

Dynamic Routing Rules Overview

Many organizations require dynamic API routing capabilities to support their evolving business needs. As a line-of-business persona, you want to be able to test new user experiences with specific customer segments, while maintaining their existing flows intact. As an engineer, you want to be able to maintain multiple API versions across different client applications while ensuring regulatory compliance. Prior to this launch, developers using API Gateway implemented dynamic routing by using different URL paths, such as “/v1/products” and “/v2/products”.

With this new launch, you can implement dynamic routing logic with a simple declarative configuration within the custom domain name settings. The new routing rule mechanism allows you to make routing decisions based on HTTP headers, base paths, or a combination of both. Developers are no longer required to create new or alter existing paths to smoothly transition between API versions, they can simply specify the desired value in the request HTTP header. Among other possibilities, you can implement cell-based architecture routing, A/B testing, or dynamic backend selection based on hostname, tenant ID, accepted response media type, or cookie value. By implementing routing logic directly within the API Gateway, you can eliminate proxy layers and complex URL structures while maintaining fine-grained control over your API traffic. This new feature seamlessly integrates with existing API Gateway capabilities and supports both public and private REST APIs. The following diagram shows how you can use routing rules for header and base-path based routing. This example uses a single level resource /products to show path matching, however depending on your use-case you could also use multi-level paths like /products/items.

Figure 1. Using routing rules for header and base-path based routing

In the following section you’ll learn how to implement header-based routing, use the new routing rules construct for common scenarios like API versioning and A/B testing, and configure rules with different routing conditions and priorities to achieve the desired behavior.

What is a routing rule

A routing rule is a new resource type uniquely associated with a single custom domain. It represents a collection of conditions that, when matched, cause the incoming request to be forwarded to a specific API and stage. Routing rules have three configuration properties:

  • The Conditions property defines the criteria that must be met for actions to be taken. A rule can include up to two header conditions and one base path condition, and all specified conditions must be met to trigger the action. If no conditions are defined for a rule, it serves as a catch-all rule matching all requests.
  • The Actions property defines what actions will be taken when rule conditions are met. At the time of this launch the supported action is invoking any stage of any REST API within the same account and region boundaries.
  • The Priority property defines the order that rules are evaluated in, with 1 being highest priority and 1,000,000 the lowest. You cannot reuse same priority value for more than one rule. AWS recommends you leave ample space between sequential rules to make it easy to add new rules in future, for example use 100, 200, 300 instead of 1, 2, 3.

Header conditions, specified via a MatchHeaders property, are used to match HTTP request header values, such as x-version=v1. Conforming to RFC 7230, header names are not case sensitive, while header values are. You can also use wildcards in header values for prefix, suffix, and contains match. See the following examples using AWS CloudFormation templates:

Exact match:

- MatchHeaders: 
	AnyOf: 
		- Header: "x-version" 
		ValueGlob: "alpha-v2-latest"

Will only match x-version=alpha-v2-latest

Prefix match:

- MatchHeaders: 
	AnyOf: 
	- Header: "x-version" 
	ValueGlob: "*latest"

Matches x-version=alpha-v2-latest, but not x-version=alpha-v2

Suffix match:

- MatchHeaders: 
	AnyOf: 
		- Header: "x-version" 
		ValueGlob: "alpha*"

Will match x-version=alpha-v2-latest and x-version=alpha-v1, but not x-version=beta-v1

Prefix and suffix match.

- MatchHeaders: 
	AnyOf: 
		- Header: "x-version" 
		ValueGlob: "*v2*"

Matches x-version=alpha-v2-latest and x-version=beta-v2-test, but not x-version=alpha-v1

Base path condition, specified via MatchBasePaths property, is used to match the incoming request path. The matching is case sensitive.

- MatchBasePaths: 
	AnyOf: 
		- "products"

You can have up to two MatchHeaders and one MatchBasePaths conditions per routing rule. Conditions are evaluated using the AND operator, meaning all conditions must be met for the action to be taken. Both condition types support a single comparison value under AnyOf property. The following snippet illustrates a sample routing rule with two MatchHeaders conditions and a single MatchBasePaths condition.

ProductsV1RoutingRule: 
	Type: 'AWS::ApiGatewayV2::RoutingRule' 
	Properties: 
		DomainNameArn: !Sub "arn:aws:apigateway:${AWS::Region}::/domainnames/${ApiCustomDomain}" 
		Priority: 100 
		Conditions: 
			- MatchHeaders: 
				AnyOf: 
					- Header: "x-version" 
					ValueGlob: "v2" 
			- MatchHeaders: 
				AnyOf: 
					- Header: "x-user-cohort" 
					ValueGlob: "beta-testers" 
			- MatchBasePaths: 
				AnyOf: 
					- "products" 
		Actions: 
				- InvokeApi:
					ApiId: !Ref ProductsV2Api 
					Stage: !Ref ProductsV2Stage

This rule matches requests to https://example.com/products when both header conditions are met – x-version=v2 and x-user-cohort=beta-testers. This rule does not match requests to any other base path, such as https://example.com/orders, or requests that do not match at least one header condition.

For scenarios like API versioning, you can create rules that evaluate headers such as “accept” or “version” to route traffic to different API implementations. For example, to route requests containing “x-version: api-beta” to your beta API, you would create a rule specifying this header condition and set the action to route to your beta API deployment.

Header-based routing also simplifies A/B testing by allowing you to define client cohorts based on custom headers, allowing controlled experiments with different configurations. You can create rules that check for a custom header like “x-test-group” to route specific users to different API implementations. The priority system ensures predictable routing behavior – when multiple rules match a request, the rule with the lowest priority number (highest precedence) determines the routing. Combining header and path conditions within a single rule enables complex routing scenarios such as version-specific routing for specific API resources instead of the entire API, as illustrated in the following diagram.

Figure 2. A routing configuration with two header and one path conditions in API Gateway Console.

Review the API Gateway documentation for detailed guide on creating routing rules.

Configuring Routing Mode

Before you begin creating routing rules, you must first create at least one API, stage, and a custom domain name. You can configure your custom domain name with the new routing mode setting.

  • API mappings only. This is the default mode. When using this mode, you can continue to use base path mappings to route requests to different APIs, and not use Routing Rules at all. This mode maintains the current behavior, where requests are routed based on base path mappings only.
  • Routing rules then API mappings. With this mode you can use Routing Rules while continuing to keep base path mappings as a fallback. When you use this mode, the Routing Rules always take precedence, and unmatched requests are evaluated against base path mappings. This mode is useful for gradually transitioning your APIs to Routing Rules.
  • Routing rules only. This mode gives you the flexibility to use routing rules only, and not rely on the base paths that you may have previously created on the domain using API mappings. This is the recommended routing mode; it is helpful when you are starting off with a new custom domain or finished transitioning from API mappings to Routing Rules for an existing custom domain.

When switching from one routing mode to another, always test your new configuration in non-production environments first. For example, when switching mode from API mappings only to routing rules only, your traffic will only be routed with routing rules; existing API mappings will no longer take effect.

Onboarding to Header-Based Routing

You can adopt the new Header-Based Routing for your existing API Gateway custom domains with zero-downtime, risk-minimized approach. The first step is to configure your custom domain to use the Routing rules then API mappings mode using the API Gateway console, AWS CLI, or your infrastructure-as-code (IaC) tool. This configuration ensures that while you gradually create Routing Rules, your existing base path mappings continue to function as fallback routes. Since Routing Rules are evaluated before base path mappings, and in the absence of any matching rules, requests automatically fall back to your existing base path mappings, your current API traffic remains unaffected during this transition.

Once you’ve configured the routing mode, you can progressively introduce Routing Rules alongside your existing setup. For example, you might start by creating a rule with a specific test header that routes to a new API version, allowing you to validate the routing behavior with controlled test traffic while production traffic continues flowing through your existing base path mappings. As you gain confidence in the new routing configuration, you can gradually expand your rules, adjust priorities, and optionally migrate away from base path mappings entirely. This incremental approach, combined with API Gateway’s observability capabilities described in the next section, enables you to validate each change and ensure your API consumers experience no disruption during the transition.

Observability

API Gateway provides comprehensive visibility into how your routing rules are processing requests through access logging. Each request now includes additional context variables that help you understand the routing decision process. The $context.customDomain.routingRuleIdMatched variable identifies which rule was matched and applied to the request, while existing variables like $context.domainName, $context.apiId, and $context.stage provide the complete routing context. By analyzing these access logs, you can verify routing behavior, troubleshoot unexpected routes, and gather insights about traffic patterns across different API versions or test variants.

End-to-end example

Consider a real-world scenario where a team needs to gradually migrate users to a new API version, such as an e-commerce platform updating its checkout API from v1 to v2. First, the team creates two different REST APIs – one for each version. Then, they set up a Routing Rule with priority 100 that checks for the header x-version=v2 and routes matching requests to the v2 API. They also create another rule with priority 200 that routes all requests with paths starting with /checkout to v1 API as a fallback.

Figure 3. Gradually transitioning clients from v1 to v2 API.

In the application code they add the x-version header for a small percentage of users. They monitor the performance and error rates using API Gateway’s telemetry capabilities by tracking the access and execution logs, along with emitted metrics. As their confidence grows, they gradually increase the percentage of users sending the v2 header. This approach ensures a controlled migration with minimal risk and ability to quickly rollback by simply removing the header from requests or changing a routing rule.

Sample

Follow the instructions in this GitHub repository to provision the sample in your AWS account. The project illustrates using dynamic routing with API Gateway.

Conclusion

Header-based routing brings significant advantages to API Gateway users. The feature’s backward compatibility ensures a smooth transition path – you can maintain existing base path mappings while gradually adopting Routing Rules, or use both mechanisms simultaneously with the fallback option. This flexibility allows you to migrate at your own pace without disrupting existing applications. The solution is cost-effective, with no additional charges for using Routing Rules on REST APIs. It reduces requirements to leverage extra service and infrastructure for dynamic routing. The priority-based evaluation system provides deterministic routing behavior, making it easier to understand and troubleshoot routing decisions.

To learn more about API Gateway header-based routing see the service documentation.

To learn more about Serverless architectures see Serverless Land.

From Ideology to Financial Gain: Exploring the Convergence from Hacktivism to Cybercrime

Post Syndicated from Rapid7 original https://blog.rapid7.com/2025/06/03/from-ideology-to-financial-gain-exploring-the-convergence-from-hacktivism-to-cybercrime/

From Ideology to Financial Gain: Exploring the Convergence from Hacktivism to Cybercrime

Co-authored by Yaniv Allender and Alexandra Blia

Introduction

In the ever-evolving landscape of cyber threat actors, the lines between ideologically driven hacktivism and financially motivated cybercriminals have become increasingly blurred. Originally fueled by political, social, or ethical causes, hacktivist groups have historically engaged in digital protest through website defacements, data leaks, and distributed denial of service (DDoS) attacks.

However, in recent years, a noticeable trend has emerged. Some hacktivist groups are evolving into ransomware operations and even becoming ransomware affiliates. This transformation is driven by a mix of ideological fatigue, opportunity for financial gain, access to sophisticated tools, and the growing profitability of extortion-based attacks. The result is a new hybrid threat actor—one that merges the disruptive zeal of hacktivism with the ruthless efficiency of cybercrime.

Understanding this shift is crucial for defenders, as it represents a convergence of motives that complicates attribution, response, and mitigation strategies. To this end, we have examined three prominent examples of relevant threat actors, namely FunkSec, KillSec, and GhostSec, identifying the drivers behind their transition to financially motivated campaigns and exploring the shift in their modus operandi.

Threat actor analysis

FunkSec

The FunkSec ransomware group emerged within the cybercrime ecosystem as a rising star in December 2024. The ransomware-as-a-service (RaaS) group has claimed at least 172 victims to date. The group proudly promotes itself as an AI-driven ransomware group, with their encryptor, FunkLocker, and some of the malware’s source code allegedly generated using generative AI tools.

The group targets organizations from various sectors and regions, such as government, education, automotive, energy, IT, and manufacturing, located in countries like the United States, Israel, France, Italy, Germany, India, and Australia.

FunkSec started as a politically motivated hacking (hacktivist) group, specifically interested in targeting the United States (Figure 1). The group was known to be aligned with the “Free Palestine” movement (Figure 2), and associated itself with other hacktivist groups, such as Ghost Algeria and Cyb3r Fl00d. Among its affiliates are Scorpion (AKA DesertStorm, a suspected Algeria-based hacker), El_farado, XTN, Blako, and Bjorka (an alleged Indonesian hacktivist). In its early days, the group offered tools commonly associated with hacktivist activities, including services for DDoS and defacement attacks.

From Ideology to Financial Gain: Exploring the Convergence from Hacktivism to Cybercrime
Figure 1 – FunkSec’s activities as a hacktivist

From Ideology to Financial Gain: Exploring the Convergence from Hacktivism to Cybercrime
Figure 2 – FunkSec’s statement against the USA and Israel

At some point, the group transitioned its focus from politically motivated attacks to a RaaS model, offering customizable tools to its affiliates. Its victimology also changed from government entities to organizations across various sectors, such as education, technology, telecommunications, and agriculture (Figure 3).

From Ideology to Financial Gain: Exploring the Convergence from Hacktivism to Cybercrime
Figure 3 – FunkSec’s latest active DLS

FunkSec’s reliance on relatively simple malware development using AI-based tools also explains the fast transition of the group from targeted hacktivism campaigns to broader, financially-motivated activities, with a large number of victims in a short period of time (Figure 4).

From Ideology to Financial Gain: Exploring the Convergence from Hacktivism to Cybercrime
Figure 4 – FunkSec’s victims on their DLS

The group’s transition has also been referenced on a Russian-speaking dark web forum, where the author mentioned a cybersecurity vendor’s article on FunkSec (Figure 5).

From Ideology to Financial Gain: Exploring the Convergence from Hacktivism to Cybercrime
Figure 5 – FunkSec’s transition being referenced on a Russian-speaking dark web forum

KillSec

The KillSec hacktivist group (AKA Kill Security) has been active since at least 2021. The Russia-aligned group targets organizations from various sectors, such as government, finance, transportation, electronics, manufacturing, travel and recreation, retail, and consumer services, located in countries like India, Bangladesh, Romania, Poland, and Brazil. The group considers itself a “prominent hacktivist group operating in the cyber realm, with a focus on both disruption and digital activism.”

KillSec initially emerged as a hacktivist group aligned with the Anonymous collective, with its operations primarily including DDoS attacks and website defacements, before pivoting to ransomware operations in October 2023. KillSec’s ransomware variants, namely KillSecurity 2.0 and KillSecurity 3.0, are designed to encrypt files and demand ransom payments for decryption.

In June 2024, KillSec introduced a RaaS operation, advertising a locker for Windows environments written in C++ and a dashboard, enabling affiliates to observe detailed statistics, conduct chat communications, and customize ransomware configurations using a builder tool. In November 2024, the group launched an additional locker for ESXi environments, expanding the breadth of its operations (Figure 6).

From Ideology to Financial Gain: Exploring the Convergence from Hacktivism to Cybercrime
Figure 6 – KillSec launches locker for ESXi environments

The group’s shift is aligned with the overall proliferation of RaaS programs, enabling less technically skilled individuals to conduct ransomware attacks with relative ease in exchange for a fee. The group has been advertising its RaaS offering in an attempt to attract cybercriminals and further broaden its affiliate network (Figure 7).

From Ideology to Financial Gain: Exploring the Convergence from Hacktivism to Cybercrime
Figure 7 – KillSec looking for affiliates

Although in certain incidents, KillSec leveraged solely stolen data to extort the victims, the group appears to adopt mainly double extortion tactics, exfiltrating data in addition to encrypting it and demanding a ransom payment to prevent it from being leaked. The group operates an active dedicated leak site (DLS) to which it uploads the data of victims who refuse to pay the ransom. The group also uses its DLS to advertise its services, which include penetration testing, data gathering, and its RaaS program (Figure 8).

From Ideology to Financial Gain: Exploring the Convergence from Hacktivism to Cybercrime
Figure 8 – KillSec’s services

It should be noted that KillSec’s DLS also features a “For Sale” section, offering data allegedly exfiltrated from the targeted companies for sale, with the prices ranging between $5,000 and $350,000 (Figure 9). The group likely introduced this section in an attempt to further monetize the exfiltrated data. This offering of stolen data and additional services further suggests the financially motivated nature of the group’s activity.

From Ideology to Financial Gain: Exploring the Convergence from Hacktivism to Cybercrime
Figure 9 – “For Sale” section on KillSec’s DLS

GhostSec

The GhostSec hacktivist group (AKA Ghost Security, GhostSecMafia, and GSM) has been active since at least 2015. The Anonymous-affiliated group gained prominence with the #OpIsis and #OpParis​​ campaigns, in which various hacktivist groups took down thousands of ISIS websites and social media accounts using defacement and DDoS attacks. Since then, GhostSec has participated in campaigns, such as #OpLebanon, #OpNigeria, #OpMyanmar, #OpEcuador, and #OpColombia. The group has also continuously launched cyberattacks on Israel in response to alleged war crimes, primarily defacing their websites to spread “Free Palestine” messages.

GhostSec’s shift towards financially motivated operations overlaps with the group’s collaboration with cybercriminals. In July 2023, GhostSec announced that they formed a partnership with the Stormous ransomware group to target organizations in Cuba (Figure 10). Following this announcement, Stormous and GhostSec jointly claimed extortion attacks against three Cuban government ministries, and GhostSec also expressed the potential for future joint operations against other countries. In August 2023, GhostSec, together with ThreatSec, Stormous, Blackforums, and SiegedSec, collectively formed a unified collective, naming themselves “The Five Families” (Figure 11). This collective attempted to extort the presidential website of Cuba and the Brazilian organization Alfa Comercial.

From Ideology to Financial Gain: Exploring the Convergence from Hacktivism to Cybercrime
Figure 10 – Announcement of the alliance between GhostSec and Stormous on their Telegram channel

From Ideology to Financial Gain: Exploring the Convergence from Hacktivism to Cybercrime
Figure 11 – Announcement of the “Five Families” formation on their Telegram channel

GhostSec solidified its presence in the cybercriminal ecosystem with the launch of its RaaS program “GhostLocker” in October 2023, which was shortly followed by the release of its infostealer tool, GhostStealer (Figure 12). In January 2024, the updated “REWRITE” (aka GhostLocker 2.0) version of GhostLocker was released, with a fully featured management panel allowing affiliates to track campaigns and payouts. The threat actor promoted its malware-as-a-service (MaaS) tools heavily on its Telegram channels, demonstrating its intention to attract affiliates and, in turn, maximize its profits.

From Ideology to Financial Gain: Exploring the Convergence from Hacktivism to Cybercrime
Figure 12 – GhostLocker’s release announcement

On May 15, 2024, GhostSec announced its retirement from cybercriminal activities and its return to hacktivism. The group stated that it reached this decision after having obtained enough funding to support its hacktivist operations. GhostSec further mentioned that Stormous would remain in charge of the management and operation of GhostLocker (Figure 13).

From Ideology to Financial Gain: Exploring the Convergence from Hacktivism to Cybercrime
Figure 13 – GhostSec’s retirement from cybercriminal activities

It should be noted that Stormous seemingly had already incorporated GhostLocker into its operations, even before GhostSec’s retirement. As of May 2025, the group is still active and operates the Stormous RaaS program, which appears to be a continuation of GhostLocker. This development signifies the mutual assistance and influence among united threat groups, as collectives like the Five Families allow them to maximize the impact and breadth of their operations by sharing resources, audience, and knowledge.

Two sides of the same coin?

This analysis shows that the threat actors in scope, FunkSec, KillSec, and GhostSec, have followed a similar trajectory, pivoting from politically motivated, disruptive campaigns to financial extortion. This transition is likely facilitated by the public availability of leaked ransomware builders, such as LockBit 3.0, which threat actors can leverage to develop their payloads.

The groups specifically appear to have adopted double extortion tactics, exfiltrating data from their victims and then encrypting it, in an attempt to pressure them to comply with their ransom demands. However, despite their seeming ability to conduct ransomware operations, these groups appear to lack the level of sophistication and specialization that characterize top-tier cybercriminal groups, such as Cl0p and LockBit, which are mentioned in the Rapid7 Q1 2025 ransomware report.

Interestingly enough, all three groups embraced RaaS as their business model while pivoting towards cybercrime. This evolution is aligned with the overall current status of the ransomware ecosystem, as RaaS programs have become increasingly more common. Such programs, demonstrating the financial nature of their activities, enable threat actors to maximize their profits by allowing affiliates to use their ransomware kit for a fee and a percentage of the collected ransom.

This transition of FunkSec, KillSec, and GhostSec has also affected and amplified the victimology of their operations. While these groups once operated as hacktivists that primarily targeted government entities, their scope of activities broadened significantly as they shifted to ransomware attacks. Along this process, their attacks shifted from targeted to opportunistic, against organizations of different sizes, operating in diverse sectors and geographies, that could be relatively easily compromised.

While all of these groups follow the pattern, shifting from hacktivism to cybercrime, and specifically financially motivated RaaS operations, the reason behind this transition remains unclear. As an exception, GhostSec appears to have embraced cybercrime in an attempt to gather funding for its hacktivist operations, according to its exit message. It should be noted that other threat actors, such as CyberVolk, have also launched RaaS programs to fund their operations, but these efforts remain scarce.

Finally, other hacktivist groups, such as Ikaruz Red Team and their affiliates, also operate ransomware, but they do so to cause disruption and make political statements. Thus, the scope of their operations differs from financial gain and is not comparable to that of the groups included in this analysis.

Conclusion

The evolution of FunkSec, KillSec, and GhostSec from hacktivist collectives to RaaS operations highlights a recent trend of a shift in motivations, driving cybercriminal behavior. Initially, these groups were propelled by political and ideological aims, targeting governments and organizations in alignment with their perceived causes. However, over time, their focus has clearly shifted towards financial gain, as evidenced by their adoption of RaaS models that prioritize profit over ideology. As cybercriminals adapt to “market demands,” it becomes clear that financial motivation has come to dominate their activities, leaving behind the ideological roots of their earlier campaigns.

Indicators of compromise (IoCs)

FunkSec

  • Darkweb DLS:
  • funksec53xh7j5t6ysgwnaidj5vkh3aqajanplix533kwxdz3qrwugid[.]onion
  • funksec7vgdojepkipvhfpul3bvsxzyxn66ogp7q4pptvujxtpyjttad[.]onion
  • funksecsekgasgjqlzzkmcnutrrrafavpszijoilbd6z3dkbzvqu43id[.]onion
  • Clearweb DLS: http://funksec[.]top
  • Funkforum: http://funk4ph7igelwpgadmus4n4moyhh22cib723hllneen7g2qkklml4sqd[.]onion
  • Session ID: 0538d726ae3cc264c1bd8e66c6c6fa366a3dfc589567944170001e6fdbea9efb3d

GhostSec

8b758ccdfbfa5ff3a0b67b2063c2397531cf0f7b3d278298da76528f443779e9

c9f71fc4f385a4469438ef053e208065431b123e676c17b65d84b6c69ef6748a

a1b468e9550f9960c5e60f7c52ca3c058de19d42eafa760b9d5282eb24b7c55f

3ecf05857d65f7bc58b547d023bde7cc521a82712b947c04ddf9d7d1645c0ce0

Stormous

KillSec

  • DLS: http://ks5424y3wpr5zlug5c7i6svvxweinhbdcqcfnptkfcutrncfazzgz5id[.]onion
  • Telegram channel: https://t.me/killsecc
  • TOX ID: 9453686EAB63923D1C35C92DDE5E61A6534DD067B5448C1C8D996A460B92CA5055C1AB0FCD22
  • Session ID:05cb94c52170c8119f7ebc2d8afc94b9746bc7c361d91c49e7d18e96e266582a07
  • SHA256: 8cee3ec87a5728be17f838f526d7ef3a842ce8956fe101ed247a5eb1494c579d
  • IP addresses: 82[.]147[.]84[.]98, 77[.]91[.]77[.]187, 93[.]123[.]39[.]65

Rapid7 customers

InsightIDR and Managed Detection and Response (MDR) customers have existing detection coverage through Rapid7’s expansive library of detection rules. Below is a non-exhaustive list of detections that are deployed and will alert on behavior related to the FunkSec, KillSec, and GhostSec ransomware activity. We will also continue to iterate detections as new variants emerge, giving customers continuous detection without manual tuning:

Suspicious Process – Malicious Hash On Asset

While this specific detection directly covers malicious binaries linked to ransomware operations, customers also benefit from a comprehensive suite of detections that alert on post-exploitation behavior often observed prior to ransomware deployment. These include detections for lateral movement, privilege escalation, and suspicious persistence mechanisms, providing layered defense even when the specific ransomware payload is novel or obfuscated.

Cornelis CN5000 400Gbps Omni-Path Launched with UltraEthernet Roadmap

Post Syndicated from Patrick Kennedy original https://www.servethehome.com/cornelis-cn5000-400gbps-omni-path-launched-with-ultraethernet-roadmap/

The new Cornelis CN5000 series is a 400Gbps Omni-Path alternative to NVIDIA’s networking, and the company also has a roadmap to UltraEthernet

The post Cornelis CN5000 400Gbps Omni-Path Launched with UltraEthernet Roadmap appeared first on ServeTheHome.

Implementing just-in-time privileged access to AWS with Microsoft Entra and AWS IAM Identity Center

Post Syndicated from Rodney Underkoffler original https://aws.amazon.com/blogs/security/implementing-just-in-time-privileged-access-to-aws-with-microsoft-entra-and-aws-iam-identity-center/

Controlling access to your privileged and sensitive resources is critical for all AWS customers. Preventing direct human interaction with services and systems through automation is the primary means of accomplishing this. For those infrequent times when automation is not yet possible or implemented, providing a secure method for temporary elevated access is the next best option. In a privileged access management solution, there are several elements that should be included:

  • User access should follow the principle of least privileged
  • Users should be granted only the minimum amount of access required to perform their job duties
  • Access granted should persist only for the time necessary to perform the assigned tasks
  • The solution should include:
    • An eligibility process for granting access
    • An approval process for granting access
    • Auditing of the access grants and activities taken

Entra Privileged Identity Management (PIM) is a third-party solution that provides dynamic group management, access control, and audit capabilities that integrate with AWS IAM Identity Center.

In this post, we show you how to configure just-in-time access to AWS using Entra PIM’s integration with IAM Identity Center.

Just-in-time privileged access with Entra PIM and IAM Identity Center

Privileged Identity Management is a Microsoft Entra ID feature that enables management, control, and access monitoring of your important cloud resources. There are many different configuration options when it comes to eligibility and assignment to privileged security groups, including time-bound access with start and end dates, multi-factor authentication (MFA) enforcement, justification tracking, and so on. You can read more about those options in Microsoft’s product documentation.

Figure 1 shows the just-in-time access solution powered by Entra PIM group activation requests. In this solution, Entra PIM is integrated with IAM Identity Center to provide temporary, limited access to AWS resources based on user requests and approvals. Entra ID users can submit requests for specific access to specific AWS permissions sets, which are then automatically granted for a set duration.

Figure 1 – Entra PIM solution integrated with IAM Identity Center

Figure 1 – Entra PIM solution integrated with IAM Identity Center

Prerequisites

To try the solution described in this post, you need to have the following in place:

Step-by-step configuration

In the following steps, you create configurations to enable Entra PIM for Groups to automatically assign users to groups based on approval criteria. The groups will be Entra ID security groups that use direct assignment. Note that, at the time of this writing, dynamic groups and groups that you have synchronized from a self-managed Active Directory cannot be used with Microsoft Entra PIM. While it might be possible to also populate these groups using a third-party synchronization tool, for the purposes of this exercise, we assume that administration is occurring solely within Entra ID.

In the example scenario, the role corresponds to a specific job function within your organization. We use a group called AWS – Amazon EC2 Admin, which corresponds to a DevOps on-call site reliability engineer (SRE) lead.

Step 1: Create a group representing a specific privilege level.

Create a group in Entra ID that represents a specific privilege level that your employees can request for access to the AWS Management Console.

  1. Sign in to the Microsoft Entra admin center with your credentials.
  2. Select Groups and then All groups.
  3. Choose New group.
  4. Specify Security in the Group type dropdown list.
    • In the Group name field, enter AWS - Amazon EC2 Admin.
    • In the Group description field, enter Amazon EC2 administrator permissions.
    • Choose Create.

Step 2: Assign access for the group in Entra ID

Now you need to assign the newly created group to your enterprise application.

  1. Sign in to the Microsoft Entra admin center with your credentials
  2. Select Applications and then Enterprise applications and select the IAM Identity Center application that you created.
  3. Select Users and groups from the Manage menu group and select + Add user/group.
  4. Select the None selected option from the Users and groups section.
  5. Select the AWS – Amazon EC2 Admin group checkbox.
  6. Choose Select and then choose Assign.
  7. Select Provisioning from the Manage menu group and begin synchronizing the empty group by selecting the Start provisioning option.

When you first enable provisioning, the initial Microsoft Entra ID sync is triggered immediately. After that, subsequent syncs are triggered every 40 minutes, with the exact frequency depending on the number of users and groups in the application.

When the initial sync completes, the AWS – Amazon EC2 Admin group will be ready for configuration in IAM Identity Center.

Step 3: Create permission sets in IAM Identity Center

As you prepare to configure your permission set, let’s consider session duration from both the AWS and Entra PIM perspectives. There are two session durations on the AWS side: AWS access portal session duration and permission set session duration. The AWS access portal session duration defines the maximum length of time that a user can be signed in to the AWS access portal without reauthenticating. The default session duration is 8 hours but can be configured anywhere between 15 minutes and 7 days.

Note: Entra does not pass the SessionNotOnOrAfter attribute to IAM Identity Center as part of the SAML assertion. Meaning the duration of the AWS access portal session is controlled by the duration set in IAM Identity Center.

The session duration defined within a permission set specifies the length of time that a user can have a session for an AWS account. The default and minimum value is 1 hour (with a maximum value of 12). Entra PIM allows you to configure an activation maximum duration. The activation maximum duration is the length of time that the specified group will contain the activated user account. The activation maximum duration has a default value of 8 hours but can be configured between 30 minutes and 24 hours.

You should carefully consider the values that you provide for each of these durations. The AWS access portal will display permission sets that the user had access to at the time that they signed in for the duration of the active AWS access portal session.

When you set the permission set session duration, you need to keep in mind that active sessions are not terminated when the Entra PIM activation maximum duration has been reached. Let’s look at an example:

  • AWS access portal session duration: default (8 hours)
  • Session duration defined in the permission set: 1 hour
  • Entra PIM group activation maximum duration: 1 hour

You might be inclined to think that an hour after being added to the group in Entra, the user would no longer have access to AWS resources. This is not necessarily the case. A user could authenticate to the AWS access portal, wait up to 8 hours, and still successfully access AWS through the permission set link. Their session would be active for the duration of the session setting defined in the permission set, which is 1 hour in this case. In this example, we have a potential window of access of 10 hours, as shown in Figure 2 that follows.

Figure 2 – Calculating session duration

Figure 2 – Calculating session duration

With this in mind, configure your test environment with the default setting of 8 hours for the AWS access portal and 1 hour for the permission set session duration value.

  1. Open the IAM Identity Center console.
  2. Under Multi-account permissions, choose Permission sets.
  3. Choose Create permission set.
  4. On the Select permission set type page, under Permission set type, select Custom permission set, and then choose Next.
  5. On the Specify policies and permissions boundary page, expand AWS managed policies.
  6. Search for and select AmazonEC2FullAccess policy, and then choose Next.
  7. On the Specify permission set details page, enter EC2AdminAccess for the Permission set name and choose Next.
  8. On the Review and create page, review the selections, and choose Create.

Step 4: Assign group access in your organization

At this point, you’re ready to assign the Microsoft Entra group to the corresponding permission set in IAM Identity Center. This allows users who are members of the group to be granted the appropriate access level in AWS.

  1. In the navigation pane, under Multi-account permissions, choose AWS accounts.
  2. On the AWS accounts page, select the check box next to one or more AWS accounts to which you want to assign access.
  3. Choose Assign users or groups.
  4. On the Groups tab, select AWS – Amazon EC2 Admin and choose Next
  5. On the Assign permission sets to “<AWS-account-name>” page, select the EC2AdminAccess permission set.
  6. Check that the correct permission set was selected and choose Next.
  7. On the Review and submit page, verify that the correct group and permission set are selected, and choose Submit.

Step 5: Configure Entra PIM

To use this Microsoft Entra group with Entra PIM, you bring the group under the management of PIM by using the Entra admin console to activate the group. You can read more about group management with PIM in the Microsoft documentation. Begin by activating the Entra group that you created.

  1. Sign in to the Microsoft Entra admin center with your credentials.
  2. Select Groups and then All groups
  3. Select the AWS – Amazon EC2 Admin group.
    Figure 3 – Selecting groups for PIM enablement

    Figure 3 – Selecting groups for PIM enablement

  4. Select Privileged Identity Management under the Activity menu list.
  5. Choose Enable PIM for this group.
    Figure 4 – Enable PIM for this group

    Figure 4 – Enable PIM for this group

Now, you will configure the PIM settings for the group. These settings define Member or Owner properties and requirements. It’s here that you can establish MFA requirements, configure notifications, conditional access, approvals, durations, and so on. The Owner role can elevate their permissions using just-in-time access to manage a group, while the Member role is limited to requesting just-in-time membership within the group. In this example, you use the Member properties to demonstrate group membership level temporary elevated access and set a 1-hour duration for the group assignment.

  1. Sign in to the Microsoft Entra admin center with your credentials.
  2. Select Identity Governance, Privileged Identity Management, and then Groups.
  3. Select the AWS – Amazon EC2 Admin group.
    Figure 5 – Selecting groups for PIM configuration

    Figure 5 – Selecting groups for PIM configuration

  4. From the Manage menu select Settings.
  5. Choose Member to view the default role setting details.
    Figure 6 – Settings option for the Member role

    Figure 6 – Settings option for the Member role

  6. Review the default settings. The activation maximum duration should be set to 1 hour and require a justification from the user.
  7. Close the Role setting details – Member blade.
    Figure 7 – Closing the Role setting details – Member blade

    Figure 7 – Closing the Role setting details – Member blade

  8. From the Manage menu select Assignments and choose + Add assignments.
    Figure 8 – Adding eligibility assignments to the PIM enabled groups

    Figure 8 – Adding eligibility assignments to the PIM enabled groups

  9. Select Member from the Select role dropdown menu and choose No member selected. Select the test account, Rich Roe in this example, and then choose Select.
    Figure 9 – Adding the test user as an eligible identity for PIM activation to the group

    Figure 9 – Adding the test user as an eligible identity for PIM activation to the group

  10. Choose Next and leave the default setting of 1 year of eligibility. Duration eligibility defines the period that the user can request activation for the group. Depending on your use case, you will define this as permanent or for a set period. For testing purposes, keep the default setting. Choose Assign.
    Figure 10 – Completing the eligibility assignment

    Figure 10 – Completing the eligibility assignment

Test the configuration

You should now have a test configuration of Entra PIM and IAM Identity Center. Use the test account to verify just-in-time access.

  1. Sign in to the Microsoft Entra admin center using the test account (Rich Roe in this example).
  2. Select Identity Governance, Privileged Identity Management, and then My roles.
    Figure 11 – Browsing to the My Roles section of the Entra admin center

    Figure 11 – Browsing to the My Roles section of the Entra admin center

  3. From the Activate menu list, select Groups. Your eligible group assignments should be listed.
  4. Choose Activate for the AWS – Amazon EC2 Admin group.
    Figure 12 – Activating the just-in-time group membership

    Figure 12 – Activating the just-in-time group membership

  5. In the Activate – Member blade, enter a justification for the access request and choose Activate.
    Figure 13 – Providing a justification for access

    Figure 13 – Providing a justification for access

In this example, there are no approval workflow processes configured for the group, so Entra validates the eligibility requirements and adds the test account to the AWS – Amazon EC2 Admin group. If you want to dive deeper into the approval workflow process, you can read more about it on the Configure PIM for Groups settings page. Because the group is assigned to the enterprise application and configured for provisioning, the updated group membership is automatically synchronized using the SCIM protocol with the connected IAM Identity Center instance. The provisioning time can vary based on the number of PIM enabled users that are activating their memberships within a given 10-second period. In most situations, group memberships are synchronized within 2–10 minutes, but can revert to the standard 40-minute interval if activity runs up against Entra PIM throttling limits. IAM Identity Center responds to SCIM requests as they arrive from Entra ID.

To test access with the newly activated group assignment, use a separate browser or a private window.

  1. Sign in to the My Apps portal with the test user credentials and select the IAM Identity Center app that you created for testing. If you experience an error or don’t see the expected permission set, wait a few minutes until the group membership has synchronized to IAM Identity Center and try again.
    Figure 14 – Accessing IAM Identity Center through the My apps portal

    Figure 14 – Accessing IAM Identity Center through the My apps portal

  2. Expand the associated AWS account and confirm the EC2ReadOnly permission set has been granted.
  3. Close the AWS tab. Wait for the access to be revoked, which has been set to 60 minutes in this example.
    Figure 15 – Just-in-time access to the EC2AdminAccess permission set

    Figure 15 – Just-in-time access to the EC2AdminAccess permission set

  4. Sign back in to the My Apps portal and select the AWS IAM Identity Center app. Notice that the EC2ReadOnly permission set has been revoked.

Conclusion

The combination of AWS IAM Identity Center and Entra PIM provides a robust solution for managing just-in-time elevated access to AWS. By using security groups in Entra and mapping them to permission sets in IAM Identity Center, you can automate the provisioning and deprovisioning of privileged access based on defined policies and approval workflows. This approach helps to make sure the principle of least privilege is enforced, with access granted only for the duration required to complete a task. The detailed auditing capabilities of both services also provide comprehensive visibility into privileged access activities.

For AWS customers seeking a comprehensive, secure, and scalable privileged access management solution, the Entra PIM and IAM Identity Center integration is a common option that’s worth investigating to see if it’s a good fit for your use case.

If you have feedback about this post, submit comments in the Comments section below. If you have questions about this post, contact AWS Support.

Rodney Underkoffler

Rodney Underkoffler

Rodney is a Senior Solutions Architect at Amazon Web Services, focused on guiding enterprise customers on their cloud journey. He has a background in infrastructure, security, and IT business practices. He is passionate about technology and enjoys building and exploring new solutions and methodologies.

Aidan Keane

Aidan Keane

Aidan is a Senior Specialist Solutions Architect at Amazon Web Services, focused on Microsoft Workloads. He partners with enterprise customers to optimize their Microsoft environments on AWS and accelerate their cloud journey. Outside of work, he is a sports enthusiast who enjoys golf, biking, and watching Liverpool FC, while also enjoying family time and travelling to Ireland and South America.

Build a centralized observability platform for Apache Spark on Amazon EMR on EKS using external Spark History Server

Post Syndicated from Sri Potluri original https://aws.amazon.com/blogs/big-data/build-a-centralized-observability-platform-for-apache-spark-on-amazon-emr-on-eks-using-external-spark-history-server/

Monitoring and troubleshooting Apache Spark applications become increasingly complex as companies scale their data analytics workloads. As data processing requirements grow, enterprises deploy these applications across multiple Amazon EMR on EKS clusters to handle diverse workloads efficiently. However, this approach creates a challenge in maintaining comprehensive visibility into Spark applications running across these separate clusters. Data engineers and platform teams need a unified view to effectively monitor and optimize their Spark applications.

Although Spark provides powerful built-in monitoring capabilities through Spark History Server (SHS), implementing a scalable and secure observability solution across multiple clusters requires careful architectural considerations. Organizations need a solution that not only consolidates Spark application metrics but extends its features by adding other performance monitoring and troubleshooting packages while providing secure access to these insights and maintaining operational efficiency.

This post demonstrates how to build a centralized observability platform using SHS for Spark applications running on EMR on EKS. We showcase how to enhance SHS with performance monitoring tools, with a pattern applicable to many monitoring solutions such as SparkMeasure and DataFlint. In this post, we use DataFlint as an example to demonstrate how you can integrate additional monitoring features. We explain how to collect Spark events from multiple EMR on EKS clusters into a central Amazon Simple Storage Service (Amazon S3) bucket; deploy SHS on a dedicated Amazon Elastic Kubernetes Service (Amazon EKS) cluster; and configure secure access using AWS Load Balancer Controller, AWS Private Certificate Authority, Amazon Route 53, and AWS Client VPN. This solution provides teams with a single, secure interface to monitor, analyze, and troubleshoot Spark applications across multiple clusters.

Overview of solution

Consider DataCorp Analytics, a data-driven enterprise running multiple business units with diverse Spark workloads. Their Financial Analytics team processes time-sensitive trading data requiring strict processing times and dedicated resources, and their Marketing Analytics team handles customer behavior data with flexible requirements, requiring multiple EMR on EKS clusters to accommodate these distinct workload patterns. As their Spark applications grow in number and complexity across these clusters, data and platform engineers struggle to maintain comprehensive visibility while maintaining secure access to monitoring tools.

This scenario presents an ideal use case for implementing a centralized observability platform using SHS and DataFlint. The solution deploys SHS on a dedicated EKS cluster, configured to read events from multiple EMR on EKS clusters through a centralized S3 bucket. Access is secured through Load Balancer Controller, AWS Private CA, Route 53, and Client VPN, and DataFlint enhances the monitoring capabilities with additional insights and visualizations. The following architecture diagram illustrates the components and their interactions.

Architecture diagram

The solution workflow is as follows:

  1. Spark applications on EMR on EKS use a custom EMR Docker image that includes DataFlint JARs for enhanced metrics collection. These applications generate detailed event logs containing execution metrics, performance data, and DataFlint-specific insights. The logs are written to a centralized Amazon S3 location through the following configuration (note especially the configurationOverrides section). For additional information, explore the StartJobRun guide to learn how to run Spark jobs and review the StartJobRun API reference.
{
  "name": "${SPARK_JOB_NAME}", 
  "virtualClusterId": "${VIRTUAL_CLUSTER_ID}",  
  "executionRoleArn": "${IAM_ROLE_ARN_FOR_JOB_EXECUTION}",
  "releaseLabel": "emr-7.2.0-latest", 
  "jobDriver": {
    "sparkSubmitJobDriver": {
      "entryPoint": "s3://${S3_BUCKET_NAME}/app/${SPARK_APP_FILE}",
      "entryPointArguments": [
        "--input-path",
        "s3://${S3_BUCKET_NAME}/data/input",
        "--output-path",
        "s3://${S3_BUCKET_NAME}/data/output"
      ],
       "sparkSubmitParameters": "--conf spark.driver.cores=1 --conf spark.driver.memory=4G --conf spark.kubernetes.driver.limit.cores=1200m --conf spark.executor.cores=2  --conf spark.executor.instances=3  --conf spark.executor.memory=4G"
    }
  }, 
  "configurationOverrides": {
    "applicationConfiguration": [
      {
        "classification": "spark-defaults", 
        "properties": {
          "spark.driver.memory":"2G",
          "spark.kubernetes.container.image": "${AWS_ACCOUNT_ID}.dkr.ecr.${AWS_REGION}.amazonaws.com/${EMR_REPO_NAME}:${EMR_IMAGE_TAG}",
          "spark.app.name": "${SPARK_JOB_NAME}"
          "spark.eventLog.enabled": "true",
          "spark.eventLog.dir": "s3://${S3_BUCKET_NAME}/spark-events/"
         }
      }
    ], 
    "monitoringConfiguration": {
      "persistentAppUI": "ENABLED",
      "s3MonitoringConfiguration": {
        "logUri": "s3://${S3_BUCKET_NAME}/spark-events/"
      }
    }
  }
}
  1. A dedicated SHS deployed on Amazon EKS reads these centralized logs. The Amazon S3 location is configured in the SHS to read from the central Amazon S3 location through the following code:
env:
  - name: SPARK_HISTORY_OPTS
    value: "-Dspark.history.fs.logDirectory=s3a://${S3_BUCKET}/spark-events/"
  1. We configure Load Balancer Controller, AWS Private CA, a Route 53 hosted zone, and Client VPN to securely access the SHS UI using a web browser.
  2. Finally, users can access the SHS web interface at https://spark-history-server.example.internal/.

You can find the code base in the AWS Samples GitHub repository.

Prerequisites

Before you deploy this solution, make sure the following prerequisites are in place:

Set up a common infrastructure

Complete the following steps to set up the infrastructure:

  1. Clone the repository to your local machine and set the two environment variables. Replace <AWS_REGION> with the AWS Region where you want to deploy these resources.
git clone [email protected]:aws-samples/sample-centralized-spark-history-server-emr-on-eks.git
cd sample-centralized-spark-history-server-emr-on-eks
export REPO_DIR=$(pwd)
export AWS_REGION=<AWS_REGION>
  1. Execute the following script to create the common infrastructure. The script creates a secure virtual private cloud (VPC) networking environment with public and private subnets and an encrypted S3 bucket to store Spark application logs.
cd ${REPO_DIR}/infra
./deploy_infra.sh
  1. To verify successful infrastructure deployment, open the AWS CloudFormation console, choose your stack, and check the Events, Resources, and Outputs tabs for completion status, details, and list of resources created.

Set up EMR on EKS clusters

This section covers building a custom EMR on EKS Docker image with DataFlint integration, launching two EMR on EKS clusters (datascience-cluster-v and analytics-cluster-v), and configuring the clusters for job submission. Additionally, we set up the necessary IAM roles for service accounts (IRSA) to enable Spark jobs to write events to the centralized S3 bucket. Complete the following steps:

  1. Deploy two EMR on EKS clusters:
cd ${REPO_DIR}/emr-on-eks
./deploy_emr_on_eks.sh
  1. To verify successful creation of the EMR on EKS clusters using the AWS CLI, execute the following command:
aws emr-containers list-virtual-clusters \
    --query "virtualClusters[?state=='RUNNING']"
  1. Execute the following command for the datascience-cluster-v and analytics-cluster-v clusters to verify their respective states, container provider information, and associated EKS cluster details. Replace <VIRTUAL-CLUSTER-ID> with the ID of each cluster obtained from the list-virtual-clusters output.
aws emr-containers describe-virtual-cluster \
    --id <VIRTUAL-CLUSTER-ID>

Configure and execute Spark jobs on EMR on EKS clusters

Complete the following steps to configure and execute Spark jobs on the EMR on EKS clusters:

  1. Generate custom EMR on EKS image and StartJobRun request JSON files to run Spark jobs:
cd ${REPO_DIR}/jobs
./configure_jobs.sh

The script performs the following tasks:

  • Prepares the environment by uploading the sample Spark application spark_history_demo.py to a designated S3 bucket for job execution.
  • Creates a custom Amazon EMR container image by extending the base EMR 7.2.0 image with the DataFlint JAR for additional insights and publishing it to an Amazon Elastic Container Registry (Amazon ECR) repository.
  • Generates cluster-specific StartJobRun request JSON files for datascience-cluster-v and analytics-cluster-v.

Review start-job-run-request-datascience-cluster-v.json and start-job-run-request-analytics-cluster-v.json for additional details.

  1. Execute the following commands to submit Spark jobs on the EMR on EKS virtual clusters:
aws emr-containers start-job-run \
--cli-input-json file://${REPO_DIR}/jobs/start-job-run/start-job-run-request-datascience-cluster-v.json
aws emr-containers start-job-run \
--cli-input-json file://${REPO_DIR}/jobs/start-job-run/start-job-run-request-analytics-cluster-v.json
  1. Verify the successful generation of the logs in the S3 bucket:

aws s3 ls s3://emr-spark-logs-<AWS_ACCOUNT_ID>-<AWS_REGION>/spark-events/

You have successfully set up an EMR on EKS environment, executed Spark jobs, and collected the logs in the centralized S3 bucket. Next, we will deploy SHS, configure its secure access, and visualize the logs using it.

Set up AWS Private CA and create a Route 53 private hosted zone

Use the following code to deploy AWS Private CA and create a Route 53 private hosted zone. This will provide a user-friendly URL to connect to SHS over HTTPS.

cd ${REPO_DIR}/ssl
./deploy_ssl.sh

Set up SHS on Amazon EKS

Complete the following steps to build a Docker image containing SHS with DataFlint, deploy it on an EKS cluster using a Helm chart, and expose it through a Kubernetes service of type LoadBalancer. We use a Spark 3.5.0 base image, which includes SHS by default. However, although this simplifies deployment, it results in a larger image size. For environments where image size is critical, consider building a custom image with just the standalone SHS component instead of using the complete Spark distribution.

  1. Deploy SHS on the spark-history-server EKS cluster:
cd ${REPO_DIR}/shs
./deploy_shs.sh
  1. Verify the deployment by listing the pods and viewing the pod logs:
kubectl get pods --namespace spark-history
kubectl logs <SHS-PODNAME> --namespace spark-history
  1. Review the logs and confirm there are no errors or exceptions.

You have successfully deployed SHS on the spark-history-server EKS cluster, and configured it to read logs from the emr-spark-logs-<AWS_ACCOUNT_ID>-<AWS_REGION> S3 bucket.

Deploy Client VPN and add entry to Route 53 for secure access

Complete the following steps to deploy Client VPN to securely connect your client machine (such as your laptop) to SHS and configure Route 53 to generate a user-friendly URL:

  1. Deploy the Client VPN:
cd ${REPO_DIR}/vpn
./deploy_vpn.sh
  1. Add entry to Route 53:
cd ${REPO_DIR}/dns
./deploy_dns.sh

Add certificates to local trusted stores

Complete the following steps to add the SSL certificate to your operating system’s trusted certificate stores for secure connections:

  1. For macOS users, using Keychain Access (GUI):
    1. Open Keychain Access from Applications, Utilities, choose the System keychain in the navigation pane, and choose File, Import Items.
    2. Browse to and choose ${REPO_DIR}/ssl/certificates/ca-certificate.pem, then choose the imported certificate.
    3. Expand the Trust section and set When using this certificate to Always Trust.
    4. Close and enter your password when prompted and save.
    5. Alternatively, you can execute the following command to include the certificate in Keychain and trust it:
sudo security add-trusted-cert -d -r trustRoot -k /Library/Keychains/System.keychain "${REPO_DIR}/ssl/certificates/ca-certificate.pem"
  1. For Windows users:
    1. Rename ca-certificate.pem to ca-certificate.crt.
    2. Choose (right-click) ca-certificate.crt and choose Install Certificate.
    3. Choose Local Machine (admin rights required).
    4. Select Place all certificates in the following store.
    5. Choose Browse and choose Trusted Root Certification Authorities.
    6. Complete the installation by choosing Next and Finish.

Set up Client VPN on your client machine for secure access

Complete the following steps to install and configure Client VPN on your client machine (such as your laptop) and create a VPN connection to the AWS Cloud:

  1. Download, install, and launch the Client VPN application from the official download page for your operating system.
  2. Create your VPN profile:
    1. Choose File in the menu bar, choose Manage Profiles, and choose Add Profile.
    2. Enter a name for your profile. Example: SparkHistoryServerUI
    3. Browse to ${REPO_DIR}/vpn/client_vpn_certs/client-config.ovpn, choose the certificate file, and choose Add Profile to save your configuration.
  3. Select your newly created profile, choose Connect, and wait for the connection confirmation to establish the VPN connection.

When you’re connected, you will have secure access to the AWS resources in your environment.

VPN connection details

Securely access the SHS URL

Complete the following steps to securely access SHS using a web browser:

  1. Execute the following command to get the SHS URL:

https://spark-history-server.example.internal/

  1. Copy this URL and enter it into your web browser to access the SHS UI.

The following screenshot shows an example of the UI.

Spark History Server job summary page

  1. Choose an App ID to view its detailed execution information and metrics.

Spark History Server job detail page

  1. Choose the DataFlint tab to view detailed application insights and analytics.

DataFlint insights page

DataFlint displays various helpful metrics, including alerts, as shown in the following screenshot.

DataFlint alerts page

Clean up

To avoid incurring future charges from the resources created in this tutorial, clean up your environment after completing the steps. To remove all provisioned resources:

  1. Disconnect from the Client VPN.
  2. Run the cleanup.sh script:
cd ${REPO_DIR}/
./cleanup.sh

Conclusion

In this post, we demonstrated how to build a centralized observability platform for Spark applications using SHS and enhance SHS with performance monitoring tools like DataFlint. The solution aggregates Spark events from multiple EMR on EKS clusters into a unified monitoring interface, providing comprehensive visibility into your Spark applications’ performance and resource utilization. By using a custom EMR image with performance monitoring tool integration, we enhanced the standard Spark metrics to gain deeper insights into application behavior. If your environment uses a mix of EMR on EKS, Amazon EMR on EC2, or Amazon EMR Serverless, you can seamlessly extend this architecture to aggregate the logs from EMR on EC2 and EMR Serverless in a similar way and visualize them using SHS.

Although this solution provides a robust foundation for Spark monitoring, production deployments should consider implementing authentication and authorization. SHS supports custom authentication through javax servlet filters and fine-grained authorization through access control lists (ACLs). We encourage you to explore implementing authentication filters for secure access control, configuring user- and group-based ACLs for view and modify permissions, and setting up group mapping providers for role-based access. For detailed guidance, refer to Spark’s web UI security documentation and SHS security features.

While AWS endeavors to apply best practices for security within this example, each organization has its own policies. Please make sure to use the specific policies of your organization when deploying this solution as a starting point for implementing centralized Spark monitoring in your data processing environment.


About the authors

Sri Potluri is a Cloud Infrastructure Architect at AWS. He is passionate about solving complex problems and delivering well-structured solutions for diverse customers. His expertise spans across a range of cloud technologies, providing scalable and reliable infrastructures tailored to each project’s unique challenges.

Suvojit Dasgupta is a Principal Data Architect at AWS. He leads a team of skilled engineers in designing and building scalable data solutions for AWS customers. He specializes in developing and implementing innovative data architectures to address complex business challenges.

Architecture patterns to optimize Amazon Redshift performance at scale

Post Syndicated from Eddie Yao original https://aws.amazon.com/blogs/big-data/architecture-patterns-to-optimize-amazon-redshift-performance-at-scale/

Tens of thousands of customers use Amazon Redshift as a fully managed, petabyte-scale data warehouse service in the cloud. As an organization’s business data grows in volume, the data analytics need also grows. Amazon Redshift performance needs to be optimized at scale to achieve faster, near real-time business intelligence (BI). You might also consider optimizing Amazon Redshift performance when your data analytics workloads or user base increases, or to meet a data analytics performance service level agreement (SLA). You can also look for ways to optimize Amazon Redshift data warehouse performance after you complete an online analytical processing (OLAP) migration from another system to Amazon Redshift.

In this post, we will show you five Amazon Redshift architecture patterns that you can consider to optimize your Amazon Redshift data warehouse performance at scale using features such as Amazon Redshift Serverless, Amazon Redshift data sharing, Amazon Redshift Spectrum, zero-ETL integrations, and Amazon Redshift streaming ingestion.

Use Amazon Redshift Serverless to automatically provision and scale your data warehouse capacity

To start, let’s review using Amazon Redshift Serverless to automatically provision and scale your data warehouse capacity. The architecture is shown in the following diagram and includes different components within Amazon Redshift Serverless like ML-based workload monitoring and automatic workload management.

Amazon Redshift Serverless architecture diagram

Amazon Redshift Serverless architecture diagram

Amazon Redshift Serverless is a deployment model that you can use to run and scale your Redshift data warehouse without managing infrastructure. Amazon Redshift Serverless will automatically provision and scale your data warehouse capacity to deliver fast performance for even the most demanding, unpredictable, or massive workloads.

Amazon Redshift Serverless measures data warehouse capacity in Redshift Processing Units (RPUs). You pay for the workloads you run in RPU-hours on a per-second basis. You can optionally configure your Base, Max RPU-Hours, and MaxRPU parameters to modify your warehouse performance costs. This post dives deep into understanding cost mechanisms to consider when managing Amazon Redshift Serverless.

Amazon Redshift Serverless scaling is automatic and based on your RPU capacity. To further optimize scaling operations for large scale datasets, Amazon Redshift Serverless has AI-driven scaling and optimization. It uses AI to scale automatically with workload changes across key metrics such as data volume changes, concurrent users, and query complexity, accurately meeting your price performance targets.

There is no maintenance window in Amazon Redshift Serverless, because software version updates are applied automatically. This maintenance occurs with no interruptions for any existing connections or query executions. Make sure to consult the considerations guide to better understand the operation of Amazon Redshift Serverless.

You can migrate from an existing provisioned Amazon Redshift data warehouse to Amazon Redshift Serverless by creating a snapshot of your current provisioned data warehouse and then restoring that snapshot in Amazon Redshift Serverless. Amazon Redshift will automatically convert interleaved keys to compound keys when you restore a provisioned data warehouse snapshot to a Serverless namespace. You can also get started with a new Amazon Redshift Serverless data warehouse.

Amazon Redshift Serverless use cases

You can use Amazon Redshift Serverless for:

  • Self-service analytics
  • Auto scaling for unpredictable or variable workloads
  • New applications
  • Multi-tenant applications

With Amazon Redshift, you can access and query data stored in Amazon S3 Tables – fully managed Apache Iceberg tables optimized for analytics workloads. Amazon Redshift also supports querying data stored using Apache Iceberg tables, and other open table formats like Apache Hudi and Linux Foundation Delta Lake, for more information see External tables for Redshift Spectrum and Expand data access through Apache Iceberg using Delta Lake UniForm on AWS.

You can also use Amazon Redshift Serverless with Amazon Redshift data sharing, which can automatically scale your large dataset in independent datashares and maintain workload isolation controls.

Amazon Redshift data sharing to share live data between separate Amazon Redshift data warehouses

Next, we will look at an Amazon Redshift data sharing architecture pattern, shown in below diagram, to share data between a hub Amazon Redshift data warehouse and spoke Amazon Redshift data warehouses , and to share data across multiple Amazon Redshift data warehouses with each other.

Amazon Redshift data sharing architecture patterns diagram

Amazon Redshift data sharing architecture patterns diagram

With Amazon Redshift data sharing, you can securely share access to live data between separate Amazon Redshift data warehouses without manually moving or copying the data. Because the data is live, all users can see the most up-to-date and consistent information in Amazon Redshift as soon as it’s updated using separate dedicated resources. Because the compute accessing the data is isolated, you can size the data warehouse configurations to individual workload price performance requirements rather than the aggregate of all workloads. This also provides additional flexibility to scale with new workloads without affecting the workloads already being run on Amazon Redshift.

A datashare is the unit of sharing data in Amazon Redshift. A producer data warehouse administrator can create datashares and add datashare objects to share data with other data warehouses, referred to as outbound shares. A consumer data warehouse administrator can receive datashares from other data warehouses, referred to as inbound shares.

To get started, a producer data warehouse needs to add all objects (and potential permissions) that need to be accessed by another data warehouse to a datashare, and share that datashare with a consumer. After that consumer creates a database from the datashare, the shared objects can be accessed using three-part notation consumer_database_name.schema_name.table_name on the consumer, using the consumer’s compute.

Amazon Redshift data sharing use cases

Amazon Redshift data sharing, including multi-warehouse writes in Amazon Redshift, can be used to:

  • Support different kinds of business-critical workloads, including workload isolation and chargeback for individual workloads.
  • Enable cross-group collaboration across teams for broader analytics, data science, and cross-product impact analysis.
  • Deliver data as a service.
  • Share data between environments to improve team agility by sharing data at different granularity levels such as development, test, and production.
  • License access to data in Amazon Redshift by listing Amazon Redshift data sets in the AWS Data Exchange catalog so that customers can find, subscribe to, and query the data in minutes.
  • Update business source data on the producer. You can share data as a service across your organization, but then consumers can also perform actions on the source data.
  • Insert additional records on the producer. Consumers can add records to the original source data.

The following articles provide examples of how you can use Amazon Redshift data sharing to scale performance:

Amazon Redshift Spectrum to query data in Amazon S3

You can use Amazon Redshift Spectrum to query data in , as shown in below diagram using AWS Glue Data Catalog.

Amazon Redshift Spectrum architecture diagram

Amazon Redshift Spectrum architecture diagram

You can use Amazon Redshift Spectrum to efficiently query and retrieve structured and semi-structured data from files in Amazon S3 without having to directly load data into Amazon Redshift tables. Using the large, parallel scale of the Amazon Redshift Spectrum layer, you can run massive, fast, parallel queries against large datasets while most of the data remains in Amazon S3. This can significantly improve the performance and cost-effectiveness of massive analytics workloads, because you can use the scalable storage of Amazon S3 to handle large volumes of data while still benefiting from the powerful query processing capabilities of Amazon Redshift.

Amazon Redshift Spectrum uses separate infrastructure independent of your Amazon Redshift data warehouse, offloading many compute-intensive tasks, such as predicate filtering and aggregation. This means that you can use significantly less data warehouse processing capacity than other queries. Amazon Redshift Spectrum can also automatically scale to potentially thousands of instances, based on the demands of your queries.

When implementing Amazon Redshift Spectrum, make sure to consult the considerations guide which details how to configure your networking, external table creation, and permissions requirements.

Review this best practices guide and this blog post, which outlines recommendations on how to optimize performance including the impact of different file types, how to design around the scaling behavior, and how you can efficiently partition files. You can check out an example architecture in Accelerate self-service analytics with Amazon Redshift Query Editor V2.

To get started with Amazon Redshift Spectrum, you define the structure for your files and register them as an external table in an external data catalog (AWS Glue, Amazon Athena, and Apache Hive metastore are supported). After creating your external table, you can query your data in Amazon S3 directly from Amazon Redshift.

Amazon Redshift Spectrum use cases

You can use Amazon Redshift Spectrum in the following use cases:

  • Huge volume but less frequently accessed data, build lake house architecture to query exabytes of data in an S3 data lake
  • Heavy scan- and aggregation-intensive queries
  • Selective queries that can use partition pruning and predicate pushdown, so the output is fairly small

Zero-ETL to unify all data and achieve near real-time analytics

You can use Zero-ETL integration with Amazon Redshift to integrate with your transactional databases like Amazon Aurora MySQL-Compatible Edition, so you can run near real-time analytics in Amazon Redshift, or BI in Amazon QuickSight, or machine learning workload in Amazon SageMaker AI, shown in below diagram.

Zero-ETL integration with Amazon Redshift architecture diagram

Zero-ETL integration with Amazon Redshift architecture diagram

Zero-ETL integration with Amazon Redshift removes the undifferentiated heavy lifting to build and manage complex extract, transform, and load (ETL) data pipelines; unifies data across databases, data lakes, and data warehouses; and makes data available in Amazon Redshift in near real time for analytics, artificial intelligence (AI) and machine learning (ML) workloads.

Currently Amazon Redshift supports the following zero-ETL integrations:

To create a zero-ETL integration, you specify an integration source, such as an Amazon Aurora DB cluster, and an Amazon Redshift data warehouse, such as Amazon Redshift Serverless workgroup or a provisioned data warehouse (including Multi-AZ deployment on RA3 clusters to automatically recover from any infrastructure or Availability Zone failures and help ensure that your workloads remain uninterrupted), as the target. The integration replicates data from the source to the target and makes data available in the target data warehouse within seconds. The integration also monitors the health of the integration pipeline and recovers from issues when possible.

Make sure to review considerations, limitations, and quotas on both the data source and target when using zero-ETL integrations with Amazon Redshift.

Zero-ETL integration use cases

You can use zero-ETL integration with Amazon Redshift as an architecture pattern to boost analytical query performance at scale, enable a straightforward and secure way to create near real-time analytics on petabytes of transactional data, with continuous change-data-capture (CDC). Plus, you can use other Amazon Redshift capabilities such as built-in machine learning, materialized views, data sharing, and federated access to multiple data stores and data lakes. You can see more other zero-ETL integrations use cases at What is ETL.

Ingest streaming data into Amazon Redshift data warehouse for near real-time analytics

You can ingest streaming data with Amazon Kinesis Data Streams or Amazon Managed Streaming for Apache Kafka (Amazon MSK) to Amazon Redshift and run near real-time analytics in Amazon Redshift, as shown in the following diagram.

Amazon Redshift data streaming architecture diagram

Amazon Redshift data streaming architecture diagram

Amazon Redshift streaming ingestion provides low-latency, high-speed data ingestion directly from Amazon Kinesis Data Streams or Amazon MSK to an Amazon Redshift provisioned or Amazon Redshift Serverless data warehouse, without staging data in Amazon S3. You can connect to and access the data from the stream using standard SQL and simplify data pipelines by creating materialized views in Amazon Redshift on top of the data stream. For best practices, you can review these blog posts:

To get started on Amazon Redshift streaming ingestion, you create an external schema that maps to the streaming data source and create a materialized view that references the external schema. For details on how to set up Amazon Redshift streaming ingestion for Amazon KDS, see Getting started with streaming ingestion from Amazon Kinesis Data Streams. For details on how to set up Amazon Redshift streaming ingestion for Amazon MSK, see Getting started with streaming ingestion from Apache Kafka sources.

Amazon Redshift streaming ingestion use cases

You can use Amazon Redshift streaming ingestion to:

  • Improve gaming experience by analyzing real-time data from gamers
  • Analyze real-time IoT data and use machine learning (ML) within Amazon Redshift to improve operations, predict customer churn, and grow your business
  • Analyze clickstream user data
  • Conduct real-time troubleshooting by analyzing streaming data from log files
  • Perform near real-time retail analytics on streaming point of sale (POS) data

Other Amazon Redshift features to optimize performance

There are other Amazon Redshift features that you can use to optimize performance.

  • You can resize Amazon Redshift provisioned clusters to optimize data warehouse compute and storage use.
  • You can use concurrency scaling, where Amazon Redshift provisioning automatically adds additional capacity to process increases in read, such as dashboard queries; and write operations, such as data ingestion and processing.
  • You can also consider materialized views in Amazon Redshift, applicable to both provisioned and serverless data warehouses, which contains a precomputed result set, based on an SQL query over one or more base tables. They are especially useful for speeding up queries that are predictable and repeated.
  • You can use auto-copy for Amazon Redshift to set up continuous file ingestion from your Amazon S3 prefix and automatically load new files to tables in your Amazon Redshift data warehouse without the need for additional tools or custom solutions.

Cloud security at AWS is the highest priority. Amazon Redshift offers broad security-related configurations and controls to help ensure information is appropriately protected. See Amazon Redshift Security Best Practices for a comprehensive guide to Amazon Redshift security best practices.

Conclusion

In this post, we reviewed Amazon Redshift architecture patterns and features that you can use to help scale your data warehouse to dynamically accommodate different workload combinations, volumes, and data sources to achieve optimal price performance. You can use them alone or together—choosing the best infrastructural set up for your use case requirements—and scale to accommodate for any future growth.

Get started with these Amazon Redshift architecture patterns and features today by following the instructions provided in each section. If you have questions or suggestions, leave a comment below.


About the authors

Eddie Yao is a Principal Technical Account Manager (TAM) at AWS. He helps enterprise customers build scalable, high-performance cloud applications and optimize cloud operations. With over a decade of experience in web application engineering, digital solutions, and cloud architecture, Eddie currently focuses on Media & Entertainment (M&E) and Sports industries and AI/ML and generative AI.

Julia Beck is an Analytics Specialist Solutions Architect at AWS. She supports customers in validating analytics solutions by architecting proof of concept workloads designed to meet their specific needs.

Scott St. Martin is a Solutions Architect at AWS who is passionate about helping customers build modern applications. Scott uses his decade of experience in the cloud to guide organizations in adopting best practices around operational excellence and reliability, with a focus the manufacturing and financial services spaces. Outside of work, Scott enjoys traveling, spending time with family, and playing piano.

[$] Safety certification for open-source systems

Post Syndicated from daroc original https://lwn.net/Articles/1022889/

This year’s

Linaro Connect
in Lisbon, Portugal featured a number of talks about the use of
open-source components in safety-critical systems. Kate Stewart gave a keynote on the topic
on the first day of the conference. In it, she highlighted several projects that
have been working to pursue safety certification and spoke about the importance of
being able to trace software’s origins to safety. In a talk on the second day, Roberto
Bagnara shared his experience with working on one of those projects, the Xen
hypervisor, to conform to a formal set of rules for safety-critical code.

Дървената сабя на Бетко от Варна

Post Syndicated from Еми Барух original https://www.toest.bg/durvenata-sabya-na-betko-ot-varna/

Дървената сабя на Бетко от Варна

Софи Бехарано де Голдберг изчаква посетителите да си намерят места в салона и очевидно се вълнува. Облечена е ярко, по мексикански. Вече е дала няколко интервюта. Повторила е много пъти с правилно произношение българската дума благодаря. С насладата на солист, който е извикан на бис, произнася няколко други думи от детския език на своя баща. Няма начин аудиторията да не се възбуди, когато гастролиращият чужденец я погъделичка с познания от партитурата на нейния език. Това винаги работи.

Гювеч, геврек, чорба…. слова от остатъчна езикова мелодия. Тук е мястото да напиша, че Рада Ганкова – преводачка на книгата „Морската градина“, чиято авторка е Софи Бехарано де Голдберг, е извършила впечатляващо лингвистично-археологическо тършуване, за да освободи текста от неговата мексиканскост и да намери верните културно-исторически кодове към една история, разказана от мексиканка, но случила се преди 80 години в България.

Стотици часове Софи е прекарала в разговори със своя баща, героя на нейния мемоарен текст. Разговорите впрочем са по-скоро с онази негова версия на шестгодишно момче, съхранило с удивителни подробности отпечатъци от разбърканите години на детството.

Дървената сабя на Бетко от Варна
Алберто и Софи © Личен архив

„Морската градина“ е екстракт от тези спомени, опит за фамилна сага без отстраненост, в която емоционалният градус е доминиращата температура на разказа. И моят въпрос за съотношението между обективно и субективно се явява напълно излишен…

Всичко в книгата е истинно, но преживяно през субективната чувствителност на дете. Войната оставя дълбоки следи. Аз знаех всички преживени от него истории и когато го разпитвах, не се интересувах от последователността на случилото се, а как го беше почувствал той. Исках да усетя емоционалната плътност на неговия разказ, да доловя вълненията на едно дете. А контекстът на тези случки е много тревожен, смущаващ.

И до ден днешен, ако той започне да разказва, примерно, онзи епизод, когато в дома им нахълтва есесовец и пита: „Къде са оръжията?“, когато той, шестгодишният, единственият „мъж в семейството“, заявява пред втрещения поглед на майка си: „Знам къде са“ и води есесовеца в съседната стая, за да извади от сандъка с играчки дървената си сабя, той го разказва по същия начин. И гласът му издава същото онова вълнение.

Докато го слушах, си казвах: чудесно е, че е преживял онези години като дете, защото това емоционално го е спасило. Не си е давал сметка за ужасните трагедии, разиграващи се по същото време с негови сънародници.

Говорим за субективната памет, за начина, по който тя оставя отпечатък върху поведението, за осъзнатото желание да изтриеш част от травматичните спомени, за да се съхраниш. Защото ако не го направиш, те може да те разрушат. Това се случва с майката на малкия Алберто – София, бабата на Софи Бехарано. Трябвало е да оцелее и да опази синовете си в онези години, когато мъжът ѝ е интерниран в трудовите лагери, когато е шиела жълтата звезда на дрехата си, когато пред очите на детето ѝ са я заплюли на улицата, когато не са ѝ давали работа, защото е еврейка, когато е нямало как да нахрани момчетата.

Когато най-накрая пристига при майка си и сестрите си в Мексико, тя е искала да им разкаже всичко, през което е минала. И е разказвала, и е разказвала, и е разказвала… как е живяла сама със синовете си, как се е чувствала в онази плевня, как е вървяла по улицата и са я плюели в лицето. Разказвала е за всичко, което жестоко я е наранявало. А те са я слушали, слушали, слушали. И се опитвали да я откъснат от тези спомени. Казвали ѝ: „Вече си тук. Свършило се е. Обърни страницата. Забрави!“ Но тя е имала нужда да говори и когато са я карали да спре, да замълчи, всичко това е оставало вътре в нея, оставало е неизречено и сякаш още повече е допринесло за нейната депресия.

Потиснати вътре в теб, травмите набъбват, раждат страховити фантазми, продължават да изкривяват представите ти за минало и настояще.

Софи спира за момент. Прави пауза и продължава:

 … Единственото, което се колебаех дали да включа в книгата, заради мъчителния спомен, бяха сеансите с електрошок, на които подлагаха баба ми София. Сърцето ми се свиваше само от подочутите думи на възрастните. Но тя беше много нежна с мен и изключително горда, че нося името ѝ.

Винаги ме представяше на приятелките си така: „Това е внучката ми, тази, която носи моето име – София.“ С голяма гордост. Защото за сефарадските евреи е важна традиция внучето да наследи твоето име.

Така че нашите отношения се люлееха между гордост и тъга, особено за мен. Посещавахме я и знаехме, че ще говори, говори, говори… през цялото време за войната. С много болка.

Войната приключва щастливо за семейство Биджерано. То успява да отплава за Мексико, при останалите си роднини. Но военните години продължават да моделират поведенческите модели във фамилията.

Имах щастливо детство. Но то беше детство под похлупак, в което аз бях прекалено пазена. Баща ми ужасно се страхуваше за мен заради преживяното от него. Обстоятелството, че неговият собствен баща не е можел да го защити, сякаш допълнително увеличаваше потребността му да бди над мен.

Не ми разрешаваше да се включвам в ученическите екскурзии. Директорът го убеждаваше да ме пусне. Но той беше непоколебим: „Дъщеря ми – не!“

Когато ходехме в Акапулко, не ми даваше да влизам в морето. Страхуваше се, че може нещо да ми се случи, а той няма да може да ми помогне. Въпреки че беше роден във Варна, не умееше да плува.

Когато исках да отида на гости, той заявяваше: „Аз ще те заведа. Аз ще те прибера. Няма да се качваш в чужда кола. Няма да пътуваш с друг.“

В този смисъл не беше лесно. Но винаги ми обясняваше защо: „Ако ти се случи нещо, а аз не мога да ти помогна… ще умра!“

Когато идва от любов, приемаш и това.

С моите сестри вече не беше чак толкова строг. Но спомените за войната не го напускаха.

Най-малката ми сестра веднъж участваше в театрална пиеса в училище и на нея се беше паднало да бъде затворник. Пиеската се играеше в деня за възпоменание на Холокоста. Баща ми беше в салона, сред публиката. И когато я видя да се появява в костюм на райета, скочи и я свали от сцената. Каза ѝ: „Ти никога няма да слагаш на блузата си жълта звезда, нито затворнически дрехи.“ Това се случи по средата на представлението. Сестра ми – трябва да беше на около 11 години – не разбираше какво става. Едва после учителите научиха, че баща ми е оцелял от Холокоста, и разбраха причината за случилото се.

Аз бях най-дълбоко потопена в тази история, защото бях най-голяма от трите ни и най-дълго бях общувала с моите дядо и баба.

Опитвах се да развържа техния възел от спомени. Техните поколенчески травми, през които много пъти минаваш, без да си искал да минеш. Това ми позволи да си отговоря на доста въпроси: защо семейството ми е такова, каквото е; защо им харесва да ядат това, което ядат; защо сред миризмите, които помнят, е особено силно уханието на ветивер и на рози; защо увертюрата „1812 година“ на Чайковски, изпълнена от оркестъра на Военноморските сили в Морската градина във Варна, е музикално пиршество за баща ми.

Говориш с възхита за българите. За втори път си в България. Каква беше първата ти среща с хората тук?

Първия път много силно впечатление ми направи поведението на хората. Аз идвам от една толкова топла страна, толкова приемаща, и изведнъж се натъквам на някаква студенина, като че ли всички са сърдити – и в ресторантите, и продавачите в магазините. Стреснах се – нищо не им бях направила. Защо така? Но разбрах, че са минали едва няколко години, откакто са излезли от комунизма, така си го обяснявах. Все пак тогава останах шокирана. Сега обаче виждам промени – не големи, но има!

Дядо ми много пъти се е връщал в България, опитвайки се да помогне на онези, които са помагали на него. Казваше: „Не мога да забравя това, което се случи. Аз вече съм материално добре, а те живеят в комунизъм и в недоимък.“ Помня как опаковаше куфари, пълни с панталони, панталони, панталони. И аз го питах къде отиват всички тези панталони. Идваха насам, за да помогнат на семейство Деневи, които да ги разменят на черния пазар срещу храна и други неща, които са им липсвали.

Защо е толкова важно за теб да гледаш назад, да търсиш разклоненията в родословното дърво? Твоето първо потапяне във фамилната сага е с книгата ти „Луните на Истанбул“, в която разказваш историята на майка си. След нея идва „Морската градина“.

Ако оставиш да израсне едно поколение, което не знае какво се е случило с живелите преди него, нишката на времето се губи. Аз имах специални отношения и с двете ми баби. Много съм научила от тях. Бих искала и моите внуци да имат с мен такива отношения. И те да наследят тази семейна история.

Да знаеш откъде идваш ти дава идентичност и това решава много проблеми – емоционални, психологически. Аз чудесно знам откъде идвам. През къде е трябвало да се мине, за да съм тук сега – както от страна на майка ми, така и от страна на баща ми. И това ми дава невероятна сигурност! Знам защо съм тук. Знам какво искам от живота. Винаги съм искала да бъда писателка и написаното от мен да бъде разпознаваемо на различни места по света. По този начин аз да представлявам и Мексико. Защото Мексико е много даряваща страна, която отвори вратите си за моето семейство.

Дъщеря съм на емигранти.

За мен е много важно да възстановя позагубилото се чувство на състрадателност към емигранта, срещу когото се надигат все повече гласове.

Особено, когато се заговори за отношенията между Мексико и САЩ.

Всички мигрираме. Някои – по желание, други – по принуда.

Ако е нямало милосърдие към емигрантите от страна на Мексико, когато е пристигнало моето семейство, аз нямаше да съм тук.

Това също е една от мисиите ми – да призовавам към отзивчивост, човещина, доброта към емигрантите. Да не ни е безразлично откъде идват, защо идват…

Продукт съм на различни култури – наполовина българка, наполовина туркиня, родена в Мексико. Омъжих се за ашкеназки евреин. Свекърът ми е от Минск, а свекърва ми – от Полша. Представи си какви смески се отлагат в кръвта на децата ми. Това е истинско великолепие.

Вместо да се фокусираме върху разликите между ашкеназим и сефарадим – в кулинарните традиции, в ритуалите и т.н., – казвам на децата ми: вие сте най-късметлийските същества – притежавате огромно богатство: културно, езиково. Те знаят ладино, знаят и идиш. Яли са бурекас, гефилте фиш, бюрек и такос. Те са привилегировани хора. Израснали са в полифония от култури, която ги превръща в универсални същества.

Как сърфираш между доброто и лошото, които са неотделими съставки от обобщения колективен образ на всеки народ?

Ние, евреите, казваме: когато спасиш един живот, спасяваш цяла вселена. И аз съм доказателство за това. Тези, които са спасили баба ми, дядо ми и баща ми, не са знаели, че спасяват и мен, и моите деца, и моите внуци…

Дървената сабя на Бетко от Варна
Семейството днес © Личен архив

Аз израснах с благодарността, която сякаш беше пропита в кожата ми. Винаги когато се говореше за господин Денев, който е помогнал на семейството ми, се говореше за добрината на всички хора. Такова беше моето възпитание. Говореше се и за доброто, и за лошото, но аз избрах да остана при доброто. И в края на краищата – ето ме, че съм тук.

Под куполите на античния комплекс „Сердика“ в София, в подземието между властовите центрове на държавата, залата е рекламно аранжирана. На първите редове са поставени бисквитки със захарен отпечатък от корицата на „Морската градина“.

Софи Бехарано де Голдберг е чакала този ден. Чакала е тези срещи. Те не са литературни срещи, а поклон към хората, които са дръзнали да кажат „не“, когато други са мълчали. Не всички са имали тази смелост, но книгата на Софи не се интересува от нюансите. Авторката е дошла в България, за да благодари. За да превърне срещата си с тукашната публика в празник. Иска ѝ се баща ѝ да е до нея. Но „малкият Алберто“, днес на 88 години, е на 11 000 километра разстояние. Той ще наблюдава сцената чрез импровизирана видеоконферентна връзка. Когато срещата приключи и присъстващите започнат да ръкопляскат, в София ще е 9 вечерта, а в Мексико сити – 12 на обед.

Introducing AI Attack Coverage in Exposure Command: Secure what traditional AppSec Tools miss

Post Syndicated from Michael Chroney original https://blog.rapid7.com/2025/06/03/introducing-ai-attack-coverage-in-exposure-command-secure-what-traditional-appsec-tools-miss/

Introducing AI Attack Coverage in Exposure Command: Secure what traditional AppSec Tools miss

The rise of GenAI-powered applications – from internal copilots to customer-facing chatbots – is changing how businesses operate. While these tools drive innovation, they also introduce a fast moving, often invisible layer of risk.

Most traditional AppSec tools were never built to handle the unique threats of conversational AI interfaces. As attackers get savvier, security teams need the right kind of coverage.

That’s why we’re excited to introduce AI Attack Coverage in Exposure Command and InsightAppSec.

This release brings purpose built protection for AI driven applications into your existing AppSec workflows, so you can uncover vulnerabilities that legacy tools miss – and stop AI specific threats before they become business problems.

A new class of risk requires a new kind of coverage

As organizations embrace GenAI, they’re also expanding their attack surface – often without realizing it. LLMs (large language models) and AI integrations create new opportunities for attackers to exploit vulnerabilities like:

  • Prompt injection: Tricking the model into revealing sensitive data or bypassing security controls.
  • Plugin abuse: Misusing connected tools through AI interfaces.
  • Data leakage: Inadvertent exposure of sensitive information in responses.

The problem? These aren’t issues most scanners can detect, and manual reviews don’t scale. AI Attack Coverage addresses this gap head-on with capabilities designed to tackle the evolving threat landscape.

Built to secure what matters most

AI Attack Coverage in Exposure Command introduces a suite of enhancements that work seamlessly within your existing DevSecOps pipelines:

  • Smarter scanning for smarter apps: Our enhanced R7Crawler interacts with LLMs and chatbots in real-world ways – uncovering vulnerabilities traditional scanners can’t see.
  • Purpose built LLM testing: With 6 new attack modules, comprising 25+ new attack techniques, that will target six of the OWASP Top 10 for LLMs, we help you find prompt injection, improper output handling, and more.
  • AI aware validation: Reduce false positives with intelligent validation powered by AWS Nova Pro, so teams can focus on what’s real and actionable.
  • Developer first remediation: Features like Attack Replay and CI/CD integrations help teams fix faster – without slowing down releases​.
Introducing AI Attack Coverage in Exposure Command: Secure what traditional AppSec Tools miss

Complete visibility, from code to cloud

Exposure Command doesn’t stop at the app layer. With integrated telemetry from InsightCloudSec, you also get:

  • Full-stack visibility into where GenAI services live across your environment.
  • Automated enforcement of security best practices for AI/ML environments.
  • Unified context to prioritize what’s truly risky in your hybrid estate. ​

Get started with AI Attack Coverage

If you’re building with AI – or thinking about it – now’s the time to make sure your security strategy keeps up. AI Attack Coverage gives your team the visibility, context, and control to manage risk in a world where apps are getting smarter, and attackers are more adept at exploiting them.

Whether you’re an AppSec engineer, a risk leader, or a CISO trying to future-proof your security posture, Exposure Command brings it all together.

Learn More About Rapid7’s Exposure Command

Confidently identify and prioritize exposures from endpoint to cloud with full attack surface visibility and threat-aware risk context.

Young tech creators take over Bradford at Coolest Projects UK

Post Syndicated from Sophie Ashford original https://www.raspberrypi.org/blog/young-tech-creators-take-over-bradford-at-coolest-projects-uk/

Bradford was buzzing with excitement this May as over 170 young digital makers from across the UK gathered for Coolest Projects UK 2025 at the Life Centre to celebrate the amazing things young people create with technology. Run by the Raspberry Pi Foundation and hosted by BBC science presenter Greg Foot, the free, in-person event brought together budding creators, families, mentors, and even a few troops of Scouts for a fun-filled day.

From AI tools and advanced programming to Scratch games and hardware builds, the showcase featured an incredible range of projects from 113 Coolest Projects participants and 58 scouts. Every young person received thoughtful feedback from industry professionals, the chance to try hands-on coding challenges, and the thrill of sharing what they built with a welcoming crowd and other creators.

Two young creators connecting on the day over a project.

A day of discovery and digital making

Coolest Projects UK 2025 wasn’t just about showcasing finished products; it celebrated every part of the creative journey. Many creators shared works-in-progress or prototypes, sparking conversations around design, problem-solving, and learning through code.

One of the day’s highlights was an interactive escape room designed just for the event, giving attendees a chance to flex their logical thinking and collaboration skills. And for 58 visiting Scouts, the day was a chance to earn their Digital Maker Badge and share their creations with the showcase participants.

Two young scouts getting hands-on at a workshop.

Greg Foot is known for BBC Radio 4’s Sliced Bread and other popular science shows. He brought energy and enthusiasm as host, sharing stories and celebrating young people’s creativity on stage.

Greg hosting the awards ceremony where every participant received an award along with a few being given the extra recognition of judges’ favourite.

A platform for everyone

Many of this year’s participants came from local Code Clubs, CoderDojos, and schools across the UK. Others had worked independently to bring their ideas to life. The event encouraged collaboration and connection, with creators exchanging feedback, learning from each other, and celebrating shared interests.

Earlier this year, young people from Bradford also had the chance to take part in hands-on workshops. Held at the National Science and Media Museum, they were guided on getting started with digital making and developing their own project ideas for the showcase.

Featured projects

Here are a few of the projects that were showcased on the day. Each one demonstrates the power of digital tools and the fun and creativity that young people bring to their Coolest Projects journeys. Here’s what the creators had to say about their work, what inspired them, and their experiences of the day:

Arlo | MUST. EAT. DONUTS., AI

Arlo’s interactive game featured AI models that used face and mouth tracking to make the main character, called Chompy, mirror the movements of the player. Arlo’s game was inspired by a session at his Code Club. He came across a video sensing motion plug-in and realised he could make a game that used the player’s head as the controller. 

“It is a fun and silly game for all to play. I also created the artwork myself in my own style, as drawing is another one of my passions, alongside coding. I would love to come back next year, maybe in a different category. I wanted to enter because I got the chance to share my coding and drawing skills, and I was excited to think others may play a game I created.”

Arlo showing his project to the event host Greg Foot.

Felicia and Francesca | The Silent Forest, Scratch

Felicia and Francesca created a top-down, Zelda-style RPG in Scratch, where the player explores a pixel world and interacts with characters and objects. Instead of using the keyboard, the game is controlled with a Micro:bit. Felicia shared with us why they wanted to showcase the game at Coolest Projects.

“I went to Coolest Projects UK because I love making things with Scratch and wanted to show my game to other people. It was a fun way to share what I built, see what other kids made, and learn new ideas. I wanted to challenge myself and be part of something really cool!”

Eesa, Yahya and Yusha | Let’s Speak Arabic!, Scratch

Let’s Speak Arabic is an interactive program designed to help people learn conversational Arabic. Eesa, Yahya, and Yusha are home educated and study a book called Al Arabiyyah Bayna Yadayk together. This inspired them to think about fun ways to upgrade their study, and the idea for gamifying their learning through Scratch was born. The team shared a little about their experience:

“The event was awesome. Actually, it was even better than we imagined! We loved meeting people from all over the country, really enjoyed playing other people’s games, and got lots of ideas for what we could code in the future. And, our parents were so proud we got judge’s favourite!”

Jay | J Bot, Hardware

Jay is a long-time friend of the Foundation and has been taking part in Coolest Projects online and in person for the past few years. He wowed again this year with his life-sized J Bot and shared with us why he thinks Coolest Projects is such an important event for the young creator community.

“I know it might seem a bit intimidating to come and showcase in front of all these people, but I feel more and more people should try and get involved [in Coolest Projects] because it’s a really good community of people. And they are really supportive as well. So I would just say, give it a go. Don’t be nervous because people are here to help you along the way.”

Jay showing his project, J Bot, to another young creator.

What’s next?

Coolest Projects UK continues to grow as a platform for the next generation of changemakers. We can’t wait to see what they create next!

Although the online showcase and Foundation-led events are now closed for this year, there are still many more partner events happening globally throughout 2025.

Visit coolestprojects.org to learn more.

A young creator showcasing her hardware project.

Code Club: A place to keep creating

Coolest Projects is just one part of the Raspberry Pi Foundation’s work to help young people explore computing. Across the UK and Ireland, over 2000 free Code Clubs offer sessions where young people build digital skills, grow in confidence, and work on creative projects with others. Across the world, there are nearly 6000 more clubs running.To find your local Code Club or get involved as a volunteer, head to codeclub.org.

The post Young tech creators take over Bradford at Coolest Projects UK appeared first on Raspberry Pi Foundation.

Security updates for Tuesday

Post Syndicated from corbet original https://lwn.net/Articles/1023625/

Security updates have been issued by AlmaLinux (varnish), Debian (asterisk and roundcube), Fedora (systemd), Mageia (golang), Red Hat (ghostscript, perl-CPAN, python36:3.6, and rsync), SUSE (govulncheck-vulndb, libsoup-2_4-1, and postgresql, postgresql16, postgresql17), and Ubuntu (mariadb, open-vm-tools, php-twig, and python-tornado).

Building an AI Agent that puts humans in the loop with Knock and Cloudflare’s Agents SDK

Post Syndicated from Chris Bell (Guest author) original https://blog.cloudflare.com/building-agents-at-knock-agents-sdk/

This is a guest post by Chris Bell, CTO of Knock

There’s a lot of talk right now about building AI agents, but not a lot out there about what it takes to make those agents truly useful.

An Agent is an autonomous system designed to make decisions and perform actions to achieve a specific goal or set of goals, without human input.

No matter how good your agent is at making decisions, you will need a person to provide guidance or input on the agent’s path towards its goal. After all, an agent that cannot interact or respond to the outside world and the systems that govern it will be limited in the problems it can solve.

That’s where the “human-in-the-loop” interaction pattern comes in. You’re bringing a human into the agent’s loop and requiring an input from that human before the agent can continue on its task.


In this blog post, we’ll use Knock and the Cloudflare Agents SDK to build an AI Agent for a virtual card issuing workflow that requires human approval when a new card is requested.

You can find the complete code for this example in the repository.

What is Knock?

Knock is messaging infrastructure you can use to send multi-channel messages across in-app, email, SMS, push, and Slack, without writing any integration code.

With Knock, you gain complete visibility into the messages being sent to your users while also handling reliable delivery, user notification preferences, and more.

You can use Knock to power human-in-the-loop flows for your agents using Knock’s Agent Toolkit, which is a set of tools that expose Knock’s APIs and messaging capabilities to your AI agents.

Using the Agent SDK as the foundation of our AI Agent

The Agents SDK provides an abstraction for building stateful, real-time agents on top of Durable Objects that are globally addressable and persist state using an embedded, zero-latency SQLite database.

Building an AI agent outside of using the Agents SDK and the Cloudflare platform means we need to consider WebSocket servers, state persistence, and how to scale our service horizontally. Because a Durable Object backs the Agents SDK, we receive these benefits for free, while having a globally addressable piece of compute with built-in storage, that’s completely serverless and scales to zero.

In the example, we’ll use these features to build an agent that users interact with in real-time via chat, and that can be paused and resumed as needed. The Agents SDK is the ideal platform for powering asynchronous agentic workflows, such as those required in human-in-the-loop interactions.

Setting up our Knock messaging workflow

Within Knock, we design our approval workflow using the visual workflow builder to create the cross-channel messaging logic. We then make the notification templates associated with each channel to which we want to send messages.

Knock will automatically apply the user’s preferences as part of the workflow execution, ensuring that your user’s notification settings are respected.


You can find an example workflow that we’ve already created for this demo in the repository. You can use this workflow template via the Knock CLI to import it into your account.

Building our chat UI

We’ve built the AI Agent as a chat interface on top of the AIChatAgent abstraction from Cloudflare’s Agents SDK (docs). The Agents SDK here takes care of the bulk of the complexity, and we’re left to implement our LLM calling code with our system prompt.

// src/index.ts

import { AIChatAgent } from "agents/ai-chat-agent";
import { openai } from "@ai-sdk/openai";
import { createDataStreamResponse, streamText } from "ai";

export class AIAgent extends AIChatAgent {
  async onChatMessage(onFinish) {
    return createDataStreamResponse({
      execute: async (dataStream) => {
        try {
          const stream = streamText({
            model: openai("gpt-4o-mini"),
            system: `You are a helpful assistant for a financial services company. You help customers with credit card issuing.`,
            messages: this.messages,
            onFinish,
            maxSteps: 5,
          });

          stream.mergeIntoDataStream(dataStream);
        } catch (error) {
          console.error(error);
        }
      },
    });
  }
}

On the client side, we’re using the useAgentChat hook from the agents/ai-react package to power the real-time user-to-agent chat.

We’ve modeled our agent as a chat per user, which we set up using the useAgent hook by specifying the name of the process as the userId.

// src/index.ts

import { useAgent } from "agents/react";
import { useAgentChat } from "agents/ai-react";

function Chat({ userId }: { userId: string }) {
  const agent = useAgent({ agent: "AIAgent", name: userId });
  const { messages, input, handleInputChange, handleSubmit, isLoading } = useAgentChat({ agent });
  // ... 
}

This means we have an agent process, and therefore a durable object, per-user. For our human-in-the-loop use case, this becomes important later on as we talk about resuming our deferred tool call.

Deferring the tool call to Knock

We give the agent our card issuing capability through exposing an issueCard tool. However, instead of writing the approval flow and cross-channel logic ourselves, we delegate it entirely to Knock by wrapping the issue card tool in our requireHumanInput method.

Now when the user asks to request a new card, we make a call out to Knock to initiate our card request, which will notify the appropriate admins in the organization to request an approval.


To set this up, we need to use Knock’s Agent Toolkit, which exposes methods to work with Knock in our AI agent and power cross-channel messaging.

import { createKnockToolkit } from "@knocklabs/agent-toolkit/ai-sdk";
import { tool } from "ai";
import { z } from "zod";

import { AIAgent } from "./index";
import { issueCard } from "./api";
import { BASE_URL } from "./constants";

async function initializeToolkit(agent: AIAgent) {
  const toolkit = await createKnockToolkit({ serviceToken: agent.env.KNOCK_SERVICE_TOKEN });

  const issueCardTool = tool({
    description: "Issue a new credit card to a customer.",
    parameters: z.object({
      customerId: z.string(),
    }),
    execute: async ({ customerId }) => {
      return await issueCard(customerId);
    },
  });

  const { issueCard } = toolkit.requireHumanInput(
    { issueCard: issueCardTool },
    {
      workflow: "approve-issued-card",
      actor: agent.name,
      recipients: ["admin_user_1"],
      metadata: {
        approve_url: `${BASE_URL}/card-issued/approve`,
        reject_url: `${BASE_URL}/card-issued/reject`,
      },
    }
  );
  
  return { toolkit, tools: { issueCard } };  
}

There’s a lot going on here, so let’s walk through the key parts:

  • We wrap our issueCard tool in the requireHumanInput method, exposed from the Knock Agent Toolkit

  • We want the messaging workflow to be invoked to be our approve-issued-card workflow

  • We pass the agent.name as the actor of the request, which translates to the user ID

  • We set the recipient of this workflow to be the user admin_user_1

  • We pass the approve and reject URLs so that they can be used in our message templates

  • The wrapped tool is then returned as issueCard

Under the hood, these options are passed to the Knock workflow trigger API to invoke a workflow per-recipient. The set of the recipients listed here could be dynamic, or go to a group of users through Knock’s subscriptions API.

We can then pass the wrapped issue card tool to our LLM call in the onChatMessage method on the agent so that the tool call can be called as part of the interaction with the agent.

export class AIAgent extends AIChatAgent {
  // ... other methods

  async onChatMessage(onFinish) {
    const { tools } = await initializeToolkit(this);

    return createDataStreamResponse({
      execute: async (dataStream) => {
        const stream = streamText({
          model: openai("gpt-4o-mini"),
          system: "You are a helpful assistant for a financial services company. You help customers with credit card issuing.",
          messages: this.messages,
          onFinish,
          tools,
          maxSteps: 5,
        });

        stream.mergeIntoDataStream(dataStream);
      },
    });
  }
}

Now when the agent calls the issueCardTool, we invoke Knock to send our approval notifications, deferring the tool call to issue the card until we receive an approval. Knock’s workflows take care of sending out the message to the set of recipient’s specified, generating and delivering messages according to each user’s preferences.

Using Knock workflows for our approval message makes it easy to build cross-channel messaging to reach the user according to their communication preferences. We can also leverage delays, throttles, batching, and conditions to orchestrate more complex messaging.

Handling the approval

Once the message has been sent to our approvers, the next step is to handle the approval coming back, bringing the human into the agent’s loop.

The approval request is asynchronous, meaning that the response can come at any point in the future. Fortunately, Knock takes care of the heavy lifting here for you, routing the event to the agent worker via a webhook that tracks the interaction with the underlying message. In our case, that’s a click to the “approve” or “reject” button.

First, we set up a message.interacted webhook handler within the Knock dashboard to forward the interactions to our worker, and ultimately to our agent process.


In our example here, we route the approval click back to the worker to handle, appending a Knock message ID to the end of the approve_url and reject_url to track engagement against the specific message sent. We do this via liquid inside of our message templates in Knock: {{ data.approve_url }}?messageId={{ current_message.id }} . One caveat here is that if this were a production application, we’re likely going to handle our approval click in a different application than this agent is running. We co-located it here for the purposes of this demo only.

Once the link is clicked, we have a handler in our worker to mark the message as interacted using Knock’s message interaction API, passing through the status as metadata so that it can be used later.

import Knock from '@knocklabs/node';
import { Hono } from "hono";

const app = new Hono();
const client = new Knock();

app.get("/card-issued/approve", async (c) => {
  const { messageId } = c.req.query();
  
  if (!messageId) return c.text("No message ID found", { status: 400 });

  await client.messages.markAsInteracted(messageId, {
    status: "approved",
  });

  return c.text("Approved");
});

The message interaction will flow from Knock to our worker via the webhook we set up, ensuring that the process is fully asynchronous. The payload of the webhook includes the full message, including metadata about the user that generated the original request, and keeps details about the request itself, which in our case contains the tool call.

import { getAgentByName, routeAgentRequest } from "agents";
import { Hono } from "hono";

const app = new Hono();

app.post("/incoming/knock/webhook", async (c) => {
  const body = await c.req.json();
  const env = c.env as Env;

  // Find the user ID from the tool call for the calling user
  const userId = body?.data?.actors[0];

  if (!userId) {
    return c.text("No user ID found", { status: 400 });
  }

  // Find the agent DO for the user
  const existingAgent = await getAgentByName(env.AIAgent, userId);

  if (existingAgent) {
    // Route the request to the agent DO to process
    const result = await existingAgent.handleIncomingWebhook(body);

    return c.json(result);
  } else {
    return c.text("Not found", { status: 404 });
  }
});

We leverage the agent’s ability to be addressed by a named identifier to route the request from the worker to the agent. In our case, that’s the userId. Because the agent is backed by a durable object, this process of going from incoming worker request to finding and resuming the agent is trivial.

Resuming the deferred tool call

We then use the context about the original tool call, passed through to Knock and round tripped back to the agent, to resume the tool execution and issue the card.

export class AIAgent extends AIChatAgent {
  // ... other methods

  async handleIncomingWebhook(body: any) {
    const { toolkit } = await initializeToolkit(this);

    const deferredToolCall = toolkit.handleMessageInteraction(body);

    if (!deferredToolCall) {
      return { error: "No deferred tool call given" };
    }

    // If we received an "approved" status then we know the call was approved 
    // so we can resume the deferred tool call execution
    if (result.interaction.status === "approved") {
      const toolCallResult = 
	      await toolkit.resumeToolExecution(result.toolCall);

      const { response } = await generateText({
        model: openai("gpt-4o-mini"),
        prompt: `You were asked to issue a card for a customer. The card is now approved. The result was: ${JSON.stringify(toolCallResult)}.`,
      });

      const message = responseToAssistantMessage(
        response.messages[0],
        result.toolCall,
        toolCallResult
      );

      // Save the message so that it's displayed to the user
      this.persistMessages([...this.messages, message]);
    }

    return { status: "success" };
  }
}

Again, there’s a lot going on here, so let’s step through the important parts:

  • We attempt to transform the body, which is the webhook payload from Knock, into a deferred tool call via the handleMessageInteraction method

  • If the metadata status we passed through to the interaction call earlier has an “approved” status then we resume the tool call via the resumeToolExecution method

  • Finally, we generate a message from the LLM and persist it, ensuring that the user is informed of the approved card

With this last piece in place, we can now request a new card be issued, have an approval request be dispatched from the agent, send the approval messages, and route those approvals back to our agent to be processed. The agent will asynchronously process our card issue request and the deferred tool call will be resumed for us, with very little code.

Protecting against duplicate approvals

One issue with the above implementation is that we’re prone to issuing multiple cards if someone clicks on the approve button more than once. To rectify this, we want to keep track of the tool calls being issued, and ensure that the call is processed at most once.

To power this we leverage the agent’s built-in state, which can be used to persist information without reaching for another persistence store like a database or Redis, although we could absolutely do so if we wished. We can track the tool calls by their ID and capture their current status, right inside the agent process.

type ToolCallStatus = "requested" | "approved" | "rejected";

export interface AgentState {
  toolCalls: Record<string, ToolCallStatus>;
}

class AIAgent extends AIChatAgent<Env, AgentState> {
  initialState: AgentState = {
    toolCalls: {},
  };
  
  setToolCallStatus(toolCallId: string, status: ToolCallStatus) {
    this.setState({
      ...this.state,
      toolCalls: { ...this.state.toolCalls, [toolCallId]: status },
    });
  } 
  // ... 
}

Here, we create the initial state for the tool calls as an empty object. We also add a quick setter helper method to make interactions easier.

Next up, we need to record the tool call being made. To do so, we can use the onAfterCallKnock option in the requireHumanInput helper to capture that the tool call has been requested for the user.

const { issueCard }  = toolkit.requireHumanInput(
  { issueCard: issueCardTool },
  {
    // Keep track of the tool call state once it's been sent to Knock
    onAfterCallKnock: async (toolCall) => 
      agent.setToolCallStatus(toolCall.id, "requested"),
    // ... as before
  }
);

Finally, we then need to check the state when we’re processing the incoming webhook, and mark the tool call as approved (some code omitted for brevity).

export class AIAgent extends AIChatAgent {
  async handleIncomingWebhook(body: any) {
    const { toolkit } = await initializeToolkit(this);
    const deferredToolCall = toolkit.handleMessageInteraction(body);
    const toolCallId = result.toolCall.id;

    // Make sure this is a tool call that can be processed
    if (this.state.toolCalls[toolCallId] !== "requested") {
      return { error: "Tool call is not requested" };
    }

    if (result.interaction.status === "approved") {
      const toolCallResult = await toolkit.resumeToolExecution(result.toolCall);
      this.setToolCallStatus(toolCallId, "approved");
      // ... rest as before
    }
  }
}

Conclusion

Using the Agents SDK and Knock, it’s easy to build advanced human-in-the-loop experiences that defer tool calls.

Knock’s workflow builder and notification engine gives you building blocks to create sophisticated cross-channel messaging for your agents. You can easily create escalation flows that send messages through SMS, push, email, or Slack that respect the notification preferences of your users. Knock also gives you complete visibility into the messages your users are receiving.

The Durable Object abstraction underneath the Agents SDK means that we get a globally addressable agent process that’s easy to yield and resume back to. The persistent storage in the Durable Object means we can retain the complete chat history per-user, and any other state that’s required in the agent process to resume the agent with (like our tool calls). Finally, the serverless nature of the underlying Durable Object means we’re able to horizontally scale to support a large number of users with no effort.

If you’re looking to build your own AI Agent chat experience with a multiplayer human-in-the-loop experience, you’ll find the complete code from this guide available in GitHub.

The collective thoughts of the interwebz