Building an AI Agent that puts humans in the loop with Knock and Cloudflare’s Agents SDK

Post Syndicated from Chris Bell (Guest author) original https://blog.cloudflare.com/building-agents-at-knock-agents-sdk/

This is a guest post by Chris Bell, CTO of Knock

There’s a lot of talk right now about building AI agents, but not a lot out there about what it takes to make those agents truly useful.

An Agent is an autonomous system designed to make decisions and perform actions to achieve a specific goal or set of goals, without human input.

No matter how good your agent is at making decisions, you will need a person to provide guidance or input on the agent’s path towards its goal. After all, an agent that cannot interact or respond to the outside world and the systems that govern it will be limited in the problems it can solve.

That’s where the “human-in-the-loop” interaction pattern comes in. You’re bringing a human into the agent’s loop and requiring an input from that human before the agent can continue on its task.


In this blog post, we’ll use Knock and the Cloudflare Agents SDK to build an AI Agent for a virtual card issuing workflow that requires human approval when a new card is requested.

You can find the complete code for this example in the repository.

What is Knock?

Knock is messaging infrastructure you can use to send multi-channel messages across in-app, email, SMS, push, and Slack, without writing any integration code.

With Knock, you gain complete visibility into the messages being sent to your users while also handling reliable delivery, user notification preferences, and more.

You can use Knock to power human-in-the-loop flows for your agents using Knock’s Agent Toolkit, which is a set of tools that expose Knock’s APIs and messaging capabilities to your AI agents.

Using the Agent SDK as the foundation of our AI Agent

The Agents SDK provides an abstraction for building stateful, real-time agents on top of Durable Objects that are globally addressable and persist state using an embedded, zero-latency SQLite database.

Building an AI agent outside of using the Agents SDK and the Cloudflare platform means we need to consider WebSocket servers, state persistence, and how to scale our service horizontally. Because a Durable Object backs the Agents SDK, we receive these benefits for free, while having a globally addressable piece of compute with built-in storage, that’s completely serverless and scales to zero.

In the example, we’ll use these features to build an agent that users interact with in real-time via chat, and that can be paused and resumed as needed. The Agents SDK is the ideal platform for powering asynchronous agentic workflows, such as those required in human-in-the-loop interactions.

Setting up our Knock messaging workflow

Within Knock, we design our approval workflow using the visual workflow builder to create the cross-channel messaging logic. We then make the notification templates associated with each channel to which we want to send messages.

Knock will automatically apply the user’s preferences as part of the workflow execution, ensuring that your user’s notification settings are respected.


You can find an example workflow that we’ve already created for this demo in the repository. You can use this workflow template via the Knock CLI to import it into your account.

Building our chat UI

We’ve built the AI Agent as a chat interface on top of the AIChatAgent abstraction from Cloudflare’s Agents SDK (docs). The Agents SDK here takes care of the bulk of the complexity, and we’re left to implement our LLM calling code with our system prompt.

// src/index.ts

import { AIChatAgent } from "agents/ai-chat-agent";
import { openai } from "@ai-sdk/openai";
import { createDataStreamResponse, streamText } from "ai";

export class AIAgent extends AIChatAgent {
  async onChatMessage(onFinish) {
    return createDataStreamResponse({
      execute: async (dataStream) => {
        try {
          const stream = streamText({
            model: openai("gpt-4o-mini"),
            system: `You are a helpful assistant for a financial services company. You help customers with credit card issuing.`,
            messages: this.messages,
            onFinish,
            maxSteps: 5,
          });

          stream.mergeIntoDataStream(dataStream);
        } catch (error) {
          console.error(error);
        }
      },
    });
  }
}

On the client side, we’re using the useAgentChat hook from the agents/ai-react package to power the real-time user-to-agent chat.

We’ve modeled our agent as a chat per user, which we set up using the useAgent hook by specifying the name of the process as the userId.

// src/index.ts

import { useAgent } from "agents/react";
import { useAgentChat } from "agents/ai-react";

function Chat({ userId }: { userId: string }) {
  const agent = useAgent({ agent: "AIAgent", name: userId });
  const { messages, input, handleInputChange, handleSubmit, isLoading } = useAgentChat({ agent });
  // ... 
}

This means we have an agent process, and therefore a durable object, per-user. For our human-in-the-loop use case, this becomes important later on as we talk about resuming our deferred tool call.

Deferring the tool call to Knock

We give the agent our card issuing capability through exposing an issueCard tool. However, instead of writing the approval flow and cross-channel logic ourselves, we delegate it entirely to Knock by wrapping the issue card tool in our requireHumanInput method.

Now when the user asks to request a new card, we make a call out to Knock to initiate our card request, which will notify the appropriate admins in the organization to request an approval.


To set this up, we need to use Knock’s Agent Toolkit, which exposes methods to work with Knock in our AI agent and power cross-channel messaging.

import { createKnockToolkit } from "@knocklabs/agent-toolkit/ai-sdk";
import { tool } from "ai";
import { z } from "zod";

import { AIAgent } from "./index";
import { issueCard } from "./api";
import { BASE_URL } from "./constants";

async function initializeToolkit(agent: AIAgent) {
  const toolkit = await createKnockToolkit({ serviceToken: agent.env.KNOCK_SERVICE_TOKEN });

  const issueCardTool = tool({
    description: "Issue a new credit card to a customer.",
    parameters: z.object({
      customerId: z.string(),
    }),
    execute: async ({ customerId }) => {
      return await issueCard(customerId);
    },
  });

  const { issueCard } = toolkit.requireHumanInput(
    { issueCard: issueCardTool },
    {
      workflow: "approve-issued-card",
      actor: agent.name,
      recipients: ["admin_user_1"],
      metadata: {
        approve_url: `${BASE_URL}/card-issued/approve`,
        reject_url: `${BASE_URL}/card-issued/reject`,
      },
    }
  );
  
  return { toolkit, tools: { issueCard } };  
}

There’s a lot going on here, so let’s walk through the key parts:

  • We wrap our issueCard tool in the requireHumanInput method, exposed from the Knock Agent Toolkit

  • We want the messaging workflow to be invoked to be our approve-issued-card workflow

  • We pass the agent.name as the actor of the request, which translates to the user ID

  • We set the recipient of this workflow to be the user admin_user_1

  • We pass the approve and reject URLs so that they can be used in our message templates

  • The wrapped tool is then returned as issueCard

Under the hood, these options are passed to the Knock workflow trigger API to invoke a workflow per-recipient. The set of the recipients listed here could be dynamic, or go to a group of users through Knock’s subscriptions API.

We can then pass the wrapped issue card tool to our LLM call in the onChatMessage method on the agent so that the tool call can be called as part of the interaction with the agent.

export class AIAgent extends AIChatAgent {
  // ... other methods

  async onChatMessage(onFinish) {
    const { tools } = await initializeToolkit(this);

    return createDataStreamResponse({
      execute: async (dataStream) => {
        const stream = streamText({
          model: openai("gpt-4o-mini"),
          system: "You are a helpful assistant for a financial services company. You help customers with credit card issuing.",
          messages: this.messages,
          onFinish,
          tools,
          maxSteps: 5,
        });

        stream.mergeIntoDataStream(dataStream);
      },
    });
  }
}

Now when the agent calls the issueCardTool, we invoke Knock to send our approval notifications, deferring the tool call to issue the card until we receive an approval. Knock’s workflows take care of sending out the message to the set of recipient’s specified, generating and delivering messages according to each user’s preferences.

Using Knock workflows for our approval message makes it easy to build cross-channel messaging to reach the user according to their communication preferences. We can also leverage delays, throttles, batching, and conditions to orchestrate more complex messaging.

Handling the approval

Once the message has been sent to our approvers, the next step is to handle the approval coming back, bringing the human into the agent’s loop.

The approval request is asynchronous, meaning that the response can come at any point in the future. Fortunately, Knock takes care of the heavy lifting here for you, routing the event to the agent worker via a webhook that tracks the interaction with the underlying message. In our case, that’s a click to the “approve” or “reject” button.

First, we set up a message.interacted webhook handler within the Knock dashboard to forward the interactions to our worker, and ultimately to our agent process.


In our example here, we route the approval click back to the worker to handle, appending a Knock message ID to the end of the approve_url and reject_url to track engagement against the specific message sent. We do this via liquid inside of our message templates in Knock: {{ data.approve_url }}?messageId={{ current_message.id }} . One caveat here is that if this were a production application, we’re likely going to handle our approval click in a different application than this agent is running. We co-located it here for the purposes of this demo only.

Once the link is clicked, we have a handler in our worker to mark the message as interacted using Knock’s message interaction API, passing through the status as metadata so that it can be used later.

import Knock from '@knocklabs/node';
import { Hono } from "hono";

const app = new Hono();
const client = new Knock();

app.get("/card-issued/approve", async (c) => {
  const { messageId } = c.req.query();
  
  if (!messageId) return c.text("No message ID found", { status: 400 });

  await client.messages.markAsInteracted(messageId, {
    status: "approved",
  });

  return c.text("Approved");
});

The message interaction will flow from Knock to our worker via the webhook we set up, ensuring that the process is fully asynchronous. The payload of the webhook includes the full message, including metadata about the user that generated the original request, and keeps details about the request itself, which in our case contains the tool call.

import { getAgentByName, routeAgentRequest } from "agents";
import { Hono } from "hono";

const app = new Hono();

app.post("/incoming/knock/webhook", async (c) => {
  const body = await c.req.json();
  const env = c.env as Env;

  // Find the user ID from the tool call for the calling user
  const userId = body?.data?.actors[0];

  if (!userId) {
    return c.text("No user ID found", { status: 400 });
  }

  // Find the agent DO for the user
  const existingAgent = await getAgentByName(env.AIAgent, userId);

  if (existingAgent) {
    // Route the request to the agent DO to process
    const result = await existingAgent.handleIncomingWebhook(body);

    return c.json(result);
  } else {
    return c.text("Not found", { status: 404 });
  }
});

We leverage the agent’s ability to be addressed by a named identifier to route the request from the worker to the agent. In our case, that’s the userId. Because the agent is backed by a durable object, this process of going from incoming worker request to finding and resuming the agent is trivial.

Resuming the deferred tool call

We then use the context about the original tool call, passed through to Knock and round tripped back to the agent, to resume the tool execution and issue the card.

export class AIAgent extends AIChatAgent {
  // ... other methods

  async handleIncomingWebhook(body: any) {
    const { toolkit } = await initializeToolkit(this);

    const deferredToolCall = toolkit.handleMessageInteraction(body);

    if (!deferredToolCall) {
      return { error: "No deferred tool call given" };
    }

    // If we received an "approved" status then we know the call was approved 
    // so we can resume the deferred tool call execution
    if (result.interaction.status === "approved") {
      const toolCallResult = 
	      await toolkit.resumeToolExecution(result.toolCall);

      const { response } = await generateText({
        model: openai("gpt-4o-mini"),
        prompt: `You were asked to issue a card for a customer. The card is now approved. The result was: ${JSON.stringify(toolCallResult)}.`,
      });

      const message = responseToAssistantMessage(
        response.messages[0],
        result.toolCall,
        toolCallResult
      );

      // Save the message so that it's displayed to the user
      this.persistMessages([...this.messages, message]);
    }

    return { status: "success" };
  }
}

Again, there’s a lot going on here, so let’s step through the important parts:

  • We attempt to transform the body, which is the webhook payload from Knock, into a deferred tool call via the handleMessageInteraction method

  • If the metadata status we passed through to the interaction call earlier has an “approved” status then we resume the tool call via the resumeToolExecution method

  • Finally, we generate a message from the LLM and persist it, ensuring that the user is informed of the approved card

With this last piece in place, we can now request a new card be issued, have an approval request be dispatched from the agent, send the approval messages, and route those approvals back to our agent to be processed. The agent will asynchronously process our card issue request and the deferred tool call will be resumed for us, with very little code.

Protecting against duplicate approvals

One issue with the above implementation is that we’re prone to issuing multiple cards if someone clicks on the approve button more than once. To rectify this, we want to keep track of the tool calls being issued, and ensure that the call is processed at most once.

To power this we leverage the agent’s built-in state, which can be used to persist information without reaching for another persistence store like a database or Redis, although we could absolutely do so if we wished. We can track the tool calls by their ID and capture their current status, right inside the agent process.

type ToolCallStatus = "requested" | "approved" | "rejected";

export interface AgentState {
  toolCalls: Record<string, ToolCallStatus>;
}

class AIAgent extends AIChatAgent<Env, AgentState> {
  initialState: AgentState = {
    toolCalls: {},
  };
  
  setToolCallStatus(toolCallId: string, status: ToolCallStatus) {
    this.setState({
      ...this.state,
      toolCalls: { ...this.state.toolCalls, [toolCallId]: status },
    });
  } 
  // ... 
}

Here, we create the initial state for the tool calls as an empty object. We also add a quick setter helper method to make interactions easier.

Next up, we need to record the tool call being made. To do so, we can use the onAfterCallKnock option in the requireHumanInput helper to capture that the tool call has been requested for the user.

const { issueCard }  = toolkit.requireHumanInput(
  { issueCard: issueCardTool },
  {
    // Keep track of the tool call state once it's been sent to Knock
    onAfterCallKnock: async (toolCall) => 
      agent.setToolCallStatus(toolCall.id, "requested"),
    // ... as before
  }
);

Finally, we then need to check the state when we’re processing the incoming webhook, and mark the tool call as approved (some code omitted for brevity).

export class AIAgent extends AIChatAgent {
  async handleIncomingWebhook(body: any) {
    const { toolkit } = await initializeToolkit(this);
    const deferredToolCall = toolkit.handleMessageInteraction(body);
    const toolCallId = result.toolCall.id;

    // Make sure this is a tool call that can be processed
    if (this.state.toolCalls[toolCallId] !== "requested") {
      return { error: "Tool call is not requested" };
    }

    if (result.interaction.status === "approved") {
      const toolCallResult = await toolkit.resumeToolExecution(result.toolCall);
      this.setToolCallStatus(toolCallId, "approved");
      // ... rest as before
    }
  }
}

Conclusion

Using the Agents SDK and Knock, it’s easy to build advanced human-in-the-loop experiences that defer tool calls.

Knock’s workflow builder and notification engine gives you building blocks to create sophisticated cross-channel messaging for your agents. You can easily create escalation flows that send messages through SMS, push, email, or Slack that respect the notification preferences of your users. Knock also gives you complete visibility into the messages your users are receiving.

The Durable Object abstraction underneath the Agents SDK means that we get a globally addressable agent process that’s easy to yield and resume back to. The persistent storage in the Durable Object means we can retain the complete chat history per-user, and any other state that’s required in the agent process to resume the agent with (like our tool calls). Finally, the serverless nature of the underlying Durable Object means we’re able to horizontally scale to support a large number of users with no effort.

If you’re looking to build your own AI Agent chat experience with a multiplayer human-in-the-loop experience, you’ll find the complete code from this guide available in GitHub.
New Linux Vulnerabilities

Post Syndicated from Bruce Schneier original https://www.schneier.com/blog/archives/2025/06/new-linux-vulnerabilities.html

They’re interesting:

Tracked as CVE-2025-5054 and CVE-2025-4598, both vulnerabilities are race condition bugs that could enable a local attacker to obtain access to access sensitive information. Tools like Apport and systemd-coredump are designed to handle crash reporting and core dumps in Linux systems.

[…]

“This means that if a local attacker manages to induce a crash in a privileged process and quickly replaces it with another one with the same process ID that resides inside a mount and pid namespace, apport will attempt to forward the core dump (which might contain sensitive information belonging to the original, privileged process) into the namespace.”

Moderate severity, but definitely worth fixing.

Slashdot thread.

Database Monitoring using Zabbix agent 2 – Part 1, SQL

Post Syndicated from Alexander Petrov-Gavrilov original https://blog.zabbix.com/database-monitoring-using-zabbix-agent-2-part-1-sql/30381/

If you find yourself needing additional flexibility when it comes to database monitoring, Zabbix agent 2 may be exactly what you need. Keep reading to see which features make it ideal for database monitoring and find out how to best use them for your own purposes. 

What is a database?

If you’ve been using Zabbix for a while, you know that a database is an organized collection of data that is stored and accessed electronically.
That data can be historical, configuration, business, social media-related, etc. A database, or rather a database management system (DBMS) allows you to store, manage, and retrieve information efficiently.

Types of DBMS

We can separate DBMS into multiple types. Depending on how data is stored, retrieved, managed, there can be quite a few, but we will try to limit ourselves to the most common four:

  • Relational databases (or RDBMS) see tables and SQL.
    • MySQL
    • MariaDB
    • PostgreSQL
    • Oracle
  • NoSQL databases store data in formats like JSON, key-value pairs, or graphs.
    • MongoDB
    • Redis
    • InfluxDB
    • ElasticSearch
  • Cloud databases use cloud platforms for scalability.
    • Amazon RDS
    • Azure SQL
  • Time-series databases (or TSDB databases) are optimized for time-stamped data.
    • TimescaleDB
    • InfluxDB

But what unites all those database engines? They can all be monitored by Zabbix!

Database monitoring

Database monitoring is important for a variety of reasons, the most common of which are to get a precise overview of database and application performance. Since databases can be a vital part of multiple departments and applications,  poor performance may impact an entire company and its users, leading to unsatisfactory results on all sides.

To avoid such situations, the set of metrics we should monitor for database engines can include:

  • Database environment metrics
    • CPU performance
    • Memory usage
    • Drive capacity
    • Disk latency
  • Database performance metrics
    • Query performance
    • Transaction/operations/indexing
    • Connections
  • Application and/or business related data
    • Amount of users
    • Transactions
    • Inventory
    • Configuration      

Why Zabbix agent 2?

Zabbix Agent 2 includes multiple features that enhance its flexibility:

  • Task queue management with respect to both schedule and task concurrency.
  • Concurrent active checks with threads.
  • Multiple agent 2 unique metrics
  • Easier to extend using GO plugins.

Plugins in Zabbix Agent 2 are written in the Go programming language and provide a flexible, native way to extend the agent’s functionality. These plugins communicate directly with databases using their native APIs or libraries, which allows for correct and efficient performance monitoring.

But agent2 provides even more flexibility when focusing on database monitoring, allowing us to:

  • Limit query execution
  • Control the session time
  • Configure encryption between Zabbix agent and database
  • Control cache mode

All database data is collected using the best approach for the monitored database.

  • MySQL, monitoring relies on the Go-MySQL-Driver
  • PostgreSQL integration is managed through the pgx driver

The list goes on for supported database engines:

  • MySQL / MariaDB
  • PostgreSQL
  • ORACLE
  • MSSQL
  • MongoDB
  • Redis
  • Memcached

Monitoring SQL databases

Database environment

In this part we will focus on how to monitor and retrieve data from SQL databases and SQL database-related parameters. Monitoring SQL database environment metrics with Zabbix agent 2 is as straightforward as monitoring any virtual or physical machine with an OS. All we need to do is add the repo:

# dnf install https://repo.zabbix.com/zabbix/7.0/centos/9/x86_64/zabbix-release-latest-7.0.el9.noarch.rpm

Install the agent:

# dnf install zabbix-agent2

Then, make sure that connections from Zabbix server to Zabbix agent 2 are allowed using Server parameter:

### Option: Server
#       List of comma delimited IP addresses, optionally in CIDR notation, or DNS names of Zabbix servers and Zabbix proxies.
#       Incoming connections will be accepted only from the hosts listed here....
# Mandatory: no
# Default:
# Server=
Server=127.0.0.1,server-dns.example.com

Finally, link one of the many templates available out of the box:

List of templates for OS monitoring

SQL database performance metrics

What about the actual DB performance metrics? There are plenty of approaches we can take using Zabbix agent 2.

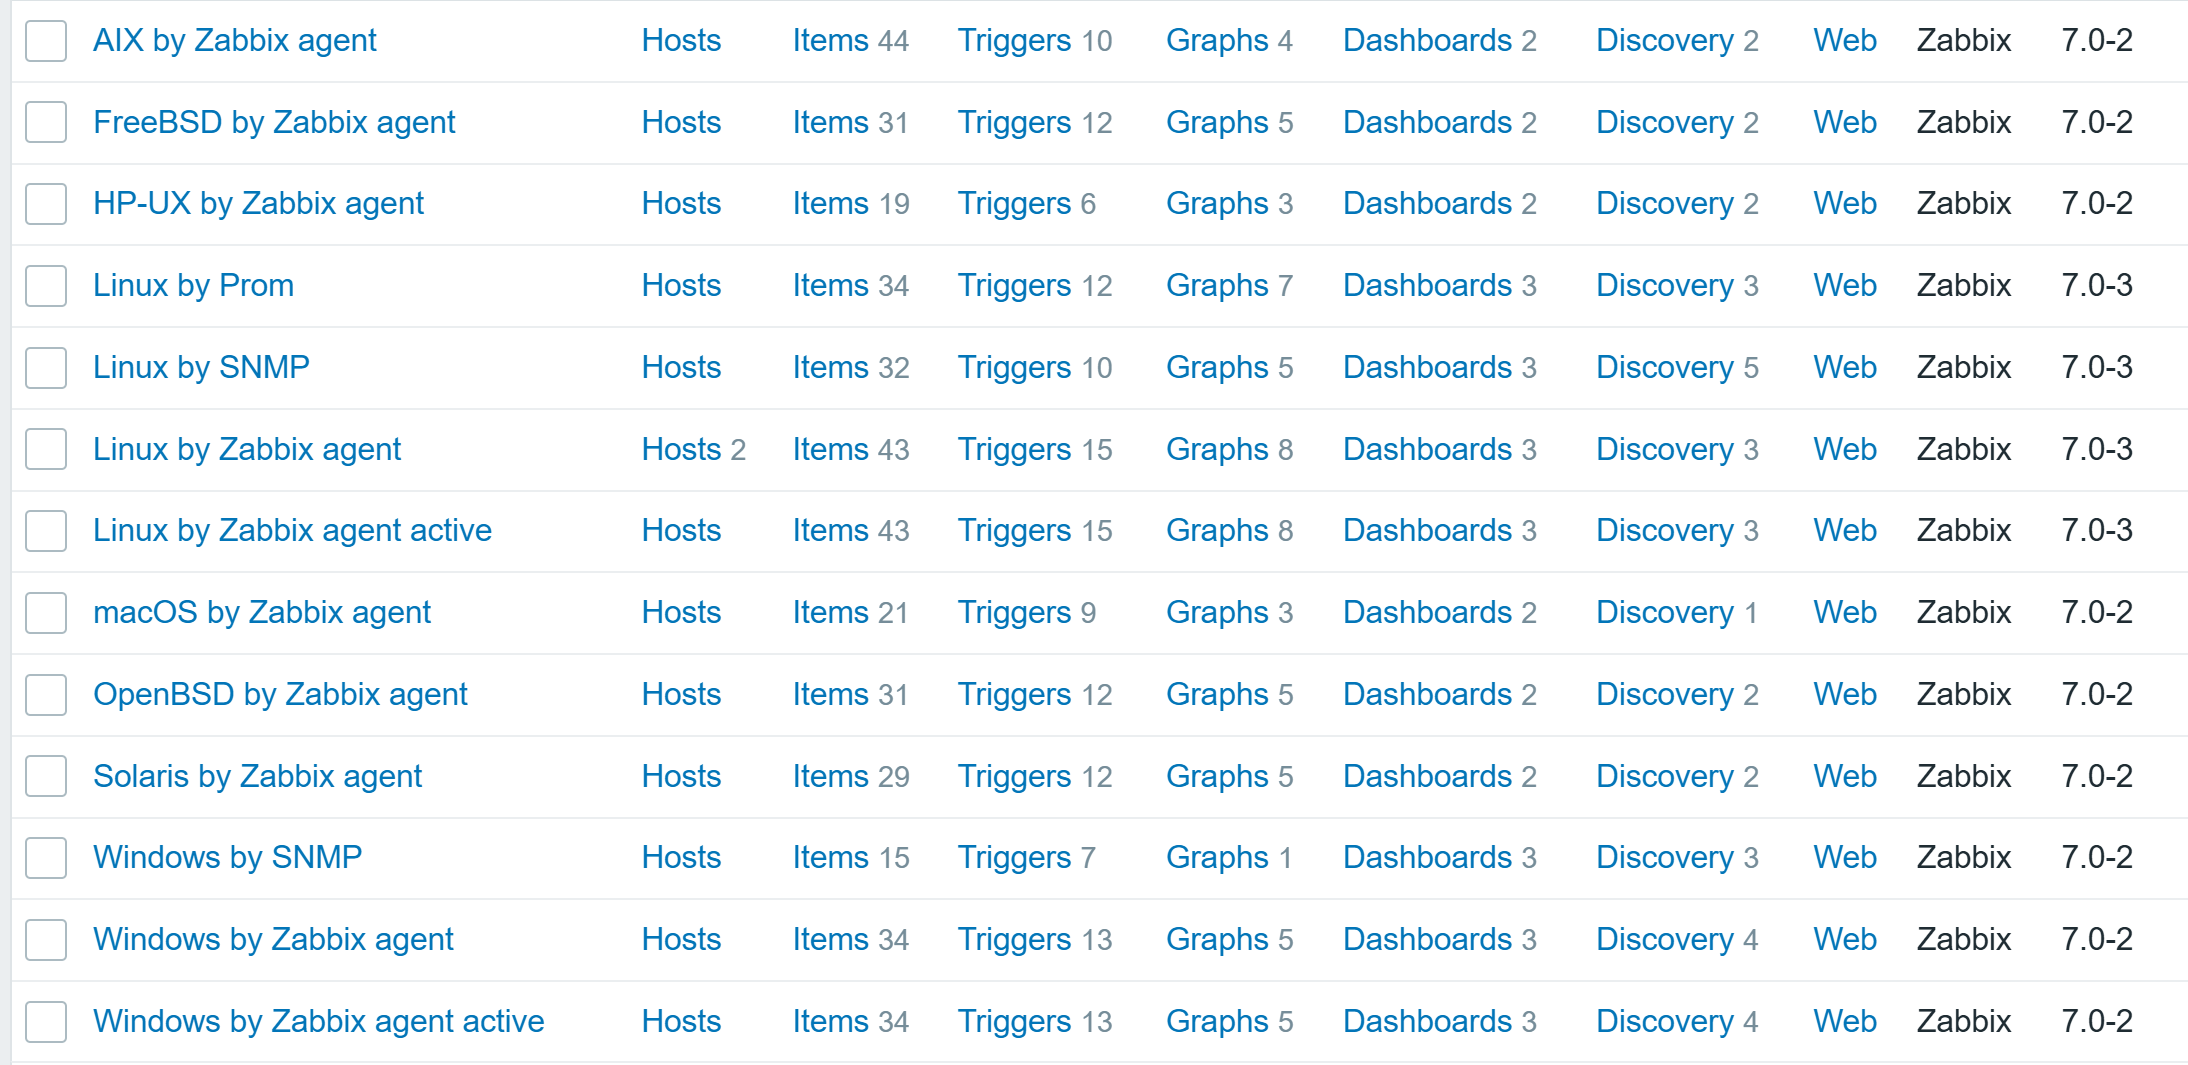
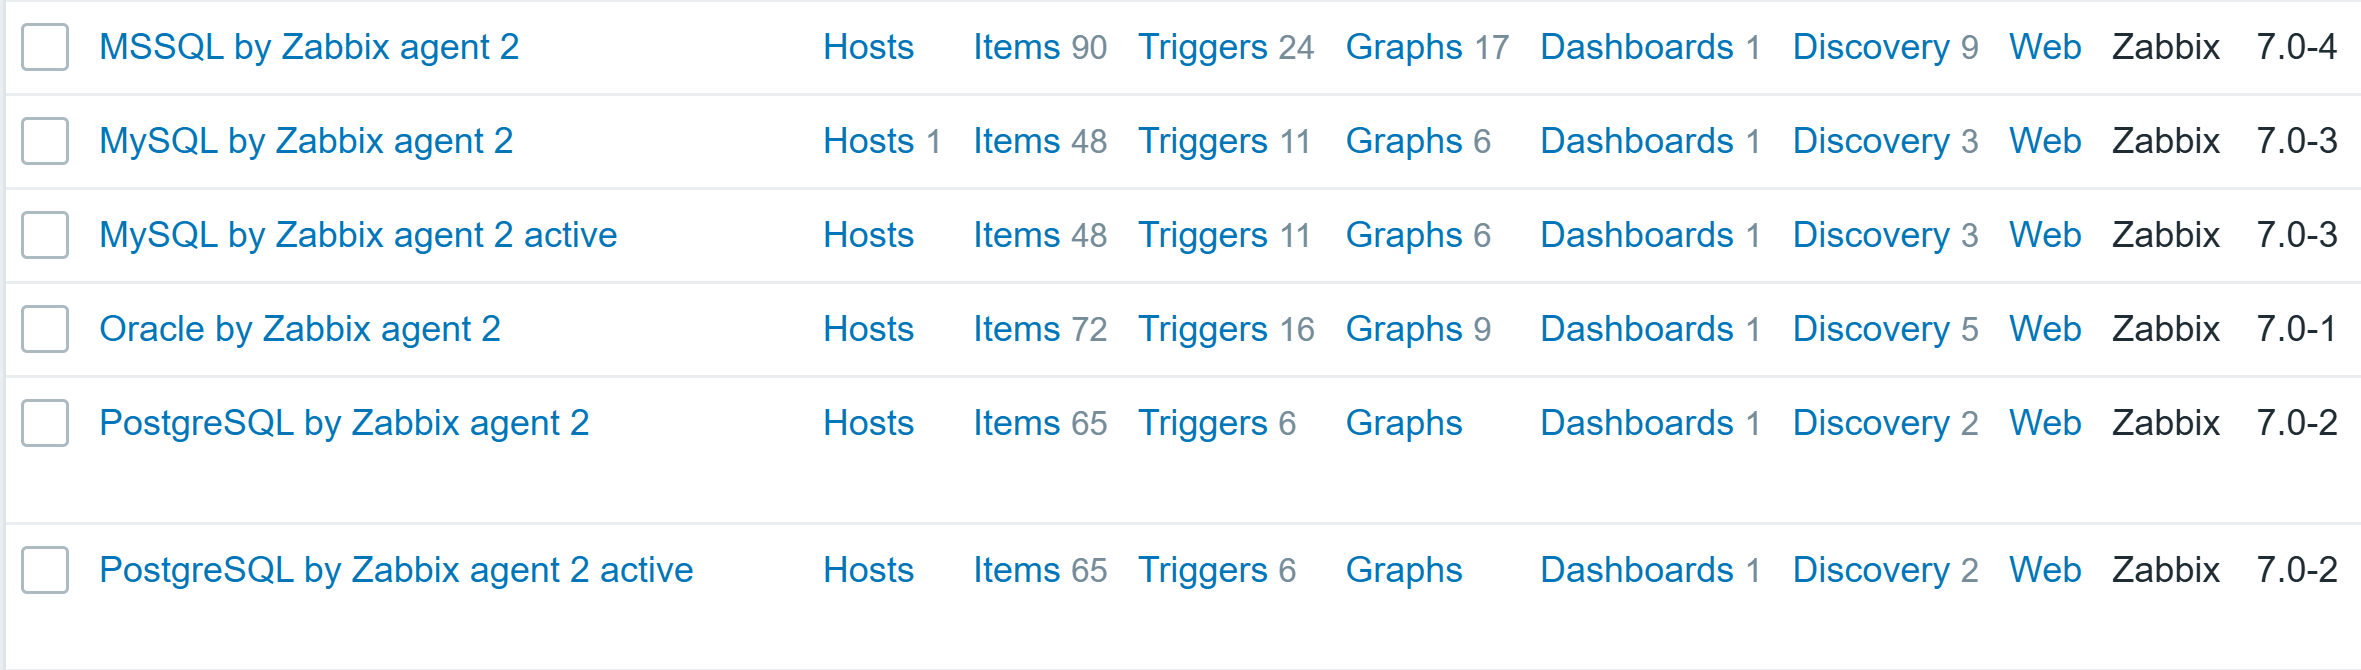
Out-of-the-box templates are available for multiple databases that can be monitored by Zabbix agent 2:

SQL database template list

Each of the templates uses a database native way to get precise performance data, such as SHOW GLOBAL STATUS for MySQL or dbStats for MongoDB. Also, template provides instructions on how to prepare the database for monitoring. Let’s take MySQL/MariaDB for example:

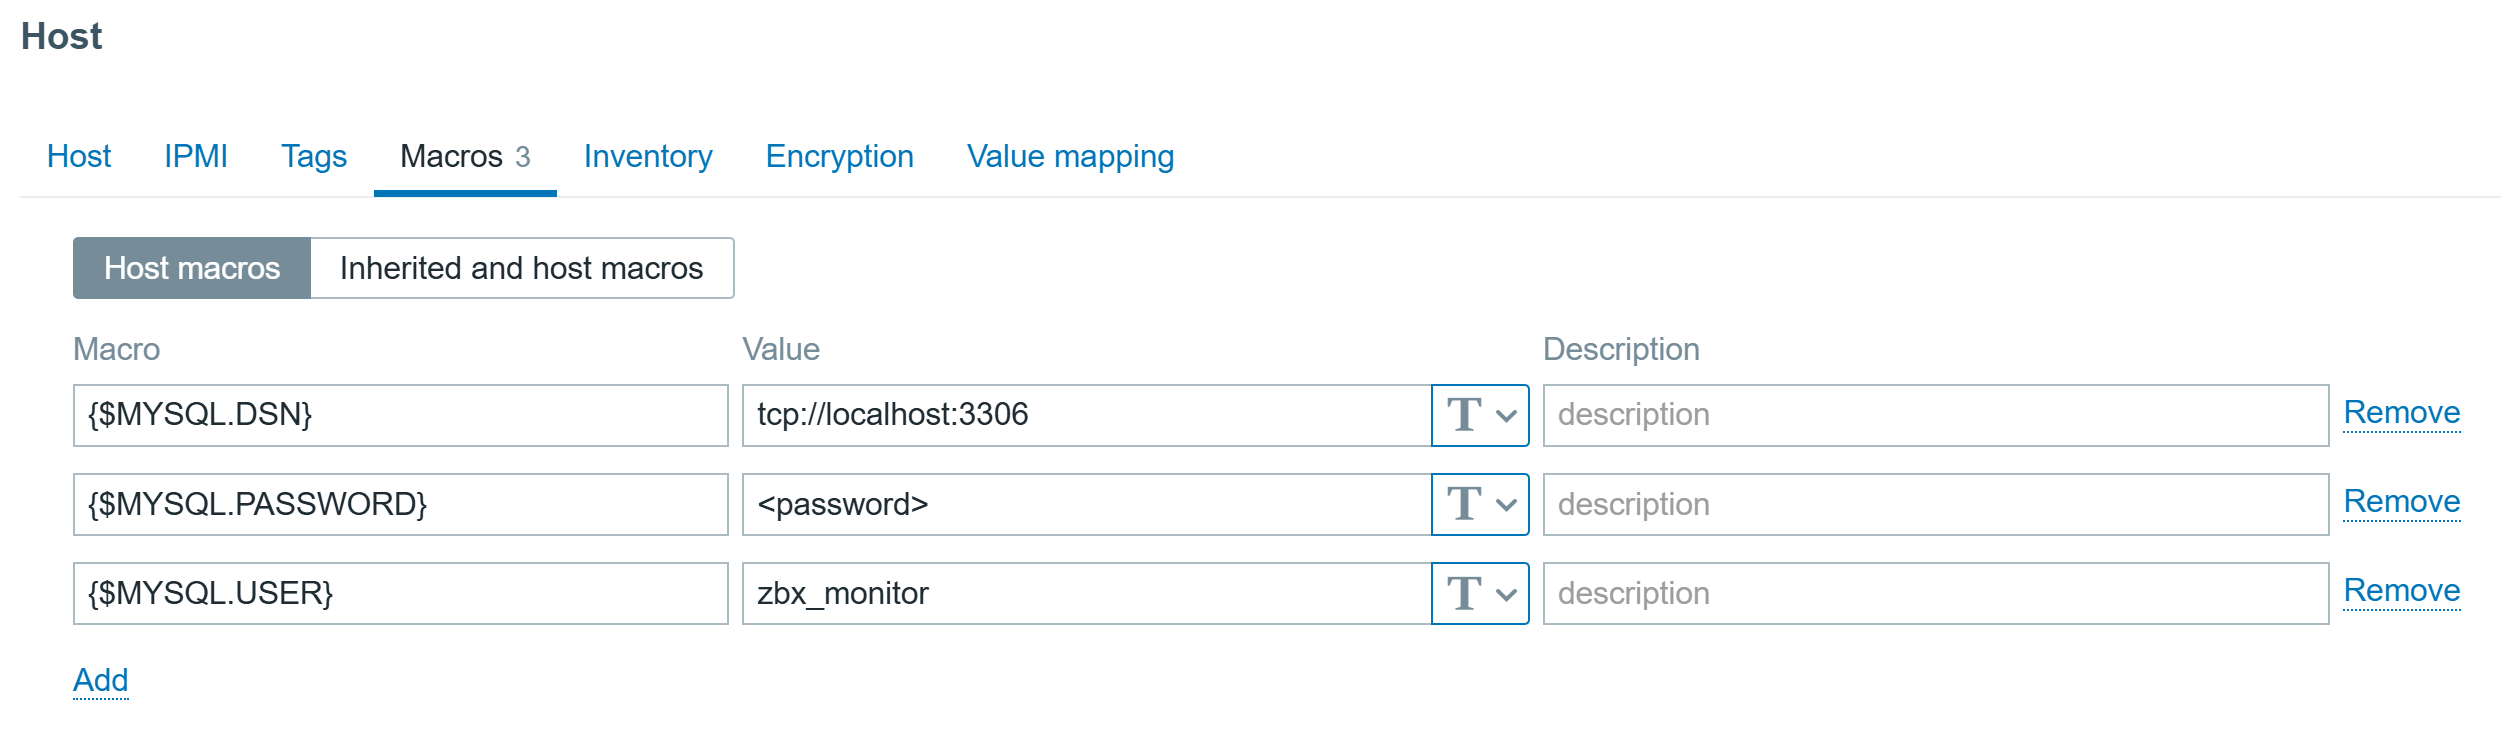
Create a MySQL user for monitoring (<password> at your discretion) and give this user enough permissions for monitoring:

mysql> CREATE USER 'zbx_monitor'@'%' IDENTIFIED BY '<password>';
mysql> GRANT REPLICATION CLIENT,PROCESS,SHOW DATABASES,SHOW VIEW ON *.* TO 'zbx_monitor'@'%';

In order to collect replication metrics, MariaDB Enterprise Server 10.5.8-5 and above and MariaDB Community Server 10.5.9 and above require the SLAVE MONITOR privilege to be set for the monitoring user. The command then looks like this:

mysql> GRANT REPLICATION CLIENT,PROCESS,SHOW DATABASES,SHOW VIEW,SLAVE MONITOR ON *.* TO 'zbx_monitor'@'%';

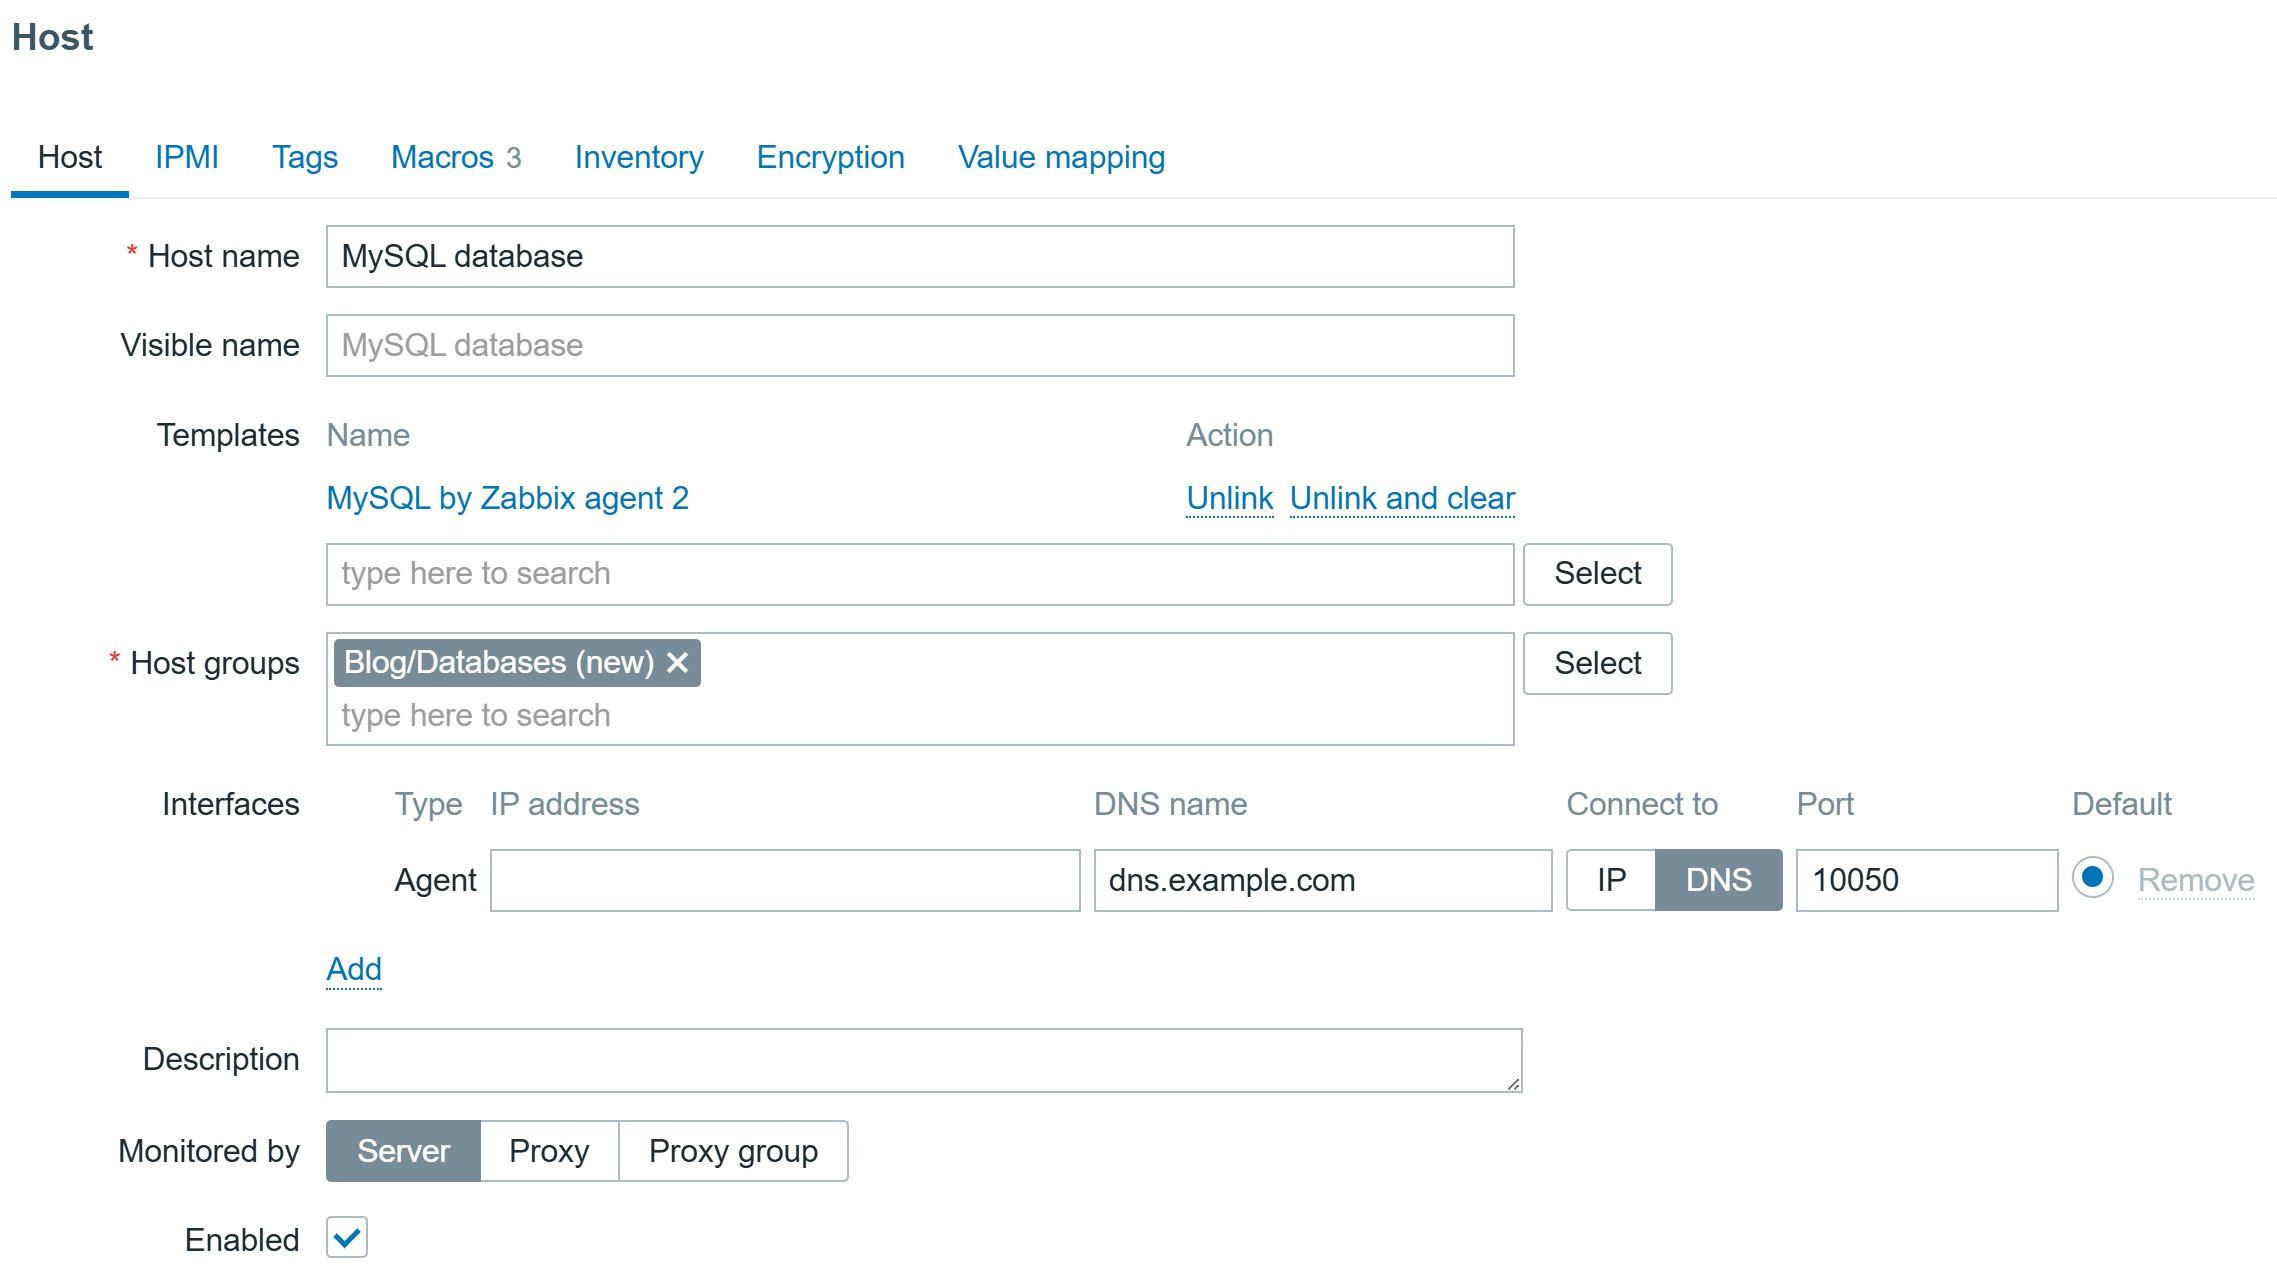
Then create a host to represent your MySQL/MariaDB and link the “MySQL by Zabbix agent 2” template:

MySQL database host
MySQL database host

Configure the Macros on the same host:

MySQL database host macros

And the data will start pouring in!

You can find instruction for other databases here.

SQL database internal data monitoring

A default template will tell us a lot about performance, but what if we also need application data? Something that is stored in the database, i.e.

  • Number of orders
  • Logged in users
  • Host count
  • List of failed transactions
  • Amount of media uploaded

Zabbix agent 2 lets users collect custom SQL query results with the help of configuration files and a specific item key:

<dbtype>.custom.query[connString,<user>,<password>,queryName,<args...>]:
• Dbtype – mysql, postgresql, oracle, mssql
• connString - URI or session name;
• user, password - Database login credentials;
• queryName - name of a custom query, matches SQL file name without .sql extension;
• args - one or several comma-separated arguments to pass to a query.

The main idea of this key is to construct efficient queries that can return multiple values. The values returned will be automatically transformed to JSON, which is both easier to preprocess and use for LLD creation.

I will add a simple query to find all hosts and their main interface availability in Zabbix:

SELECT hosts.host,interface.available FROM zabbix.hosts JOIN zabbix.interface ON hosts.hostid=interface.hostid WHERE hosts.status IN (0,1) AND hosts.flags IN (0,4) AND interface.main=1;

First I need to create a directory for custom queries:

# mkdir /etc/zabbix/zabbix_agent2.d/plugins.d/custom_queries

Now I will create an .sql file with a query and paste the mentioned query into the file:

# nano /etc/zabbix/zabbix_agent2.d/plugins.d/custom_queries/interfaces.sql    

Now I will edit the MySQL plugin .conf file and set a custom queries path:

# nano /etc/zabbix/zabbix_agent2.d/plugins.d/mysql.conf
### Option: Plugins.Mysql.CustomQueriesPath
#       Full pathname of a directory containing *.sql* files with custom queries.
#
# Mandatory: no
# Default:
# Plugins.Mysql.CustomQueriesPath=
Plugins.Mysql.CustomQueriesPath=/etc/zabbix/zabbix_agent2.d/plugins.d/custom_queries/

Save the changes and restart Zabbix agent 2 to apply them:

# systemctl restart zabbix-agent2

Before adding the item using the web interface, it is always a good idea to test it:

zabbix_agent2 -t mysql.custom.query["tcp://localhost:3306","zbx_monitor","<password>","interfaces"]

The output will is now a easy to work with JSON pattern (beautified here):

[
  {
    "available": "1",
    "host": "Zabbix server"
  },
  {
    "available": "1",
    "host": "Test environment"
  },
  {
    "available": "1",
    "host": "MySQL database"
  },
  {
    "available": "1",
    "host": "MongoDB database"
  },
  {
    "available": "1",
    "host": "PostgreSQL database"
  },
  {
    "available": "1",
    "host": "Customer portal"
  }
]

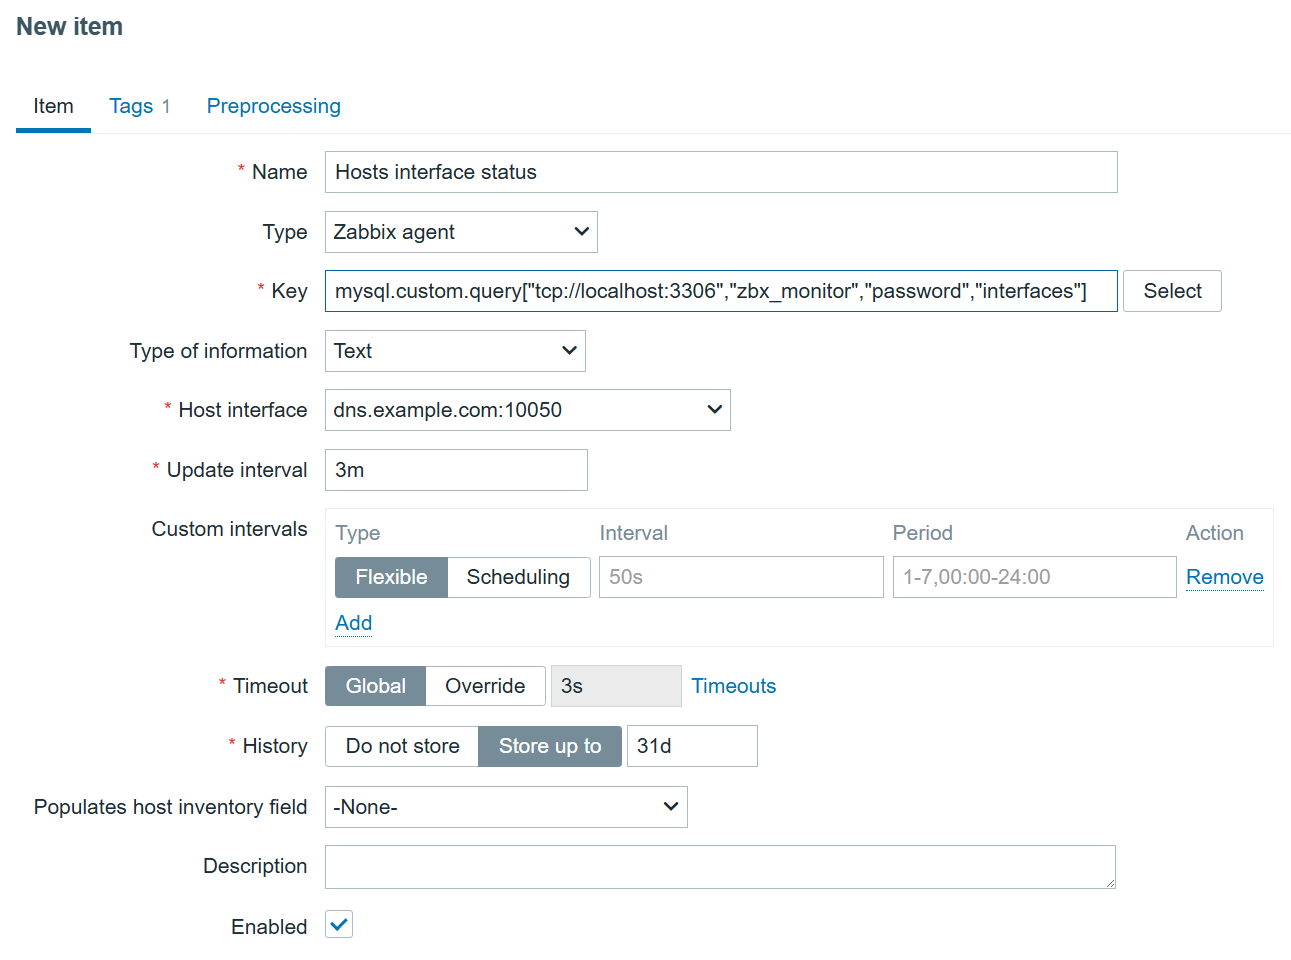
Now, I’m sure the data is collected and can be used for LLD. I can create a new item on the MySQL database host to collect this data:

Interface monitoring item

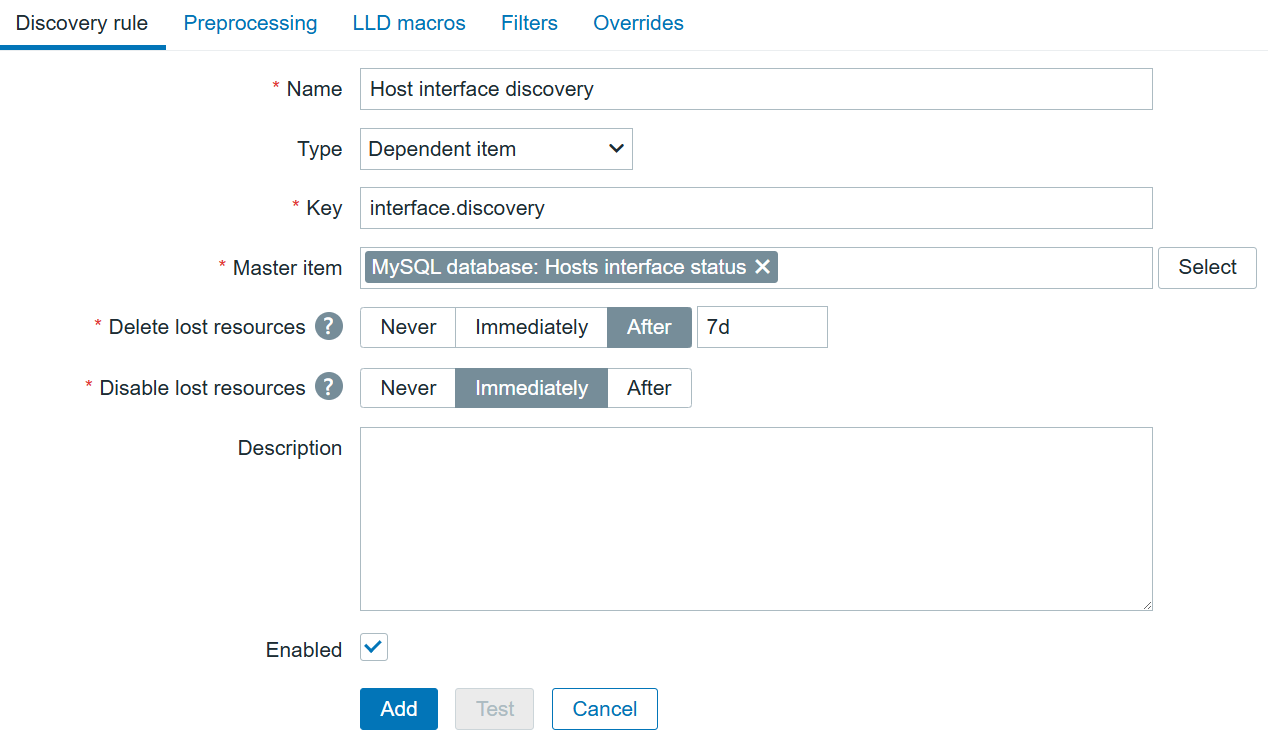
Since I know what kind of data will be returned, I can create a dependent Discovery rule on the same host:

Interface LLD item
Interface LLD item

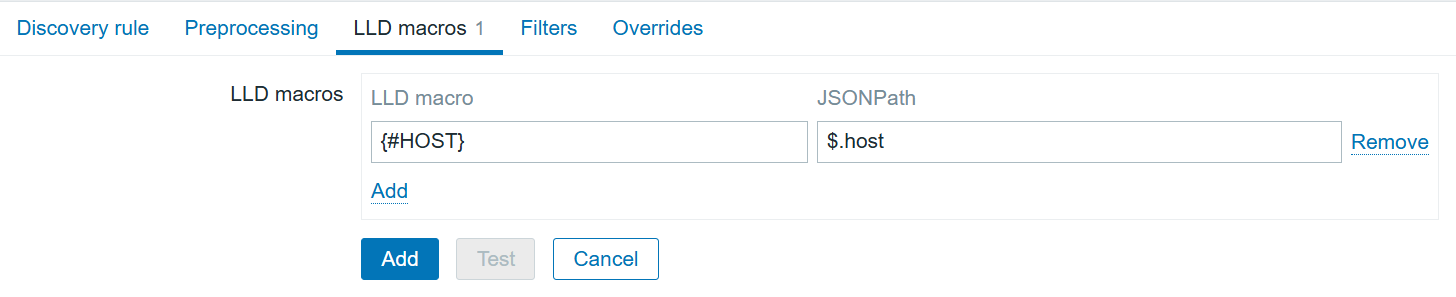
The LLD macros tab will help to transform the current JSON to the LLD-suitable JSON, replacing “host” with {#HOST}.

Interface LLD item mecros
Interface LLD item macros

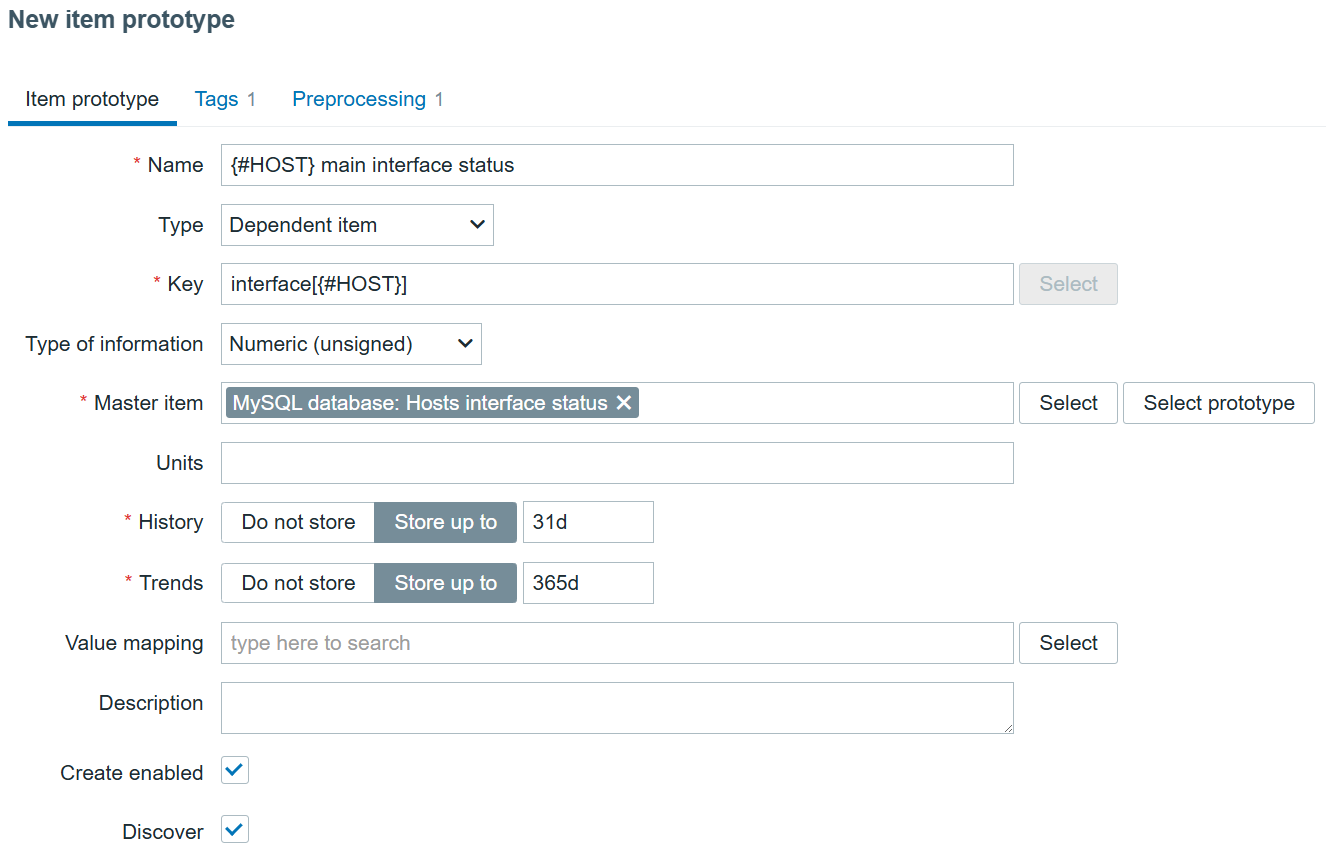
After adding the discovery itself, we can create the dependent item prototype, which will allow us to discover all hosts and their status:

Interface status item prototype

Preprocessing here is a must, and it needs to be flexible enough to extract each individual host interface status:

Interface status item prototype preprocessing

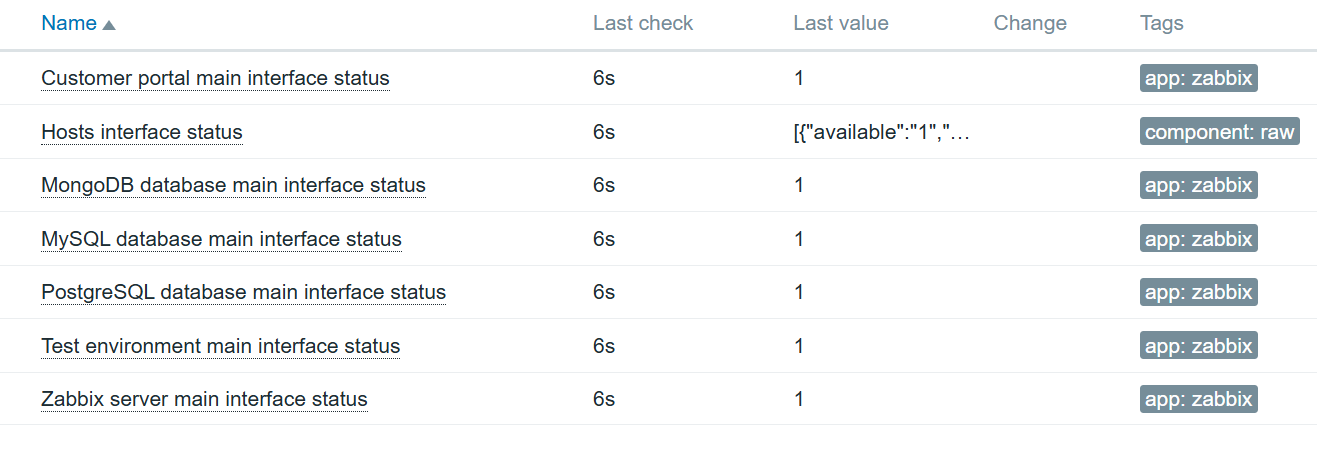
Now after adding the item prototype, we can check the results:

Interface status item data

An item cam be further enhanced using value mapping, to specify that 1 means available and 0 means not available.

With this approach, any internal database data can be extracted and monitored. In part 2 we will see how NoSQL databases can be monitored for both performance and internal data using Zabbix agent 2.

If you’d like more information on database monitoring, please don’t hesitate to sign up for our training course in Advanced Zabbix Database Monitoring, which covers multiple approaches to collecting database-related performance metrics and data using Zabbix Agent 2, ODBC, and API requests, as well as optimizing data collection by introducing dependent low-level discovery for minimal performance impact.

The post Database Monitoring using Zabbix agent 2 – Part 1, SQL appeared first on Zabbix Blog.

За измислените и истинските истории

Post Syndicated from Григор original http://www.gatchev.info/blog/?p=2665

Днес прочетох във Фейсбук трогателна статия. Как възрастна дама, останала вдовица, започнала да помага безплатно с писането на домашни на всеки, който иска. Първо на деца, после и на възрастни, които се затрудняват да напишат CV за работа, или да сметнат сложно изчисление… И малко по малко към нея се присъединили десетки доброволци.

В същия акаунт има и много други такива статии. Вероятно написани от ИИ. Същият трогателен сюжет, само името на човека и уменията му се сменят… Тези истории са измислени.

Само че не съвсем. Ще намерите по света хиляди реални старици и старци, посветили края на живота си на помощта за околните. Някои ремонтират безплатно каквото могат, други преподават уроци, трети кърпят дрехи… Те, незнайни и безименни, са прототипите на героите от тази и другите подобни истории.

Ако се случи да надживея жена си и старостта да не ми е отнела силите докрай, смятам върша същото. С каквото от уменията и познанията ми е полезно и нужно тогава. Вдъхновен от тези измислени истории… За мен няма да има написани истории, нито дори получилите помощта ми ще ме запомнят задълго. Но ще си отида с гордостта, че съм бил истински човек.

И ако дойде такъв ден, сигурно ще си кажа – къде съм тръгнал? Всичко ме боли, едва ставам от стола, не мога да отида до магазина сам, умът ми е в мъгла, душата ми – в зъбите… Но след това ще си напомня – зарекъл съм се. Поел съм ангажимент публично, пред всеки който го е прочел после. Нямам право да се скрия и да си почивам като гнил пън. По-добре да изгоря малкото, което ми остава – но да стопля някои и да осветя пътя им.

И заричането, което четете в момента, ще ми даде сили – надявам се – да го направя.

A deep dive into data protection sessions at AWS re:Inforce 2025

Post Syndicated from Rahul Sahni original https://aws.amazon.com/blogs/security/a-deep-dive-into-data-protection-sessions-at-aws-reinforce-2025/

AWS re:Inforce 2025: June 16-18 in Philadelphia, PA

A full conference pass is $1,099. Register today with the code flashsale150 to receive a limited time $150 discount, while supplies last.

At Amazon Web Services (AWS), security is our top priority. We’re excited to announce the Data Protection track at AWS re:Inforce 2025, happening June 16–18, where we’ll explore how customers use AWS to push their innovation boundaries while protecting data in the age of quantum, AI, and digital sovereignty. This year’s sessions will spotlight innovative approaches to next-generation cryptography, trusted AI, privacy-enhancing technologies, and emerging best practices for safeguarding information across the entire data lifecycle.

The Data Protection track offers insights and practical guidance for organizations of all sizes, whether you’re new to AWS or an experienced security professional. We’ve carefully curated sessions that address today’s most pressing challenges, including regulatory compliance, cross-border data transfers, and protecting data in multi-cloud environments. From hands-on workshops about implementing encryption and data classification at scale to deep-dive technical sessions on the latest AWS data protection services, you’ll find content designed to help you build and maintain a robust data protection strategy.

In this post, we highlight key sessions that feature lecture-style presentations with real-world customer use cases, along with interactive small-group sessions led by AWS experts who will guide you through practical problems and solutions. Let’s explore what you can expect at this year’s conference.

Data access and management

DAP471-R1 | Workshop | Defend against ransomware with data defense, recovery, and response
Ransomware and malware can disrupt business applications. In this expert-level workshop, you will learn how to apply AWS Backup locking mechanisms, logically air-gapped vaults, and restore testing to help strengthen your cyber recovery posture. Experience hands-on configuration of air-gapped, immutable vaults and automated recovery point testing to meet your enterprise’s objectives. Explore how these features can be combined to build a comprehensive, recovery-focused data protection strategy to withstand evolving cyber threats. You must bring your laptop to participate.

Cryptography and post-quantum

DAP472 | Workshop | Examining hybrid post-quantum TLS key exchanges
This workshop provides a practical exploration of post-quantum cryptography, comparing its performance against classical algorithms and demonstrating real-world implementation using AWS services. You will learn how to establish quantum-safe tunnels using AWS Key Management Service (AWS KMS) and AWS SDK for Java v2, implementing hybrid post-quantum TLS for secure data transfer. The session covers critical aspects including CPU and bandwidth performance metrics of post-quantum key exchange algorithms, modifications to TLS handshake protocols, and integration with AWS Transfer Family. Hands-on demonstrations will illustrate how to protect sensitive communications against both current and future quantum computing threats through hybrid classical/quantum-resistant approaches. You must bring your laptop to participate.

DAP452 | Builders’ session | Cryptographic controls with AWS CloudHSM
Gain hands-on experience implementing strong cryptographic controls using AWS CloudHSM. Learn to deploy TLS offload with Nginx, integrate Windows code signing, and create custom key stores. Explore monitoring cryptographic key usage within FIPS 140-3 level 3 hardware security modules (HSMs), using the latest high-performance hsm2m.medium HSM types. This session shows how these advancements help you strengthen your security posture, meet stringent compliance requirements, simplify operational management, and scale your cryptographic operations to support growing workloads—all while maintaining the performance your applications demand. You must bring your laptop to participate.

Data migration and modernization

DAP302 | Breakout session | Fannie Mae’s practical path to modern PKI and certificate management
Explore Fannie Mae’s transformation of their public key infrastructure (PKI) from a legacy system to a cloud-native solution on AWS. This session details their phased migration strategy, addressing challenges such as decentralized trust store updates and securing buy-in from application teams. Learn how Fannie Mae overcame migration hurdles, including legacy dependencies and compliance requirements, to achieve 100 percent adoption while maintaining security and reducing certificate-related overhead. Gain insights into cost optimization, risk mitigation, and architectural best practices for enterprise-scale certificate management in the cloud. This presentation offers actionable strategies for organizations undertaking similar PKI modernization efforts. Finally, we share the latest in enterprise-scale certificate management in the cloud.

DAP322 | Lightning talk | How Monzo Bank protects critical workloads using AWS Nitro Enclaves
Monzo Bank deploys security-critical applications requiring a high level of assurance around code integrity, system hardening, and limited attack surface. They achieved this using reproducible builds and the cryptographic attestation and isolated compute environment provided by AWS Nitro Enclaves. In this talk, we describe the challenges they overcame in building and deploying production workloads using this approach and share what they learned along the way.

Data protection for AI

DAP201 | Breakout session | Veradigm’s security-first approach to amplifying potential with GenAI
How can organizations empower teams with generative AI capabilities while maintaining rigorous data security standards responsibly? Veradigm initially hesitated to adopt generative AI because of data privacy, security, and regulatory compliance concerns. Join Veradigm’s principal developer for internal AI solutions to discover how they implemented practical security measures to build and deploy a compliant generative AI assistant using Amazon Bedrock that enhanced their team capabilities while strengthening their security posture. Learn about essential security controls, architectural decisions, and valuable lessons learned from successfully implementing AI for employees operating in a highly regulated environment.

DAP332 | Chalk talk | Executive perspective: Risk management for generative AI workloads
Don’t let the perceived complexity of responsible AI keep you from deploying generative AI applications on AWS. In this chalk talk, we present a framework for breaking down AI safety and security risks, introduce AWS best practices for keeping enterprise data secure in generative AI applications using zero trust principles, and mitigate safety risks using technologies such as Amazon Bedrock Guardrails. Discover as a group with fellow security leaders how to identify safety and security risks relevant to your workload, implement appropriate mitigation strategies, and measure efficacy over time.

DAP371 | Workshop | Defend your AI: Mitigate prompt injection with Amazon Bedrock
Master the art of identifying and mitigating prompt injection vulnerabilities in generative AI systems through this hands-on workshop. Using Amazon Bedrock, you will explore both offensive and defensive prompt engineering techniques to understand the security implications of large language models in production environments. In this session, you learn how prompt injection attacks work, complete an interactive capture the flag style challenge attempting to exploit a simulated AI environment, and learn how to implement defensive controls using Amazon Bedrock Guardrails. You must bring your laptop to participate.

Data protection and compliance at scale

DAP331-R | Chalk talk | Architecting a secrets management strategy that scales
Dive deep into architectural patterns for enterprise secrets management in cloud-native environments. In this session, we dissect the implementation complexities of centralized versus decentralized secrets management and discuss the trade-offs between these patterns, including their impact on developer velocity, security, and operational overhead. You will learn how to use AWS services to implement a flexible secrets management strategy and manage secrets lifecycle that balances the needs of developers and security teams. We also cover best practices for centralized compliance and auditing regardless of your chosen architecture.

DAP202 | Breakout session | Navigating sovereignty requirements: Architectures and solutions on AWS
Evolving data protection regulations and digital sovereignty requirements mean that organizations are facing increasingly complex compliance requirements when using cloud capabilities. This breakout session explores practical architectural approaches for meeting sovereignty requirements on AWS, with a focus on European and global regulatory frameworks. We examine key architectural patterns that enable data residency control, operational transparency, and sovereign workload isolation. The session covers the AWS Sovereignty Pledge, including sovereign design best practices, as well as the upcoming AWS European Sovereign Cloud.

Advanced seat reservation

If you’re a registered attendee, you can secure your spot in sessions through reserved seating. To reserve your seat, sign in to the attendee portal, go to Event, and then select Sessions. Act quickly to make sure you get a place in your preferred sessions.

Conclusion

Whether you’re a security architect seeking to modernize your defenses or a security executive aiming to elevate your organization’s security posture to drive faster business growth, re:Inforce is your essential destination. With a roster of carefully vetted and certified AWS speakers, you can be confident that every moment at the conference will provide valuable insights and actionable strategies. Join us at re:Inforce to empower your team, protect your assets, and propel your business forward in the digital age.

If you have feedback about this post, submit comments in the Comments section below.

Rahul Sahni

Rahul Sahni

Rahul is a Senior Product Marketing Manager at AWS Security. An avid Amazonian, Rahul embodies the company’s principle of Learn and Be Curious in both his professional and personal life. With a passion for continuous learning, he thrives on new experiences and adventures. Outside of his professional work, he enjoys experimenting with new dishes from around the world.

[$] Hardening fixes lead to hard questions

Post Syndicated from corbet original https://lwn.net/Articles/1023502/

Kees Cook’s “hardening
fixes” pull request
for the 6.16 merge window looked like a
straightforward exercise; it only contained four commits. So just about
everybody was surprised when it resulted in Cook being temporarily blocked
from his kernel.org account among fears of malicious activity. When the
dust settled, though, the red alert was canceled. It turns out,
surprisingly, that Git is a tool with which one can inflict substantial
self-harm in a moment of inattention.

Analyze media content using AWS AI services

Post Syndicated from Jack Bradham original https://aws.amazon.com/blogs/architecture/analyze-media-content-using-aws-ai-services/

Organizations managing large audio and video archives face significant challenges in extracting value from their media content. Consider a radio network with thousands of broadcast hours across multiple stations and the challenges they face to efficiently verify ad placements, identify interview segments, and analyze programming patterns.

In this post, we demonstrate how you can automatically transform unstructured media files into searchable, analyzable content. By combining Amazon Transcribe, Amazon Bedrock, Amazon QuickSight, and Amazon Q, organizations can achieve the following:

  • Process and transcribe media files upon upload
  • Identify commercials, interviews, and program segments
  • Extract insights using foundation models (FMs)
  • Create a searchable knowledge base
  • Generate rich visualizations for decision-making
  • Enable natural language queries across their media archive
  • Visualize complex information with intuitive graphics

In the following sections, we explore how these AWS services work together to help organizations unlock the full potential of their media content, whether for advertising compliance, content analysis, or discovering specific segments within thousands of hours of recordings.

Solution overview

This solution provides an event-driven media analysis pipeline that transforms how you manage and extract value from your content:

  • Streamline content management – Automatically process media files the moment they’re uploaded, saving time and reducing manual work
  • Unlock deeper insights – Generate accurate transcriptions that capture not just words, but the full context of your content—including speakers, timing, and key moments
  • Harness AI – Automatically extract meaningful insights and uncover hidden patterns in your media without extensive manual review
  • Build a searchable knowledge base – Turn scattered media files into a discoverable catalog that your entire team can use
  • Build a customizable interface – Create a customizable UI to search the catalog
  • Create powerful visualizations – Bring your insights to life with intuitive visualizations that make complex information immediately understandable

The following diagram illustrates our architecture.

Media Analysis Architecture

This event-driven architecture automatically processes and analyzes multimedia content using AWS services. The workflow consists of the following steps:

  1. A user uploads media files to an Amazon Simple Storage Service (Amazon S3) bucket. A “New Media” event triggers the first AWS Step Functions workflow. This workflow handles the initial cataloging based on values in the file name and launches the transcription process.
  2. Amazon Transcribe converts the audio into accurate, readable text. The transcribed content is securely saved to an S3 bucket for further analysis. A “Transcription Complete” event triggers the next step.
  3. A second Step Functions workflow processes the transcription. Using predefined prompts, Amazon Bedrock analyzes the transcripts to extract meaningful information. Key insights extracted from the transcript are stored in an S3 data lake.
  4. The processed results are organized systematically, structured by date (year/month/day) and tagged with relevant attributes. This organized data enables natural language queries through Amazon Q when used as a knowledge base, interactive visualizations using QuickSight, and straightforward content discovery and analysis.
  5. Amazon Athena serves as the data exploration tool to query the data lake. Athena is used as the data source in QuickSight, which turns complex data into clear, compelling visuals.

This architecture automatically transforms raw media content into searchable, analyzable data while maintaining an organized hierarchy for efficient access and analysis. The event-driven design provides automatic processing of new content as it arrives, and the combination of AWS AI services enables deep content understanding and insight extraction. Each AWS service plays a crucial role in transforming your media content:

  • Amazon Bedrock – Reviews content after transcription for insights and entity extraction:
    • Uses advanced FMs to analyze transcripts
    • Identifies commercials, interviews, and program segments
    • Extracts meaningful insights from content
  • Amazon EventBridge – Triggers actions in the cataloging workflow:
    • Monitors for new media files and completed transcriptions
    • Automatically triggers Step Functions workflows
  • AWS Lambda – Handles custom code actions needed in the workflow:
    • Facilitates interaction with Amazon Bedrock
    • Executes custom prompts on transcripts
    • Enables flexible, scalable processing
  • Amazon Q – Serves as the frontend and Retrieval Augmented Generation (RAG) engine:
    • Addresses enterprise generative AI needs by providing a turnkey solution with built-in security features like single sign-on (SSO) integration and responsible AI governance policies
    • Allows businesses to quickly deploy AI assistance while maintaining compliance, data privacy, and security standards
    • Enables natural language queries across the media archive
    • Links results to the source media files
    • Provides conversational access to content
  • Amazon QuickSight – Turns insights in beautiful visualization for better consumption:
    • Creates interactive dashboards and visualizations
    • Displays comprehensive media analytics
    • Helps track advertising, programming, and content patterns
  • Amazon S3 – Stores assets and the catalog:
    • Securely stores raw media files, transcripts, and processed data
    • Automatically triggers processing when new content is uploaded
  • AWS Step Functions – Orchestrates the entire content processing workflow:
    • Manages transcription and AI analysis steps
    • Provides robust error handling and automatic retries
  • Amazon Transcribe – Converts speech to accurate, readable text:
    • Identifies speakers and timestamps
    • Provides accurate transcriptions of audio content

Security considerations

Although this post focuses on the technical implementation of media content analysis, it’s important to acknowledge that production deployments should include comprehensive security measures:

  • Data storage security (Amazon S3):
    • Enable server-side encryption using AWS Key Management Service (AWS KMS) keys
    • Apply bucket policies restricting access to authorized principals only
    • Enable Amazon S3 Block Public Access at account and bucket levels
    • Enable versioning for data recovery
    • Implement lifecycle policies for data retention
    • Enable S3 access logging
    • Use presigned URLs for temporary access
  • Identity and Access Management (IAM):
    • Create dedicated service roles with minimum required permissions for:
      • Step Functions execution
      • Amazon Transcribe jobs
      • Amazon Bedrock API calls
      • Athena queries
    • Implement role-based access control
    • Regularly rotate credentials
    • Enable multi-factor authentication (MFA) for all users
    • Use AWS Organizations for multi-account management
  • Network security:
    • Deploy virtual private cloud (VPC) endpoints for:
      • Amazon S3
      • Athena
      • QuickSight
    • Implement network access control lists (ACLs) and security groups
    • Enable VPC Flow Logs
    • Use AWS PrivateLink where applicable
    • Configure route tables to control traffic flow
  • Data encryption:
    • Implement AWS KMS encryption for S3 objects
    • Use TLS 1.2+ for all API communications
    • Enable automatic key rotation in AWS KMS
    • Implement envelope encryption for sensitive data
  • Monitoring and detection:
    • Enable AWS CloudTrail for API activity logging
    • Configure Amazon GuardDuty for threat detection
    • Set up Amazon CloudWatch:
      • Metrics for service health
      • Alarms for security events
      • Log groups for application logs
    • Enable S3 server access logging
    • Configure VPC Flow Logs
  • Access controls:
    • Implement fine-grained access controls for:
      • Amazon Bedrock model access
      • Athena query permissions
      • QuickSight dashboard sharing
    • Conduct regular access reviews

Additionally, compliance requirements and data governance policies might impact how you implement this solution in your environment.

These security considerations are crucial but beyond the scope of this post. We recommend consulting AWS security best practices and working with your security team to implement appropriate measures for your specific use case. For more information on AWS security best practices, refer to Best Practices for Security, Identity, & Compliance.

The following sections walk you through setting up each component of the architecture to help you transform raw media into actionable insights.

Prerequisites

The following are the prerequisites to follow along this post:

Create S3 buckets

For this solution, we create three distinct buckets to support the media analytics workflow:

  • Raw media bucket for incoming files
  • Transcription outputs bucket
  • Processed insights bucket

For instructions on creating buckets, refer to Creating a general purpose bucket.

Configure EventBridge

You can enable event notifications on the raw media bucket to trigger your automated workflow through EventBridge. Establish your automation backbone by monitoring S3 bucket activities. When new media arrives or transcription completes, EventBridge will trigger the appropriate workflow, providing continuous processing. For further instructions, refer to Creating rules that react to events in Amazon EventBridge.

The following are two example triggers that can be used to filter events and trigger Step Functions workflows. The following is an example filter for new media files:

{
  "source": ["aws.s3"],
  "detail-type": ["Object Created"],
  "detail": {
    "bucket": {
      "name": ["rawinputbucket"]
    }
  }
}

The following is an example filter for new transcripts added to the data lake:

{
  "source": ["aws.s3"],
  "detail-type": ["Object Created"],
  "detail": {
    "bucket": {
      "name": ["business-data-lake"]
    },
    "object": {
      "key": [{
        "suffix": ".transcription"
      }]
    }
  }
}

Create Step Functions workflows

We design the orchestration layer with two key workflows. The first handles media intake and transcription, and the second manages AI analysis. Each workflow includes safeguards for potential failures and retry mechanisms. For further instructions, refer to Learn how to get started with Step Functions.

The following diagram shows an example of processing new media uploads for indexing and transcription.

Media Analysis - Step Function Example

The following diagram shows an example of the Step Functions workflow that analyzes the transcription.

Set up Amazon Transcribe

To create an Amazon Transcribe job, you need permissions to do so. You can implement a speech-to-text conversion with powerful features like language detection, speaker identification, and custom vocabulary support to provide accurate transcription of your media content. For further instructions, refer to How Amazon Transcribe works.

Configure Amazon Bedrock

You can power your AI analysis engine by setting up precise prompts that extract meaningful insights. Amazon Bedrock processes transcripts to identify key segments, speakers, and topics, transforming raw text into structured data. For instructions, refer to Design a prompt.

The following is a sample prompt:

You will be reviewing a radio transcription to identify advertisements and extract relevant details. Your task is to analyze the provided transcript and output the results in a specific JSON format based on a given schema.
Please follow these steps to complete the task:
1. Carefully read through the entire transcript.
2. Identify all advertisements within the transcript. Look for clear indicators such as product mentions, promotional language, or transitions from regular content to commercial content.
3. For each advertisement you identify, determine the following information:
    - Company: The name of the company being advertised
    - Start time: The timestamp in the transcript where the ad begins
    - End time: The timestamp in the transcript where the ad ends
    - Product: The specific product or service being advertised
4. Format your findings into a JSON object that follows the provided schema. Each advertisement should be a separate object within an array.
5. Ensure these fields in your response are provided for each advertisement.. All are required fields: company, starttime, endtime, product. 
6. Use precise timestamps for start and end times. If exact times are not available, make a best estimate based on the transcript's context.
7. If a particular field is unclear or not explicitly mentioned in the transcript, you may use "Unknown" as the value.
8. Only respond with json and nothing else. Do not provide comments or explain your answer. 
9. Surround the JSON response with standard ```json markers
Here's an example of how your output should be formatted:
{
"advertisements": [
        {
            "company": "TechGadgets Inc.",
            "starttime": "00:05:30",
            "endtime": "00:06:15",
            "product": "SmartHome Hub"
        },
        {
            "company": "FreshFoods Market",
            "starttime": "00:15:45",
            "endtime": "00:16:30",
            "product": "Organic Produce Delivery Service"
        }
    ]
}
Do not add any fields that are not specified in the schema, and ensure all required fields are present for each advertisement.

Create a structured data lake

We create a hierarchical data organization strategy that enables efficient access and analysis. You can use AWS Glue crawlers to automatically discover and catalog your media metadata. For instructions, refer to Using crawlers to populate the Data Catalog. Configure Athena tables to enable SQL-based querying of your media insights:

CREATE OR REPLACE VIEW "commercials_view" AS 
SELECT
  metadata.market market
, metadata.station_call station_call
, metadata.format_type format_type
, CAST(metadata.timestamp AS timestamp) timestamp
, ads.company adCompany
, ads.product adProduct
, ads.starttime
, ads.endtime
FROM
  (commercials
CROSS JOIN UNNEST(advertisements) t (ads))

Set Up Amazon Q

You can enable natural language interaction with your media archive using Amazon Q Business. Configure the knowledge base and metadata to make your content searchable and accessible through conversational queries. Use the processed insights S3 buckets to configure the knowledge base. For instructions, refer to Getting started with Amazon Q Business.

The following screenshot shows example conversations with an AI assistant.

Build QuickSight dashboards

With QuickSight, you can create visual analytics that bring your data to life. Connect to Athena views to display advertising patterns, content analysis, and performance metrics in interactive dashboards. For more information, refer to Tutorial: Create an Amazon QuickSight dashboard.

The following screenshots are a few examples of dashboards created for a fictitious radio station as part of our use case.

Validate and optimize your media analytics solution

After you implement your media analytics architecture, follow these critical steps to achieve robust performance and alignment with your organization’s needs. First, configure a comprehensive testing approach. Imagine you’re preparing to launch your media analysis solution. Your testing journey begins with accuracy validation:

  • Compare transcription outputs against original media
  • Verify AI-generated insights for precision
  • Use representative sample sets from your content library

You start by taking a recently processed radio show and comparing its transcription against the original broadcast. Your team meticulously reviews the AI-generated insights, checking if key moments like ad transitions or interview segments are correctly identified. To make sure your system works across all content types, you select diverse samples from your library—perhaps a morning talk show, an evening news segment, and a weekend sports broadcast. Next, you delve into performance benchmarking:

  • Measure processing time for different media types
  • Evaluate resource utilization across AWS services
  • Identify potential bottlenecks in the workflow

Time how long it takes to process different types of media files, from short commercial segments to lengthy program recordings. As you watch how your AWS services respond under various loads, you can monitor resource consumption patterns. This helps you identify processing bottlenecks—for instance, you might discover that certain file types take longer to transcribe or that concurrent processing needs optimization. Finally, you put yourself in your users’ shoes for a thorough user experience assessment:

  • Test natural language queries with Amazon Q
  • Validate search result relevance
  • Gather feedback from potential end-users

Team members can interact with Amazon Q, asking questions they would naturally pose when searching for specific content. For example, you can test whether searching for “interviews about climate change last week” returns relevant results. Gathering feedback from potential users—perhaps a content manager with different needs than a compliance officer—provides invaluable insights. Their real-world experiences guide your refinements and make sure the system serves its intended purpose. This comprehensive testing approach, combining structured evaluation with real-world scenarios, sets the stage for a robust and user-friendly media analysis solution. As your media analysis solution moves from initial deployment to production, optimizing its performance becomes crucial for both cost-efficiency and user satisfaction. A radio network processing thousands of hours of content weekly might find that even small improvements in transcription accuracy or processing speed can lead to significant cost savings and better content discoverability. Similarly, a marketing team analyzing ad placements across multiple stations needs precise insights to make data-driven decisions about advertising effectiveness. With these business imperatives in mind, consider the following configuration optimization strategies:

  • Transcription refinement:
    • Adjust language models for domain-specific terminology
    • Fine-tune speaker identification settings
    • Implement custom vocabularies for improved accuracy
  • AI insight generation:
    • Refine prompts for more targeted analysis
    • Experiment with different AI models
    • Align extraction parameters with business objectives
  • Scalability considerations:
    • Test workflow performance with increasing media volumes
    • Implement appropriate auto scaling configurations
    • Monitor cost-effectiveness of your architecture
  • Continuous improvement:
    • Establish regular review cycles
    • Track key performance metrics
    • Iterate on your solution based on real-world usage

We recommend starting with a pilot implementation and gradually expanding your media analytics capabilities.

Clean up

To avoid incurring ongoing charges, clean up the resources you created as part of this solution:

  1. Delete QuickSight resources:
    1. Delete dashboards created for media analytics.
    2. Delete the datasets connected to Athena.
    3. If no longer needed, delete the QuickSight Enterprise subscription.
  2. Delete S3 buckets:
    1. Empty and delete the raw media bucket, transcription outputs bucket, and processed insights bucket.
  3. Remove EventBridge rules:
    1. Delete the rules created for monitoring S3 bucket activities.
    2. Remove targets associated with these rules.
  4. Delete Step Functions workflows:
    1. Delete the media intake and transcription workflow.
    2. Delete the AI analysis workflow.
  5. Remove Lambda functions:
    1. Delete Lambda functions created for interaction with Amazon Bedrock.
    2. Remove associated IAM roles and policies.
  6. Clean up data lake components:
    1. Delete Athena views and tables.
    2. Remove AWS Glue crawlers and databases.
    3. Delete stored query results.
  7. Remove Amazon Q configurations:
    1. Delete knowledge bases created.
    2. Remove custom configurations.
  8. Remove Amazon Bedrock settings:
    1. Remove custom prompts.
    2. Disable access to FMs if no longer needed.
  9. Delete Amazon Transcribe settings:
    1. Remove custom vocabularies.
    2. Delete stored transcription jobs.
  10. Remove IAM resources:
    1. Delete custom IAM roles created for this solution.
    2. Remove associated IAM policies.
  11. Complete additional cleanup:
    1. Delete CloudWatch Logs groups associated with Lambda functions.
    2. Remove CloudWatch alarms or metrics created for monitoring.
    3. Delete saved queries in Athena.

Common use cases

Organizations in different sectors can use this architecture to unlock value from their audio and video content. You can adapt this solution to meet your specific needs, such as managing broadcast media, corporate communications, educational materials, and more. Let’s explore how different industries might apply this technology:

  • Media and broadcasting:
    • Track advertising compliance
    • Verify media placement accuracy
    • Analyze broadcast content at scale
  • Corporate and enterprise:
    • Convert meeting recordings into searchable knowledge bases
    • Identify key decisions and action items
    • Enhance organizational knowledge management
  • Education and training:
    • Create comprehensive, topic-based course catalogs
    • Index training materials for quick retrieval
    • Support continuous learning initiatives
  • Legal services:
    • Generate precise, timestamped transcripts
    • Develop searchable legal proceeding archives
    • Improve document review efficiency
  • Healthcare:
    • Extract critical medical insights from consultations
    • Categorize patient interaction data
    • Support clinical documentation processes
  • Government and public sector:
    • Build comprehensive public meeting archives
    • Implement automated topic categorization
    • Enhance transparency and accessibility
  • Customer service:
    • Analyze call recordings for quality improvement
    • Identify service trends and customer pain points
    • Drive continuous customer experience enhancement

This media analytics architecture demonstrates notable versatility. By using AI, organizations can transform raw audio and video content into structured, meaningful insights that drive decision-making across industries.

Conclusion

In this post, we demonstrated how to use AWS services to convert unstructured media content into actionable intelligence. By combining Amazon Transcribe, Amazon Bedrock, QuickSight, and Amazon Q, you can create a scalable, automated solution for media analysis that adapts to your organizational needs.

This solution offers the following key architectural advantages:

  • Automated media file processing at scale
  • AI-powered insight generation
  • Natural language search capabilities
  • Interactive decision-making visualizations
  • Flexible, maintainable infrastructure

Organizations can now convert content into searchable knowledge, extract insights automatically, develop data-driven content strategies, and enhance operational efficiency through automation.

As audio and video content generation continues to accelerate, the ability to efficiently process and extract value becomes increasingly critical. This architecture provides a robust foundation for current needs while remaining adaptable to future technological innovations.

We invite you to explore how this media analytics solution can address your organization’s unique challenges. Consider your specific use cases and unlock the insights waiting to be discovered in your media archives.


About the authors

[$] OpenH264 induces headaches for Fedora

Post Syndicated from jzb original https://lwn.net/Articles/1023088/

Software patents and workarounds for them are, once again,
causing headaches for open-source projects and users. This time
around, Fedora users have been vulnerable to a serious flaw in the OpenH264 library for
months—not for want of a fix, but because of the Rube
Goldberg machine
methodology of distributing the library to Fedora
users. The software is open source under a two-clause BSD license; the RPMs are built and
signed by Fedora, but the final product is distributed by Cisco, so
the company can pick up the tab for license fees. Unfortunately, a
breakdown in the process of handing RPMs to Cisco for distribution has
left Fedora users vulnerable, and inaction on Fedora’s part has left
users unaware that they are at risk.

Отново за неочевидното: „София Прайд Филм Фест 2025“

Post Syndicated from Нева Мичева original https://www.toest.bg/otnovo-za-neochevidnoto-sofia-pride-film-fest-2025/

Отново за неочевидното: „София Прайд Филм Фест 2025“

За пореден път „София Прайд Филм Фест“ ще доведе света в българската столица от 3 до 12 юни с малка, но широка в обхвата си подборка от филми от последната година. В селекцията си тандемът Симеон Цончев и Яна Алексиева са включили 11 пълнометражни и 13 късометражни творби – документални и игрални, мудни и трескави, увличащи и не съвсем, тъжни и весели, „наши“ и „чужди“ (съзнателно ги слагаме в кавички, защото хубавата смесица от култури, информация и ракурси, която предлага СПФФ, обезсмисля механичните деления на „тук“ и „там“, „мое“ и „твое“).

Всяко заглавие ще бъде прожектирано по веднъж в Дома на киното и – тъй като в програмата мъдро са заложени филми за взаимно изключващи се вкусове – за всеки вкус ще се намери по нещо. Както и миналата година, избрахме три от пълнометражните предложения, за да онагледим една идея по-детайлно размаха на 14-тото издание на фестивала, посветено на паметта на трагично напусналия ни Марко Марков.

Отново за неочевидното: „София Прайд Филм Фест 2025“
Първата американска астронавтка Сали Райд © U.S. Information Agency / Wikimedia

4 юни: „Сали“

Сали Райд е третата жена (и първата американка) в историята на човечеството, която полита в Космоса. Тя е от първия випуск на НАСА от десетина „различни“ по пол и цвят на кожата астронавти (дотогава това са – изненада! – само бели мъже). Първият ѝ полет е на 18 юни 1983 г., когато тя е на 32, следва и още един: общо петнайсетина дни в извънземното пространство… Сали е атлетична, волева личност с магистратура по английски и физика и докторска степен по астрофизика, силна тенисистка, отличен пилот на самолет, слави се със сдържания си, работлив характер. „Обожавам да съм в безтегловност“, казва тя.

Преди първия ѝ полет от НАСА ѝ подготвят несесерче за грим (какъвто тя очевидно никога не ползва), а към багажа ѝ добавят 100 тампона за една седмица в небето (женското устройство и до ден днешен продължава да е загадка за мнозина). На пресконференции ѝ задават въпроси за госпожици: Дали с тези екскурзии в небето няма да си съсипе шансовете да бъде майка? Дали очаква след края на полета да остане в историята като „бележка под линия“? Ако по време на работа стане засечка, какво прави, плаче ли? (В същия период Светлана Савицкая, втората астронавтка в света, пристига на станцията „Салют 7“ и за „добре дошла“ получава кухненска престилка от изцяло мъжкия екипаж.)

„Сали“ на Кристина Костантини е създаден за „Нешънъл Джиографик“ и пристига в София след премиерата на тазгодишния „Сънданс“. Плод е на гигантски труд по пресяването на хиляди часове документални материали преобладаващо от 60-те, 70-те и 80-те, с цел да се състави правдива картина за ситуацията, в която Сали съумява сама да стане ковач на щастието си. Филмът съдържа и заснети специално за него разговори с нейни колеги от НАСА, със симпатичната ѝ, дръпната майка, със сестра ѝ Беър и с Там. Там е любимата на Сали, с която тя живее 27 години, но за която светът научава едва от некролога на астронавтката през 2012-та.

Архивът за публичния живот на Сали Райд е огромен, а частният се състои от само 5–6 снимки, на които двете партньорки дори не се докосват, та в местата със спомени за връзката им Костантини се е видяла принудена да вкара мънички визуални възстановки с актьори – леко абстрактни, снимани на лента „кръпки“ в подобаващ колорит. Те, натрапчивата музика и склонността на режисьорката към буквална илюстративност (когато зад кадър се каже „телефон“, в кадър се появява човек със слушалка до ухото; при споменаването на „кола“ виждаме оживена магистрала; заедно с изговарянето на „рожден ден“ на екрана грейва торта със свещички) са сред постановъчните слабости. И все пак „Сали“ успешно събира важни факти и прочувствени моменти и дава ясна представа за един свят, свикнал на къде по-агресивно, къде по-нехайно снизхождение към жените. Светът от тази сутрин, не дори от вчера, камо ли пък от отдавна минали епохи.

Отново за неочевидното: „София Прайд Филм Фест 2025“
Кадър от филма „Физика на невидимото“ на Рафаела Камело

5 юни: „Физика на невидимото“

Филмът на бразилката Рафаела Камело идва от тазгодишното „Берлинале“ (от раздела Generation Kplus, отреден за автори, които „в своето повествование и киноезик вземат на сериозно младите хора“) и е пълнометражният ѝ дебют. В него две десетгодишни момиченца с нетипично трудна предистория, дъщери на сами жени, се срещат в една болница и се заиграват, както става с децата – без много обяснения и въпроси, без предразсъдъци, естествено. (Апропо преводът на заглавието прави – волно или неволно – несполучлива препратка към „Физика на тъгата“ и лоша услуга на филма. Natureza е „природа, естество“ и съвсем не е произволно, че режисьорката е предпочела да нарече творбата си „Естеството на невидимото“).

Майките – преработили, всяка на ръба на собственото си неизказано отчаяние – решават да заминат заедно на село за лятото: за да си помогнат, но и за да позволят на малките да подишат. Изпълнителите са органични; колоритът и образността – великолепни, благодарение на камерата на Франсиска Саес Агурто; локациите и реквизитът – изключително интересни за разглеждане.

Звучи тегаво, но всъщност никак не е. Целият филм е издържан в духа на шарен спомен от детството, в който куп неща от света на възрастните остават недоразбрани, но и куп други са разбрани с бистрота и категоричност, каквато възрастните не са в състояние да постигнат. Надвисналия срив и нещастие „Физика на невидимото“ предава с недраматично, необострено усещане – тук добронамереното общуване е възможно, а летният възторг на децата от всичко наоколо, способността им да възприемат делника като изключително преживяване се предава и на зрителите.

Филмът е преход между крайности без крайност. Болест, обреченост, изолация, бедност, смърт – у Камело всичко изглежда достойно, спокойно, почти радостно. В атмосферата си „Физика…“ напомня за слънчевата безметежност на „Проектът Флорида“ на Шон Бейкър (без често провиждащата се там мрачна подплата) и многогласата жизненост на „Тотем“ на мексиканката Лила Авилес (с тази разлика, че във „Физика…“ наместо голямо семейство, събрано от кръвни връзки, на преден план излиза едно неочаквано сестринство, сплотено от щедрост и взаимно разбиране).

Отново за неочевидното: „София Прайд Филм Фест 2025“
Лаутаро Бетони и Хавиер Оран в „Любовници в космоса“

8 юни: „Любовници в космоса“

Педро пристига от Испания, за да изкара лятото с братовчед си и негови приятели в крайградска вила в Аржентина. Всички са на по двайсет и малко – хубави, свежи лица на хора без спешни грижи и отговорности, заети изключително с това да откриват себе си. Педро на секундата влиза в шеговит разговор с друго момче, Макси, и приказката им тръгва – забавно им е да се хапят със сходно чувство за хумор, добронамерени са и интересни един за друг.

„Не приличаш на гей“, отбелязва Макси, който неотдавна се е разделил с приятелката си. „Ама че наблюдение – завърта очи Педро. – Ако бях казал, че съм космонавт, нямаше да започнеш с „Не приличаш на космонавт“.“ „Да, нямаше – отговаря Макси. – Защото приличаш на космонавт.“ И тръгва един пинг-понг от реплики между двамата – къде по-сполучливи, къде по-тромави, къде по-непринудени, къде по-нагласени, но все по-устремени към една развръзка, която режисьорът и сценарист Марко Бергер хитро отмества на една йота по-нататък във времето, почти до края на филма. Така „Любовници в космоса“ се превръща в място за игра, в неочакван дансинг за ритуалния танц на приятелството и любовта.

Видимо създаден с миниатюрен бюджет, „Любовници в космоса“ разчита най-вече на осезаемата химия между двамата си главни изпълнители, на устойчивата нишка на разговора между персонажите им и на вълнуващия контраст между ставащото помежду им и а) версията, която двамата решават да представят пред другите, плюс б) тълкуването, което всеки от тях прави за себе си.

Филмът е чепат, на места наивен, често на ръба на вулгарното (позоваването на физиологията е в повече, а вярата в нуждата от елегантност – по-малко от нужното). Като някакъв „Преди изгрев“ за едно по-неромантично поколение, свикнало на почти делови отношения в приложенията за срещи и демитологизирало секса до баналност, което обаче също копнее за неслучайна близост и безпогрешно разпознава нежността… (Срв. с лустросания пакет от клишета, спретнато подготвен от огромен екип в закриващия филм на фестивала, американския „Сватбеното тържество“ – романтиката там сякаш вирее доста по-трудно именно защото всички неистово се мъчат да я изявят.)

На СПФФ не пропускайте и…

… двата филма от силната реколта на „Кан 2024“ – леко хаотичния, доста отвлечен в ключови моменти, но очарователен за преживяване „Бърд“ на англичанката Андреа Арнолд (7 юни) и яростната история за любов и смърт „Безсрамните“ (10 юни) на Константин Божанов.

Космополитът Божанов е изключителен случай на български автор с международна кариера, в която киното не е първата спирка („мигрирал“ е в него от скулптурата) и в която филм след филм декор и тема радикално се променят. Дебютът му в пълнометражното игрално кино беше на 43 години с българското road movie „Аве“. Последва европейското road movie „И после светлина“, където ирландецът Бари Кьоеган (чудесен впрочем в споменатия по-горе „Бърд“), изигра първата си главна роля. Изненадващо (и не) миналата година дойде времето на „Безсрамните“ – независима феминистка индийска драма, изнесена харизматично от две непрофесионални актриси, едната от които получи награда за ролята си в раздела „Особен поглед“ на фестивала в Кан…

Да живеят неочевидните връзки между нещата, местата и хората и онези, които умеят да ги разпознаят и оценят!

Best practices for upgrading Amazon MWAA environments

Post Syndicated from Anurag Srivastava original https://aws.amazon.com/blogs/big-data/best-practices-for-upgrading-amazon-mwaa-environments/

Amazon Managed Workflows for Apache Airflow (Amazon MWAA) has become a cornerstone for organizations embracing data-driven decision-making. As a scalable solution for managing complex data pipelines, Amazon MWAA enables seamless orchestration across AWS services and on-premises systems. Although AWS manages the underlying infrastructure, you must carefully plan and execute your Amazon MWAA environment updates according to the shared responsibility model. Upgrading to the latest Amazon MWAA version can provide significant advantages, including enhanced security through critical security patches and potential improvements in performance with faster DAG parsing and reduced database load. You can use advanced features while maintaining ecosystem compatibility and receiving prioritized AWS support. The key to successful upgrades lies in choosing the right solution and following a methodical implementation approach.

In this post, we explore best practices for upgrading your Amazon MWAA environment and provide a step-by-step guide to seamlessly transition to the latest version.

Solution overview

Amazon MWAA provides two primary upgrade solutions:

  • In-place upgrade – This method works best when you can accommodate planned downtime. You deploy the new version directly on your existing infrastructure. In-place version upgrades on Amazon MWAA are supported for environments running Apache Airflow version 2.x and later. However, if you’re running version 1.10.z or older versions, you must create a new environment and migrate your resources, because these versions don’t support in-place upgrades.
  • Cutover upgrade – This method helps minimize disruption to production environments. You create a new Amazon MWAA environment with the target version and then transition from your old environment to the new one.

Each solution offers a different approach to help you upgrade while working to maintain data integrity and system reliability.

In-place upgrade

In-place upgrades work well for environments where you can schedule a maintenance window for the upgrade process. During this window, Amazon MWAA preserves your workflow history. This method works best when you can accommodate planned downtime. It helps maintain historical data, provides a straightforward upgrade process, and includes rollback capabilities if issues occur during provisioning. You also use fewer resources because you don’t need to create a new environment.

You can perform in-place upgrades through the AWS Management Console with a single operation. This process helps reduce operational overhead by managing many upgrade steps for you.

During the upgrade process, your environment can’t schedule or run new tasks. Amazon MWAA helps manage the upgrade process and implements safety measures—if issues occur during the provisioning phase, the service attempts to revert to the previous stable version.

Before you begin an in-place upgrade, we recommend testing your DAGs for compatibility with the target version, because DAG compatibility issues can affect the upgrade process. You can use the Amazon MWAA local runner to test DAG compatibility before you start the upgrade. You can start the upgrade using either the console and specifying the new version or the AWS Command Line Interface (AWS CLI). The following is an example Amazon MWAA upgrade command using the AWS CLI:

aws mwaa update-environment --name <value> --airflow-version <value>

The following diagram shows the Amazon MWAA in-place upgrade workflow and states.

In-place upgrade workflow and states

Refer to Introducing in-place version upgrades with Amazon MWAA for more details.

Cutover upgrade

A cutover upgrade provides an alternative solution when you need to minimize downtime, though it requires more manual steps and operational planning. With this approach, you create a new Amazon MWAA environment, migrate your metadata, and manage the transition between environments. Although this method offers more control over the upgrade process, it requires additional planning and execution effort compared to an in-place upgrade.

This method can work well for environments with complex workflows, particularly when you plan to make significant changes alongside the version upgrade. The approach offers several benefits: you can minimize production downtime, perform comprehensive testing before switching environments, and maintain the ability to return to your original environment if needed. You can also review and update your configurations during the transition.

Consider the following aspects of the cutover approach. When you run two environments simultaneously, you pay for both environments. The pricing for each Amazon MWAA environment depends on:

  • Duration of environment uptime (billed hourly with per-second resolution)
  • Environment size configuration
  • Automatic scaling capacity for workers
  • Scheduler capacity

AWS calculates the cost of additional automatic scaled workers separately. You can estimate costs for your specific configuration using the AWS Pricing Calculator.

To help prevent data duplication or corruption during parallel operation, we recommend implementing idempotent DAGs. The Airflow scheduler automatically populates some metadata tables (dag, dag_tag, and dag_code) in your new environment. However, you need to plan the migration of the following additional metadata components:

  • DAG history
  • Variables
  • Slot pool configurations
  • SLA miss records
  • XCom data
  • Job records
  • Log tables

You can choose this approach when your requirements prioritize minimal downtime and you can manage the additional operational complexity.

The cutover upgrade process involves three main steps: creating a new environment, restoring it with the existing data, and performing the upgrade. The following diagram illustrates the full workflow.

Cut-over upgrade steps

In the following sections, we walk through the key steps to perform a cutover upgrade.

Prerequisites

Before you begin the upgrade process, complete the following steps:

Create a new environment

Complete the following steps to create a new environment:

  • Generate a template for your new environment configuration using the AWS CLI:

aws mwaa create-environment --generate-cli-skeleton > <new-env-name>.json

  • Modify the generated JSON file:
    • Copy configurations from your backup file <env-name>.json to <new-env-name>.json.
    • Update the environment name.
    • Keep the AirflowVersion parameter value from your existing environment.
    • Review and update other configuration parameters as needed.
  • Create your new environment:

aws mwaa create-environment --cli-input-json <content of new-env-name.json>

Restore the new environment

Complete the following steps to restore the new environment:

  • Use the mwaa-dr PyPI package to create and run the restore DAG.
  • This process copies metadata from your S3 backup bucket to the new environment.
  • Verify that your new environment contains the expected metadata from your original environment.

Perform the version upgrade

Complete the following steps to perform the version upgrade:

  • Upgrade your environment:

aws mwaa update-environment --name <new-env-name> --airflow-version <target-version>

  • Monitor the upgrade:
    • Track the environment status on the console.
    • Watch for error messages or warnings.
    • Verify the environment reaches the AVAILABLE

Plan your transition timing carefully. When your original environment continues to process workflows during this upgrade, the metadata between environments can change.

Clean up

After you verify the stability of your upgraded environment through monitoring, you can begin the cleanup process:

  • Remove your original Amazon MWAA environment using the AWS CLI command:

 aws mwaa delete-environment --name <old-env-name>

  • Clean up your associated resources by removing unused backup data from S3 buckets, deleting temporary AWS Identity and Access Management (IAM) roles and policies created for the upgrade, and updating your DNS or routing configurations.

Before removing any resources, make sure you follow your organization’s backup retention policies, maintain necessary backup data for your compliance requirements, and document configuration changes made during the upgrade.

This approach helps you perform a controlled upgrade with opportunities for testing and the ability to return to your original environment if needed.

Monitoring and validation

You can track your upgrade progress using Amazon CloudWatch metrics, with a focus on DAG processing metrics and scheduler heartbeat. Your environment transitions through several states during the upgrade process, including UPDATING and CREATING. When your environment shows the AVAILABLE state, you can begin validation testing. We recommend checking system accessibility, testing critical workflow operations, and verifying external connections. For detailed monitoring guidance, see Monitoring and metrics for Amazon Managed Workflows for Apache Airflow.

Key considerations

Consider using infrastructure as code (IaC) practices to help maintain consistent environment management and support repeatable deployments. Schedule metadata backups using mwaa-dr during periods of low activity to help protect your data. When designing your workflows, implement idempotent pipelines to help manage potential interruptions, and maintain documentation of your configurations and dependencies.

Conclusion

A successful Amazon MWAA upgrade starts with selecting an approach that aligns with your operational requirements. Whether you choose an in-place or cutover upgrade, thorough preparation and testing help support a controlled transition. Using available tools, monitoring capabilities, and recommended practices can help you upgrade to the latest Amazon MWAA features while working to maintain your workflow operations.

For additional details and code examples on Amazon MWAA, refer to the Amazon MWAA User Guide and Amazon MWAA examples GitHub repo.

Apache, Apache Airflow, and Airflow are either registered trademarks or trademarks of the Apache Software Foundation in the United States and/or other countries.


About the Authors

Anurag Srivastava works as a Senior Big Data Cloud Engineer at Amazon Web Services (AWS), specializing in Amazon MWAA. He’s passionate about helping customers build scalable data pipelines and workflow automation solutions on AWS.

Sriharsh Adari is a Senior Solutions Architect at Amazon Web Services (AWS), where he helps customers work backwards from business outcomes to develop innovative solutions on AWS. Over the years, he has helped multiple customers on data platform transformations across industry verticals. His core area of expertise include Technology Strategy, Data Analytics, and Data Science. In his spare time, he enjoys playing sports, binge-watching TV shows, and playing Tabla.

Venu Thangalapally is a Senior Solutions Architect at AWS, based in Chicago, with deep expertise in cloud architecture, data and analytics, containers, and application modernization. He partners with Financial Services industry customers to translate business goals into secure, scalable, and compliant cloud solutions that deliver measurable value. Venu is passionate about leveraging technology to drive innovation and operational excellence. Outside of work, he enjoys spending time with his family, reading, and taking long walks.

Chandan Rupakheti is a Senior Solutions Architect at AWS. His main focus at AWS lies in the intersection of analytics, serverless, and AdTech services. He is a passionate technical leader, researcher, and mentor with a knack for building innovative solutions in the cloud. Outside of his professional life, he loves spending time with his family and friends, and listening to and playing music.

AWS Weekly Roundup: Amazon Aurora DSQL, MCP Servers, Amazon FSx, AI on EKS, and more (June 2, 2025)

Post Syndicated from Prasad Rao original https://aws.amazon.com/blogs/aws/aws-weekly-roundup-amazon-aurora-dsql-mcp-servers-amazon-fsx-ai-on-eks-and-more-june-2-2025/

It’s AWS Summit Season! AWS Summits are free in-person events that take place across the globe in major cities, bringing cloud expertise to local communities. Each AWS Summit features keynote presentations highlighting the latest innovations, technical sessions, live demos, and interactive workshops led by Amazon Web Services (AWS) experts. Last week, events took place at AWS Summit Tel Aviv and AWS Summit Singapore.

The following photo shows the packed keynote at AWS Summit Tel Aviv.

AWS Summit Tel Aviv Keynote

Find an AWS Summit near you and join thousands of AWS customers and cloud professionals taking the next step in their cloud journey.

Last week, the announcement that piqued my interest most was the general availability of Amazon Aurora DSQL, which was introduced in preview at re:Invent 2024. Aurora DSQL is the fastest serverless distributed SQL database that enables you to build always available applications with virtually unlimited scalability, the highest availability, and zero infrastructure management.

Aurora DSQL active-active distributed architecture is designed for 99.99% single-Region and 99.999% multi-Region availability with no single point of failure and automated failure recovery. This means your applications can continue to read and write with strong consistency, even in the rare case an application is unable to connect to a Region cluster endpoint.

Single and multi region deployment of Amazon Aurora DSQL

What’s more fascinating is the journey behind building Aurora DSQL, a story that goes beyond the technology in the pursuit of engineering efficiency. Read the full story in Dr. Werner Vogels’ blog post, Just make it scale: An Aurora DSQL story.

Last week’s launches
Here are the other launches that got my attention:

  • Announcing new Model Context Protocol (MCP) servers for AWS Serverless and Containers – MCP servers are now available for AWS Lambda, Amazon Elastic Container Service (Amazon ECS), Amazon Elastic Kubernetes Service (Amazon EKS), and Finch. With MCP servers, you can get from idea to production faster by giving your AI assistants access to an up-to-date framework on how to correctly interact with your AWS service of choice. To download and try out the open source MCP servers, visit the aws-labs GitHub repository.
  • Announcing the general availability of Amazon FSx for Lustre Intelligent-Tiering – FSx for Lustre Intelligent-Tiering, a new storage class, automatically optimizes costs by tiering cold data to the applicable lower-cost storage tier based on access patterns and includes an optional SSD read cache to improve performance for your most latency-sensitive workloads.
  • Amazon FSx for NetApp ONTAP now supports write-back mode for ONTAP FlexCache volumes – Write-back mode is a new ONTAP capability that helps you achieve faster performance for your write-intensive workloads that are distributed across multiple AWS Regions and on-premises file systems.
  • AWS Network Firewall Adds Support for Multiple VPC Endpoints – AWS Network Firewall now supports configuring up to 50 Amazon Virtual Private Cloud (Amazon VPC) endpoints per Availability Zone for a single firewall. This new capability gives you more options to scale your Network Firewall deployment across multiple VPCs, using a centralized security policy.
  • Cost Optimization Hub now supports Savings Plans and reservations preferences – You can now use Cost Optimization Hub, a feature within the Billing and Cost Management Console, to configure preferred Savings Plans and reservation term and payment options preferences, so you can see your resulting recommendations and savings potential based on your preferred commitments.
  • AWS Neuron introduces NxD Inference GA, new features, and improved tools – With the release of Neuron 2.23, the NxD Inference library (NxDI) moves from beta to general availability and is now recommended for all multi-chip inference use cases. Neuron 2.23 also introduces new training capabilities, including context parallelism and Odds Ratio Preference Optimization (ORPO), and adds support for PyTorch 2.6 and JAX 0.5.3.
  • AWS Pricing Calculator, now generally available, supports discounts and purchase commitment – We announced the general availability of the AWS Pricing Calculator in the AWS console. You can now create more accurate and comprehensive cost estimates by providing two types of cost estimates: cost estimation for a workload, and estimation of a full AWS bill. You can also import your historical usage or create net new usage when creating a cost estimate. Additionally, with the new rate configuration inclusive of both pricing discounts and purchase commitments, you can gain a clearer picture of potential savings and cost optimizations for your cost scenarios.
  • AWS CDK Toolkit Library is now generally available – AWS CDK Toolkit Library provides programmatic access to core AWS CDK functionalities such as synthesis, deployment, and destruction of stacks. You can use this library to integrate CDK operations directly into your applications, custom CLIs, and automation workflows, offering greater flexibility and control over infrastructure management.
  • Announcing Red Hat Enterprise Linux for AWS – Red Hat Enterprise Linux (RHEL) for AWS, starting with RHEL 10, is now generally available, combining Red Hat’s enterprise-grade Linux software with native AWS integration. RHEL for AWS is built to achieve optimum performance of RHEL running on AWS.

For a full list of AWS announcements, be sure to keep an eye on the What’s New with AWS? page.

Additional updates
Here are some additional projects, blog posts, and news items that you might find interesting:

  • Introducing AI on EKS: powering scalable AI workloads with Amazon EKS – AI on EKS is a new open source initiative from AWS designed to help you deploy, scale, and optimize AI/ML workloads on Amazon EKS. AI on EKS repository includes deployment-ready blueprints for distributed training, LLM inference, generative AI pipelines, multi-model serving, agentic AI, GPU and Neuron-specific benchmarks, and MLOps best practices.
  • Revolutionizing earth observation with geospatial foundation models on AWS – Emerging transformer-based vision models for geospatial data—also called geospatial foundation models (GeoFMs)—offer a new and powerful technology for mapping the earth’s surface at a continental scale. This post explores how Clay Foundation’s Clay foundation model can be deployed for large-scale inference and fine-tuning on Amazon SageMaker. You can use the ready-to-deploy code samples to get started quickly with deploying GeoFMs in your own applications on AWS.

High level solution flow for inference and fine tuning using Geospatial Foundation Models

  • Going beyond AI assistants: Examples from Amazon.com reinventing industries with generative AI – Non-conversational applications offer unique advantages, such as higher latency tolerance, batch processing, and caching, but their autonomous nature requires stronger guardrails and exhaustive quality assurance compared to conversational applications, which benefit from real-time user feedback and supervision. This post examines four diverse Amazon.com examples of non-conversational generative AI applications.

Upcoming AWS events
Check your calendars and sign up for these upcoming AWS events:

  • AWS Summits – Join free online and in-person events that bring the cloud computing community together to connect, collaborate, and learn about AWS. Register in your nearest city: Stockholm (June 4), Sydney (June 4–5), Hamburg (June 5), Washington (June 10–11), Madrid (June 11), Milan (June 18), Shanghai (June 19–20), and Mumbai (June 19).
  • AWS re:Inforce – Mark your calendars for AWS re:Inforce (June 16–18) in Philadelphia, PA. AWS re:Inforce is a learning conference focused on AWS security solutions, cloud security, compliance, and identity.
  • AWS Community Days – Join community-led conferences that feature technical discussions, workshops, and hands-on labs led by expert AWS users and industry leaders from around the world: Milwaukee, USA (June 5), Mexico (June 14), Nairobi, Kenya (June 14), and Colombia (June 28).

That’s all for this week. Check back next Monday for another Weekly Roundup!

– Prasad

Build a secure serverless streaming pipeline with Amazon MSK Serverless, Amazon EMR Serverless and IAM

Post Syndicated from Shubham Purwar original https://aws.amazon.com/blogs/big-data/build-a-secure-serverless-streaming-pipeline-with-amazon-msk-serverless-amazon-emr-serverless-and-iam/

The exponential growth and vast volume of streaming data have made it a vital resource for organizations worldwide. To unlock its full potential, real-time analytics are essential for extracting actionable insights. Derived from a wide range of sources, including social media, Internet of Things (IoT) sensors, and user interactions, streaming data empowers businesses to respond promptly to emerging trends and events, make informed decisions, and stay ahead of the competition.

Commonly streaming applications use Apache Kafka for data ingestion and Apache Spark Structured Streaming for processing. However, integrating and securing these components poses considerable challenges for users. The complexity of managing certificates, keystores, and TLS configurations to connect Spark Streaming to Kafka brokers demands specialized expertise. A managed, serverless framework would greatly simplify this process, alleviating the need for manual configuration and streamlining the integration of these critical components.

To simplify the management and security of traditional streaming architectures, you can use Amazon Managed Streaming for Apache Kafka (Amazon MSK). This fully managed service simplifies data ingestion and processing. Amazon MSK Serverless alleviates the need for cluster management and scaling, and further enhances security by integrating AWS Identity and Access Management (IAM) for authentication and authorization. This consolidated approach replaces complex certificate and key management require by TLS client authentication through AWS Certificate Manager, streamlining operations and bolstering data protection. For instance, when a client attempts to write data to the cluster, MSK Serverless verifies both the client’s identity and its permissions using IAM.

For efficient data processing, you can use Amazon EMR Serverless with a Spark application built on the Spark Structured Streaming framework, enabling near real-time data processing. This setup seamlessly handles large volumes of data from MSK Serverless, using IAM authentication for secure and swift data processing.

The post demonstrates a comprehensive, end-to-end solution for processing data from MSK Serverless using an EMR Serverless Spark Streaming job, secured with IAM authentication. Additionally, it demonstrates how to query the processed data using Amazon Athena, providing a seamless and integrated workflow for data processing and analysis. This solution enables near real-time querying of the latest data processed from MSK Serverless and EMR Serverless using Athena, providing instant insights and analytics.

Solution overview

The following diagram illustrates the architecture that you implement through this post.

The workflow consists of the following steps:

  1. The architecture begins with an MSK Serverless cluster set up with IAM authentication. An Amazon Elastic Compute Cloud (Amazon EC2) instance runs a Python script producer.py that acts as a data producer, sending sample data to a Kafka topic within the cluster.
  2. The Spark Streaming job retrieves data from the Kafka topic, stores it in Amazon Simple Storage Service (Amazon S3), and creates a corresponding table in the AWS Glue Data Catalog. As it continuously consumes data from the Kafka topic, the job stays up-to-date with the latest streaming data. With checkpointing enabled, the job tracks processed records, allowing it to resume from where it left off in case of a failure, providing seamless data processing.
  3. To analyze this data, users can use Athena, a serverless query service. Athena enables interactive SQL-based exploration of data directly in Amazon S3 without the need for complex infrastructure management.

Prerequisites

Before getting started, make sure you have the following:

  • An active AWS account with billing enabled
  • An IAM user with administrator access (AdministratorAccess policy) or specific permissions to create and manage resources such as a virtual private cloud (VPC), subnet, security group, IAM roles, NAT gateway, internet gateway, EC2 client, MSK Serverless, EMR Serverless, Amazon EMR Studio, and S3 buckets
  • Sufficient VPC capacity in your chosen AWS Region

Although using an IAM user with administrator access will work, it’s recommended to follow the principle of least privilege in production environments by creating custom IAM policies with only the necessary permissions. The IAM user we create has the AdministrativeAccess policy attached to it. However, you might not need such elevated access.

For this post, we create the solution resources in the us-east-2 Region using AWS CloudFormation templates. In the following sections, we show you how to configure your resources and implement the solution.

Create MSK Serverless and EMR Serverless resources

The vpc-msk-emr-serverless-studio.yaml stack creates a VPC, subnet, security group, IAM roles, NAT gateway, internet gateway, EC2 client, MSK Serverless, EMR Serverless, EMR Studio, and S3 buckets. To create the solution resources, complete the following steps:

  1. Launch the stack vpc-msk-emr-serverless-studio using the CloudFormation template:

  1. Provide the parameter values as listed in the following table.
Parameters Description Sample value
EnvironmentName An environment name that is prefixed to resource names. msk-emr-serverless-pipeline
InstanceType Amazon MSK client EC2 instance type. t2.micro
LatestAmiId Latest AMI ID of Amazon Linux 2023 for ec2 instance. You can use the default value. /aws/service/ami-amazon-linux-latest/al2023-ami-kernel-6.1-x86_64
VpcCIDR IP range (CIDR notation) for this VPC. 10.192.0.0/16
PublicSubnet1CIDR IP range (CIDR notation) for the public subnet in the first Availability Zone. 10.192.10.0/24
PublicSubnet2CIDR IP range (CIDR notation) for the public subnet in the second Availability Zone. 10.192.11.0/24
PrivateSubnet1CIDR IP range (CIDR notation) for the private subnet in the first Availability Zone. 10.192.20.0/24
PrivateSubnet2CIDR IP range (CIDR notation) for the private subnet in the second Availability Zone. 10.192.21.0/24

The stack creation process can take approximately 10 minutes to complete. You can check the Outputs tab for the stack after the stack is created.

Next, you set up the data ingestion to the Kafka topic from the Kafka EC2 instance.

Produce records to Kafka topic

Complete the following steps to set up data ingestion:

  1. On the Amazon EC2 console, go to the EC2 instance that you created using the CloudFormation template.

  1. Log in to the EC2 instance using Session Manager, a capability of AWS Systems Manager.
  2. Choose the instance msk-emr-serverless-blog and then choose Connect.

  1. Create a Kafka topic in MSK Serverless from the EC2 instance.
    1. In the following export command, replace my-endpoint with the MSKBootstrapServers value from the CloudFormation stack output:
      $ sudo su - ec2-user
      $ BS=<your-msk-serverless-endpoint (e.g.) boot-xxxxxx.yy.kafka-serverless.us-east-2.amazonaws.com:9098>

    2. Run the following command on the EC2 instance to create a topic called sales_data_topic:

Kafka client already installed at ec2-user home directory (/home/ec2-user) with MSK IAM Authentication jar and client configuration also created (/home/ec2-user/kafka_2.12-2.8.1/bin/client.properties) with IAM authentication properties.

The following code shows the contents of client.properties:

security.protocol=SASL_SSL
sasl.mechanism=AWS_MSK_IAM
sasl.jaas.config=software.amazon.msk.auth.iam.IAMLoginModule required;
sasl.client.callback.handler.class=software.amazon.msk.auth.iam.IAMClientCallbackHandler

/home/ec2-user/kafka_2.12-2.8.1/bin/kafka-topics.sh \
--bootstrap-server $BS \
--command-config /home/ec2-user/kafka_2.12-2.8.1/bin/client.properties \
--create --topic sales_data_topic \
--partitions 10

Created topic sales_data_topic.
  1. Run the following command to produce records to the Kafka topic using the syntheticSalesDataProducer.py Python script present in EC2 instance. Update the Region accordingly.
nohup python3 -u syntheticSalesDataProducer.py --num_records 1000 \
--sales_data_topic sales_data_topic --bootstrap_server $BS \
--region=us-east-2 > syntheticSalesDataProducer.log &

Understanding Amazon MSK IAM authentication with EMR Serverless

Amazon MSK IAM authentication enables secure authentication and authorization for Kafka clusters (MSK Serverless) using IAM roles. When integrating with EMR Serverless Spark Streaming, Amazon MSK IAM authentication allows Spark jobs to access Kafka topics securely, using IAM roles for fine-grained access control. This provides secure data processing and streaming.

IAM policy configuration

To enable EMR Serverless jobs to authenticate with an MSK Serverless cluster using IAM, you need to attach specific Kafka-related IAM permissions to the EMR Serverless job execution role. These permissions allow the job to perform essential operations on the Kafka cluster, topics, and consumer groups.The following IAM policy must be attached to the EMR Serverless job execution role to enable necessary permissions:

{
    "Version": "2012-10-17",
    "Statement": [
        {
            "Action": [
                "kafka-cluster:Connect",
                "kafka-cluster:DescribeCluster"
            ],
            "Resource": [
                "arn:aws:kafka:<AWS-REGION>:<ACCOUNTID>:cluster/<SERVERLESS_CLUSTER_NAME>/<ID>"
            ],
            "Effect": "Allow"
        },
        {
            "Action": [
                "kafka-cluster:CreateTopic",
                "kafka-cluster:DescribeTopic",
                "kafka-cluster:WriteData",
                "kafka-cluster:ReadData"
            ],
            "Resource": [
                "arn:aws:kafka:<AWS-REGION>:<ACCOUNTID>:topic/<SERVERLESS_CLUSTER_NAME>/*/*"
            ],
            "Effect": "Allow"
        },
        {
            "Action": [
                "kafka-cluster:AlterGroup",
                "kafka-cluster:DescribeGroup"
            ],
            "Resource": [
                "arn:aws:kafka:<AWS-REGION>:<ACCOUNTID>:group/<SERVERLESS_CLUSTER_NAME>/*/*"
            ],
            "Effect": "Allow"
        }
    ]
}

This code refers to the following actions:

  • Connect, DescribeCluster – Required to initiate a secure connection and obtain metadata
  • DescribeTopic, ReadData, WriteData – Enables data consumption and production
  • CreateTopic (optional) – Allows dynamic topic creation
  • AlterGroup, DescribeGroup – Needed for consumer group management in streaming jobs

These permissions make sure that the Spark Streaming job can securely authenticate and interact with MSK Serverless resources using its IAM role.

Required dependencies

To enable Amazon MSK IAM authentication in Spark (especially on EMR Serverless), specific JAR dependencies must be included in your Spark Streaming job using sparkSubmitParameters:

  • spark-sql-kafka-0-10_2.12 – This is the Kafka connector for Spark Structured Streaming. It provides the DataFrame API to read from and write to Kafka.
  • aws-msk-iam-auth – This JAR provides the IAM authentication mechanism required to connect to MSK Serverless using the AWS_MSK_IAM SASL mechanism.

You can include these dependencies directly by specifying them in the --packages argument when submitting the EMR Serverless job. For example:

--packages org.apache.spark:spark-sql-kafka-0-10_2.12:3.5.1,software.amazon.msk:aws-msk-iam-auth:2.2.0

When the job is submitted, EMR Serverless will automatically download these JARs from Maven Central (or another configured repository) at runtime. You don’t need to bundle them manually unless offline usage or specific versions are required.

Spark Streaming job configuration for Amazon MSK IAM authentication

In your Spark Streaming application, configure the Kafka source with SASL properties to enable IAM based authentication. The following code shows the relevant configuration:

topic_df = (spark.readStream
    .format("kafka")
    .option("kafka.bootstrap.servers", kafka_bootstrap_servers)
    .option("subscribe", topic_input)
    .option("startingOffsets", "earliest")
    .option("kafka.security.protocol","SASL_SSL")
    option("kafka.sasl.mechanism","AWS_MSK_IAM")
    .option("kafka.sasl.jaas.config","software.amazon.msk.auth.iam.IAMLoginModule required;")
    .option("kafka.sasl.client.callback.handler.class","software.amazon.msk.auth.iam.IAMClientCallbackHandler")
    .load()
    .selectExpr("CAST(value AS STRING)")
    )

Key properties include:

  • kafka.security.protocol = SASL_SSL – Enables encrypted communication over SSL with SASL authentication
  • kafka.sasl.mechanism = AWS_MSK_IAM – Tells Kafka to use the IAM based SASL mechanism
  • kafka.sasl.jaas.config = software.amazon.msk.auth.iam.IAMLoginModule required; – Specifies the login module provided by AWS for IAM integration
  • kafka.sasl.client.callback.handler.class = software.amazon.msk.auth.iam.IAMClientCallbackHandler – Handles the actual signing and authentication using the IAM role

With these settings, Spark uses the IAM credentials attached to the EMR Serverless job execution role to authenticate to MSK Serverless without needing additional credentials, certificates, or secrets.

Data processing using an EMR Serverless streaming job with Amazon MSK IAM authentication

Complete the following steps to run a Spark Streaming job to process the data from MSK Serverless:

  1. Submit the Spark Streaming job to EMR Serverless using the AWS Command Line Interface (AWS CLI), which is already installed on the EC2 instance.
  2. Log in to the EC2 instance using Session Manager. Choose the instance msk-emr-serverless-blog and then choose Connect.
  3. Run the following command to submit the streaming job. Provide the parameters from the CloudFormation stack output.
sudo su - ec2-user

aws emr-serverless start-job-run \
--application-id <APPLICATION ID> \
--execution-role-arn <EXECUTION ROLE ARN> \
--mode 'STREAMING' \
--job-driver '{
"sparkSubmit": {
"entryPoint": "s3://<EMR BLOG SCRIPT BUCKET>/emr_pyspark_streaming_script/pysparkStreamingBlog.py",
"entryPointArguments":["--topic_input","sales_data_topic","--kafka_bootstrap_servers","<BOOTSTRAP URL WITH PORT>","--output_s3_path","s3://<EMR STREAMING OUTPUT BUCKET>/output/sales-order-data/","--checkpointLocation","s3://<EMR STREAMING OUTPUT BUCKET>/checkpointing/checkpoint-sales-order-data/","--database_name","emrblog","--table_name","sales_order_data"],
"sparkSubmitParameters": "--conf spark.hadoop.hive.metastore.client.factory.class=com.amazonaws.glue.catalog.metastore.AWSGlueDataCatalogHiveClientFactory --conf spark.executor.cores=2 --conf spark.executor.memory=5g --conf spark.driver.cores=2 --conf spark.driver.memory=5g --conf spark.executor.instances=5 --packages org.apache.spark:spark-sql-kafka-0-10_2.12:3.5.1,software.amazon.msk:aws-msk-iam-auth:2.2.0"
}}'
  1. After you submit the job, log in to EMR Studio using the URL in the EmrServerlessStudioURL value from the CloudFormation stack output.
  2. In the navigation pane, choose Applications under Serverless.
  3. Choose the application ID in the EmrServerlessSparkApplicationID value from the CloudFormation stack output.
  4. On the Streaming job runs tab, verify that the job has been submitted and wait for it to begin running.

Validate the data in Athena

After the EMR Serverless Spark Streaming job ran and created the table for the processed data in the Data Catalog, follow these steps to validate the data using Athena:

  1. On the Athena console, open the query editor.
  2. Choose the Data Catalog as the data source.
  3. Choose the database emrblog that the streaming job created.
  4. To validate the data, run the following query:
SELECT 
    DATE_TRUNC('minute', date) AS minute_window, 
    ROUND(SUM(total_amount), 2) AS total_amount
FROM 
    emrblog.sales_order_data
WHERE 
    DATE_TRUNC('day', date) = CURRENT_DATE
GROUP BY 
    DATE_TRUNC('minute', date)
ORDER BY 
    minute_window DESC;

Clean up

To clean up your resources, complete the following steps:

  1. Log in to EMR Studio using the URL from the EmrServerlessStudioURL value in the CloudFormation stack output.
  2. In the navigation pane, choose Applications under Serverless.
  3. Choose the application ID from the EmrServerlessSparkApplicationID value in the CloudFormation stack output.
  4. On the Streaming job runs tab, select the job that has been running and cancel the job run.
  5. On the AWS CloudFormation console, delete the CloudFormation stack vpc-msk-emr-serverless-studio.

Conclusion

In this post, we showcased a serverless pipeline for streaming data with IAM authentication, empowering you to focus on deriving insights from your analytics. You can customize the EMR Serverless Spark Streaming code to apply transformations and filters, so only valid data is loaded into Amazon S3. This solution combines the power of Amazon EMR Spark Serverless streaming with MSK Serverless, securely integrated through IAM authentication. Now you can streamline your streaming processes without the complexity of managing Amazon MSK and Amazon EMR Spark Streaming integrations.


About the Authors

Shubham Purwar is an AWS Analytics Specialist Solution Architect. He helps organizations unlock the full potential of their data by designing and implementing scalable, secure, and high-performance analytics solutions on the AWS platform. With deep expertise in AWS analytics services, he collaborates with customers to uncover their distinct business requirements and create customized solutions that deliver actionable insights and drive business growth. In his free time, Shubham loves to spend time with his family and travel around the world.

Nitin Kumar is a Cloud Engineer (ETL) at AWS, specialized in AWS Glue. With a decade of experience, he excels in aiding customers with their big data workloads, focusing on data processing and analytics. He is committed to helping customers overcome ETL challenges and develop scalable data processing and analytics pipelines on AWS. In his free time, he likes to watch movies and spend time with his family.

Prashanthi Chinthala is a Cloud Engineer (DIST) at AWS. She helps customers overcome EMR challenges and develop scalable data processing and analytics pipelines on AWS.

Enhancing data durability in Amazon EMR HBase on Amazon S3 with the Amazon EMR WAL feature

Post Syndicated from Suthan Phillips original https://aws.amazon.com/blogs/big-data/enhancing-data-durability-in-amazon-emr-hbase-on-amazon-s3-with-the-amazon-emr-wal-feature/

Apache HBase, an open source NoSQL database, enables quick access to massive datasets. Amazon EMR, from version 5.2.0, lets you use HBase on Amazon Simple Storage Service (Amazon S3). This combines HBase’s speed with the durability advantages of Amazon S3. Also, it helps achieve the data lake architecture benefits such as the ability to scale storage and compute requirements separately. We see our customers choosing Amazon S3 over Hadoop Distributed File Systems (HDFS) when they want to achieve greater durability, availability, and simplified storage management. Amazon EMR continually improves HBase on Amazon S3, focusing on performance, availability, and reliability.

Despite these durability benefits of HBase on Amazon S3 architecture, a critical concern remains regarding data recovery when the Write-Ahead Log (WAL) is lost. Within the EMR framework, HBase data attains durability when it’s flushed, or written, to Amazon S3. This flushing process is triggered by reaching specific size and time thresholds or through manual initiation. Until data is successfully flushed to S3, it persists within the WAL, which is stored in HDFS. In this post, we dive deep into the new Amazon EMR WAL feature to help you understand how it works, how it enhances durability, and why it’s needed. We explore several scenarios that are well-suited for this feature.

HBase WAL overview

Each RegionServer in HBase is responsible for managing data from multiple tables. These tables are horizontally partitioned into regions, where each region represents a contiguous range of row keys. A RegionServer can host multiple such regions, potentially from different tables. At the RegionServer level, there is a single, shared WAL that records all write operations across all regions and tables in a sequential, append-only manner. This shared WAL makes sure durability is maintained by persisting each mutation before applying it to in-memory structures, enabling recovery in case of unexpected failures. Within each region, the memory structure of the MemStore is further divided by column families, which are the fundamental units of physical storage and I/O in HBase. Each column family maintains:

  • Its own MemStore, which holds recently written data in memory for fast access and buffering before it flushes to disk.
  • A set of HFiles, which are immutable data files stored on HDFS (or Amazon S3 in HBase on S3 mode) that hold the persistent, flushed data.

Although all column families within a region are served by the same RegionServer process, they operate independently in terms of memory buffering, flushing, and compaction. However, they still share the same WAL and RegionServer-level resources, which introduces a degree of coordination, hence they operate semi-independently within the broader region context. This architecture is shown in the following diagram.

Architecture diagram of HBase Region Server showing WAL, two regions with in-memory Memstores and persistent HFiles

Understanding the HBase write process: WAL, MemStore, and HFiles

The HBase write path initiates when a client issues a write request, typically through an RPC call directed to the appropriate RegionServer that hosts the target region. Upon receiving the request, the RegionServer identifies the correct HBase region based on the row key and forwards the KeyValue pair accordingly. The write operation follows a two-step process. First, the data is appended to the WAL, which promotes durability by recording every change before it’s committed to memory. The WAL resides on HDFS by default and exists independently on each RegionServer. Its primary purpose is to provide a recovery mechanism in the event of a failure, particularly for edits that have not yet been flushed to disk. When the WAL append is successful, the data is written to the MemStore, an in-memory store for each column family within the region. The MemStore accumulates updates until it reaches a predefined size threshold, controlled by the hbase.hregion.memstore.flush.size parameter (default is 128 MB). When this threshold is exceeded, a flush is triggered.Flushing is handled asynchronously by a background thread in the RegionServer. The thread writes the contents of the MemStore to a new HFile, which is then persisted to long-term storage. In Amazon EMR, the location of this HFile depends on the deployment mode: for HBase on Amazon S3, HFiles are stored in Amazon S3, but for HBase on HDFS, they’re stored in HDFS.This workflow is shown in the following diagram.

HBase write process workflow showing data path through WAL, Memstore, and HFile with AWS services

A region server serves multiple regions, and they all share a common WAL. The WAL records all data changes, storing them in local HDFS. Puts and deletes are initially logged to the WAL by the region server before being recorded in the MemStore for the affected store. Scan and get operations in HBase don’t require the use of the WAL. In the event of a region server crash or unavailability before MemStore flushing, the WAL is crucial for replaying data changes, which promotes data integrity. Because this log by default resides on a replicated filesystem, it enables an alternate server to access and replay the log, requiring nothing from the physically failed server for a complete recovery. When a RegionServer fails abruptly, HBase initiates an automated recovery process orchestrated by the HMaster. First, the ZooKeeper session timeout detects the RegionServer failure, notifying the HMaster. The HMaster then identifies all regions previously hosted on the failed RegionServer and marks them as unassigned. The WAL files from the failed RegionServer are split by region, and these split WAL files are distributed to the new RegionServers that will host the reassigned regions. Each new RegionServer replays its assigned WAL segments to recover the MemStore state that existed before the failure, preventing data loss. When WAL replay is complete, the regions become operational on their new RegionServers, and the recovery process concludes.

HBase recovery workflow from RegionServer failure through WAL splitting to regions online

The effectiveness of the HDFS WAL model relies on the successful completion of the write request in the WAL and the subsequent data replication in HDFS. In cases where some nodes are terminated, HDFS can still recover from the WAL files, allowing HBase to autonomously heal by replaying data from the WALs and rebalancing the regions. However, if all CORE nodes are simultaneously terminated, achieving complete cluster recovery is a challenge because the data to replay from the WAL is lost. The issue arises when WALs are lost due to CORE node shutdown (for example, all three replicas of a file block). In this scenario, HBase enters a loop attempting to replay data from the WALs. Unfortunately, the absence of available blocks in this case causes the HBase server crash procedure to fail and retry indefinitely.

Amazon EMR WAL

To address the mentioned challenge of HDFS WAL and to provide data durability in HBase, Amazon EMR introduces a new EMR WAL feature starting from versions emr-7.0 and emr-6.15. This feature facilitates the recovery of data that hasn’t been flushed to Amazon S3 (HFile). Using this feature provides thorough backup for your HBase clusters. Behind the scenes, the RegionServer writes WAL data to EMR WAL, which is a service outside the EMR cluster. With this feature enabled, concerns about loss of WAL data in HDFS are alleviated. Also, in the event of cluster or Availability Zone failure issues, you can create a new cluster, directing it to the same Amazon S3 root directory and EMR WAL workspace. This enables the automatic recovery of data in the WAL in the order of minutes. Recovery of unflushed data is supported for a duration of 30 days, after which remaining unflushed data is deleted. This workflow is shown in the following diagram.

Detailed sequence diagram of HBase write operations with EMR WAL service integration and S3 storage

Key benefits

Upon enabling EMR WAL, the WALs are located external to the EMR cluster. The key benefits are:

  • High availability – You can remain confident about data integrity even in the face of Availability Zone failures. Their HFiles are stored in Amazon S3, and the WALs are externally stored in EMR WAL. This setup enables cluster recovery and WAL replay in the same or a different Availability Zone within the region. However, for true high availability with zero downtime, relying solely on EMR WAL is not sufficient because recovery still involves brief interruptions. To provide seamless failover and uninterrupted service, HBase replication across multiple Availability Zones is essential along with EMR WAL, providing robust zero-downtime high availability.
  • Data durability improvement – Customers no longer need to concern themselves with potential data loss in scenarios involving WAL data corruption in HDFS or the removal of all replicas in HDFS due to instance terminations.

The following flow diagram compares the sequence of events with and without EMR WAL enabled.

HBase write process and failure recovery workflow with EMR WAL and S3 integration

Key EMR WAL features

In this section, we explore the key enhancements introduced in the EMR WAL service across recent Amazon EMR versions. From grouping multiple HBase regions into a single EMR WAL to advanced configuration options, these new capabilities address specific usage scenarios.

Grouping multiple HBase regions into a single Amazon EMR WAL

In Amazon EMR versions up to 7.2, a separate EMR WAL is created for each region, which can become expensive due to the EMR-WAL-WALHours pricing model, especially when the HBase cluster contains many regions. To address this, starting from Amazon EMR 7.3, we introduced the EMR WAL grouping feature, which enables consolidating multiple HBase regions per EMR WAL, offering significant cost savings (over 99% cost savings in our sample evaluation) and improved operational efficiency. By default, each HBase RegionServer has two Amazon EMR WALs. If you have many regions per RegionServer and want to increase throughput, you can customize the number of WALs per RegionServer by configuring the hbase.wal.regiongrouping.numgroups property. For instance, to set 10 EMR WALs per HBase RegionServer, you can use the following configuration:

[
  {
    "Classification": "hbase-site",
    "Properties": {
      "hbase.wal.regiongrouping.numgroups": "10"
    }
  }
]

The two HBase system tables hbase:meta and hbase:master (masterstore) don’t participate in the WAL grouping mechanisms.

In a performance test using m5.8xlarge instances with 1,000 regions per RegionServer, we observed a significant increase in throughput as the number of WALs grew from 1 to 20 per RegionServer (from 1,570 to 3,384 operations per sec). This led to a 54% improvement in average latency (from 40.5 ms to 18.8 ms) and a 72% reduction in 95th percentile latency (from 231 ms to 64 ms). However, beyond 20 WALs, we noted diminishing returns, with only slight performance improvements between 20 and 50 WALs, and average latency stabilized around 18.7ms. Based on these results, we recommend maintaining a lower region density (around 10 regions per WAL) for optimal performance. Nonetheless, it’s crucial to fine-tune this configuration according to your specific workload characteristics and performance requirements and conduct tests in your lower environment to validate the best setup.

Configurable maximum record size in EMR WAL

Until Amazon EMR version 7.4, the EMR WAL had a record size limit of 4 MB, which was insufficient for some customers. Starting from EMR 7.5, the maximum record size in EMR WAL is configurable through the emr.wal.max.payload.size property. The default value is set to 1 GB. The following is an example of how to set the maximum record size to 2 GB:

[
  {
    "Classification": "hbase-site",
    "Properties": {
      "emr.wal.max.payload.size": "2147483648"
    }
  }
]

AWS PrivateLink support

EMR WAL supports AWS PrivateLink, if you want to keep your connection within the AWS network. To set it up, create a virtual private cloud (VPC) endpoint using the AWS Management Console or AWS Command Line Interface (AWS CLI) and select the service labeled com.amazonaws.region.emrwal.prod. Make sure your VPC endpoint uses the same security groups as the EMR cluster. You have two DNS configuration options: enabling private DNS, which uses the standard endpoint format and automatically routes traffic privately, or using the provided VPC endpoint-specific DNS name for more explicit control. Regardless of the DNS option chosen, both methods mean that traffic remains within the AWS network, enhancing security. To implement this in the EMR cluster, update your cluster configuration to use the PrivateLink endpoint, as shown in the following code sample (for private DNS):

[
    {
        "Classification": "hbase-site",
        "Properties": {
            "emr.wal.client.endpoint": "https://prod.emrwal.region.amazonaws.com"
        }
    }
]

For more details, refer to Access Amazon EMR WAL through AWS PrivateLink in the Amazon EMR documentation.

Encryption options for WAL in Amazon EMR

Amazon EMR automatically encrypts data in transit in the EMR WAL service. You can enable server-side encryption (SSE) for WAL (data at rest) with two key management options:

  • SSE-EMR-WAL: Amazon EMR manages the encryption keys
  • SSE-KMS-WAL: You use an AWS Key Management Service (AWS KMS) key for encryption policies

EMR WAL cross-cluster replication

From EMR 7.5, EMR WAL supports cross-cluster replay, allowing clusters in an active-passive HBase replication setup to use EMR WAL.

For more details on the setup, refer to EMR WAL cross-cluster replication in the Amazon EMR documentation.

EMR WAL enhancement: Minimizing CPU load from HBase sync threads

Starting from EMR 7.9, we’ve implemented code optimizations in EMR WAL to address the high CPU utilization caused by sync threads used by HBase processes to write WAL edits, leading to improved CPU efficiency.

Sample use cases benefitting from this feature

Based on our customer interactions and feedback, this feature can help in the following scenarios.

Continuity during service disruptions

If your business demands disaster recovery with no data loss for an HBase on an S3 cluster due to unexpected service disruptions, such as an Availability Zone failure, the newly introduced feature means you don’t have to rely on a persistent event store solution using Amazon Managed Streaming for Apache Kafka (Amazon MSK) or Amazon Kinesis. Without EMR WAL, you had to set up a complex event-streaming pipeline to retain the most recently ingested data and enable replay from the point of failure. This new feature eliminates that dependency by storing Hbase WALs in the EMR WAL service.

Note: During an Availability Zone (AZ) failure or service-level issue, make sure to fully terminate the original Hbase cluster before launching a new one that points to the same S3 root directory. Running two active Hbase clusters that access the same S3 root can lead to data corruption.

Upgrading to the latest EMR releases or cluster rotations

Without EMR WAL, moving to the latest EMR version or managing cluster rotations with HBase on Amazon S3 necessitated manual interruptions for data flushing to S3. With the new feature, the requirement for data flushing is eliminated. However, during cluster termination and the subsequent launch of a new HBase cluster, there is an inevitable service downtime, during which data producers or ingestion pipelines must handle write disruptions or buffer incoming data until the system is fully restored. Also, the downstream services should account for temporary unavailability, which can be mitigated using a read replica cluster.

Overcoming HDFS challenges during HBase auto scaling

Without EMR WAL feature, having HDFS for your WAL files was a requirement. When implementing custom auto scaling for your HBase clusters, it sometimes resulted in WAL data corruption due to issues linked to HDFS. This is because, to prevent data loss, data blocks had to be moved to different HDFS nodes when one HDFS node was being decommissioned. When nodes continued to be terminated swiftly during scale-down process without allowing sufficient time for graceful decommissioning, it could result in WAL data corruption issues, primarily attributed to missing blocks.

Addressing HDFS disk space issues due to old WALs

When a WAL file is no longer required for recovery, indicating that HBase has made sure all data within the WAL file has been flushed, it’s transferred to the oldWALs folder for archival purposes. The log remains in this location until all other references to the WAL file are completed. In HBase use cases with high write activity, some customers have expressed concerns about the oldWALs directory (/usr/hbase/oldWALs) expanding and occupying excessive disk space and eventually causing disk space issues. With the complete relocation of these WALs to an external EMR WAL service, you will no longer encounter this issue.

Assessing HBase in Amazon EMR clusters with and without EMR WAL for fault tolerance

We conducted a data durability test employing two scripts. The first was for installing YCSB, creating a pre-split table, and loading 8 million records on the master node. The second was for terminating a core node every 90 seconds after a 3-minute wait, totaling five terminations. Two EMR clusters with eight core nodes each were created, one configured with EMR WAL enabled and the other as a standard EMR HBase cluster with the WAL stored in HDFS. After completion of EMR steps, a count was run on the HBase table. In the EMR cluster with EMR WAL enabled, all records were successfully inserted without corruption. In the cluster not using EMR WALs, regions in HBase remained “OPENING” if the node hosting the meta was terminated. For other core node terminations, inserts failed, resulting in a lower record count during validation.

Understanding when EMR WAL read charges apply in HBase

In HBase, standard table read operations such as Get and Scan don’t access WALs. Therefore, EMR WAL read (GiB) charges are only incurred during operations that involve reading from WALs, such as:

  • Restoring data from EMR WALs in a newly launched cluster
  • Replaying WALs to recover data on a crashed RegionServer
  • Performing HBase replication, which involves reading WALs to replicate data across clusters

In a normal scenario, you’re billed only for the following two components related to EMR WAL usage:

  • EMR-WAL-WALHours – Represents the hourly cost of WAL storage, calculated based on the number of WALs maintained. You can use the EMRWALCount metric in Amazon CloudWatch to monitor the number of WALs and track associated usage over time.
  • EMR-WAL-WriteRequestGiB – This reflects the volume of data written to the WAL service, charged by the amount of data written in GiB.

For further details on pricing, refer to Amazon EMR pricing and Amazon EMR Release Guide.

To monitor and analyze EMR WAL related costs in the AWS Cost and Usage Reports (CUR), look under product_servicecode = ‘ElasticMapReduce’, where you’ll find the following product_usagetype entries associated with WAL usage:

  • USE1-EMR-WAL-ReadRequestGiB
  • USE1-EMR-WAL-WALHours
  • USE1-EMR-WAL-WriteRequestGiB

The prefix USE1 indicates the Region (in this case, us-east-1) and will vary depending on where your EMR cluster is deployed.

Summary

This new EMR WAL feature allows you to improve durability of your Amazon EMR HBase on S3 clusters, addressing critical workload scenarios by eliminating the need for streaming solutions for Availability Zone level service disruptions, streamlining processes for upgrading or rotating clusters, preventing data corruption during HBase auto scaling or node termination events, and resolving disk space issues associated with old WALs. Because many of the EMR WAL features are added on the latest releases of Amazon EMR, we recommend that customers use Amazon EMR version 7.9 or later to fully benefit from these improvements.


About the authors

Suthan Phillips is a Senior Analytics Architect at AWS, where he helps customers design and optimize scalable, high-performance data solutions that drive business insights. He combines architectural guidance on system design and scalability with best practices to ensure efficient, secure implementation across data processing and experience layers. Outside of work, Suthan enjoys swimming, hiking and exploring the Pacific Northwest.

Powering global payout intelligence: How MassPay uses Amazon Redshift Serverless and zero-ETL to drive deeper analytics.

Post Syndicated from Yossi Shlomo original https://aws.amazon.com/blogs/big-data/powering-global-payout-intelligence-how-masspay-uses-amazon-redshift-serverless-and-zero-etl-to-drive-deeper-analytics/

Since the company was founded in 2019, MassPay’s singular objective has been to deliver frictionless global payments that power innovation and lift people, businesses, and quality of life worldwide. Today, the MassPay payment orchestration offering empowers companies to move money across borders effortlessly; enabling local payment experiences in over 175 countries and 70 currencies—including digital wallets, locally preferred alternative payment methods, and cryptocurrencies. From hyper-localized checkout experiences to instant global payouts, we orchestrate seamless financial experiences that reflect how people and businesses transact around the world.

As we have expanded globally, so has the complexity of our data. In this blog post we shall cover how understanding real-time payout performance, identifying customer behavior patterns across regions, and optimizing internal operations required more than traditional business intelligence and analytics tools. And how since implementing Amazon Redshift and Zero-ETL, we’ve seen 90% reduction in data availability latency, payments data available for analytics 1.5x faster, leading to 45% reduction in time-to-insight and 37% fewer support tickets related to transaction visibility and payment inquiries.

Unlocking deeper payout intelligence and global insights

To continue our innovation—and to continue to exceed our partners’ and customers’ expectations—we knew we needed to go beyond basic reporting. We know success is dependent upon developing a truly data-driven organization. This means tracking granular KPIs across payout success rates, payment method adoption, transaction velocity, customer onboarding funnel drop-off, and support ticket correlation. We also wanted to better forecast customer payment expectations, monitor foreign exchange cost trends, and understand market-specific nuances such as how payout timing impacts seller satisfaction in social commerce ecosystems.

“We didn’t just want more data. We wanted faster, smarter insights that would shape decisions in real time. Being a data-driven organization means our teams don’t guess. They know. And that gives us, our partners, and our customers real operational and competitive advantages.”

– Yossi Schlomo, Director of Payment Systems Architecture

MySQL databases, CSV exports, and third-party reporting tools wouldn’t support the scale or speed we needed to deliver.

Choosing AWS: A scalable and integrated analytics foundation

We chose Amazon Web Services (AWS) for our data infrastructure and to accelerate our analytics capabilities.

At the core of our stack is Amazon Redshift Serverless with AI-driven scaling and optimizations enabled, which gives us scalable, fast, and cost-efficient analytics without the burden of managing infrastructure. Coupled with Amazon Aurora MySQL-Compatible Edition as our transactional data store and Amazon Redshift zero-ETL integration, we eliminated manual data pipelines altogether. Transactional data flows into Amazon Redshift in near real-time, instantly powering dashboards, alerts, and machine learning (ML) models.

This data feeds interactive dashboards—both internally and embedded within our platform for customers. Now, executives, operations leads, and customer success teams can drill into payout performance by region, merchant, or payment method, while customers get real-time visibility into their own payout analytics as part of our platform experience. The architecture is shown in the following figure.

MassPay Zero-ETL architecture with Amazon Redshift Serverless

MassPay Zero-ETL architecture with Amazon Redshift Serverless

Why it’s different and what it unlocked

Without Amazon Redshift Serverless and zero-ETL, we would have had to invest in costly custom data pipelines, maintain separate exchange, transform, and load (ETL) infrastructure, and manually manage data freshness. The integration with Aurora MySQL-Compatible is seamless and reduces our analytics latency from minutes to seconds.

“Our differentiator is simple: We operationalize not just transactions but analytics for global payments. Most platforms can tell you if a transaction went through. For payments and payouts, MassPay can tell you how fast it went, what it cost, what method was most effective, and what that means for your business in real time.”

– Yossi Schlomo, Director of Payment Systems Architecture

Embedded intelligence, built for scale

Every MassPay customer gets access to comprehensive payment analytics. These are accessed using our API or through a white-label dashboard (shown in the following figure). This detail is core to our product and central to our value proposition. As part of our go-to-market strategy, we showcase these capabilities in every demo, and they’ve proven to be key drivers in conversion and upsell conversations, especially with platforms targeting high-growth ecosystems.We use tiered pricing models based on transaction volume, and our embedded intelligence helps our partners and customers optimize usage and scale efficiently.

MassPay Dashboard

MassPay Dashboard

What we’ve gained

Since implementing Amazon Redshift and Zero-ETL, we’ve seen measurable results including:

  • 90% reduction in data availability latency and data available for analytics 1.5x faster
  • 45% reduction in time-to-insight across payment and payout intelligence reports
  • 37% fewer support tickets related to transaction visibility and payment inquiries
  • Real-time Net Promoter Score (NPS) tracking correlates with payout success metrics, driving faster resolution paths

What’s next

We’re now extending our analytics model to include more advanced ML-based payout failure prediction and ML-based payment authorization prediction, FX optimization alerts, partner-level and network-level benchmarking, and much more.

Conclusion

MassPay isn’t just payments. We aren’t just payouts. We are the engine powering modern commerce. With AWS, we’re turning complex global payments infrastructure into a smart, transparent, and scalable platform for insights. For our partners, and for our customers, this means better decisions, faster payment processing, faster payouts, and truly global reach without guesswork.

We encourage you to leverage below resources to explore these features further


About the authors

Yossi Shlomo serves as the Director of Payment Systems Architecture at MassPay. Yossi is an expert in credit card payment systems, PCI compliance, and secure transaction architecture, helping global platforms process payments at scale with confidence. He specializes in building scalable, cloud-based transaction systems and optimizing global payment gateways for performance and reliability.

Milind Oke is a Amazon Redshift and SageMaker Lakehouse specialist Solutions Architect as AWS. He is based out of New York and has been building enterprise data platforms, data warehousing, and analytics solutions for customers across various domains over two decades. In the 5 years with AWS, Milind has been a speaker at worldwide technical conferences and is co-author of Amazon Redshift: The Definitive Guide: Jump-Start Analytics Using Cloud Data Warehousing 1st Edition.

Security updates for Monday

Post Syndicated from jake original https://lwn.net/Articles/1023501/

Security updates have been issued by Debian (espeak-ng, kitty, kmail-account-wizard, krb5, libreoffice, libvpx, net-tools, python-flask-cors, symfony, tcpdf, thunderbird, and twitter-bootstrap3), Fedora (chromium, dropbear, firefox, gstreamer1-plugins-bad-free, python-tornado, systemd, and thunderbird), Mageia (coreutils, deluge, glib2.0, and redis), Oracle (firefox, kernel, and systemd), Red Hat (firefox, kernel, kernel-rt, varnish, varnish:6, and zlib), SUSE (bind, curl, dnsdist, docker, ffmpeg-7, firefox, glibc, golang-github-prometheus-alertmanager, govulncheck-vulndb, icinga2, iputils, java-11-openjdk, java-1_8_0-ibm, kea, kernel, libopenssl-3-devel, libsoup, libxml2, nodejs-electron, open-vm-tools, openbao, perl-Net-Dropbox-API, pluto, poppler, postgresql14, postgresql15, postgresql16, postgresql17, python312-setuptools, runc, s390-tools, skopeo, sqlite3, thunderbird, and unbound), and Ubuntu (apport and libphp-adodb).

Key Takeaways from the Take Command Summit 2025: Risk Revolution – Proactive Strategies for Exposure Management

Post Syndicated from Rapid7 original https://blog.rapid7.com/2025/06/02/key-takeaways-from-the-take-command-summit-2025-risk-revolution-proactive-strategies-for-exposure-management/

Key Takeaways from the Take Command Summit 2025: Risk Revolution – Proactive Strategies for Exposure Management

At the Take Command 2025 Virtual Cybersecurity Summit, a standout session titled Risk Revolution brought together Rapid7 product leaders and ESG analyst Tyler Shields to unpack the evolution of exposure management — and how organizations can build more context-driven, proactive risk strategies.

Hosted by Ryan Blanchard, Senior Manager, Product Marketing at Rapid7, the panel featured:

  • Jane Man, Senior Director of Product Management, Rapid7
  • Jamie Douglas, Specialist, Rapid7
  • Tyler Shields, Principal Analyst, Risk and Vulnerability Management, ESG

Here are the key takeaways from the discussion, along with supporting insights from the post-event attendee survey.

From vulnerability management to exposure management

The session opened by distinguishing exposure management from traditional vulnerability management. Tyler Shields explained:

“Exposure management is the maturation of vulnerability management… It’s understanding risk, business context, and prioritizing accordingly.”

Rather than focusing solely on patching, exposure management is about knowing what to fix, why it matters, and who owns it and doing it continuously.

Visibility gaps are slowing teams down

Visibility was a central theme throughout the session. Jane Man noted:

“A lot of the customers we talk to still struggle with just identifying what they have.”

This challenge was echoed in the post-event survey, where 53% of respondents cited identifying unknown assets as the top challenge in their exposure management programs.

Tyler added:

“You can’t protect what you don’t know about. And you certainly can’t prioritize it.”

Prioritization must be contextual

Prioritization remains a major hurdle for many organizations. Jamie Douglas stressed that severity alone isn’t enough:

“You can have a critical vulnerability on a printer, but if it’s segmented and not internet-facing, is it really a priority?”

The team emphasized the importance of integrating business impact, asset criticality, exploitability, and ownership into the prioritization process.

“If you don’t tie risk to business context, you’re just chasing numbers,” Tyler noted.

It’s time to break down silos

A powerful moment in the session came when the panel discussed collaboration across functions. Jane shared:

“Security doesn’t operate in a vacuum. You need buy-in from engineering, cloud, compliance – everyone has a role in risk reduction.”

Without shared language and unified dashboards, visibility doesn’t translate into action. The speakers urged teams to build bridges with IT and DevOps to ensure findings are actually resolved, not just reported.

Survey: risk prioritization is lagging behind

In the survey, only 18% of respondents said their organizations integrate threat intelligence into exposure management “very effectively”, highlighting a clear opportunity to improve how teams prioritize risk with real-time context.

This stat reinforces the panel’s broader message: that exposure management isn’t a point-in-time project — it’s a continuous, evolving practice.

Watch the full session on demand

For a deeper dive into the frameworks, real-world examples, and exposure strategies discussed in this session, watch Risk Revolution on demand.

Watch the Full Session

The collective thoughts of the interwebz