След 4 одини проблеми с водата, най-накрая местните жители на Брестовица напипаха правилния начин за решаването на този пробем и той е ПРОТЕСТИ.
Ако обаче не знаем какъв е зародиша на проблема, да се скъсаме от протести, решение няма да има. Затова ще опиша основните точки, които имат отношение към решаването на проблема с водата на Брестовица.
Става въпрос за пари
Тук всички ще отбележат, че е много ясно, но да Ви кажа за какви конкретно пари става въпрос.
Без да съм хидроинженер, мога доста точно да предположа, че на село като Бретовица, подмяната на тръбите би струвало около 30 милиона лева. Поне на подобни села в други общини на които съм съдействал за финансиане беше толкова. Брестовица е доста по-голямо и затова съм завишил, но предполагам неоходимата сума е близка до тази.
Откъде може да дойдат тези пари?
Имайте предвид, че бюджета на Община Родопи е 52 млн лева. Тук влизат всички раходи, включтелно новата служебна кола на кмета на общината, новите фотоапарати за отразяване на ПР акциите, но също така и заплатите на учителите и закуските на деата в училище. Това е цялата сума.
Отделно предизборно беше теглен кредит от 7 млн лева.
Акцентирам на кредита, тъйкато той се прибавя към съществуващия вече такъв, което отрязва най-естествената възможност за финансиране на подмяната на тръбите на Брестовица, а именно финансиране чрез кредит.
Искам да припомня, че голяма част от кредита от 7 млн беше похарчен за други села или за разходи, покривани безплатно по Програмата за възстановяване и устойчивост. Нали помните каква еуфория и гордост настана след смяната на осветлението на селата? Беше отразено доста добре във ФБ и на страницата на всяко село от Община Родопи. Е тозно този разход нямаше смисъл да се прави, тъйкато се покриваха безплатно от въпросната Програма за възстановяване и устойчивост. И тук идва следващия проблем.
Общината няма капацитет да усвоява средства по програми и европейски проекти.
Като казвам няма капацитет, разбирайте интелектуален. Демонстрирах го достатъчно добре с горния пример с осветлението. Вместо администрацията да седне и да напише проект за финансиране, те теглят кредит. Както се казва – Те толкова си могат!
Ако поглднете отчета за бюджета ще видите, че миналата година има заложени 500 000 лева приходи от европейски проекти и 0 лева изпълнени. Това значи, че няма нито един проект.
Друг е въпросът, че 500 000 приходи от проекти е нищо за една община. Примерно осветлението на омразния гр. Пловдив в който всички от администрацията на Община Родопи се надпреварват да купуват апартаменти, има улично осветление изградено по Норвежката програма. Не знам дали в нашата община са чували за тази програма, но поне в отчетите и плановете за бюджета не се виждат такива планове.
Да обобщя до тук
След изтегления и рададен на други села предизборно кредит, Община Родопи не може да изтегли нов за водоснабдителната мрежа на Брестовица.
От досегашната работа и финансовите отчети е видно, че по програма средства също няма как да бъдат отпуснати. И това вече 4 години.
Моля използвайте приложената форма за записване на час за среща
[contact-form-7]
Средства от държавния бюджет
Предвид това, че предходните 2 най естествени начини за финансиране са недостъпни за Община Родопи, помощ от централния бюджет явно остава единствения начин на финансиране. Това, което забелязвам обаче в принципа на работа на общинската администрация е кастовия принцип. „Ти не си от нашите и затова за теб няма“ или обратното – „Ти си гласувал за нас, ще видим какво можем да направим“.
На същия принцип стоят нещата и в държавата. Избраме си Бате Бойко и едни фирми печелят. Идват ППДБ и правят чистка в администрацията и назначават свои.
За съжаление този принцип съществува от „време оно“, а в повечето случаи дори работи. Поне докато се се изчерпат парите.
В нашия случай парите са изчерпани. Борим се да влизаме в монетарния съюз и бюджетния дефецит е много важен, а пари за други разходи НЯМА.
Защото населението на Община Родопи си избра кмет от БСП. Няма лошо, но когато стане въпрос за пари, а принципа в държавното управление е същия като в нашата община, то тогав ана кой кмет да дадеш 30 милиона? На кмета на БСП или на твоя си кмет, който е избран от твоята партия?
Пак казвам – не се сърдете на управляващите. Те работят по същия начин както нашата администрация. За едни села има, за други няма. Брестовица е селото за което вече 4 години няма. Сега кметицата е „на г-н Михайлов“, но пари пак няма, ЗАЩОТО ВЕЧЕ ВСИЧКИ КМЕТОВЕ СА НА Г-Н МИХАЙЛОВ.
А баницата е малка. Не става да се разпредели, пък и на кредит сме яли досега.
Въпреки всичко решение има
И хората от Брестовица го намират. От моя опит с администрацията на Родопи съм разбрал едно – приесняват се единствено от обединени групи хора и лош ПР. Ако има начин нещо да се случи, то тов аще бъде само следствие на протести. Като не Ви чува кмета Михайлов, прескочете го. Протестирайте пред Областната управа. Там не са от БСП и ще имат изгода да се намесят. Пишете на Областния, идват избори това ще му е дивидент. Викайте повече телевизии, пишете във ФБ, идвайте на заседания на общинския съвет и поставяйте исканията си.
Говорете със съседите си, обединете се и изисквайте. Пари в бюджета както казах няма, няма и скоро да има. Този път с „мазнене“ във Фейсбук няма да стане. Ясно е, че много хора свикнаха на подаяния от кмета, но идва момента в който трябва да изискваш полагащото ти се.
Обединете се с други хора със същите проблеми в Община Родопи. Примерно комитета в Белащица. Хората и до референдум стигнаха. Тогава много други им се смяха, а общината се опита да го осуети, но сега става въпрос за вашите деца.
Нма да стане от един път, но няма друг начин. Пасивността не води до нищо добро. Положението е такова, че с ръкопляскане на ПР постовете на г-н Михайлов във ФБ няма да се случи. “Пари си трябват”, а парите следват проектите или интересите. След последното гласуване, интересът към вас явно е спаднал. Щом от 4 години е този проблем и пак гласуваме за още от същото, значи проблем няма.
Идват избори, използвайте ги. Ако ли не, заредете се с още 4 години търпение. За който трябва вода има достатъчно.
Васил Кендов – финансист Моля използвайте приложената форма за записване на час за среща
[contact-form-7]
Широко разпространено в България (а и в други страни) е убеждението, че увеличаването на наказанията е превенция срещу престъпността. Затова след всяко тежко престъпление, станало водеща тема в новинарските емисии, се чуват гласове за промяна на Наказателния кодекс (НК) и по-тежки присъди. Някои изразяват носталгия по законите от времето на хан Крум, когато за кражба са се рязали крайници, а националпопулисти като председателя на „Възраждане“ Костадин Костадинов дори искат връщане на смъртното наказание.
Два проблема плюс един
Проблемите с това популярно убеждение са два. Първо, то не почива на реални факти. В изследването на историка Стефан Иванов „От кражби до убийства. Криминалните престъпления в България (1944–1989 г.)“ например се доказва, че въпреки ефективното изпълнение на смъртни присъди, умишлените убийства по времето на социализма са дори повече, отколкото в посттоталитарния период.
Второ, въпреки това въпросното убеждение стои в основата на не една и две законови промени. Не поради некадърност на законотворците, а от чист популизъм, достигащ шизофренни висини. Например през 2020 г. отзвукът от катастрофата, при която загина журналистът Милен Цветков, стана повод ГЕРБ да предложи увеличаване на наказанията в НК за шофьори, употребили алкохол или наркотици. Две седмици по-късно партията представи концепция за наказателната политика за пет години напред, в която се казва: „Статистиката ясно сочи, че повишаването на размерите на наказанията не води до намаляване на престъпността.“
Към тези проблеми се прибавя и трети, местен – правосъдната система в България не изпълнява основната си функция да гарантира справедливо правосъдие в съответствие със законите. В такъв случай какво значение има колко строги са те? След като някои извършители на престъпления няма да бъдат осъдени, каквото и да са направили, а някои жертви на престъпления няма да получат не само справедливост, а дори и защита.
Защо е важно да говорим за Владислава Цариградска
Ако правосъдната система не е в състояние да защити един съдия, който просто се опитва да работи както трябва, тя не може да защити никого. Пример за такъв съдия e Владислава Цариградска. Одисеята си тя обобщава в писмо, което на 12 април изпраща до членовете на Висшия съдебен съвет и председателката на Върховния касационен съд, както и до медии. Татяна Ваксберг го обобщава:
Съдийката твърди, че я заплашват със смърт, а хората, които трябва да я защитят, все едно не я чуват. И така пет години.
В този период от пет години, в който се сменят трима главни прокурори, Цариградска работи в Районния съд в Луковит, а след това – в Окръжния съд в Плевен. Първоначално я заплашват Мартин Божанов, известен като Нотариуса, и хора около него, защото тя отказва да решава дела така, както той иска, и да си направи отвод по тях. Божанов дори отправя заплахи към нея в съдебната зала.
Следва компроматна кампания срещу Цариградска първоначално в ПИК, но тъй като съдийката продължава да не се подчинява, компроматите се множат и из други от „пеевските“ медии. Същевременно тя получава и заплахи. През 2020 г. е под охрана за 6 месеца, но охраната си тръгва, а заплахите постоянстват. Цариградска търси правата си в съда, не я държат в течение по хода на делата ѝ, но пък сайтът „Афера“ публикува части от нейни показания – значи се е сдобил с тях от вътрешен на съда човек.
След убийството на Мартин Божанов заплахите не престават, а стават все повече (над 70) и все по-страшни – че ако не „млъкне“, ще ѝ изкормят гениталиите, че съпругът и трите ѝ деца „ще са с бетонирани крака на дъното на язовира“ и т.н. Полицията задържа клошар, който беше обвинен, че е изпращал анонимни заплахи и до различни институции. Тази версия не изглежда реалистична – най-малкото заради упоритата слепота на правосъдната система за случая на Цариградска. А и например защото предупреждение „да се кротне“ идва също от човек на име Веселин Иванов – бивш служител в Дирекция „Публична комуникация“ при главния прокурор.
От средата на февруари 2024 г. Цариградска отново е с охрана, но след смяната на правителството отговорна за охраната в Министерството на правосъдието става представителка на прокуратурата. А прокуратурата години наред упорито отказва да разследва заплахите срещу съдийката. В писмото си Цариградска иска мерки, които да осигурят защита и правото на честно правосъдие както за нея, така и за всеки съдия, който е в подобна ситуация.
Репресии срещу други съдии
Съчетанието от компроматна война и излагане на риск на „непослушни“ съдии не е прецедент, независимо на колко висока позиция се намират те. Лозан Панов, който беше председател на Върховния касационен съд между 2015 и 2020 г., беше редовен обект на компромати в „пеевските“ медии. В писмото си Владислава Цариградска припомня протеста срещу него през 2017 г., който се запомни с одраните агнешки главички. След години Любена Павлова – тогава бъдеща, а днес бивша съпруга на Петьо Петров, известен като Еврото – призна, че е организирала протеста по поръчка на Еврото, чието име нашумя покрай аферата „Осемте джуджета“.
Цариградска припомня и част от перипетиите на съдия Мирослава Тодорова. През 2021 г. Европейският съд по правата на човека (ЕСПЧ) осъди България заради дисциплинарни производства срещу съдийката в периода 2011–2012 г. Тя е уволнена през 2012 г., а през 2013 г. е възстановена на работа, но на по-ниска длъжност за една година.
Обвиненията срещу Тодорова са скалъпени, а истинската причина е, че по онова време тя е председателка на Съюза на съдиите в България – неправителствена организация, позволяваща си критични позиции по отношение на правосъдната система. През 2012 г. организацията излиза с остра реакция срещу назначаването на Владимира Янева за председател на Софийския градски съд. На следващия ден Мирослава Тодорова е уволнена.
Затова ЕСПЧ отсъжда, че по отношение на нея е нарушена Европейската конвенция за правата на човека, по силата на която, казано накратко, човек не може да бъде наказван по причини, различни от описаните в закона, по който е наказан. Обвиненията срещу Тодорова са, че бави делата си, но по същество „наложените ѝ санкции са представлявали намеса в упражняването на правото ѝ на свобода на изразяване“.
Янева впрочем също е уволнена през 2015 г. , а после – осъдена условно. Причината е, че е разрешавала незаконно подслушване. Името ѝ беше замесено в редица скандали, свързани с отношенията между политическата власт и прокуратурата – достатъчно е да си спомним за „опраскването“ и „двете каки“.
С това обаче репресиите срещу Мирослава Тодорова от страна на върховете на правосъдната система не престават. През 2019 г. Инспекторатът на Висшия съдебен съвет (ИВСС) публикува онлайн, както всяка година, имотните декларации на съдиите. От всички над 4400 декларации само тази на Тодорова е с незаличени лични данни. Така ЕГН-то, адресът и номерът на личната ѝ карта стават общодостъпни (включително за хората, които е осъдила), както и ЕГН-тата на нейния партньор и непълнолетния ѝ син – в противоречие със Закона за защита на личните данни.
Според ИВСС става въпрос за „пропуск“. Файлът с декларацията на Тодорова е озаглавен NE SE CHISTIIIIIIIIIIIIIIIIII, което навежда на мисълта, че съответната информация умишлено не е изчистена и ИВСС нарочно е изложил съдийката на риск.
Потребност от възстановително правосъдие
Освен че правосъдната система ги репресира, защото имат дързостта да работят съвестно и да имат високи професионални стандарти, между Владислава Цариградска и Мирослава Тодорова има още нещо общо – и двете застават зад принципите на възстановителното правосъдие. Това означава не просто извършителите на престъпление да бъдат наказани, а да имат възможност да компенсират поне отчасти стореното и да помогнат на жертвите.
„Това не значи някой да бъде освободен от отговорност, означава да се намесиш и да подпомогнеш след това съвместното живеене на хората“, разяснява Владислава Цариградска пред „Свободна Европа“. В статия за „Тоест“ съдиите Мирослава Тодорова и Калин Калпакчиев дефинират възстановителното правосъдие като „способ да видиш другия като пълноценно човешко същество“.
Да си представим правосъдна система, в която хората носят отговорност за престъпленията си, но тя не се свежда до изолиране от обществото и издевателства в затвора, а включва сериозни усилия за превъзпитание и възможност за компенсиране на щетите впоследствие.
В тази система Мартин Божанов не е оръжие за кални поръчки, докато стане неудобен и съответно бъде убит, а просто далавераджия и имотен измамник. След като е осъден и излежава намален срок на присъдата си, защото се съгласява да премине през рехабилитационна програма, той се свързва, с посредничеството на медиатор, със свои жертви и им помага. На единия прави ремонт в дома, който преди се е опитал незаконно да отнеме. На друг помага да си отвори кафене, понеже има опит в това. И той е жив и доволен от живота си, и потърпевшите са компенсирани, и правосъдната система си е свършила работата.
Ще си кажете: проблемът не е, че нямаме възстановително правосъдие, а че и това правосъдие, което имаме, не работи справедливо и не успява да гарантира справедливост дори за онези, които го практикуват. Прави сте, знам. От друга страна обаче, ако една система не функционира, може би трябва да бъде конструирана по друг начин. И след като по-строгите наказания така и така не дават желания ефект, защо да не пробваме с добро?
Водещо изображение: Владислава Цариградска в студиото на „Здравей, България“ по Нова телевизия
The Internet has a plethora of moving parts: routers, switches, hubs, terrestrial and submarine cables, and connectors on the hardware side, and complex protocol stacks and configurations on the software side. When something goes wrong that slows or disrupts the Internet in a way that affects your customers, you want to be able to localize and understand the issue as quickly as possible.
New Map The new Amazon CloudWatch Internet Weather Map is here to help! Built atop of collection of global monitors operated by AWS, you get a broad, global view of Internet weather, with the ability to zoom in and understand performance and availability issues that affect a particular city. To access the map, open the CloudWatch Console, expand Network monitoring on the left, and click Internet Monitor. The map appears and displays weather for the entire world:
The red and yellow circles indicate current, active issues that affect availability or performance, respectively. The grey circles represent issues that have been resolved within the last 24 hours, and the blue diamonds represent AWS regions. The map will automatically refresh every 15 minutes if you leave it on the screen.
Each issue affects a specific city-network, representing a combination of a location where clients access AWS resources, and the Autonomous System Number (ASN) that was used to access the resources. ASNs typically represent individual Internet Service Providers (ISPs).
The list to the right of the map shows active events at the top, followed by events that have been resolved in the recent past, looking back up to 24 hours:
I can hover my mouse over any of the indicators to see the list of city-networks in the geographic area:
If I zoom in a step or two, I can see that those city-networks are spread out over the United States:
I can zoom in even further and see a single city-network:
This information is also available programmatically. The new ListInternetEvents function returns up to 100 performance or availability events per call, with optional filtering by time range, status (ACTIVE or RESOLVED), or type (PERFORMANCE or AVAILABILITY). Each event includes full details including latitude and longitude.
The new map is accessible from all AWS regions and there is no charge to use it. Going forward, we have a lot of powerful additions on the roadmap, subject to prioritization based on your feedback. Right now we are thinking about:
Displaying causes of certain types of outages such as DDoS attacks, BGP route leaks, and issues with route interconnects.
Adding a view that is specific to a chosen ISP.
Displaying the impact to public SaaS applications.
Please feel free to send feedback on this feature to [email protected] .
CloudWatch Internet Monitor The information in the map applies to everyone who makes use of applications built on AWS. If you want to understand how internet weather affects your particular AWS applications and to take advantage of other features such as health event notification and traffic insights, you can make use of CloudWatch Internet Monitor. As my colleague Sébastien wrote when he launched this feature in late 2022:
You told us one of your challenges when monitoring internet-facing applications is to gather data outside of AWS to build a realistic picture of how your application behaves for your customers connected to multiple and geographically distant internet providers. Capturing and monitoring data about internet traffic before it reaches your infrastructure is either difficult or very expensive.
After you review the map, you can click Create monitor to get started with CloudWatch Internet Monitor:
After that you enter a name for your monitor, choose the AWS resources (VPCs, CloudFront distributions, Network Load Balancers, and Amazon WorkSpace Directories) to monitor, then select the desired percentage of internet-facing traffic to monitor. The monitor will begin to operate within minutes, using entries from your VPC Flow Logs, CloudFront Access Logs, and other telemetry to identify the most relevant city-networks.
Here are some resources to help you learn more about this feature:
The recent XZ backdoor has sparked a lot of discussion about how the open-source
community links and packages software. One possible
security improvement being discussed
is changing how
projects like systemd link to dynamic libraries that are only used for
optional functionality: using dlopen() to load those libraries only
when required. This could
shrink the attack surface exposed by dependencies, but the approach is not
without downsides — most prominently, it makes discovering which dynamic
libraries a program depends on harder.
On April 11, Lennart Poettering proposed one way to eliminate that problem
in a systemd RFC on GitHub.
Amazon Managed Workflows for Apache Airflow (Amazon MWAA) is a managed service for Apache Airflow that streamlines the setup and operation of the infrastructure to orchestrate data pipelines in the cloud. Customers use Amazon MWAA to manage the scalability, availability, and security of their Apache Airflow environments. As they design more intensive, complex, and ever-growing data processing pipelines, customers have asked us for additional underlying resources to provide greater concurrency and capacity for their tasks and workflows.
To address this, today, we are announcing the availability of larger environment classes in Amazon MWAA. In this post, we dive into the capabilities of these new XL and 2XL environments, the scenarios they are well suited for, and how you can set up or upgrade your existing Amazon MWAA environment to take advantage of the increased resources.
Current challenges
When you create an Amazon MWAA environment, a set of managed Amazon Elastic Container Service (Amazon ECS) with AWS Fargate containers are provisioned with defined virtual CPUs and RAM.
As you work with larger, complex, resource-intensive workloads, or run thousands of Directed Acyclic Graphs (DAGs) per day, you may start exhausting CPU availability on schedulers and workers, or reaching memory limits in workers. Running Apache Airflow at scale puts proportionally greater load on the Airflow metadata database, sometimes leading to CPU and memory issues on the underlying Amazon Relational Database Service (Amazon RDS) cluster. A resource-starved metadata database may lead to dropped connections from your workers, failing tasks prematurely.
To improve performance and resiliency of your tasks, consider following Apache Airflow best practices to author DAGs. As an alternative, you can create multiple Amazon MWAA environments to distribute workloads. However, this requires additional engineering and management effort.
New environment classes
With today’s release, you can now create XL and 2XL environments in Amazon MWAA in addition to the existing environment classes. They have two and four times the compute, and three and six times the memory, respectively, of the current large Amazon MWAA environment instance class. These instances add compute and RAM linearly to directly improve capacity and performance of all Apache Airflow components. The following table summarizes the environment capabilities.
.
Scheduler and Worker CPU / RAM
Web Server
CPU / RAM
Concurrent Tasks
DAG Capacity
mw1.xlarge
8 vCPUs / 24 GB
4 vCPUs / 12 GB
40 tasks (default)
Up to 2000
mw1.2xlarge
16 vCPUs / 48 GB
8 vCPUs / 24 GB
80 tasks (default)
Up to 4000
With the introduction of these larger environments, your Amazon Aurora metadata database will now use larger, memory-optimized instances powered by AWS Graviton2. With the Graviton2 family of processors, you get compute, storage, and networking improvements, and the reduction of your carbon footprint offered by the AWS family of processors.
Pricing
Amazon MWAA pricing dimensions remains unchanged, and you only pay for what you use:
The environment class
Additional worker instances
Additional scheduler instances
Metadata database storage consumed
You now get two additional options in the first three dimensions: XL and 2XL for environment class, additional workers, and schedulers instances. Metadata database storage pricing remains the same. Refer to Amazon Managed Workflows for Apache Airflow Pricing for rates and more details.
Observe Amazon MWAA performance to plan scaling to larger environments
Before you start using the new environment classes, it’s important to understand if you are in a scenario that relates to capacity issues, such as metadata database out of memory, or workers or schedulers running at high CPU usage. Understanding the performance of your environment resources is key to troubleshooting issues related to capacity. We recommend following the guidance described in Introducing container, database, and queue utilization metrics for the Amazon MWAA environment to better understand the state of Amazon MWAA environments, and get insights to right-size your instances.
In the following test, we simulate a high load scenario, use the CloudWatch observability metrics to identify common problems, and make an informed decision to plan scaling to larger environments to mitigate the issues.
During our tests, we ran a complex DAG that dynamically creates over 500 tasks and uses external sensors to wait for a task completion in a different DAG. After running on an Amazon MWAA large environment class with auto scaling set up to a maximum of 10 worker nodes, we noticed the following metrics and values in the CloudWatch dashboard.
The worker nodes have reached maximum CPU capacity, causing the number of queued tasks to keep increasing. The metadata database CPU utilization has peaked at over 65% capacity, and the available database free memory has been reduced. In this situation, we could further increase the worker nodes to scale, but that would put additional load on the metadata database CPU. This might lead to a drop in the number of worker database connections and available free database memory.
With new environment classes, you can vertically scale to increase available resources by editing the environment and selecting a higher class of environment, as shown in the following screenshot.
From the list of environments, we select the one in use for this test. Choose Edit to navigate to the Configure advanced settings page, and select the appropriate xlarge or 2xlarge environment as required.
After you save the change, the environment upgrade will take 20–30 minutes to complete. Any running DAG that got interrupted during the upgrade is scheduled for a retry, depending on the way you configured the retries for your DAGs. You can now choose to invoke them manually or wait for the next scheduled run.
After we upgraded the environment class, we tested the same DAG and observed the metrics were showing improved values because more resources are now available. With this XL environment, you can run more tasks on fewer worker nodes, and therefore the number of queued tasks kept decreasing. Alternately, if you have tasks that require more memory and/or CPU, you can reduce the tasks per worker, but still achieve a high number of tasks per worker with a larger environment size. For example, if you have a large environment where the worker node CPU is maxed out with celery.worker_autoscale (the Airflow configuration that defines the number of tasks per worker) Set at 20,20, you can increase to an XL environment and set celery.worker_autoscale to 20,20 on the XL, rather than the default 40 tasks per worker on an XL environment and the CPU load should reduce significantly.
Amazon MWAA XL and 2XL environment classes are available today in all Regions where Amazon MWAA is currently available.
Conclusion
Today, we are announcing the availability of two new environment classes in Amazon MWAA. With XL and 2XL environment classes, you can orchestrate larger volumes of complex or resource-intensive workflows. If you are running DAGs with a high number of dependencies, running thousands of DAGs across multiple environments, or in a scenario that requires you to heavily use workers for compute, you can now overcome the related capacity issues by increasing your environment resources in a few straightforward steps.
In this post, we discussed the capabilities of the two new environment classes, including pricing and some common resource constraint problems they solve. We provided guidance and an example of how to observe your existing environments to plan scaling to XL or 2XL, and we described how you can upgrade existing environments to use the increased resources.
Apache, Apache Airflow, and Airflow are either registered trademarks or trademarks of the Apache Software Foundation in the United States and/or other countries.
About the Authors
Hernan Garcia is a Senior Solutions Architect at AWS based in the Netherlands. He works in the financial services industry, supporting enterprises in their cloud adoption. He is passionate about serverless technologies, security, and compliance. He enjoys spending time with family and friends, and trying out new dishes from different cuisines.
Jeetendra Vaidya is a Senior Solutions Architect at AWS, bringing his expertise to the realms of AI/ML, serverless, and data analytics domains. He is passionate about assisting customers in architecting secure, scalable, reliable, and cost-effective solutions.
Sriharsh Adari is a Senior Solutions Architect at AWS, where he helps customers work backward from business outcomes to develop innovative solutions on AWS. Over the years, he has helped multiple customers on data platform transformations across industry verticals. His core area of expertise includes technology strategy, data analytics, and data science. In his spare time, he enjoys playing sports, watching TV shows, and playing Tabla.
Rapid7’s Insight Platform has officially achieved Level 2 Texas Risk and Authorization Management Program (TX-RAMP) authorization. This milestone marks a significant step forward in providing our customers peace-of-mind as well as the best end-to-end cloud security solutions.
According to the official TX-RAMP manual, Level 2 TX-RAMP authorization “is required for cloud computing services that store, process, or transmit confidential data of a state agency and the cloud computing service is determined to be moderate or high impact information resources.”
This authorization also signifies our unwavering commitment to cybersecurity compliance as well as the people, processes, and technology required to safeguard the confidential data of our customers and mitigate an ever-expanding attack surface.
Public-Sector Validation in Texas
Cloud security providers (CSPs) must keep pace with the ever-evolving variety of controls and requirements enacted at the state level, ensuring they continue to comply with statutory requirements for contracting with public-sector organizations (state agencies, higher-education institutions, etc.) in Texas – the world’s eighth largest economy.
As such, the Rapid7 Insight Platform will now be more readily available to customers across the state of Texas, empowering organizations to enhance and simplify security operations while delivering risk context across today’s hybrid environments. Multiple cross-functional teams within Rapid7 helped to drive this alignment to stringent and confidential data-security requirements.
What are We Looking to Achieve?
With this authorization, public-sector customers can leverage Rapid7’s Insight Platform to modernize security operations and visibility across key areas such as:
Vulnerability management
Detection and response
Application security
Cloud-native application protection
This approach to security helps cyber-defenders understand contextual risk at scale across the hybrid environment (on-premise, remote workers, cloud). They can also leverage cutting-edge AI to automate detections and the required remediations to mitigate critical vulnerabilities – saving time, money, and reputation. Achieving Level 2 TX-RAMP authorization reflects Rapid7’s continuing commitment to:
Aligning to regulatory and compliance standards set forth by governmental entities around the globe
Delivering best-in-class solutions that meet and exceed industry standards
Learn more about TX-RAMP and how Rapid7 is poised to lead the charge towards a safer, more secure digital future.
Fedora 40 Beta was released
on March 26, and the final release is nearing completion. So far,
the release is coming together nicely with major
updates for GNOME, KDE Plasma, and the usual cavalcade of
smaller updates and enhancements. As part of the release, the project also scuttled Delta
RPMs and OpenSSL 1.1.
Version
0.81 of the PuTTY SSH client is out with a fix for CVE-2024-31497;
some users will want to update and generate new keys:
PuTTY 0.81, released today, fixes a critical vulnerability
CVE-2024-31497 in the use of 521-bit ECDSA keys
(ecdsa-sha2-nistp521). If you have used a 521-bit ECDSA private
key with any previous version of PuTTY, consider the private key
compromised: remove the public key from authorized_keys files, and
generate a new key pair.
However, this only affects that one algorithm and key size. No
other size of ECDSA key is affected, and no other key type is
affected.
Today, we are announcing the availability of Anthropic’s Claude 3 Opus on Amazon Bedrock, the most intelligent Claude 3 model, with best-in-market performance on highly complex tasks. It can navigate open-ended prompts and sight-unseen scenarios with remarkable fluency and human-like understanding, leading the frontier of general intelligence.
With the availability of Claude 3 Opus on Amazon Bedrock, enterprises can build generative AI applications to automate tasks, generate revenue through user-facing applications, conduct complex financial forecasts, and accelerate research and development across various sectors. Like the rest of the Claude 3 family, Opus can process images and return text outputs.
Claude 3 Opus shows an estimated twofold gain in accuracy over Claude 2.1 on difficult open-ended questions, reducing the likelihood of faulty responses. As enterprise customers rely on Claude across industries like healthcare, finance, and legal research, improved accuracy is essential for safety and performance.
How does Claude 3 Opus perform? Claude 3 Opus outperforms its peers on most of the common evaluation benchmarks for AI systems, including undergraduate-level expert knowledge (MMLU), graduate-level expert reasoning (GPQA), basic mathematics (GSM8K), and more. It exhibits high levels of comprehension and fluency on complex tasks, leading the frontier of general intelligence.
Claude 3 Opus in action If you are new to using Anthropic models, go to the Amazon Bedrock console and choose Model access on the bottom left pane. Request access separately for Claude 3 Opus.
To test Claude 3 Opus in the console, choose Text or Chat under Playgrounds in the left menu pane. Then choose Select model and select Anthropic as the category and Claude 3 Opus as the model.
To test more Claude prompt examples, choose Load examples. You can view and run examples specific to Claude 3 Opus, such as analyzing a quarterly report, building a website, and creating a side-scrolling game.
By choosing View API request, you can also access the model using code examples in the AWS Command Line Interface (AWS CLI) and AWS SDKs. Here is a sample of the AWS CLI command:
aws bedrock-runtime invoke-model \
     --model-id anthropic.claude-3-opus-20240229-v1:0 \
     --body "{\"messages\":[{\"role\":\"user\",\"content\":[{\"type\":\"text\",\"text\":\" Your task is to create a one-page website for an online learning platform.\\n\"}]}],\"anthropic_version\":\"bedrock-2023-05-31\",\"max_tokens\":2000,\"temperature\":1,\"top_k\":250,\"top_p\":0.999,\"stop_sequences\":[\"\\n\\nHuman:\"]}" \
     --cli-binary-format raw-in-base64-out \
     --region us-east-1 \
     invoke-model-output.txt
Here is sample JavaScript code to send a Messages API request to generate text:
// claude_opus.js - Invokes Anthropic Claude 3 Opus using the Messages API.
import {
  BedrockRuntimeClient,
  InvokeModelCommand
} from "@aws-sdk/client-bedrock-runtime";

const modelId = "anthropic.claude-3-opus-20240229-v1:0";
const prompt = "Hello Claude, how are you today?";

// Create a new Bedrock Runtime client instance
const client = new BedrockRuntimeClient({ region: "us-east-1" });

// Prepare the payload for the model
const payload = {
  anthropic_version: "bedrock-2023-05-31",
  max_tokens: 1000,
  messages: [{
    role: "user",
    content: [{ type: "text", text: prompt }]
  }]
};

// Invoke Claude with the payload and wait for the response
const command = new InvokeModelCommand({
  contentType: "application/json",
  body: JSON.stringify(payload),
  modelId
});
const apiResponse = await client.send(command);

// Decode and print Claude's response
const decodedResponseBody = new TextDecoder().decode(apiResponse.body);
const responseBody = JSON.parse(decodedResponseBody);
const text = responseBody.content[0].text;
console.log(`Response: ${text}`);
Now, you can install the AWS SDK for JavaScript Runtime Client for Node.js and run claude_opus.js.
Welcome to the 17th edition of Cloudflare’s DDoS threat report. This edition covers the DDoS threat landscape along with key findings as observed from the Cloudflare network during the first quarter of 2024.
What is a DDoS attack?
But first, a quick recap. A DDoS attack, short for Distributed Denial of Service attack, is a type of cyber attack that aims to take down or disrupt Internet services such as websites or mobile apps and make them unavailable for users. DDoS attacks are usually done by flooding the victim’s server with more traffic than it can handle.
To learn more about DDoS attacks and other types of attacks, visit our Learning Center.
Accessing previous reports
Quick reminder that you can access previous editions of DDoS threat reports on the Cloudflare blog. They are also available on our interactive hub, Cloudflare Radar. On Radar, you can find global Internet traffic, attacks, and technology trends and insights, with drill-down and filtering capabilities, so you can zoom in on specific countries, industries, and networks. There’s also a free API allowing academics, data sleuths, and other web enthusiasts to investigate Internet trends across the globe.
To learn how we prepare this report, refer to our Methodologies.
2024 Q1 key insights
Key insights from the first quarter of 2024 include:
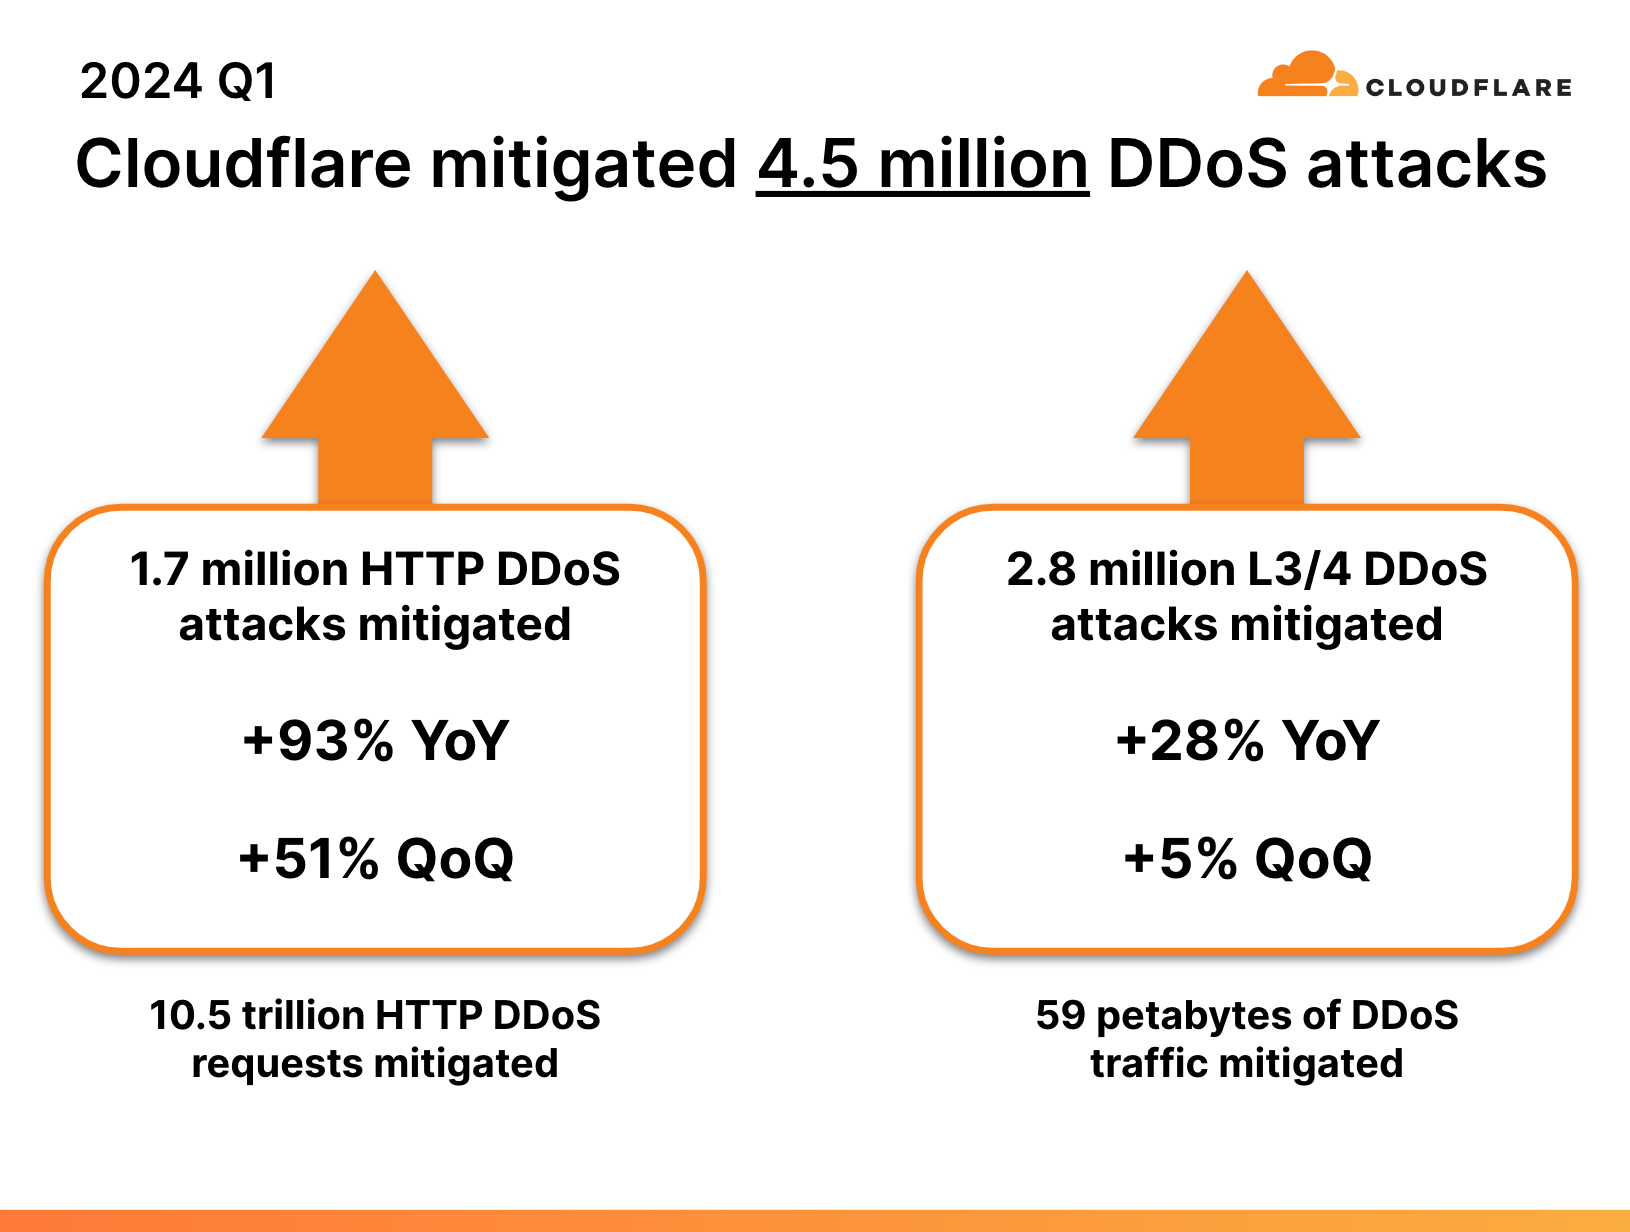
2024 started with a bang. Cloudflare’s defense systems automatically mitigated 4.5 million DDoS attacks during the first quarter — representing a 50% year-over-year (YoY) increase.
DNS-based DDoS attacks increased by 80% YoY and remain the most prominent attack vector.
DDoS attacks on Sweden surged by 466% after its acceptance to the NATO alliance, mirroring the pattern observed during Finland’s NATO accession in 2023.
Starting 2024 with a bang
We’ve just wrapped up the first quarter of 2024, and, already, our automated defenses have mitigated 4.5 million DDoS attacks — an amount equivalent to 32% of all the DDoS attacks we mitigated in 2023.
Breaking it down to attack types, HTTP DDoS attacks increased by 93% YoY and 51% quarter-over-quarter (QoQ). Network-layer DDoS attacks, also known as L3/4 DDoS attacks, increased by 28% YoY and 5% QoQ.
2024 Q1: Cloudflare mitigated 4.5 million DDoS attacks
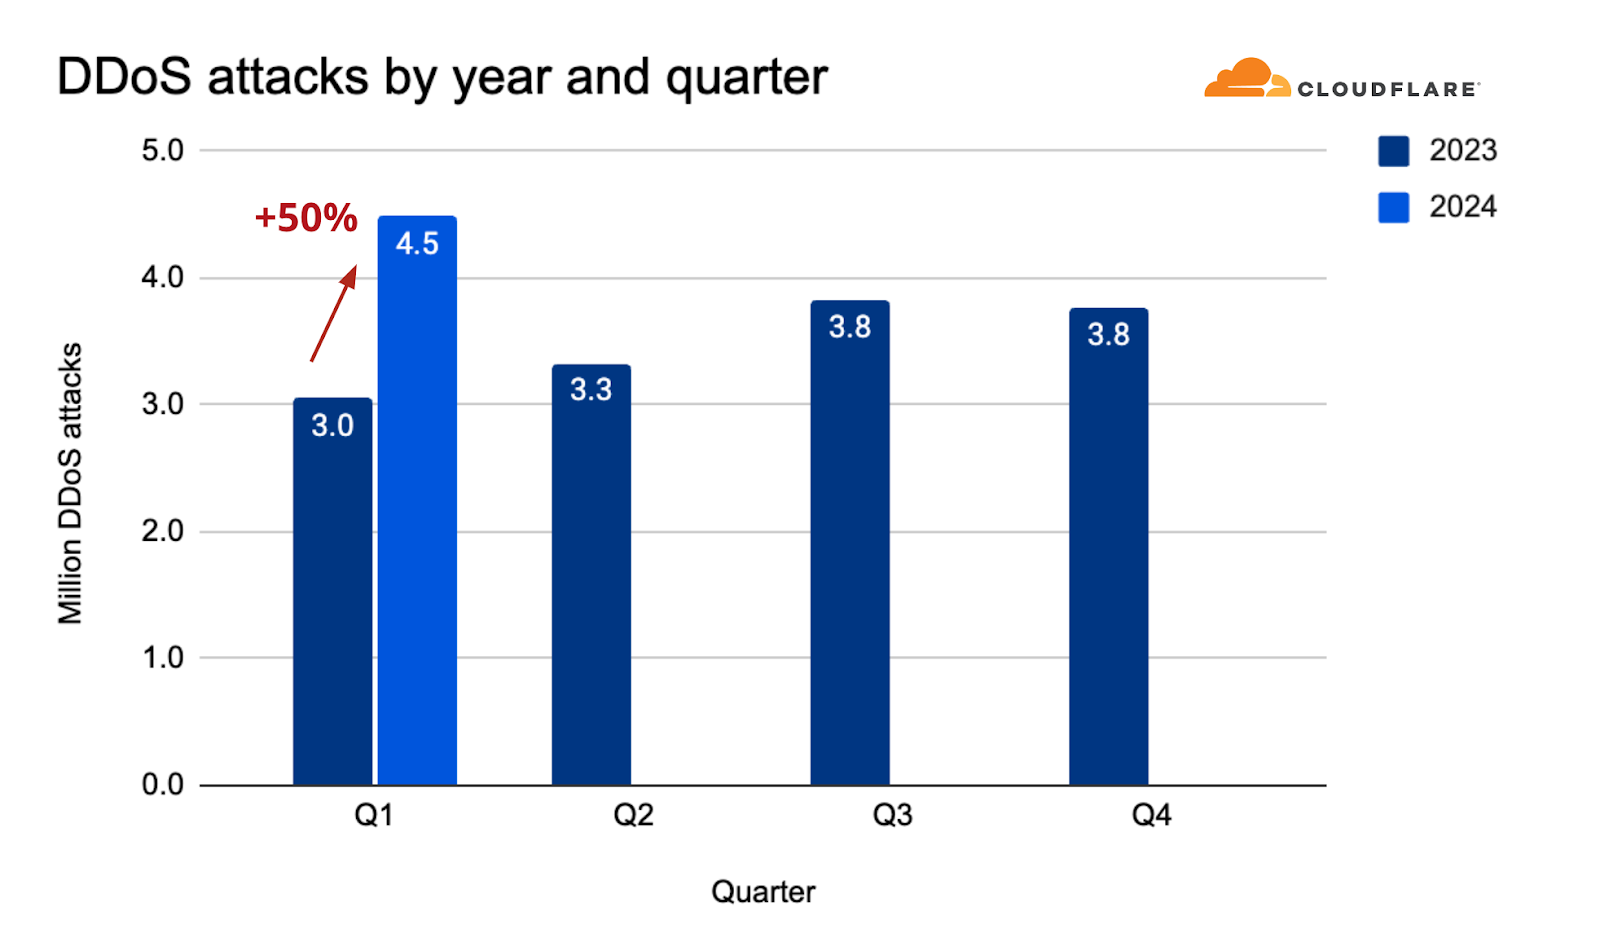
When comparing the combined number of HTTP DDoS attacks and L3/4 DDoS attacks, we can see that, overall, in the first quarter of 2024, the count increased by 50% YoY and 18% QoQ.
DDoS attacks by year and quarter
In total, our systems mitigated 10.5 trillion HTTP DDoS attack requests in Q1. Our systems also mitigated over 59 petabytes of DDoS attack traffic — just on the network-layer.
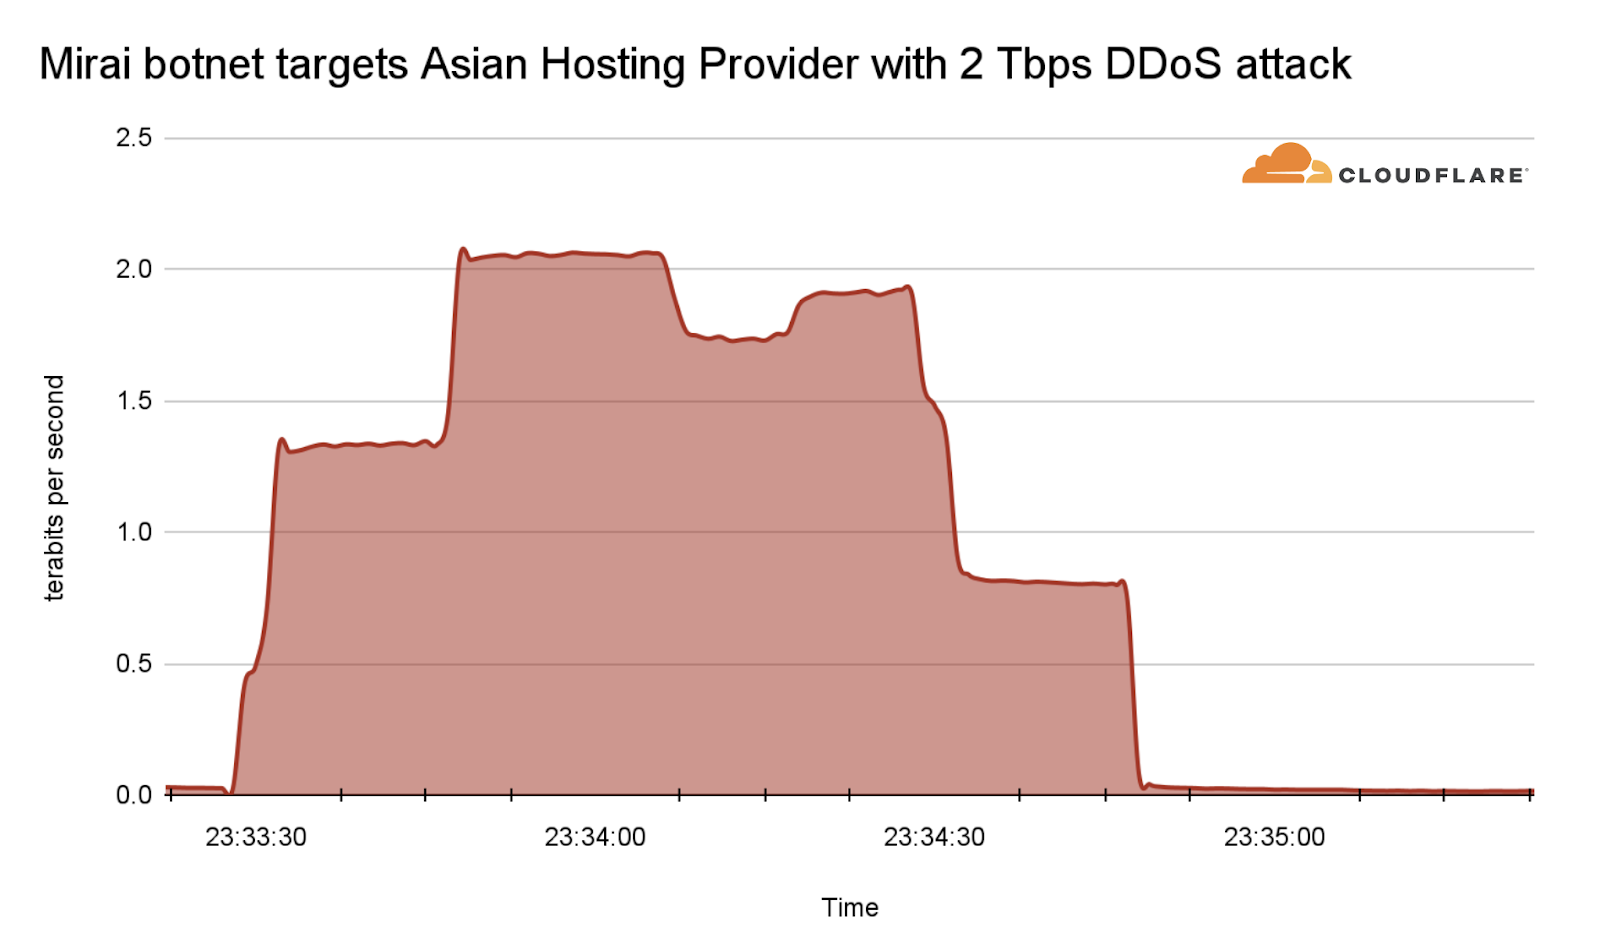
Among those network-layer DDoS attacks, many of them exceeded the 1 terabit per second rate — almost on a weekly basis. The largest attack that we have mitigated so far in 2024 was launched by a Mirai-variant botnet. This attack reached 2 Tbps and was aimed at an Asian hosting provider protected by Cloudflare Magic Transit. Cloudflare’s systems automatically detected and mitigated the attack.
The Mirai botnet, infamous for its massive DDoS attacks, was primarily composed of infected IoT devices. It notably disrupted Internet access across the US in 2016 by targeting DNS service providers. Almost eight years later, Mirai attacks are still very common. Four out of every 100 HTTP DDoS attacks, and two out of every 100 L3/4 DDoS attacks are launched by a Mirai-variant botnet. The reason we say “variant” is that the Mirai source code was made public, and over the years there have been many permutations of the original.
Mirai botnet targets Asian hosting provider with 2 Tbps DDoS attack
DNS attacks surge by 80%
In March 2024, we introduced one of our latest DDoS defense systems, the Advanced DNS Protection system. This system complements our existing systems, and is designed to protect against the most sophisticated DNS-based DDoS attacks.
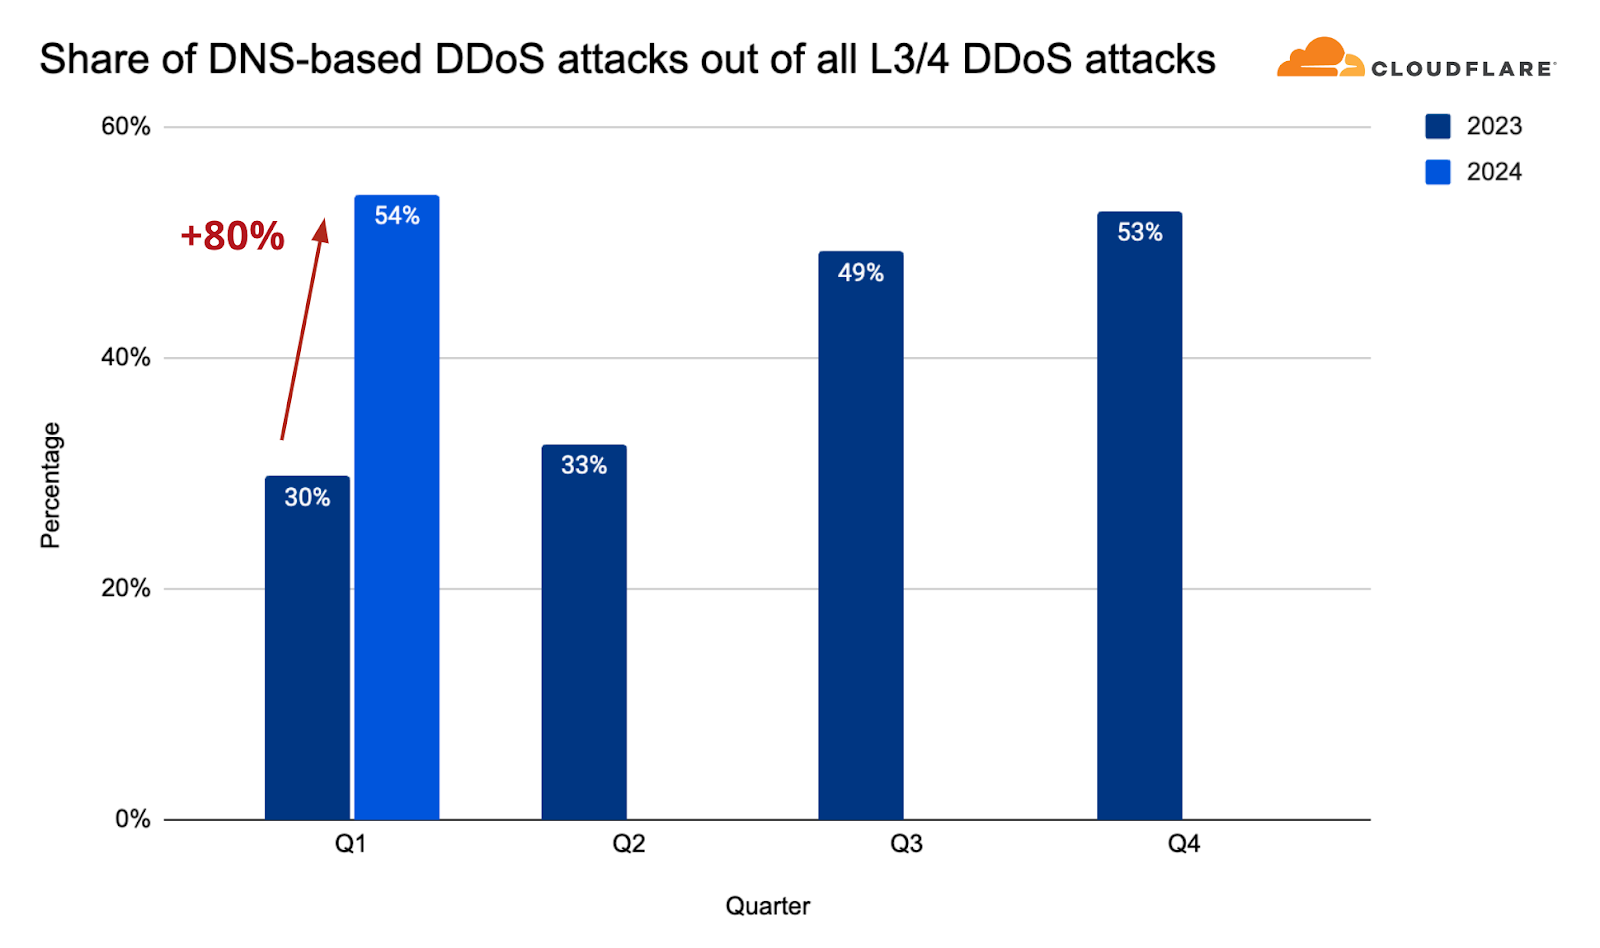
It is not out of the blue that we decided to invest in this new system. DNS-based DDoS attacks have become the most prominent attack vector and its share among all network-layer attacks continues to grow. In the first quarter of 2024, the share of DNS-based DDoS attacks increased by 80% YoY, growing to approximately 54%.
DNS-based DDoS attacks by year and quarter
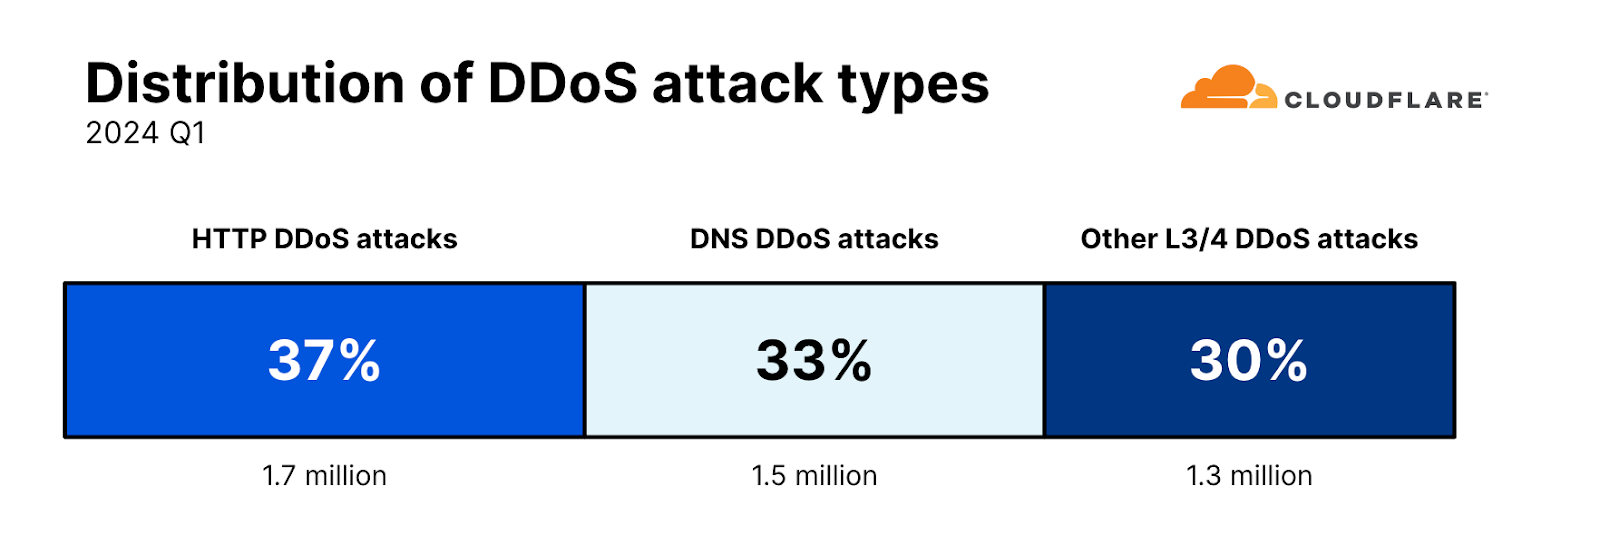
Despite the surge in DNS attacks and due to the overall increase in all types of DDoS attacks, the share of each attack type, remarkably, remains the same as seen in our previous report for the final quarter of 2023. HTTP DDoS attacks remain at 37% of all DDoS attacks, DNS DDoS attacks at 33%, and the remaining 30% is left for all other types of L3/4 attacks, such as SYN Flood and UDP Floods.
Attack type distribution
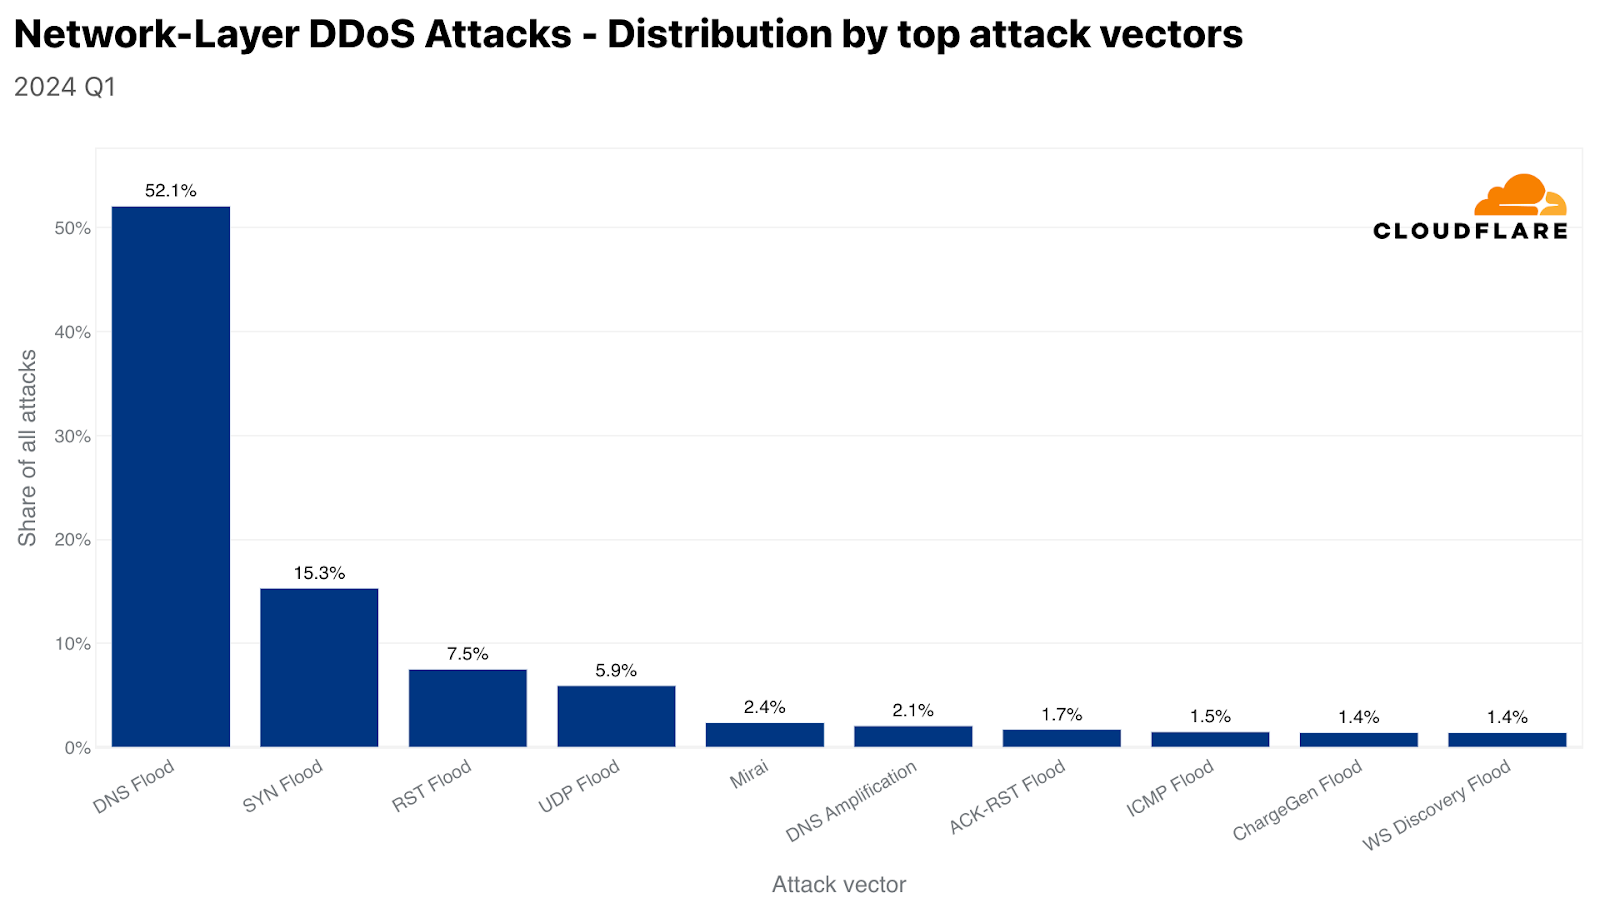
And in fact, SYN Floods were the second most common L3/4 attack. The third was RST Floods, another type of TCP-based DDoS attack. UDP Floods came in fourth with a 6% share.
Top attack vectors
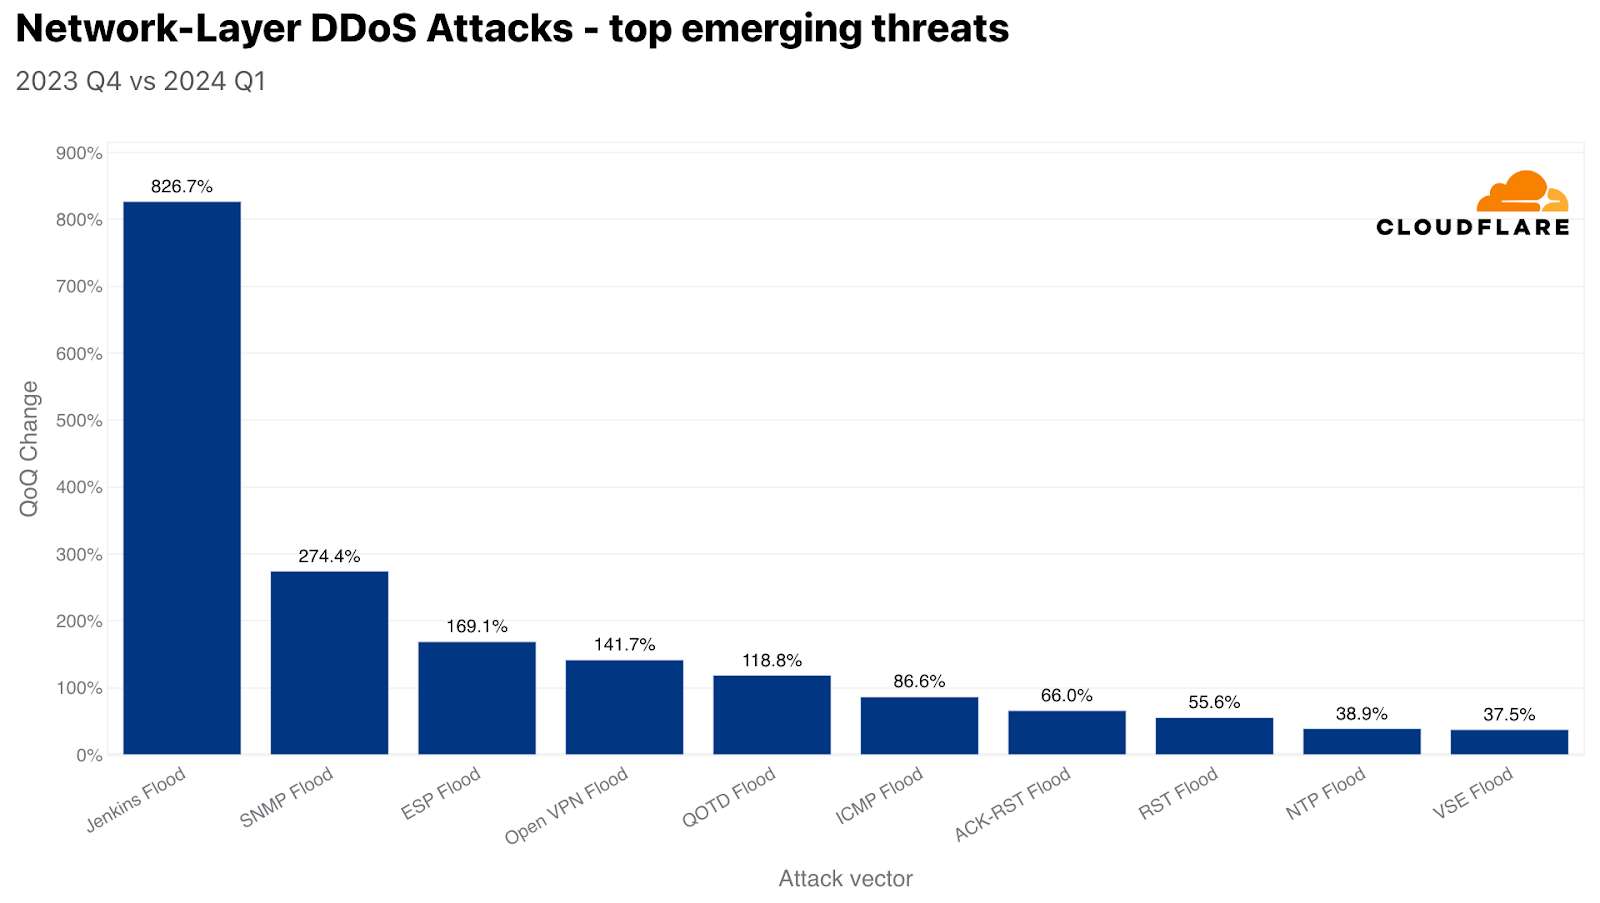
When analyzing the most common attack vectors, we also check for the attack vectors that experienced the largest growth but didn’t necessarily make it into the top ten list. Among the top growing attack vectors (emerging threats), Jenkins Flood experienced the largest growth of over 826% QoQ.
Jenkins Flood is a DDoS attack that exploits vulnerabilities in the Jenkins automation server, specifically through UDP multicast/broadcast and DNS multicast services. Attackers can send small, specially crafted requests to a publicly facing UDP port on Jenkins servers, causing them to respond with disproportionately large amounts of data. This can amplify the traffic volume significantly, overwhelming the target’s network and leading to service disruption. Jenkins addressed this vulnerability (CVE-2020-2100) in 2020 by disabling these services by default in later versions. However, as we can see, even 4 years later, this vulnerability is still being abused in the wild to launch DDoS attacks.
Attack vectors that experienced the largest growth QoQ
The HTTP/2 Continuation Flood vulnerability targets HTTP/2 protocol implementations that improperly handle HEADERS and multiple CONTINUATION frames. The threat actor sends a sequence of CONTINUATION frames without the END_HEADERS flag, leading to potential server issues such as out-of-memory crashes or CPU exhaustion. HTTP/2 Continuation Flood allows even a single machine to disrupt websites and APIs using HTTP/2, with the added challenge of difficult detection due to no visible requests in HTTP access logs.
This vulnerability poses a potentially severe threat more damaging than the previously known
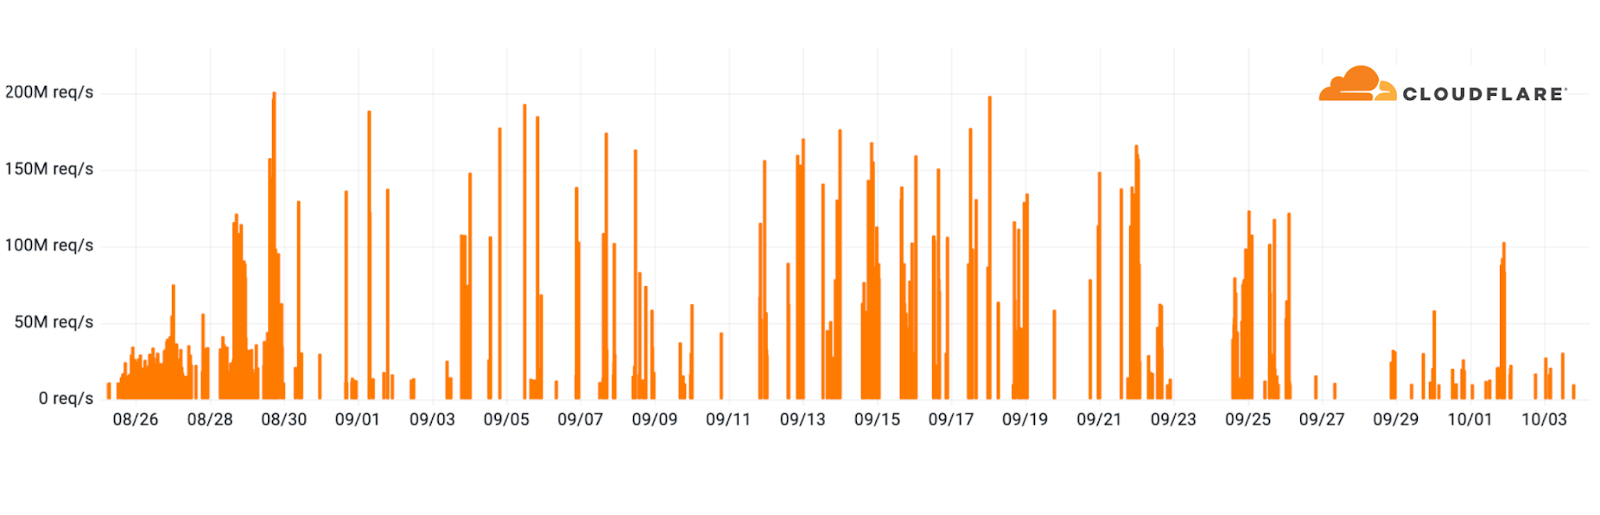
HTTP/2 Rapid Reset, which resulted in some of the largest HTTP/2 DDoS attack campaigns in recorded history. During that campaign, thousands of hyper-volumetric DDoS attacks targeted Cloudflare. The attacks were multi-million requests per second strong. The average attack rate in that campaign, recorded by Cloudflare, was 30M rps. Approximately 89 of the attacks peaked above 100M rps and the largest one we saw hit 201M rps. Additional coverage was published in our 2023 Q3 DDoS threat report.
HTTP/2 Rapid Reset campaign of hyper-volumetric DDoS attacks in 2023 Q3
Cloudflare’s network, its HTTP/2 implementation, and customers using our WAF/CDN services are not affected by this vulnerability. Furthermore, we are not currently aware of any threat actors exploiting this vulnerability in the wild.
Multiple CVEs have been assigned to the various implementations of HTTP/2 that are impacted by this vulnerability. A CERT alert published by Christopher Cullen at Carnegie Mellon University, which was covered by Bleeping Computer, lists the various CVEs:
Affected service
CVE
Details
Node.js HTTP/2 server
CVE-2024-27983
Sending a few HTTP/2 frames can cause a race condition and memory leak, leading to a potential denial of service event.
Envoy’s oghttp codec
CVE-2024-27919
Not resetting a request when header map limits are exceeded can cause unlimited memory consumption which can potentially lead to a denial of service event.
Tempesta FW
CVE-2024-2758
Its rate limits are not entirely effective against empty CONTINUATION frames flood, potentially leading to a denial of service event.
amphp/http
CVE-2024-2653
It collects CONTINUATION frames in an unbounded buffer, risking an out of memory (OOM) crash if the header size limit is exceeded, potentially resulting in a denial of service event.
Go’s net/http and net/http2 packages
CVE-2023-45288
Allows an attacker to send an arbitrarily large set of headers, causing excessive CPU consumption, potentially leading to a denial of service event.
nghttp2 library
CVE-2024-28182
Involves an implementation using nghttp2 library, which continues to receive CONTINUATION frames, potentially leading to a denial of service event without proper stream reset callback.
Apache Httpd
CVE-2024-27316
A flood of CONTINUATION frames without the END_HEADERS flag set can be sent, resulting in the improper termination of requests, potentially leading to a denial of service event.
Apache Traffic Server
CVE-2024-31309
HTTP/2 CONTINUATION floods can cause excessive resource consumption on the server, potentially leading to a denial of service event.
Envoy versions 1.29.2 or earlier
CVE-2024-30255
Consumption of significant server resources can lead to CPU exhaustion during a flood of CONTINUATION frames, which can potentially lead to a denial of service event.
Top attacked industries
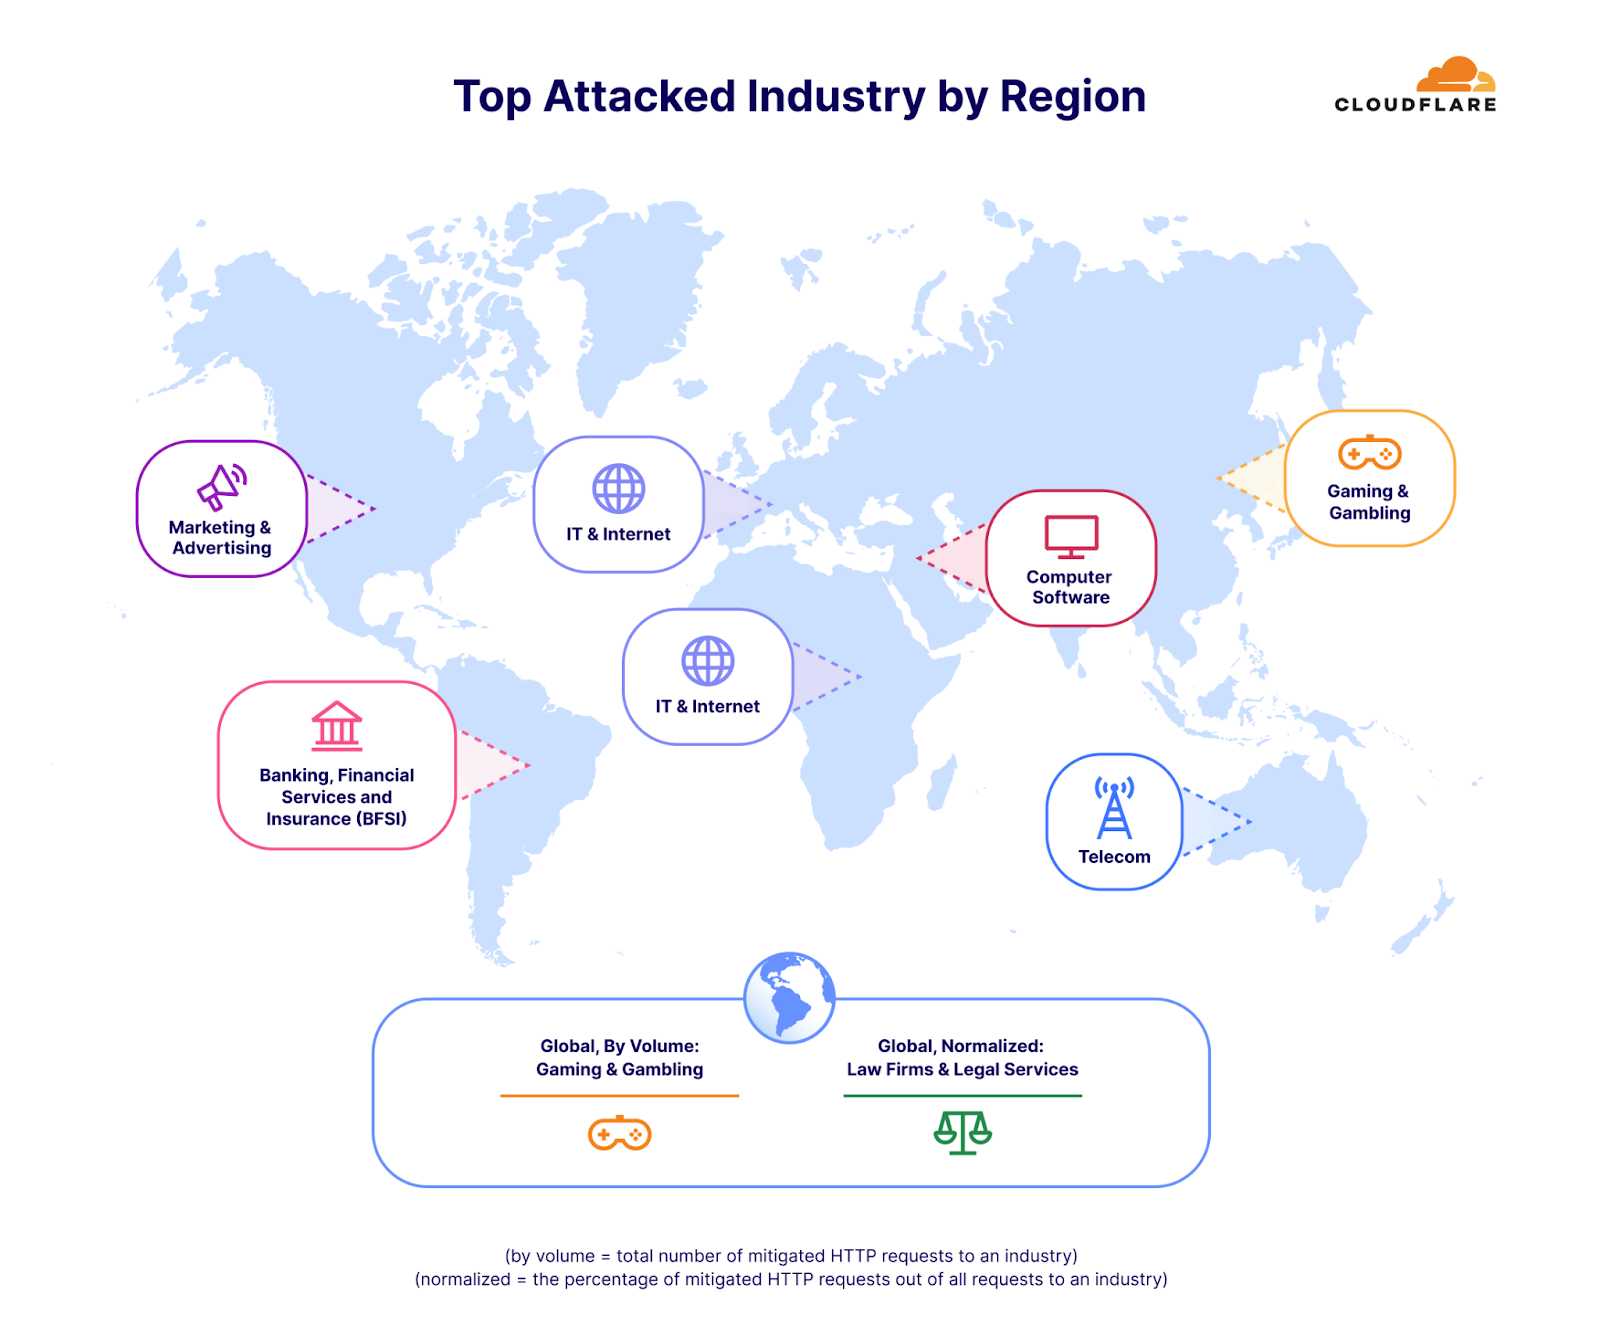
When analyzing attack statistics, we use our customer’s industry as it is recorded in our systems to determine the most attacked industries. In the first quarter of 2024, the top attacked industry by HTTP DDoS attacks in North America was Marketing and Advertising. In Africa and Europe, the Information Technology and Internet industry was the most attacked. In the Middle East, the most attacked industry was Computer Software. In Asia, the most attacked industry was Gaming and Gambling. In South America, it was the Banking, Financial Services and Insurance (BFSI) industry. Last but not least, in Oceania, was the Telecommunications industry.
Top attacked industries by HTTP DDoS attacks, by region
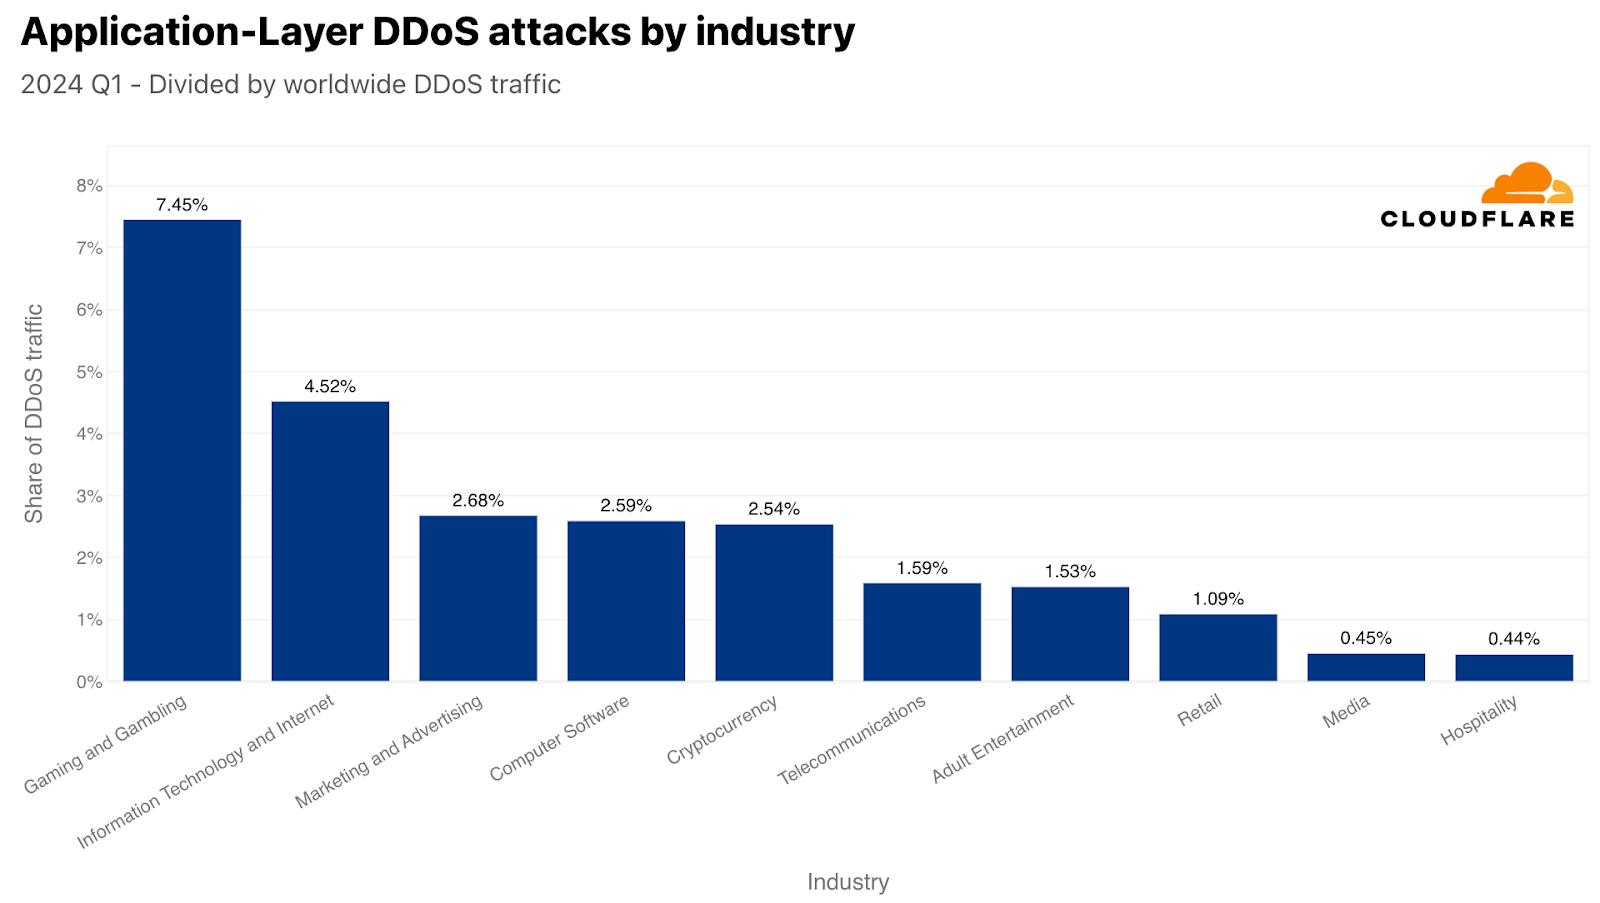
Globally, the Gaming and Gambling industry was the number one most targeted by HTTP DDoS attacks. Just over seven of every 100 DDoS requests that Cloudflare mitigated were aimed at the Gaming and Gambling industry. In second place, the Information Technology and Internet industry, and in third, Marketing and Advertising.
Top attacked industries by HTTP DDoS attacks
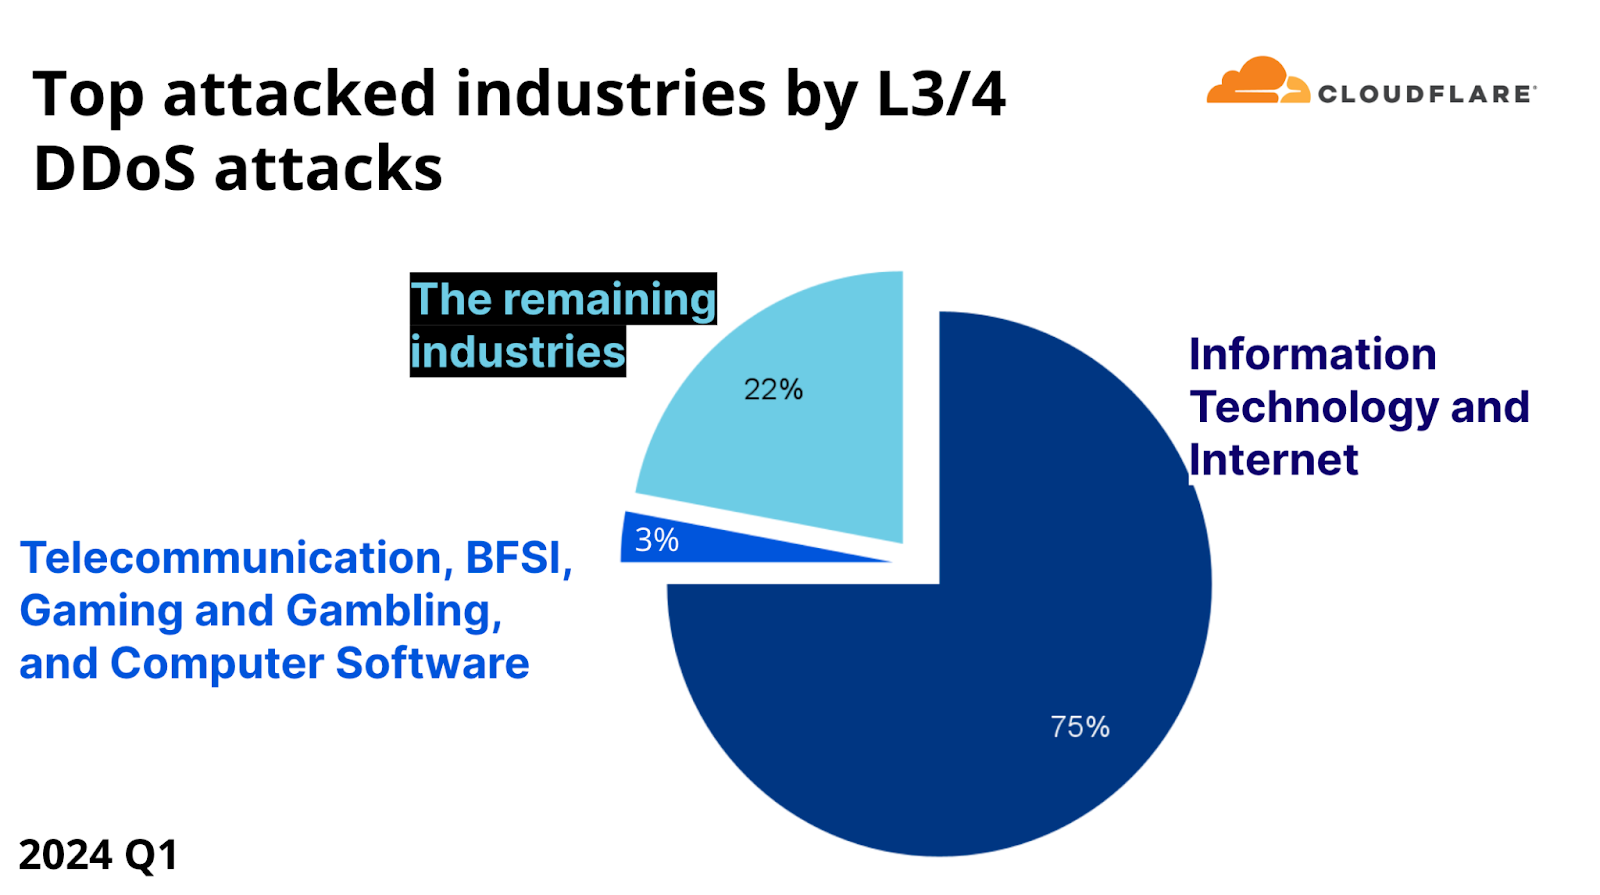
With a share of 75% of all network-layer DDoS attack bytes, the Information Technology and Internet industry was the most targeted by network-layer DDoS attacks. One possible explanation for this large share is that Information Technology and Internet companies may be “super aggregators” of attacks and receive DDoS attacks that are actually targeting their end customers. The Telecommunications industry, the Banking, Financial Services and Insurance (BFSI) industry, the Gaming and Gambling industry and the Computer Software industry accounted for the next three percent.
Top attacked industries by L3/4 DDoS attacks
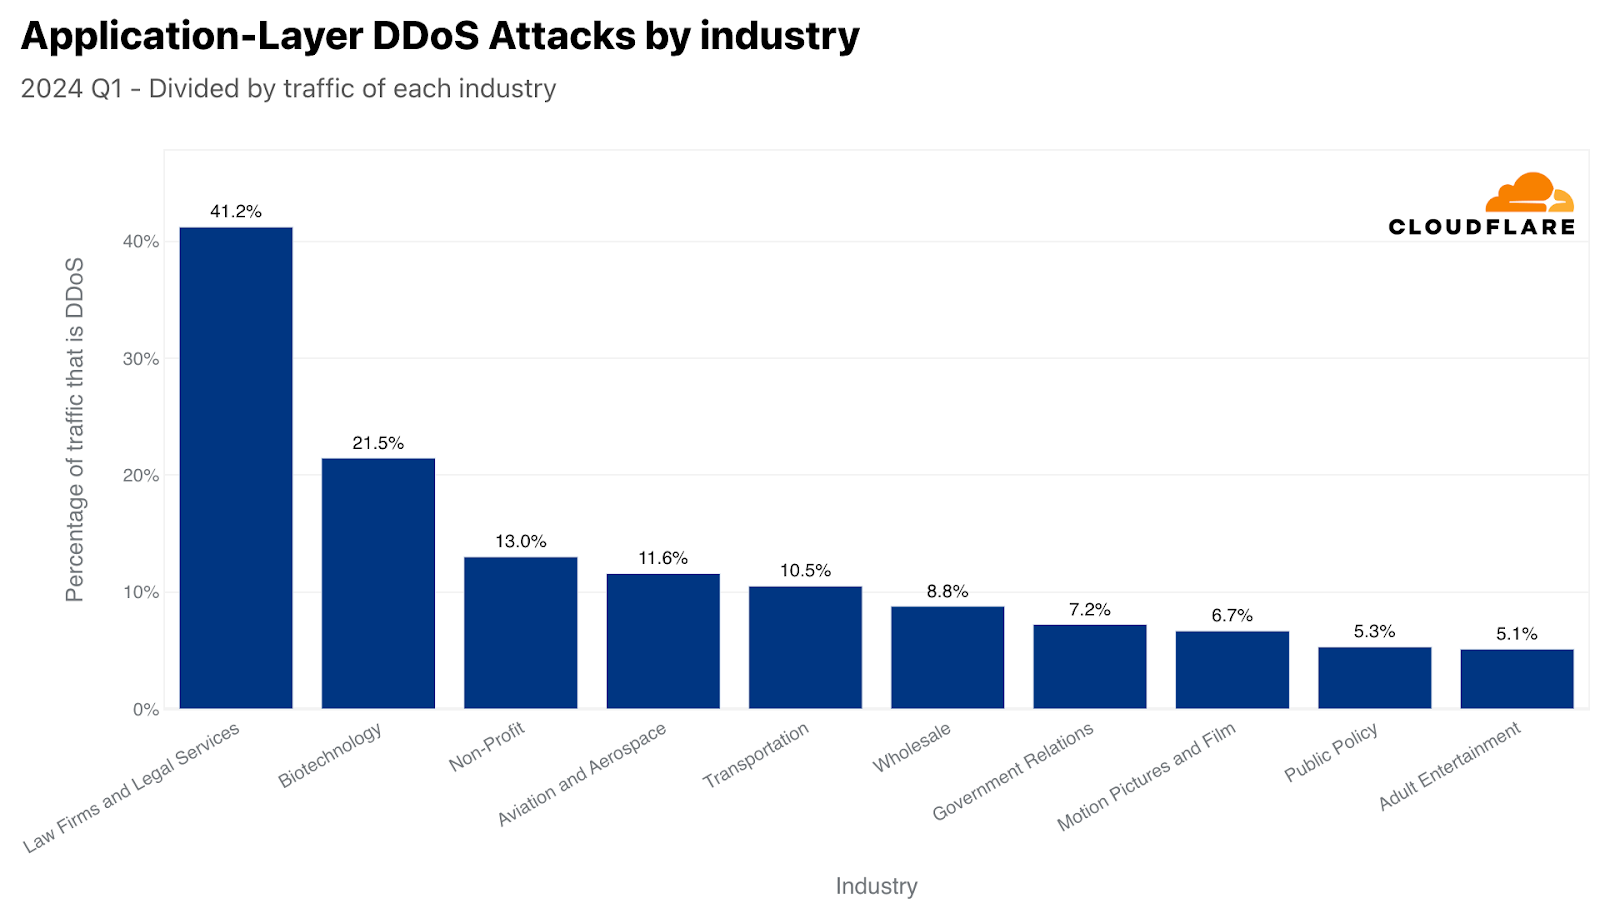
When normalizing the data by dividing the attack traffic by the total traffic to a given industry, we get a completely different picture. On the HTTP front, Law Firms and Legal Services was the most attacked industry, as over 40% of their traffic was HTTP DDoS attack traffic. The Biotechnology industry came in second with a 20% share of HTTP DDoS attack traffic. In third place, Nonprofits had an HTTP DDoS attack share of 13%. In fourth, Aviation and Aerospace, followed by Transportation, Wholesale, Government Relations, Motion Pictures and Film, Public Policy, and Adult Entertainment to complete the top ten.
Top attacked industries by HTTP DDoS attacks (normalized)
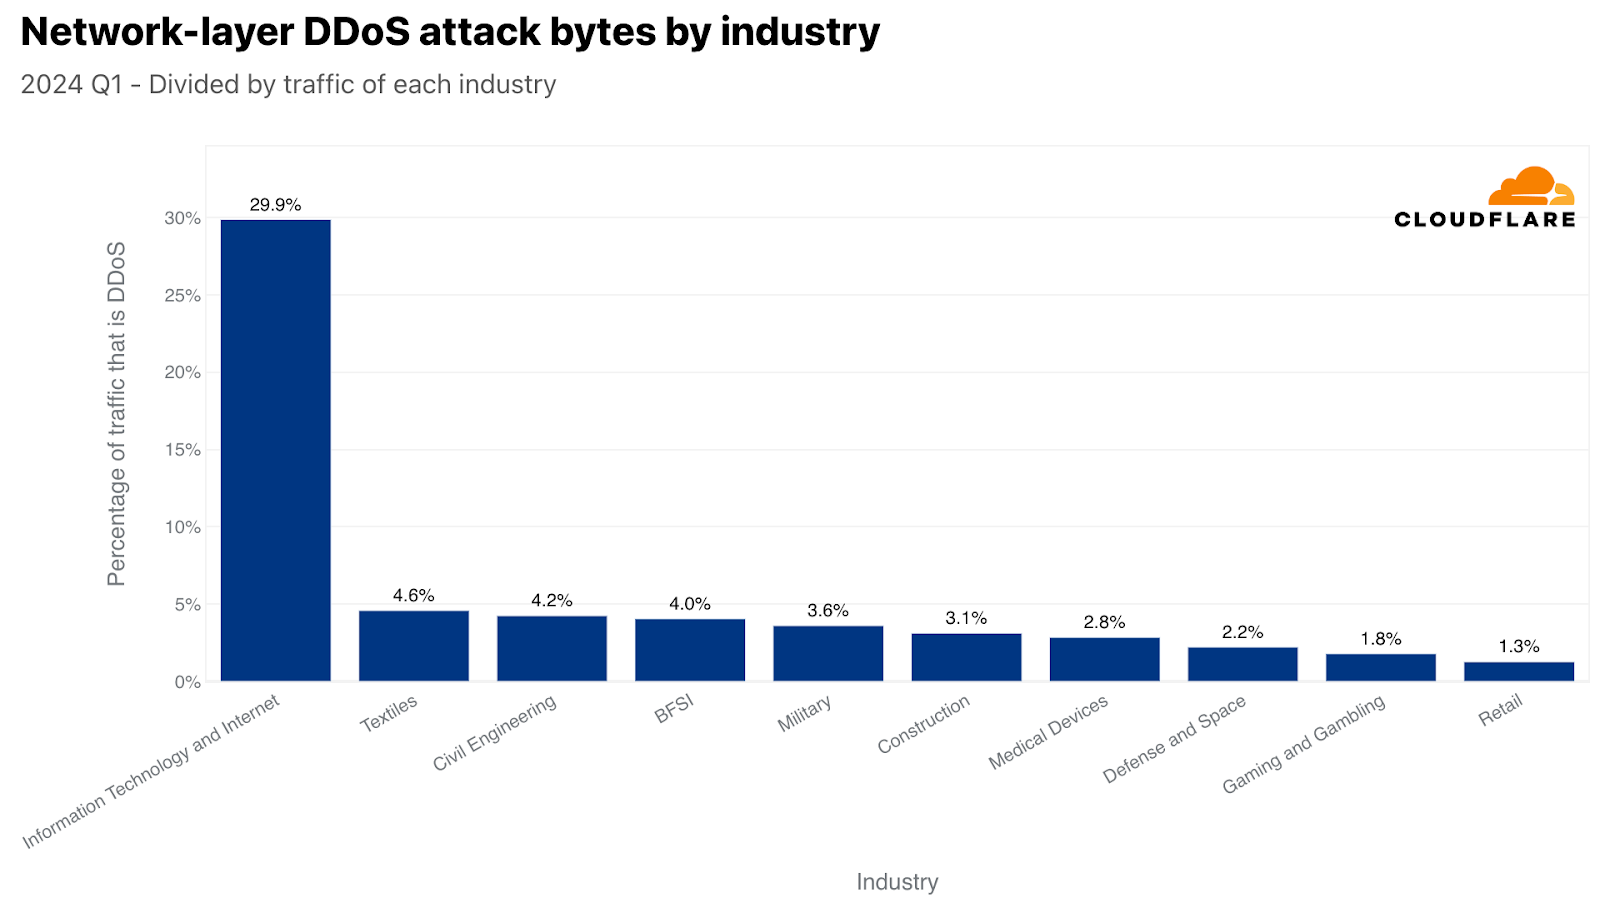
Back to the network layer, when normalized, Information Technology and Internet remained the number one most targeted industry by L3/4 DDoS attacks, as almost a third of their traffic were attacks. In second, Textiles had a 4% attack share. In third, Civil Engineering, followed by Banking Financial Services and Insurance (BFSI), Military, Construction, Medical Devices, Defense and Space, Gaming and Gambling, and lastly Retail to complete the top ten.
Top attacked industries by L3/4 DDoS attacks (normalized)
Largest sources of DDoS attacks
When analyzing the sources of HTTP DDoS attacks, we look at the source IP address to determine the origination location of those attacks. A country/region that’s a large source of attacks indicates that there is most likely a large presence of botnet nodes behind Virtual Private Network (VPN) or proxy endpoints that attackers may use to obfuscate their origin.
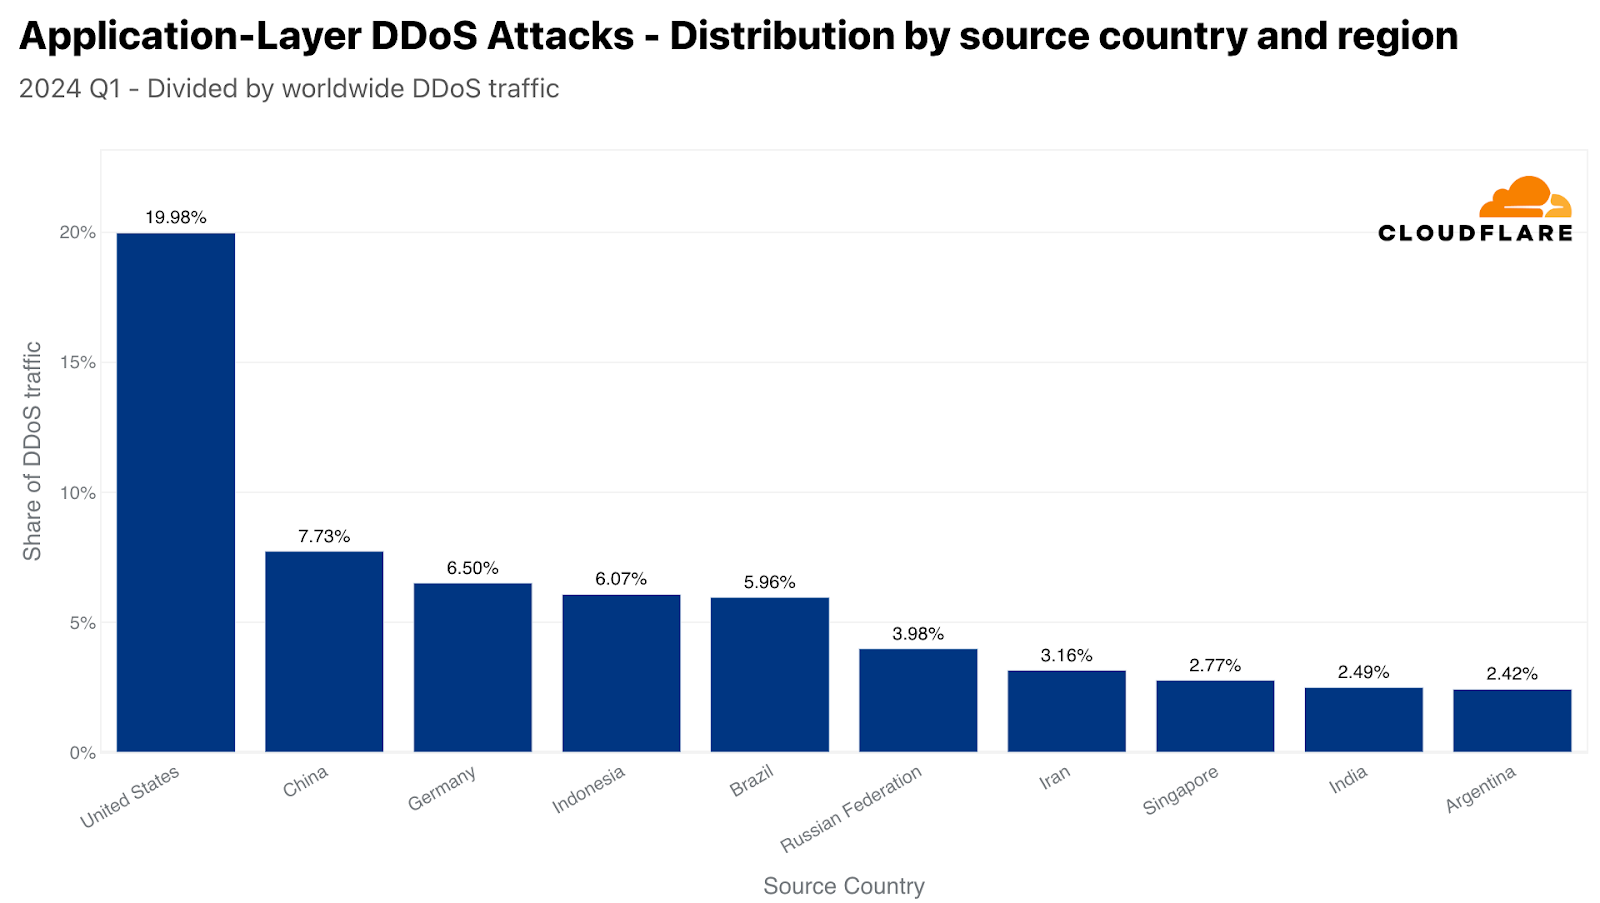
In the first quarter of 2024, the United States was the largest source of HTTP DDoS attack traffic, as a fifth of all DDoS attack requests originated from US IP addresses. China came in second, followed by Germany, Indonesia, Brazil, Russia, Iran, Singapore, India, and Argentina.
The top sources of HTTP DDoS attacks
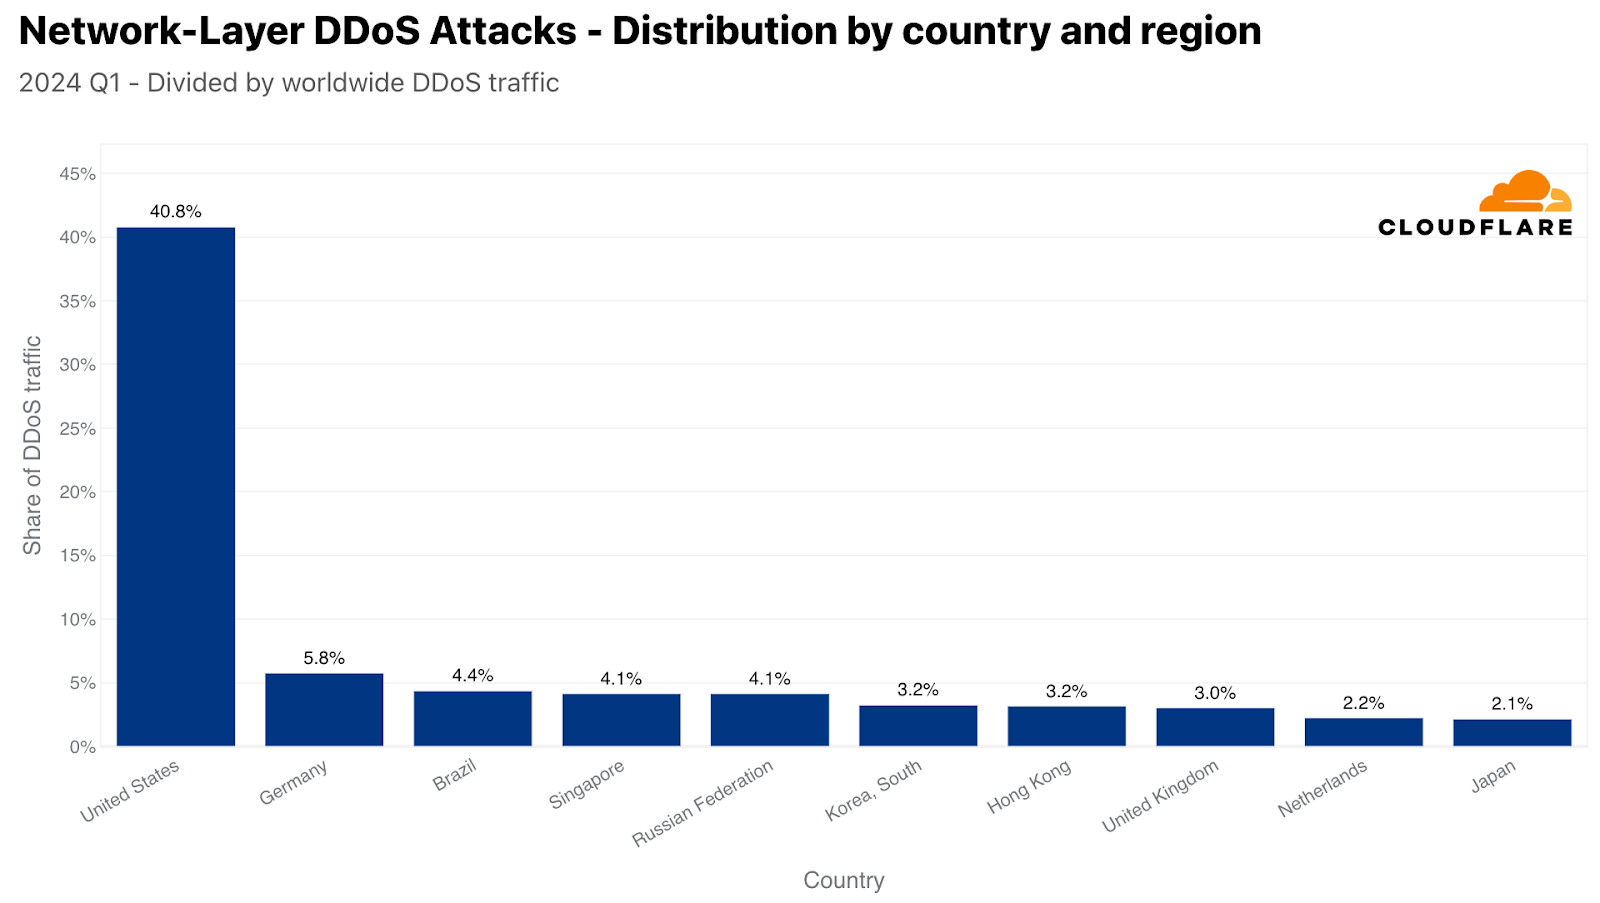
At the network layer, source IP addresses can be spoofed. So, instead of relying on IP addresses to understand the source, we use the location of our data centers where the attack traffic was ingested. We can gain geographical accuracy due to Cloudflare’s large global coverage in over 310 cities around the world.
Using the location of our data centers, we can see that in the first quarter of 2024, over 40% L3/4 DDoS attack traffic was ingested in our US data centers, making the US the largest source of L3/4 attacks. Far behind, in second, Germany at 6%, followed by Brazil, Singapore, Russia, South Korea, Hong Kong, United Kingdom, Netherlands, and Japan.
The top sources of L3/4 DDoS attacks
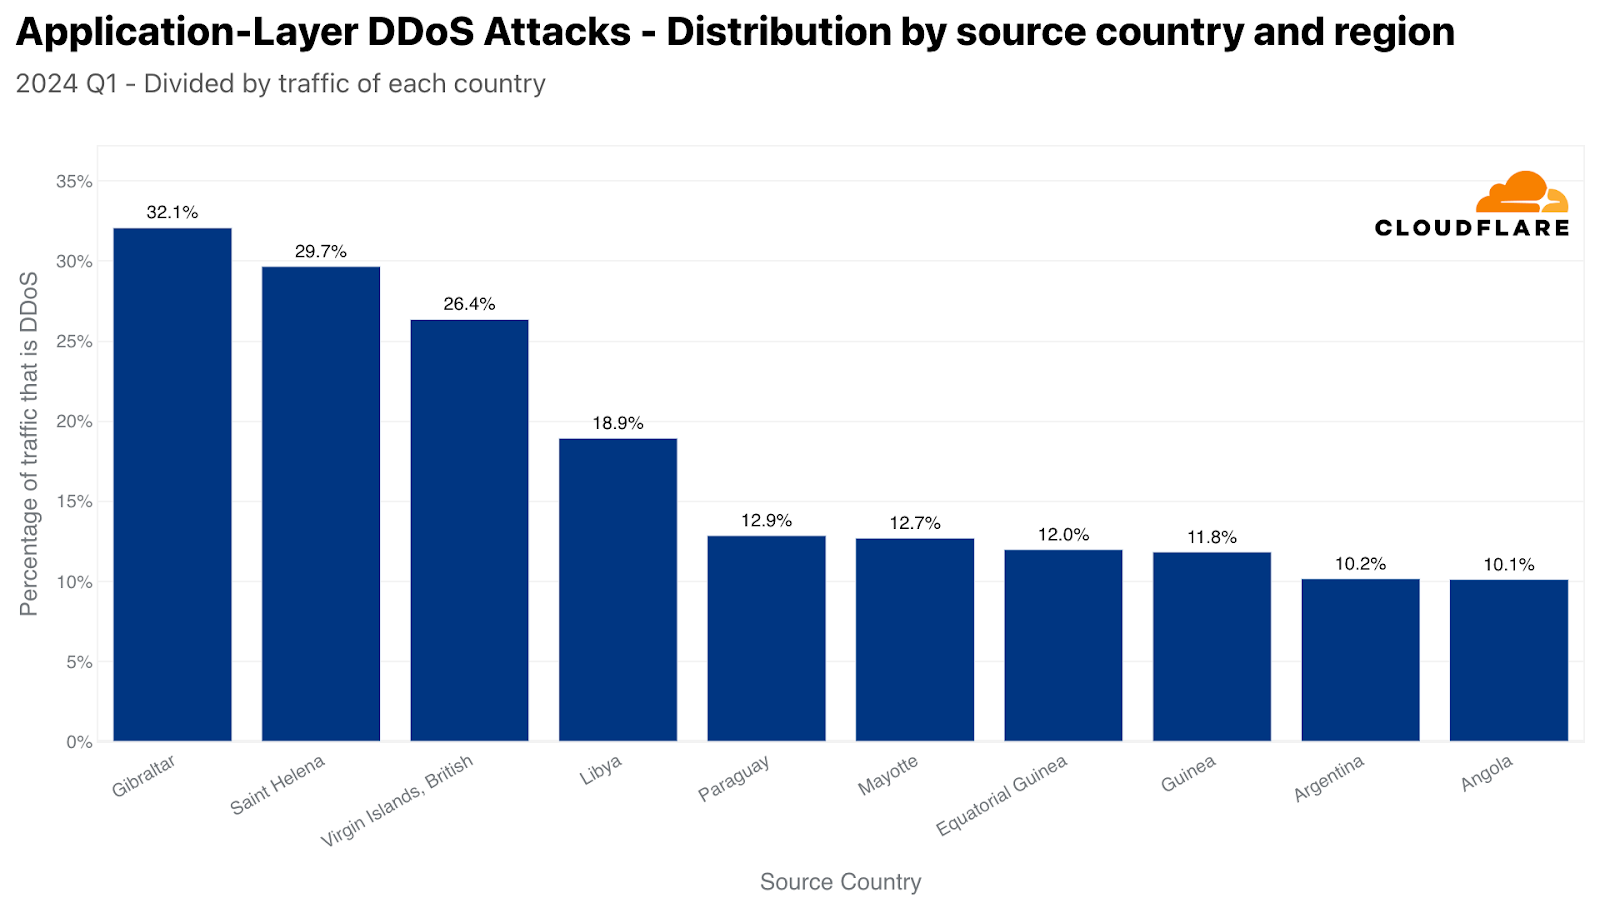
When normalizing the data by dividing the attack traffic by the total traffic to a given country or region, we get a totally different lineup. Almost a third of the HTTP traffic originating from Gibraltar was DDoS attack traffic, making it the largest source. In second place, Saint Helena, followed by the British Virgin Islands, Libya, Paraguay, Mayotte, Equatorial Guinea, Argentina, and Angola.
The top sources of HTTP DDoS attacks (normalized)
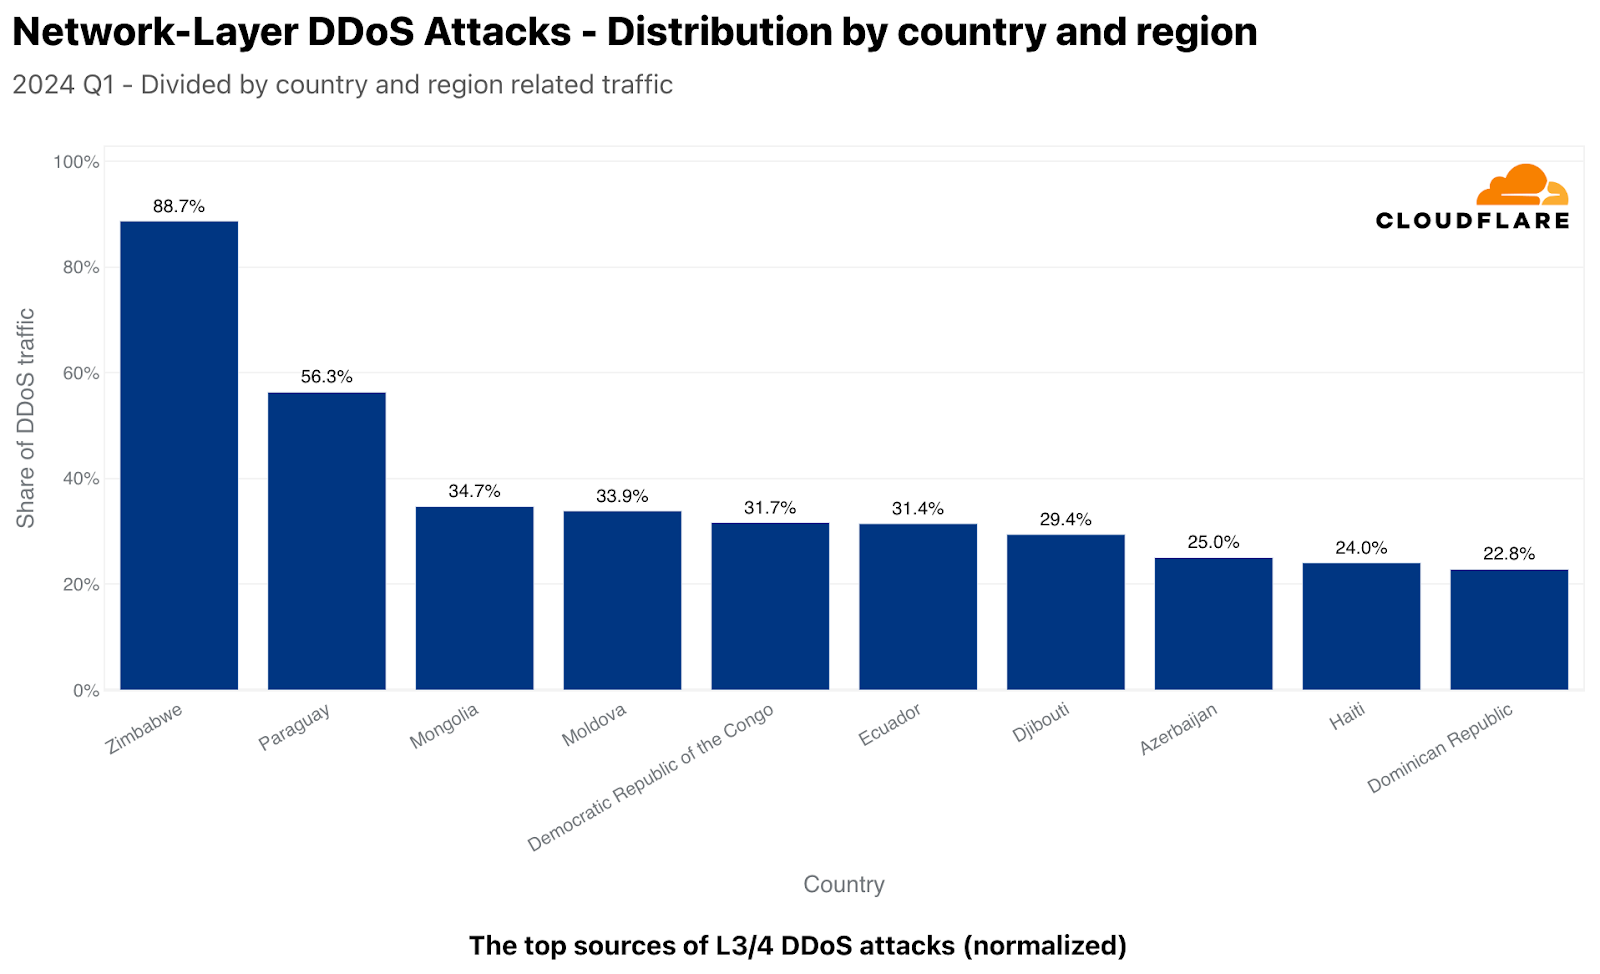
Back to the network layer, normalized, things look rather different as well. Almost 89% of the traffic we ingested in our Zimbabwe-based data centers were L3/4 DDoS attacks. In Paraguay, it was over 56%, followed by Mongolia reaching nearly a 35% attack share. Additional top locations included Moldova, Democratic Republic of the Congo, Ecuador, Djibouti, Azerbaijan, Haiti, and Dominican Republic.
The top sources of L3/4 DDoS attacks (normalized)
Most attacked locations
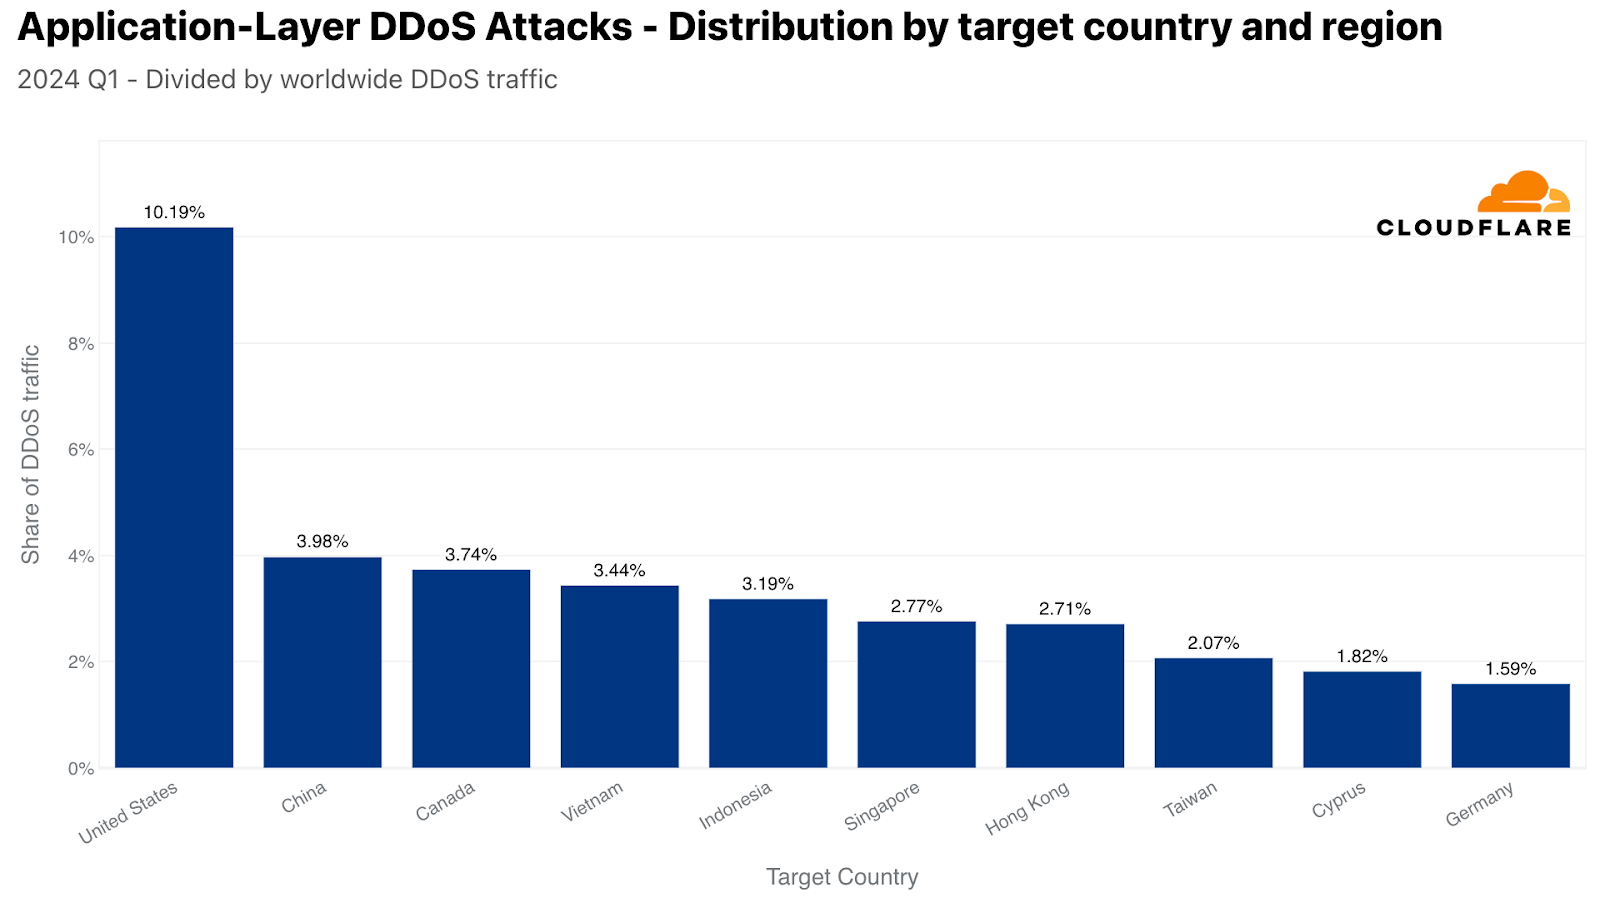
When analyzing DDoS attacks against our customers, we use their billing country to determine the “attacked country (or region)”. In the first quarter of 2024, the US was the most attacked by HTTP DDoS attacks. Approximately one out of every 10 DDoS requests that Cloudflare mitigated targeted the US. In second, China, followed by Canada, Vietnam, Indonesia, Singapore, Hong Kong, Taiwan, Cyprus, and Germany.
Top attacked countries and regions by HTTP DDoS attacks
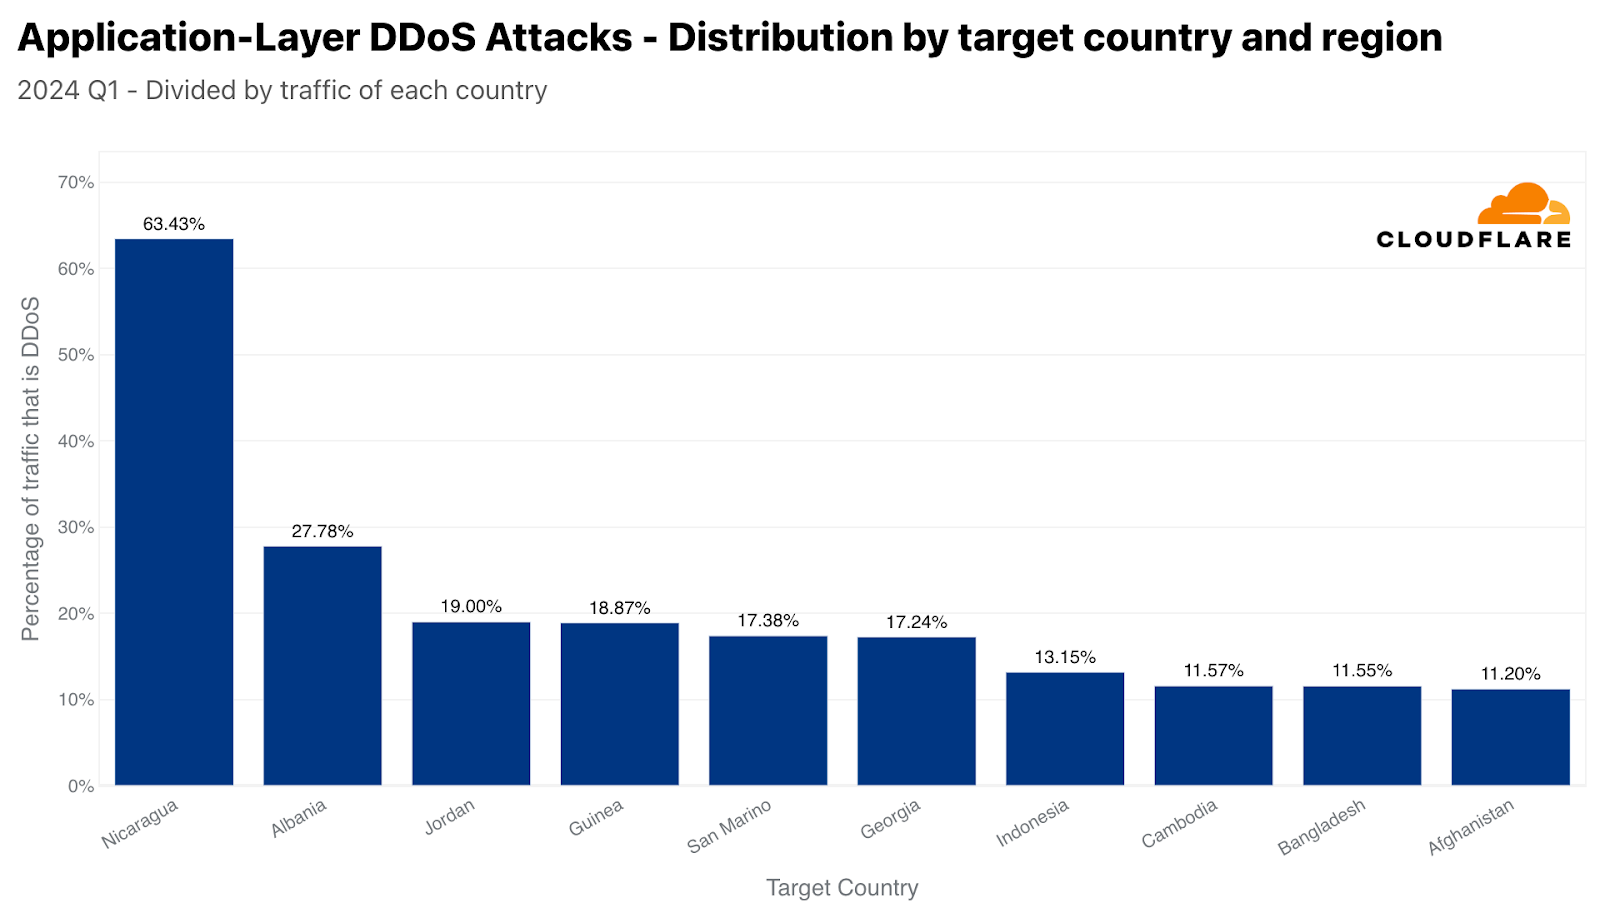
When normalizing the data by dividing the attack traffic by the total traffic to a given country or region, the list changes drastically. Over 63% of HTTP traffic to Nicaragua was DDoS attack traffic, making it the most attacked location. In second, Albania, followed by Jordan, Guinea, San Marino, Georgia, Indonesia, Cambodia, Bangladesh, and Afghanistan.
Top attacked countries and regions by HTTP DDoS attacks (normalized)
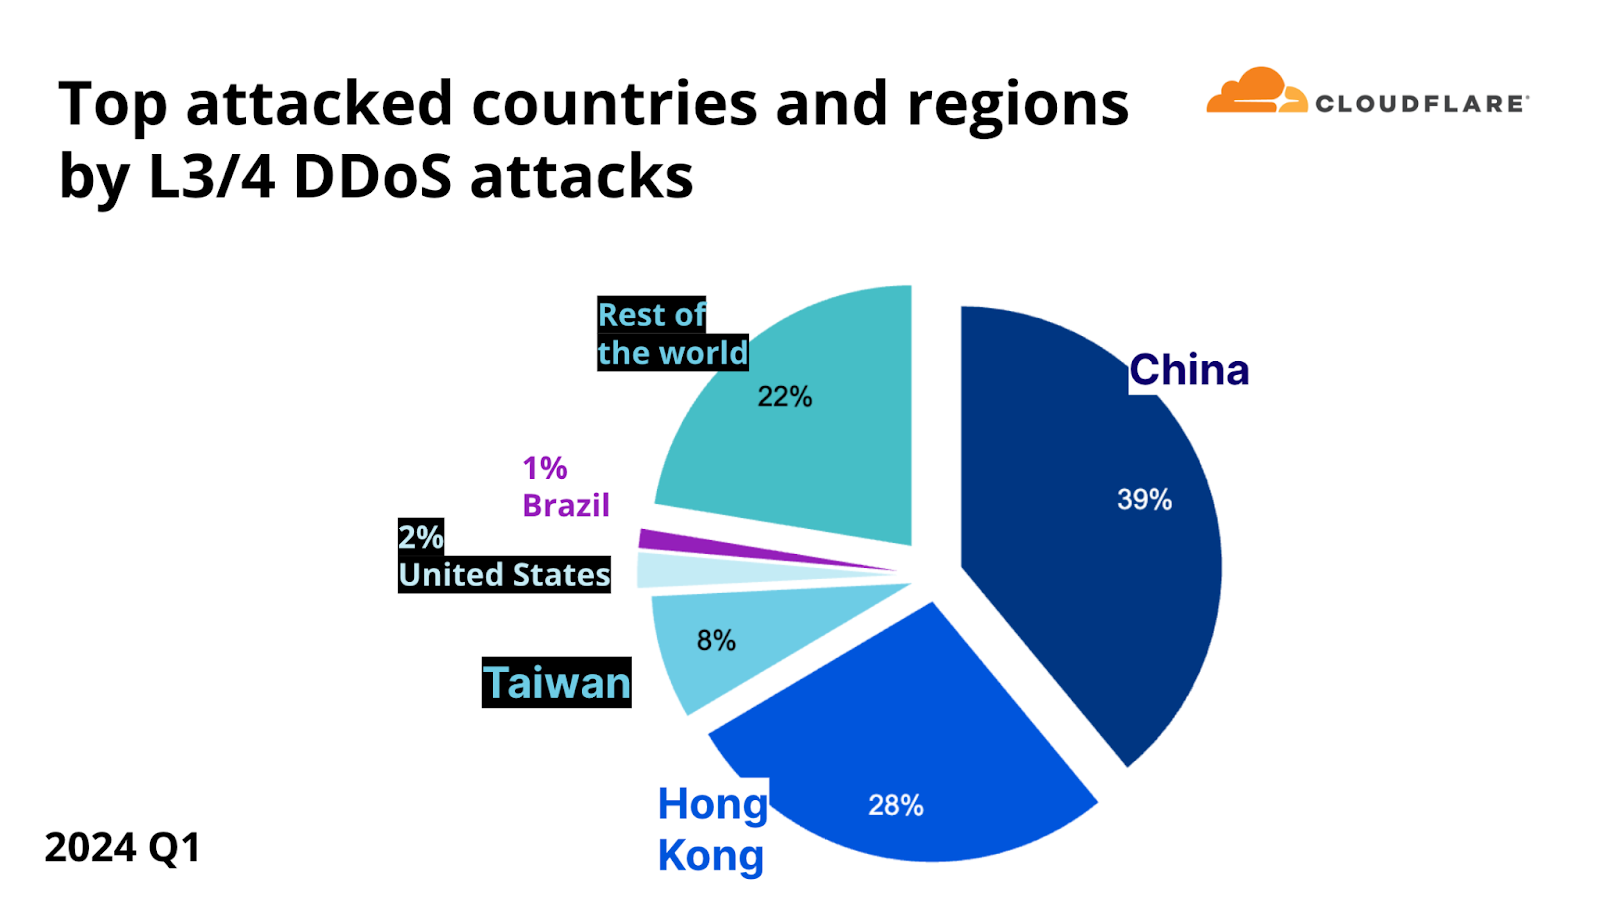
On the network layer, China was the number one most attacked location, as 39% of all DDoS bytes that Cloudflare mitigated during the first quarter of 2024 were aimed at Cloudflare’s Chinese customers. Hong Kong came in second place, followed by Taiwan, the United States, and Brazil.
Top attacked countries and regions by L3/4 DDoS attacks
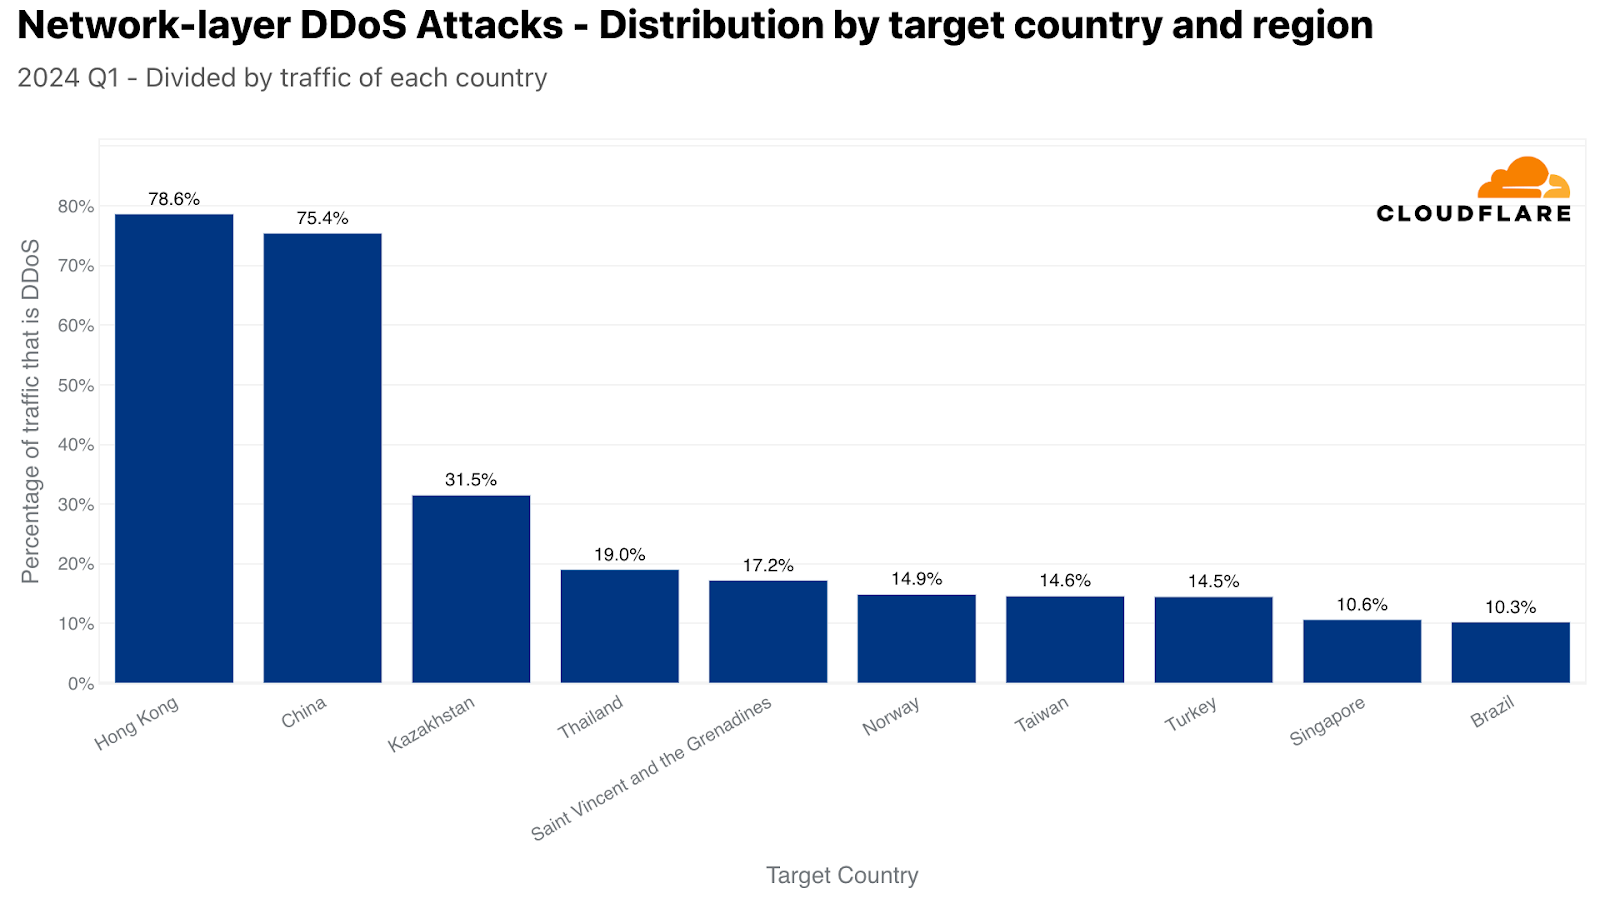
Back to the network layer, when normalized, Hong Kong takes the lead as the most targeted location. L3/4 DDoS attack traffic accounted for over 78% of all Hong Kong-bound traffic. In second place, China with a DDoS share of 75%, followed by Kazakhstan, Thailand, Saint Vincent and the Grenadines, Norway, Taiwan, Turkey, Singapore, and Brazil.
Top attacked countries and regions by L3/4 DDoS attacks (normalized)
Cloudflare is here to help – no matter the attack type, size, or duration
Cloudflare’s mission is to help build a better Internet, a vision where it remains secure, performant, and accessible to everyone. With four out of every 10 HTTP DDoS attacks lasting over 10 minutes and approximately three out of 10 extending beyond an hour, the challenge is substantial. Yet, whether an attack involves over 100,000 requests per second, as is the case in one out of every 10 attacks, or even exceeds a million requests per second — a rarity seen in only four out of every 1,000 attacks — Cloudflare’s defenses remain impenetrable.
Since pioneering unmetered DDoS Protection in 2017, Cloudflare has steadfastly honored its promise to provide enterprise-grade DDoS protection at no cost to all organizations, ensuring that our advanced technology and robust network architecture do not just fend off attacks but also preserve performance without compromise.
The collective thoughts of the interwebz
Manage Consent
To provide the best experiences, we use technologies like cookies to store and/or access device information. Consenting to these technologies will allow us to process data such as browsing behavior or unique IDs on this site. Not consenting or withdrawing consent, may adversely affect certain features and functions.
Functional
Always active
The technical storage or access is strictly necessary for the legitimate purpose of enabling the use of a specific service explicitly requested by the subscriber or user, or for the sole purpose of carrying out the transmission of a communication over an electronic communications network.
Preferences
The technical storage or access is necessary for the legitimate purpose of storing preferences that are not requested by the subscriber or user.
Statistics
The technical storage or access that is used exclusively for statistical purposes.The technical storage or access that is used exclusively for anonymous statistical purposes. Without a subpoena, voluntary compliance on the part of your Internet Service Provider, or additional records from a third party, information stored or retrieved for this purpose alone cannot usually be used to identify you.
Marketing
The technical storage or access is required to create user profiles to send advertising, or to track the user on a website or across several websites for similar marketing purposes.
 Как да се реши проблемът с водата в Брестовица


 The Internet has a plethora of moving parts: routers, switches, hubs, terrestrial and submarine cables, and connectors on the hardware side, and complex protocol stacks and configurations on the software side. When something goes wrong that slows or disrupts the Internet in a way that affects your customers, you want to be able to localize and understand the issue as quickly as possible.


 Hernan Garcia is a Senior Solutions Architect at AWS based in the Netherlands. He works in the financial services industry, supporting enterprises in their cloud adoption. He is passionate about serverless technologies, security, and compliance. He enjoys spending time with family and friends, and trying out new dishes from different cuisines.
 Jeetendra Vaidya is a Senior Solutions Architect at AWS, bringing his expertise to the realms of AI/ML, serverless, and data analytics domains. He is passionate about assisting customers in architecting secure, scalable, reliable, and cost-effective solutions.
 Sriharsh Adari is a Senior Solutions Architect at AWS, where he helps customers work backward from business outcomes to develop innovative solutions on AWS. Over the years, he has helped multiple customers on data platform transformations across industry verticals. His core area of expertise includes technology strategy, data analytics, and data science. In his spare time, he enjoys playing sports, watching TV shows, and playing Tabla.