Former senior White House cyber policy director A. J. Grotto talks about the economic incentives for companies to improve their security—in particular, Microsoft:
Grotto told us Microsoft had to be “dragged kicking and screaming” to provide logging capabilities to the government by default, and given the fact the mega-corp banked around $20 billion in revenue from security services last year, the concession was minimal at best.
[…]
“The government needs to focus on encouraging and catalyzing competition,” Grotto said. He believes it also needs to publicly scrutinize Microsoft and make sure everyone knows when it messes up.
“At the end of the day, Microsoft, any company, is going to respond most directly to market incentives,” Grotto told us. “Unless this scrutiny generates changed behavior among its customers who might want to look elsewhere, then the incentives for Microsoft to change are not going to be as strong as they should be.”
Breaking up the tech monopolies is one of the best things we can do for cybersecurity.
Фалшив данъчен инспектор рекетира търговец да му плати 600 лв., за да не му напише акт. Случаят е разкрит от полицията и стига дори до ДАНС. Три години по-късно развръзка…
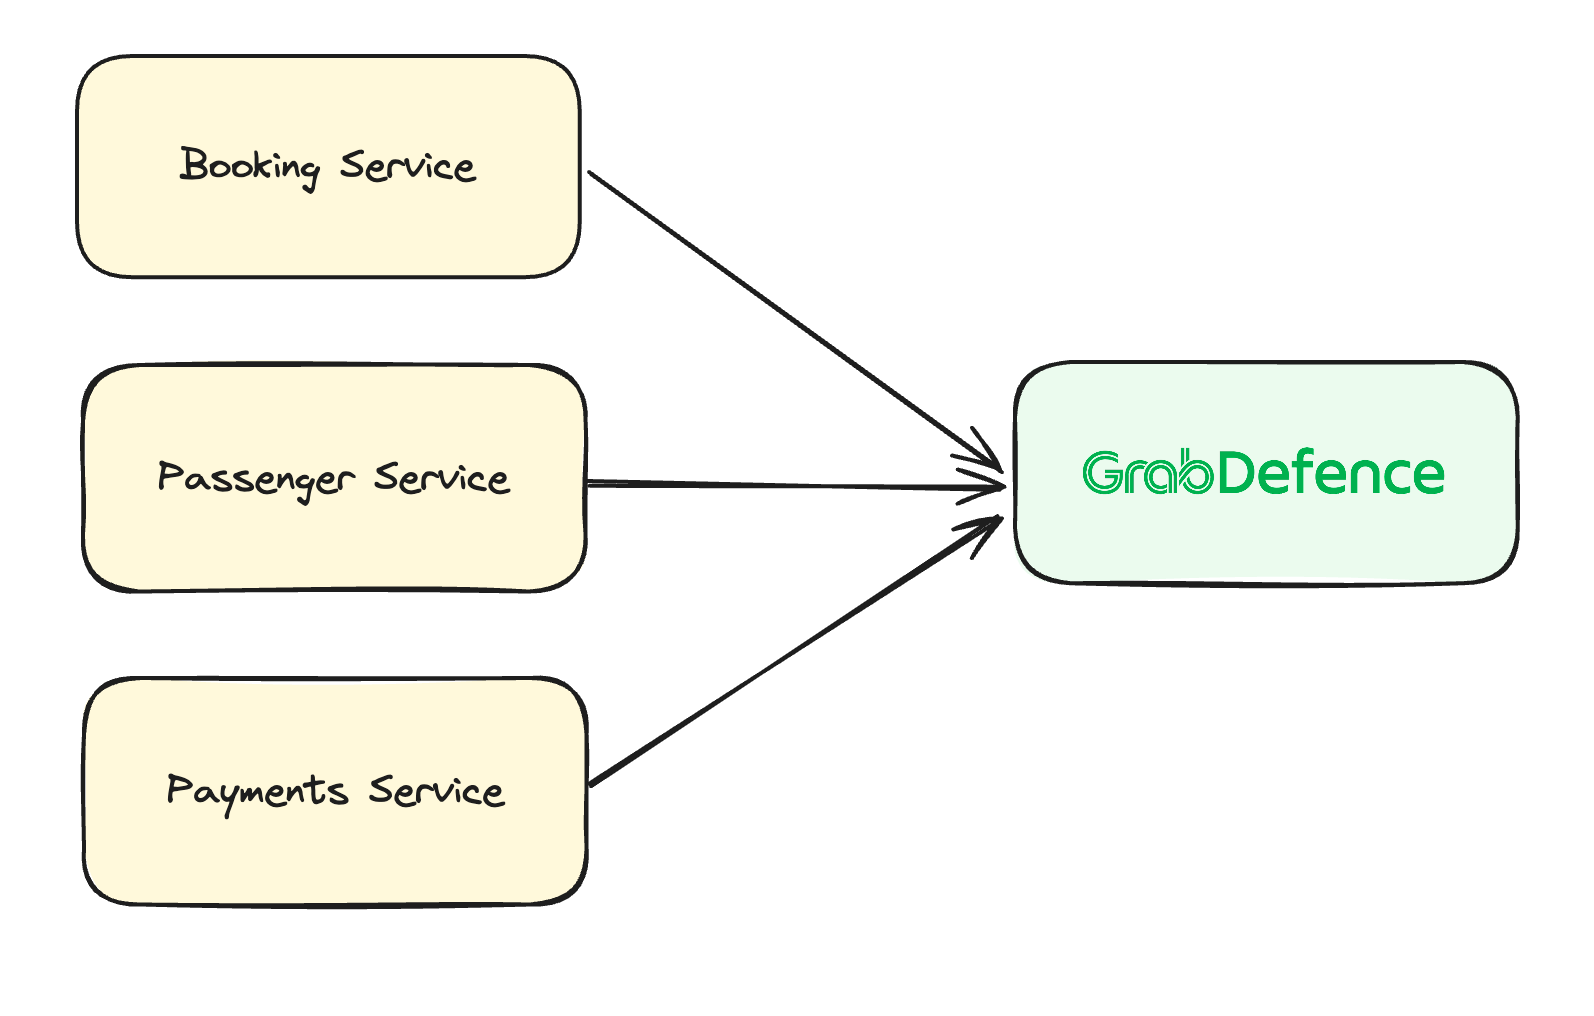
Grab has an in-house Risk Management platform called GrabDefence which relies on ingesting large amounts of data gathered from upstream services to power our heuristic risk rules and data science models in real time.
Fig 1. GrabDefence aggregates data from different upstream services
As Grab’s business grows, so does the amount of data. It becomes imperative that the data which fuels our risk systems is of reliable quality as any data discrepancy or missing data could impact fraud detection and prevention capabilities.
We need to quickly detect any data anomalies, which is where data observability comes in.
Data observability as a solution
Data observability is a type of data operation (DataOps; similar to DevOps) where teams build visibility over the health and quality of their data pipelines. This enables teams to be notified of data quality issues, and allows teams to investigate and resolve these issues faster.
We needed a solution that addresses the following issues:
Alerts for any data quality issues as soon as possible – so this means the observability tool had to work in real time.
With hundreds of data points to observe, we needed a neat and scalable solution which allows users to quickly pinpoint which data points were having issues.
A consistent way to compare, analyse, and compute data that might have different formats.
Hence, we decided to use Flink to standardise data transformations, compute, and observe data trends quickly (in real time) and scalably.
Utilising Flink for real-time computations at scale
What is Flink?
Flink SQL is a powerful, flexible tool for performing real-time analytics on streaming data. It allows users to query continuous data streams using standard SQL syntax, enabling complex event processing and data transformation within the Apache Flink ecosystem, which is particularly useful for scenarios requiring low-latency insights and decisions.
How we used Flink to compute data output
In Grab, data comes from multiple sources and while most of the data is in JSON format, the actual JSON structure differs between services. Because of JSON’s nested and dynamic data structure, it is difficult to consistently analyse the data – posing a significant challenge for real-time analysis.
To help address this issue, Apache Flink SQL has the capability to manage such intricacies with ease. It offers specialised functions tailored for parsing and querying JSON data, ensuring efficient processing.
Another standout feature of Flink SQL is the use of custom table functions, such as JSONEXPLOAD, which serves to deconstruct and flatten nested JSON structures into tabular rows. This transformation is crucial as it enables subsequent aggregation operations. By implementing a 5-minute tumbling window, Flink SQL can easily aggregate these now-flattened data streams. This technique is pivotal for monitoring, observing, and analysing data patterns and metrics in near real-time.
Now that data is aggregated by Flink for easy analysis, we still needed a way to incorporate comprehensive monitoring so that teams could be notified of any data anomalies or discrepancies in real time.
How we interfaced the output with Datadog
Datadog is the observability tool of choice in Grab, with many teams using Datadog for their service reliability observations and alerts. By aggregating data from Apache Flink and integrating it with Datadog, we can harness the synergy of real-time analytics and comprehensive monitoring. Flink excels in processing and aggregating data streams, which, when pushed to Datadog, can be further analysed and visualised. Datadog also provides seamless integration with collaboration tools like Slack, which enables teams to receive instant notifications and alerts.
With Datadog’s out-of-the-box features such as anomaly detection, teams can identify and be alerted to unusual patterns or outliers in their data streams. Taking a proactive approach to monitoring is crucial in maintaining system health and performance as teams can be alerted, then collaborate quickly to diagnose and address anomalies.
This integrated pipeline—from Flink’s real-time data aggregation to Datadog’s monitoring and Slack’s communication capabilities—creates a robust framework for real-time data operations. It ensures that any potential issues are quickly traced and brought to the team’s attention, facilitating a rapid response. Such an ecosystem empowers organisations to maintain high levels of system reliability and performance, ultimately enhancing the overall user experience.
Organising monitors and alerts using out-of-the-box solutions from Datadog
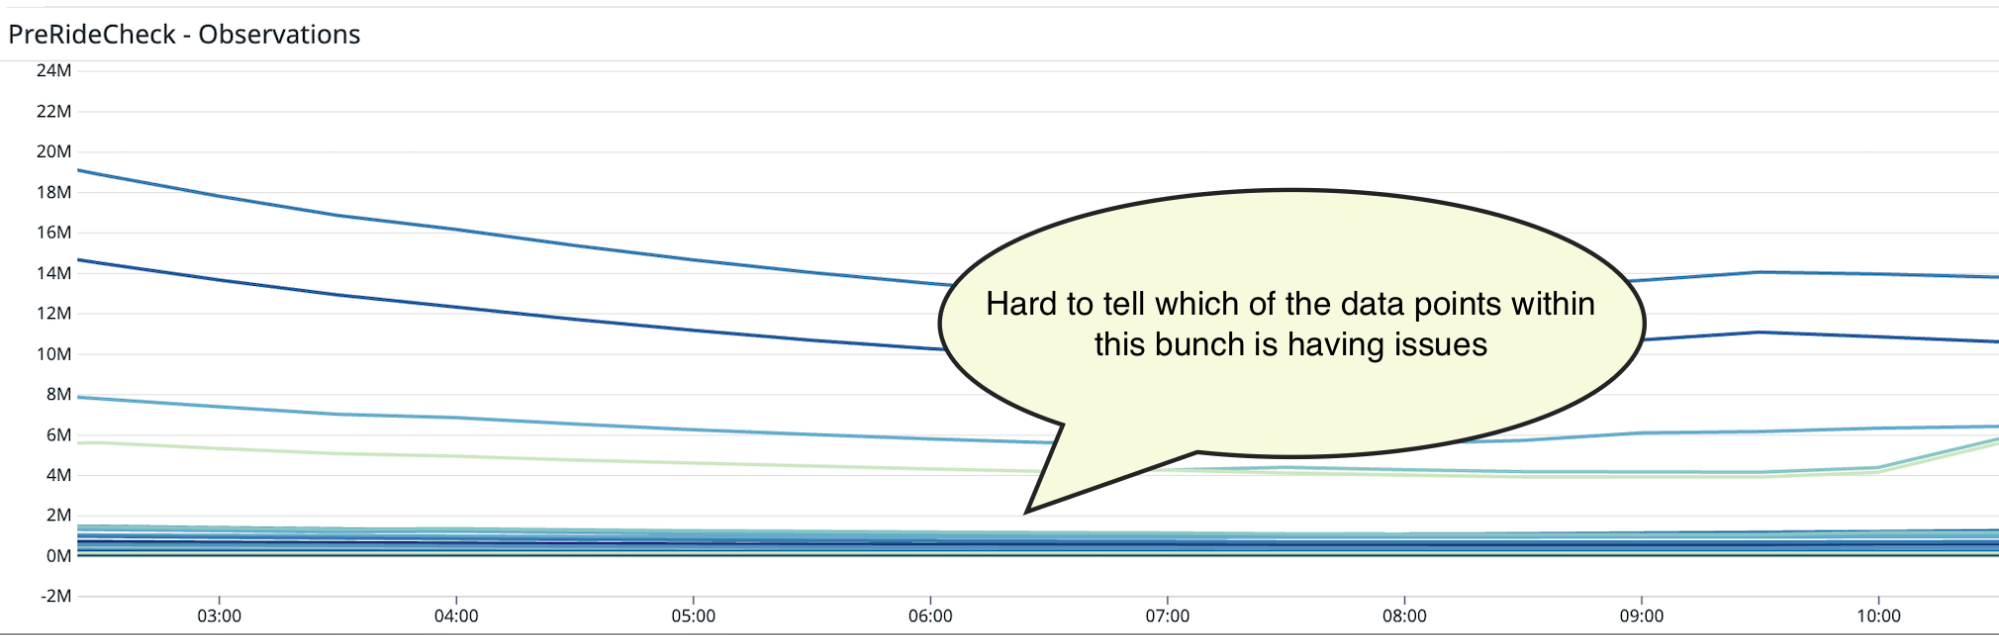
Once we integrated Flink data into Datadog, we realised that it could become unwieldy to try to identify the data point with issues from hundreds of other counters.
Fig 2. Hundreds of data points on a graph make it hard to decipher which ones have issues
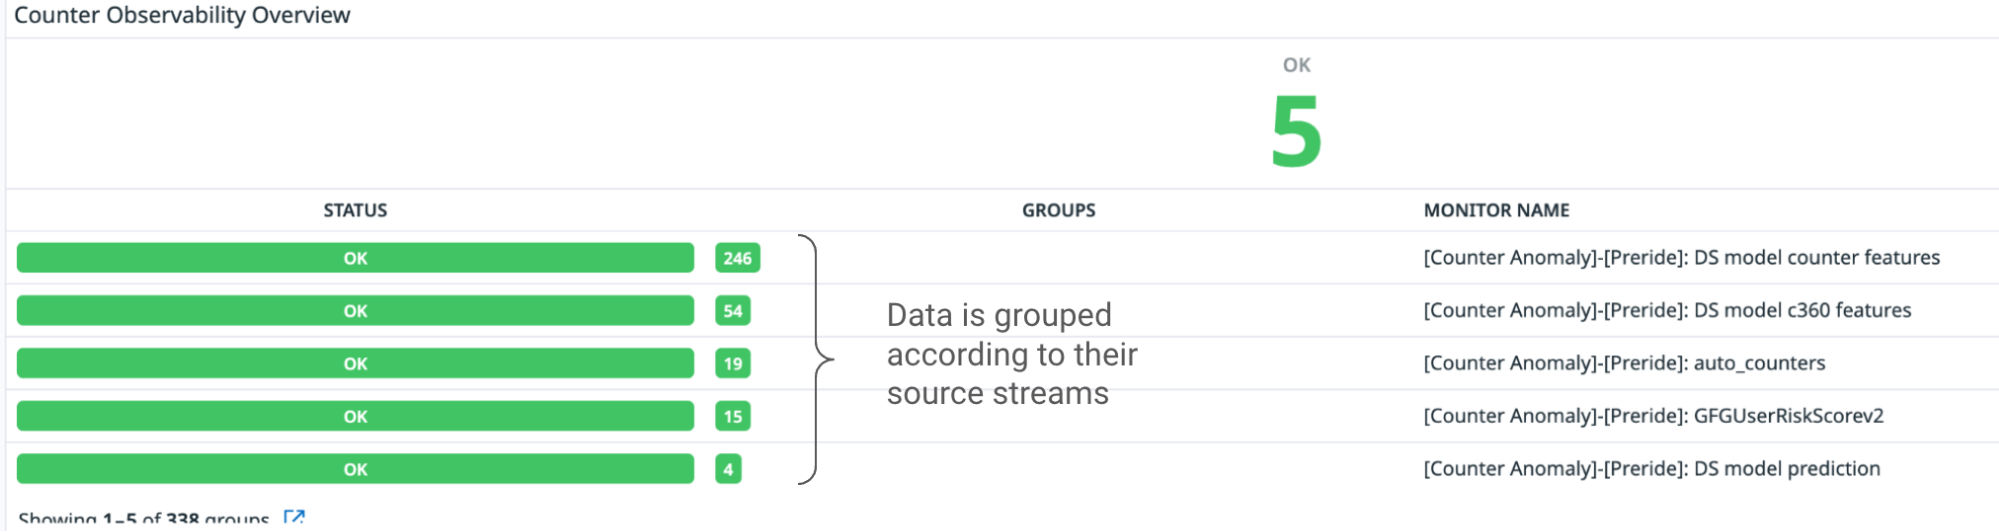
We decided to organise the counters according to the service stream it was coming from, and create individual monitors for each service stream. We used Datadog’s Monitor Summary tool to help visualise the total number of service streams we are reading from and the number of underlying data points within each stream.
Fig 3. Data is grouped according to their source stream
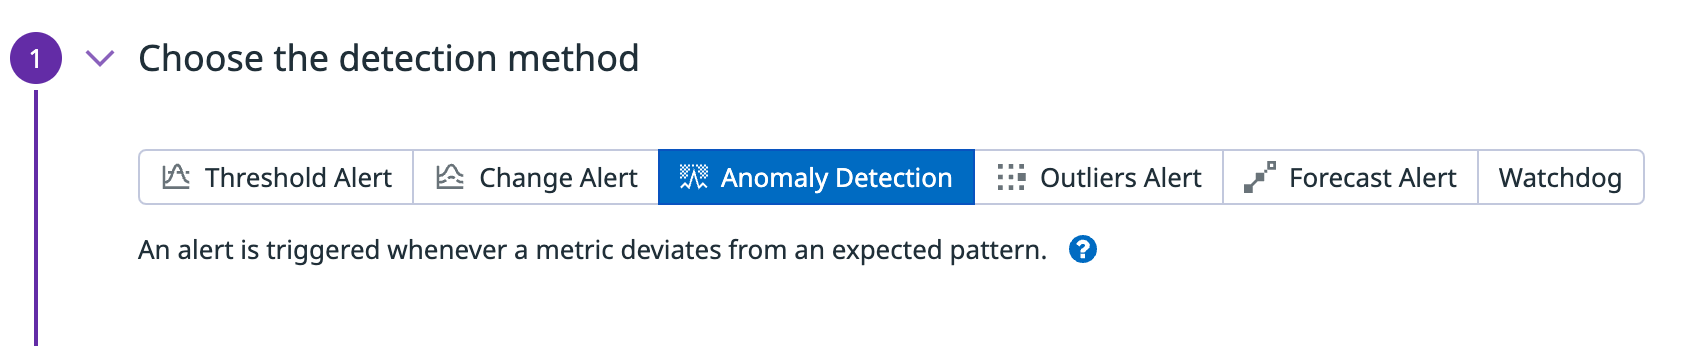
Within each individual stream, we used Datadog’s Anomaly Detection feature to create an alert whenever a data point from the stream exceeds a predefined threshold. This can be configured by the service teams on Datadog.
Fig 4. Datadog’s built-in Anomaly Detection function triggers alerts whenever a data point exceeds a threshold
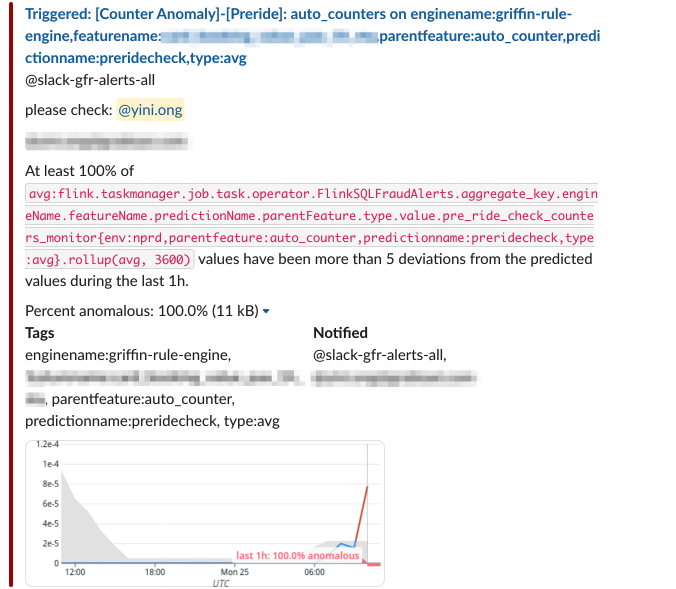
These alerts are then sent to a Slack channel where the Data team is informed when a data point of interest starts throwing anomalous values.
Fig 5. Datadog integration with Slack to help alert users
Impact
Since the deployment of this data observability tool, we have seen significant improvement in the detection of anomalous values. If there are any anomalies or issues, we now get alerts within the same day (or hour) instead of days to weeks later.
Organising the alerts according to source streams have also helped simplify the monitoring load and allows users to quickly narrow down and identify which pipeline has failed.
What’s next?
At the moment, this data observability tool is only implemented on selected checkpoints in GrabDefence. We plan to expand the observability tool’s coverage to include more checkpoints, and continue to refine the workflows to detect and resolve these data issues.
Join us
Grab is the leading superapp platform in Southeast Asia, providing everyday services that matter to consumers. More than just a ride-hailing and food delivery app, Grab offers a wide range of on-demand services in the region, including mobility, food, package and grocery delivery services, mobile payments, and financial services across 428 cities in eight countries.
Powered by technology and driven by heart, our mission is to drive Southeast Asia forward by creating economic empowerment for everyone. If this mission speaks to you, join our team today!
The Open Home Foundation has announced
its existence as a home and support resource for free home-automation
projects.
We created the Open Home Foundation to fight for the fundamental
principles of privacy, choice, and sustainability for smart
homes. And every person who lives in one.
Ahead of today, we’ve transferred over 240 projects, standards,
drivers, and libraries—Home Assistant, ESPHome, Zigpy, Piper,
Improv Wi-Fi, Wyoming, and so many more—to the Open Home
Foundation. This is all about looking into the future. We’ve done
this to create a bulwark against surveillance capitalism, the risk
of buyout, and open-source projects becoming abandonware. To an
extent, this protection extends even against our future selves—so
that smart home users can continue to benefit for years, if not
decades. No matter what comes.
If you are managing lots of accounts and Amazon Virtual Private Cloud (Amazon VPC) resources, sharing and then associating many DNS resources to each VPC can present a significant burden. You often hit limits around sharing and association, and you may have gone as far as building your own orchestration layers to propagate DNS configuration across your accounts and VPCs.
Today, I’m happy to announce Amazon Route 53 Profiles, which provide the ability to unify management of DNS across all of your organization’s accounts and VPCs. Route 53 Profiles let you define a standard DNS configuration, including Route 53 private hosted zone (PHZ) associations, Resolver forwarding rules, and Route 53 Resolver DNS Firewall rule groups, and apply that configuration to multiple VPCs in the same AWS Region. With Profiles, you have an easy way to ensure all of your VPCs have the same DNS configuration without the complexity of handling separate Route 53 resources. Managing DNS across many VPCs is now as simple as managing those same settings for a single VPC.
Profiles are natively integrated with AWS Resource Access Manager (RAM) allowing you to share your Profiles across accounts or with your AWS Organizations account. Profiles integrates seamlessly with Route 53 private hosted zones by allowing you to create and add existing private hosted zones to your Profile so that your organizations have access to these same settings when the Profile is shared across accounts. AWS CloudFormation allows you to use Profiles to set DNS settings consistently for VPCs as accounts are newly provisioned. With today’s release, you can better govern DNS settings for your multi-account environments.
How Route 53 Profiles works To start using the Route 53 Profiles, I go to the AWS Management Console for Route 53, where I can create Profiles, add resources to them, and associate them to their VPCs. Then, I share the Profile I created across another account using AWS RAM.
In the navigation pane in the Route 53 console, I choose Profiles and then I choose Create profile to set up my Profile.
I give my Profile configuration a friendly name such as MyFirstRoute53Profile and optionally add tags.
I can configure settings for DNS Firewall rule groups, private hosted zones and Resolver rules or add existing ones within my account all within the Profile console page.
I choose VPCs to associate my VPCs to the Profile. I can add tags as well as do configurations for recursive DNSSEC validation, the failure mode for the DNS Firewalls associated to my VPCs. I can also control the order of DNS evaluation: First VPC DNS then Profile DNS, or first Profile DNS then VPC DNS.
I can associate one Profile per VPC and can associate up to 5,000 VPCs to a single Profile.
Profiles gives me the ability to manage settings for VPCs across accounts in my organization. I am able to disable reverse DNS rules for each of the VPCs the Profile is associated with rather than configuring these on a per-VPC basis. The Route 53 Resolver automatically creates rules for reverse DNS lookups for me so that different services can easily resolve hostnames from IP addresses. If I use DNS Firewall, I am able to select the failure mode for my firewall via settings, to fail open or fail closed. I am also able to specify if I wish for the VPCs associated to the Profile to have recursive DNSSEC validation enabled without having to use DNSSEC signing in Route 53 (or any other provider).
Let’s say I associate a Profile to a VPC. What happens when a query exactly matches both a resolver rule or PHZ associated directly to the VPC and a resolver rule or PHZ associated to the VPC’s Profile? Which DNS settings take precedence, the Profile’s or the local VPC’s? For example, if the VPC is associated to a PHZ for example.com and the Profile contains a PHZ for example.com, that VPC’s local DNS settings will take precedence over the Profile. When a query is made for a name for a conflicting domain name (for example, the Profile contains a PHZ for infra.example.com and the VPC is associated to a PHZ that has the name account1.infra.example.com), the most specific name wins.
Sharing Route 53 Profiles across accounts using AWS RAM I use AWS Resource Access Manager (RAM) to share the Profile I created in the previous section with my other account.
I choose the Share profile option in the Profiles detail page or I can go to the AWS RAM console page and choose Create resource share.
I provide a name for my resource share and then I search for the ‘Route 53 Profiles’ in the Resources section. I select the Profile in Selected resources. I can choose to add tags. Then, I choose Next.
Profiles utilize RAM managed permissions, which allow me to attach different permissions to each resource type. By default, only the owner (the network admin) of the Profile will be able to modify the resources within the Profile. Recipients of the Profile (the VPC owners) will only be able to view the contents of the Profile (the ReadOnly mode). To allow a recipient of the Profile to add PHZs or other resources to it, the Profile’s owner will have to attach the necessary permissions to the resource. Recipients will not be able to edit or delete any resources added by the Profile owner to the shared resource.
I leave the default selections and choose Next to grant access to my other account.
On the next page, I choose Allow sharing with anyone, enter my other account’s ID and then choose Add. After that, I choose that account ID in the Selected principals section and choose Next.
In the Review and create page, I choose Create resource share. Resource share is successfully created.
Now, I switch to my other account that I share my Profile with and go to the RAM console. In the navigation menu, I go to the Resource shares and choose the resource name I created in the first account. I choose Accept resource share to accept the invitation.
That’s it! Now, I go to my Route 53 Profiles page and I choose the Profile shared with me.
I have access to the shared Profile’s DNS Firewall rule groups, private hosted zones, and Resolver rules. I can associate this account’s VPCs to this Profile. I am not able to edit or delete any resources. Profiles are Regional resources and cannot be shared across Regions.
Route 53 Profiles will be available in all AWS Regions, except in Canada West (Calgary), the AWS GovCloud (US) Regions and the Amazon Web Services China Regions.
For more details about the pricing, visit the Route 53 pricing page.
Get started with Profiles today and please let us know your feedback either through your usual AWS Support contacts or the AWS re:Post for Amazon Route 53.
Amazon Managed Workflow for Apache Airflow (Amazon MWAA) is a managed service that allows you to use a familiar Apache Airflow environment with improved scalability, availability, and security to enhance and scale your business workflows without the operational burden of managing the underlying infrastructure. In Airflow, Directed Acyclic Graphs (DAGs) are defined as Python code. Dynamic DAGs refer to the ability to generate DAGs on the fly during runtime, typically based on some external conditions, configurations, or parameters. Dynamic DAGs helps you to create, schedule, and run tasks within a DAG based on data and configurations that may change over time.
There are various ways to introduce dynamism in Airflow DAGs (dynamic DAG generation) using environment variables and external files. One of the approaches is to use the DAG Factory YAML based configuration file method. This library aims to facilitate the creation and configuration of new DAGs by using declarative parameters in YAML. It allows default customizations and is open-source, making it simple to create and customize new functionalities.
In this post, we explore the process of creating Dynamic DAGs with YAML files, using the DAG Factory library. Dynamic DAGs offer several benefits:
Enhanced code reusability – By structuring DAGs through YAML files, we promote reusable components, reducing redundancy in your workflow definitions.
Streamlined maintenance – YAML-based DAG generation simplifies the process of modifying and updating workflows, ensuring smoother maintenance procedures.
Flexible parameterization – With YAML, you can parameterize DAG configurations, facilitating dynamic adjustments to workflows based on varying requirements.
Improved scheduler efficiency – Dynamic DAGs enable more efficient scheduling, optimizing resource allocation and enhancing overall workflow runs
Enhanced scalability – YAML-driven DAGs allow for parallel runs, enabling scalable workflows capable of handling increased workloads efficiently.
By harnessing the power of YAML files and the DAG Factory library, we unleash a versatile approach to building and managing DAGs, empowering you to create robust, scalable, and maintainable data pipelines.
Overview of solution
In this post, we will use an example DAG file that is designed to process a COVID-19 data set. The workflow process involves processing an open source data set offered by WHO-COVID-19-Global. After we install the DAG-Factory Python package, we create a YAML file that has definitions of various tasks. We process the country-specific death count by passing Country as a variable, which creates individual country-based DAGs.
The following diagram illustrates the overall solution along with data flows within logical blocks.
Prerequisites
For this walkthrough, you should have the following prerequisites:
Make sure the AWS Identity and Access Management (IAM) user or role used for setting up the environment has IAM policies attached for the following permissions:
The access policies mentioned here are just for the example in this post. In a production environment, provide only the needed granular permissions by exercising least privilege principles.
Create an unique (within an account) Amazon S3 bucket name while creating your Amazon MWAA environment, and create folders called dags and requirements.
Create and upload a requirements.txt file with the following content to the requirements folder. Replace {environment-version} with your environment’s version number, and {Python-version} with the version of Python that’s compatible with your environment:
Pandas is needed just for the example use case described in this post, and dag-factory is the only required plug-in. It is recommended to check the compatibility of the latest version of dag-factory with Amazon MWAA. The boto and psycopg2-binary libraries are included with the Apache Airflow v2 base install and don’t need to be specified in your requirements.txt file.
Download the WHO-COVID-19-global data file to your local machine and upload it under the dags prefix of your S3 bucket.
Make sure that you are pointing to the latest AWS S3 bucket version of your requirements.txt file for the additional package installation to happen. This should typically take between 15 – 20 minutes depending on your environment configuration.
Validate the DAGs
When your Amazon MWAA environment shows as Available on the Amazon MWAA console, navigate to the Airflow UI by choosing Open Airflow UI next to your environment.
Verify the existing DAGs by navigating to the DAGs tab.
Configure your DAGs
Complete the following steps:
Create empty files named dynamic_dags.yml, example_dag_factory.py and process_s3_data.py on your local machine.
Edit the process_s3_data.py file and save it with following code content, then upload the file back to the Amazon S3 bucket dags folder. We are doing some basic data processing in the code:
Read the file from an Amazon S3 location
Rename the Country_code column as appropriate to the country.
Filter data by the given country.
Write the processed final data into CSV format and upload back to S3 prefix.
import boto3
import pandas as pd
import io

def process_s3_data(COUNTRY):
### Top level Variables replace S3_BUCKET with your bucket name ###
    s3 = boto3.client('s3')
    S3_BUCKET = "my-mwaa-assets-bucket-sfj33ddkm"
    INPUT_KEY = "dags/WHO-COVID-19-global-data.csv"
    OUTPUT_KEY = "dags/count_death"
### get csv file ###
   response = s3.get_object(Bucket=S3_BUCKET, Key=INPUT_KEY)
   status = response['ResponseMetadata']['HTTPStatusCode']
   if status == 200:
### read csv file and filter based on the country to write back ###
       df = pd.read_csv(response.get("Body"))
       df.rename(columns={"Country_code": "country"}, inplace=True)
       filtered_df = df[df['country'] == COUNTRY]
       with io.StringIO() as csv_buffer:
                   filtered_df.to_csv(csv_buffer, index=False)
                   response = s3.put_object(
                       Bucket=S3_BUCKET, Key=OUTPUT_KEY + '_' + COUNTRY + '.csv', Body=csv_buffer.getvalue()
                   )
       status = response['ResponseMetadata']['HTTPStatusCode']
       if status == 200:
           print(f"Successful S3 put_object response. Status - {status}")
       else:
           print(f"Unsuccessful S3 put_object response. Status - {status}")
   else:
       print(f"Unsuccessful S3 get_object response. Status - {status}")
Edit the dynamic_dags.yml and save it with the following code content, then upload the file back to the dags folder. We are stitching various DAGs based on the country as follows:
Define the default arguments that are passed to all DAGs.
Create a DAG definition for individual countries by passing op_args
Map the process_s3_data function with python_callable_name.
Use Python Operator to process csv file data stored in Amazon S3 bucket.
We have set schedule_interval as 10 minutes, but feel free to adjust this value as needed.
Edit the file example_dag_factory.py and save it with the following code content, then upload the file back to dags folder. The code cleans the existing the DAGs and generates clean_dags() method and the creating new DAGs using the generate_dags() method from the DagFactory instance.
from airflow import DAG
import dagfactory

config_file = "/usr/local/airflow/dags/dynamic_dags.yml"
example_dag_factory = dagfactory.DagFactory(config_file)

## to clean up or delete any existing DAGs ##
example_dag_factory.clean_dags(globals())
## generate and create new DAGs ##
example_dag_factory.generate_dags(globals())
After you upload the files, go back to the Airflow UI console and navigate to the DAGs tab, where you will find new DAGs.
Once you upload the files, go back to the Airflow UI console and under the DAGs tab you will find new DAGs are appearing as shown below:
You can enable DAGs by making them active and testing them individually. Upon activation, an additional CSV file named count_death_{COUNTRY_CODE}.csv is generated in the dags folder.
Cleaning up
There may be costs associated with using the various AWS services discussed in this post. To prevent incurring future charges, delete the Amazon MWAA environment after you have completed the tasks outlined in this post, and empty and delete the S3 bucket.
Conclusion
In this blog post we demonstrated how to use the dag-factory library to create dynamic DAGs. Dynamic DAGs are characterized by their ability to generate results with each parsing of the DAG file based on configurations. Consider using dynamic DAGs in the following scenarios:
Automating migration from a legacy system to Airflow, where flexibility in DAG generation is crucial
Situations where only a parameter changes between different DAGs, streamlining the workflow management process
Managing DAGs that are reliant on the evolving structure of a source system, providing adaptability to changes
Establishing standardized practices for DAGs across your team or organization by creating these blueprints, promoting consistency and efficiency
Embracing YAML-based declarations over complex Python coding, simplifying DAG configuration and maintenance processes
Creating data driven workflows that adapt and evolve based on the data inputs, enabling efficient automation
By incorporating dynamic DAGs into your workflow, you can enhance automation, adaptability, and standardization, ultimately improving the efficiency and effectiveness of your data pipeline management.
Jayesh Shinde is Sr. Application Architect with AWS ProServe India. He specializes in creating various solutions that are cloud centered using modern software development practices like serverless, DevOps, and analytics.
Harshd Yeola is Sr. Cloud Architect with AWS ProServe India helping customers to migrate and modernize their infrastructure into AWS. He specializes in building DevSecOps and scalable infrastructure using containers, AIOPs, and AWS Developer Tools and services.
One of the mainstays of the the Linux Foundation’s Open Source Summit is the “fireside chat”
(sans fire) between Linus Torvalds and Dirk Hohndel to discuss open source and
Linux kernel topics of the day. On April 17, at Open Source Summit
North America (OSSNA) in Seattle, Washington, they held with tradition
and discussed a range of topics including proper whitespace parsing,
security, and the current AI craze.
AWS Summits continue to rock the world, with events taking place in various locations around the globe. AWS Summit London (April 24) is the last one in April, and there are nine more in May, including AWS Summit Berlin (May 15–16), AWS Summit Los Angeles (May 22), and AWS Summit Dubai (May 29). Join us to connect, collaborate, and learn about AWS!
While you decide which summit to attend, let’s look at the last week’s new announcements.
Last week’s launches Last week was another busy one in the world of artificial intelligence (AI). Here are some launches that got my attention.
Anthropic’s Claude 3 Opus now available in Amazon Bedrock – After Claude 3 Sonnet and Claude 3 Haiku, two of the three state-of-the-art models of Anthropic’s Claude 3, Opus is now available in Amazon Bedrock. Cluade 3 Opus is at the forefront of generative AI, demonstrating comprehension and fluency on complicated tasks at nearly human levels. Like the rest of the Claude 3 family, Opus can process images and return text outputs. Claude 3 Opus shows an estimated twofold gain in accuracy over Claude 2.1 on difficult open-ended questions, reducing the likelihood of faulty responses.
Meta Llama 3 now available in Amazon SageMaker JumpStart – Meta Llama 3 is now available in Amazon SageMaker JumpStart, a machine learning (ML) hub that can help you accelerate your ML journey. You can deploy and use Llama 3 foundation models (FMs) with a few steps in Amazon SageMaker Studio or programmatically through the Amazon SageMaker Python SDK. Llama is available in two parameter sizes, 8B and 70B, and can be used to support a broad range of use cases, with improvements in reasoning, code generation, and instruction following. The model will be deployed in an AWS secure environment under your VPC controls, helping ensure data security.
AWS Split Cost Allocation Data for Amazon EKS – You can now receive granular cost visibility for Amazon Elastic Kubernetes Service (Amazon EKS) in the AWS Cost and Usage Reports (CUR) to analyze, optimize, and chargeback cost and usage for your Kubernetes applications. You can allocate application costs to individual business units and teams based on how Kubernetes applications consume shared Amazon EC2 CPU and memory resources. You can aggregate these costs by cluster, namespace, and other Kubernetes primitives to allocate costs to individual business units or teams. These cost details will be accessible in the CUR 24 hours after opt-in. You can use the Containers Cost Allocation dashboard to visualize the costs in Amazon QuickSight and the CUR query library to query the costs using Amazon Athena.
AWS KMS automatic key rotation enhancements – AWS Key Management Service (AWS KMS) introduces faster options for automatic symmetric key rotation. You can now customize rotation frequency between 90 days to 7 years, invoke key rotation on demand for customer-managed AWS KMS keys, and view the rotation history for any rotated AWS KMS key. There is a nice post on the Security Blog you can visit to learn more about this feature, including a little bit of history about cryptography.
Amazon Personalize automatic solution training – Amazon Personalize now offers automatic training for solutions. With automatic training, you can set a cadence for your Amazon Personalize solutions to automatically retrain using the latest data from your dataset group. This process creates a newly trained machine learning (ML) model, also known as a solution version, and maintains the relevance of Amazon Personalize recommendations for end users. Automatic training mitigates model drift and makes sure recommendations align with users’ evolving behaviors and preferences. With Amazon Personalize, you can personalize your website, app, ads, emails, and more, using the same machine learning technology used by Amazon, without requiring any prior ML experience. To get started with Amazon Personalize, visit our documentation.
Amazon Cognito is now available in Europe (Spain) Region. Amazon Cognito makes it easy to add authentication, authorization, and user management to your web and mobile apps supporting sign-in with social identity providers such as Apple, Facebook, Google, and Amazon, and enterprise identity providers through standards such as SAML 2.0 and OpenID Connect.
Other AWS news Here are some additional news that you might find interesting:
The PartyRock Generative AI Hackathon winners – The PartyRock Generative AI Hackathon concluded with over 7,650 registrants submitting 1,200 projects across four challenge categories, featuring top winners like Parable Rhythm – The Interactive Crime Thriller, Faith – Manga Creation Tools, and Arghhhh! Zombie. Participants showed remarkable creativity and technical prowess, with prizes totaling $60,000 in AWS credits.
I tried the Faith – Manga Creation Tools app using my daughter Arya’s made-up stories and ideas and the result was quite impressive.
Visit Jeff Barr’s post to learn more about how to try the apps for yourself.
AWS open source news and updates – My colleague Ricardo writes about open source projects, tools, and events from the AWS Community. Check out Ricardo’s page for the latest updates.
Upcoming AWS events Check your calendars and sign up for upcoming AWS events:
AWS Summits – Join free online and in-person events that bring the cloud computing community together to connect, collaborate, and learn about AWS. Register in your nearest city: Singapore (May 7), Seoul (May 16–17), Hong Kong (May 22), Milan (May 23), Stockholm (June 4), and Madrid (June 5).
AWS re:Inforce – Explore cloud security in the age of generative AI at AWS re:Inforce, June 10–12 in Pennsylvania for 2.5 days of immersive cloud security learning designed to help drive your business initiatives.
AWS Community Days – Join community-led conferences that feature technical discussions, workshops, and hands-on labs led by expert AWS users and industry leaders from around the world: Turkey (May 18), Midwest | Columbus (June 13), Sri Lanka (June 27), Cameroon (July 13), Nigeria (August 24), and New York (August 28).
McAfee released a report on a new LUA malware loader distributed through what appeared to be a legitimate Microsoft GitHub repository for the “C++ Library Manager for Windows, Linux, and MacOS,” known as vcpkg.
The attacker is exploiting a property of GitHub: comments to a particular repo can contain files, and those files will be associated with the project in the URL.
What this means is that someone can upload malware and “attach” it to a legitimate and trusted project.
As the file’s URL contains the name of the repository the comment was created in, and as almost every software company uses GitHub, this flaw can allow threat actors to develop extraordinarily crafty and trustworthy lures.
For example, a threat actor could upload a malware executable in NVIDIA’s driver installer repo that pretends to be a new driver fixing issues in a popular game. Or a threat actor could upload a file in a comment to the Google Chromium source code and pretend it’s a new test version of the web browser.
These URLs would also appear to belong to the company’s repositories, making them far more trustworthy.
Peter Hutterer announces
udev-hid-bpf, a tool to facilitate the loading of BPF programs that
make human-input devices work correctly.
eBPF was originally written for network packet filters but as of
kernel v6.3 and thanks to Benjamin, we have BPF in the HID
subsystem. HID actually lends itself really well to BPF because,
well, we have a byte array and to fix our devices we need to do
complicated things like “toggle that bit to zero” or “swap those
two values”.
See this article for more information on
the BPF-HID mechanism.
To provide the best experiences, we use technologies like cookies to store and/or access device information. Consenting to these technologies will allow us to process data such as browsing behavior or unique IDs on this site. Not consenting or withdrawing consent, may adversely affect certain features and functions.
Functional
Always active
The technical storage or access is strictly necessary for the legitimate purpose of enabling the use of a specific service explicitly requested by the subscriber or user, or for the sole purpose of carrying out the transmission of a communication over an electronic communications network.
Preferences
The technical storage or access is necessary for the legitimate purpose of storing preferences that are not requested by the subscriber or user.
Statistics
The technical storage or access that is used exclusively for statistical purposes.The technical storage or access that is used exclusively for anonymous statistical purposes. Without a subpoena, voluntary compliance on the part of your Internet Service Provider, or additional records from a third party, information stored or retrieved for this purpose alone cannot usually be used to identify you.
Marketing
The technical storage or access is required to create user profiles to send advertising, or to track the user on a website or across several websites for similar marketing purposes.


 Jayesh Shinde is Sr. Application Architect with AWS ProServe India. He specializes in creating various solutions that are cloud centered using modern software development practices like serverless, DevOps, and analytics.
 Harshd Yeola is Sr. Cloud Architect with AWS ProServe India helping customers to migrate and modernize their infrastructure into AWS. He specializes in building DevSecOps and scalable infrastructure using containers, AIOPs, and AWS Developer Tools and services.
