Post Syndicated from The Atlantic original https://www.youtube.com/shorts/jEYuAuDrJNM
Earth Sized Planets
Post Syndicated from xkcd.com original https://xkcd.com/3318/

Trump Is Closing From Behind
Post Syndicated from The Atlantic original https://www.youtube.com/shorts/wL9PK3jTCkA
How BMW Group accelerated connected vehicle workloads on AWS Graviton
Post Syndicated from Tomislav Lozančić original https://aws.amazon.com/blogs/architecture/how-bmw-group-accelerated-connected-vehicle-workloads-on-aws-graviton/
This post is co-written with Tomislav Lozancic, Hrvoje Lukavski from BMW Group, and Hugo Cardoso from CTW.
BMW Connected Company, a division within BMW Group, develops and operates premium digital services for BMW’s connected vehicle fleet of more than 24.5 million vehicles worldwide. Critical TechWorks (CTW), established in September 2018, focuses exclusively on developing software for BMW Group’s future connected vehicle fleet.
In 2024, BMW Connected Company began migrating its Connected Vehicle platform, known internally as Orbit, from x86 to Arm-based compute as part of a broader modernization strategy to advance BMW Group’s economic and environmental goals.
In this post, we share the methodology behind the migration, tooling and patterns that helped application teams move to AWS Graviton at their own pace, without service disruption.
Laying the groundwork
Before applications could adopt a new processor architecture, the platform needed a more flexible provisioning layer. The team adopted Karpenter, replacing fixed Managed Node Groups with dynamic, policy-driven node pools that could provision the right instance type automatically. You can read more about this migration in Transforming the BMW Connected Vehicle Backend with Karpenter.
With the compute foundation in place, the next challenge was supporting multi-architecture builds. Building, testing, and deploying the same application for two architectures without slowing teams down required extending the continuous integration and continuous delivery (CI/CD) platform. Build runners needed to target both x86 and Arm while producing dual build pipelines, as described in the following section.
Introducing Graviton-based CI/CD runners
The Connected Vehicle CI/CD platform facilitates over 130,000 builds and deployments daily through self-hosted GitHub Actions runners. You can read more about the evolution of this platform in An Engine of Efficiency: BMW Group’s CI/CD Modernization Journey with AWS.
To surface potential issues early and minimize disruption, the team first validated Graviton on a set of self-contained services. Dedicated Graviton runners operated alongside the existing x86 fleet during this phase. The price-performance advantage of Graviton was confirmed immediately, with lower cost per build minute and faster build times, justifying the business case for wider adoption.
Building on these initial results, the team designed the wider platform rollout around two complementary tracks.
- Dual build pipelines: Building and shipping both CPU architectures in parallel, giving applications a non-disruptive path to transition independently.
- Container hosting: Extending support into the centralized container platform, so applications could be hosted on Graviton.
The following figure shows the six-stage journey to adopt AWS Graviton. The stages are grouped into two phases: a build-foundation phase and a workload-migration phase.

Figure 1: AWS Graviton adoption journey across the Connected Vehicle platform
Supporting adoption
Getting teams onto Graviton depended less on policy than on removing friction. The following practices lowered the barrier to entry, beginning with the build pipeline.
1 – Multi-architecture builds
As outlined earlier, every container image needed to support both architectures before workloads could run on Arm-based instances. To achieve this, two complementary build approaches were used: emulated builds using Docker Buildx with QEMU, and native builds on Graviton-based runners.
Both approaches produce multi-arch images by publishing a manifest list (OCI image index) alongside the architecture-specific images. When a container runtime pulls a tagged image, it reads the manifest and automatically selects the correct variant for the node’s architecture. This means a single image tag serves both arm64 and amd64 nodes transparently.
2 – Mirroring base images
Public images are mirrored into a private Amazon Elastic Container Registry (Amazon ECR) to achieve availability, immutability, and CVE compliance. To preserve multi-arch support during mirroring, the team uses Google’s Crane. Crane transfers images directly between registries and filters the manifest to only the required platforms, which avoids wasted storage from unused architectures.
Besides public images, custom application workloads also needed support for both architectures. Most Dockerfiles required no changes, because their base images and dependencies already supported multiple architectures. In some cases, an alternative or dependency with Arm support needed to be found. For the builds, two approaches were considered:
- Native build per architecture: Each architecture is built and pushed separately on a runner with the matching architecture, followed by a final job that creates and pushes the image index. In GitHub Actions, this means one runner per architecture plus one index-creation step. This approach is more reliable but requires a dedicated runner for each target architecture.
- Emulated builds from a single machine: Using Docker Buildx with QEMU, all architectures can be built and pushed from a single x86 or Arm runner. This streamlines the pipeline but introduces emulation overhead, often making builds significantly slower for compute-intensive workloads.
The team opted to support both approaches. For platform-scale adoption, Graviton runners were preferred because they ran arm64 builds natively. This avoided the QEMU emulation overhead and surfaced architecture-specific issues earlier in the pipeline. With GitHub Actions reusable workflows, teams can select the right fit for each use case. Dockerfiles use the QEMU path to avoid spinning up additional runners. Those with significant complexity, large dependency downloads, or long build times use native builds, where the overhead becomes problematic.
Graviton runner labels mirror the existing x86 labels, so adoption involves swapping x64 for arm64 in a single label.
3 – Defining Graviton NodePools
The following diagram shows the mixed-architecture Amazon Elastic Kubernetes Service (Amazon EKS) cluster, including how on-premises systems connect and how the Graviton and x86 node pools coexist.
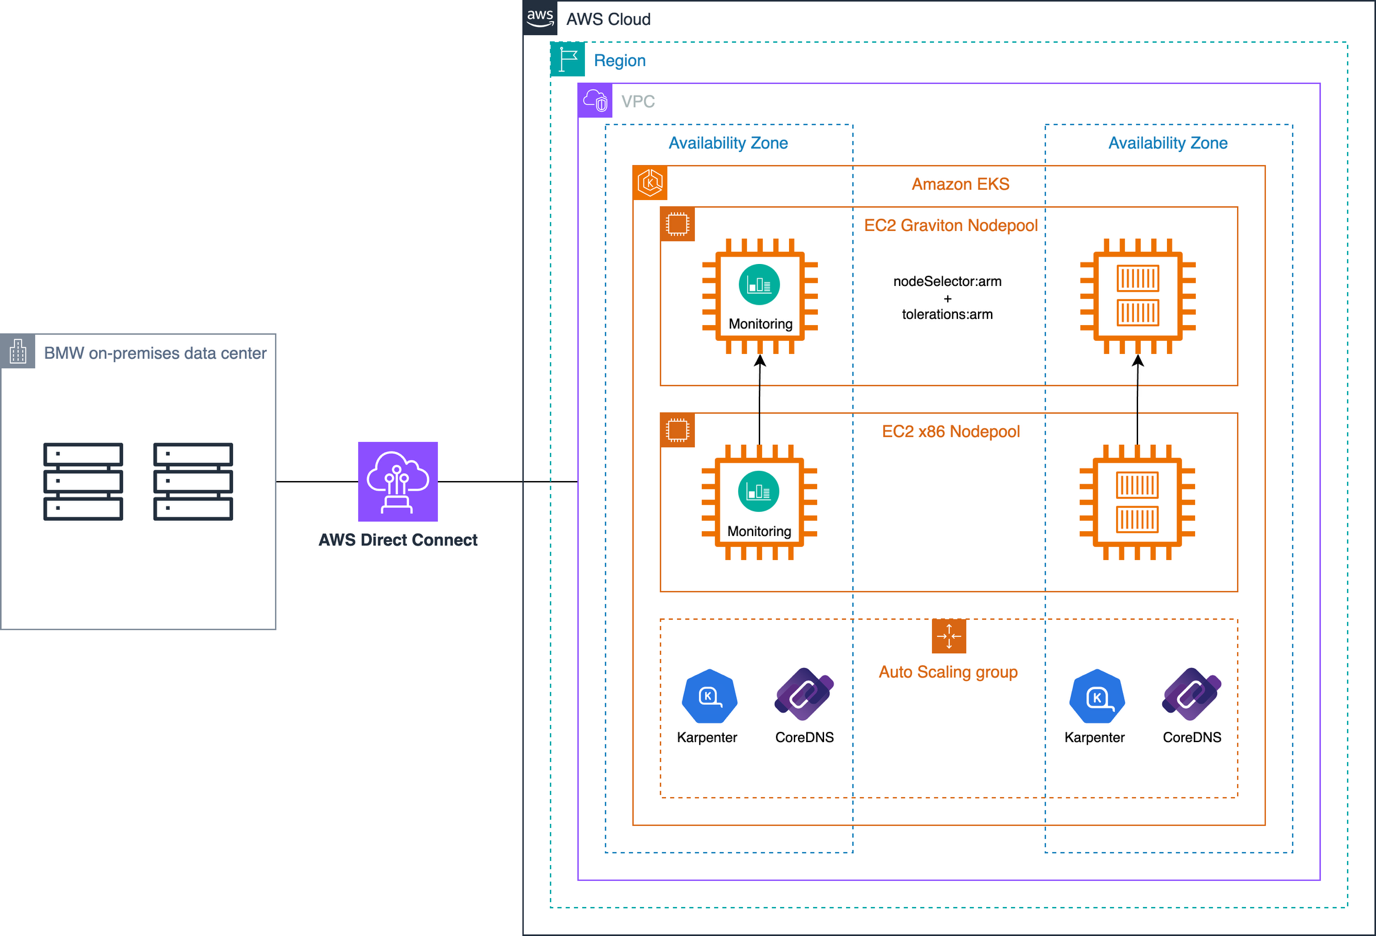
Figure 2: Mixed-architecture Amazon EKS cluster with dedicated Graviton node pools and opt-in scheduling
Dedicated Graviton node pools let teams adopt without friction across each environment. The pools are shared and general-purpose by default, not tailored to individual workloads. This keeps the underlying infrastructure model consistent and predictable while still allowing teams to migrate on their own schedule. Karpenter’s automatic scaling foundation supports efficient resource allocation and rapid provisioning for both Arm and x86 workloads.
To avoid accidental scheduling, the Graviton node pools use taints. Workloads must explicitly opt in using a node selector and matching toleration. This supports controlled rollout and predictable behavior:
With this in place, only Arm-ready workloads are scheduled on Graviton nodes, while other workloads continue to run on amd64 nodes without disruption.
4 – Phased rollout
Before supporting broad adoption for application workloads, the team first validated the migration path by running core platform services (Karpenter, Prometheus, and operational tooling). This platform-first approach identified compatibility gaps early, refined node pool configuration, and established rollback patterns. Teams had a proven reference model before they were encouraged to opt in.
A key design principle was minimizing rollback risk by keeping both architectures viable simultaneously. Dual-arch images and a dedicated NodePool mean every application can run on both CPU architectures. If issues arise, workloads fall back to x86 without image rebuilds or pipeline changes.
Kubernetes node affinity rules prefer Arm without forcing it, so workloads naturally gravitate toward Graviton instances:
If a full rollback is needed, the GitOps-based ArgoCD deployment model makes recovery straightforward by reverting to the previous version in Git and letting ArgoCD reconcile the cluster state.
Results
The migration delivered approximately $600,000 in annualized infrastructure savings and measurable performance improvements. After moving the NGINX-based ingress controller from x86 to Graviton, key results included:
- CPU consumption decreased by approximately 57 percent, while maintaining the same ingress profile.
- Price-performance improved by around 40 percent, as lower CPU consumption per request increased throughput capacity per dollar spent.
- Scaling efficiency improved at peak loads, with workloads requiring less compute capacity to handle equivalent traffic volumes.
Today, more than 65 percent of the platform runs on Graviton across production environments, a shift that supports BMW Group’s sustainability goals by reducing compute energy demand.
Lessons learned
Migrating a platform of this scale surfaced practical lessons that shaped the team’s approach and would benefit others considering a similar transition:
- Opt-in scheduling: Use taints, selectors, and tolerations to make sure that only ready workloads migrate.
- Multi-architecture images: One manifest-based tag for both architectures keeps releases straightforward and rollback instant.
- Platform-first adoption: Validate on shared infrastructure first to reduce risk before teams opt in.
- Optimization of emulated builds: This approach is useful for straightforward pipelines. Compute-heavy builds should use native or cross-compilation paths instead, which avoids unnecessary QEMU overhead and long build times.
Conclusion
BMW Group migrated its Connected Vehicle platform to AWS Graviton, achieving over $600,000 in annual cost savings and a 40 percent improvement in price-performance. The more than 130,000 daily builds and deployments that power more than 24.5 million connected vehicles continued without disruption.
The migration succeeded because of deliberate, incremental choices: taint-based node isolation, multi-arch container builds, and Karpenter’s ability to provision the right instance at the right time. Each layer reduced risk while keeping the rollout optional for individual teams. What started as a platform experiment is now the default compute path.
To get started with Graviton-based workloads on Amazon EKS, see the AWS Graviton Getting Started guide. To learn how BMW Group adopted Karpenter at scale, read Transforming the BMW Connected Vehicle Backend with Karpenter.
About the authors
Reolink Doorbell Gen1 vs Gen2 for Home Assistant: Which One Should You Buy?
Post Syndicated from digiblur DIY original https://www.youtube.com/watch?v=VcsM_G8kteU
Optimizing Apache HBase availability on Amazon EMR, Part 1: Coordinator startup, RegionServer recovery, and regions in transition
Post Syndicated from Reekunj Parmar original https://aws.amazon.com/blogs/big-data/optimizing-apache-hbase-availability-on-amazon-emr-part-1-coordinator-startup-regionserver-recovery-and-regions-in-transition/
Running Apache HBase on Amazon EMR gives you a scalable, high-performance NoSQL store, and following well-understood operational patterns can help improve availability. The most common availability conditions each leave a reliable signature. With the right process, you can more efficiently identify the cause and restore the cluster to full health.
This post gives you that repeatable process for three situations you are most likely to meet: an HBase coordinator that is slow to finish initializing, a RegionServer that leaves the cluster, and regions that stay in transition longer than expected. For each one, you learn which web UI pages, commands, and log messages point you to the cause, and which actions can help resolve it.
This is the first post in a two-part series on operating Apache HBase on Amazon EMR.
- Part 1 (this post) covers the triage framework and availability topics: an HBase coordinator that is slow to start, a RegionServer that leaves the cluster, and AWS Regions that stay in transition (RIT).
- Part 2 covers performance: diagnosing and tuning compaction, the parameters worth changing, and knowing when to engage AWS Support.
What this post covers:
- How to restore an HBase coordinator that is slow to start or finish initializing.
- How to recover a RegionServer that stopped or won’t rejoin the cluster.
- How to resolve regions that stay in transition (RIT).
- The tools to diagnose each situation, and when each tool is the right one to reach for.
What this post doesn’t cover:
- Performance tuning during major compaction (see Part 2).
- Cluster sizing, schema and row key design, or capacity planning.
- Backup, restore, snapshot, and disaster recovery procedures.
- Security configuration such as Kerberos, encryption, and authorization.
This post is written for operations teams, data engineers, HBase administrators, site reliability engineers (SREs), and support engineers. These are the people who operate HBase clusters on Amazon EMR and want a repeatable process for keeping them healthy.
If you’re evaluating whether to run HBase on Amazon EMR, or designing a new cluster, start with the Apache HBase on Amazon EMR documentation and the Amazon EMR best practices guide instead.
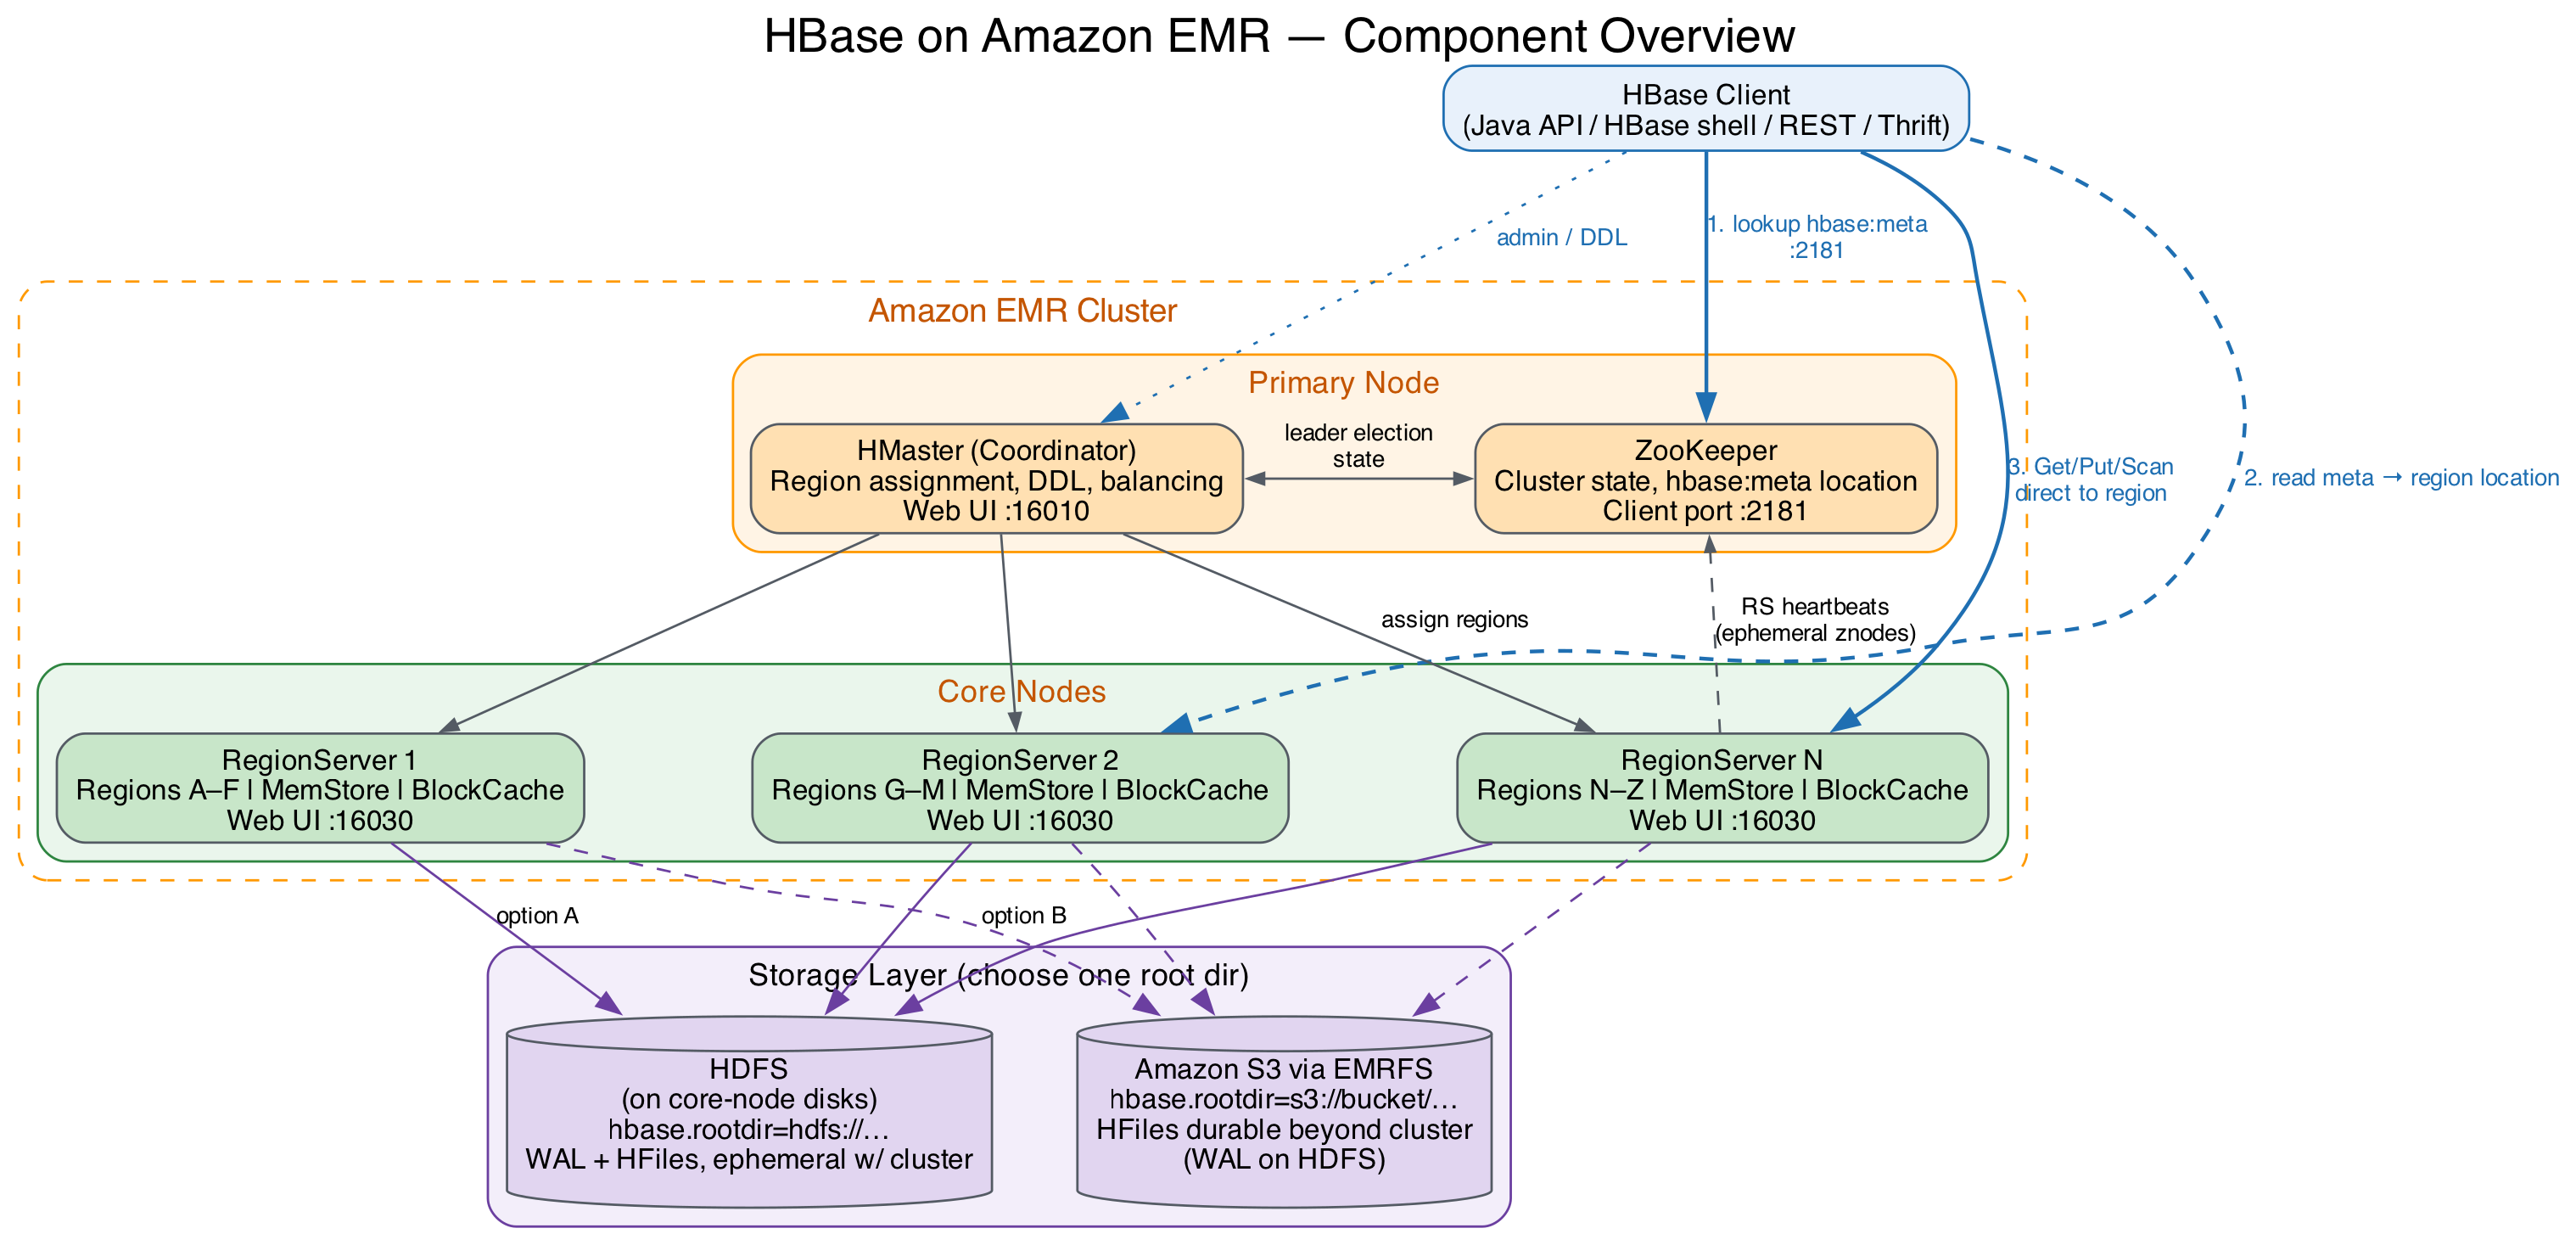
Figure 1: HBase on Amazon EMR port reference, where 16010 is the HMaster (coordinator) web UI, 16030 is the RegionServer web UI, and 2181 is the ZooKeeper client port
Terminology
Apache HBase names the process that coordinates the cluster HMaster, and Amazon EMR runs it on the primary node. This post refers to it as the HBase coordinator. Names that contain master, such as the hbase-master service and the hbase-hbase-master-*.log log files, appear only in commands and log output, where you need the exact name.
In HBase, a Region is a range of rows in a table, and a RegionServer is the process that serves regions. Neither is related to an AWS Region.
Prerequisites
Before you begin, make sure you have the following access in place:
- HBase web UI (coordinator on port 16010, RegionServer on port 16030): shows live RegionServers, failed RegionServers, and regions in transition. Reach it through an SSH tunnel or the Amazon EMR persistent application user interfaces.
- SSH access to the primary and core nodes: needed for logs, the HBase shell, and every Level 2 and Level 3 step. See Connect to the primary node using SSH.
- Read access to
/var/logand the Amazon S3 log URI: covers coordinator, RegionServer, ZooKeeper, and Hadoop Distributed File System (HDFS) logs. The Amazon Simple Storage Service (Amazon S3) copy matters when a node has been replaced. - Permission to run the HBase shell as the
hbaseuser: usesudo -u hbase hbase shellto keep file ownership consistent.
This post assumes you are familiar with the following:
- Amazon EMR architecture (primary, core, and task nodes).
- HBase components (the coordinator process, RegionServers, ZooKeeper, write-ahead log (WAL), MemStore, HFiles, and the
hbase:metatable). - Your storage mode (HDFS or Amazon S3).
- Common Linux command line tools.
Before you start, confirm your Amazon EMR release and storage mode:
An s3:// or s3a:// value means you are running HBase on Amazon S3. Log paths, default values, and the correct repair tool all depend on your release and storage mode.
Three levels of troubleshooting
Start with the checks that need the least access, and move to the next level only if you need more information.
- Level 1 (read-only checks): Web UI, shell commands, and console events. Safe to run anytime, with no cluster impact.
- Level 2 (intermediate diagnostics): Log analysis, process inspection, and disk and memory checks. Still non-destructive, but requires SSH access.
- Level 3 (advanced intervention): Thread dumps, heap analysis, and HBCK2 repairs. These can change cluster state, so take a snapshot first and change one thing at a time.
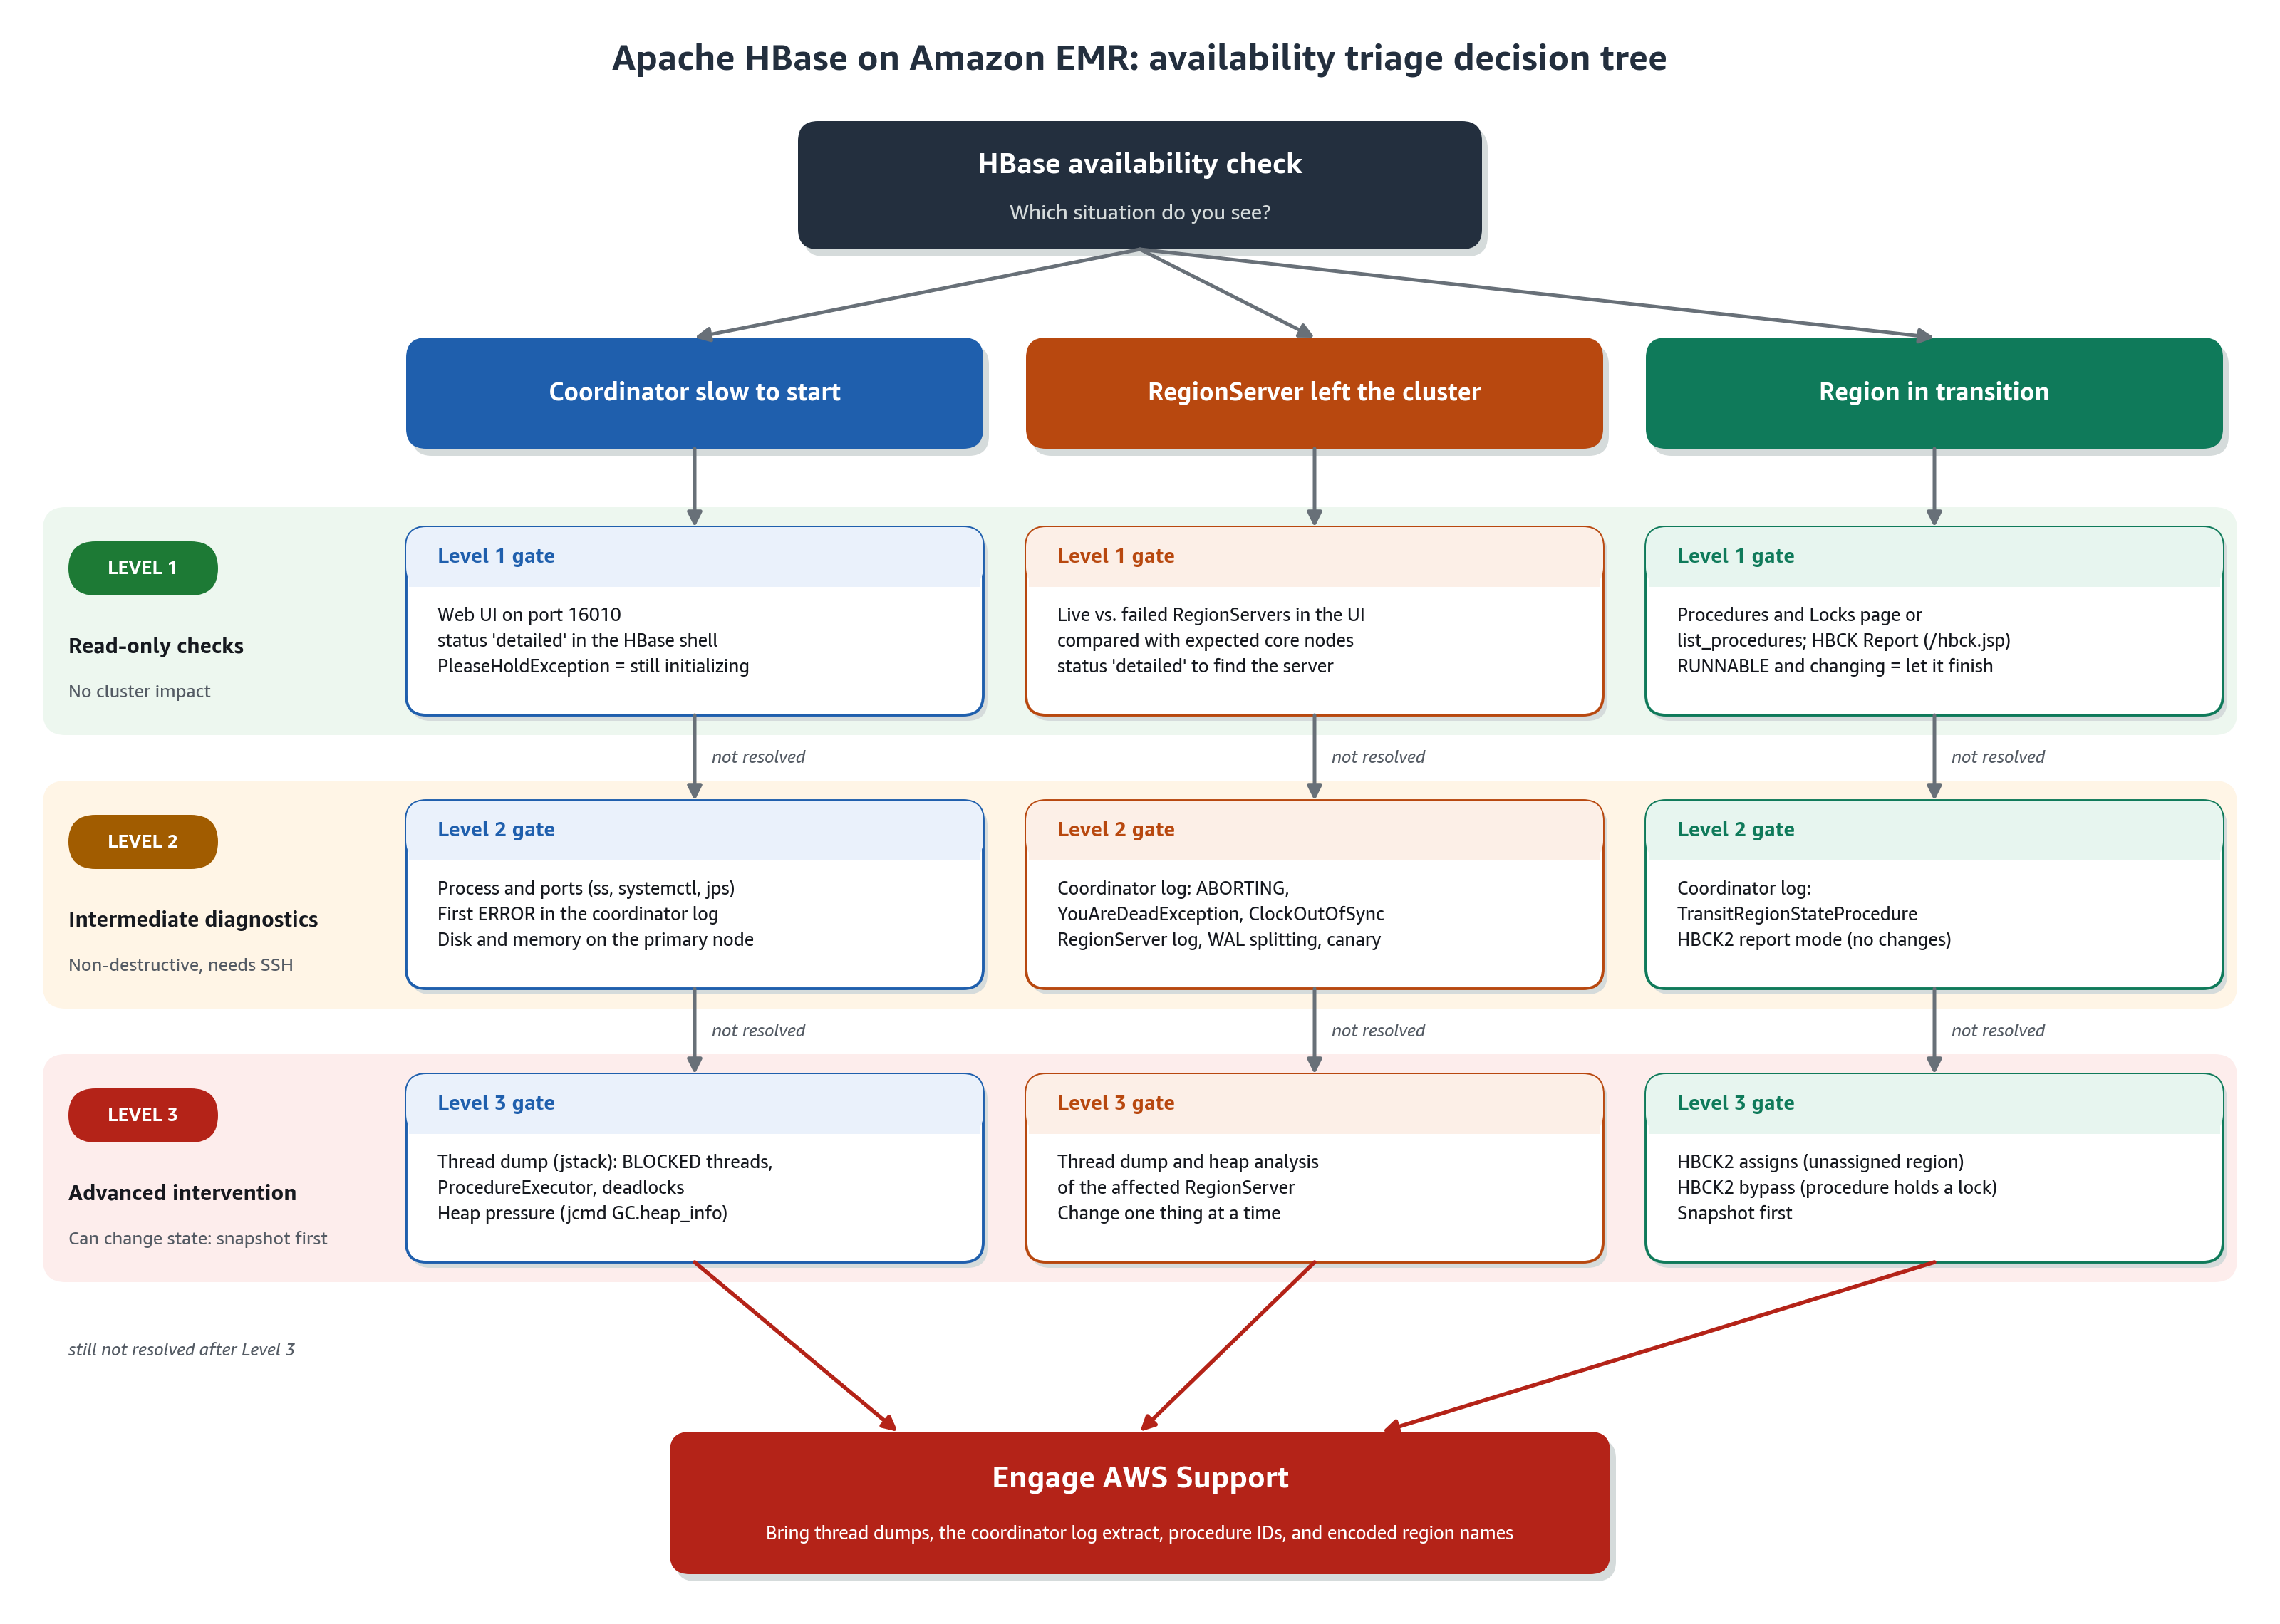
Figure 2: HBase availability triage decision tree, where each of the three situations flows through a Level 1 read-only gate, a Level 2 diagnostics gate, and a Level 3 intervention gate before you engage AWS Support
Restore an HBase coordinator that is slow to start
The HBase coordinator runs on the Amazon EMR primary node and handles region assignments, RegionServer health monitoring, and failover. While the coordinator in your HBase cluster initializes, your RegionServers keep serving the regions they already host, so your clients can continue to read from and write to those regions. Until the coordinator finishes initializing, your HBase cluster can’t start new work, such as reassigning regions or recovering from a RegionServer loss. You also can’t run administrative operations such as creating a table. Your goal is to bring it to a fully initialized state quickly.
A coordinator that is slow to finish starting usually points to one of these areas: HDFS, the Java virtual machine (JVM), ZooKeeper, Amazon S3 throttling, or a known Apache HBase behavior already addressed in a later release.
Step 1 (Level 1): Confirm the current state
These checks are read-only.
- Check the HBase web UI on port 16010. If it loads, the coordinator process is running. A coordinator that is running but reports
Initializingfor a long time usually means the coordinator cannot assignhbase:meta. You troubleshoot this situation differently from one where the coordinator is not running at all. - Check cluster status from the shell:
If this returns a
PleaseHoldException, the coordinator is running but has not finished initializing. If no coordinator is found, go to Level 2. - Identify the active coordinator (on a cluster with multiple primary nodes):
- Review cluster events and the Amazon EMR console. Note when the coordinator stopped responding, and whether an instance event, scaling action, or configuration change lines up with it.
Step 2 (Level 2): Check the process, ports, and resources
This helps you tell “the coordinator is not running” apart from “I cannot reach the coordinator”:
A process ID (PID) that changes each time you check tells you the coordinator is restarting repeatedly. That is a useful signal, because the explanation sits at the end of each log cycle.
- Find the first error in the coordinator log (
hbase-hbase-master-*.log): - Check resources. A full disk on the primary node often causes this problem, so check disk usage early:
- Search for known log signatures. See the Quick reference table at the end of this post.
Log locations (see View Amazon EMR log files):
- HBase logs are in
/var/log/hbase/. - ZooKeeper logs in
/var/log/zookeeper/. - HDFS logs in
/var/log/hadoop-hdfs/. - Archived copies are in
/mnt/var/log/and in the Amazon S3 log URI under<cluster-id>/node/<instance-id>/applications/hbase/.
Confirm the paths with ls /var/log on your cluster, because they have varied across releases.
Step 3 (Level 3): Inspect a coordinator that is running but not yet progressing
When the coordinator is running but has not yet made progress, and the log hasn’t pointed you to a cause, SSH into the primary node for a deeper look.
- Take a thread dump of the coordinator. Capture the process ID first:
Look for
BLOCKEDthreads, threads namedProcedureExecutor, and any deadlock section. - Check heap pressure:
Heap dumps are expensive. A full heap dump with jmap -dump pauses the JVM for as long as it takes to write the file. The jmap -histo:live command also pauses the JVM, because the :live option forces a full garbage collection before it builds the histogram. On a large coordinator heap, that pause can be noticeable, so treat jmap -histo:live as a Level 3 action. The jcmd GC.heap_info check shown earlier doesn’t pause the JVM.
HDFS and the NameNode
In HDFS storage mode, the coordinator doesn’t finish initializing until HDFS is fully available:
Check the NameNode logs in /var/log/hadoop-hdfs/. On clusters with multiple primary nodes, also check the standby NameNode. Check the DataNodes for missing blocks or full disks as well.
Log signatures to look for include SafeModeException, BlockMissingException, cannot obtain block length for LocatedBlock, and NoRouteToHostException. Resolve HDFS first, then restart the coordinator.
JVM and garbage collection
The coordinator runs as a JVM, so garbage collection (GC) pauses can cause it to lose its ZooKeeper session and trigger a failover:
Occasional sub-second pauses are normal. Repeated multi-second pauses are what to address. If the heap is undersized, raise the coordinator heap through the hbase-env configuration classification, and review the GC log configuration in /etc/hbase/conf/hbase-env.sh. Treat repeated failovers caused by pauses as a capacity signal.
ZooKeeper
HBase uses Apache ZooKeeper for coordinator election, RegionServer registration, and startup coordination, so a ZooKeeper condition often affects several components at once:
Inspect the HBase znodes if needed:
Resolve the ZooKeeper condition before you restart the coordinator.
Warning: Don’t delete HBase znodes. Removing
/hbaseor its children can discard the region assignment state that HBase needs in order to recover, which makes recovery significantly harder. Engage AWS Support if you need help with the HBase ZooKeeper state.
Amazon S3 request throttling
This section applies to HBase on Amazon S3 only. If the coordinator log shows the following, Amazon S3 is throttling your requests:
Step 1: Confirm it is throttling by counting occurrences rather than reacting to a single line:
Step 2: Increase the EMRFS retry limit. By default, EMRFS uses an exponential backoff strategy and retries Amazon S3 requests up to 15 times. Raise the limit through the emrfs-site configuration classification:
For large clusters, you can instead turn on the additive-increase/multiplicative-decrease (AIMD) retry strategy. It’s supported on Amazon EMR releases 6.4.0 and later, and it adapts the request rate based on recent successful requests. For details on both strategies, see Retry Amazon S3 requests with EMRFS. A higher retry limit helps during short periods of throttling. If throttling is continuous, additional retries convert errors into latency, so also reduce the request rate as described in Step 3.
Step 3: Reduce or spread the request rate. Lower compaction pressure (covered in Part 2 of this series). Make sure the local block cache is working so that reads don’t go to Amazon S3 unnecessarily, and spread load across prefixes. See Resolve HTTP 503 “Slow Down” AmazonS3Exception in Amazon EMR and Best practices design patterns: optimizing Amazon S3 performance.
Check whether a later release includes a fix
Before you begin a deep investigation, check whether your symptom is a known bug already fixed in a later release. Read the “Changes, enhancements, and resolved issues” section of the Amazon EMR release guide for releases after yours. Then search for the exact exception in the Apache HBase JIRA. Search for the exception class and the stack trace, because many different causes can produce the same symptom.
Keep RegionServers healthy and recover them quickly
RegionServers host the regions that serve client reads and writes. If a RegionServer leaves your cluster, you are responsible for confirming that the HBase coordinator on your primary node moved that server’s regions to your remaining RegionServers, finding out why the server left, and taking steps to prevent a repeat. Read the coordinator log before the RegionServer log, because the coordinator records why it marked the server as gone, and that is the most direct path to the root cause.
Recover a RegionServer that stopped or won’t rejoin the cluster
Step 1 (Level 1): In the HBase web UI, compare the live and failed RegionServer lists against the number of core nodes you expect. Run status 'detailed' to see which server stopped reporting, so you know exactly where to focus.
Step 2 (Level 2): Read the coordinator log first:
A RegionServer writes ABORTING to its log when it shuts itself down after a fatal error. A YouAreDeadException means the ZooKeeper session expired, usually because of a GC pause. A ClockOutOfSyncException means there is time skew between nodes, so check the time service.
Then read that server’s own log on the core node:
In HDFS mode, check the DataNode for missing blocks or failed volumes. Check the node itself:
Check WAL splitting progress. Slow WAL splitting can make recovery appear to stall after a RegionServer is lost:
Use the canary tool to confirm which tables and regions are affected, instead of inferring it from client errors:
The canary tool writes its results to the console, including each region that it couldn’t read, and saves a log of the results to /var/log/hbase/hbase.log.
Resolve regions that stay in transition (RIT)
A region enters transition state when your HBase cluster opens, closes, splits, or merges the region. HBase typically completes these transitions in seconds as part of normal cluster operations. If a region stays in transition for more than a few minutes, it is worth a closer look. One of these situations typically explains it:
- A split was in progress when the RegionServer restarted.
- A ZooKeeper session change occurred partway through.
- The RegionServer JVM paused for GC, so the transition didn’t complete.
- A coordinator failover happened during the transition.
Work through the following steps in order.
Step 1 (Level 1): Confirm it is still in transition. Check the UI and note the region, the duration, and the owning procedure from the Procedures and Locks page, or run list_procedures. If the procedure is RUNNABLE and its state changes between checks, let it finish.
Step 2 (Level 2): Find what is blocking it:
Inspect and report region and meta inconsistencies
If the region is still in transition, inspect and report inconsistencies before you attempt any repair.
Step 1 (Level 1): Confirm without changing anything. Open the HBCK Report tab in the HBase web UI (HBase 2.1.6 and later, at /hbck.jsp). Check the Regions in Transition list and the Procedures and Locks page. Confirm the table state:
Step 2 (Level 2): Report the inconsistency. For Amazon EMR 6.x and 7.x (HBase 2.x), use HBCK2 in report mode through bin/hbase with the -j option.
Note: The HBCK2 jar path and version shown in the following commands are examples. Before you run these commands, verify the actual jar location and version on your cluster with
find / -name "hbase-hbck2*.jar" 2>/dev/null.
For Amazon EMR 5.x (HBase 1.x), use sudo -u hbase hbase hbck -details to report state. Don’t run HBCK1 repair commands against Amazon EMR 6.x or 7.x clusters. HBCK1’s write facility (-fix) has been removed, and its assessments of an HBase 2.x cluster are inaccurate because it doesn’t understand the internal workings of HBase 2.x.
Step 3 (Level 3): Apply a targeted fix. If a region is unassigned, use HBCK2 assigns. If a procedure is holding a lock, use HBCK2 bypass. Take a snapshot first, and change one thing at a time.
Step 4 (Level 3): Escalate. If clearing znodes looks like the answer, open a case with AWS Support instead. Have your thread dumps, coordinator log extract, procedure IDs, and encoded region names ready.
Quick reference: Log signatures
Search for the first occurrence of a signature. The first error usually identifies the cause:
| Log signature | What it means | Where to look next |
SafeModeException |
HDFS is in safe mode | Resolve HDFS. Check the NameNode logs |
BlockMissingException |
Missing HDFS blocks | Run hdfs fsck. Check the DataNodes |
SessionExpired / ConnectionLoss |
ZooKeeper session lost | Check the ZooKeeper logs and GC pauses |
YouAreDeadException |
The RegionServer’s ZooKeeper session expired | GC pause or network partition |
ClockOutOfSyncException |
Time skew between nodes | Check the Network Time Protocol (NTP) or time service |
503 Slow Down |
Amazon S3 request throttling | Increase EMRFS retries. Spread prefixes |
JvmPauseMonitor / Detected pause in JVM |
GC pause | Check heap sizing. Review the GC logs |
PleaseHoldException |
The coordinator has not finished initializing | Wait. Check whether hbase:meta can be assigned |
Conclusion
In this post, you learned a repeatable way to keep Apache HBase on Amazon EMR highly available by resolving three common situations: a coordinator that is slow to initialize, a RegionServer that leaves the cluster, and regions that stay in transition. Start with the read-only Level 1 checks, use Level 2 log analysis to confirm the cause, and reach for the Level 3 tools only after you’ve confirmed it. Take a snapshot first and make one change at a time.
Part 2 of this series covers slow reads and writes caused by compaction: how to confirm that compaction is the cause, which parameters to tune first, and when to contact AWS Support.
Next steps:
- Read Part 2 of this series for compaction tuning and guidance on when to contact AWS Support.
- Review the HBase guidance in the Amazon EMR best practices guide.
About the authors
Unlocking full-stack observability for AWS Outposts
Post Syndicated from Aishwariya Khiani original https://aws.amazon.com/blogs/compute/unlocking-full-stack-observability-for-aws-outposts/
Your team just deployed AWS Outposts to run latency-sensitive workloads on-premises, and now you need to monitor infrastructure that spans both your data center and an AWS Region. Some services run locally on the Outposts, and others depend on Regional endpoints. A network blip between the two can cause silent failures that traditional monitoring tools miss entirely.
AWS Outposts extends native AWS services to on-premises environments, but this hybrid topology introduces monitoring challenges that don’t exist in pure-cloud or pure-on-premises setups. Control planes are distributed, critical operations depend on AWS Region connectivity, and fixed, finite capacity requires proactive capacity planning.
In this post, you will learn how to build end-to-end observability for Outposts using AWS Systems Manager, Amazon CloudWatch, and Amazon EventBridge, covering four monitoring dimensions:
- Network – Connectivity status, BGP sessions, and Regional service dependency tracking.
For dependency tracking, watch each Regional service’s own CloudWatch metrics together with the service-link ConnectedStatus: that pairing tells a dependency failure apart from a connectivity drop. For example, AWS Directory Service (DirectoryReachability, AuthenticationFailures), Amazon Relational Database Service (Amazon RDS) (ReplicaLag, DatabaseConnections), and so on.
- Storage – Amazon Simple Storage Service (Amazon S3) on Outposts capacity, Amazon Elastic Block Store (Amazon EBS) volume utilization, and replication health.
- Compute – Instance-level metrics, micro-architectural performance, and enhanced networking.
- Containers – Amazon Elastic Kubernetes Service (Amazon EKS) on Outposts with Prometheus-based Kubernetes monitoring.
By the end, you will have a monitoring architecture that gives you unified visibility across your hybrid environment and catches issues before your users do.
Building a monitoring foundation with AWS Systems Manager
The following sections detail how to configure each component of the Systems Manager foundation for your Outposts environment.
Centralized management architecture
Systems Manager provides the foundation for Outposts monitoring with centralized management across hybrid environments. Configure it to span your cloud and on-premises infrastructure so you get unified visibility, automated operations, and consistent policy enforcement across your distributed AWS resources.
SSM Agent deployment
The Systems Manager agent (SSM Agent) is the basis for monitoring. Use the following commands to install the SSM Agent on your Outpost servers.
OpsCenter integration
Systems Manager OpsCenter provides incident management capabilities that extend beyond basic alerting:
- Automated OpsItem creation: Configure Amazon EventBridge to automatically create operational work items when specific conditions are met.
- Runbook integration: Link automated remediation runbooks directly to OpsItems for immediate response.
- Cross-service correlation: Aggregate related issues across multiple AWS services into single operational views.
- Historical analysis: Use OpsCenter’s data retention for trend analysis and continuous improvement.
Patch management strategy
Implement a patch management approach that addresses the unique requirements of Outposts:
Systems Manager Patch Manager requires the SSM Agent to communicate with Regional endpoints through the service link. If the service link is degraded, patching operations will fail.
Personal Health Dashboard integration
The integration between AWS Personal Health Dashboard (PHD) and OpsCenter creates a proactive monitoring workflow. When an Outposts health event occurs, this rule automatically creates an OpsItem in Systems Manager, giving your operations team a single view for triage.
Automated event processing
Configure Amazon EventBridge rules to automatically process PHD events:
Monitoring dimensions
This section covers the four key monitoring dimensions for Outposts, with specific metrics, configurations, and alerting strategies for each.
1. Network monitoring and notification
Network monitoring for Outposts requires approaches that account for the hybrid nature of the deployment:
Multi-layer connectivity monitoring
Implement monitoring across multiple network layers:
- Physical layer: Monitor fiber-optic connections, network equipment health, and environmental factors.
- ConnectedStatus.
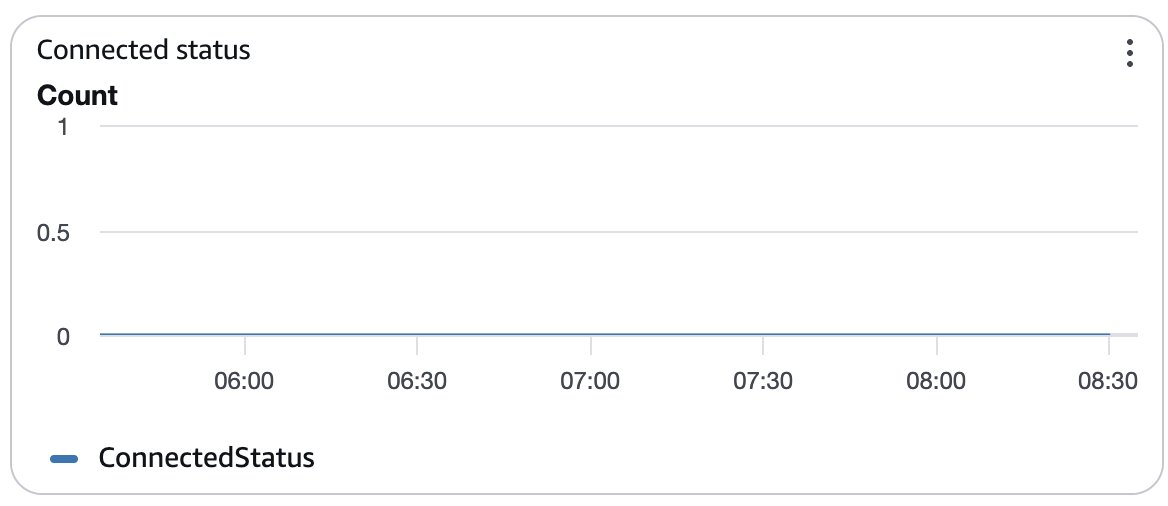
Figure 1: ConnectedStatus metric for the Outposts service link
- Network layer: Track routing, Border Gateway Protocol (BGP) sessions, and inter-rack connectivity.
- VIF metrics.
- VifBgpSessionState.
- VIF metrics.
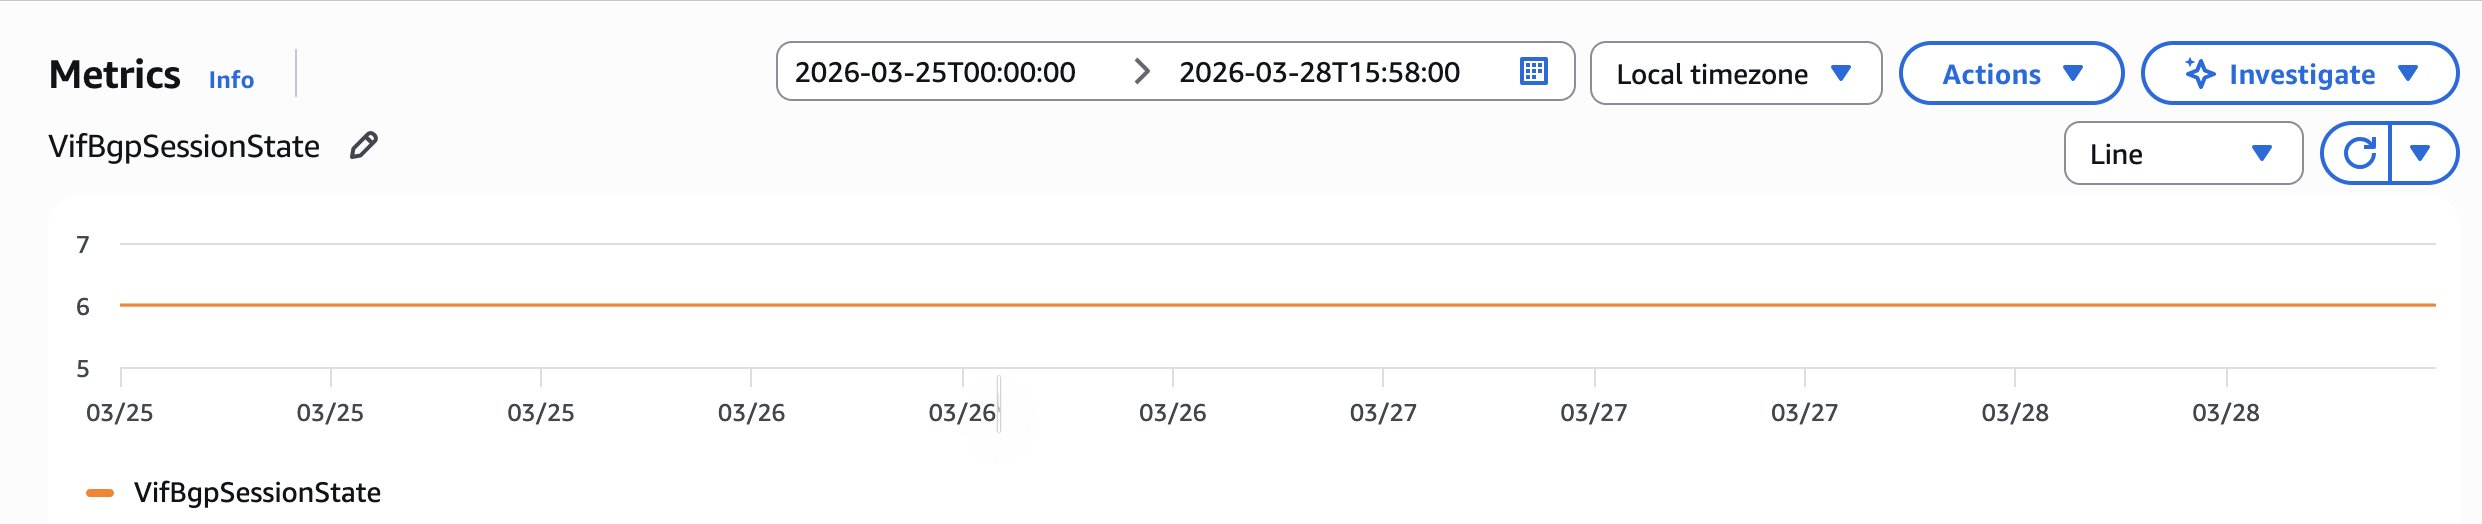
Figure 2: VifBgpSessionState metric for the Outposts virtual interface
- VifConnectionStatus.
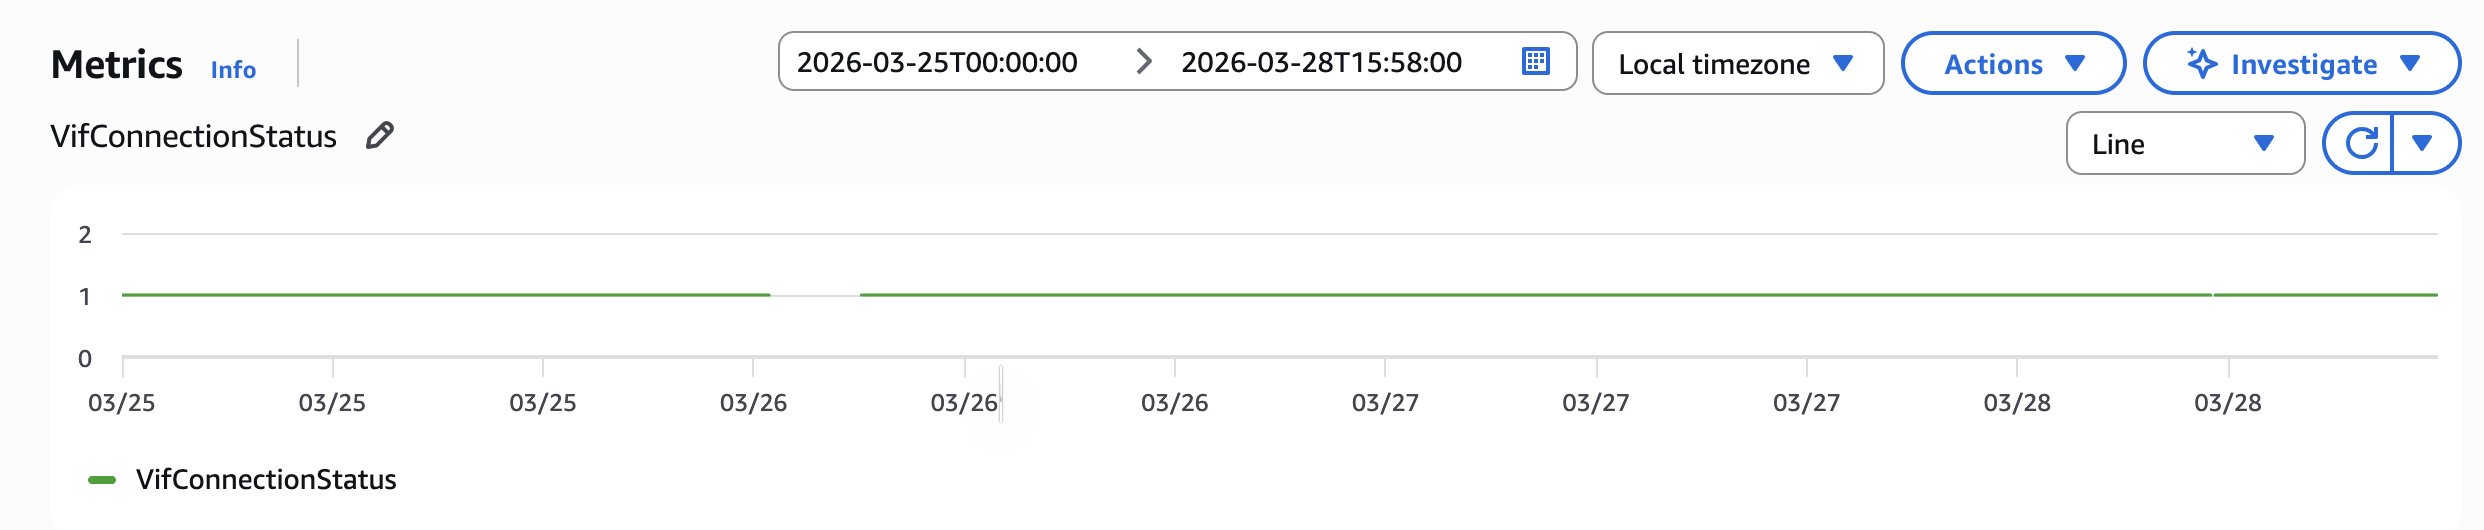
Figure 3: VifConnectionStatus metric for the Outposts virtual interface
- IfTrafficIn.
- IfTrafficOut.
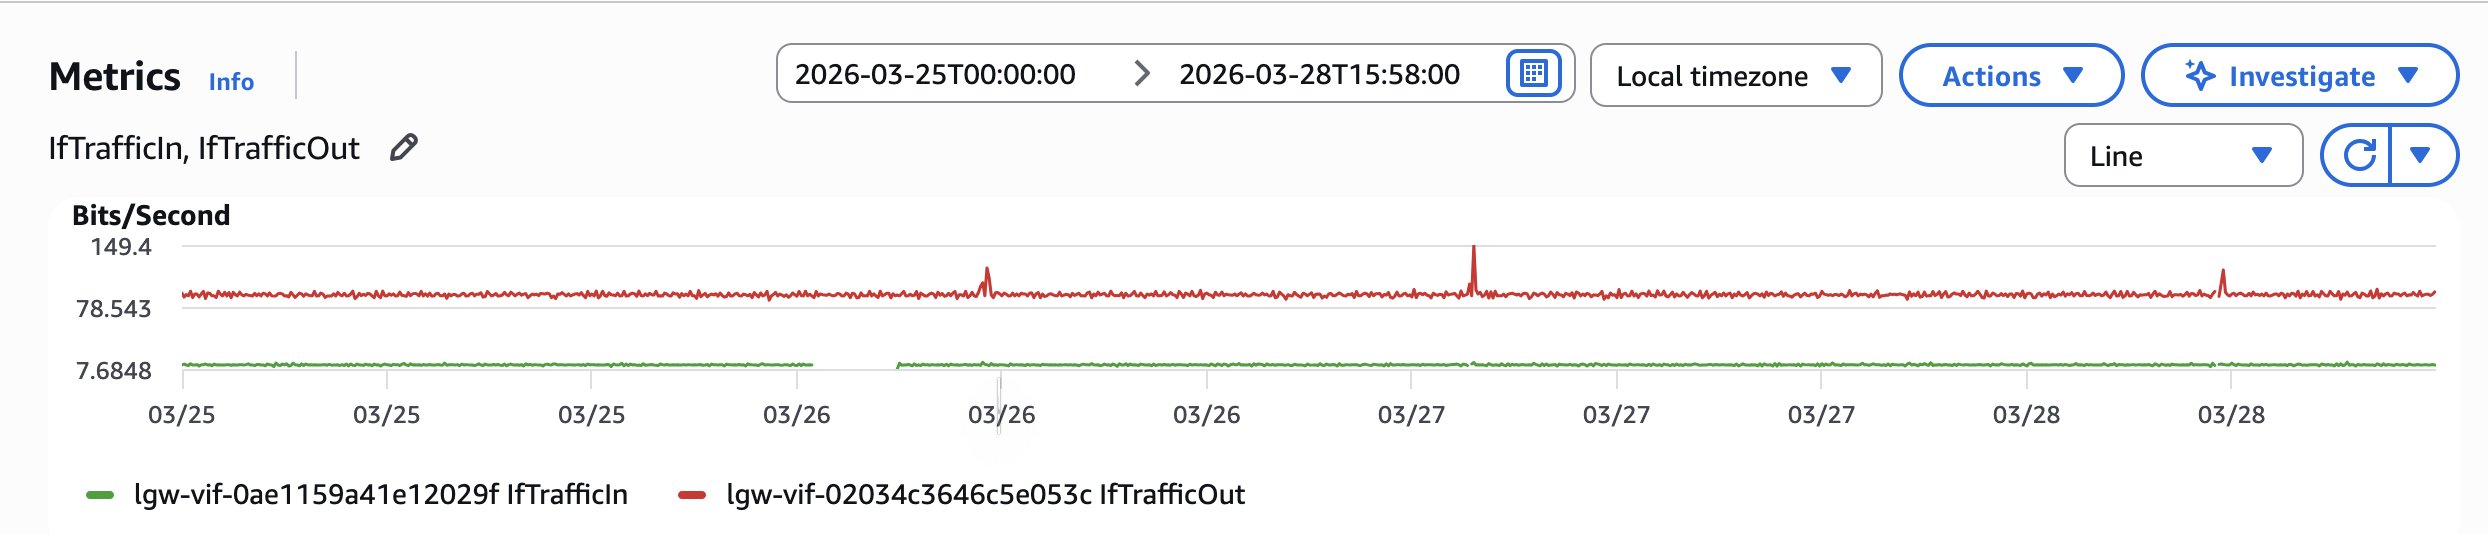
Figure 4: IfTrafficIn and IfTrafficOut metrics for Outposts network traffic
- CapacityExceptions.
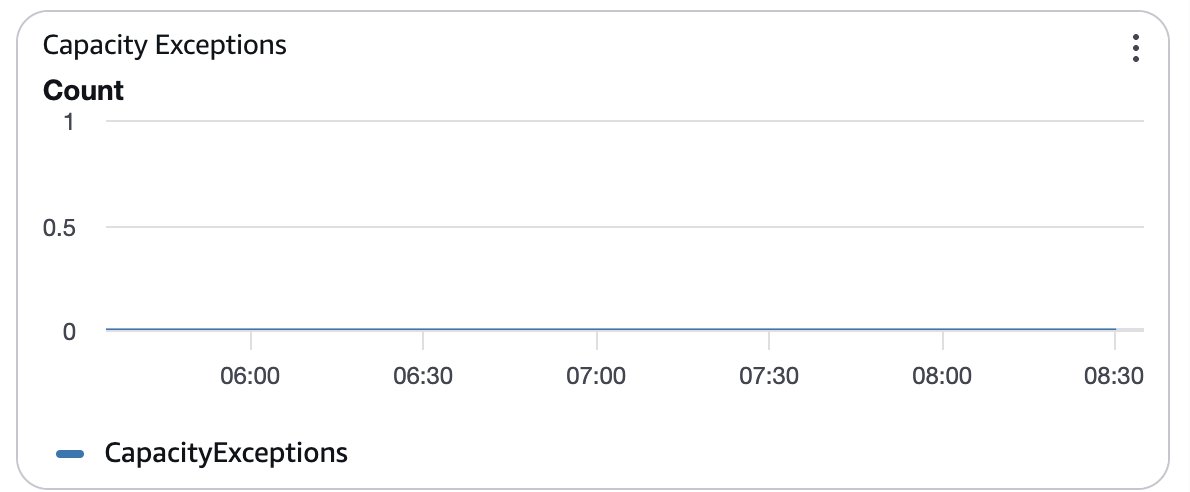
Figure 5: CapacityExceptions metric for the Outposts link
- LagStatus:.
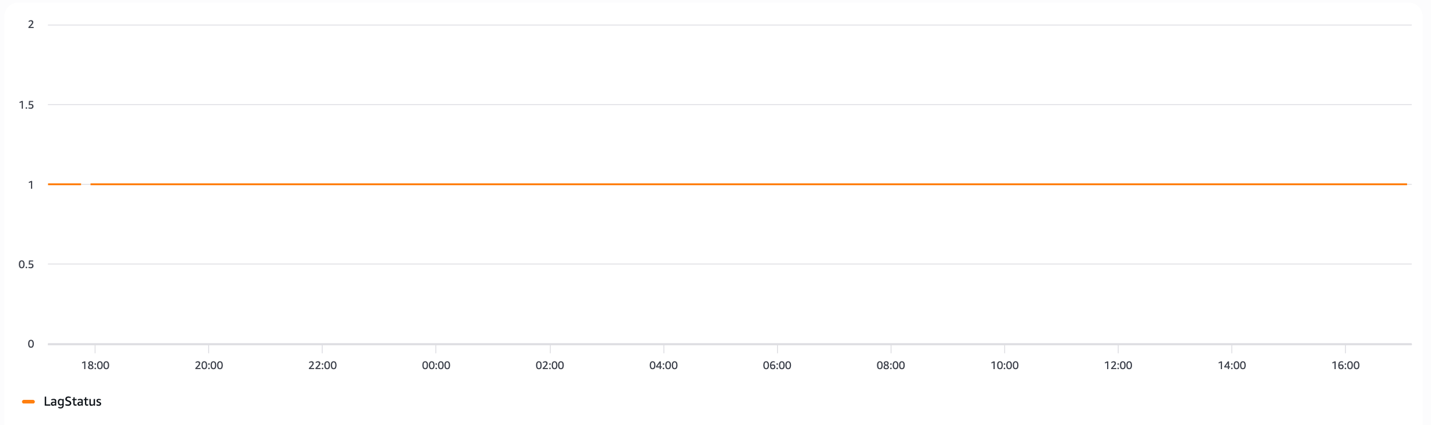
Figure 6: LagStatus metric for the Outposts link aggregation group
Regional service dependency mapping
Create detailed dependency maps for critical Regional services:
- Amazon Elastic File System (Amazon EFS): Monitor mount target availability and performance across Availability Zones.
- AWS Directory Service: Track authentication latency and success rates.
- Amazon RDS: Monitor cross-Region replication lag and connection pooling.
- AWS Lambda: Track cold start times and execution duration for Region-dependent functions.
2. Storage monitoring and optimization
Outposts provides CloudWatch metrics for both Amazon S3 and Amazon EBS storage resources. Monitor these metrics to track capacity utilization and plan for scaling.
S3 metrics:
The S3Outposts namespace includes the following metrics for Amazon S3 on Outposts buckets. You can monitor the total number of S3 on Outposts bytes provisioned, the total available bytes for objects, and the total size of all objects for a given bucket. Bucket or account-related metrics exist for all direct S3 usage.
- OutpostTotalBytes: The total provisioned capacity in bytes for an Outpost.
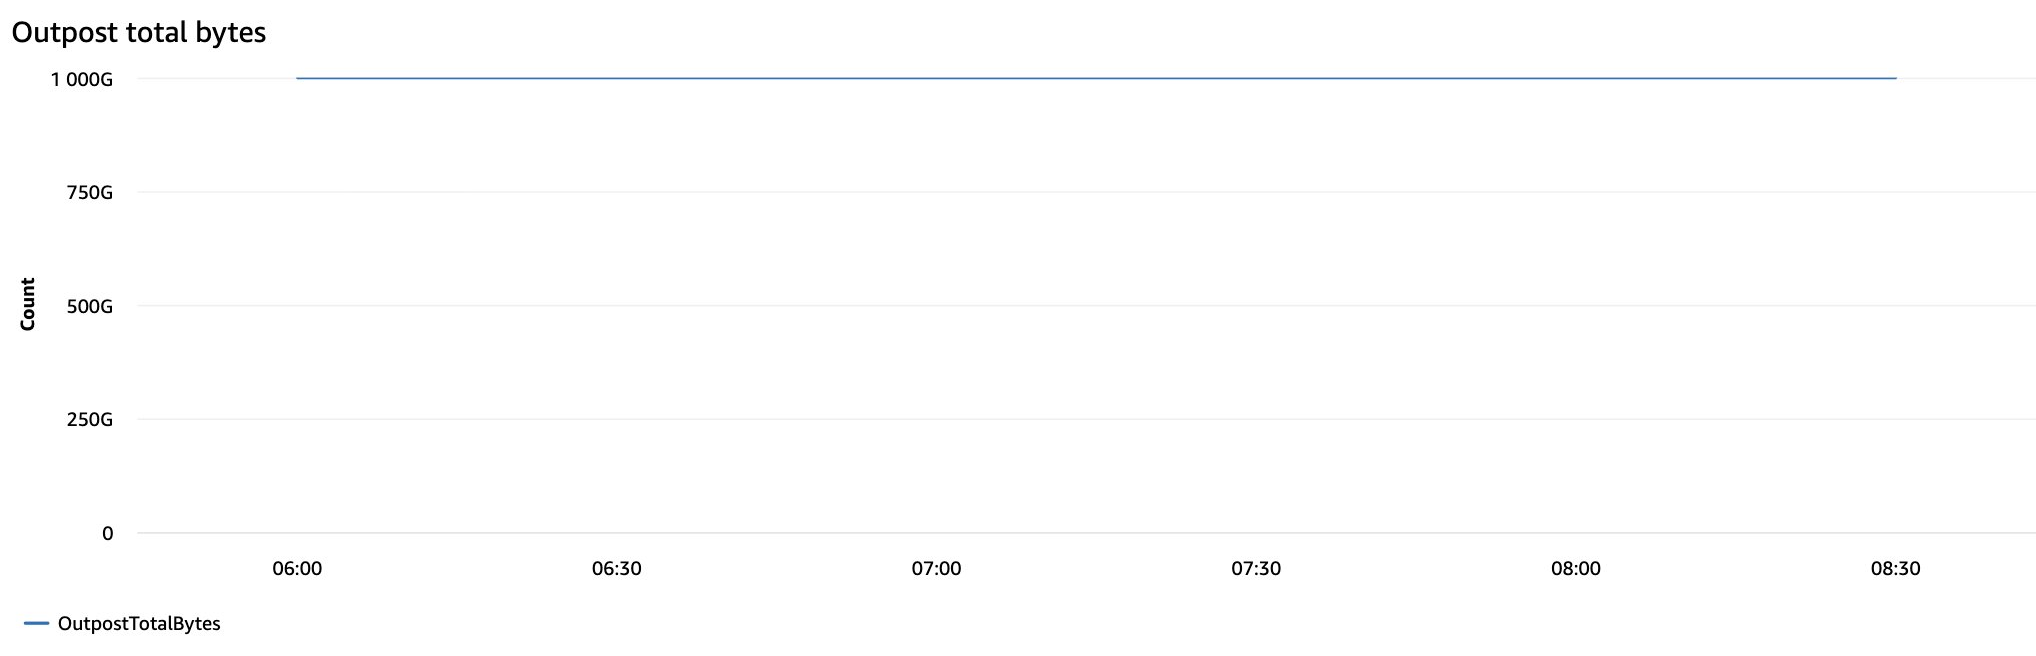
Figure 7: OutpostTotalBytes metric for S3 on Outposts provisioned capacity
- OutpostFreeBytes: The count of available bytes on an Outpost to store customer data. BucketUsedBytes: The total size of all objects for the given bucket.
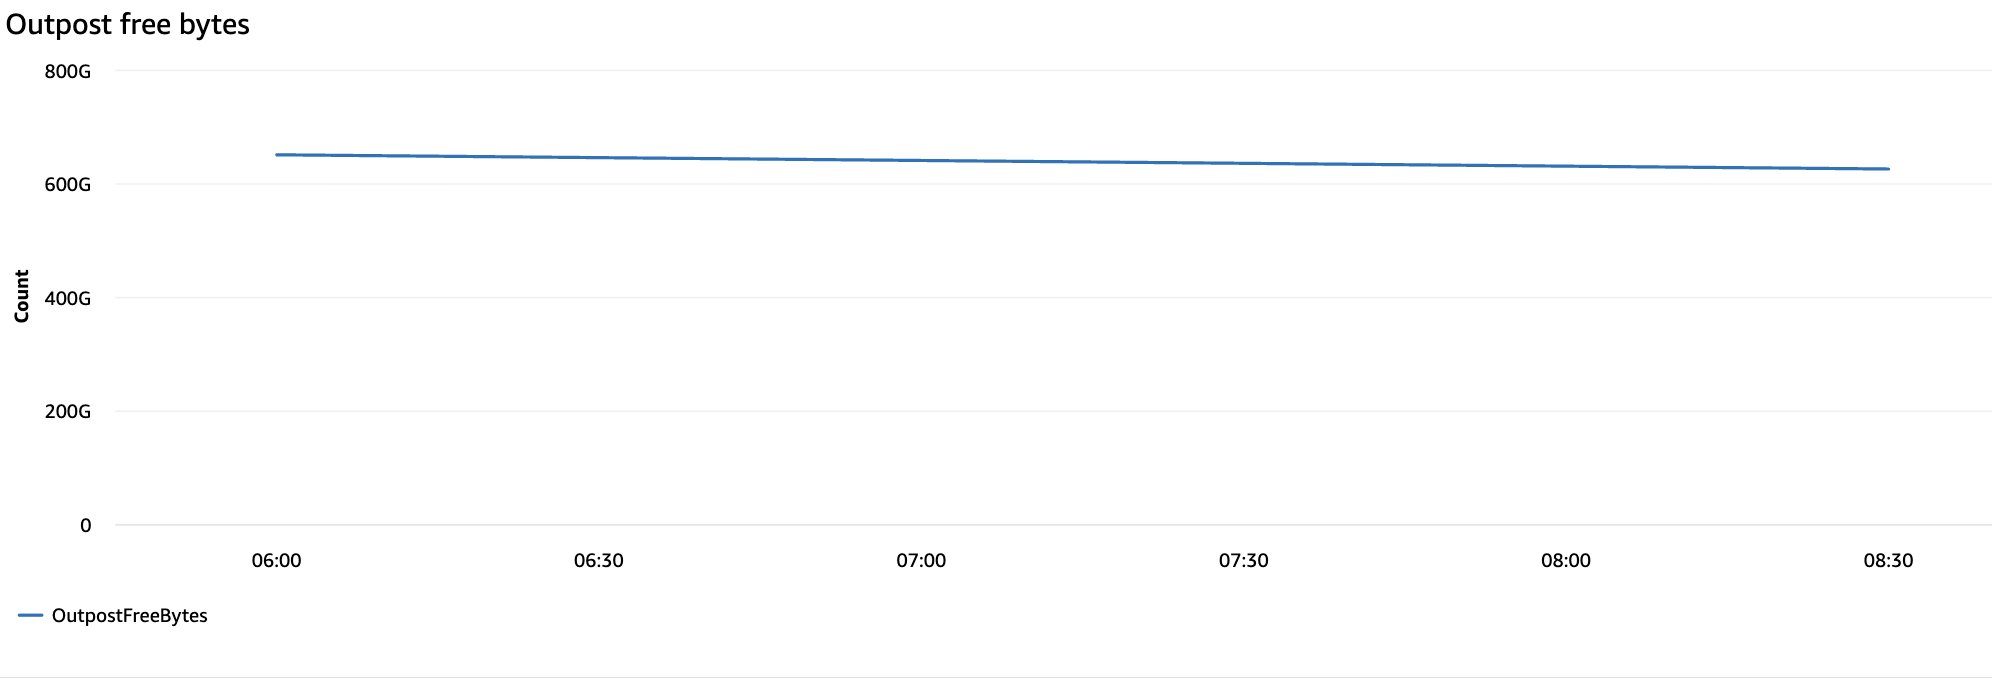
Figure 8: OutpostFreeBytes metric for available S3 on Outposts capacity
Other key metrics to monitor include the following:
- AccountUsedBytes: The total size of all objects for the specified Outposts account.
- BytesPendingReplication: The total number of bytes of objects that are pending replication for a given replication rule. For more information about how to enable replication metrics, see Creating replication rules between Outposts.
- OperationsPendingReplication: The total number of operations that are pending replication for a given replication rule.
Amazon EBS performance deep dive
The following Amazon EBS metrics are available for Outposts volumes:
- EBSVolumeTypeCapacityUtilization: The percentage of Amazon EBS volume type capacity in use.
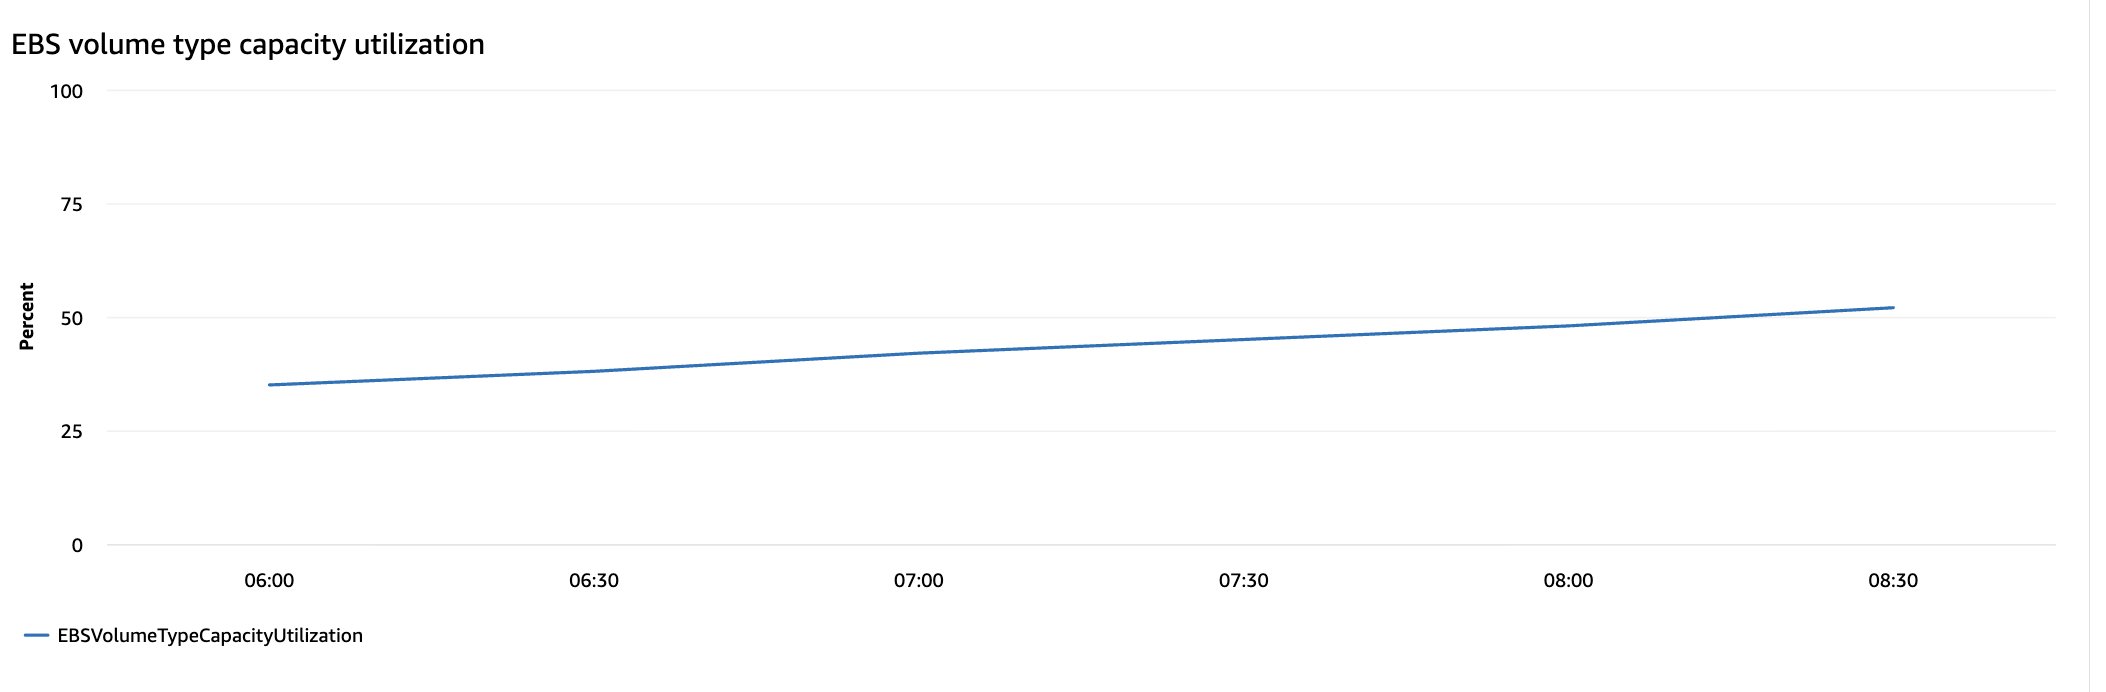
Figure 9: EBSVolumeTypeCapacityUtilization metric for Outposts Amazon EBS volumes
- EBSVolumeTypeCapacityAvailability: The percentage of Amazon EBS volume type capacity available.
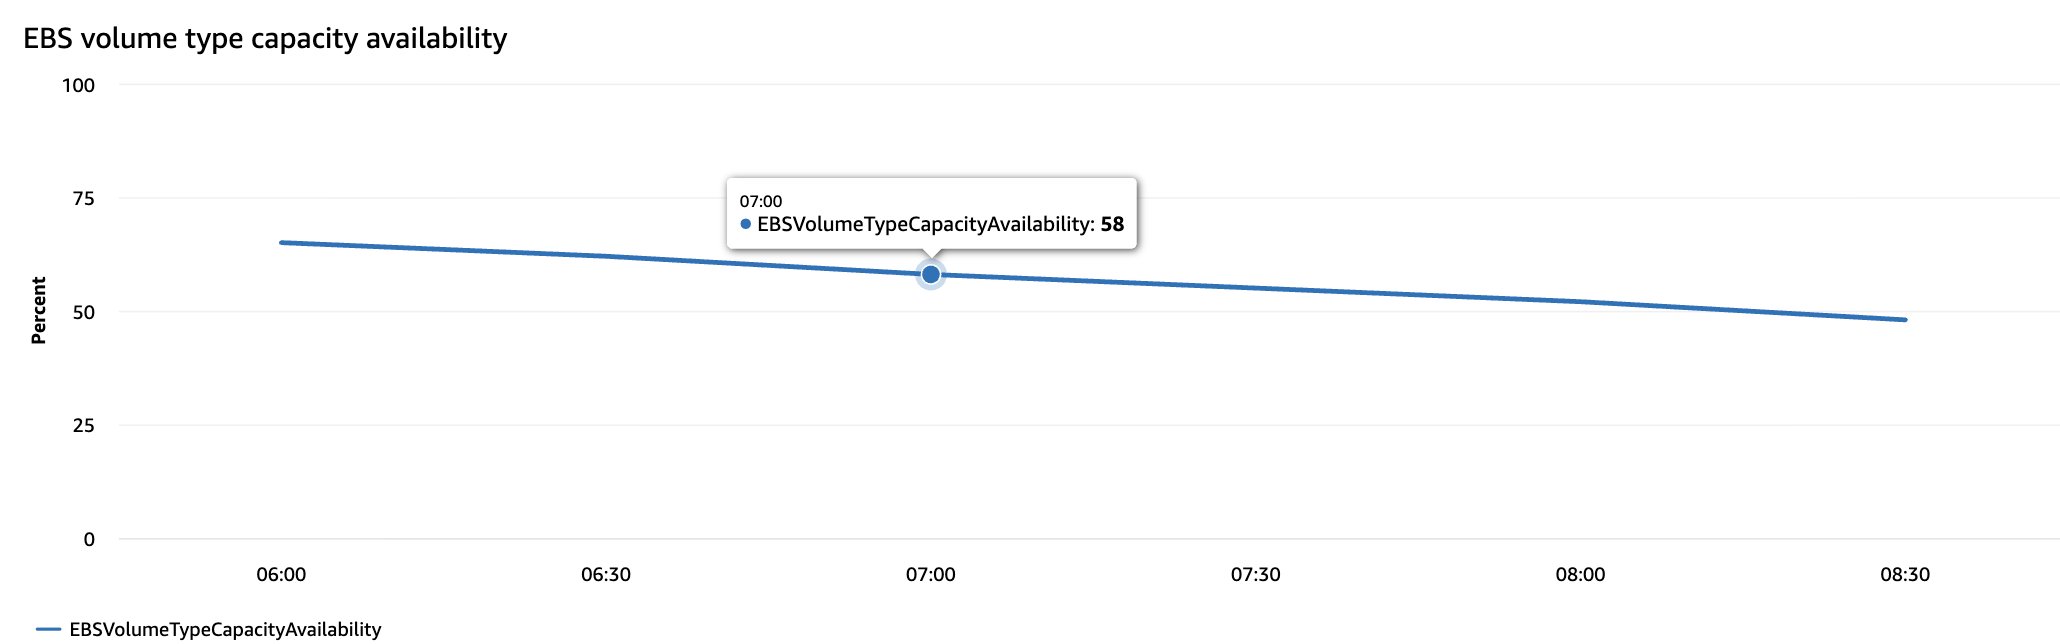
Figure 10: EBSVolumeTypeCapacityAvailability metric for Outposts Amazon EBS volumes
- EBSVolumeTypeCapacityUtilizationGB: The number of gigabytes in use for the Amazon EBS volume type.
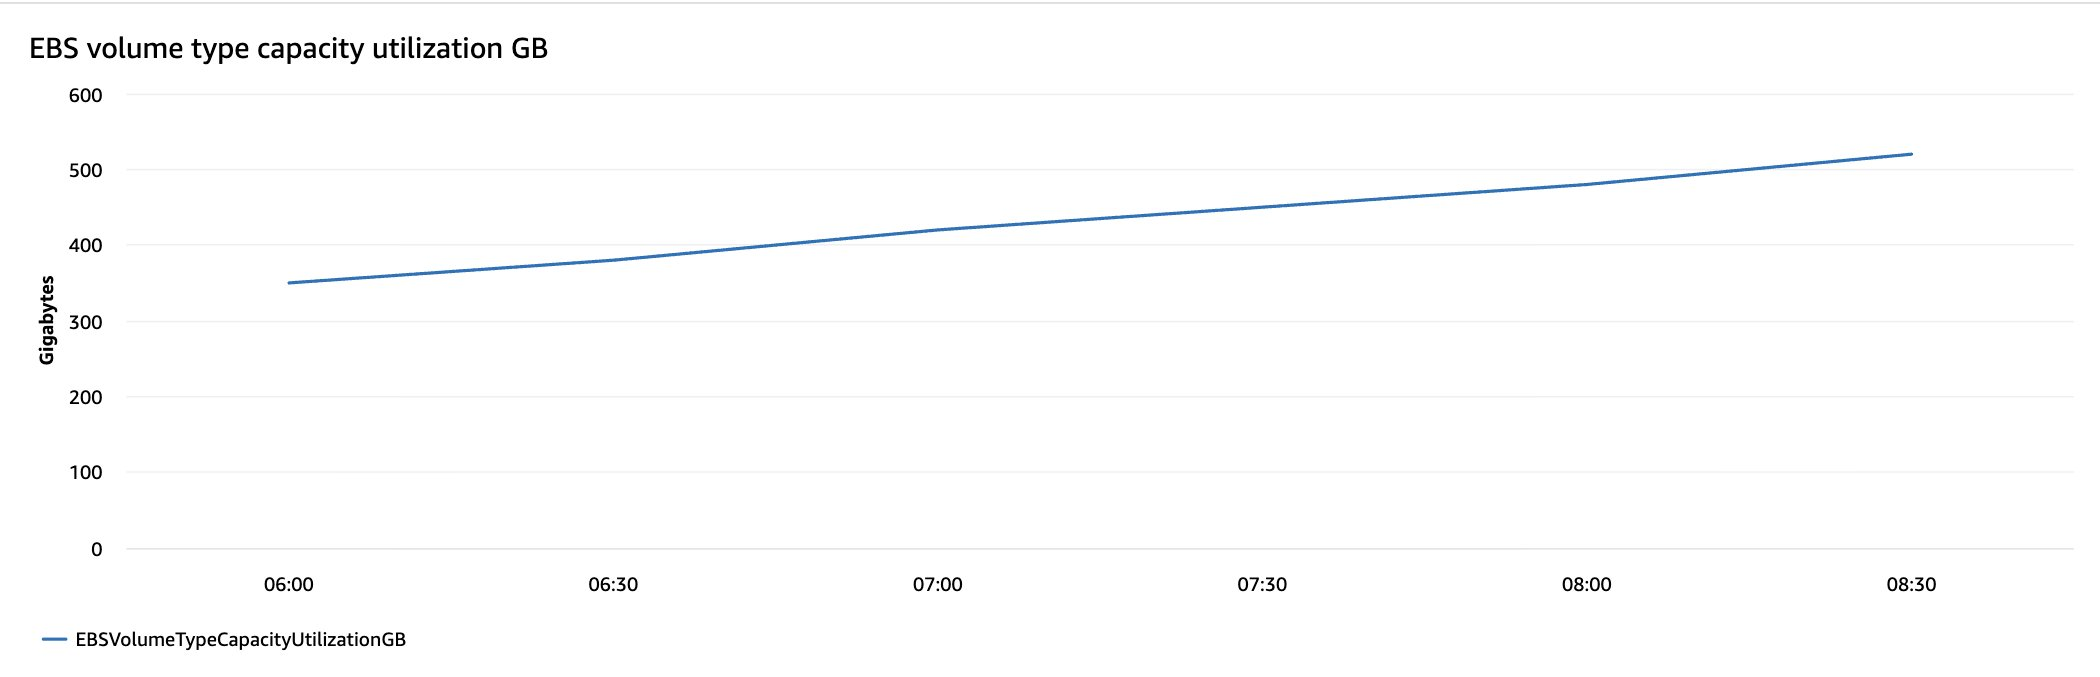
Figure 11: EBSVolumeTypeCapacityUtilizationGB metric for Outposts Amazon EBS volumes
- EBSVolumeTypeCapacityAvailabilityGB: The number of gigabytes of available capacity for the Amazon EBS volume type.
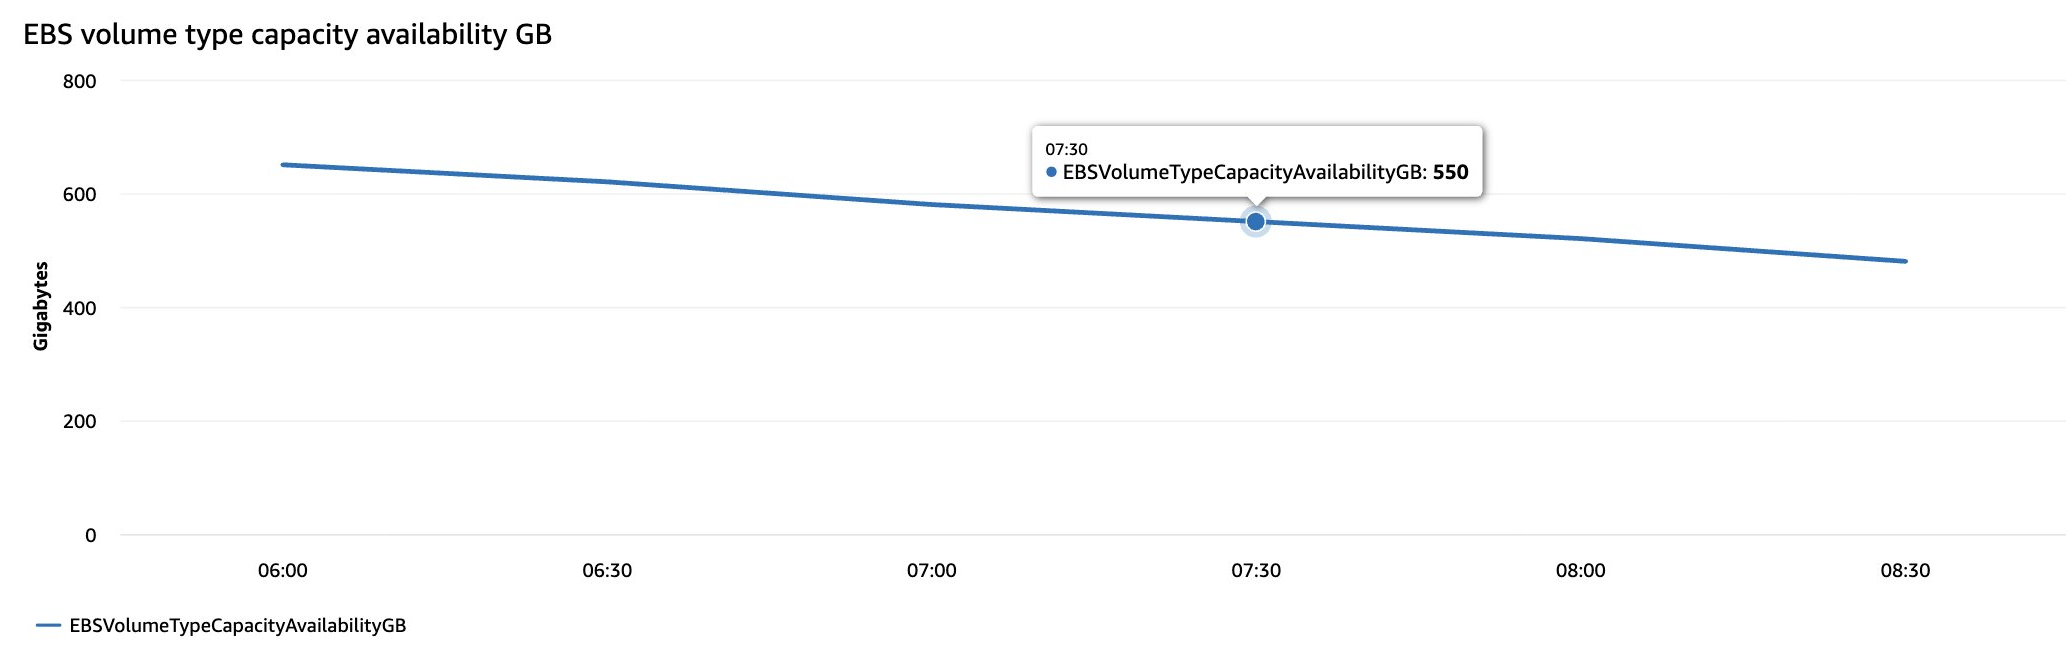
Figure 12: EBSVolumeTypeCapacityAvailabilityGB metric for Outposts Amazon EBS volumes
Note: Second-generation AWS Outposts racks support both gp2 and gp3 Amazon EBS volume types, whereas first-generation racks support gp2 only.
3. Compute and capacity monitoring
Outposts have a fixed capacity that doesn’t auto scale, so compute and capacity metrics are essential for planning. The following instance and capacity metrics are published to the AWS/Outposts namespace.
- Instance metrics.
UsedInstanceType_Count: The number of instance types that are currently in use, including any instance types used by managed services such as Amazon RDS or Application Load Balancer. This metric doesn’t include capacity for any Dedicated Hosts configured on the Outpost.
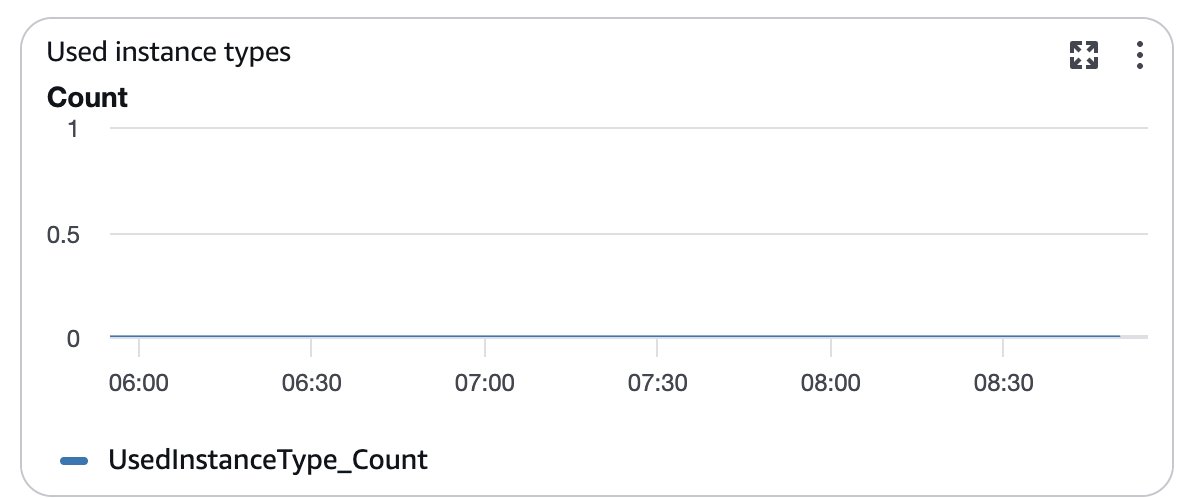
Figure 13: UsedInstanceType_Count metric for Outposts instance usage
InstanceTypeCapacityUtilization: The percentage of instance capacity in use. This metric does not include capacity for any Dedicated Hosts configured on the Outpost.
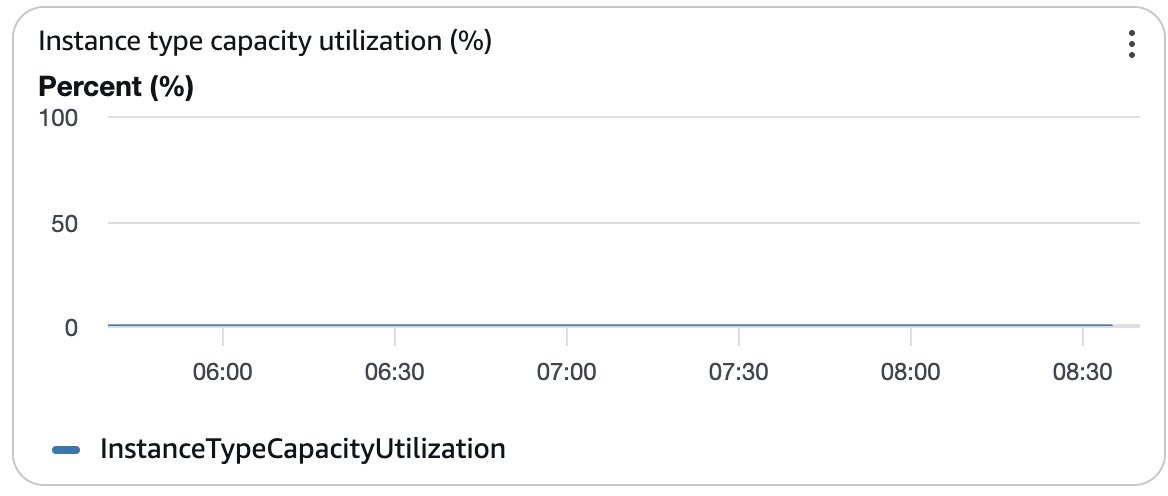
Figure 14: InstanceTypeCapacityUtilization metric for Outposts instances
InstanceTypeCapacityAvailability: The percentage of instance capacity available. This metric doesn’t include capacity for any Dedicated Hosts configured on the Outpost.
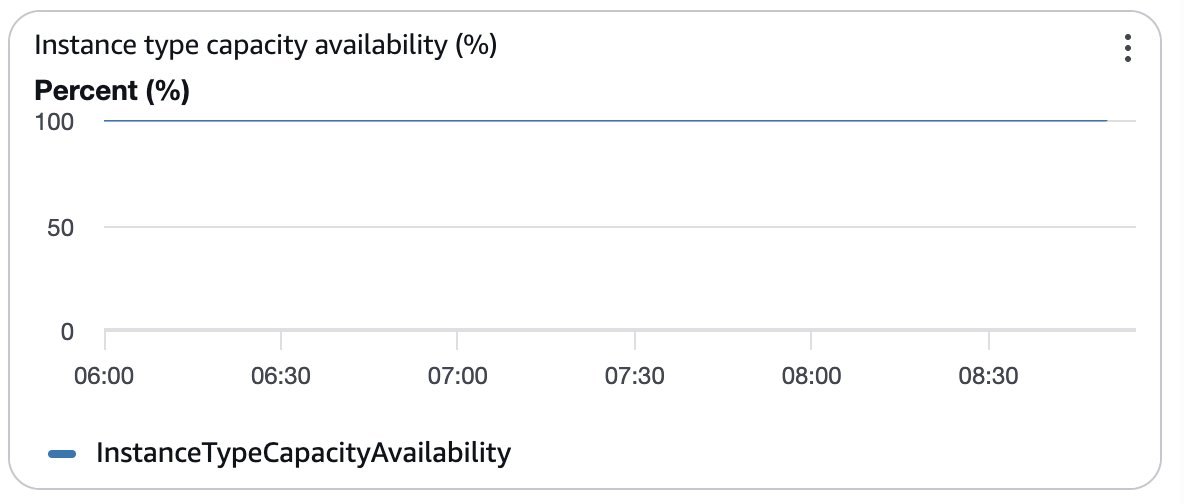
Figure 15: InstanceTypeCapacityAvailability metric for Outposts instances
InstanceFamilyCapacityAvailability: The percentage of instance capacity available. This metric does not include capacity for any Dedicated Hosts configured on the Outpost.
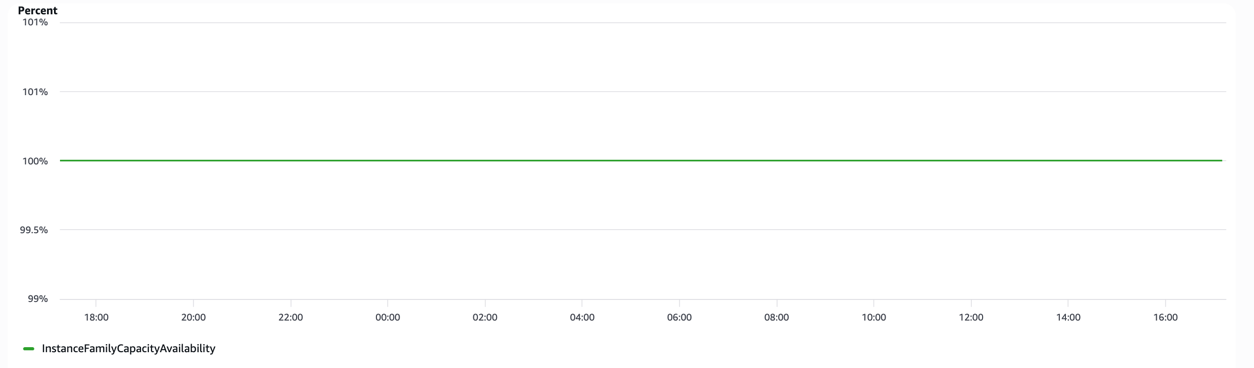
Figure 16: InstanceFamilyCapacityAvailability metric for Outposts instances
InstanceFamilyCapacityUtilization: The percentage of instance capacity in use. This metric doesn’t include capacity for any Dedicated Hosts configured on the Outpost.
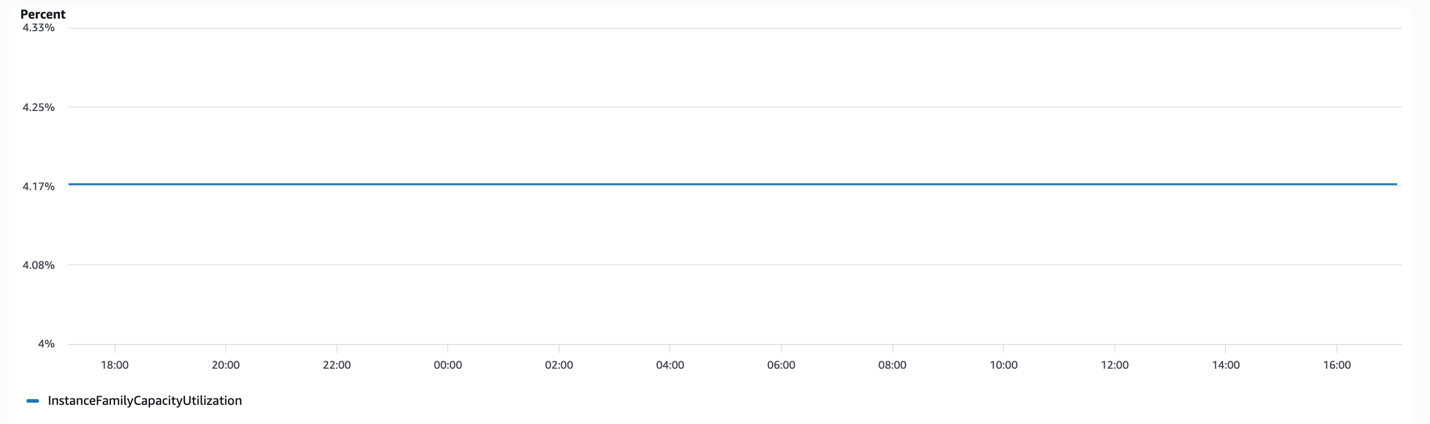
Figure 17: InstanceFamilyCapacityUtilization metric for Outposts instances
Monitoring EKS containers on AWS Outposts with Amazon CloudWatch
AWS Outposts extends AWS infrastructure to your on-premises environment. When running containerized workloads using Amazon EKS (extended clusters) on Outposts, monitoring is critical because unlike the Region, Outposts has fixed capacity that doesn’t auto-scale. Without proper monitoring, pods can fail to schedule, workloads can get OOMKilled, and disk pressure can cause evictions. All of this happens without warning.
This section walks through setting up CloudWatch Container Insights for EKS on Outposts, the key metrics to track, and how to build a unified monitoring dashboard.
Prerequisites
- An AWS Outposts rack deployed and connected to your parent Region.
- An EKS cluster with worker nodes running on the Outpost.
kubectlconfigured to access your cluster.- AWS Command Line Interface (AWS CLI) installed and configured.
Step 1: Launch self-managed worker nodes with Amazon Linux 2023 (AL2023) and nodeadm
Outpost subnets don’t support EKS managed node groups, so worker nodes come up as a self-managed node group launched from an EC2 launch template.
The AMI must be AL2023. Amazon EKS stopped publishing AL2 AMIs on November 26, 2025, and those images no longer receive security patches or bug fixes, as noted in the Amazon EKS AMI deprecation FAQs.
AL2023 also changes how a node initializes. It uses nodeadm rather than the AL2 bootstrap.sh script, so the user data becomes a YAML NodeConfig document instead of a shell script. AL2023 expects the cluster endpoint, certificate authority, and service CIDR to be passed in explicitly where AL2 discovered them at boot. Missing them is a common reason nodes launch but don’t join the cluster.
aws eks describe-cluster returns all three:
Step 2: Install the CloudWatch Observability add-on
On an extended cluster, use the CloudWatch Observability EKS add-on to enable Container Insights. The add-on deploys the CloudWatch agent and Fluent Bit as DaemonSets on your Outpost worker nodes, and it collects container, pod, node, and cluster-level metrics automatically.
You can also do this from the EKS Console under your cluster’s Add-ons tab.
Step 3: Verify the agent is running
Confirm that the CloudWatch agent pods are running on each node:
Expected output:
You should see one cloudwatch-agent pod per worker node.
Step 4: Verify metrics in CloudWatch
After 5–10 minutes, metrics start flowing into CloudWatch.
- Open the CloudWatch Console.
- Navigate to Metrics → All metrics.
- Look for the
ContainerInsightsnamespace. - You will see metrics grouped by Cluster, Node, Pod, Service, and Namespace.
Key metrics for EKS containers on Outposts
Here are the metrics that matter most, organized by level.
Cluster level
| Metric | Description | Unit | |
| 1 | cluster_node_count |
Total worker nodes in the cluster | Count |
| 2 | cluster_failed_node_count |
Nodes in a failed state | Count |
Example: cluster_node_count
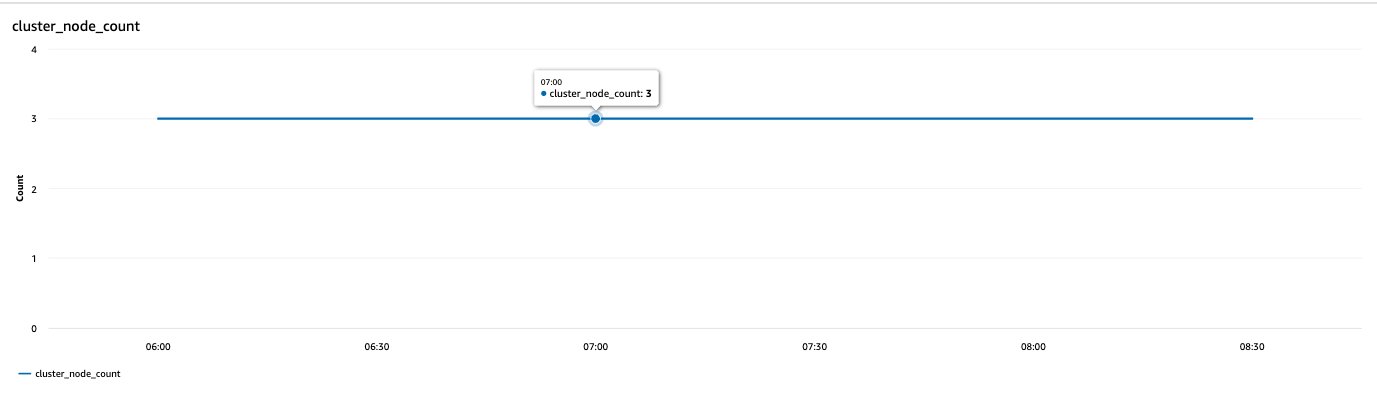
Figure 18: cluster_node_count metric in CloudWatch Container Insights
Node level
| Metric | Description | Unit | |
| 1 | node_cpu_utilization |
% CPU used on each node | Percent |
| 2 | node_cpu_reserved_capacity |
% CPU reserved for system components (kubelet, kube-proxy) | Percent |
| 3 | node_memory_utilization |
% memory used on each node | Percent |
| 5 | node_filesystem_utilization |
% disk used on each node | Percent |
| 6 | node_network_total_bytes |
Network throughput (rx + tx) | Bytes/sec |
| 7 | node_number_of_running_pods |
Pod count per node | Count |
| 8 | node_number_of_running_containers |
Container count per node | Count |
Example:
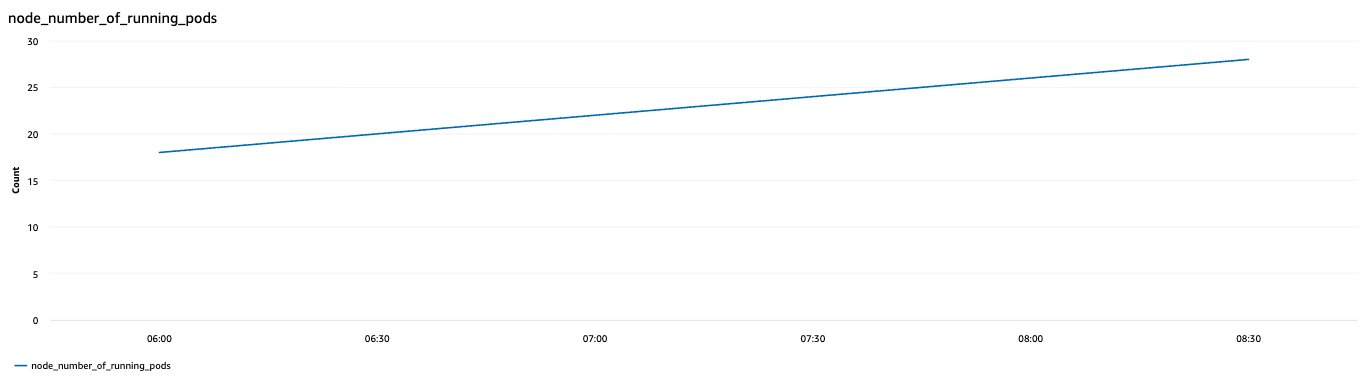
Figure 19: Node-level Container Insights metrics for EKS worker nodes
Pod level
| Metric | Description | Unit | |
| 1 | pod_cpu_utilization |
% CPU used by pods | Percent |
| 2 | pod_cpu_utilization_over_pod_limit |
CPU usage relative to pod limit | Percent |
| 3 | pod_memory_utilization |
% memory used by pods | Percent |
| 4 | pod_memory_utilization_over_pod_limit |
Memory usage relative to pod limit | Percent |
| 5 | pod_network_rx_bytes |
Bytes received per second | Bytes/sec |
| 6 | pod_network_tx_bytes |
Bytes transmitted per second | Bytes/sec |
| 7 | pod_number_of_container_restarts |
Container restart count (stability indicator) | Count |
Example:
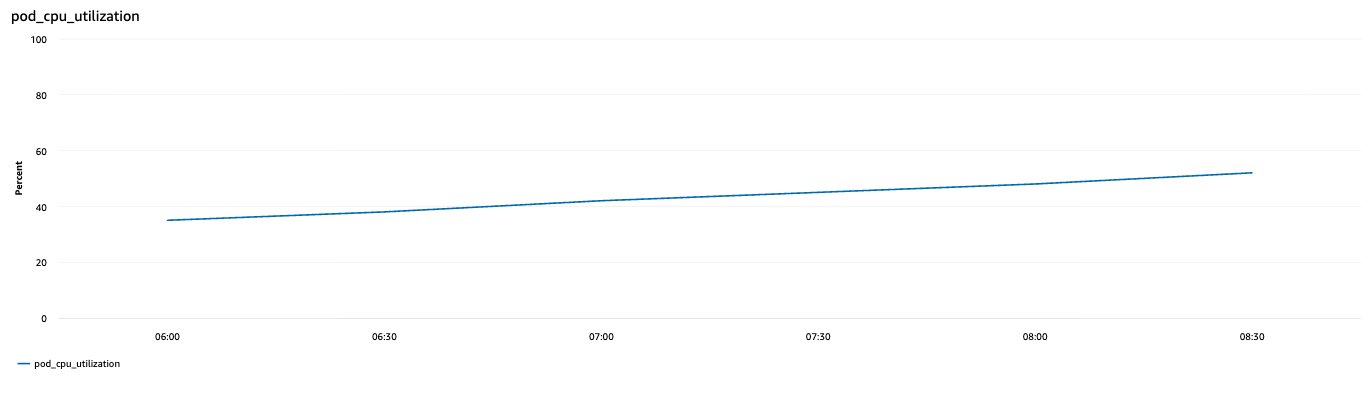
Figure 20: Pod-level Container Insights metrics for EKS workloads
Service level
| Metric | Description | Unit | |
| 1 | service_number_of_running_pods |
Running pods per service | Count |
| 2 | namespace_number_of_running_pods |
Running pods per namespace | Count |
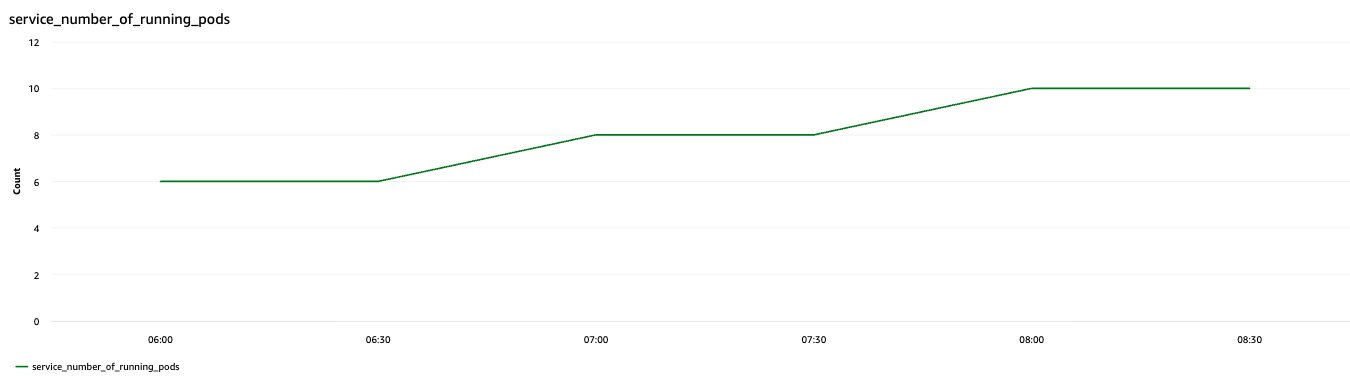
Figure 21: Service-level Container Insights metrics for EKS on Outposts
Step 5: Build a unified dashboard
Bring everything together in a single CloudWatch dashboard.
- Go to CloudWatch Console → Dashboards → Create dashboard.
- Name it
Outposts-EKS-Monitoring - Add widgets in this order:
Row 1 — Outposts infrastructure
InstanceFamilyCapacityUtilization(line chart)EBSVolumeTypeCapacityUtilization(line chart)UsedInstanceType_Count(number widget)
Row 2 — Node health
node_cpu_utilization(line chart)node_memory_utilization(line chart)node_filesystem_utilization(line chart)
Row 3 — Pod/container workloads
pod_cpu_utilization(line chart)pod_memory_utilization(line chart)pod_number_of_container_restarts(number widget)
Why this matters on Outposts
In the Region, if your containers need more resources, the infrastructure scales automatically. On Outposts, you have a fixed pool of compute, memory, and storage.
Without monitoring:
- Pods fail to schedule when node capacity is exhausted.
- Workloads get OOMKilled without warning.
- Disk pressure causes pod evictions.
- You have no visibility into how close you are to capacity limits.
By combining Container Insights metrics with Outposts infrastructure metrics in a single dashboard, you get a complete picture, from application-level container health down to physical infrastructure utilization. With it, you can plan capacity proactively before issues affect your workloads.
Useful references
- Amazon EKS on AWS Outposts documentation
- CloudWatch Container Insights metrics for EKS
- Monitoring best practices for AWS Outposts
- Deploying containerized apps on Outposts with EKS
- Managing S3 on Outposts capacity with CloudWatch
Conclusion
Monitoring AWS Outposts requires visibility across four dimensions that don’t exist in pure-cloud deployments: Region connectivity health, local storage capacity, compute performance on fixed hardware, and container orchestration across hybrid boundaries. The gap between standard cloud monitoring and what Outposts demands is where incidents hide.
In this post, we walked through building that visibility layer using Systems Manager as the management foundation, Amazon CloudWatch for metrics and alarms, and Amazon EventBridge for automated incident response through OpsCenter. Together, these services give you a unified monitoring architecture that spans your data center and the parent Region.
Next steps
To get started with the monitoring approach described in this post:
- Deploy the Systems Manager agent to all Outpost instances and verify Region connectivity through the Fleet Manager console.
- Set up CloudWatch alarms for the critical Outpost metrics. Start with ConnectedStatus, OutpostFreeBytes, and CapacityExceptions before expanding to application-level metrics.
- Configure the Amazon EventBridge-to-OpsCenter integration shown in this post to automate incident creation for Outposts health events.
- Build a CloudWatch dashboard that combines network, storage, and compute metrics into a single operational view for your Outpost.
For more information, see the following resources:
- AWS Outposts monitoring best practices
- AWS Systems Manager hybrid activations
- Amazon CloudWatch metrics for Outposts
- Container Insights for Amazon EKS
About the authors
How boAt delivers personalized fitness coaching with Amazon Bedrock
Post Syndicated from Natasha Sah original https://aws.amazon.com/blogs/architecture/how-boat-delivers-personalized-fitness-coaching-with-amazon-bedrock/
This post is co-written with Sridhara Seshadri from KaHa Technologies Pvt Ltd, a wholly-owned subsidiary of Imagine Marketing Limited (IML).
Recognizing that users need more than raw fitness data, boAt launched the “AI Coach” feature. It uses a combination of user history, preferences, and generative AI to deliver personalized coaching plans in real time. Using AWS, boAt built a solution that delivers personalized AI coaching. The AI Coach feature has been in production for over six months, reliably serving millions of boAt smartwatch users across India. In this post, we explore how boAt built the AI Coach on Amazon Bedrock and AWS Lambda, and the design choices that made it scalable and cost-effective.
Imagine Marketing Limited primarily operates under the brand boAt, launched in 2015 in the consumer electronics industry, focused on mass-premium, lifestyle-oriented products for India’s young, tech-savvy consumers at accessible price points. Starting with audio, boAt has expanded into adjacent categories such as wearables and charging solutions, selling through online marketplaces, D2C, and offline retail. In FY 2025, boAt led India’s branded personal audio with strong value and volume shares, sold over 34 million units in India as reported in FounderPin, and ranked among the top global audio brands by volume. Its agile, digital-first model drives rapid innovation, wide reach, and faster time-to-market aligned with evolving consumer preferences.
Opportunity
With the emergence of advanced AI capabilities, boAt saw an opportunity to deliver a highly personalized fitness coaching experience for its smartwatch users. The core objective was to help users build and sustain fitness and wellness habits aligned with their lifestyles. These recommendations needed to be straightforward for users to follow while clearly communicating their value.
The three primary design principles were personalization, affordability, and scalability.
Solution architecture
The following shows a simplified high-level architecture of the AI Coach components deployed on AWS.
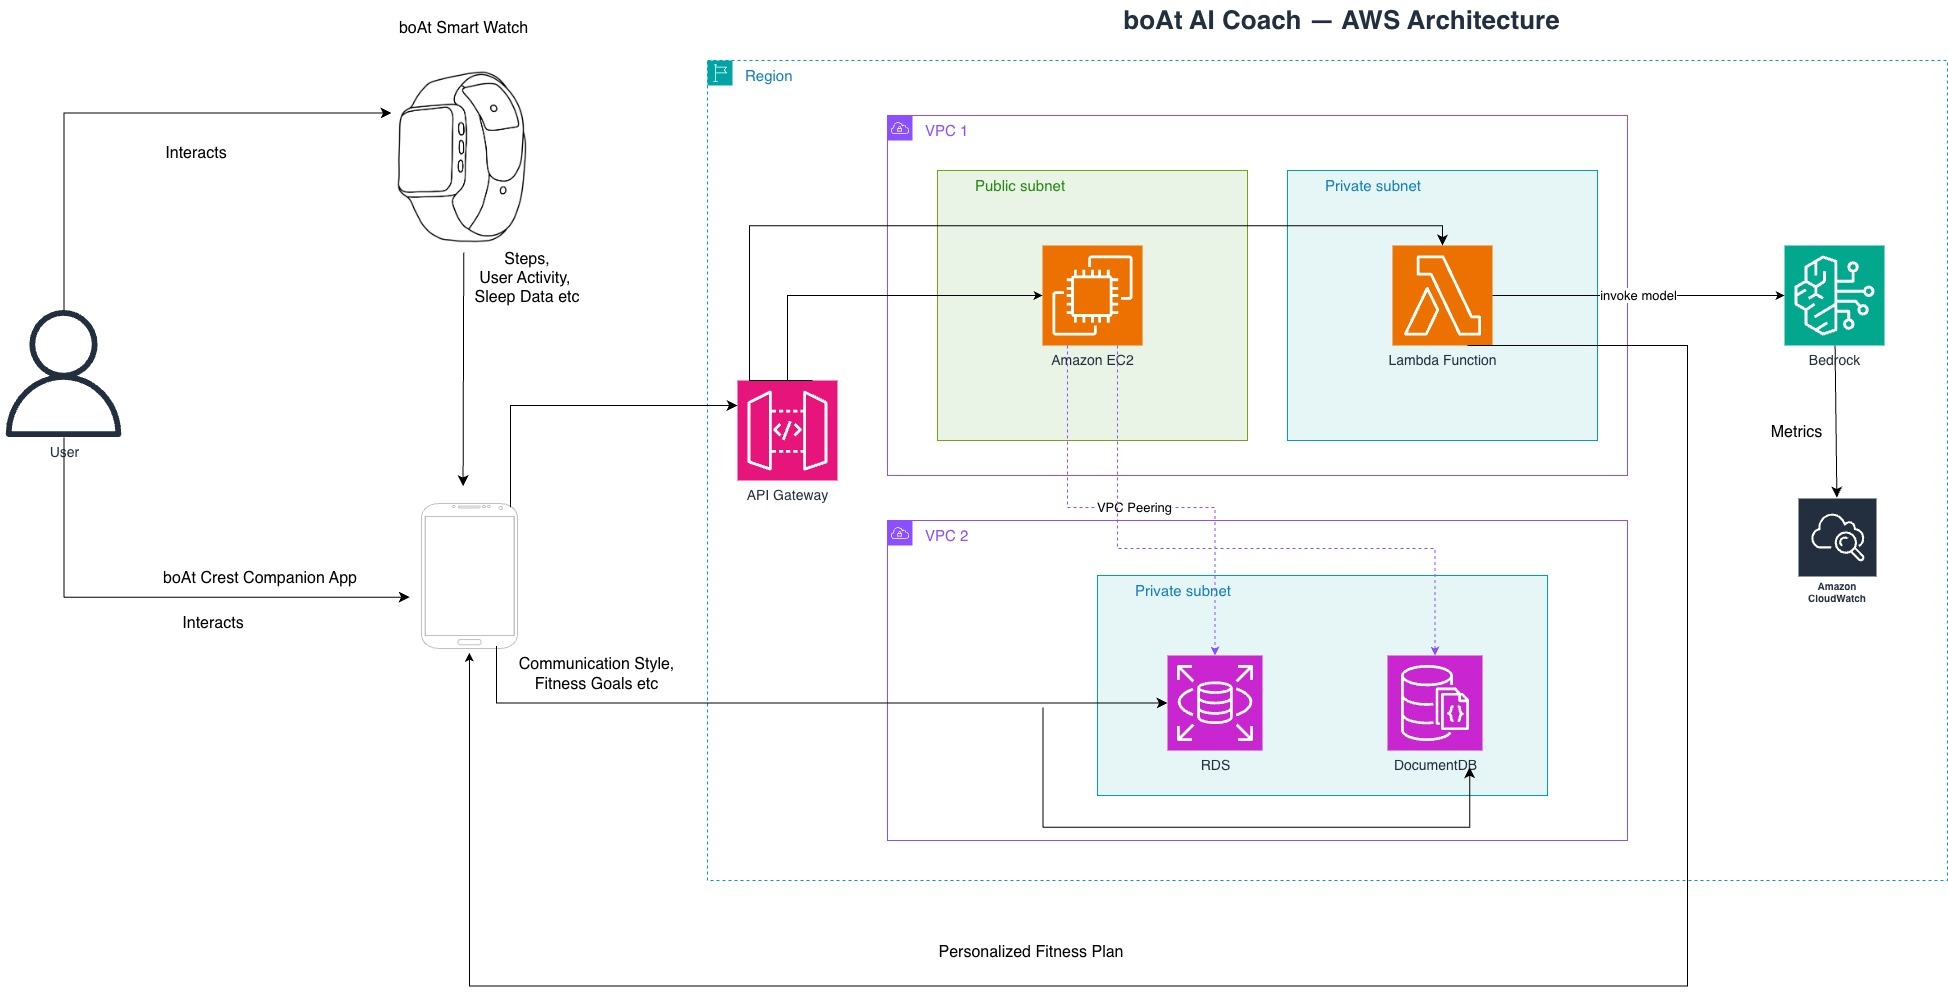
Figure 1: High-level architecture of the boAt AI Coach on AWS
The following sections provide a brief overview of the architecture and its key components.
- Data source: The boAt smartwatch serves as the primary data source, capturing metrics such as steps, user activities (for example, running or yoga), and sleep data. All data is encrypted at rest and in transit. The boAt Crest companion app for iOS and Android also captures additional data points, such as the user’s preferred communication style and fitness goals for a predefined period.
- Historical data: Historical user data, when available, plays a key role in personalizing plans. These data points are transmitted by the companion application to backend servers and stored in Amazon Relational Database Service (Amazon RDS) for MySQL and Amazon DocumentDB (with MongoDB compatibility). When the AI coach creates a plan, this historical data provides important context about what the user has done earlier.
- AWS Lambda: This component plays several roles:
- It acts as a translation layer, transforming input data into a format suitable for large language models (LLMs) and converting model outputs into a format the companion application can parse and interpret. This layer also abstracts the underlying AI coach implementation.
- On the input side, the data sent through the API is in a legacy format optimized for database operations. This is mapped to a more verbose format so that LLMs can better interpret what each key means.
- On the output side, the system handles missing keys in the generated plan by substituting safe defaults and verifying that the response format remains consistent with the companion application’s requirements.
- For production deployments, consider placing the Amazon Elastic Compute Cloud (Amazon EC2) instance in a private subnet and exposing it through an Amazon API Gateway private integration using a VPC link.
The AI Coach feature has two main logical pieces:
- Personalized plan generation.
- Nudges to aid adherence to the plan.
We use the Meta Llama 3.3 70B Instruct model on Amazon Bedrock to implement the AI Coach feature. For model availability by Region, see Region availability at a glance.
AWS Lambda retrieves historical user data for a predefined period in accordance with applicable privacy laws from the boAt Crest Companion app (full historical data is stored in Amazon RDS and Amazon DocumentDB), supplies it as context to the LLM for personalized plan generation, and parses the model response for the client. The team uses Amazon Bedrock on-demand inference exclusively, with structured data retrieval and prompt construction handled within Lambda. As adoption grows, they plan to transition to Amazon Bedrock batch inference to optimize costs at scale.
The plan is personalized to each user based on the inputs provided by the user during onboarding to this feature and historical user data patterns. The architecture was designed in such a way that future changes in user inputs don’t need a change in the backend components.
Relevant nudges are sent to the user at different times of each day, based on their actual metrics compared to the recommended ones. The style and tone of the nudges are offered as a configuration for the end user. These range from informational and objective to pop-culture and sarcastic, with a wide variety of style packs to choose from.
After evaluating options, the team selected the AWS Lambda and Amazon Bedrock combination for three reasons:
- Model-agnostic access: The unified API in Amazon Bedrock let the team evaluate multiple foundation models (including Meta Llama 3.3) through a single integration. This avoided the need to build separate pipelines for each LLM and accelerated model selection.
- Built-in observability and cost governance: Amazon Bedrock publishes per-invocation metrics (token counts, latency, and error rates) directly to Amazon CloudWatch, and it supports application inference profiles with cost allocation tags to attribute usage by tenant, feature, or environment. Combined with the average Lambda execution-time metrics, this gave the team precise per-user unit economics from day one, without building custom metering infrastructure.
- Serverless scalability with zero infrastructure overhead: The on-demand inference mode in Amazon Bedrock requires no provisioned compute. It scales automatically with usage and charges only per token processed. As AI Coach adoption grows, the team can extend throughput through cross-Region inference profiles that dynamically route requests across AWS Regions, without changes to their Lambda-based backend or impact to the end user experience.
Throughout development, the team applied responsible AI practices—including output validation, safe default substitution for missing response keys, and prompt constraints limiting recommendations to watch-supported activities—to deliver a trustworthy and safe user experience.
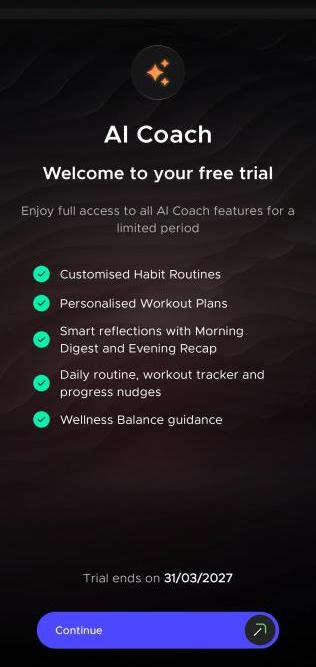
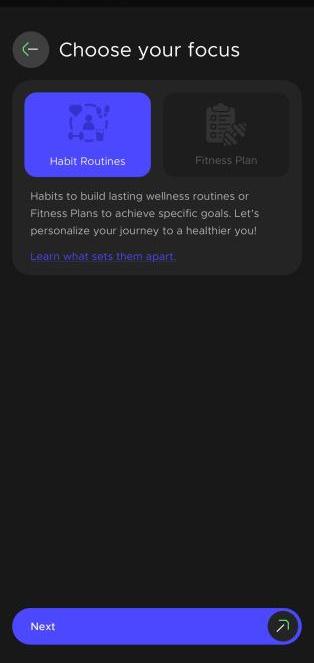
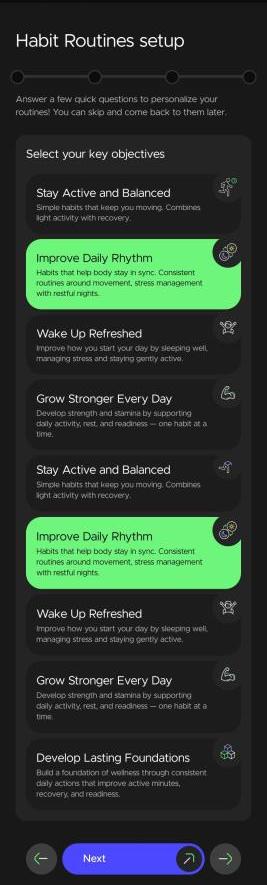
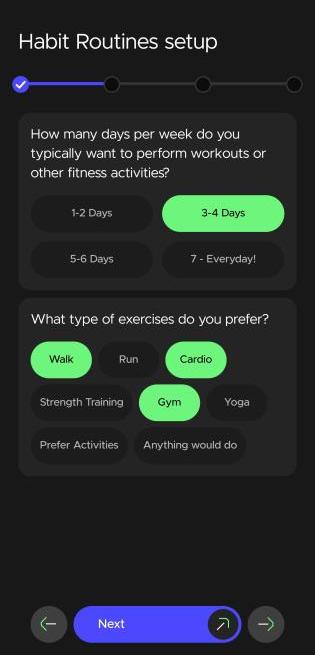
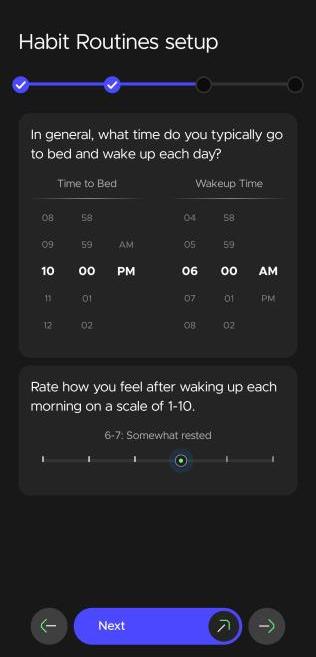
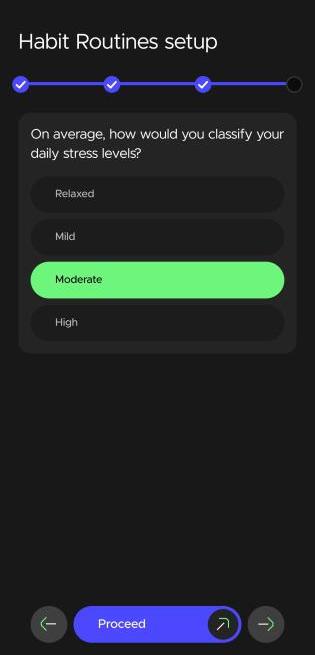
The following screenshots illustrate the AI Coach onboarding experience, where users set their fitness goals, preferred activities, workout frequency, sleep schedule, and stress levels to generate a fully personalized coaching plan.
 |
 |
 |
 |
 |
 |
Beyond the user-facing experience shown in the preceding screenshots, the development journey involved several technical and design challenges worth highlighting. The following are notable challenges the team encountered during development and real-world testing.
- Personalizing plans effectively: During the initial testing phase, the generated plans were not personalized enough to meet our expectations. The data the companion app provides is in JSON format, made of key-value pairs. We found that the keys needed to be more descriptive for the LLM to interpret the data effectively. For example,
weightbecameweight_in_kg, andtargetbecamestep_goal. We spent considerable time verifying that each legacy key was expanded and made as descriptive as possible. This higher level of descriptiveness significantly improved plan personalization. - Smartwatch capability matching: Recommended activities in the plan, such as swimming, had to align with the user’s onboarding preferences, their overall goals, and the smartwatch’s capability to support those activities. We added a dedicated section to the prompt that lists watch-supported activities, which reduced the likelihood of unsupported recommendations. However, because of the non-deterministic nature of LLMs, prompt optimization alone did not eliminate all errors. We therefore added a parsing layer and suitable defaults to handle exception cases.
Conclusion
The boAt AI Coach demonstrates how generative AI can transform raw smartwatch data into personalized, actionable wellness guidance at scale. By combining Amazon Bedrock, AWS Lambda, and thoughtful prompt engineering, the team shipped a production-grade feature that serves millions of users without sacrificing personalization or reliability. To learn more about the boAt AI Coach and explore the technologies behind it, check out the following resources:
- Read about how the AI Coach in boAt smartwatches can improve your fitness
- Explore Amazon Bedrock for building generative AI applications
- Explore the boAt Chrome Eon smartwatch featuring AI Coach
About the authors
ASRock Industrial AI Box-A395 Review: Taking Strix Halo to Work
Post Syndicated from Ryan Smith original https://www.servethehome.com/asrock-industrial-ai-box-a395-review-taking-strix-halo-to-work/
Today we are taking a look at ASRock Industrial’s highly portable Ryzen AI Max+ 395 system, the AI Box-A395. The barebones tower system packs a punch, as well as a handle to quickly pack up the PC
The post ASRock Industrial AI Box-A395 Review: Taking Strix Halo to Work appeared first on ServeTheHome.
Мариус Куркински: Любовта ни е такава – театрална и трагична
Post Syndicated from Роси Михова original https://www.toest.bg/marius-kurkinski-liubovta-ni-e-takava-teatralna-i-tragichna/
Въпросите задават Елизабет Лойд, Оскар Уайлд и Роси Михова

С идването на XIX век викторианска Англия подарява на Европа не само теорията на еволюцията, следобедния чай и манията по локомотивите, но и едно приятно салонно забавление – попълването на „албуми за признания“ (confession albums). Те включвали въпроси, към които от отговарящите се очаквало да пристъпят с подобаваща искреност, проникновение и остроумие. Отговорите били обсъждани с дни, а развълнуваните дами ентусиазирано ги определяли като „ментални фотографии“ на своите гости и респонденти.
Подобни лексикони в своята младост попълват редица известни личности – Марсел Пруст, Карл Маркс, Артър Конан Дойл и разбира се, „най-забележителният от всички англичани“ – ирландецът Оскар Уайлд. През 1877 г. той отговаря на въпросите на своята приятелка Елизабет Лойд и само с няколко реплики успява да забърка впечатляваща смесица от арогантност, естетизъм и искрено преклонение пред изкуството.
Днес нашият разговор с актьора и режисьор Мариус Куркински* започва именно с въпросите на госпожица Лойд към младия Оскар. Към тях обаче ще добавим и питания, с които самият писател ни измъчва вече повече от век в някои от своите знакови текстове**.
Срещата с обичания актьор е повод също така да научим нещо повече за последния му моноспектакъл „BG Мариус“, както и за работата му в новия български филм „Софѝя“ със сценарист и режисьор Димитър Радев.
Предлагам да започнем съвсем лежерно с няколко въпроса от „Албума за признания“ на г-ца Елизабет Лойд. Кой е любимият Ви цвят? За Уайлд това е небесносиният.
Тук донякъде имаме съвпадение. Моят любим цвят е тъмносиният. Може би защото, когато си затворя очите и когато съм в състояние на душевен покой, виждам него. Свързвам го и със синята птица от известната пиеса на Метерлинк. Въобще в това синьо явно има нещо. Вижте как още с първия въпрос се появява някаква връзка с Оскар Уайлд, някакво сближаване. Ние всъщност стоим близо и по дати. Той е роден на 16 октомври, а аз съм на 15-ти.
Кое е любимото Ви цвете? Обратно на моите очаквания, Уайлд посочва най-минималистичното и най-непретенциозното от всички цветя – маргаритката.
Моето любимо цвете е зюмбюлът. Особено синият зюмбюл. Свързвам го с най-ранните ми спомени и с маминка Марийка, майката на баща ми. Тя имаше градина само с такива зюмбюли и за мен те носят мириса на детството.
Кое е любимото Ви занимание? Тук Уайлд с типичната арогантност и кокетство на младостта отговаря, че любимото му занимание е да не прави нищо.
Няма да увъртам – любимото ми занимание е да правя моноспектакъл. Събирането на сценичната версия за представлението, подбирането на текстовете – това ми е най-любимото. То е едно голямо приключение, чрез което най-точно назовавам и разбирам себе си.
Преди години най-много обичах репетициите с артисти – да се срещам с актьорите, да прекарам целия репетиционен процес с тях, след това да преживяваме представлението, да сме непрекъснато заедно – от сутрин до вечер. Имам около 30 режисьорски постановки в различни театри и тази радост от съвместната работа всъщност я нося и до днес.
С други думи, любимото ми занимание ще си остане професията ми. Нищо от живота, от бита, което не е свързано с театъра, не ми е любимо. Нищо друго не ми носи особено удовлетворение. Абсолютно нищо.
Любима добродетел? Оскар Уайлд, бидейки Оскар Уайлд, отговаря: да нямаш добродетели.
Милостта. Това е най-голямата добродетел от всички.
Кой е най-големият порок?
Най-големият порок не е грехът, а любовта към греха – завръщането към греховете. Това е най-голямото пропадане.
То и най-тъжното нещо на света е това да си влюбен в тъгата…
Да, точно. И това също е вид грях. Да си влюбен в тъгата води до леност и меланхолично самосъжаление, което е опасно и вредно. То е каприз. То е и неблагодарност към нашия Създател.
Кой не би бил щастлив, ако има свобода, книги, цветя и луната, пита Уайлд. Има ли нещо в този списък за щастие, което бихте добавили или бихте махнали?
Всичко бих махнал от този списък, защото напоследък аз не копнея за щастие. Не го разбирам. Щастието е понятие за младостта. На моята възраст от 57 години смятам, че човек не трябва да говори за щастие. Късно е.
Радостта обаче е друга работа. Това е нещо, което разбирам и към което се стремя. Мечтая си за радост, която не познавам, която дори не мога да назова и която е още неоткрита за хората. Това е за мен радостта – откривателството на нещо ново, неусетено досега и невидяно. Искам да го преживея, искам и публиката ми да го преживее. Това е моята задача за всеки спектакъл – поне за секунда да доведа публиката до състояние, което никога не е предполагала, че може да изпита. Иначе все едно е било напразно.
В есето си „Критикът като артист“ Уайлд пита: не е ли човек най-малко себе си, когато говори от свое име? Дай му маска – и той ще ти каже истината.
Това е много точно казано. Аз така приемам актьорската си работа – да се чувствам най-искрен в маската, в играта с чужди думи, в превъплъщението в чужди състояния, не моите. Защото да твърдиш, че си изцяло оголен и автентичен на сцената, би било прекалено самонадеяно.
Във филма „Софѝя“ на режисьора и сценарист Димитър Радев изпълнявате ролята на ангела – детектив Рафаил. Как един дълбоко вярващ човек като Вас придобива дързостта да приеме ролята на ангел?
Тук мога да перифразирам Оскар Уайлд и да кажа, че този въпрос е прекалено важен, за да му отговоря сериозно. Все пак ще допълня, че аз съм минал през всичко, преди да приема това изпитание. Подготвил съм се. Посъветвал съм се с когото трябва. Вече съм го приел и сега го работя с радост, без да усещам някакъв зловещ страх. Приемам го даже като дар, който съм получил в живота.
Всичко стана леко. Харесах стила на Димитър Радев. Харесах и сценария, който е много изповедален и не наподобява, не имитира други филми. Той няма амбиции в границите на това, което се очаква от съвременното българско кино – да се прекалява в злободневието и в това колко ние, българите, сме зле като общество и като хора. Защото има такава тенденция да се уголемява злото и уродливостта. В този филм е точно обратното.
Доколко работата Ви във филма предполага вживяване в образа на ангела или напротив – дистанциране от него, за да го нарисувате така, както художникът рисува портрет?
Това е същностен въпрос и аз наистина трябваше да избера един от двата подхода. Мисля, че в случая задължително е отграничаването, тъй като ние така или иначе сме хора в страстите. Ние сме в тази земна чувственост, от която вече ми е омръзнало, но няма как – не можем да се отървем напълно от нея. Но за мен в случая това отстраняване от ролята е актьорска свръхзадача. Никога не съм го правил, досега винаги съм преживявал ролите си.
Всъщност мен театърът много ме изчисти от тази обременяваща чувственост. Поради простата причина, че човешките страсти изобилстват на сцената. Така театралните изпълнения, многото играене, многото емоции ми помогнаха да се поукротя. Не остават сили, а няма и смисъл да беснеем в собствения си живот.
Освен това актьорската професия е работа. Тя не е магия, не е някакво служение в храма на Мелпомена. Такива неща няма. Това е занаят. Това е труд. И защо един ден да не изиграя дори Бог и нашия Господ Исус Христос? С какво това е по-различно от художника иконописец, който го рисува?
Има такива прекрасни примери в световното кино – „Страстите Христови“ на Мел Гибсън. Или „Евангелието по Матея“ на Пазолини, който някои наричат скандален, но за мен е полезен и благотворен за християнството филм.
Възможно ли е обаче в личен план да има такова нещо като „благотворно чуждо влияние“? Въпросът е на Дориан Грей, а лорд Хенри отговаря с прочутата си парадоксална теза, че „всяко влияние е неморално“, защото лишава човека от собствената му душа.
За разлика от лорд Хенри, аз смятам, че е възможно да има добро чуждо влияние върху човешката душа. Аз съм имал такова от моите родители. Едва сега го осъзнавам в абсолютна пълнота, тъй като миналата година изгубих и татко, а майка – още през 2009-та. Имах много време да осмисля какво те са сторили за мен като тяхно дете. И съм изключително впечатлен от мъдростта им и от делата им. Аз всъщност преди съм живял с тях така, сякаш ги е нямало. Разбира се, много съм ги обичал, но те като че ли по никакъв начин не са се намесвали в живота ми. Но всъщност са го правили, и то с голяма деликатност и чист разум.
Конкретни спомени и детайли от моя реален живот няма да споменавам, но докато бях дете, аз бях изцяло под тяхната грижа, закрила и влияние. Давам си сметка, че те съзнателно са ме насочвали в определена посока, и днес аз съм им много благодарен.
Но краткият ми отговор на въпроса е, че човек е сам, или сам с Бога. Няма никой друг. И това е окончателното ми твърдение. А това, което казах за родителите ми, е в защита на техните дела, на техния живот. Защото той е бил живот не на думи, а на дела. Това, последното, е страшно важно.
Вярно ли е, че единственият начин човек да се отърве от изкушението е да му се отдаде?
Нека не оценяваме нечие твърдение като вярно или невярно. Вероятно Уайлд е имал този опит, преживял е нещо такова – борба, в която се е предал на изкушението. Познавайки неговия живот и драматургия, въобще съдбата му, това изглежда някак много естествено.
Но да преодолееш изкушението не е проста работа. Има свети отци, които казват, че изкушенията са за вразумление и изправление на пътя и че те винаги са според мярката на човека – избор, който е по силите му той да направи. Аз по-скоро така ги разглеждам – като изпит, който ние полагаме.
За себе си мога да кажа, че и да искам, и да не искам, в младостта си първо съм се отдавал на изкушенията, а чак след това съм мислил какво ще правя с тях.
Добре, нужно ли е да устояваме на всяко изкушение?
Ако трябва да отговоря днес по съвест, бих казал: да, трябва да устоим на всяко изкушение.
А няма ли душата ни да се разболее от копнеж?
Има я тази опасност – ако не да умрем, то да се поболеем от несбъднати мечти, от неосъществена любов. Но вече съм убеден, че това е нашето светско мислене. Това стои далеч от вярата в божественото.
И пак казвам: аз говоря като много грешен човек. Изпадал съм в какви ли не състояния. Дори сега, през октомври, когато е рожденият ми ден, пак изпадам в някакво тежко греховно отчаяние, което е недопустимо. Като че ли намирам някакво удоволствие от тази настъпваща тъга. И това ми се вижда малко лукаво от моя страна. Има някаква суета в това да потъгуваш.
Да, но всички сме склонни към известен нарцисизъм и театралност в страданието си. Сякаш то привнася дълбочина и съдбовност на преживяванията ни. Може би затова Уайлд задава и следния въпрос: какъв е смисълът да си влюбен, ако не си трагично влюбен?
При него тази театралност в живота и в творчеството му е забележително постижение. Тя е плод на извисения ум на един смел мъж и светла душа. И макар че бихме могли да четем тази реплика като остроумна пародия на романтичните клишета, аз мисля, че той всъщност я изрича в един истински трагичен смисъл.
Аз съм убеден, че любовта на земята между двама души е невъзможна. Тя е винаги несподелена, защото при нея няма равнопоставеност. Винаги единият обича по-малко. Винаги другият е в унизено състояние. И това е неизменна част от нашето влюбване и острастяване.
Струва ми се, че Уайлд говори за това: че любовта винаги свършва, че тя не може да бъде изживяна докрай, че съвършената любов, такава каквато е описана в Посланието към коринтяните, е недостъпна за човека тук, на земята.
Помислете за „Рибарят и неговата душа“. Там русалката казва: да, аз ще те възлюбя, но ти трябва да се откажеш от душата си. И рибарят отрязва душата си и я оставя да скита сама по света, а той потъва с любимата в морските дълбини, пропада в най-ниското. Вижте колко особено мнение има Уайлд за взаимното влюбване – за да ме имаш, ти трябва да се отречеш от себе си. Това е много зловеща теория за любовта. И ние не се замисляме, но много често между двама души се случва точно така. Някой погубва душата си заради другия, макар и да не го съзнава с такива категории. За Уайлд любовта ни е такава – театрална и трагична. Както, между другото, я описва и Шекспир.
Кое е голямото послание на Шекспир за любовта? Че тя умира. С „Ромео и Жулиета“ той ни казва точно това – че най-чистата, изпиваща, взаимна любов на двама влюбени, които се обичат еднакво силно, не може да вирее на този свят. Такава покъртителна любов, чрез която сякаш усещаш самото сътворение, не може да просъществува. Тя може единствено да умре от кинжала или бавно да изтлее от баналността на семейния живот.
Уайлд твърди, че първото от всички удоволствия е илюзията. А излиза, че може би най-голямата сред всички илюзии е романтичната илюзия?
Не приемам нищо като илюзия и ще бъда съвсем откровен. Аз още от съвсем малък, като дете и после юноша, съм си казвал: колко е хубаво, че си имам театъра и че той ме е обзел напълно. И дори съм си мислил колко хубаво е, че няма да се влюбвам, защото животът ми е вече изпълнен. И така станах на 23 години. Един ден стоях пред сградата на театралната академия и пак си мислех какъв късмет е, че на мен това няма да ми се случи, защото си имам театъра и вече съм намерил къде да приютя глава на този свят. И както си го помислих и назовах пред себе си, както се зарадвах и дори леко възгордях, така на другия ден с грамадна сила ме връхлетя най-трагично влюбване. Ама наистина ме връхлетя – опустошително и невъзможно. То не беше илюзия. То бе истина.
И ако се върнем на темата за изкушенията, все още не съм сигурен дали това влюбване не ми беше изпратено като голямо изпитание. Изпит, който аз не издържах. Трябваше да се въздържа тогава. Трябваше да го направя точно заради първата ми любов, заради театъра.
Днес си мисля, че щях да бъда по-добър артист, ако не бях преживял нищо от това наистина, а само си го бях представял. Това щеше да бъде по-честно и по-вярно към изкуството. Абсолютно съм убеден, че щях да бъда по-добър актьор, ако не знаех нищо от истинския живот, а си го представях и пресъздавах непреживяното.
Да си призная, озадачавате ме с този отговор. А в разказа „Сфинксът без загадка“ има и такъв въпрос: ако не кажа на никого, какъв е смисълът да имам тайна?
Мисля, че това е просто заигравка. Смисълът на тайната е само един – да се пази. И ако тя е нещо прекрасно, то това е единственият начин то да бъде опазено чисто. Нали е казано: не давайте бисерите си на свинете?!
Макар че съществува тази опасност човек да си мисли, че пази в себе си кой знае какви съкровища, а всъщност да няма нищо. И тази мисъл плаши. Може би затова дори след толкова години, прекарани на сцената, продължавам да пристъпвам към всяко представление не точно със страх, но с голям трепет. С радост, но и с трепет.
Защото в залата актьор и зрител не са един срещу друг. Те са един с друг. Това е среща, диалог, взаимност. Ние се изненадваме взаимно, обучаваме се взаимно, подаряваме си радост взаимно. Ние сме тези живи, различни, абсолютно случайно събрани хора, които за два часа от живота си делят едно общо пространство. И в него те живеят и дишат заедно – без вражда и без гняв.
Затова в същността си всяко театрално представление е проверка на това доколко сме хора.
Красиво казано. А в предговора на романа „Портретът на Дориан Грей“ Уайлд пита: нима тези, които откриват грозен смисъл дори в красивите неща, не са просто корумпирани, без да са очарователни?
Той го е казал и с това сякаш е изчерпил темата. Има такива хора и те наистина са брутални, без да са очарователни. А вероятно са просто зли. Защото, ако съдиш другия и на всичкото отгоре го правиш по некрасив, позорен начин, това вече е не едно, а две тежки прегрешения. Падение след падение.
В момента ние живеем в тази проклетия – в тази осъзната злонамереност към другите. Това е определението за сегашния свят. Точно тази мисъл. И ми се струва, че човечеството затъва все повече. А може би винаги е било в това състояние, просто други са били изразните средства.
Предлагам Ви все пак да завършим този разговор в по-оптимистична тоналност. Уайлд пише, че човек може да повярва в невъзможното, но никога няма да повярва в невероятното. Сега, без да изчисляваме степените на вероятност, а с най-чистосърдечна вяра в невъзможното, кажете в какво продължавате да вярвате въпреки всички доказателства за противното.
Когато човек е вярващ, нищо не може да го уплаши и да го спре в пътя му към спасение на душата. Всичко друго е каламбур и хитросплетение. Но сега бих завършил с втората по сила заповед в християнството. Забележете, тя е тази, която идва веднага след любовта към Бога: „И възлюби ближния си като самия себе си.“ В това вярвам. Въпреки всички доказателства за противното.
* Мариус Куркински е актьор, режисьор и музикален изпълнител. Знакова фигура на театралната сцена с многобройните си монологични постановки, последната от които е „BG Мариус“. Отличаван е за работата си с редица награди, като получава многократно „Икар“ за главна и поддържаща мъжка роля. Последният филм под негова режисура е „Засукан свят“ (2019), а в момента е част от актьорския екип в новия игрален фентъзи филм „Софѝя“.
** В разговора са използвани цитати от романа „Портретът на Дориан Грей“, пиесата „Колко е важно да бъдеш сериозен“, разказа „Сфинксът без загадка“, есето „Критикът като артист“ и писмото изповед De Profundis, написано през 1897 г., по време на престоя на Оскар Уайлд в затвора „Рединг“.
Президентски избори 2026 – балотаж в чужбина
Post Syndicated from Боян Юруков original https://yurukov.net/blog/2026/pr2026-balotaj/
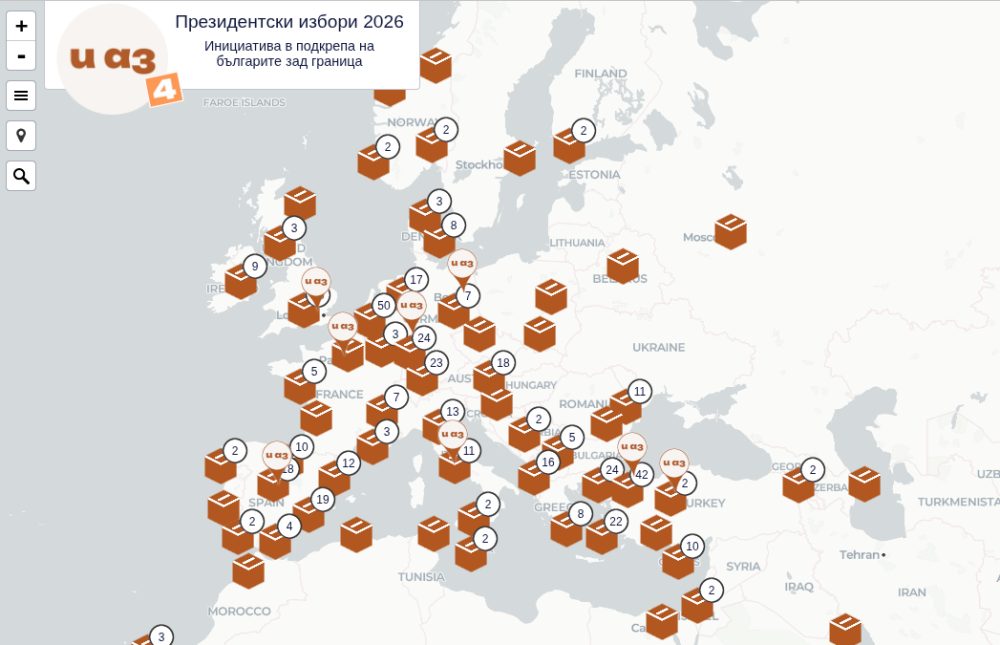
След три дни в неделя, 1-ви ноември 2026 ще се проведе балотаж за президент и вицепрезидент. Българите зад граница ще могат да гласуват на същите места извън страната, както и в първия тур на изборите. Някои секции обаче са със сменени адреси – поне 5 в последните дни. Затова отново препоръчвам да сверите мястото преди деня на вота. За тези и бъдещи промени ще изпратя индивидуални мейли за абониралите се в портала на Glasuvam.org.
Ето най-важното, което следва да знаете:
- Може да гласува всеки български гражданин независимо дали сте подали заявление преди първия тур, дали сте гласували тогава и къде, както и къде пребивавате обичайно
- Може да гласувате на различно място извън страната от първия тур
- Гласува се с валидна българска лична карта или паспорт.
- Отново се подписва декларация на място пред комисията
- Препоръчвам да се гласува с машина където е възможно. Освен, че е по-бързо, проверката на първия тур показа, че човешките грешки в броенето са практически елиминирани
Адресите на секциите зад граница ще намерите на картата, която подготвям за всеки вот в последните над 12 години. Същите ще намерите в таблицата на МВнР, както и тяхната карта. Препоръчвам да следите и страницата на ЦИК за изборите. Ако срещнете трудности или видите нарушения, може да сигнализирате на инициативата за следене на вота Ти Броиш.
Automate toll-free number registrations at scale with AWS End User Messaging
Post Syndicated from Rommel Sunga original https://aws.amazon.com/blogs/messaging-and-targeting/automate-toll-free-number-registrations-at-scale-with-aws-end-user-messaging/
When you manage SMS communications for dozens or hundreds of business units, registering each toll-free number (TFN) manually becomes a bottleneck. For independent software vendors (ISVs), software as a service (SaaS) providers, or large organizations with many teams, the repetitive console work, multi-day carrier reviews, and rejection handling add up fast.
With AWS End User Messaging SMS, you can send messages using TFNs, 10DLC numbers, or short codes in the US, each with its own registration process. For more information, see Toll-Free Number registration requirements. In a previous post, we showed how to programmatically register a single TFN using a Bash script, and how to register multiple TFNs in bulk with Python. Those scripts automate the seven API calls required for each registration.
This post goes further. We walk through a serverless architecture that handles the full TFN registration lifecycle: submission, carrier review, and resolution (including rejections). It uses AWS Step Functions for orchestration, Amazon EventBridge for async status callbacks, and a human-in-the-loop pattern for handling rejections. The same architecture applies to International Toll-Free Numbers (ITFNs) by adjusting the RegistrationType and IsoCountryCode.
Prerequisites
Before deploying this solution, you need:
- Technical prerequisites: AWS Command Line Interface (AWS CLI) v2, AWS Serverless Application Model (AWS SAM) CLI, Python 3.12+, and an AWS account with AWS End User Messaging SMS enabled. See the repository README for full setup instructions.
- An email address to receive SNS notifications for registration status updates.
- The registration data for each TFN you want to register:
- Company information.
- Contact information.
- Messaging use case and details.
- Opt-in workflow description.
- Opt-in workflow image (PNG, JPEG, or PDF, max 500 KB) showing how end users consent to receiving SMS messages. (You can retrieve the full list of required fields with DescribeRegistrationFieldDefinitions.)
- Message samples.
Note: For a complete step-by-step guide, see: How to register for a US toll-free number with AWS End User Messaging
The problem: Manual registration at scale
When you register a TFN through the AWS End User Messaging SMS console, you fill out a multi-step form for each number:
- Company Info – Company name, website, address, business type, tax ID.
- Contact Info – First name, last name, support email, support phone number.
- Messaging Use Case – Monthly volume, use case category, use case details, opt-in type, opt-in workflow description, opt-in image upload.
- Message Samples – 1–3 example SMS message bodies.
- Review and Submit.
For a single registration, this takes a few minutes. For 50, 100, or 500 registrations across tenants, it becomes a full-time job. After you submit a registration, each registration enters a carrier review period of 1–15 business days. If rejected, you need to identify the issue, fix the fields on the console, and resubmit. Tracking all of this across many registrations is where the real operational burden lives.
The following architecture automates submission by using an API and tracks the full lifecycle with event-driven callbacks.
Architecture overview
You deploy the solution as an AWS SAM template. It consists of the following components:
| Component | Purpose |
| Amazon API Gateway | RESTful endpoints for submission, file upload, and resume |
| AWS Lambda (six functions) | Business logic for intake, presigned URL generation, registration, event routing, notification, and human-in-the-loop resume |
| AWS Step Functions | Orchestrates the multi-day workflow with pause and resume capability |
| Amazon EventBridge | Captures async registration status change events from the carrier |
| Amazon DynamoDB | Tracks registration state across the full lifecycle |
| Amazon Simple Notification Service (SNS) | Sends operator notifications on status changes |
| Amazon Simple Storage Service (Amazon S3) | Stages opt-in workflow attachments with presigned upload URLs |
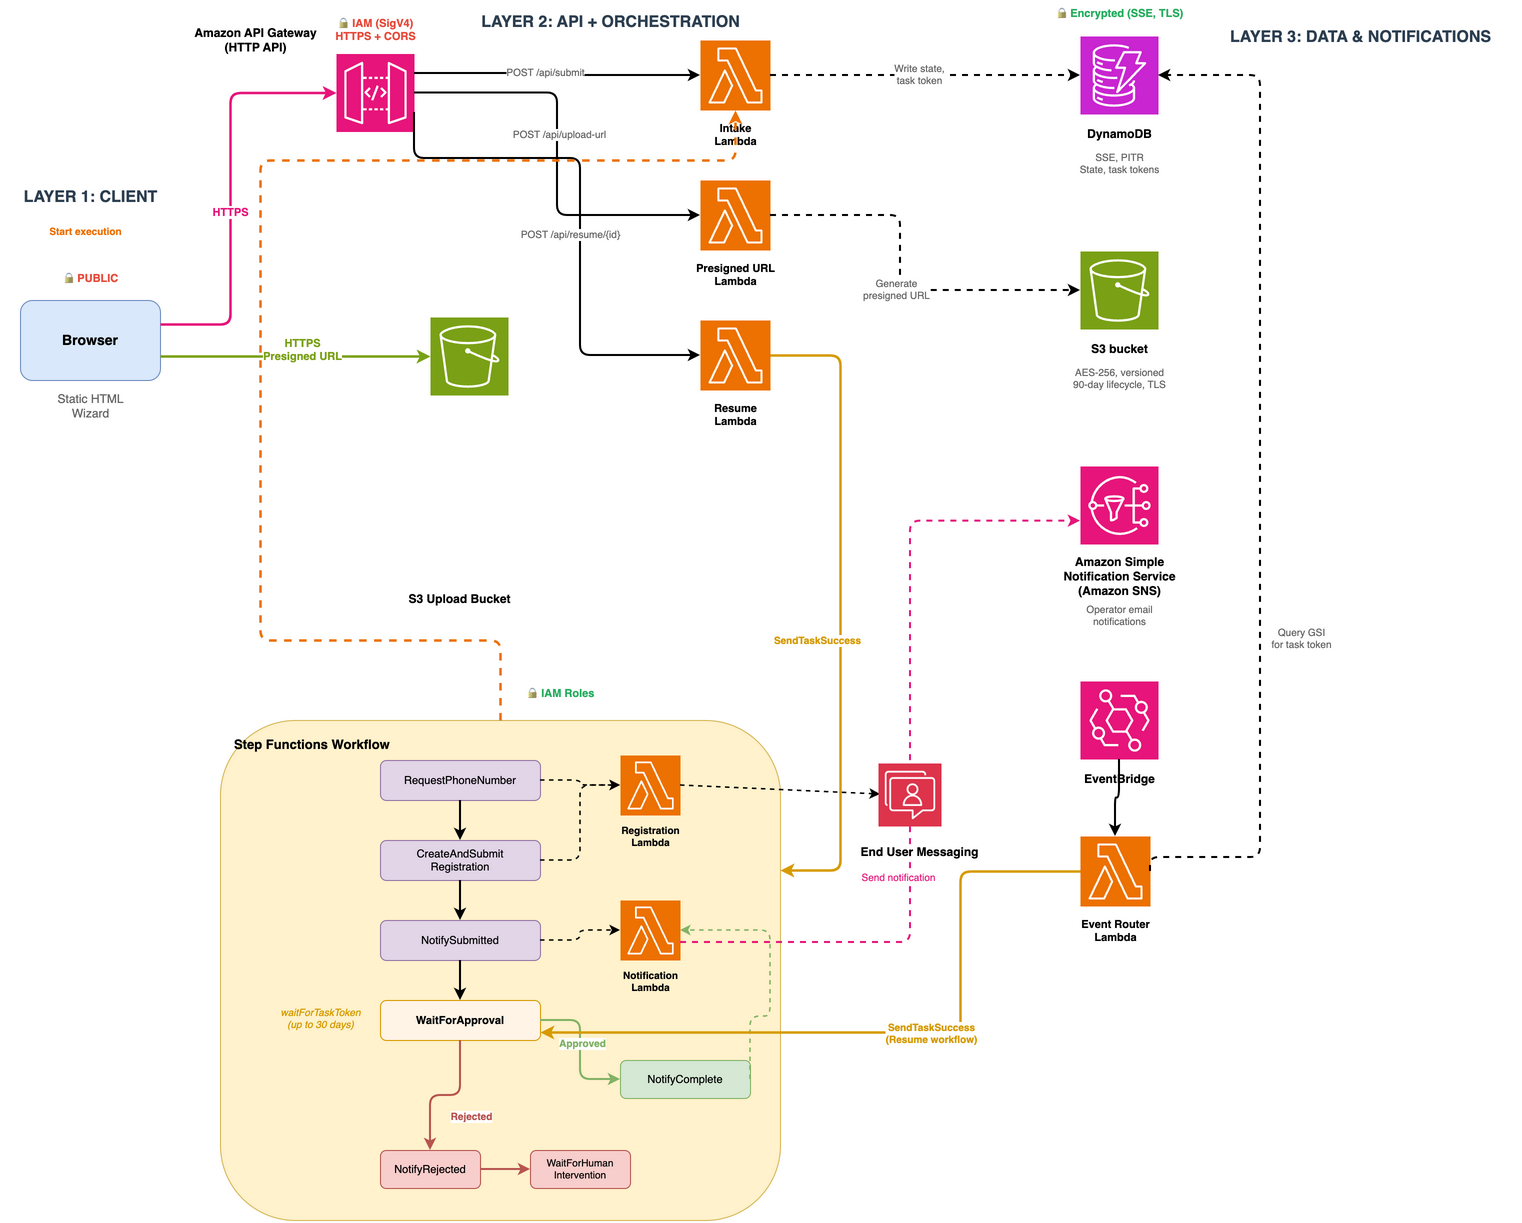
Figure 1: Architecture from submission through resolution, showing the synchronous submission flow, async Amazon EventBridge callbacks, and human-in-the-loop rejection handling
The flow
The workflow has three phases: submission, carrier review, and resolution.
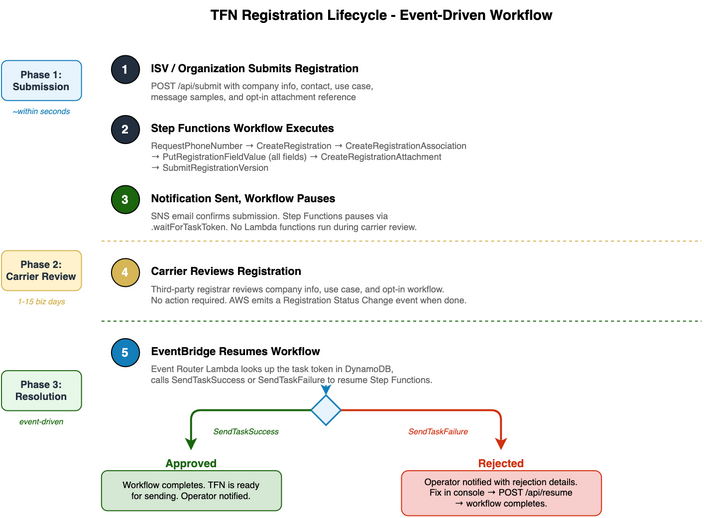
Figure 2: Registration lifecycle showing the three phases. No AWS Lambda functions run in Phase 2. The rejected path includes human-in-the-loop remediation before completion
Phase 1: Submission (within seconds)
- The application calls
POST /api/submitwith the registration data (company info, contact info, use case, message samples, and an Amazon S3 reference to the opt-in screenshot). - The Intake Lambda validates the payload, writes the full request to Amazon DynamoDB, and starts a Step Functions execution.
- Step Functions orchestrates the seven AWS End User Messaging SMS (EUM SMS) API calls in order:
- RequestPhoneNumber – Provisions a
TOLL_FREEnumber. - CreateRegistration – Creates a
US_TOLL_FREE_REGISTRATION. - CreateRegistrationAssociation – Associates the phone number with the registration (required before submission for TFNs).
- PutRegistrationFieldValue – Repeated for each field across all sections (
companyInfo,contactInfo,messagingUseCase,messageSamples). - CreateRegistrationAttachment – Uploads the opt-in screenshot from S3.
- DescribeRegistrationAttachments – Polls until the uploaded attachment reaches
UPLOAD_COMPLETEbefore the field value is assigned. - SubmitRegistrationVersion – Submits the registration for carrier review.
- RequestPhoneNumber – Provisions a
- An SNS notification confirms submission. The workflow then pauses using the Step Functions
.waitForTaskTokenintegration pattern.
Phase 2: Carrier review (1–15 business days)
During this phase, no Lambda functions run. Step Functions holds a task token in DynamoDB and waits. The toll-free number’s monthly fee still applies.
When the carrier completes its review, AWS End User Messaging emits a Registration Status Change event to Amazon EventBridge. An Amazon EventBridge rule routes this event to the Event Router Lambda. The Lambda queries a DynamoDB Global Secondary Index (GSI) to find the matching request by registrationId and retrieves the stored task token. It then calls SendTaskSuccess (if approved) or SendTaskFailure (if rejected) to resume the Step Functions execution.
Phase 3: Resolution
If approved: The workflow advances to the completion state, the operator is notified, and the TFN is ready for sending messages.
If rejected: The workflow enters a WaitForHumanIntervention state:
- The operator receives an SNS email with the specific rejection reasons (for example,
messagingUseCase.optInImage: MISSING_REQUIRED_FIELD). - The operator fixes the registration on the AWS End User Messaging SMS console.
- The operator calls
POST /api/resume/{requestId}to unblock the workflow. - The workflow completes successfully.
Scaling to many registrations
For organizations managing registrations across many customers or teams:
- Batch submission: Call
/api/submitfor each registration. Each spawns an independent Step Functions execution that tracks its own lifecycle. - State tracking: DynamoDB holds all registration state. Query by
requestId(internal ID) orregistrationId(EUM SMS ID, through the GSI) to build dashboards or status pages. - Rate limiting: The EUM SMS API has service quotas for
RequestPhoneNumberandPutRegistrationFieldValue. If submitting hundreds of registrations in a burst, add a Step FunctionsWaitstate or use Amazon Simple Queue Service (SQS) with a rate-limited consumer to stay within limits. - International Toll-Free Numbers (ITFNs): The same architecture extends to international toll-free numbers. Change the
RegistrationTypeandIsoCountryCode, and adjust the field mappings for the target country’s registration form. You can use DescribeRegistrationFieldDefinitions to retrieve the required fields for any registration type.
Production hardening: This solution ships as a sample. The AllowedOrigin parameter is required and rejects the wildcard CORS origin (’*’). Set it to your application’s domain when you deploy. The IAM policies in the template are scoped to resource ARNs in your account and Region, except SendTaskSuccess and SendTaskFailure, which don’t support resource-level permissions.
Deployment
The solution is available as an open source AWS SAM template:
Repository: sample-sms-tfn-registration-automation on GitHub
Deploy with:
Use the DryRun parameter to test the full workflow, from submission through resolution, without creating real registrations or incurring phone number charges. When set to true, the Registration Lambda returns synthetic IDs while DynamoDB writes, Step Functions execution, and SNS notifications all run for real.
Clean up
Because toll-free number lease fees begin the moment you request a number, tear down resources you no longer need. To remove the stack and stop incurring charges:
Cost considerations
Registrations spend most of their time waiting for carrier review. The architecture reflects that:
| Resource | Cost driver |
| Toll-free phone number | Monthly fee begins as soon as RequestPhoneNumber is called, regardless of registration status. See AWS End User Messaging Pricing. |
| Step Functions | Standard workflow charges per state transition. No charges while paused at .waitForTaskToken. |
| DynamoDB | On-demand billing. Each registration record is small (~2 KB). Negligible at hundreds of registrations. |
| Lambda | Only runs during submission (~seconds) and when Amazon EventBridge delivers a status change. No polling. |
| S3 | Storage for opt-in screenshots. 90-day lifecycle auto-deletion. |
| SNS | You pay per email sent. A few cents for a typical batch. |
The .waitForTaskToken pattern keeps the workflow idle during the 1–15 business day carrier review: no Lambda functions run and nothing polls. DynamoDB storage and the TFN monthly fee still apply.
Important: You begin incurring costs for TFNs as soon as you request the phone number, even if your registration has not yet been submitted or approved. Factor this into your batch strategy.
Monitoring and observability
To track registrations in flight:
- Step Functions console – Each registration has its own execution. View the current state (waiting for approval, rejected, complete) and full execution history.
- DynamoDB queries – Query the table by
requestId(hash key) to get the full record for a specific registration, including its currentstatus,registrationId, andphoneNumber. Use theregistration-id-indexGSI to look up a request by the EUM SMSregistrationId. Scan with a filter onstatusto find all registrations in a given state (for example,REGISTRATION_SUBMITTEDorREGISTRATION_REQUIRES_UPDATES). - Amazon CloudWatch Logs – Each Lambda function has its own log group. The Event Router logs structured fields like
regId,status, andtypefor every Amazon EventBridge event it receives. Use CloudWatch Logs Insights to query across log groups byregistrationIdto trace how an event was processed. - SNS notifications – Operators receive email for submissions, approvals, rejections (with specific field-level rejection reasons from the carrier), and timeouts. No polling or console checks required.
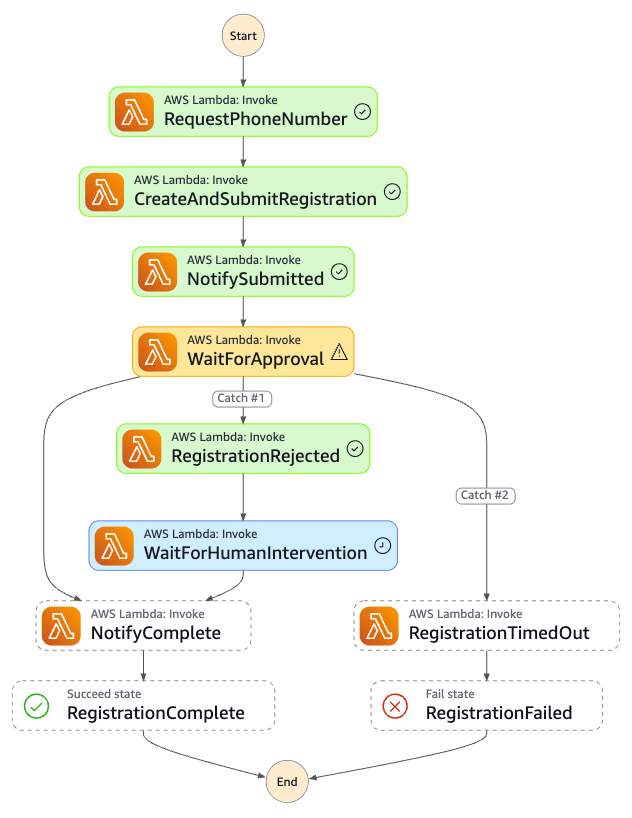
Figure 3: A single registration execution on the Step Functions console. Green states are the happy path. The rejection path (Catch #1) pauses for human intervention before completing
For organizations running hundreds of registrations, you can add a CloudWatch dashboard that tracks metrics like: registrations submitted per day, average approval time, rejection rate, and registrations currently awaiting review.
Conclusion
In this post, we showed how to automate the full TFN registration lifecycle using AWS Step Functions, Amazon EventBridge, and a human-in-the-loop rejection pattern. The architecture reduces each registration to a single API call and runs the seven EUM SMS API calls behind the scenes. It then waits for the carrier without running Lambda functions, and notifies you when something needs attention.
Related resources
- Automate AWS End User Messaging US Toll-Free Number Registrations – script-based approach for single or bulk TFN registration.
- US Toll-Free Number Registration Form (AWS Docs).
- Create a Registration Using the AWS CLI.
- How to register for a US toll-free number with AWS End User Messaging.
- Toll-Free Number Registration Rejection Reasons.
About the authors
Election Night at The Atlantic
Post Syndicated from The Atlantic original https://www.youtube.com/shorts/yV1ZgUtK8Ho
Comic for 2026.10.29 – Fix This Painting
Post Syndicated from Explosm.net original https://explosm.net/comics/fix-this-painting
New Cyanide and Happiness Comic
[$] Containers as a recognized kernel object
Post Syndicated from corbet original https://lwn.net/Articles/1102593/
The foundation of the design for containers in the kernel is that there
isn’t one; there is no container abstraction that the kernel recognizes.
Instead, the kernel provides a long list of components — namespaces,
control groups, sandboxing mechanisms, and more — along with a note that
says, in effect, “some assembly required”. There have been attempts (repeatedly) over the years to turn containers
into first-class objects with kernel support, but they have never gotten
far. Now Josef Bacik is making a
try with a concept that he calls “cells”.
Mike Collins & Marshall Rawson #lastweektonight
Post Syndicated from LastWeekTonight original https://www.youtube.com/shorts/LOzF4eGZnfY
ELECTION NIGHT LIVE: Tom Nichols, David Frum, Anne Applebaum, & Others Interpret the Midterm Results
Post Syndicated from The Atlantic original https://www.youtube.com/watch?v=WyltZQ43-Hk
Речниците на вампира
Post Syndicated from Екатерина Петрова original https://www.toest.bg/rechnitsite-na-vampira/

С наближаването на края на октомври, вместо да се впускаме в ежегодните разправии дали „внесеният от Америка празник Хелоуин“ трябва да се празнува в България, или не (за които даже вече сме писали), може просто да му се насладим – или поне да използваме повода да научим нещо ново.
Кошмари преди Хелоуин
Няма страшно, Хелоуин е просто забавление, казва Александър Драганов и ни уверява, че и ние имаме своя родна хорър култура, която не бива да пренебрегваме, а да интегрираме в празника, за да стигне до повече хора.
Защото освен възможността да се маскират и да играят на „пакост или лакомство“, която Хелоуин предлага на децата, той предоставя и на нас, възрастните, цяла серия от страховити, но очарователни етимологии, палави езикови tricks и изкушаващи семантични treats, с които да се позабавляваме. А покрай тях и да се уверим – както ровенето из речници и проследяването на разнопосочните връзки между думите за пореден път ни доказват, – че езикът, вярванията, суеверията и традициите ни (а покрай тях и самите ние) са много по-свързани с тези на останалия свят, отколкото предполагаме.
Но да започнем от името на празника, чиято транскрипция на български е леко подвеждаща. Заради изписването „Хелоуин“ изглежда, сякаш наименованието идва от Hello („здравей“) + win („победа“). А то всъщност произлиза от съвсем друго понятие. Като слят и съкратен вариант на All Hallows’ Eve, или „навечерието на Вси светии“, Halloween се произнася и би следвало да се изписва като „Халоуийн“¹. В името на приемствеността обаче, а и за да не разбунваме допълнително и без това разбунените духове, в този текст аз все пак ще се съобразя с установената транскрипция.
И като стана дума за разбунване на духове – дейност, която е в основата на празника, няма как да не обърнем внимание на някои от главните действащи персонажи в него, чийто географски – и още по-интересно, етимологичен – произход често се оказва съвсем не толкова далечен или чужд. На първо място, разбира се, имаме
граф Дракула – може би най-популярния персонаж, като който празнуващите традиционно се маскират за Хелоуин.
Както е добре известно, макар и литературният герой Дракула да се заражда с появата на романа през 1897 г. в Ирландия (също като празника), той всъщност е тясно свързан с Румъния: действието в книгата се развива в Трансилвания, а героят е базиран на историческата личност на княз Влад Цепеш, наричан още Дракула и живял току отвъд Дунава, във Влашко².
Много по-слабо известна обаче е етимологията на наименованието на типа митологично създание, към който Дракула принадлежи, а именно вампир. За моя изненада се оказва, че съвременната дума, която речниците дефинират като „мъртвец, който се е превърнал в зъл нощен дух и пие кръвта на хора и животни“ и която в съвсем леки вариации се среща в множество близки и далечни езици, произлиза от праславянската дума *ǫpyrь.
Като свързващо звено между *ǫpyrь и съвременната дума „вампир“ някои източници споменават старобългарската *вѫпиръ, макар че, както подсказва звездичката пред нея, тя е незасвидетелствана. Като такава я определя Българският етимологичен речник, според който старобългарското понятие „е било заето в гр. βαμπύρος, което прониква обратно в български и сърбохърватски“. Речникът обяснява, че „в тая си форма думата получава голямо разпространение на всички европейски езици, благодарение на една история с вампири, разиграла се в Сърбия през 18 в.“³.
Но докато по тези въпроси изследователите, общо взето, са единодушни, теориите за произхода на праславянската дума *ǫpyrь са разнопосочни и с варираща степен на убедителност. В Етимологичния речник на украинския език например една от посочените възможни връзки е с праславянския глагол *vrěpiti (se) (‘вкопчвам се, впивам се’) заради склонността на вампирите да се впиват в своите жертви.
Друга хипотеза разглежда *pyrь като възможен корен, който означава или „огън“, или „летящо същество“, но с добавена към него отрицателна представка. В първия случай, както се отбелязва в гореспоменатия речник, *ǫpyrь би могло да обозначава труп, който не е бил изгорен – като отражение на древната вяра в пречистващото действие на огъня от времето, когато при славяните езичници кремацията била задължителен погребален обред.
При втория случай пък се предполага възможен паралел с праславянската дума *netopyřь⁴, буквално „нощен летец“, или с други думи, „прилеп“⁵. Основавайки се на тази хипотеза, Етимологичният речник на хърватския или сръбския език отбелязва, че *ǫpyrь може да е възникнало като табуистично название за vukodlak6. В потвърждение на това твърдение в „Српски рjечник“ от 1818 г. думите за „вампир“ и „вукодлак“ са дадени като синонимни и взаимно заменяеми.
Митичното същество на човек, който от време на време се превръща във вълк, може и да не се радва на популярността на вампира, поне що се отнася до костюмите за Хелоуин, но произходът на наименованието му, известно на български под смятаното за диалектно „вълколак“, или по-съвременното и книжовно „върколак“, също е доста любопитен. Думата произлиза от праславянските *vьlkъ (‘вълк’) и *dolkъ (‘козина’), а според Етимологичния речник „различните форми се дължат на дисимилация и на осмисляне с други думи, понеже връзката с началното значение е загубена“.
Тъй като речникът не пояснява точно с кои други думи става осмислянето, ние можем само да гадаем. Лично аз винаги съм си мислила, че тъй като звуково се доближава до „въртене“ и „превръщане“,
понятието „върколак“ по някакъв начин е свързано с разпространената сред вампири, таласъми и тем подобни практика, известна на английски като shapeshifting, или промяна на формата.
(На руски например, освен архаичната дума „волколак“, в съвременен контекст се използва и понятието „волк-оборотень“.)
Така или иначе, освен в много от славянските езици българската дума е заета също и в други балкански, например румънски (vârcolac) и албански (vurkollak или vurvollak), където думата се използва като синоним на „зомби“, „вампир“ или „призрак“. В гръцкия βρυκόλακας (vrykólakas) също е синоним на βαμπίρ (vampír), докато думата за „върколак“ е съвсем отделна: λυκάνθρωπος (lykánthropos) – от λύκος (lúkos ‘вълк’) + ἄνθρωπος (ánthrōpos ‘човек’).
Но да се върнем към теориите за произхода на *ǫpyrь, друга от които води към трети доста популярен хелоуински персонаж. Според Етимологичния речник на хърватския или сръбския език е възможно – макар и доста лингвисти да отхвърлят тази теория като неблагонадеждна – праславянската дума *ǫpyrь да е заемка от севернотюркската (ubyr, ubyrly), която означава „вещица“.
За разлика от „вампир“ и „върколак“, които се разпространяват не само в славянските, а и в други езици, думите за „вещица“ са доста по-специфични и разнообразни дори и в сродните славянски езици. На сръбски, хърватски и македонски думата – съответно „вештица“/veštica, vještica и „вештерка“ – е сходна с българската и произлиза от „вещ“ (‘знаещ’). С леки звукови изменения тези думи споделят общия праславянския корен *věd- (срв. *věděti ‘знам’) с източнославянските езици – съответно „ведьма“ на руски, „відьма“ на украински и „ведзьма“ на беларуски. В словенски и в западнославянските езици пък думите за „вещица“ са особено очарователни: čarovnica на словенски, czarownica на полски, čarodějnice на чешки и čarodejnica на словашки.
Румънската дума за „вещица“ е vrăjitoare – женска форма на vrăjitor (‘магьосник’), която произлиза от vrajă (‘заклинание’), а тя на свой ред е заета от старобългарски (срв. вражениѥ, тоест „гадание“ или „врачуване“). Италианската strega, която произлиза от латинската strix, а тя на свой ред от старогръцката στρίξ (stríx), или „сова“, пък споделя обща етимология с румънското фолклорно понятие strigoi, което се смята за нещо като синоним на заетата от западноевропейските езици vampir.
И като стана дума за румънски синоними на „вампир“, няма как да завършим този текст, без да споменем още едно наименование, станало известно благодарение на романа на Брам Стокър. Там, в превод на Теодор Михайлов, се споменават
„носферату“, както ги наричат в Източна Европа“ – описани като същества, „обречени на безсмъртие“ и „страховити създания, вдъхващи ни ужас“.
Самият Стокър признава, че е заел думата nosferatu от шотландската авторка Емили Джерард, която я използва като (по презумпция местен) синоним на „вампир“ в статията си Transylvanian Superstitions („Трансилвански суеверия“) от 1885 г.
През 1922 г. понятието придобива световна известност с култовия немски хорър филм „Носферату – симфония на ужаса“, наречен така, за да се избегне нарушаването на авторските права на Стокър, върху чийто роман е базиран. Въпреки че в румънския език такава дума реално не съществува, лингвистите все пак допускат възможността тя да се е появила в резултат на неправилно чута и грешно изписана румънска дума: nesuferit, ‘непоносим’, ‘неприятен’, или пък necuratul, която буквално означава „нечистият“ и се използва като евфемистично название на дявола7. Друга теория предполага връзка с гръцката νοσοφόρος (nosophoros), или „носещ зараза“.
1 Докато в католическия и протестантския календар празникът Вси светии всяка година се отбелязва на 1 ноември, в православния той е подвижен и се пада някъде през лятото – в първата неделя след Петдесетница, или точно 57 дни след Великден. Но и навечерието на Деня на народните будители е подходящ момент да се поровим в речниците, а пък, ако все пак държим на официален повод да помислим за мъртвите, съвсем скоро предстои и Архангеловата задушница – на 7 ноември.
2 Името на историческата личност, върху която Брам Стокър базира своя литературен герой, също е свързано с доста интересни етимологични връзки. Влад III, владетел на Влашко през XV век, е известен с прозвището Цепеш (от рум. Țepeș ‘кол’) заради обичая си да набива своите противници на кол, както и като Дракула – заради членството на баща му Влад II в Ордена на дракона. За злокобната му слава допринася и фактът, че в съвременния румънски думата език Dracul означава „дяволът“ или „сатаната“.
3 Wikidictionary също споменава по-старата старобългарска форма *вѫпиръ, но обяснява разпространението ѝ в Западна Европа посредством унгарския. Така излиза, че думата „вампир“ навлиза (обратно) в съвременния български „от англ. vampire, фр. vampire или нем. Vampire, които са заимствани от унг. vámpír“.
4 Думата „нетопир“ се среща в българския и досега като остаряло наименование за „прилеп“, a с малки вариации съществува и в чешкия (netopýr), полския (nietoperz) и словенския (netopir). На руски и украински „Нетопыри́“ обозначава конкретен род малки гладконоси прилепи (на латински Pipistrellus), известен на български с умилителното научно наименование Прилепчета.
5 Въпреки че прилепът не принадлежи към разреда на гризачите, на доста езици той се нарича с думи, буквално означаващи някакъв вид мишка: на френски прилепът е „плешива мишка“ (chauve-souris), в повечето германски езици тя е пърхаща (Fledermaus на немски, fladdermus на шведски и т.н.), на естонски е кожена (nahkhiir), на езика на баските е стара, лоша или зла (saguzar), на руски е летяща („летучая мышь“), на сръбски и хърватски е сляпа (slijepi miš), а според алтернативното ѝ название (šišmiš) може да е таванска или шумоляща.
6 Теорията за табуто намираме и в Българския етимологичен речник. Като произлизащи от праславянската *ǫpyrь освен българската дума „вампир“ там са изредени и форми с начално уп- в сърбохърватски („упир“/upir), руски, украински и белоруски („упырь“ и „упирь“), чешки (upír) и полски (upiór), като се отбелязва, че „разнообразието на формите, които често не са резултат на правилен фонетичен развой, трябва да се обясни с особения характер на думата, която спада към кръга на понятията, свързани с табу“.
7 Алтернативните имена, с които различни езици и култури назовават зли и страшни същества, за да избегнат използването на истинското им (табуистично) име и по този начин да ги повикат и ядосат, също си имат наименование. Известен на английски като noa-name, терминът произлиза от полинезийската идея за Noa – антоним на Tapu, откъдето идва и думата „табу“. Свързано с нея – макар че съвременното му значение се основава по-скоро върху идеи за приличие, отколкото върху страх от зли сили – е понятието „евфемизъм“. То на свой ред произлиза от старогръцкото εὐφημισμός (euphemismos), съставено от εὖ (eu ‘добре’) и φήμη (pheme ‘реч, говорене’).
В рубриката „От дума на дума“ Екатерина Петрова търси актуални, интересни или новопоявили се думи от нашето ежедневие и проследява често изненадващия им произход, развитието на значенията им във времето и взаимовръзките им с близки и далечни езици.
Security updates for Thursday
Post Syndicated from jzb original https://lwn.net/Articles/1103666/
Security updates have been issued by AlmaLinux (cjose, emacs, expat, gcc-toolset-15-gcc, java-17-openjdk, java-25-openjdk, kernel, kernel-rt, libX11, libXi, libXrender, libXtst, mod_auth_openidc:2.3, pki-deps:10.6, thunderbird, webkit2gtk3, and yggdrasil), Debian (chromium, firefox-esr, and openjdk-25), Fedora (firefox, librabbitmq, libreswan, python-pillow, and unbound), Mageia (fio and python3, python-pip), Oracle (buildah, cjose, container-tools:ol8, emacs, flute, libbase, libfonts, libformula, liblayout, libloader, libreoffice, librepository, libserializer, pentaho-libxml, pentaho-reporting-flow-engine, and sac, kernel, libX11, libXi, libXrender, libXtst, podman, python-urllib3, thunderbird, and yggdrasil), Red Hat (firefox, goose, kernel, kernel package, kernel-rt, librsvg2, multiple packages, php:7.4, sudo, thunderbird, and xorg-x11-server), and SUSE (alsa, ca-certificates-mozilla, chromedriver, cifs-utils, coredns, coreutils, cpupower, curl, cyrus-sasl, docker, dpdk, haproxy, kernel, libpoppler-cpp3, libsndfile-devel, libzbar-devel, mozilla-nss, MozillaFirefox, nginx, openai-codex, and perl-Cpanel-JSON-XS).
Cloudflare DDoS Threat Report 2026 Q3: More swarms, fewer giants
Post Syndicated from Cloudforce One original https://blog.cloudflare.com/ddos-threat-report-2026-q3/
Welcome to the 26th edition of Cloudflare's DDoS Threat Report. This edition covers the third quarter of 2026 — July, August, and September — and returns the series to its quarterly cadence following the combined H1 2026 volume. The analysis is produced by Cloudforce One, Cloudflare's Threat Intelligence organization, providing a comprehensive analysis of the evolving threat landscape of Distributed Denial of Service (DDoS) attacks based on data from the Cloudflare network.
Key insights
- Short-burst, low-bandwidth attacks lasting under 10 minutes and 1 Gbps surged by 208%. Conversely, hyper-volumetric attacks exceeding 1 Tbps plummeted by nearly 69% from Q2, possibly a reflection of law enforcement actions against four major Internet of Things (IoT) botnets earlier in the year. However, variants continue to emerge, proving that IoT botnets remain a durable, high-volume threat to network infrastructure.
- Threat actors dramatically shifted their reflection and amplification tactics, abruptly abandoning CLDAP floods, which collapsed by 99.5% quarter-over-quarter. Instead, attackers pivoted heavily toward other connectionless protocols, driving a 215% surge in DNS amplification and a 122% increase in general UDP floods.
- Attack targets broadened significantly across both industries and geographies, with the United States reclaiming the most-attacked position from China. Canada and Israel experienced sharp spikes in targeted attacks — jumping 10 and 7 spots respectively — while juggling geopolitical tensions, trade disputes, and contentious domestic events. At the same time, the operational focus shifted away from media organizations toward a wider array of industry targets, including consumer services, Internet infrastructure, and adult entertainment.
Q3 by the numbers: 8,200 DDoS attacks every hour
Across its network in the third quarter of 2026, Cloudflare autonomously mitigated 18.2 million network-layer DDoS attacks and 14.4 trillion HTTP DDoS requests. That works out to approximately 8,226 network-layer DDoS attacks per hour, or about 197,400 per day — one attack every 0.44 seconds. The quarter's mitigated traffic totaled 272.6 PB at the network layer and 95.1 PB at the HTTP layer.
More swarms, fewer giants
Short-burst, mid-range, high-count attacks — the operational signature of DDoS-for-hire "booter" services — accelerated this quarter. These attacks primarily targeted computer software, gambling and casinos, and information technology industries. Cloudflare autonomously mitigated 18.2 million network-layer DDoS attacks in Q3 2026, a +208% increase from the same quarter in 2025:
- 96% ended in under 10 minutes
- 98% stayed under 1 Gbps, more than enough to overwhelm a server or website
On the other hand, network-level hyper-volumetric attacks (those exceeding 1 Tbps) reversed course, dropping to 251 attacks in Q3 from 805 in Q2 — coinciding with law enforcement action in early 2026 that dismantled four of the largest IoT DDoS botnets: Aisuru, KimWolf, JackSkid, and Mossad.
Still, IoT-based botnets remain a durable high-volume threat as the ecosystem churns through new variants such as Dysphoria and Evooo1Bot. Mirai-classified mitigation peaked in August at 57.23 PB, representing 46.5% of all mitigated network-layer bytes in Q3, including four days — August 16, 19, 23, and 25 — that each cleared three petabytes. The quarter's longest sustained Mirai attack ran 49.7 hours between August 19 and August 21.
Vector shifts: the collapse of CLDAP and rise of UDP
The most dramatic vector shift of the quarter was downward. CLDAP (Connectionless Lightweight Directory Access Protocol) attacks — where small queries with a forged victim IP address trick public domain controllers (UDP 389) into reflecting massive, amplified responses back at the target — experienced a dramatic +580% quarter-over-quarter surge in the first half of the year before collapsing to just 0.05% of attacks in Q3.
Meanwhile, DNS amplification surged 215% to account for 3.43% of all network-layer attacks, exploiting open DNS resolvers in a similar reflection-and-amplification pattern to CLDAP: small spoofed queries, large replies directed at the victim. Other UDP floods climbed from 14.06% to 31.31% of network-layer attacks. UDP is a connectionless transport protocol, which makes it a convenient vehicle for raw volumetric attacks: attackers send large numbers of UDP packets to random or specific ports on the target, forcing the target to check for a listening application and respond, consuming its network and compute resources.
Most-attacked industry
While Media, Production & Publishing remained the most-attacked industry in Q3 2026, its overall share is roughly a quarter of its Q2 level, and the focus has moved across a wider set of industries. Internet rose from outside the top 10 to #6; Consumer Services and Adult Entertainment also climbed in, reaching #8 and #9 respectively.
Most-attacked locations
Geographic surges: Canada and Israel climb the ranks
Adding to an already turbulent period of bilateral trade disputes, Canada jumped from #16 to #6, driven by attacks against its Retail, Telecommunications, Service providers & carriers, and Marketing & advertising industries.
Israel moved 7 spots to take #10 as a result of sustained DDoS activity in mid-September. While this period was marked by contentious decisions ahead of parliamentary elections and the Rosh Hashanah holiday, there was also a massive, documented surge in hostile cyber warfare targeting Israel this year.
Top 10
The United States was the most-attacked location in Q3 2026, while China was number #2 and Indonesia rose into the top three at 2.93% of total attacks. The U.S.-China pairing at the top is consistent with the first half of 2026, when China finished #1 and the U.S. #2; the countries have traded positions as attention and attacker preferences shift.
Strengthening global defenses and helping to defend the Internet
Cloudflare's network is designed to absorb this kind of growth in DDoS threats. Every service on our network is protected by free, unmetered DDoS protection that runs at every one of our 330+ cities globally, backed by 500 Tbps of network capacity. Autonomy is the point: our systems detect and mitigate attacks without human intervention. And they need to, because as this quarter's distributions make clear, most attacks end long before a human analyst could see the alert, and the largest attacks still regularly exceed 1 Tbps at a cadence measured in hundreds per quarter.
To help hosting providers, cloud computing platforms, and Internet service providers identify and take down the abusive IP addresses and accounts that launch these attacks, we leverage Cloudflare's unique vantage point on DDoS attacks to provide a free DDoS Botnet Threat Feed for Service Providers.
Over 800 networks worldwide have signed up for this feed, and we've already seen great collaboration across the community to take down botnet nodes. For a continuously-updated view of attack trends across the Internet, visit Cloudflare Radar.
About Cloudforce One
Driven by a mission to help defend the Internet, Cloudforce One draws on telemetry from Cloudflare's global network — which protects more than 20% of the web — to drive threat research and operational response, protecting critical systems for millions of organizations worldwide.