Stream Live lets users easily scale their live-streaming apps and websites to millions of creators and concurrent viewers while focusing on the content rather than the infrastructure — Stream manages codecs, protocols, and bit rate automatically.
For Speed Week this year, we introduced a closed beta of Low-Latency HTTP Live Streaming (LL-HLS), which builds upon the high-quality, feature-rich HTTP Live Streaming (HLS) protocol. Lower latency brings creators even closer to their viewers, empowering customers to build more interactive features like chat and enabling the use of live-streaming in more time-sensitive applications like live e-learning, sports, gaming, and events.
Today, in celebration of Birthday Week, we’re opening this beta to all customers with even lower latency. With LL-HLS, you can deliver video to your audience faster, reducing the latency a viewer may experience on their player to as little as three seconds. Low Latency streaming is priced the same way, too: $1 per 1,000 minutes delivered, with zero extra charges for encoding or bandwidth.
Broadcast with latency as low as three seconds.
LL-HLS is an extension of the HLS standard that allows us to reduce glass-to-glass latency — the time between something happening on the broadcast end and a user seeing it on their screen. That includes factors like network conditions and transcoding for HLS and adaptive bitrates. We also include client-side buffering in our understanding of latency because we know the experience is driven by what a user sees, not when a byte is delivered into a buffer. Depending on encoder and player settings, broadcasters' content can be playing on viewers' screens in less than three seconds.
On the left, OBS Studio broadcasting from my personal computer to Cloudflare Stream. On the right, watching this livestream using our own built-in player playing LL-HLS with three second latency!
Same pricing, lower latency. Encoding is always free.
Our addition of LL-HLS support builds on all the best parts of Stream including simple, predictable pricing. You never have to pay for ingress (broadcasting to us), compute (encoding), or egress. This allows you to stream with peace of mind, knowing there are no surprise fees and no need to trade quality for cost. Regardless of bitrate or resolution, Stream costs \$1 per 1,000 minutes of video delivered and \$5 per 1,000 minutes of video stored, billed monthly.
Stream also provides both a built-in web player or HLS/DASH manifests to use in a compatible player of your choosing. This enables you or your users to go live using the same protocols and tools that broadcasters big and small use to go live to YouTube or Twitch, but gives you full control over access and presentation of live streams. We also provide access control with signed URLs and hotlinking prevention measures to protect your content.
Powered by the strength of the network
And of course, Stream is powered by Cloudflare's global network for fast delivery worldwide, with points of presence within 50ms of 95% of the Internet connected population, a key factor in our quest to slash latency. We ingest live video close to broadcasters and move it rapidly through Cloudflare’s network. We run encoders on-demand and generate player manifests as close to viewers as possible.
Getting started with LL-HLS
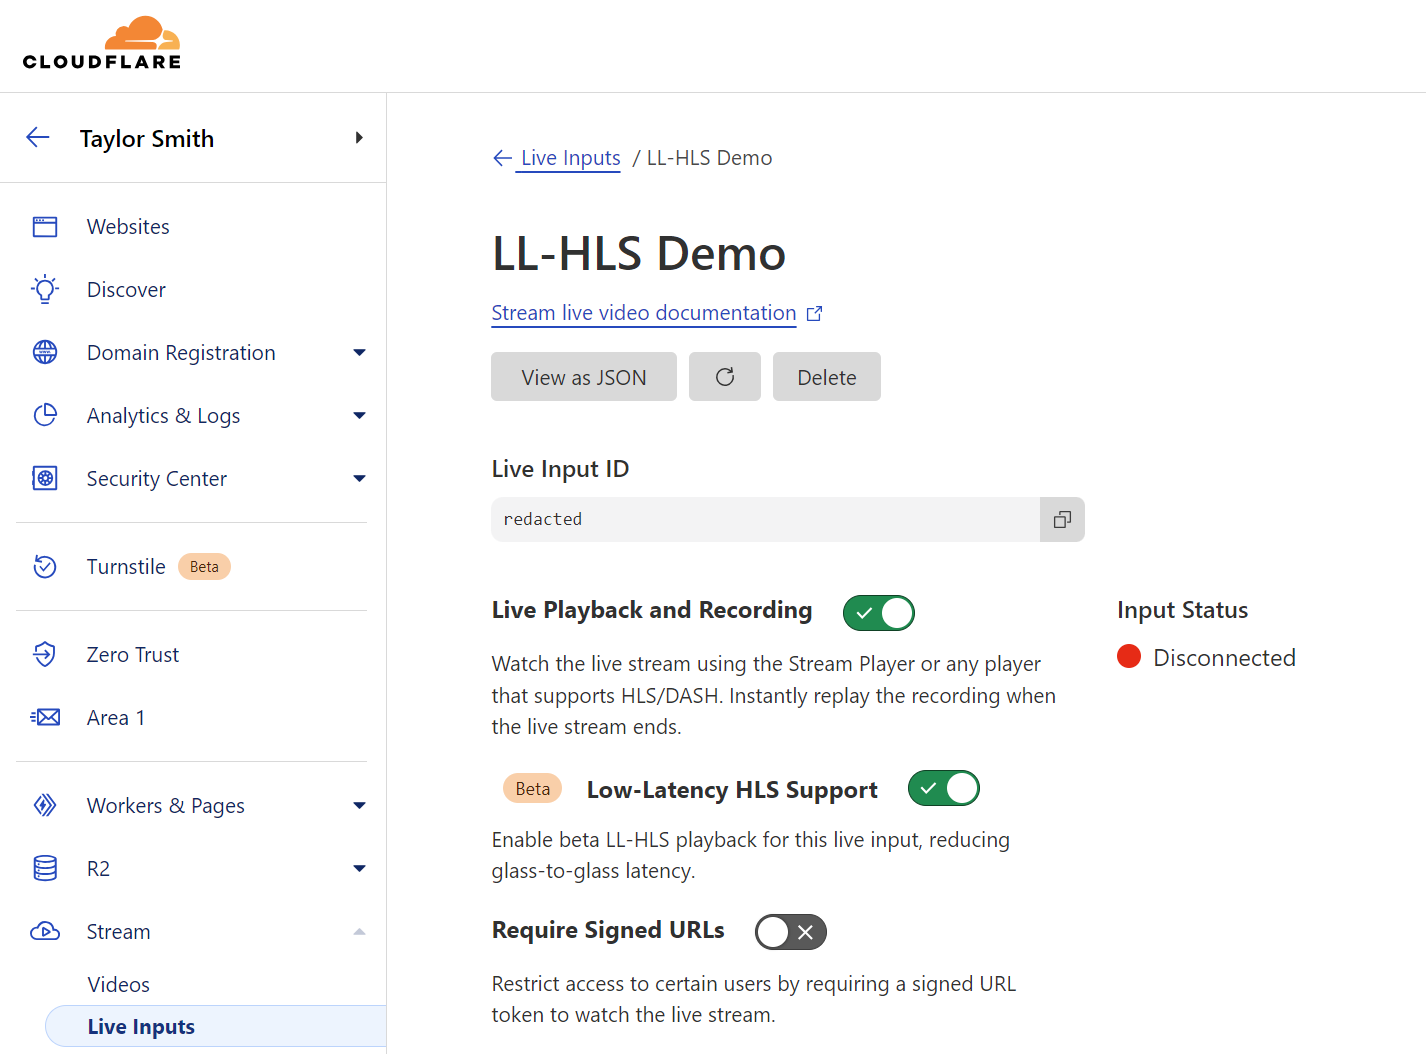
Getting started with Stream Live only takes a few minutes, and by using Live Outputs for restreaming, you can even test it without changing your existing infrastructure. First, create or update a Live Input in the Cloudflare dashboard. While in beta, Live Inputs will have an option to enable LL-HLS called “Low-Latency HLS Support.” Activate this toggle to enable the new pipeline.
Stream will automatically provide the RTMPS and SRT endpoints to broadcast your feed to us, just as before. For the best results, we recommend the following broadcast settings:
Codec: h264
GOP size / keyframe interval: 1 second
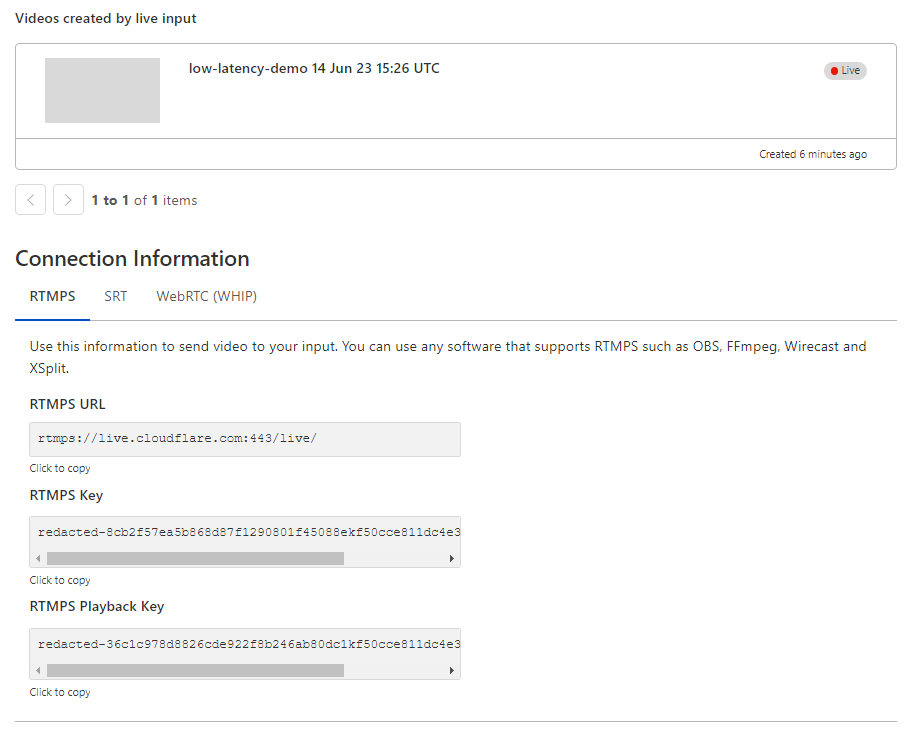
Optionally, configure a Live Output to point to your existing video ingest endpoint via RTMPS or SRT to test Stream while rebroadcasting to an existing workflow or infrastructure.
Stream will automatically provide RTMPS and SRT endpoints to broadcast your feed to us as well as an HTML embed for our built-in player.
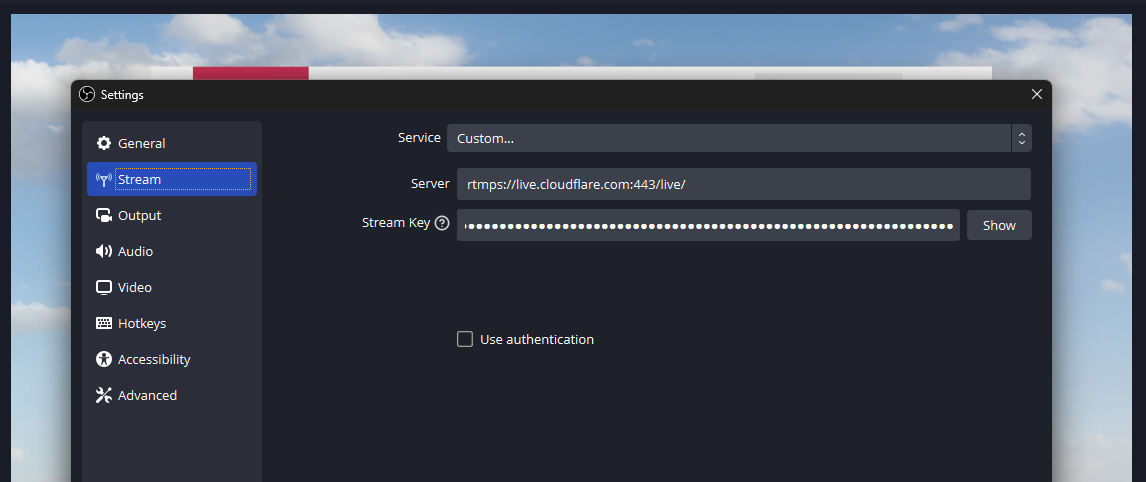
This connection information can be added easily to a broadcast application like OBS to start streaming immediately:
During the beta, our built-in player will automatically attempt to use low-latency for any enabled Live Input, falling back to regular HLS otherwise. If LL-HLS is being used, you’ll see “Low Latency” noted in the player.
During this phase of the beta, we are most closely focused on using OBS to broadcast and Stream’s built-in player to watch — which uses HLS.js under the hood for LL-HLS support. However, you may test the LL-HLS manifest in a player of your own by appending ?protocol=llhls to the end of the HLS manifest URL. This flag may change in the future and is not yet ready for production usage; watch for changes in DevDocs.
Sign up today
Low-Latency HLS is Stream Live’s latest tool to bring your creators and audiences together. All new and existing Stream subscriptions are eligible for the LL-HLS open beta today, with no pricing changes or contract requirements — all part of building the fastest, simplest serverless live-streaming platform. Join our beta to start test-driving Low-Latency HLS!
Picture this: you’re at an airport, and you’re going through an airport security checkpoint. There are a bunch of agents who are scanning your boarding pass and your passport and sending you through to your gate. All of a sudden, some of the agents go on break. Maybe there’s a leak in the ceiling above the checkpoint. Or perhaps a bunch of flights are leaving at 6pm, and a number of passengers turn up at once. Either way, this imbalance between localized supply and demand can cause huge lines and unhappy travelers — who just want to get through the line to get on their flight. How do airports handle this?
Some airports may not do anything and just let you suffer in a longer line. Some airports may offer fast-lanes through the checkpoints for a fee. But most airports will tell you to go to another security checkpoint a little farther away to ensure that you can get through to your gate as fast as possible. They may even have signs up telling you how long each line is, so you can make an easier decision when trying to get through.
At Cloudflare, we have the same problem. We are located in 300 cities around the world that are built to receive end-user traffic for all of our product suites. And in an ideal world, we always have enough computers and bandwidth to handle everyone at their closest possible location. But the world is not always ideal; sometimes we take a data center offline for maintenance, or a connection to a data center goes down, or some equipment fails, and so on. When that happens, we may not have enough attendants to serve every person going through security in every location. It’s not because we haven’t built enough kiosks, but something has happened in our data center that prevents us from serving everyone.
So, we built Traffic Manager: a tool that balances supply and demand across our entire global network. This blog is about Traffic Manager: how it came to be, how we built it, and what it does now.
The world before Traffic Manager
The job now done by Traffic Manager used to be a manual process carried out by network engineers: our network would operate as normal until something happened that caused user traffic to be impacted at a particular data center.
When such events happened, user requests would start to fail with 499 or 500 errors because there weren’t enough machines to handle the request load of our users. This would trigger a page to our network engineers, who would then remove some Anycast routes for that data center. The end result: by no longer advertising those prefixes in the impacted data center, user traffic would divert to a different data center. This is how Anycast fundamentally works: user traffic is drawn to the closest data center advertising the prefix the user is trying to connect to, as determined by Border Gateway Protocol. For a primer on what Anycast is, check out this reference article.
Depending on how bad the problem was, engineers would remove some or even all the routes in a data center. When the data center was again able to absorb all the traffic, the engineers would put the routes back and the traffic would return naturally to the data center.
As you might guess, this was a challenging task for our network engineers to do every single time any piece of hardware on our network had an issue. It didn’t scale.
Never send a human to do a machine’s job
But doing it manually wasn’t just a burden on our Network Operations team. It also resulted in a sub-par experience for our customers; our engineers would need to take time to diagnose and re-route traffic. To solve both these problems, we wanted to build a service that would immediately and automatically detect if users were unable to reach a Cloudflare data center, and withdraw routes from the data center until users were no longer seeing issues. Once the service received notifications that the impacted data center could absorb the traffic, it could put the routes back and reconnect that data center. This service is called Traffic Manager, because its job (as you might guess) is to manage traffic coming into the Cloudflare network.
Accounting for second order consequences
When a network engineer removes a route from a router, they can make the best guess at where the user requests will move to, and try to ensure that the failover data center has enough resources to handle the requests — if it doesn’t, they can adjust the routes there accordingly prior to removing the route in the initial data center. To be able to automate this process, we needed to move from a world of intuition to a world of data — accurately predicting where traffic would go when a route was removed, and feeding this information to Traffic Manager, so it could ensure it doesn’t make the situation worse.
Meet Traffic Predictor
Although we can adjust which data centers advertise a route, we are unable to influence what proportion of traffic each data center receives. Each time we add a new data center, or a new peering session, the distribution of traffic changes, and as we are in over 300 cities and 12,500 peering sessions, it has become quite difficult for a human to keep track of, or predict the way traffic will move around our network. Traffic manager needed a buddy: Traffic Predictor.
In order to do its job, Traffic Predictor carries out an ongoing series of real world tests to see where traffic actually moves. Traffic Predictor relies on a testing system that simulates removing a data center from service and measuring where traffic would go if that data center wasn’t serving traffic. To help understand how this system works, let’s simulate the removal of a subset of a data center in Christchurch, New Zealand:
First, Traffic Predictor gets a list of all the IP addresses that normally connect to Christchurch. Traffic Predictor will send a ping request to hundreds of thousands of IPs that have recently made a request there.
Traffic Predictor records if the IP responds, and whether the response returns to Christchurch using a special Anycast IP range specifically configured for Traffic Predictor.
Once Traffic Predictor has a list of IPs that respond to Christchurch, it removes that route containing that special range from Christchurch, waits a few minutes for the Internet routing table to be updated, and runs the test again.
Instead of being routed to Christchurch, the responses are instead going to data centers around Christchurch. Traffic Predictor then uses the knowledge of responses for each data center, and records the results as the failover for Christchurch.
This allows us to simulate Christchurch going offline without actually taking Christchurch offline!
But Traffic Predictor doesn’t just do this for any one data center. To add additional layers of resiliency, Traffic Predictor even calculates a second layer of indirection: for each data center failure scenario, Traffic Predictor also calculates failure scenarios and creates policies for when surrounding data centers fail.
Using our example from before, when Traffic Predictor tests Christchurch, it will run a series of tests that remove several surrounding data centers from service including Christchurch to calculate different failure scenarios. This ensures that even if something catastrophic happens which impacts multiple data centers in a region, we still have the ability to serve user traffic. If you think this data model is complicated, you’re right: it takes several days to calculate all of these failure paths and policies.
Here’s what those failure paths and failover scenarios look like for all of our data centers around the world when they’re visualized:
This can be a bit complicated for humans to parse, so let’s dig into that above scenario for Christchurch, New Zealand to make this a bit more clear. When we take a look at failover paths specifically for Christchurch, we see they look like this:
In this scenario we predict that 99.8% of Christchurch’s traffic would shift to Auckland, which is able to absorb all Christchurch traffic in the event of a catastrophic outage.
Traffic Predictor allows us to not only see where traffic will move to if something should happen, but it allows us to preconfigure Traffic Manager policies to move requests out of failover data centers to prevent a thundering herd scenario: where sudden influx of requests can cause failures in a second data center if the first one has issues. With Traffic Predictor, Traffic Manager doesn’t just move traffic out of one data center when that one fails, but it also proactively moves traffic out of other data centers to ensure a seamless continuation of service.
From a sledgehammer to a scalpel
With Traffic Predictor, Traffic Manager can dynamically advertise and withdraw prefixes while ensuring that every datacenter can handle all the traffic. But withdrawing prefixes as a means of traffic management can be a bit heavy-handed at times. One of the reasons for this is that the only way we had to add or remove traffic to a data center was through advertising routes from our Internet-facing routers. Each one of our routes has thousands of IP addresses, so removing only one still represents a large portion of traffic.
Specifically, Internet applications will advertise prefixes to the Internet from a /24 subnet at an absolute minimum, but many will advertise prefixes larger than that. This is generally done to prevent things like route leaks or route hijacks: many providers will actually filter out routes that are more specific than a /24 (for more information on that, check out this blog here). If we assume that Cloudflare maps protected properties to IP addresses at a 1:1 ratio, then each /24 subnet would be able to service 256 customers, which is the number of IP addresses in a /24 subnet. If every IP address sent one request per second, we’d have to move 4 /24 subnets out of a data center if we needed to move 1,000 requests per second (RPS).
But in reality, Cloudflare maps a single IP address to hundreds of thousands of protected properties. So for Cloudflare, a /24 might take 3,000 requests per second, but if we needed to move 1,000 RPS out, we would have no choice but to move a single /24 out. And that’s just assuming we advertise at a /24 level. If we used /20s to advertise, the amount we can withdraw gets less granular: at a 1:1 website to IP address mapping, that’s 4,096 requests per second for each prefix, and even more if the website to IP address mapping is many to one.
While withdrawing prefix advertisements improved the customer experience for those users who would have seen a 499 or 500 error — there may have been a significant portion of users who wouldn’t have been impacted by an issue who still were moved away from the data center they should have gone to, probably slowing them down, even if only a little bit. This concept of moving more traffic out than is necessary is called “stranding capacity”: the data center is theoretically able to service more users in a region but cannot because of how Traffic Manager was built.
We wanted to improve Traffic Manager so that it only moved the absolute minimum of users out of a data center that was seeing a problem and not strand any more capacity. To do so, we needed to shift percentages of prefixes, so we could be extra fine-grained and only move the things that absolutely need to be moved. To solve this, we built an extension of our Layer 4 load balancer Unimog, which we call Plurimog.
A quick refresher on Unimog and layer 4 load balancing: every single one of our machines contains a service that determines whether that machine can take a user request. If the machine can take a user request then it sends the request to our HTTP stack which processes the request before returning it to the user. If the machine can’t take the request, the machine sends the request to another machine in the data center that can. The machines can do this because they are constantly talking to each other to understand whether they can serve requests for users.
Plurimog does the same thing, but instead of talking between machines, Plurimog talks in between data centers and points of presence. If a request goes into Philadelphia and Philadelphia is unable to take the request, Plurimog will forward to another data center that can take the request, like Ashburn, where the request is decrypted and processed. Because Plurimog operates at layer 4, it can send individual TCP or UDP requests to other places which allows it to be very fine-grained: it can send percentages of traffic to other data centers very easily, meaning that we only need to send away enough traffic to ensure that everyone can be served as fast as possible. Check out how that works in our Frankfurt data center, as we are able to shift progressively more and more traffic away to handle issues in our data centers. This chart shows the number of actions taken on free traffic that cause it to be sent out of Frankfurt over time:
But even within a data center, we can route traffic around to prevent traffic from leaving the datacenter at all. Our large data centers, called Multi-Colo Points of Presence (MCPs) contain logical sections of compute within a data center that are distinct from one another. These MCP data centers are enabled with another version of Unimog called Duomog, which allows for traffic to be shifted between logical sections of compute automatically. This makes MCP data centers fault-tolerant without sacrificing performance for our customers, and allows Traffic Manager to work within a data center as well as between data centers.
When evaluating portions of requests to move, Traffic Manager does the following:
Traffic Manager identifies the proportion of requests that need to be removed from a data center or subsection of a data center so that all requests can be served.
Traffic Manager then calculates the aggregated space metrics for each target to see how many requests each failover data center can take.
Traffic Manager then identifies how much traffic in each plan we need to move, and moves either a proportion of the plan, or all of the plan through Plurimog/Duomog, until we've moved enough traffic. We move Free customers first, and if there are no more Free customers in a data center, we'll move Pro, and then Business customers if needed.
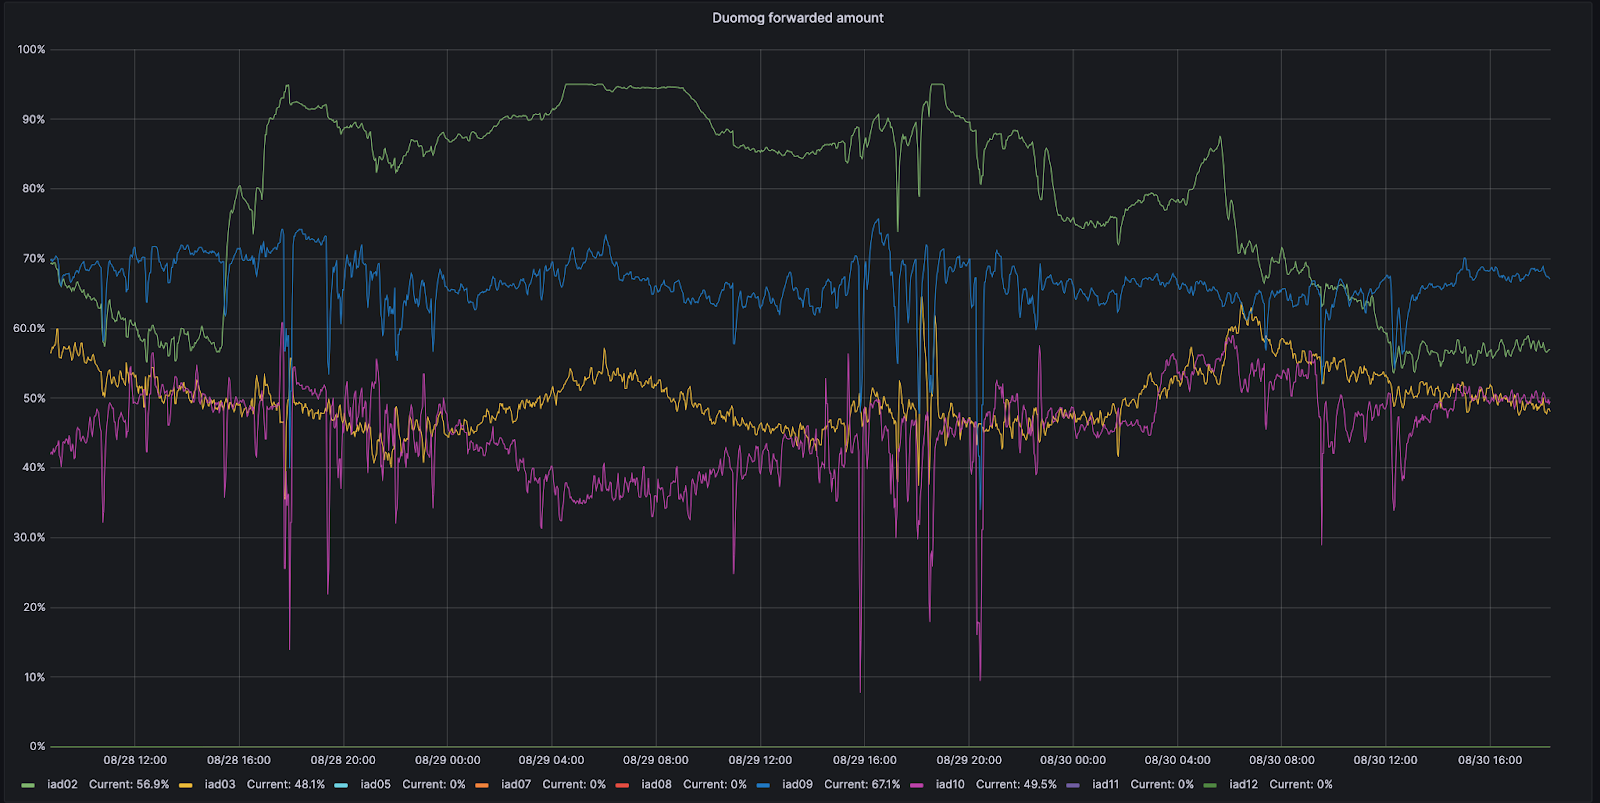
For example, let’s look at Ashburn, Virginia: one of our MCPs. Ashburn has nine different subsections of capacity that can each take traffic. On 8/28, one of those subsections, IAD02, had an issue that reduced the amount of traffic it could handle.
During this time period, Duomog sent more traffic from IAD02 to other subsections within Ashburn, ensuring that Ashburn was always online, and that performance was not impacted during this issue. Then, once IAD02 was able to take traffic again, Duomog shifted traffic back automatically. You can see these actions visualized in the time series graph below, which tracks the percentage of traffic moved over time between subsections of capacity within IAD02 (shown in green):
How does Traffic Manager know how much to move?
Although we used requests per second in the example above, using requests per second as a metric isn’t accurate enough when actually moving traffic. The reason for this is that different customers have different resource costs to our service; a website served mainly from cache with the WAF deactivated is much cheaper CPU wise than a site with all WAF rules enabled and caching disabled. So we record the time that each request takes in the CPU. We can then aggregate the CPU time across each plan to find the CPU time usage per plan. We record the CPU time in ms, and take a per second value, resulting in a unit of milliseconds per second.
CPU time is an important metric because of the impact it can have on latency and customer performance. As an example, consider the time it takes for an eyeball request to make it entirely through the Cloudflare front line servers: we call this the cfcheck latency. If this number goes too high, then our customers will start to notice, and they will have a bad experience. When cfcheck latency gets high, it’s usually because CPU utilization is high. The graph below shows 95th percentile cfcheck latency plotted against CPU utilization across all the machines in the same data center, and you can see the strong correlation:
So having Traffic Manager look at CPU time in a data center is a very good way to ensure that we’re giving customers the best experience and not causing problems.
After getting the CPU time per plan, we need to figure out how much of that CPU time to move to other data centers. To do this, we aggregate the CPU utilization across all servers to give a single CPU utilization across the data center. If a proportion of servers in the data center fail, due to network device failure, power failure, etc., then the requests that were hitting those servers are automatically routed elsewhere within the data center by Duomog. As the number of servers decrease, the overall CPU utilization of the data center increases. Traffic Manager has three thresholds for each data center; the maximum threshold, the target threshold, and the acceptable threshold:
Maximum: the CPU level at which performance starts to degrade, where Traffic Manager will take action
Target: the level to which Traffic Manager will try to reduce the CPU utilization to restore optimal service to users
Acceptable: the level below which a data center can receive requests forwarded from another data center, or revert active moves
When a data center goes above the maximum threshold, Traffic Manager takes the ratio of total CPU time across all plans to current CPU utilization, then applies that to the target CPU utilization to find the target CPU time. Doing it this way means we can compare a data center with 100 servers to a data center with 10 servers, without having to worry about the number of servers in each data center. This assumes that load increases linearly, which is close enough to true for the assumption to be valid for our purposes.
Target ratio equals current ratio:
Therefore:
Subtracting the target CPU time from the current CPU time gives us the CPU time to move:
For example, if the current CPU utilization was at 90% across the data center, the target was 85%, and the CPU time across all plans was 18,000, we would have:
This would mean Traffic Manager would need to move 1,000 CPU time:
Now we know the total CPU time needed to move, we can go through the plans, until the required time to move has been met.
What is the maximum threshold?
A frequent problem that we faced was determining at which point Traffic Manager should start taking action in a data center – what metric should it watch, and what is an acceptable level?
As said before, different services have different requirements in terms of CPU utilization, and there are many cases of data centers that have very different utilization patterns.
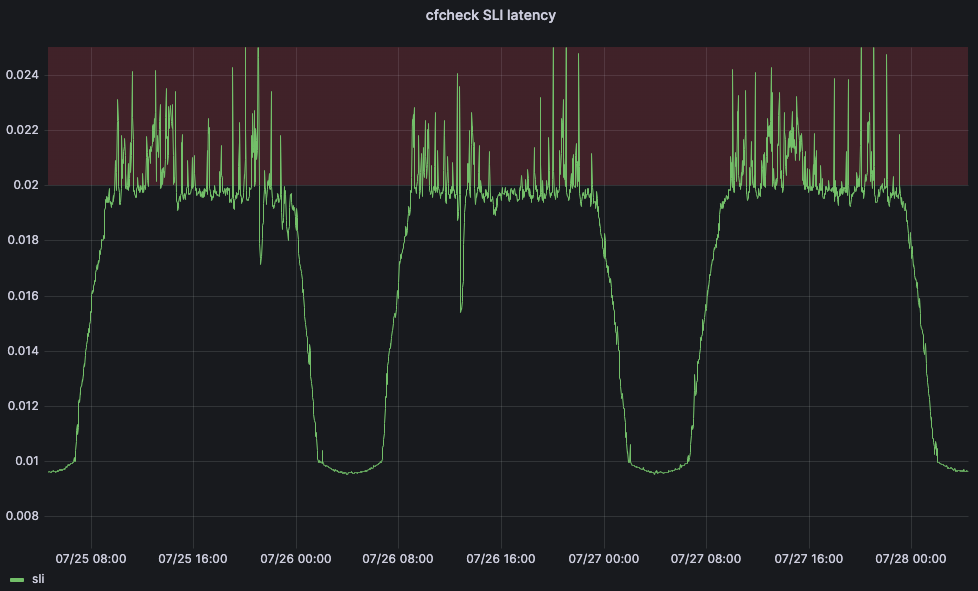
To solve this problem, we turned to machine learning. We created a service that will automatically adjust the maximum thresholds for each data center according to customer-facing indicators. For our main service-level indicator (SLI), we decided to use the cfcheck latency metric we described earlier.
But we also need to define a service-level objective (SLO) in order for our machine learning application to be able to adjust the threshold. We set the SLO for 20ms. Comparing our SLO to our SLI, our 95th percentile cfcheck latency should never go above 20ms and if it does, we need to do something. The below graph shows 95th percentile cfcheck latency over time, and customers start to get unhappy when cfcheck latency goes into the red zone:
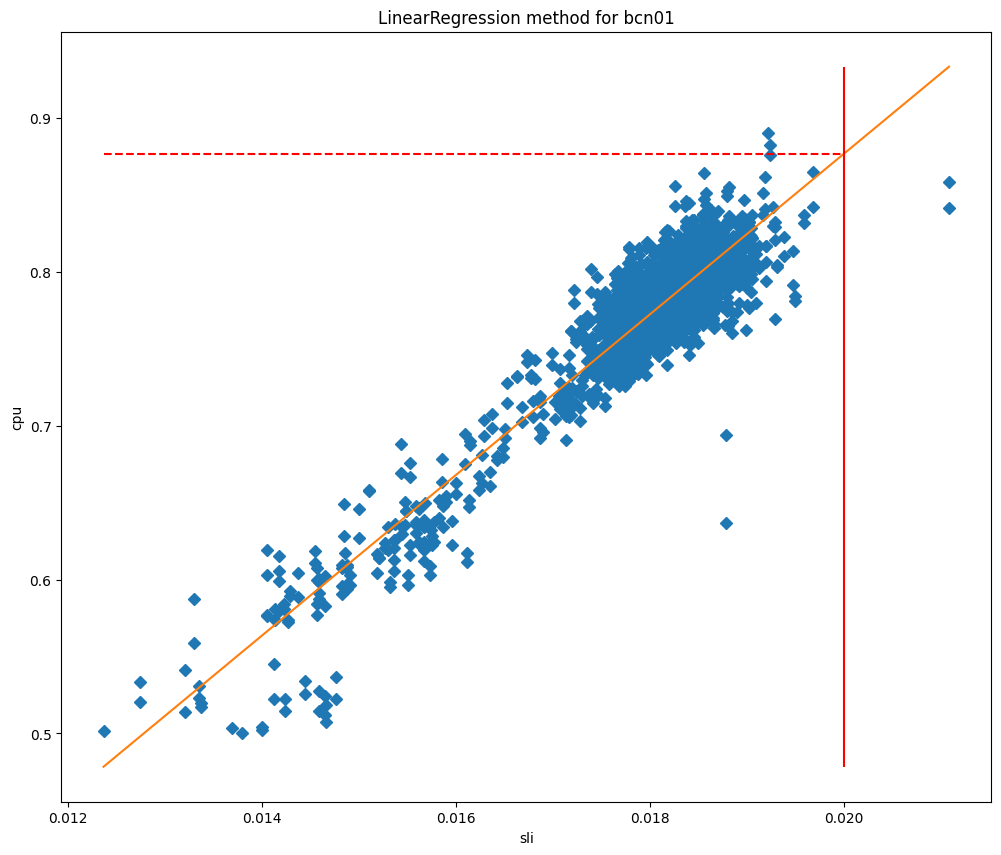
If customers have a bad experience when CPU gets too high, then the goal of Traffic Manager’s maximum thresholds are to ensure that customer performance isn’t impacted and to start redirecting traffic away before performance starts to degrade. At a scheduled interval the Traffic Manager service will fetch a number of metrics for each data center and apply a series of machine learning algorithms. After cleaning the data for outliers we apply a simple quadratic curve fit, and we are currently testing a linear regression algorithm.
After fitting the models we can use them to predict the CPU usage when the SLI is equal to our SLO, and then use it as our maximum threshold. If we plot the cpu values against the SLI we can see clearly why these methods work so well for our data centers, as you can see for Barcelona in the graphs below, which are plotted against curve fit and linear regression fit respectively.
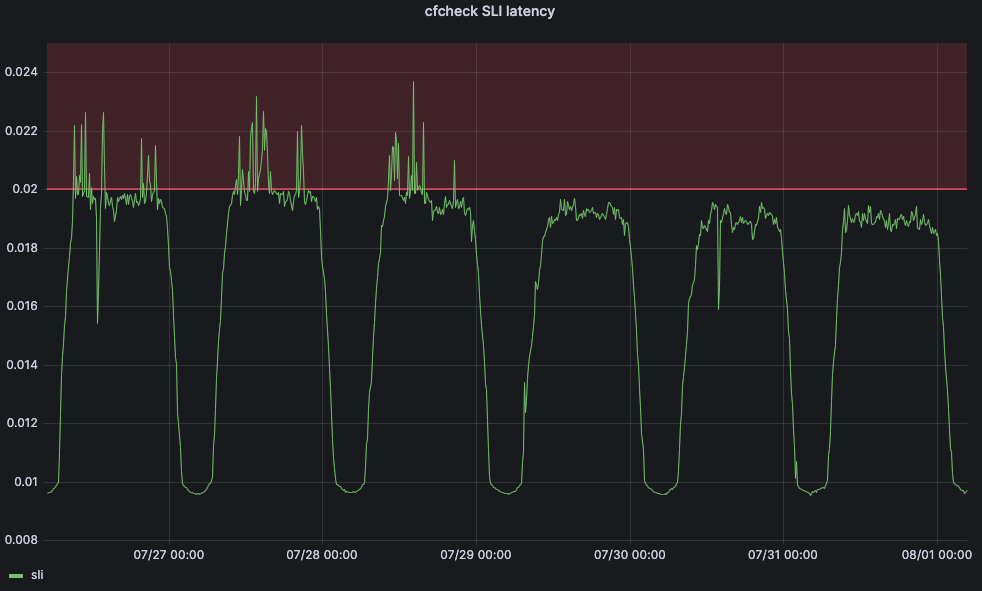
In these charts the vertical line is the SLO, and the intersection of this line with the fitted model represents the value that will be used as the maximum threshold. This model has proved to be very accurate, and we are able to significantly reduce the SLO breaches. Let’s take a look at when we started deploying this service in Lisbon:
Before the change, cfcheck latency was constantly spiking, but Traffic Manager wasn’t taking actions because the maximum threshold was static. But after July 29, we see that cfcheck latency has never hit the SLO because we are constantly measuring to make sure that customers are never impacted by CPU increases.
Where to send the traffic?
So now that we have a maximum threshold, we need to find the third CPU utilization threshold which isn’t used when calculating how much traffic to move – the acceptable threshold. When a data center is below this threshold, it has unused capacity which, as long as it isn’t forwarding traffic itself, is made available for other data centers to use when required. To work out how much each data center is able to receive, we use the same methodology as above, substituting target for acceptable:
Therefore:
Subtracting the current CPU time from the acceptable CPU time gives us the amount of CPU time that a data center could accept:
To find where to send traffic, Traffic Manager will find the available CPU time in all data centers, then it will order them by latency from the data center needing to move traffic. It moves through each of the data centers, using all available capacity based on the maximum thresholds before moving onto the next. When finding which plans to move, we move from the lowest priority plan to highest, but when finding where to send them, we move in the opposite direction.
To make this clearer let's use an example:
We need to move 1,000 CPU time from data center A, and we have the following usage per plan: Free: 500ms/s, Pro: 400ms/s, Business: 200ms/s, Enterprise: 1000ms/s.
We would move 100% of Free (500ms/s), 100% of Pro (400ms/s), 50% of Business (100ms/s), and 0% of Enterprise.
Nearby data centers have the following available CPU time: B: 300ms/s, C: 300ms/s, D: 1,000ms/s.
With latencies: A-B: 100ms, A-C: 110ms, A-D: 120ms.
Starting with the lowest latency and highest priority plan that requires action, we would be able to move all the Business CPU time to data center B and half of Pro. Next we would move onto data center C, and be able to move the rest of Pro, and 20% of Free. The rest of Free could then be forwarded to data center D. Resulting in the following action: Business: 50% → B, Pro: 50% → B, 50% → C, Free: 20% → C, 80% → D.
Reverting actions
In the same way that Traffic Manager is constantly looking to keep data centers from going above the threshold, it is also looking to bring any forwarded traffic back into a data center that is actively forwarding traffic.
Above we saw how Traffic Manager works out how much traffic a data center is able to receive from another data center — it calls this the available CPU time. When there is an active move we use this available CPU time to bring back traffic to the data center — we always prioritize reverting an active move over accepting traffic from another data center.
When you put this all together, you get a system that is constantly measuring system and customer health metrics for every data center and spreading traffic around to make sure that each request can be served given the current state of our network. When we put all of these moves between data centers on a map, it looks something like this, a map of all Traffic Manager moves for a period of one hour. This map doesn’t show our full data center deployment, but it does show the data centers that are sending or receiving moved traffic during this period:
Data centers in red or yellow are under load and shifting traffic to other data centers until they become green, which means that all metrics are showing as healthy. The size of the circles represent how many requests are shifted from or to those data centers. Where the traffic is going is denoted by where the lines are moving. This is difficult to see at a world scale, so let’s zoom into the United States to see this in action for the same time period:
Here you can see Toronto, Detroit, New York, and Kansas City are unable to serve some requests due to hardware issues, so they will send those requests to Dallas, Chicago, and Ashburn until equilibrium is restored for users and data centers. Once data centers like Detroit are able to service all the requests they are receiving without needing to send traffic away, Detroit will gradually stop forwarding requests to Chicago until any issues in the data center are completely resolved, at which point it will no longer be forwarding anything. Throughout all of this, end users are online and are not impacted by any physical issues that may be happening in Detroit or any of the other locations sending traffic.
Happy network, happy products
Because Traffic Manager is plugged into the user experience, it is a fundamental component of the Cloudflare network: it keeps our products online and ensures that they’re as fast and reliable as they can be. It’s our real time load balancer, helping to keep our products fast by only shifting necessary traffic away from data centers that are having issues. Because less traffic gets moved, our products and services stay fast.
But Traffic Manager can also help keep our products online and reliable because they allow our products to predict where reliability issues may occur and preemptively move the products elsewhere. For example, Browser Isolation directly works with Traffic Manager to help ensure the uptime of the product. When you connect to a Cloudflare data center to create a hosted browser instance, Browser Isolation first asks Traffic Manager if the data center has enough capacity to run the instance locally, and if so, the instance is created right then and there. If there isn’t sufficient capacity available, Traffic Manager tells Browser Isolation which the closest data center with sufficient available capacity is, thereby helping Browser Isolation to provide the best possible experience for the user.
Happy network, happy users
At Cloudflare, we operate this huge network to service all of our different products and customer scenarios. We’ve built this network for resiliency: in addition to our MCP locations designed to reduce impact from a single failure, we are constantly shifting traffic around on our network in response to internal and external issues.
But that is our problem — not yours.
Similarly, when human beings had to fix those issues, it was customers and end users who would be impacted. To ensure that you’re always online, we’ve built a smart system that detects our hardware failures and preemptively balances traffic across our network to ensure it’s online and as fast as possible. This system works faster than any person — not only allowing our network engineers to sleep at night — but also providing a better, faster experience for all of our customers.
And finally: if these kinds of engineering challenges sound exciting to you, then please consider checking out the Traffic Engineering team's open position on Cloudflare’s Careers page!
We are thrilled to introduce Cloudflare Fonts! In the coming weeks sites that use Google Fonts will be able to effortlessly load their fonts from the site’s own domain rather than from Google. All at a click of a button. This enhances both privacy and performance. It enhances users' privacy by eliminating the need to load fonts from Google’s third-party servers. It boosts a site's performance by bringing fonts closer to end users, reducing the time spent on DNS lookups and TLS connections.
Sites that currently use Google Fonts will not need to self-host fonts or make complex code changes to benefit – Cloudflare Fonts streamlines the entire process, making it a breeze.
Fonts and privacy
When you load fonts from Google, your website initiates a data exchange with Google's servers. This means that your visitors' browsers send requests directly to Google. Consequently, Google has the potential to accumulate a range of data, including IP addresses, user agents (formatted descriptions of the browser and operating system), the referer (the page on which the Google font is to be displayed) and how often each IP makes requests to Google. While Google states that they do not use this data for targeted advertising or set cookies, any time you can prevent sharing your end user’s personal data unnecessarily is a win for privacy.
With Cloudflare Fonts, when you serve fonts directly from your own domain. This means no font requests are sent to third-party domains like Google, which some privacy regulators have found to be a problem in the past. Our pro-privacy approach means your end user’s IP address and other data are not sent to another domain. All that information stays within your control, within your domain. In addition, because Cloudflare Fonts eliminates data transmission to third-party servers like Google's, this can enhance your ability to comply with any potential data localization requirements.
Faster Google Font delivery through Cloudflare
Now that we have established that Cloudflare Fonts can improve your privacy, let's flip to the other side of the coin – how Cloudflare Fonts will improve your performance.
To do this, we first need to delve into how Google Fonts affects your website's performance. Subsequently, we'll explore how Cloudflare Fonts addresses and rectifies these performance challenges.
Google Fonts is a fantastic resource that offers website owners a range of royalty-free fonts for website usage. When you decide on the fonts you would like to incorporate, it’s super easy to integrate. You just add a snippet of HTML to your site. You then add styles to apply these fonts to various parts of your page:
But this ease of use comes with a performance penalty.
Upon loading your webpage, your visitors' browser fetches the CSS file as soon as the HTML starts to be parsed. Then, when the browser starts rendering the page and identifies the need for fonts in different text sections, it requests the required font files.
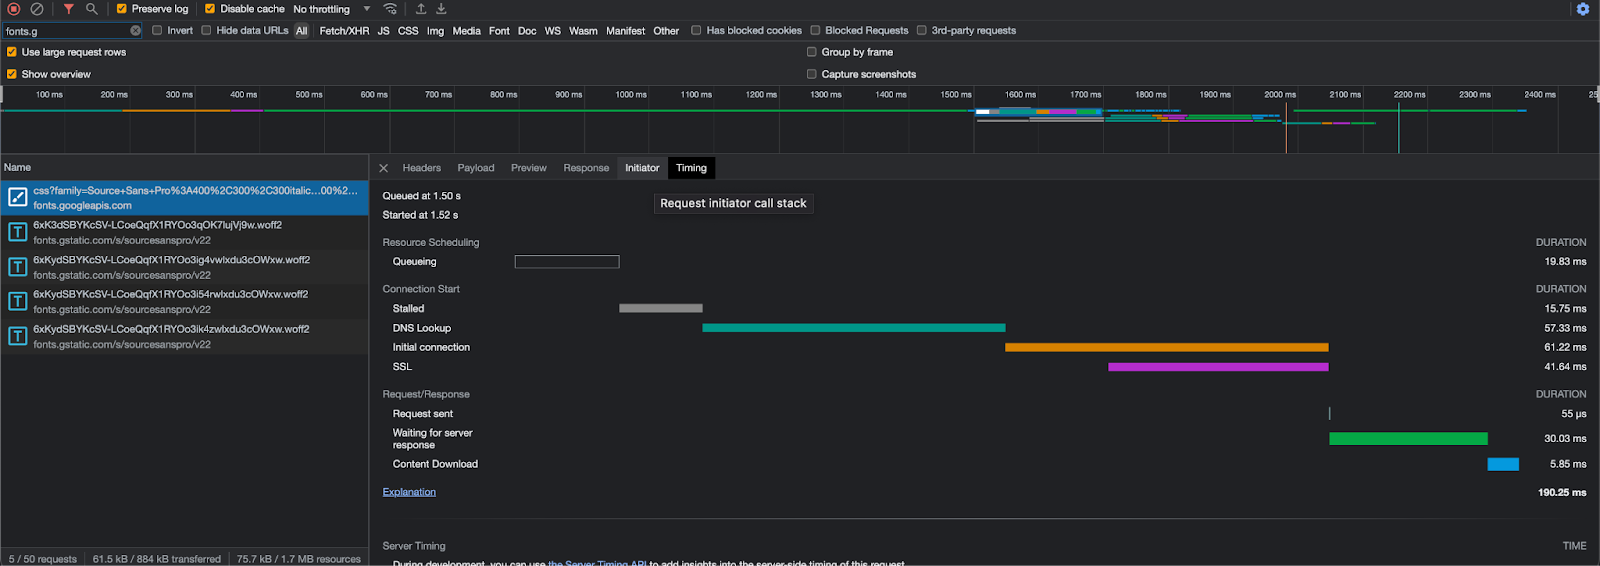
This is where the performance problem arises. Google Fonts employs a two-domain system: the CSS resides on one domain – fonts.googleapis.com – while the font files reside on another domain – fonts.gstatic.com.
This separation results in a minimum of four round trips to the third-party servers for each resource request. These round trips are DNS lookup, socket connection establishment, TLS negotiation (for HTTPS), and the final round trip for the actual resource request. Ultimately, getting a font from Google servers to a browser requires eight round trips.
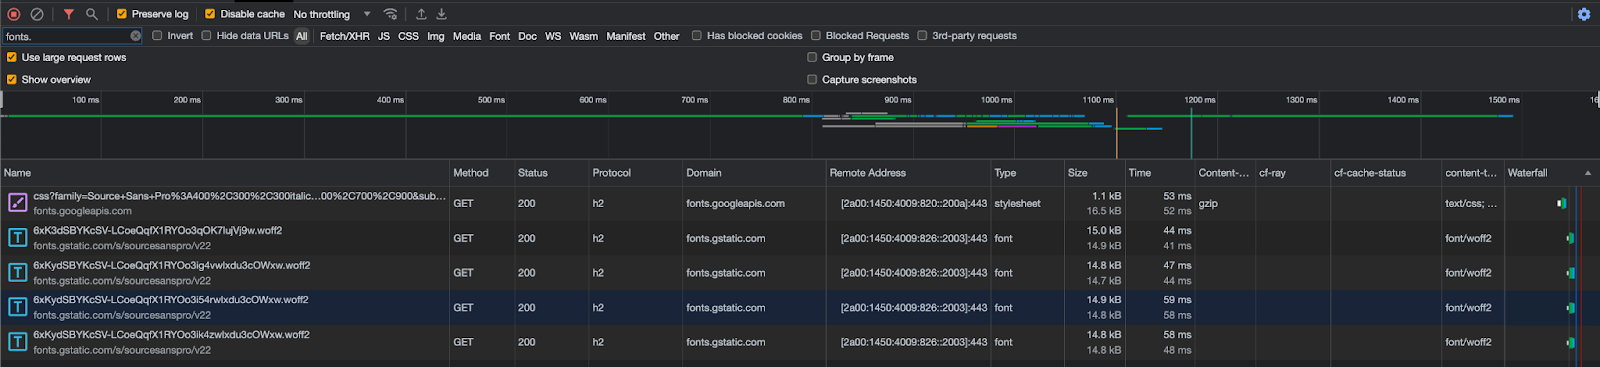
Users can see this. If they are using Google Fonts they can open their network tab and filter for these Google domains.
You can visually see the impact of the extra DNS request and TLS connection that these requests add to your website experience. For example on my WordPress site that natively uses Google Fonts as part of the theme adds an extra ~150ms.
Fast fonts
Cloudflare Fonts streamlines this process, by reducing the number of round trips from eight to one. Two sets of DNS lookups, socket connections and TLS negotiations to third-parties are no longer required because there is no longer a third-party server involved in serving the CSS or the fonts. The only round trip involves serving the font files directly from the same domain where the HTML is hosted. This approach offers an additional advantage: it allows fonts to be transmitted over the same HTTP/2 or HTTP/3 connection as other page resources, benefiting from proper prioritization and preventing bandwidth contention.
The eagle-eyed amongst you might be thinking “Surely it is still two round trips – what about the CSS request?”. Well, with Cloudflare Fonts, we have also removed the need for a separate CSS request. This means there really is only one round-trip – fetching the font itself.
To achieve both the home-routing of font requests and the removal of the CSS request, we rewrite the HTML as it passes through Cloudflare’s global network. The CSS response is embedded, and font URL transformations are performed within the embedded CSS.
These transformations adjust the font URLs to align with the same domain as the HTML content. These modified responses seamlessly pass through Cloudflare's caching infrastructure, where they are automatically cached for a substantial performance boost. In the event of any cache misses, we use Fontsource and NPM to load these fonts and cache them within the Cloudflare infrastructure. This approach ensures that there's no inadvertent data exposure to Google's infrastructure, maintaining both performance and data privacy.
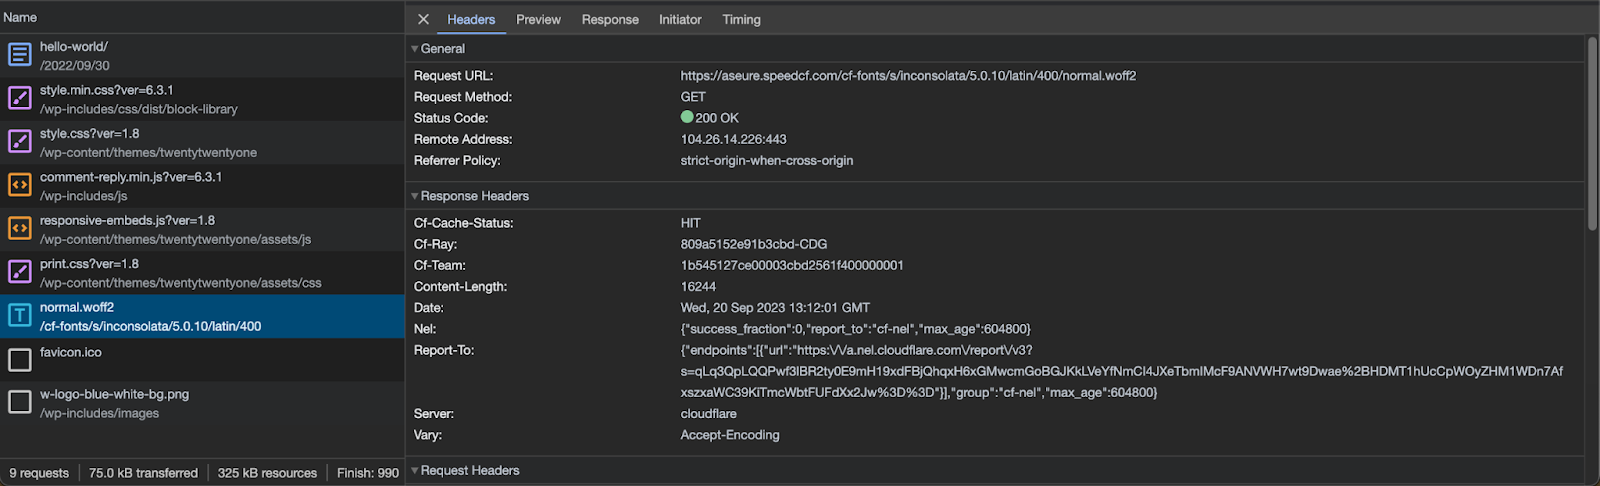
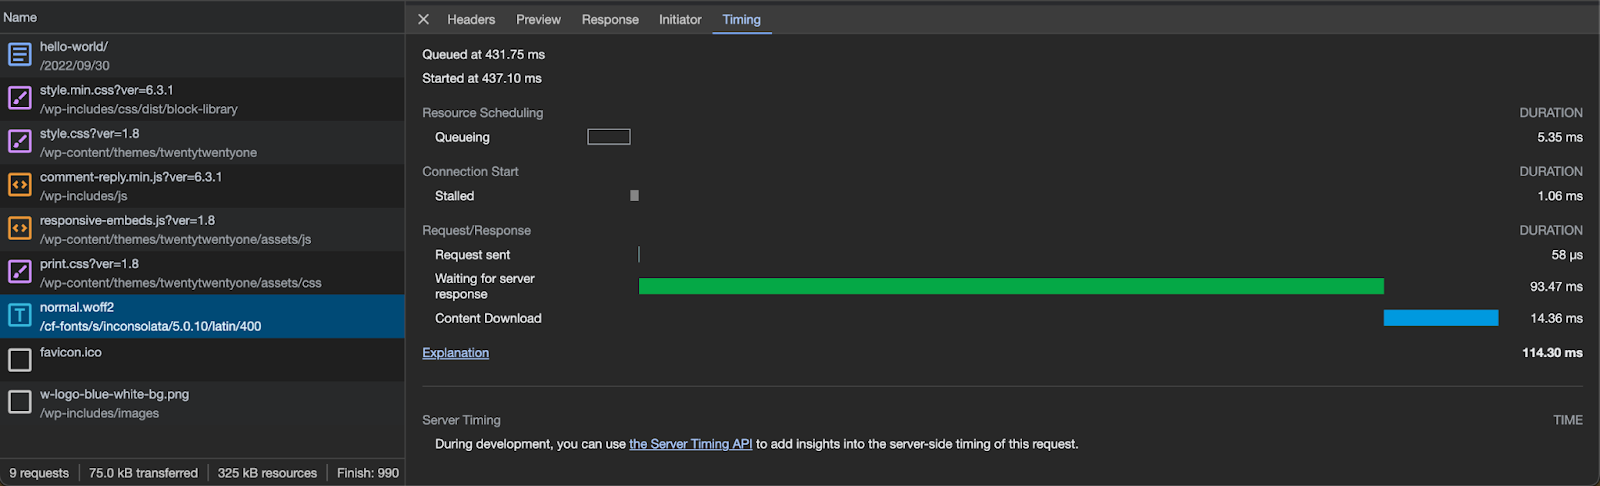
With Cloudflare Fonts enabled, you are able to see within your Network Tab that font files are now loaded from your own hostname from the /cf-fonts path and served from Cloudflare’s closest cache to the user, as indicated by the cf-cache-status: HIT.
Additionally, you can notice that the timings section in the browser no longer needs an extra DNS lookup for the hostname or the setup of a TLS connection. This happens because the content is served from your hostname, and the browser has already cached the DNS response and has an open TLS connection.
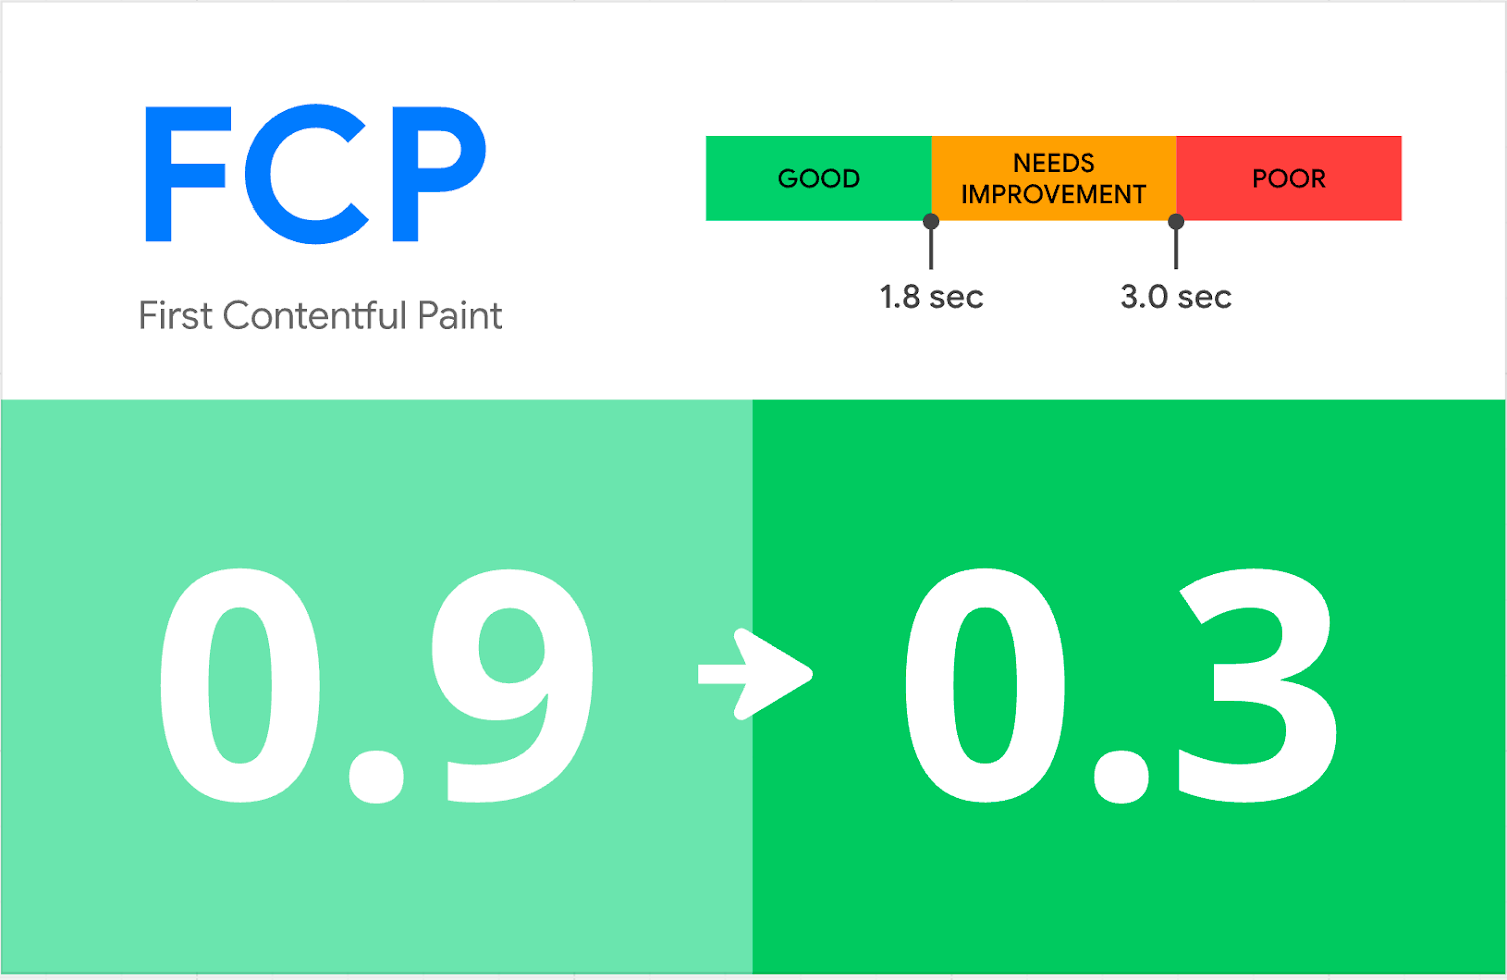
Finally, you can see the real-world performance benefits of Cloudflare Fonts. We conducted synthetic Google Lighthouse tests before enabling Cloudflare Fonts on a straightforward page that displays text. First Contentful Paint (FCP), which represents the time it takes for the first content element to appear on the page, was measured at 0.9 seconds in the Google fonts tests. After enabling Cloudflare Fonts, the First Contentful Paint (FCP) was reduced to 0.3 seconds, and our overall Lighthouse performance score improved from 98 to a perfect 100 out of 100.
Making Cloudflare Fonts fast with ROFL
In order to make Cloudflare Fonts this performant, we needed to make blazing-fast HTML alterations as responses stream through Cloudflare’s network. This has been made possible by leveraging one of Cloudflare’s more recent technologies.
Earlier this year, we finished rewriting one of Cloudflare's oldest components, which played a crucial role in dynamically altering HTML content. But as described in this blog post, a new solution was required to replace the old – A memory-safe solution, able to scale to Cloudflare’s ever-increasing load.
This new module is known as ROFL (Response Overseer for FL). It now powers various Cloudflare products that need to alter HTML as it streams, such as Email Obfuscation, Rocket Loader, and HTML Minification.
ROFL was developed entirely in Rust. This decision was driven by Rust's memory safety, performance, and security. The memory-safety features of Rust are indispensable to ensure airtight protection against memory leaks while we process a staggering volume of requests, measuring in the millions per second. Rust's compiled nature allows us to finely optimize our code for specific hardware configurations, delivering impressive performance gains compared to interpreted languages.
ROFL paved the way for the development of Cloudflare Fonts. The performance of ROFL allows us to rewrite HTML on-the-fly and modify the Google Fonts links quickly, safely and efficiently. This speed helps us reduce any additional latency added by processing the HTML file and improve the performance of your website.
Unlock the power of Cloudflare Fonts today! 🚀
Cloudflare Fonts will be available to all Cloudflare customers in October. If you're using Google Fonts, you will be able to supercharge your site's privacy and speed. By enabling this feature, you can seamlessly enhance your website's performance while safeguarding your user’s privacy.
Today, we are excited to announce Cloudflare Trace! Cloudflare Trace is available to all our customers. Cloudflare Trace enables you to understand how HTTP requests traverse your zone's configuration and what Cloudflare Rules are being applied to the request.
For many Cloudflare customers, the journey their customers' traffic embarks on through the Cloudflare ecosystem was a mysterious black box. It's a complex voyage, routed through various products, each capable of introducing modification to the request.
Consider this scenario: your web traffic could get blocked by WAF Custom Rules or Managed Rules (WAF); it might face rate limiting, or undergo modifications via Transform Rules, Where a Cloudflare account has many admins, modifying different things it can be akin to a game of "hit and hope," where the outcome of your web traffic's journey is uncertain as you are unsure how another admins rule will impact the request before or after yours. While Cloudflare's individual products are designed to be intuitive, their interoperation, or how they work together, hasn't always been as transparent as our customers need it to be. Cloudflare Trace changes this.
Running a trace
Cloudflare Trace allows users to set a number of request variables, allowing you to tailor your trace precisely to your needs. A basic trace will require users to define two settings. A URL that is being proxied through Cloudflare and an HTTP method such as GET. However, customers can also set request headers, add a request body and even set a bot score to allow users to validate the correct behavior of their security rules.
Once a trace is initiated, the dashboard returns a visualization of the products that were matched on a request, such as Configuration Rules, Transform Rules, and Firewall Rules, along with the specific rules inside these phases that were applied. Customers can then view further details of the filters and actions the specific rule undertakes. Clicking the rule id will take you directly to that specific rule in the Cloudflare Dashboard, allowing you to edit filters and actions if needed.
The user interface also generates a programmatic version of the trace that can be used by customers to run traces via a command line. This enables customers to use tools like jq to further investigate the extensive details returned via the trace output.
The life of a Cloudflare request
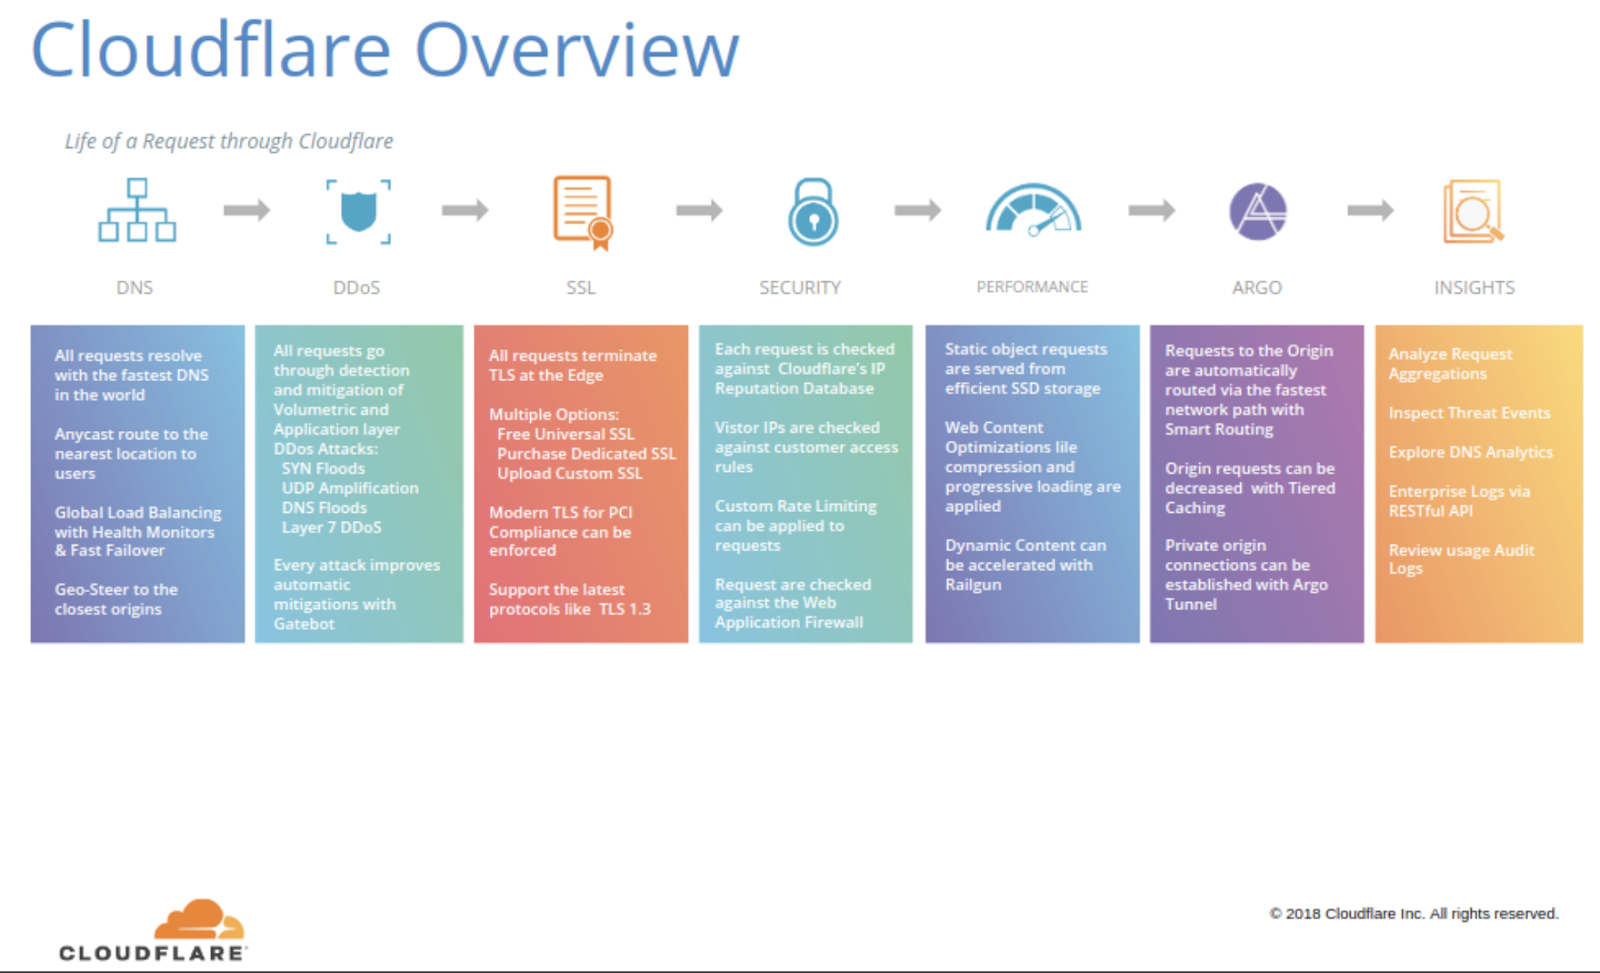
Understanding the intricate journey that your traffic embarks on within Cloudflare can be a challenging task for many of our customers and even for Cloudflare employees. This complexity often leads to questions within our Cloudflare Community or direct inquiries to our support team. Internally, over the past 13 years at Cloudflare, numerous individuals have attempted to explain this journey through diagrams. We maintain an internal Wiki page titled 'Life of a Request Museum.' This page archives all the attempts made over the years by some of the first Cloudflare engineers, heads of product, and our marketing team, where the following image was used in our 2018 marketing slides.
The "problem" (a rather positive one) is that Cloudflare is innovating so rapidly. New products are being added, code is removed, and existing products are continually enhanced. As a result, a diagram created just a few weeks ago can quickly become outdated and challenging to keep up to date.
Finding a happy medium
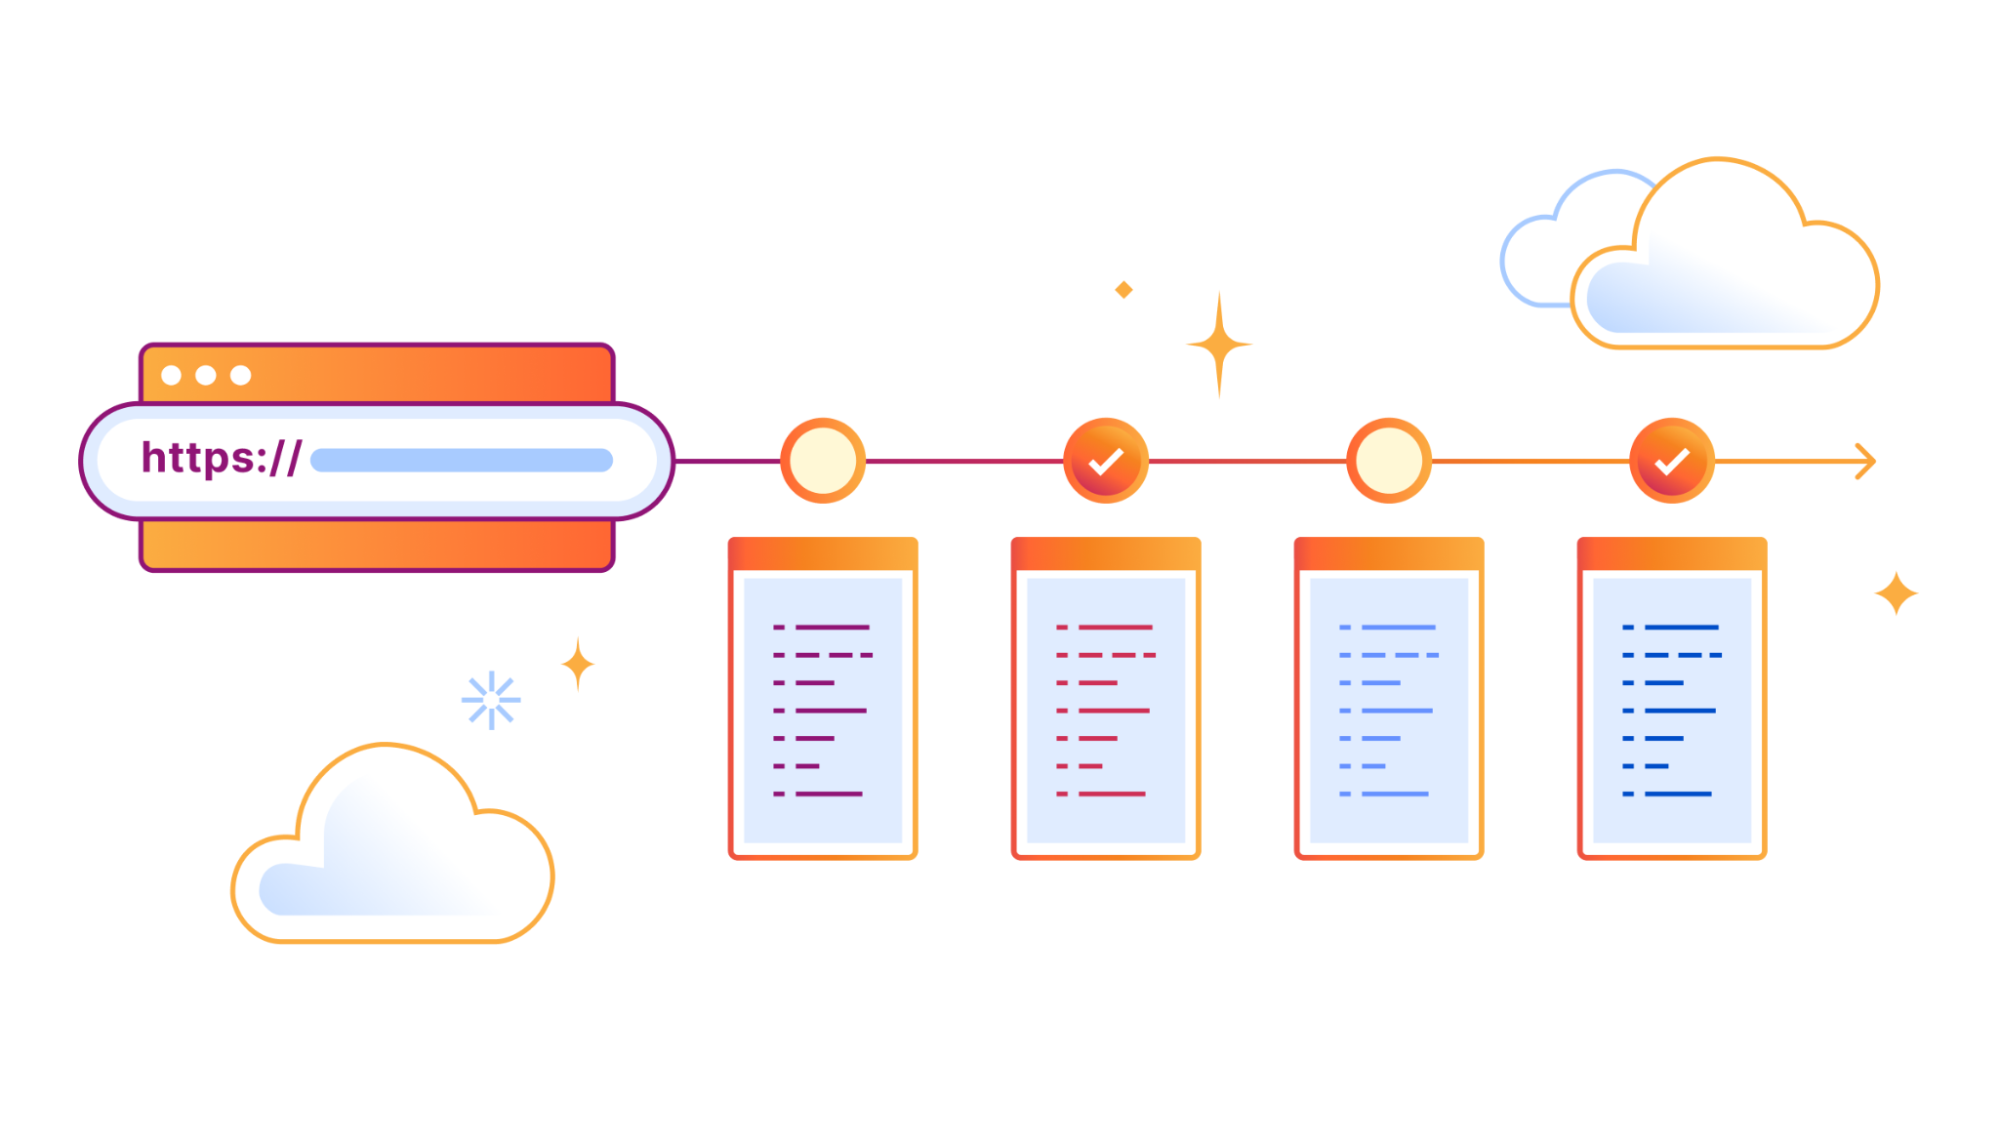
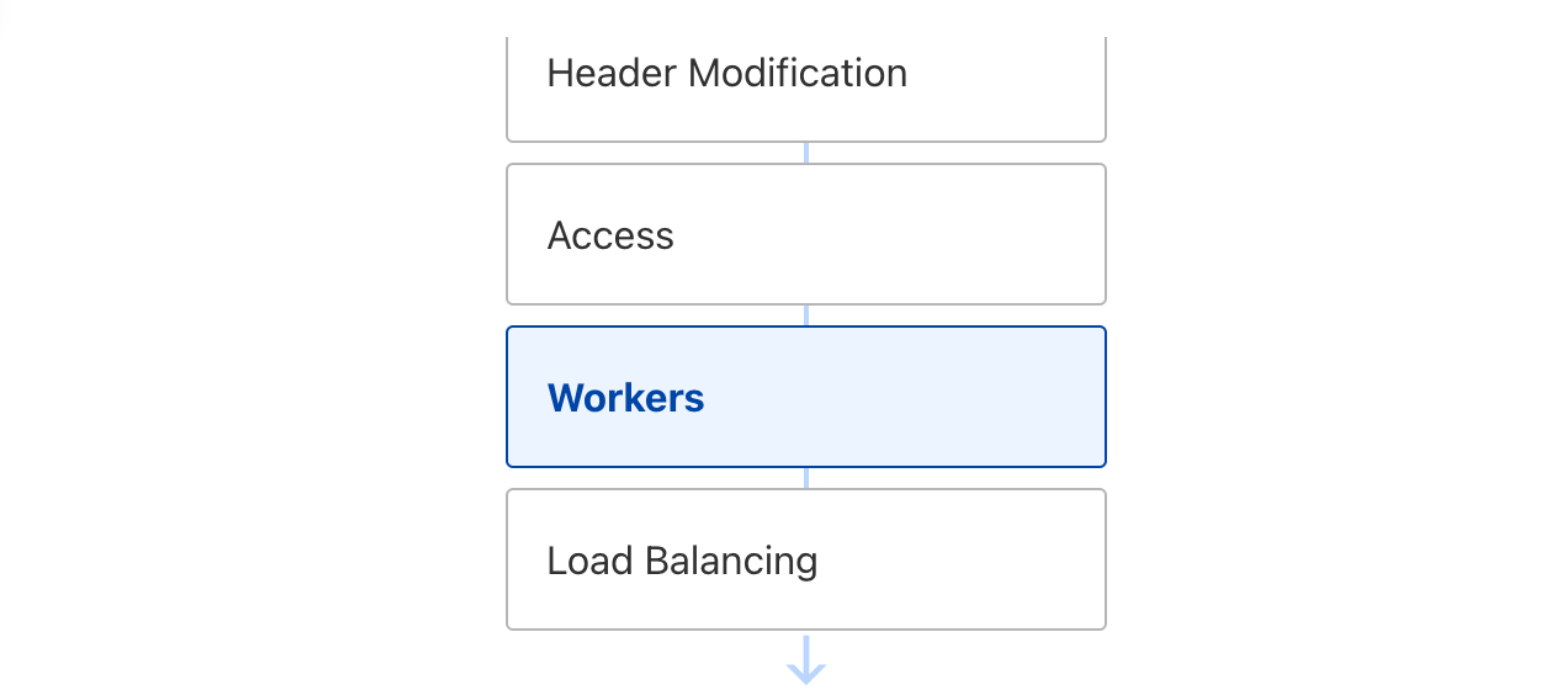
However, customers still want to understand, “The life of a request.” Striking the ideal balance between providing just enough detail without overwhelming our users posed a problem akin to the Goldilocks principle. One of our first attempts to detail the ordering of Cloudflare products was Traffic Sequence, a straightforward dashboard illustration that provides a basic, high-level overview of the interactions between Cloudflare products. While it does not detail every intricacy, it helps our customers understand the order and flow of products that interacted with an HTTP request and was a welcome addition to the Cloudflare dashboard.
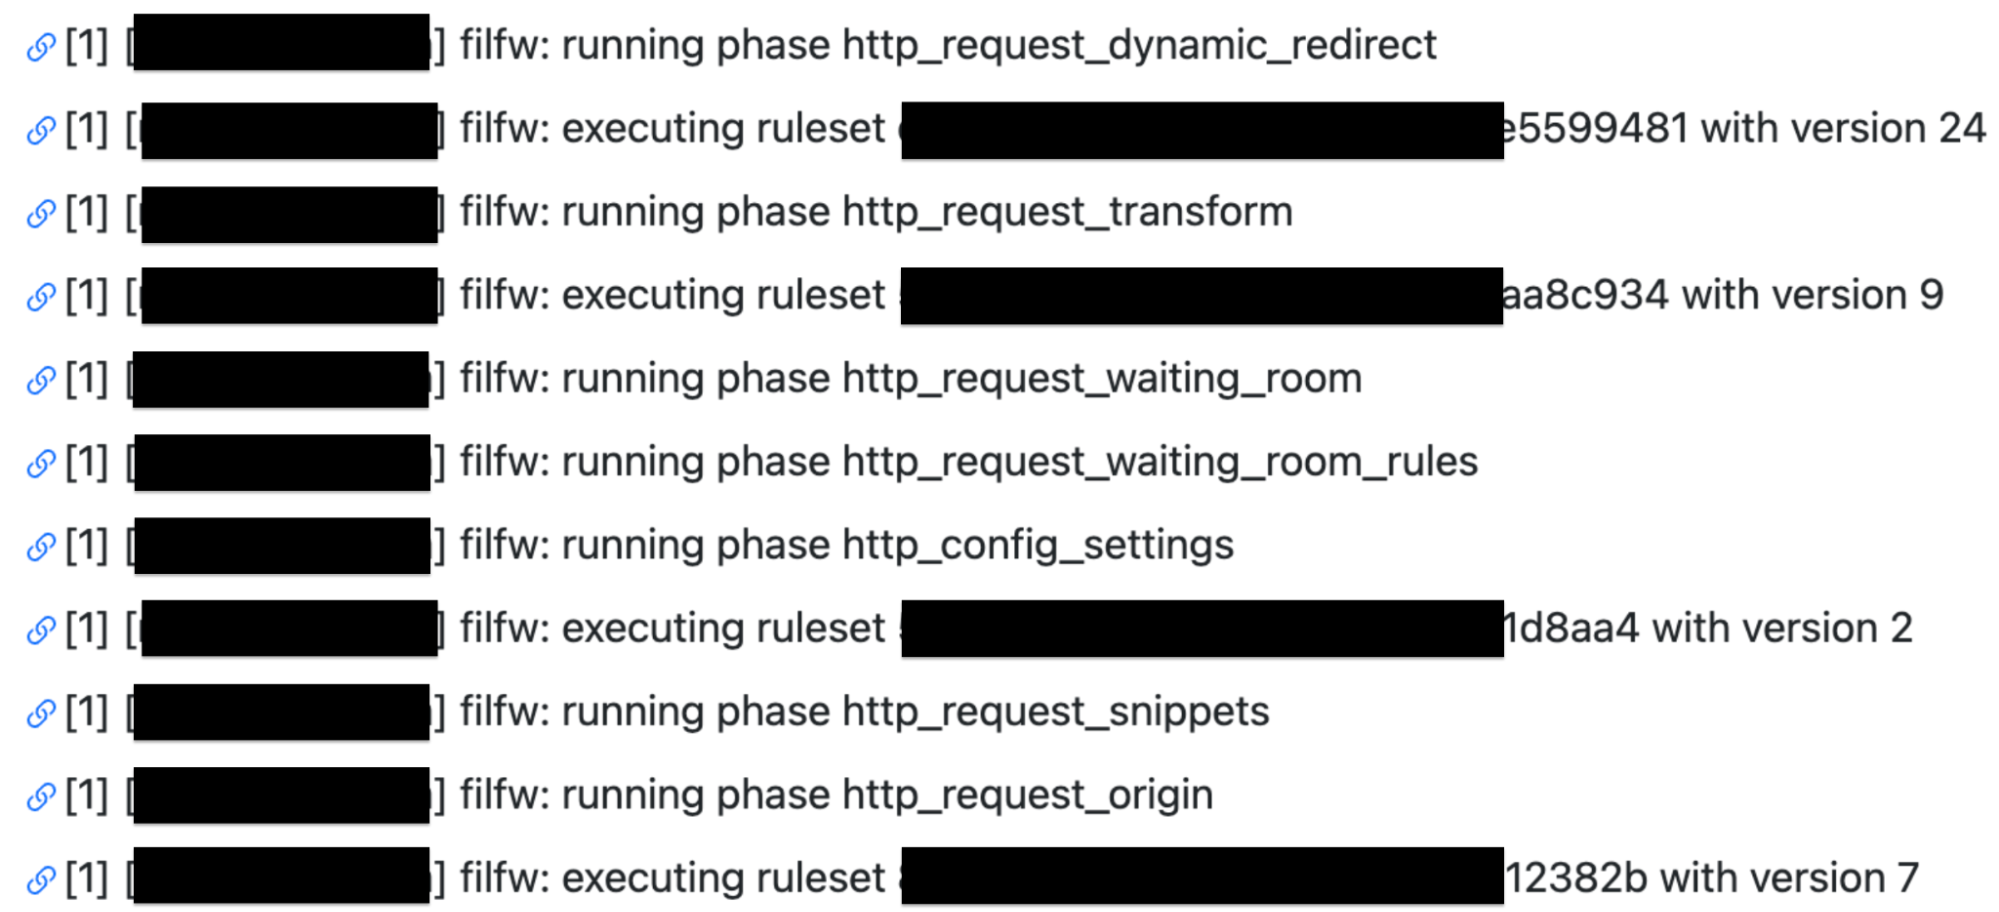
However, customers still requested further insights and details. Especially around debugging issues. Internally Cloudflare teams utilize a number of self created products to trace a request. One of these products is Flute. This product gives a verbose output of all rules, Cloudflare features and codepaths a request undertakes. This allows our engineers and support teams to investigate an issue and identify if something is awry. For example in the following Flute trace image you can see how a request for my domain is evaluated against Single Redirects, Waiting Room, Configuration Settings, Snippets and Origin Rules.
The Flute tool became one of the key focal points in the development of Cloudflare Trace. However, it can be quite intricate and packed with extensive details, potentially leading to more questions than solutions if copied verbatim and exposed to our customers.
To understand the happy medium in developing Cloudflare Trace. We closely collaborated with our Support team to gain a deeper understanding of the challenges our customers faced specifically around Cloudflare Rulesets. The primary challenge centered around understanding which rules were applicable to specific requests. Customers often raised queries, and in certain instances, these inquiries had to be escalated for further investigation into the reasons behind a request's specific behavior. By empowering our customers to independently investigate and comprehend these issues, we identified a second area where Cloudflare Trace proves invaluable—by reducing the workload of our support team and enabling them to operate more efficiently while focusing on other support tickets.
For customers encountering genuine problems, they have the capability to export the JSON response of a trace, which can then be directly uploaded to a support ticket. This streamlined process significantly reduces the time required to investigate and resolve support tickets.
Trace examples
Cloudflare Trace has been available via API for the last nine months. We have been working with a number of customers and stakeholders to understand where tracing is beneficial and solving customer problems. Here are some of the real world examples that we have solved using Cloudflare Trace.
Transform Rules inconsistently matching
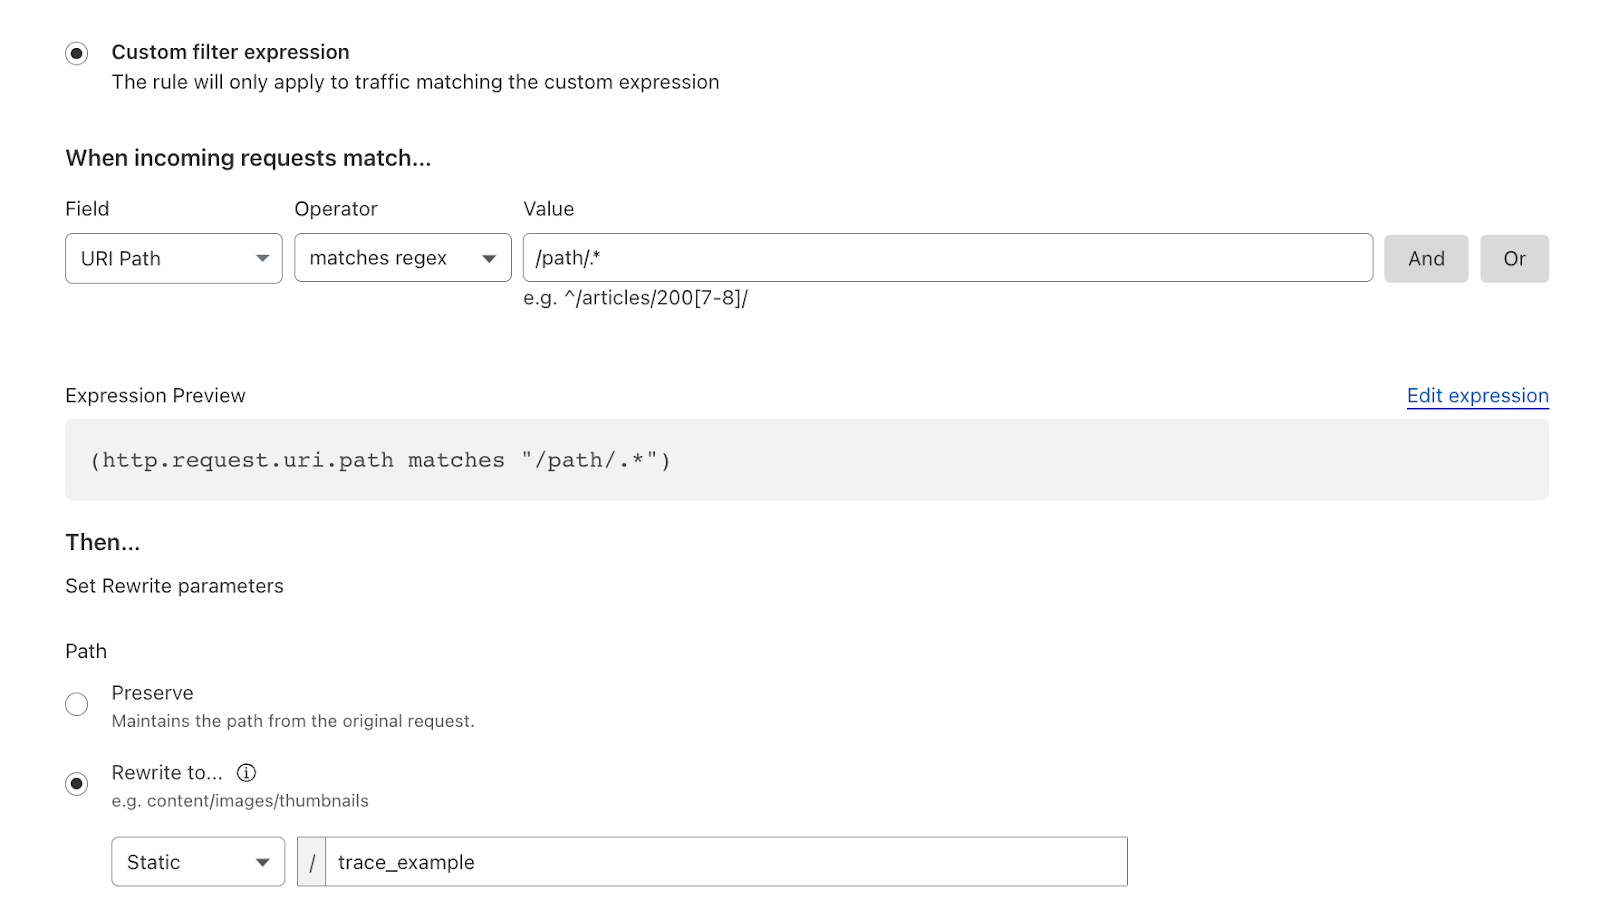
A customer encountered an issue while attempting to rewrite a URL to their origin for specific paths using Transform rules. The Cloudflare account created a filter that employed regex to match against a specific path.
A systems administrator monitoring their web server observed in their logs that the URLs for a small percentage of requests were not transforming correctly, causing disruptions to the application. They decided to investigate by comparing a correctly functioning request with one that was not, and subsequently conducted traces.
In the problematic trace, only one rule matched the trace parameters and was setting incorrect parameters.
Whereas on the other URL the rule that contained the regex matched as intended and set the correct URL parameters.
This allowed the sysadmin to pinpoint the problem: the regex was specifically designed to handle requests with subdirectories, but it failed to address cases where requests directly targeted the root or a non-subdirectory path. After identifying this issue within the traces, the sysadmin updated the filter. Subsequently, both cases matched successfully, leading to the resolution of the problem.
What origin?
When a request encounters a Cloudflare ruleset, such as Origin Rules, all the rules are evaluated, and any rule that is matched is applied in sequential order of priority. This means that multiple settings could be applied from different rules. For example, a Host Header could be set in rule 1, and a DNS origin could be assigned in rule 3. This means that the request will exit the Origin Rules phase with a new Host Header and be routed to a different origin. Cloudflare Trace allows users to easily see all the rules that matched and altered the request.
Tracing the future
Cloudflare Trace will be available to all our customers over this coming week. And located within the Account section of your Cloudflare Dashboard for all plans. We are excited to introduce additional features and products to Cloudflare Trace in the coming months. In the future will also be developing scheduling and alerts, which will enable you to monitor if a newly deployed rule is impacting the critical path of your application. As with all our products, we value your feedback. Within the Trace dashboard, you'll find a form for providing feedback and feature requests to help us enhance the product before its general release.
Unusually, we have a large chunk of changes in filesystems. Part of
it is the vfs-level revert of some of the timestamp handling that
needs to soak a bit more, and part of it is some xfs fixes. With a
few other filesystem fixes too.
The multi-grain timestamp changes turned
out to cause the occasional regression (timestamps that could appear to go
backward) and were taken back out.
Having been at Cloudflare since it was tiny it’s hard to believe that we’re hitting our teens! But here we are 13 years on from launch. Looking back to 2010 it was the year of iPhone 4, the first iPad, the first Kinect, Inception was in cinemas, and TiK ToK was hot (well, the Kesha song was). Given how long ago all that feels, I'd have a hard time predicting the next 13 years, so I’ll stick to predicting the future by creating it (with a ton of help from the Cloudflare team).
Building the future is, in part, what Birthday Week is about. Over the past 13 years we’ve announced things like Universal SSL (doubling the size of the encrypted web overnight and helping to usher in the largely encrypted web we all use; Cloudflare Radar shows that worldwide 99% of HTTP requests are encrypted), or Cloudflare Workers (helping change the way people build and scale applications), or unmetered DDoS protection (to help with the scourge of DDoS).
This year will be no different.
Winding back to the year I joined Cloudflare we made our first Birthday Week announcement: our automatic IPv6 gateway. Fast-forward to today and Cloudflare Radar says that 37% of connections to Cloudflare use IPv6, so this year there’s a special offer to help make IPv6 ever more widespread and counter those who’d try to bind us to IPv4. So let’s build an IPv6 future together.
Last year we announced Turnstile, our privacy-preserving replacement for CAPTCHAs. This year we’ll be closing a big privacy hole in the encrypted Internet and showing how cryptography can be used to make measurements anonymous and private. Plus even more encrypted, anonymous connections from your computer to the Internet. And there’s more on what’s next for Turnstile itself, and helping make fonts faster and more private too. So let’s build a privacy-preserving Internet together.
AI, of course, is a huge topic and one quarter of all this week's blog posts are about AI, machine learning, GPUs, and all things building, managing, and measuring applications that use AI and machine learning. If it’s not obvious already, it will be after this week: the future involves AI everywhere, on device, in the cloud, and deep inside the Cloudflare global network.
Cloudflare WARP wasn’t a Birthday Week announcement (it was one of our April 1 releases like 1.1.1.1) but this year we’ll be switching from Star Trek to Star Wars with a new product called Hyperdrive. You’ll have to wait until Thursday to read all about it. But if you love databases, you’ll want to make the jump to lightspeed with us.
Speaking of speed… speed! It’s not all AI, privacy, and cool products. We also need to continue our mission to explore strange new worlds help make everyone’s use of the Internet faster. So, we’ll update you on our network performance, talk about how we keep our network running smoothly in face of ever-changing Internet weather, help you stream with low latency, and use caching in new smart ways.
Lastly, we’ll be talking about the impact of Cloudflare on the climate and our climate commitments. Helping with climate change is yet another thing we need to do together.
And, of course, there’s much more than just that. But I wouldn’t want to spoil the birthday surprise by unwrapping the blogs early.
To provide the best experiences, we use technologies like cookies to store and/or access device information. Consenting to these technologies will allow us to process data such as browsing behavior or unique IDs on this site. Not consenting or withdrawing consent, may adversely affect certain features and functions.
Functional
Always active
The technical storage or access is strictly necessary for the legitimate purpose of enabling the use of a specific service explicitly requested by the subscriber or user, or for the sole purpose of carrying out the transmission of a communication over an electronic communications network.
Preferences
The technical storage or access is necessary for the legitimate purpose of storing preferences that are not requested by the subscriber or user.
Statistics
The technical storage or access that is used exclusively for statistical purposes.The technical storage or access that is used exclusively for anonymous statistical purposes. Without a subpoena, voluntary compliance on the part of your Internet Service Provider, or additional records from a third party, information stored or retrieved for this purpose alone cannot usually be used to identify you.
Marketing
The technical storage or access is required to create user profiles to send advertising, or to track the user on a website or across several websites for similar marketing purposes.