Tag Archives: Amazon CloudWatch

Why Deployment Requirements are Important When Making Architectural Choices

Post Syndicated from Yusuf Mayet original https://aws.amazon.com/blogs/architecture/why-deployment-requirements-are-important-when-making-architectural-choices/

Introduction

Too often, architects fall into the trap of thinking the architecture of an application is restricted to just the runtime part of the architecture. By doing this we focus on only a single customer (such as the application’s users and how they interact with the system) and we forget about other important customers like developers and DevOps teams. This means that requirements regarding deployment ease, deployment frequency, and observability are delegated to the back burner during design time and tacked on after the runtime architecture is built. This leads to increased costs and reduced ability to innovate.

In this post, I discuss the importance of key non-functional requirements, and how they can and should influence the target architecture at design time.

Architectural patterns

When building and designing new applications, we usually start by looking at the functional requirements, which will define the functionality and objective of the application. These are all the things that the users of the application expect, such as shopping online, searching for products, and ordering. We also consider aspects such as usability to ensure a great user experience (UX).

We then consider the non-functional requirements, the so-called “ilities,” which typically include requirements regarding scalability, availability, latency, etc. These are constraints around the functional requirements, like response times for placing orders or searching for products, which will define the expected latency of the system.

These requirements—both functional and non-functional together—dictate the architectural pattern we choose to build the application. These patterns include Multi-tierevent-driven architecturemicroservices, and others, and each one has benefits and limitations. For example, a microservices architecture allows for a system where services can be deployed and scaled independently, but this also introduces complexity around service discovery.

Aligning the architecture to technical users’ requirements

Amazon is a customer-obsessed organization, so it’s important for us to first identify who the main customers are at each point so that we can meet their needs. The customers of the functional requirements are the application users, so we need to ensure the application meets their needs. For the most part, we will ensure that the desired product features are supported by the architecture.

But who are the users of the architecture? Not the applications’ users—they don’t care if it’s monolithic or microservices based, as long as they can shop and search for products. The main customers of the architecture are the technical teams: the developers, architects, and operations teams that build and support the application. We need to work backwards from the customers’ needs (in this case the technical team), and make sure that the architecture meets their requirements. We have therefore identified three non-functional requirements that are important to consider when designing an architecture that can equally meet the needs of the technical users:

  1. Deployability: Flow and agility to consistently deploy new features
  2. Observability: feedback about the state of the application
  3. Disposability: throwing away resources and provision new ones quickly

Together these form part of the Developer Experience (DX), which is focused on providing developers with APIs, documentation, and other technologies to make it easy to understand and use. This will ensure that we design for Day 2 operations in mind.

Deployability: Flow

There are many reasons that organizations embark on digital transformation journeys, which usually involve moving to the cloud and adopting DevOps. According to Stephen Orban, GM of AWS Data Exchange, in his book Ahead in the Cloud, faster product development is often a key motivator, meaning the most important non-functional requirement is achieving flow, the speed at which you can consistently deploy new applications, respond to competitors, and test and roll out new features. As well, the architecture needs to be designed upfront to support deployability. If the architectural pattern is a monolithic application, this will hamper the developers’ ability to quickly roll out new features to production. So we need to choose and design the architecture to support easy and automated deployments. Results from years of research prove that leaders use DevOps to achieve high levels of throughput:

Graphic - Using DevOps to achieve high levels of throughput

Decisions on the pace and frequency of deployments will dictate whether to use rolling, blue/green, or canary deployment methodologies. This will then inform the architectural pattern chosen for the application.

Using AWS, in order to achieve flow of deployability, we will use services such as AWS CodePipelineAWS CodeBuildAWS CodeDeploy and AWS CodeStar.

Observability: feedback

Once you have achieved a rapid and repeatable flow of features into production, you need a constant feedback loop of logs and metrics in order to detect and avoid problems. Observability is a property of the architecture that will allow us to better understand the application across the delivery pipeline and into production. This requires that we design the architecture to ensure that health reports are generated to analyze and spot trends. This includes error rates and stats from each stage of the development process, how many commits were made, build duration, and frequency of deployments. This not only allows us to measure code characteristics such as test coverage, but also developer productivity.

On AWS, we can leverage Amazon CloudWatch to gather and search through logs and metrics, AWS X-Ray for tracing, and Amazon QuickSight as an analytics tool to measure CI/CD metrics.

Disposability: automation

In his book, Cloud Strategy: A Decision-based Approach to a Successful Cloud Journey, Gregor Hohpe, Enterprise Strategist at AWS, notes that cloud and automation add a new “-ility”: disposability, which is the ability to set up and dispose of new servers in an automated and pain-free manner. Having immutable, disposable infrastructure greatly enhances your ability to achieve high levels of deployability and flow, especially when used in a CI/CD pipeline, which can create new resources and kill off the old ones.

At AWS, we can achieve disposability with serverless using AWS Lambda, or with containers running on Amazon Elastic Container Service (ECS) or Amazon Elastic Kubernetes Service (EKS), or using AWS Auto Scaling with Amazon Elastic Compute Cloud (EC2).

Three different views of the architecture

Once we have designed an architecture that caters for deployability, observability, and disposability, it exposes three lenses across which we can view the architecture:

3 views of the architecture

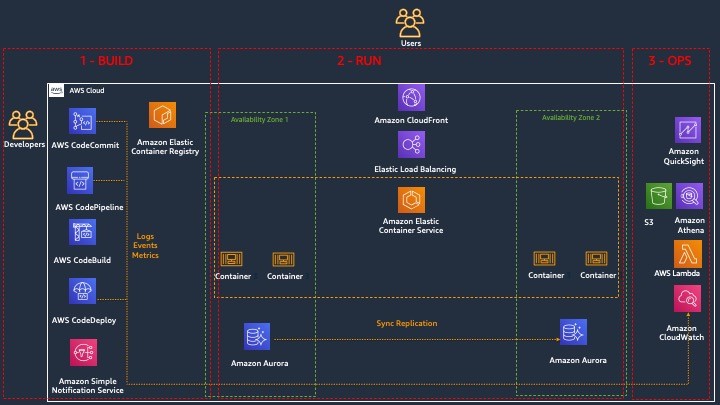
  1. Build lens: the focus of this part of the architecture is on achieving deployability, with the objective to give the developers an easy-to-use, automated platform that builds, tests, and pushes their code into the different environments, in a repeatable way. Developers can push code changes more reliably and frequently, and the operations team can see greater stability because environments have standard configurations and rollback procedures are automated
  2. Runtime lens: the focus is on the users of the application and on maximizing their experience by making the application responsive and highly available.
  3. Operate lens: the focus is on achieving observability for the DevOps teams, allowing them to have complete visibility into each part of the architecture.

Summary

When building and designing new applications, the functional requirements (such as UX) are usually the primary drivers for choosing and defining the architecture to support those requirements. In this post I have discussed how DX characteristics like deployability, observability, and disposability are not just operational concerns that get tacked on after the architecture is chosen. Rather, they should be as important as the functional requirements when choosing the architectural pattern. This ensures that the architecture can support the needs of both the developers and users, increasing quality and our ability to innovate.

Enhanced monitoring and automatic scaling for Apache Flink

Post Syndicated from Karthi Thyagarajan original https://aws.amazon.com/blogs/big-data/enhanced-monitoring-and-automatic-scaling-for-apache-flink/

Thousands of developers use Apache Flink to build streaming applications to transform and analyze data in real time. Apache Flink is an open-source framework and engine for processing data streams. It’s highly available and scalable, delivering high throughput and low latency for the most demanding stream-processing applications. Monitoring and scaling your applications is critical to keep your applications running successfully in a production environment.

Amazon Kinesis Data Analytics reduces the complexity of building and managing Apache Flink applications. Amazon Kinesis Data Analytics manages the underlying Apache Flink components that provide durable application state, metrics and logs, and more. Kinesis Data Analytics recently announced new Amazon CloudWatch metrics and the ability to create custom metrics to provide greater visibility into your application.

In this post, we show you how to easily monitor and automatically scale your Apache Flink applications with Amazon Kinesis Data Analytics. We walk through three examples. First, we create a custom metric in the Kinesis Data Analytics for Apache Flink application code. Second, we use application metrics to automatically scale the application. Finally, we share a CloudWatch dashboard for monitoring your application and recommend metrics that you can alarm on.

Custom metrics

Kinesis Data Analytics uses Apache Flink’s metrics system to send custom metrics to CloudWatch from your applications. For more information, see Using Custom Metrics with Amazon Kinesis Data Analytics for Apache Flink.

We use a basic word count program to illustrate the use of custom metrics. The following code shows how to extend RichFlatMapFunction to track the number of words it sees. This word count is then surfaced via the Flink metrics API.

private static final class Tokenizer extends RichFlatMapFunction<String, Tuple2<String, Integer>> {
     
            private transient Counter counter;
     
            @Override
            public void open(Configuration config) {
                this.counter = getRuntimeContext().getMetricGroup()
                        .addGroup("kinesisanalytics")
                        .addGroup("Service", "WordCountApplication")
                        .addGroup("Tokenizer")
                        .counter("TotalWords");
            }
     
            @Override
            public void flatMap(String value, Collector<Tuple2<String, Integer>>out) {
                // normalize and split the line
                String[] tokens = value.toLowerCase().split("\\W+");
     
                // emit the pairs
                for (String token : tokens) {
                    if (token.length() > 0) {
                        counter.inc();
                        out.collect(new Tuple2<>(token, 1));
                    }
                }
            }
        }

Custom metrics emitted through the Flink metrics API are forwarded to CloudWatch metrics by Kinesis Data Analytics for Apache Flink. The following screenshot shows the word count metric in CloudWatch.

Custom automatic scaling

This section describes how to implement an automatic scaling solution for Kinesis Data Analytics for Apache Flink based on CloudWatch metrics. You can configure Kinesis Data Analytics for Apache Flink to perform CPU-based automatic scaling. However, you can automatically scale your application based on something other than CPU utilization. To perform custom automatic scaling, use Application Auto Scaling with the appropriate metric.

For applications that read from a Kinesis stream source, you can use the metric millisBehindLatest. This captures how far behind your application is from the head of the stream.

A target tracking policy is one of two scaling policy types offered by Application Auto Scaling. You can specify a threshold value around which to vary the degree of parallelism of your Kinesis Data Analytics application. The following sample code on GitHub configures Application Auto Scaling when millisBehindLatest for the consuming application exceeds 1 minute. This increases the parallelism, which increases the number of KPUs.

The following diagram shows how Application Auto Scaling, used with Amazon API Gateway and AWS Lambda, scales a Kinesis Data Analytics application in response to a CloudWatch alarm.

The sample code includes examples for automatic scaling based on the target tracking policy and step scaling policy.

Automatic scaling solution components

The following is a list of key components used in the automatic scaling solution. You can find these components in the AWS CloudFormation template in the GitHub repo accompanying this post.

  • Application Auto Scaling scalable target – A scalable target is a resource that Application Auto Scaling can scale in and out. It’s uniquely identified by the combination of resource ID, scalable dimension, and namespace. For more information, see RegisterScalableTarget.
  • Scaling policy – The scaling policy defines how your scalable target should scale. As described in the PutScalingPolicy, Application Auto Scaling supports two policy types: TargetTrackingScaling and StepScaling. In addition, you can configure a scheduled scaling action using Application Auto Scaling. If you specify TargetTrackingScaling, Application Auto Scaling also creates corresponding CloudWatch alarms for you.
  • API Gateway – Because the scalable target is a custom resource, we have to specify an API endpoint. Application Auto Scaling invokes this to perform scaling and get information about the current state of our scalable resource. We use an API Gateway and Lambda function to implement this endpoint.
  • Lambda – API Gateway invokes the Lambda function. This is called by Application Auto Scaling to perform the scaling actions. It also fetches information such as current scale value and returns information requested by Application Auto Scaling.

Additionally, you should be aware of the following:

  • When scaling out or in, this sample only updates the overall parallelism. It doesn’t adjust parallelism or KPU.
  • When scaling occurs, the Kinesis Data Analytics application experiences downtime.
  • The throughput of a Flink application depends on many factors, such as complexity of processing and destination throughput. The step-scaling example assumes a relationship between incoming record throughput and scaling. The millisBehindLatest metric used for target tracking automatic scaling works the same way.
  • We recommend using the default scaling policy provided by Kinesis Data Analytics for CPU-based scaling, the target tracking auto scaling policy for the millisBehindLatest metric, and a step scaling auto scaling policy for a metric such as numRecordsInPerSecond. However, you can use any automatic scaling policy for the metric you choose.

CloudWatch operational dashboard

Customers often ask us about best practices and the operational aspects of Kinesis Data Analytics for Apache Flink. We created a CloudWatch dashboard that captures the key metrics to monitor. We categorize the most common metrics in this dashboard with the recommended statistics for each metric.

This GitHub repo contains a CloudFormation template to deploy the dashboard for any Kinesis Data Analytics for Apache Flink application. You can also deploy a demo application with the dashboard. The dashboard includes the following:

  • Application health metrics:
    • Use uptime to see how long the job has been running without interruption and downtime to determine if a job failed to run. Non-zero downtime can indicate issues with your application.
    • Higher-than-normal job restarts can indicate an unhealthy application.
    • Checkpoint information size, duration, and number of failed checkpoints can help you understand application health and progress. Increasing checkpoint duration values can signify application health problems like backpressure and the inability to keep up with input data. Increasing checkpoint size over time can point to an infinitely growing state that can lead to out-of-memory errors.
  • Resource utilization metrics:
    • You can check the CPU and heap memory utilization along with the thread count. You can also check the garbage collection time taken across all Flink task managers.
  • Flink application progress metrics:
    • numRecordsInPerSecond and numRecordsOutPerSecond show the number of records accepted and emitted per second.
    • numLateRecordsDropped shows the number of records this operator or task has dropped due to arriving late.
    • Input and output watermarks are valid only when using event time semantics. You can use the difference between these two values to calculate event time latency.
  • Source metrics:
    • The Kinesis Data Streams-specific metric millisBehindLatest shows that the consumer is behind the head of the stream, indicating how far behind current time the consumer is. We used this metric to demonstrate Application Auto Scaling earlier in this post.
    • The Kafka-specific metric recordsLagMax shows the maximum lag in terms of number of records for any partition in this window.

The dashboard contains useful metrics to gauge the operational health of a Flink application. You can modify the threshold, configure additional alarms, and add other system or custom metrics to customize the dashboard for your use. The following screenshot shows a section of the dashboard.

Summary

In this post, we covered how to use the enhanced monitoring features for Kinesis Data Analytics for Apache Flink applications. We created custom metrics for an Apache Flink application within application code and emitted it to CloudWatch. We also used Application Auto Scaling to scale an application. Finally, we shared a CloudWatch dashboard to monitor the operational health of Kinesis Data Analytics for Apache Flink applications. For more information about using Kinesis Data Analytics, see Getting Started with Amazon Kinesis Data Analytics.


About the Authors

Karthi Thyagarajan is a Principal Solutions Architect on the Amazon Kinesis team.


Deepthi Mohan is a Sr. TPM on the Amazon Kinesis Data Analytics team.

Troubleshooting Amazon API Gateway with enhanced observability variables

Post Syndicated from Eric Johnson original https://aws.amazon.com/blogs/compute/troubleshooting-amazon-api-gateway-with-enhanced-observability-variables/

Amazon API Gateway is often used for managing access to serverless applications. Additionally, it can help developers reduce code and increase security with features like AWS WAF integration and authorizers at the API level.

Because more is handled by API Gateway, developers tell us they would like to see more data points on the individual parts of the request. This data helps developers understand each phase of the API request and how it affects the request as a whole. In response to this request, the API Gateway team has added new enhanced observability variables to the API Gateway access logs. With these new variables, developers can troubleshoot on a more granular level to quickly isolate and resolve request errors and latency issues.

The phases of an API request

API Gateway divides requests into phases, reflected by the variables that have been added. Depending upon the features configured for the application, an API request goes through multiple phases. The phases appear in a specific order as follows:

Phases of an API request

Phases of an API request

  • WAF: the WAF phase only appears when an AWS WAF web access control list (ACL) is configured for enhanced security. During this phase, WAF rules are evaluated and a decision is made on whether to continue or cancel the request.
  • Authenticate: the authenticate phase is only present when AWS Identity and Access Management (IAM) authorizers are used. During this phase, the credentials of the signed request are verified. Access is granted or denied based on the client’s right to assume the access role.
  • Authorizer: the authorizer phase is only present when a Lambda, JWT, or Amazon Cognito authorizer is used. During this phase, the authorizer logic is processed to verify the user’s right to access the resource.
  • Authorize: the authorize phase is only present when a Lambda or IAM authorizer is used. During this phase, the results from the authenticate and authorizer phase are evaluated and applied.
  • Integration: during this phase, the backend integration processes the request.

Each phrase can add latency to the request, return a status, or raise an error. To capture this data, API Gateway now provides enhanced observability variables based on each phase. The variables are named according to the phase they occur in and follow the naming structure, $context.phase.property. Therefore, you can get data about WAF latency by using $context.waf.latency.

Some existing variables have also been given aliases to match this naming schema. For example, $context.integrationErrorMessage has a new alias of $context.integration.error. The resulting list of variables is as follows:

Phases and variables for API Gateway requests

Phases and variables for API Gateway requests

API Gateway provides status, latency, and error data for each phase. In the authorizer and integration phases, there are additional variables you can use in logs. The $context.phase.requestId provides the request ID from that service and the $context.phase.integrationStatus provide the status code.

For example, when using an AWS Lambda function as the integration, API Gateway receives two status codes. The first, $context.integration.integrationStatus, is the status of the Lambda service itself. This is usually 200, unless there is a service or permissions error. The second, $context.integration.status, is the status of the Lambda function and reports on the success or failure of the code.

A full list of access log variables is in the documentation for REST APIs, WebSocket APIs, and HTTP APIs.

A troubleshooting example

In this example, an application is built using an API Gateway REST API with a Lambda function for the backend integration. The application uses an IAM authorizer to require AWS account credentials for application access. The application also uses an AWS WAF ACL to rate limit requests to 100 requests per IP, per five minutes. The demo application and deployment instructions can be found in the Sessions With SAM repository.

Because the application involves an AWS WAF and IAM authorizer for security, the request passes through four phases: waf, authenticate, authorize, and integration. The access log format is configured to capture all the data regarding these phases:

{
  "requestId":"$context.requestId",
  "waf-error":"$context.waf.error",
  "waf-status":"$context.waf.status",
  "waf-latency":"$context.waf.latency",
  "waf-response":"$context.wafResponseCode",
  "authenticate-error":"$context.authenticate.error",
  "authenticate-status":"$context.authenticate.status",
  "authenticate-latency":"$context.authenticate.latency",
  "authorize-error":"$context.authorize.error",
  "authorize-status":"$context.authorize.status",
  "authorize-latency":"$context.authorize.latency",
  "integration-error":"$context.integration.error",
  "integration-status":"$context.integration.status",
  "integration-latency":"$context.integration.latency",
  "integration-requestId":"$context.integration.requestId",
  "integration-integrationStatus":"$context.integration.integrationStatus",
  "response-latency":"$context.responseLatency",
  "status":"$context.status"
}

Once the application is deployed, use Postman to test the API with a sigV4 request.

Configuring Postman authorization

Configuring Postman authorization

To show troubleshooting with the new enhanced observability variables, the first request sent through contains invalid credentials. The user receives a 403 Forbidden error.

Client response view with invalid tokens

Client response view with invalid tokens

The access log for this request is:

{
    "requestId": "70aa9606-26be-4396-991c-405a3671fd9a",
    "waf-error": "-",
    "waf-status": "200",
    "waf-latency": "8",
    "waf-response": "WAF_ALLOW",
    "authenticate-error": "-",
    "authenticate-status": "403",
    "authenticate-latency": "17",
    "authorize-error": "-",
    "authorize-status": "-",
    "authorize-latency": "-",
    "integration-error": "-",
    "integration-status": "-",
    "integration-latency": "-",
    "integration-requestId": "-",
    "integration-integrationStatus": "-",
    "response-latency": "48",
    "status": "403"
}

The request passed through the waf phase first. Since this is the first request and the rate limit has not been exceeded, the request is passed on to the next phase, authenticate. During the authenticate phase, the user’s credentials are verified. In this case, the credentials are invalid and the request is rejected with a 403 response before invoking the downstream phases.

To correct this, the next request uses valid credentials, but those credentials do not have access to invoke the API. Again, the user receives a 403 Forbidden error.

Client response view with unauthorized tokens

Client response view with unauthorized tokens

The access log for this request is:

{
  "requestId": "c16d9edc-037d-4f42-adf3-eaadf358db2d",
  "waf-error": "-",
  "waf-status": "200",
  "waf-latency": "7",
  "waf-response": "WAF_ALLOW",
  "authenticate-error": "-",
  "authenticate-status": "200",
  "authenticate-latency": "8",
  "authorize-error": "The client is not authorized to perform this operation.",
  "authorize-status": "403",
  "authorize-latency": "0",
  "integration-error": "-",
  "integration-status": "-",
  "integration-latency": "-",
  "integration-requestId": "-",
  "integration-integrationStatus": "-",
  "response-latency": "52",
  "status": "403"
}

This time, the access logs show that the authenticate phase returns a 200. This indicates that the user credentials are valid for this account. However, the authorize phase returns a 403 and states, “The client is not authorized to perform this operation”. Again, the request is rejected with a 403 response before invoking downstream phases.

The last request for the API contains valid credentials for a user that has rights to invoke this API. This time the user receives a 200 OK response and the requested data.

Client response view with valid request

Client response view with valid request

The log for this request is:

{
  "requestId": "ac726ce5-91dd-4f1d-8f34-fcc4ae0bd622",
  "waf-error": "-",
  "waf-status": "200",
  "waf-latency": "7",
  "waf-response": "WAF_ALLOW",
  "authenticate-error": "-",
  "authenticate-status": "200",
  "authenticate-latency": "1",
  "authorize-error": "-",
  "authorize-status": "200",
  "authorize-latency": "0",
  "integration-error": "-",
  "integration-status": "200",
  "integration-latency": "16",
  "integration-requestId": "8dc58335-fa13-4d48-8f99-2b1c97f41a3e",
  "integration-integrationStatus": "200",
  "response-latency": "48",
  "status": "200"
}

This log contains a 200 status code from each of the phases and returns a 200 response to the user. Additionally, each of the phases reports latency. This request had a total of 48 ms of latency. The latency breaks down according to the following:

Request latency breakdown

Request latency breakdown

Developers can use this information to identify the cause of latency within the API request and adjust accordingly. While some phases like authenticate or authorize are immutable, optimizing the integration phase of this request could remove a large chunk of the latency involved.

Conclusion

This post covers the enhanced observability variables, the phases they occur in, and the order of those phases. With these new variables, developers can quickly isolate the problem and focus on resolving issues.

When configured with the proper access logging variables, API Gateway access logs can provide a detailed story of API performance. They can help developers to continually optimize that performance. To learn how to configure logging in API Gateway with AWS SAM, see the demonstration app for this blog.

#ServerlessForEveryone

Log your VPC DNS queries with Route 53 Resolver Query Logs

Post Syndicated from Martin Beeby original https://aws.amazon.com/blogs/aws/log-your-vpc-dns-queries-with-route-53-resolver-query-logs/

The Amazon Route 53 team has just launched a new feature called Route 53 Resolver Query Logs, which will let you log all DNS queries made by resources within your Amazon Virtual Private Cloud. Whether it’s an Amazon Elastic Compute Cloud (EC2) instance, an AWS Lambda function, or a container, if it lives in your Virtual Private Cloud and makes a DNS query, then this feature will log it; you are then able to explore and better understand how your applications are operating.

Our customers explained to us that DNS query logs were important to them. Some wanted the logs so that they could be compliant with regulations, others wished to monitor DNS querying behavior, so they could spot security threats. Others simply wanted to troubleshoot application issues that were related to DNS. The team listened to our customers and have developed what I have found to be an elegant and easy to use solution.

From knowing very little about the Route 53 Resolver, I was able to configure query logging and have it working with barely a second glance at the documentation; which I assure you is a testament to the intuitiveness of the feature rather than me having any significant experience with Route 53 or DNS query logging.

You can choose to have the DNS query logs sent to one of three AWS services: Amazon CloudWatch Logs, Amazon Simple Storage Service (S3), and Amazon Kinesis Data Firehose. The target service you choose will depend mainly on what you want to do with the data. If you have compliance mandates (For example, Australia’s Information Security Registered Assessors Program), then maybe storing the logs in Amazon Simple Storage Service (S3) is a good option. If you have plans to monitor and analyze DNS queries in real-time or you integrate your logs with a 3rd party data analysis tool like Kibana or a SEIM tool like Splunk, than perhaps Amazon Kinesis Data Firehose is the option for you. For those of you who want an easy way to search, query, monitor metrics, or raise alarms, then Amazon CloudWatch Logs is a great choice, and this is what I will show in the following demo.

Over in the Route 53 Console, near the Resolver menu section, I see a new item called Query logging. Clicking on this takes me to a screen where I can configure the logging.

The dashboard shows the current configurations that are setup. I click Configure query logging to get started.

The console asks me to fill out some necessary information, such as a friendly name; I’ve named mine demoNewsBlog.

I am now prompted to select the destination where I would like my logs to be sent. I choose the CloudWatch Logs log group and select the option to Create log group. I give my new log group the name /aws/route/demothebeebsnet.

Next, I need to select what VPC I would like to log queries for. Any resource that sits inside the VPCs I choose here will have their DNS queries logged. You are also able to add tags to this configuration. I am in the habit of tagging anything that I use as part of a demo with the tag demo. This is so I can easily distinguish between demo resources and live resources in my account.

Finally, I press the Configure query logging button, and the configuration is saved. Within a few moments, the service has successfully enabled the query logging in my VPC.

After a few minutes, I log into the Amazon CloudWatch Logs console and can see that the logs have started to appear.

As you can see below, I was quickly able to start searching my logs and running queries using Amazon CloudWatch Logs Insights.

There is a lot you can do with the Amazon CloudWatch Logs service, for example, I could use CloudWatch Metric Filters to automatically generate metrics or even create dashboards. While putting this demo together, I also discovered a feature inside of Amazon CloudWatch Logs called Contributor Insights that enables you to analyze log data and create time series that display top talkers. Very quickly, I was able to produce this graph, which lists out the most common DNS queries over time.
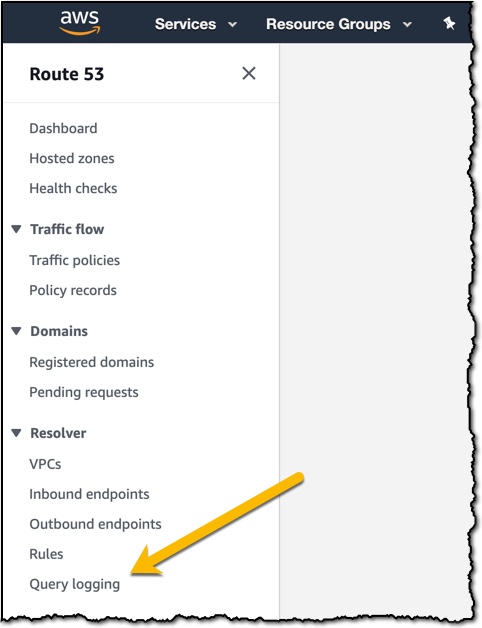
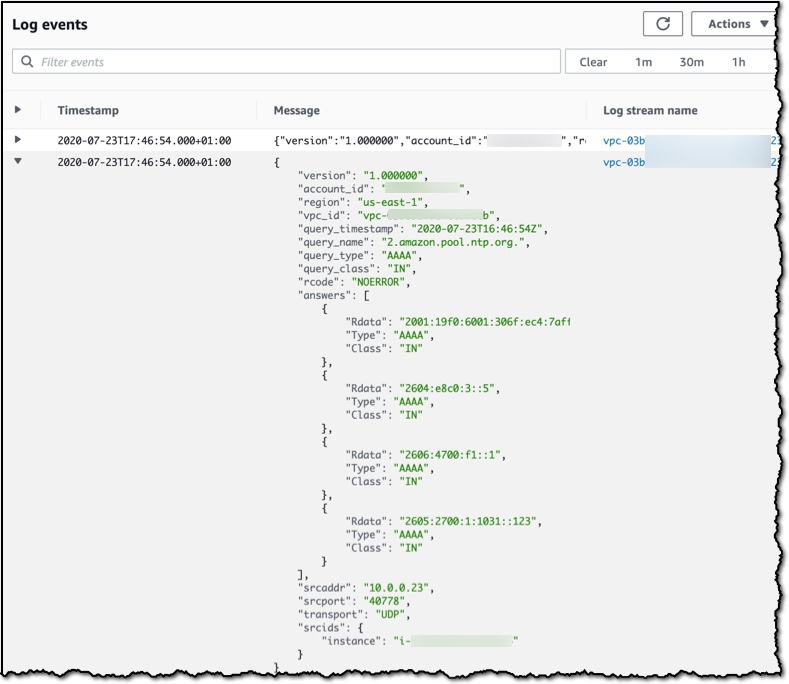
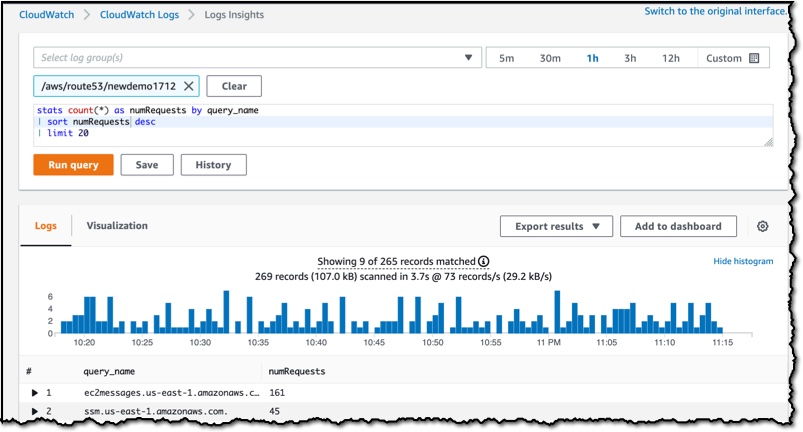
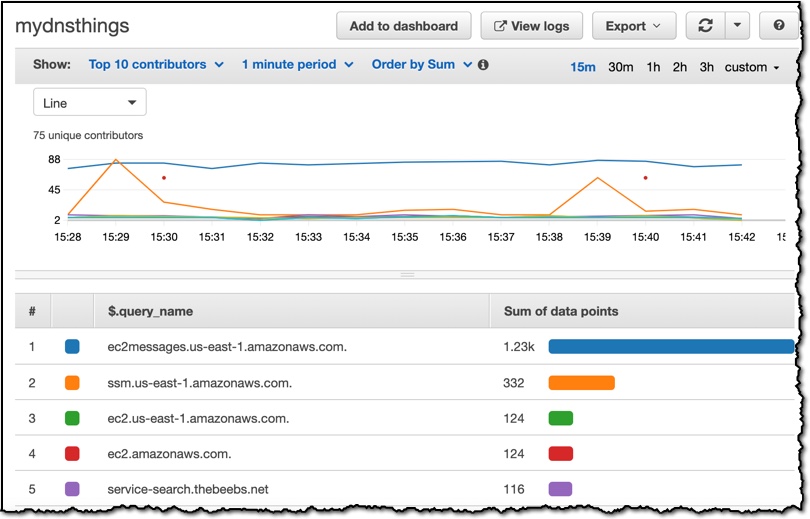
Route 53 Resolver Query Logs is available in all AWS Commercial Regions that support Route 53 Resolver Endpoints, and you can get started using either the API or the AWS Console. You do not pay for the Route 53 Resolver Query Logs, but you will pay for handling the logs in the destination service that you choose. So, for example, if you decided to use Amazon Kinesis Data Firehose, then you will incur the regular charges for handling logs with the Amazon Kinesis Data Firehose service.

Happy Logging

— Martin