Post Syndicated from Brandon Kindred original https://aws.amazon.com/blogs/devops/using-semantic-versioning-to-simplify-release-management/
Any organization that manages software libraries and applications needs a standardized way to catalog, reference, import, fix bugs and update the versions of those libraries and applications. Semantic Versioning enables developers, testers, and project managers to have a more standardized process for committing code and managing different versions. It’s benefits also extend beyond development teams to end users by using change logs and transparent feature documentation. This alleviates the operational burden of communicating changes for each release cycle.
In this post, we dive deep into how Semantic Versioning works and how to use the NodeJS package semantic-release/npm in a GitHub Actions continuous integration and continuous delivery (CI/CD) pipeline to automatically version an Amazon Web Services (AWS) Cloud Development Kit (AWS CDK) project. Once we’re done, you’ll be ready to deliver AWS CDK projects that are automatically versioned so your team can focus more on code instead of versioning for each release.
How does Semantic Versioning work?
With Semantic Versioning, version number changes convey a specific meaning about the underlying code change. This helps others to understand what has changed from one version to the next.
Semantic Versioning is defined in a Major.Minor.Patch format, which is a guideline to track the scope and potential impact of changes for feature development, major updates and bug fixes. The Major version number change signifies that this release will have breaking changes and any upgrade to this version should be validated for backward compatibility. The Minor version number change signifies a feature release in a backward-compatible manner. Finally, the Patch version number signifies a small insignificant change or a bug fix and users can upgrade to this version without introducing breaking changes or new features.
Each version number is always incremented by one digit and when a higher digit increments, the lower digits reset to zero. For example, version 1.5.2 means that the software is in its first major version, and has released 5 features with 2 patches implemented. When a new feature is added, it will be released as version 1.6.0. If there are any bugs reported and a fix is release for that bug, the next release version will be 1.6.1. For a version 2.0.0 release there will be breaking changes, and may not be backward compatible with previous 1.x.x versions.
What is semantic-release?
Now that we have covered how Semantic Versioning works, and why it’s useful in software projects, let’s review semantic-release. It is a Node.js tool that simplifies Semantic Versioning management. Semantic-release can do more than just apply Semantic Versioning to your projects. With a variety of plugins available, you can track what sort of changes are being made with commit analysis or by generating a changelog for each release. This automates what would otherwise have been a manual and time-consuming process to create and review roadmaps and documentation tracking the new features and fixes that comprise a release. Semantic-release is also straightforward to integrate with CI tools such as GitHub Actions, GitLab CI, Travis CI, and CircleCI 2.0 workflows.
Unfortunately, if your commit messages don’t match the format semantic-release requires, the automatic versioning won’t work correctly. To verify that commit messages are in the right format, you can integrate tools such as commitizen or commitlint, which can validate that commit messages are in a valid format.
Using semantic-release
Commit message formats
By default, semantic-release uses Angular Commit Message Conventions, however the commit message format can be altered by using config options. Let’s take a quick look at the three different types of commit messages, fixes, features, and breaking changes.
Patches and fixes
For patch or fix commits, you need to start your commit message with “fix(context):”. This tells semantic-release that this is a minor patch—meaning that if your version is 0.0.1, after this commit is merged the version will be incremented to 0.0.2. Following is an example commit message.
fix(printer): inform user when printer is out of paper
Features
Feature commit messages start with “feat(context):” which indicates to semantic-release that this is a feature release, also referred to as a minor release. If your version is 0.1.0, after a feature commit is merged, the version will be incremented to 0.2.0. Following is an example of a feature commit.
feat(printer): add option for printing in color
Breaking changes
Breaking change commits are intended for marking a major breaking change—meaning that the commit introduces changes that are not compatible with existing or previous versions. The way that commit messages are marked as breaking changes is slightly different than the previous commit types. For a breaking change, the commit footer needs to include “BREAKING CHANGE:”. For example, a breaking change commit, might look like the following.
perf(printer): remove color printing option
BREAKING CHANGE: The color printing option has been removed. The default black and white printing option is always used for performance reasons.
Release change log
To generate a release change log, we only need to add the semantic-release/changelog plugin to the package.json file. We’ll demonstrate how to do this in the next section.
Adding Semantic Release to an AWS CDK project
To demonstrate semantic-release in action we will build an example with AWS CDK and the NPM semantic-release library. All code provided in the remainder of this blog can be found in the semantic-versioning demo repository (aws-cdk-semantic-release) on GitHub.
To get started we’ll need to create a Node.js CDK application, add semantic-release and its plugins, commit changes, then build the project. If you don’t have AWS CDK installed yet, check out the Getting Stated with CDK guide.
To begin, navigate to the folder where the project will be saved. Next, we initialize a new AWS CDK project and add semantic-release. Then, we configure the branches that Semantic Versioning should be applied to and add a few NPM plugins to extend the functionality of semantic-release. While there are many plugins available, only a few are needed to get started. Below, we’ll walk through which plugins to install and how to install them.
Initiate a new AWS CDK Typescript project and add semantic-release
In a command terminal, navigate to the folder where you want to store your AWS CDK project and run the following three commands. The first line will create the project and the next two will install the semantic-release NPM and Git plugins in the AWS CDK project.
cd <<PROJECT_FOLDER>>
cdk init app --language typescript
npm install @semantic-release/npm -D
npm install @semantic-release/git -D
Define which branches to apply versioning to
We need to tell NPM which branches can trigger a new release. In the example we’ll use the main branch and the staging branches for release. We will add a new section to the package.json file along with the branches we want to use for releases.
"release": {
  "branches": ["main"]
}
Add supporting plugins to package.json
In order for semantic-release to pick up commits, generate release notes, and be able to perform a release with GitHub we need to add the commit-analyzer, release-notes-generator, changelog, NPM, Git, and GitHub plugins. Add the following plugins section to the package.json file after the “release” section we added in the previous step.
"plugins": [
    "@semantic-release/commit-analyzer",
    "@semantic-release/release-notes-generator",
    "@semantic-release/changelog",
    "@semantic-release/npm",
    [
        "@semantic-release/git",
        {
            "assets": [
                "package.json",
                "CHANGELOG.md"
            ],
            "message": "chore(release): ${nextRelease.version}[skip ci]\n\n${nextRelease.notes}"
        }
    ],
    "@semantic-release/github"
],
Putting it all together, our package.json file should look similar to the following.
{
    "name": "aws-cdk-semantic-release",
    "version": "0.1.0",
    "bin": {
        "aws-cdk-semantic-release": "bin/aws-cdk-semantic-release.js"
    },
    "scripts": {
        "build": "tsc",
        "watch": "tsc -w",
        "test": "jest",
        "cdk": "cdk"
    },
    "plugins": [
        "@semantic-release/commit-analyzer",
        "@semantic-release/release-notes-generator",
        "@semantic-release/changelog",
        "@semantic-release/npm",
        [
            "@semantic-release/git",
            {
                "assets": [
                    "package.json",
                    "CHANGELOG.md"
                ],
                "message": "chore(release): ${nextRelease.version} [skip ci]\n\n${nextRelease.notes}"
            }
        ],
        "@semantic-release/github"
    ],
    "release": {
        "branches": [
            "main"
        ]
    },
    "devDependencies": {
        "@semantic-release/changelog": "^6.0.3",
        "@semantic-release/git": "^10.0.1",
        "@semantic-release/npm": "^11.0.2",
        "@types/jest": "^29.5.12",
        "@types/node": "20.11.16",
        "aws-cdk": "2.127.0",
        "jest": "^29.7.0",
        "ts-jest": "^29.1.2",
        "ts-node": "^10.9.2",
        "typescript": "~5.3.3"
    },
    "dependencies": {
        "aws-cdk-lib": "2.127.0",
        "constructs": "^10.0.0",
        "source-map-support": "^0.5.21"
    }
}
With the necessary package.json changes in place, we can commit our code and build the project again.
git commit -m "feat(semver): added semantic release plugins and set main branch for versioning"
npm run build
Configure GitHub Actions
In the projects root folder, we are going to create folders for .github/workflows so that we can configure GitHub Actions release steps.
mkdir .github
cd .github
mkdir workflows
cd workflows
Create a file called release.yaml in the workflows folder that has the following.
name: Release
on:
  push:
    branches:
      - main
jobs:
  release:
    runs-on: ubuntu-latest
    steps:
      - name: Checkout Code
         uses: actions/checkout@v3
      - name: Setup Node.js
         uses: actions/setup-node@v3
         with:
           node-version: '20.8.1'
      - name: Install Dependencies
         run: npm install
      - name: Semantic Release
         env:
           GITHUB_TOKEN: ${{ secrets.GITHUB_TOKEN }}
           NPM_TOKEN: ${{ secrets.NPM_TOKEN }}
         run: npx semantic-release
The GITHUB_TOKEN is automatically generated and managed by GitHub Actions, so we don’t need to worry about retrieving or defining this value in our GitHub Actions steps. However, NPM_TOKEN is not automatically provided to us, so we need to define the NPM token. To do this we need to login to npmjs.com and create an account. Once we’re logged in, we need to create an access token. Once the NPM access token is created, then we need to add the token to GitHub secrets.
Verify Semantic-Release is setup correctly
Now that we have everything configured, new merges and commits to the main branch will kick off a CI/CD pipeline through GitHub Actions that builds the project and increments the version. To verify that everything is working correctly, we’ll alter the CDK code to include an AWS Lambda function. Afterward, we’ll commit changes to the main branch to verify that semantic-release is working correctly.
Make a change, commit, push and verify
In the AWS CDK project lib/aws-cdk-semantic-release-stack.ts file we’ll update the visibilityTimeout duration to 600, then commit the changes. We want to be sure to use the Semantic Versioning format for the commit message so that our changes are versioned correctly. For this we use the following commit message.
“fix(sqs-visibility): increased visibility timeout to 600”
After committing the changes, we push the changes to the remote GitHub repository to initiate the GitHub Actions build process. Once the build is complete, we see that the build number has been incremented from the previous version. You can review the releases for the sample code to see how it has been versioned. Following are examples of what it should look like before and after executing this. Please note that the version numbers depicted may not match yours.
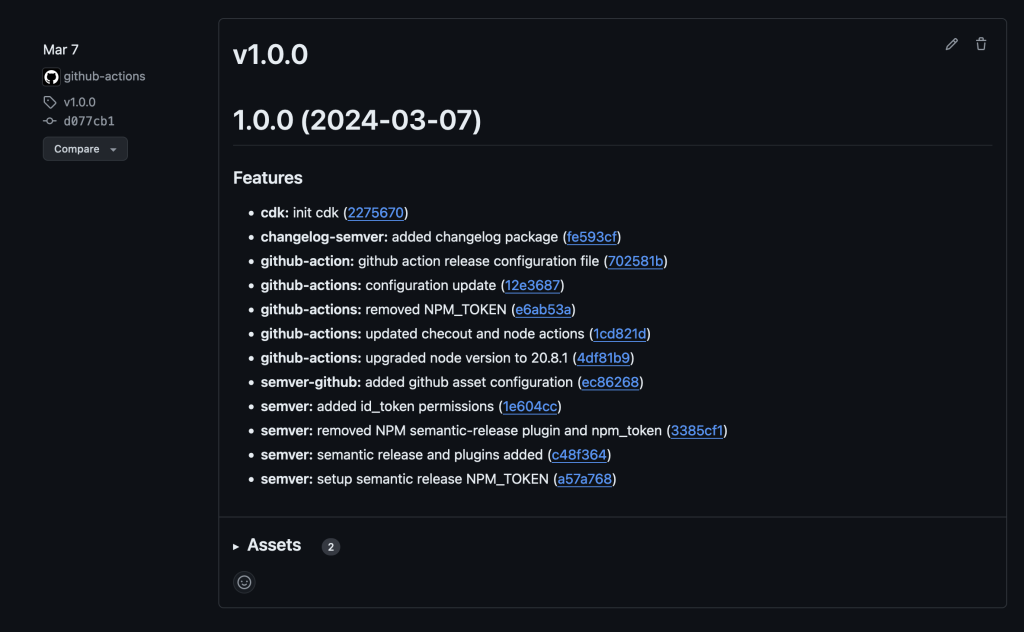
Screenshot of GitHub releases page showing release 1.0.0 and the associated features changelog
Figure 1 – Before the new commits
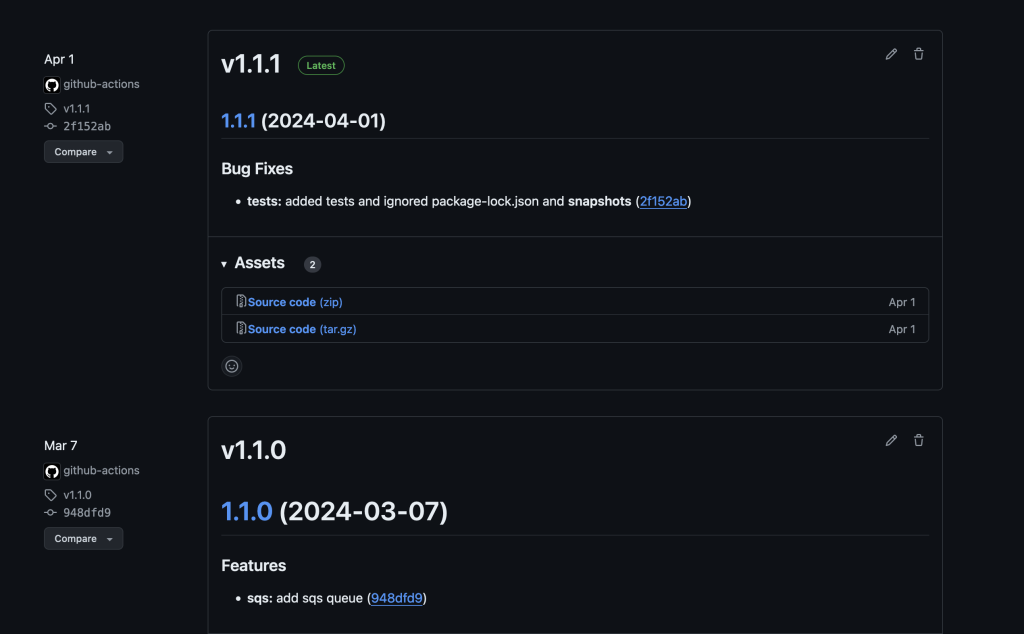
Screenshot of GitHub releases page showing a previous release and the latest release along with their respective versions of 1.1.0 and 1.1.1
Figure 2 – After GitHub Actions generates a new build
Conclusion
Semantic Versioning offers a structured and reliable way to manage software changes. When paired with the significant benefits of using Node.js packages like semantic-release, version management can become effortless. All of this enables automated version management Node.js projects such as AWS CDK pipelines for automated code deployment. It enhances clarity, stability, and collaboration, while also supporting automation and fostering user confidence.
By adopting Semantic Versioning, development teams can achieve more predictable and efficient workflows, ultimately leading to higher quality software. It also builds confidence among users without going into much details with respect to software upgrades and backward compatibility. As a best practice, start incorporating Semantic Versioning for existing and future applications.
Contact an AWS Representative to know how we can help accelerate your business.
Reference
CDK setup and deployment of application with CDK V2 Construct:


 ) is represented in the graph above. It can be converted into the equation below: