Back in July 2024, we announced plans to de-emphasize AWS CodeCommit based on adoption patterns and our assessment of customer needs. We never stopped looking at the data or listening to you, and what you’ve shown us is clear: you need an AWS-managed solution for your code repositories. Based on this feedback, CodeCommit is returning to full General Availability, effective immediately.
We Listened, and We Heard You
After the de-emphasis announcement last year, we heard from many of you. Your feedback was direct and revealing. You told us that CodeCommit isn’t just another code repository for you—it’s a critical piece of your infrastructure. Its deep IAM integration, VPC endpoint support, CloudTrail logging, and seamless connectivity with CodePipeline and CodeBuild provide value that’s difficult to replicate with third-party solutions, especially for teams operating in regulated industries or those who want all their development infrastructure within AWS boundaries. In short, we learned that CodeCommit is essential for many of you, so we’re bringing it back.
We acknowledge the uncertainty the de-emphasis has caused. If you invested time and resources planning or executing a migration away from CodeCommit, we apologize. We’ve learned from this, and we’re committed to doing better.
What’s Changing Today
Here’s what you need to know:
CodeCommit is open to new customers again – New customer sign-ups are open as of today. If you’ve been waiting to onboard new accounts or create repositories, you can do so right now through the AWS Console, CLI, or APIs.
For current and former customers – If you already migrated away, we understand you may have completed your transition to GitHub, GitLab, Bitbucket, or another provider. Those are excellent platforms, and we fully support your decision to use them. If you’re interested in returning to CodeCommit, our support team and account teams are available to help.
If you’re mid-migration, you can pause or reverse your plans. Contact AWS Support or your account team to discuss your specific situation and determine the best path forward.
If you stayed with CodeCommit, thank you for your patience during this period. We’re working through the backlog of feature requests and support tickets that accumulated, prioritizing by customer need. Continue to tell us how we can improve the service and support your workflows (human, machine, and agentic) moving forward.
What’s Coming Next
We’re not just maintaining CodeCommit—we’re investing in it. Here’s what’s on the roadmap:
Git LFS Support (Q1 2026) – This has been your most requested feature. Git Large File Storage will enable you to efficiently manage large binary files like images, videos, design assets, and compiled binaries without bloating your repositories. You’ll get faster clones, better performance, and cleaner version history for large assets.
Regional Expansions (Starting Q3 2026) – CodeCommit will expand to additional AWS Regions in eu-south-2 and ca-west-1, bringing the service closer to where you’re building and deploying your applications.
We’ll share more details about these features and additional roadmap items in the coming months. Keep an eye on our What’s New feed for the latest AWS launches.
Pricing, SLA, and Getting Started
Pricing remains unchanged—you can review the current structure on the CodeCommit pricing page. We continue to maintain our 99.9% uptime SLA as defined in our service terms.
If you’re new to CodeCommit or returning after a migration, check out our Getting Started Guide for step-by-step instructions. For migration assistance or questions about your specific setup, contact AWS Support or your account team.
Available Now
AWS CodeCommit is available now in 29 regions. New customers can begin creating repositories immediately. Visit the CodeCommit console to get started.
Thank you for your feedback, your patience, and your continued trust in AWS. We’re committed to making CodeCommit the best integrated Git repository service for AWS development.
Customers can migrate their AWS CodeCommit Git repositories to other Git providers using several methods, such as cloning the repository, mirroring, or migrating specific branches. This blog describes a basic use case to mirror a repository to a generic provider, and links to instructions for mirroring to more specific providers. Your exact steps could vary depending on the type or complexity of your repository, and the decisions made on what and how you want to migrate. This post only describes how to migrate Git repository data, and does not describe exporting other data from CodeCommit such as pull requests.
Pre-requisites
Before you can migrate your CodeCommit repository to another provider, make sure that you have the necessary credentials and permissions to both the AWS Management Console and the other provider’s account. For migrating to GitHub and Gitlab, use CodeCommit static credentials as described in HTTPS users using Git credentials. If you choose to use the generic migration option process described below, any type of CodeCommit credentials can be used. To learn more about setting up AWS CodeCommit access control see Setting up for AWS CodeCommit.
In the AWS CodeCommit console, select the clone URL for the repository you will migrate. The correct clone URL (HTTPS, SSH, or HTTPS (CRC)) depends on which credential type and network protocol you have chosen to use.
Figure 1: Clone repositories
Migrating your AWS CodeCommit repository to a GitLab repository
Using the CodeCommit clone URL in combination with the HTTPS Git repository credentials, follow the guidance in GitLab’s documentation for importing source code from a repository by URL.
Migrating your AWS CodeCommit repository to a GitHub repository
Using the CodeCommit clone URL in combination with the HTTPS Git repository credentials, follow the guidance in GitHub’s documentation for importing source code.
Generic migration to a different repository provider
1. Clone the AWS CodeCommit Repository Clone the repository from AWS CodeCommit to your local machine using Git. If you’re using HTTPS, you can do this by running the following command:
Replace <provider name> with the provider name of your choice. (Example: gitlab) Replace <provider-repository-url> with the URL of your new repository provider’s repository.
3. Push your local repository to the new remote repository
This will push all branches and tags to your new repository provider’s repository. The provider name must match the provider name from step 2.
git push <provider name> --mirror
Notes:
The remote repository should be empty
The remote repository may have protected branches not allowing force push. In this case, navigate to your new repository provider and disable branch protections to allow force push.
4. Verify the Migration
Once the push is complete, verify that all files, branches, and tags have been successfully migrated to the new repository provider. You can do this by browsing your repository online or by cloning it to another location and checking it locally.
5. Update Remote URLs
If you plan to continue working with the migrated repository locally, you may want to update the remote URL to point to the new provider’s repository instead of AWS CodeCommit. You can do this using the following command:
Replace <provider-repository-url> with the URL of your new repository provider’s repository.
6. Update CI/CD Pipelines and fix protected branches
If you have CI/CD pipelines set up that interact with your repository, such as GitLab, GitHub or AWS CodePipeline, update their configuration to reflect the new repository URL. If you removed protected branch permissions in Step 3 you may want to add these back to your main branch.
7. Inform Your Team
If you’re migrating a repository that others are working on, be sure to inform your team about the migration and provide them with the new repository URL.
8. Delete the, now migrated, AWS CodeCommit repository
This action cannot be undone. Navigate back to the AWS CodeCommit console and delete the repository that you have migrated using the “Delete Repository” button.
Figure 2: Delete repositories
Conclusion
This post described a few methods to migrate your existing AWS CodeCommit repository to another Git provider. After migration, you have the option to continue to use your current AWS CodeCommit repository, but doing so will likely require a regular sync operation between AWS CodeCommit and the new repository provider. For more information about repository migration, please see the following resources:
Migrate a repository incrementally – This guide is written to migrate a repository to CodeCommit incrementally but can also be used for other Git providers.
In this blog post, we will explore how to simplify Amazon EKS deployments with GitHub Actions and AWS CodeBuild. In today’s fast-paced digital landscape, organizations are turning to DevOps practices to drive innovation and streamline their software development and infrastructure management processes. One key practice within DevOps is Continuous Integration and Continuous Delivery (CI/CD), which automates deployment activities to reduce the time it takes to release new software updates. AWS offers a suite of native tools to support CI/CD, but also allows for flexibility and customization through integration with third-party tools.
Throughout this post, you will learn how to use GitHub Actions to create a CI/CD workflow with AWS CodeBuild and AWS CodePipeline. You’ll leverage the capabilities of GitHub Actions from a vast selection of pre-written actions in the GitHub Marketplace to build and deploy a Python application to an Amazon Elastic Kubernetes Service (EKS) cluster.
GitHub Actions is a powerful feature on GitHub’s development platform that enables you to automate your software development workflows directly within your repository. With Actions, you can write individual tasks to build, test, package, release, or deploy your code, and then combine them into custom workflows to streamline your development process.
Solution Overview
This solution being proposed in this post uses several AWS developer tools to establish a CI/CD pipeline while ensuring a streamlined path from development to deployment:
AWS CodeBuild: A fully managed build service that compiles source code, runs tests, and produces software packages that are ready to deploy.
AWS CodePipeline: A continuous delivery service that orchestrates the build, test, and deploy phases of your release process.
Amazon Elastic Kubernetes Service (EKS): A managed service that makes it easy to run Kubernetes on AWS without needing to install and operate your own Kubernetes control plane.
AWS CloudFormation: AWS CloudFormation lets you model, provision, and manage AWS and third-party resources by treating infrastructure as code. You’ll use AWS CloudFormation to deploy certain baseline resources required to follow along.
Amazon Elastic Container Registry (ECR): A fully managed container registry that makes it easy for developers to store, manage, and deploy Docker container images.
The code’s journey from the developer’s workstation to the final user-facing application is a seamless relay across various AWS services with key build an deploy operations performed via GitHub Actions:
The developer commits the application’s code to the Source Code Repository. In this post we will leverage a repository created in AWS CodeCommit.
The commit to the Source Control Management (SCM) system triggers the AWS CodePipeline, which is the orchestration service that manages the CI/CD pipeline.
AWS CodePipeline proceeds to the Build stage, where AWS CodeBuild, integrated with GitHub Actions, builds the container image from the committed code.
Once the container image is successfully built, AWS CodeBuild, with GitHub Actions, pushes the image to Amazon Elastic Container Registry (ECR) for storage and versioning.
An Approval Stage is included in the pipeline, which allows the developer to manually review and approve the build artifacts before they are deployed.
After receiving approval, AWS CodePipeline advances to the Deploy Stage, where GitHub Actions are used to run helm deployment commands.
Within this Deploy Stage, AWS CodeBuild uses GitHub Actions to install the Helm application on Amazon Elastic Kubernetes Service (EKS), leveraging Helm charts for deployment.
The deployed application is now running on Amazon EKS and is accessible via the automatically provisioned Application Load Balancer.
Pre-requisites
If you choose to replicate the steps in this post, you will need the following items:
Utilities like awscli and eksctl require access to your AWS account. Please make sure you have the AWS CLI configured with credentials. For instructions on setting up the AWS CLI, refer to this documentation.
Walkthrough
Deploy Baseline Resources
To get started you will first deploy an AWS CloudFormation stack that pre-creates some foundational developer resources such as a CodeCommit repository, CodeBuild projects, a CodePipeline pipeline that orchestrates the release of the application across multiple stages. If you’re interested to learn more about the resources being deployed, you can download the template and review its contents.
Additionally, to make use of GitHub Actions in AWS CodeBuild, it is required to authenticate your AWS CodeBuild project with GitHub using an access token – authentication with GitHub is required to ensure consistent access and avoid being rate-limited by GitHub.
First, let’s set up the environment variables required to configure the infrastructure:
In the commands above, replace cluster-name with your EKS cluster name, cluster-region with the AWS region of your EKS cluster, cluster-account with your AWS account ID (12-digit number), and github-pat with your GitHub Personal Access Token (PAT).
Using the AWS CloudFormation template located here, deploy the stack using the AWS CLI:
When you use AWS CodeBuild / GitHub Actions to deploy your application onto Amazon EKS, you’ll need to allow-list the service role associated with the build project(s) by adding the IAM principal to access your Cluster’s aws-auth config-map or using EKS Access Entries (recommended). The CodeBuild service role has been pre-created in the previous step and the role ARN can be retrieved using the command below:
Next, you will create a simple python flask application and the associated helm charts required to deploy the application and commit them to source control repository in AWS CodeCommit. Begin by cloning the CodeCommit repository by following the steps below:
Configure your git client to use the AWS CLI CodeCommit credential helper. For UNIX based systems follow instructions here, and for Windows based systems follow instructions here.
Retrieve the repository HTTPS clone URL using the command below:
git clone $CODECOMMIT_CLONE_URL github-actions-demo && cd github-actions-demo
Create the Application
Now that you’ve set up all the required resources, you can begin building your application and its necessary deployment manifests.
Create the app.py file, which serves as the hello world application using the command below:
cat << EOF >app.py
from flask import Flask
app = Flask(__name__)

@app.route('/')
def demoapp():
  return 'Hello from EKS! This application is built using Github Actions on AWS CodeBuild'

if __name__ == '__main__':
  app.run(port=8080,host='0.0.0.0')
EOF
Create a Dockerfile in the same directory as the application using the command below:
cat << EOF > Dockerfile
FROM public.ecr.aws/docker/library/python:alpine3.18
WORKDIR /app
RUN pip install Flask
RUN apk update && apk upgrade --no-cache
COPY app.py .
CMD [ "python3", "app.py" ]
EOF
Initialize the HELM application
helm create demo-app
rm -rf demo-app/templates/*
Create the manifest files required for the deployment accordingly:
deployment.yaml – Contains the blueprint for deploying instances of the application. It includes the desired state and pod template which has the pod specifications like the container image to be used, ports etc.
service.yaml – Describes the service object in Kubernetes and specifies how to access the set of pods running the application. It acts as an internal load balancer to route traffic to pods based on the defined service type (like ClusterIP, NodePort, or LoadBalancer).
ingress.yaml – Defines the ingress rules for accessing the application from outside the Kubernetes cluster. This file maps HTTP and HTTPS routes to services within the cluster, allowing external traffic to reach the correct services.
values.yaml – This file provides the default configuration values for the Helm chart. This file is crucial for customizing the chart to fit different environments or deployment scenarios. The manifest below assumes that the default namespace is configured as the namespace selector for your Fargate profile.
Each phase in a buildspec can contain multiple steps and each step can run commands or run a GitHub Action. Each step runs in its own process and has access to the build filesystem. A step references a GitHub action by specifying the uses directive and optionally the with directive is used to pass arguments required by the action. Alternatively, a step can specify a series of commands using the run directive. It’s worth noting that, because steps run in their own process, changes to environment variables are not preserved between steps.
To pass environment variables between different steps of a build phase, you will need to assign the value to an existing or new environment variable and then writing this to the GITHUB_ENV environment file. Additionally, these environment variables can also be passed across multiple stage in CodePipeline by leveraging the exported variables directive.
Build Specification (Build Stage)
Here, you will create a file called buildspec-build.yml at the root of the repository – In the following buildspec, we leverage GitHub actions in AWS CodeBuild to build the container image and push the image to ECR. The actions used in this buildspec are:
aws-actions/configure-aws-credentials: Accessing AWS APIs requires the action to be authenticated using AWS credentials. By default, the permissions granted to the CodeBuild service role can be used to sign API actions executed during a build. However, when using a GitHub action in CodeBuild, the credentials from the CodeBuild service role need to be made available to subsequent actions (e.g., to log in to ECR, push the image). This action allows leveraging the CodeBuild service role credentials for subsequent actions.
In the buildspec above the variables IMAGE_REPO and IMAGE_TAG are set as exported-variables that will be used in the subsequent deploy stage.
Build Specification (Deploy Stage)
During the deploy stage, you will utilize AWS CodeBuild to deploy the helm manifests to EKS by leveraging the community provided bitovi/deploy-eks-helm action. Furthermore, the alexellis/arkade-get action is employed to install kubectl, which will be used later to describe the ingress controller and retrieve the application URL.
Create a file called buildspec-deploy.yml at the root of the repository as such:
Now check these files in to the remote repository by running the below commands
git add -A && git commit -m "Initial Commit"
git push --set-upstream origin main
Now, let’s verify the deployment of our application using the load balancer URL. Navigate to the CodePipeline console. The pipeline incorporates a manual approval stage and requires a pipeline operator to review and approve the release to deploy the application. Following this, the URL for the deployed application can be conveniently retrieved from the outputs of the pipeline execution.
Viewing the application
Click the execution ID. This should take you to a detailed overview of the most recent execution.
Figure 2 CodePipeline Console showing the pipeline (release) execution ID
Under the Timeline tab, select the ‘Build’ action for the ‘Deploy’ stage.
Figure 3 Navigating to the timeline view and reviewing the details for the deploy stage
Copy the application load balancer URL from the output variables.
Figure 4 Copy the APP_URL from the Output Variables for the Deploy action
Paste the URL into a browser of your choice and you should see the message below.
Figure 5 Preview of the application deployed on Amazon EKS
You can also review the logs for your build and see the GitHub action at work from the AWS CodeBuild console.
Clean up
To avoid incurring future charges, you should clean up the resources that you created:
Delete the application by executing helm, this will remove the ALB that was provisioned
helm uninstall demo-app
Delete the CloudFormation stack (github-actions-demo-base) by executing the below command
In this walkthrough, you have learned how to leverage the powerful combination of GitHub Actions and AWS CodeBuild to simplify and automate the deployment of a Python application on Amazon EKS. This approach not only streamlines your deployment process but also ensures that your application is built and deployed securely. You can extend this pipeline by incorporating additional stages such as testing and security scanning, depending on your project’s needs. Additionally, this solution can be used for other programming languages.
Today customers want to reduce manual operations for deploying and maintaining their infrastructure. The recommended method to deploy and manage infrastructure on AWS is to follow Infrastructure-As-Code (IaC) model using tools like AWS CloudFormation, AWS Cloud Development Kit (AWS CDK) or Terraform.
One of the critical components in terraform is managing the state file which keeps track of your configuration and resources. When you run terraform in an AWS CI/CD pipeline the state file has to be stored in a secured, common path to which the pipeline has access to. You need a mechanism to lock it when multiple developers in the team want to access it at the same time.
In this blog post, we will explain how to manage terraform state files in AWS, best practices on configuring them in AWS and an example of how you can manage it efficiently in your Continuous Integration pipeline in AWS when used with AWS Developer Tools such as AWS CodeCommit and AWS CodeBuild. This blog post assumes you have a basic knowledge of terraform, AWS Developer Tools and AWS CI/CD pipeline. Let’s dive in!
Challenges with handling state files
By default, the state file is stored locally where terraform runs, which is not a problem if you are a single developer working on the deployment. However if not, it is not ideal to store state files locally as you may run into following problems:
When working in teams or collaborative environments, multiple people need access to the state file
Data in the state file is stored in plain text which may contain secrets or sensitive information
Local files can get lost, corrupted, or deleted
Best practices for handling state files
The recommended practice for managing state files is to use terraform’s built-in support for remote backends. These are:
Remote backend on Amazon Simple Storage Service (Amazon S3): You can configure terraform to store state files in an Amazon S3 bucket which provides a durable and scalable storage solution. Storing on Amazon S3 also enables collaboration that allows you to share state file with others.
Remote backend on Amazon S3 with Amazon DynamoDB: In addition to using an Amazon S3 bucket for managing the files, you can use an Amazon DynamoDB table to lock the state file. This will allow only one person to modify a particular state file at any given time. It will help to avoid conflicts and enable safe concurrent access to the state file.
There are other options available as well such as remote backend on terraform cloud and third party backends. Ultimately, the best method for managing terraform state files on AWS will depend on your specific requirements.
When deploying terraform on AWS, the preferred choice of managing state is using Amazon S3 with Amazon DynamoDB.
AWS configurations for managing state files
Create an Amazon S3 bucket using terraform. Implement security measures for Amazon S3 bucket by creating an AWS Identity and Access Management (AWS IAM) policy or Amazon S3 Bucket Policy. Thus you can restrict access, configure object versioning for data protection and recovery, and enable AES256 encryption with SSE-KMS for encryption control.
Next create an Amazon DynamoDB table using terraform with Primary key set to LockID. You can also set any additional configuration options such as read/write capacity units. Once the table is created, you will configure the terraform backend to use it for state locking by specifying the table name in the terraform block of your configuration.
For a single AWS account with multiple environments and projects, you can use a single Amazon S3 bucket. If you have multiple applications in multiple environments across multiple AWS accounts, you can create one Amazon S3 bucket for each account. In that Amazon S3 bucket, you can create appropriate folders for each environment, storing project state files with specific prefixes.
Now that you know how to handle terraform state files on AWS, let’s look at an example of how you can configure them in a Continuous Integration pipeline in AWS.
Architecture
Figure 1: Example architecture on how to use terraform in an AWS CI pipeline
This diagram outlines the workflow implemented in this blog:
The AWS CodeCommit repository contains the application code
The AWS CodeBuild job contains the buildspec files and references the source code in AWS CodeCommit
The AWS Lambda function contains the application code created after running terraform apply
Amazon S3 contains the state file created after running terraform apply. Amazon DynamoDB locks the state file present in Amazon S3
Implementation
Pre-requisites
Before you begin, you must complete the following prerequisites:
Install the latest version of AWS Command Line Interface (AWS CLI)
After cloning, you could see the following folder structure:
Figure 2: AWS CodeCommit repository structure
Let’s break down the terraform code into 2 parts – one for preparing the infrastructure and another for preparing the application.
Preparing the Infrastructure
The main.tf file is the core component that does below:
It creates an Amazon S3 bucket to store the state file. We configure bucket ACL, bucket versioning and encryption so that the state file is secure.
It creates an Amazon DynamoDB table which will be used to lock the state file.
It creates two AWS CodeBuild projects, one for ‘terraform plan’ and another for ‘terraform apply’.
Note – It also has the code block (commented out by default) to create AWS Lambda which you will use at a later stage.
AWS CodeBuild projects should be able to access Amazon S3, Amazon DynamoDB, AWS CodeCommit and AWS Lambda. So, the AWS IAM role with appropriate permissions required to access these resources are created via iam.tf file.
Next you will find two buildspec files named buildspec-plan.yaml and buildspec-apply.yaml that will execute terraform commands – terraform plan and terraform apply respectively.
Modify AWS region in the provider.tf file.
Update Amazon S3 bucket name, Amazon DynamoDB table name, AWS CodeBuild compute types, AWS Lambda role and policy names to required values using variable.tf file. You can also use this file to easily customize parameters for different environments.
With this, the infrastructure setup is complete.
You can use your local terminal and execute below commands in the same order to deploy the above-mentioned resources in your AWS account.
terraform init
terraform validate
terraform plan
terraform apply
Once the apply is successful and all the above resources have been successfully deployed in your AWS account, proceed with deploying your application.
Preparing the Application
In the cloned repository, use the backend.tf file to create your own Amazon S3 backend to store the state file. By default, it will have below values. You can override them with your required values.
bucket = "tfbackend-bucket"
key    = "terraform.tfstate"
region = "eu-central-1"
The repository has sample python code stored in main.py that returns a simple message when invoked.
In the main.tf file, you can find the below block of code to create and deploy the Lambda function that uses the main.py code (uncomment these code blocks).
Now you can deploy the application using AWS CodeBuild instead of running terraform commands locally which is the whole point and advantage of using AWS CodeBuild.
Run the two AWS CodeBuild projects to execute terraform plan and terraform apply again.
Once successful, you can verify your deployment by testing the code in AWS Lambda. To test a lambda function (console):
Open AWS Lambda console and select your function “tf-codebuild”
In the navigation pane, in Code section, click Test to create a test event
Provide your required name, for example “test-lambda”
Accept default values and click Save
Click Test again to trigger your test event “test-lambda”
It should return the sample message you provided in your main.py file. In the default case, it will display “Hello from AWS Lambda !” message as shown below.
Figure 3: Sample Amazon Lambda function response
To verify your state file, go to Amazon S3 console and select the backend bucket created (tfbackend-bucket). It will contain your state file.
Figure 4: Amazon S3 bucket with terraform state file
Open Amazon DynamoDB console and check your table tfstate-lock and it will have an entry with LockID.
Figure 5: Amazon DynamoDB table with LockID
Thus, you have securely stored and locked your terraform state file using terraform backend in a Continuous Integration pipeline.
Cleanup
To delete all the resources created as part of the repository, run the below command from your terminal.
terraform destroy
Conclusion
In this blog post, we explored the fundamentals of terraform state files, discussed best practices for their secure storage within AWS environments and also mechanisms for locking these files to prevent unauthorized team access. And finally, we showed you an example of how efficiently you can manage them in a Continuous Integration pipeline in AWS.
Automated code analysis plays a key role in improving code quality and compliance. Amazon CodeGuru Reviewer provides automated recommendations that can assist developers in identifying defects and deviation from coding best practices. For instance, CodeGuru Security automatically flags potential security vulnerabilities such as SQL injection, hardcoded AWS credentials and cross-site request forgery, to name a few. After becoming aware of these findings, developers can take decisive action to remediate their code.
On the other hand, determining what the best course of action is to address a particular automated recommendation might not always be obvious. For instance, an apprentice developer may not fully grasp what a SQL injection attack means or what makes the code at hand particularly vulnerable. In another situation, the developer reviewing a CodeGuru recommendation might not be the same developer who wrote the initial code. In these cases, the developer will first need to get familiarized with the code and the recommendation in order to take proper corrective action.
By using Generative AI, developers can leverage pre-trained foundation models to gain insights on their code’s structure, the CodeGuru Reviewer recommendation and the potential corrective actions. For example, Generative AI models can generate text content, e.g., to explain a technical concept such as SQL injection attacks or the correct use of a given library. Once the recommendation is well understood, the Generative AI model can be used to refactor the original code so that it complies with the recommendation. The possibilities opened up by Generative AI are numerous when it comes to improving code quality and security.
In this post, we will show how you can use CodeGuru Reviewer and Bedrock to improve the quality and security of your code. While CodeGuru Reviewer can provide automated code analysis and recommendations, Bedrock offers a low-friction environment that enables you to gain insights on the CodeGuru recommendations and to find creative ways to remediate your code.
Solution Overview
The diagram below depicts our approach and the AWS services involved. It works as follows:
1. The developer pushes code to an AWS CodeCommit repository. 2. The repository is associated with CodeGuru Reviewer, so an automated code review is initiated. 3. Upon completion, the CodeGuru Reviewer console displays a list of recommendations for the code base, if applicable. 4. Once aware of the recommendation and the affected code, the developer navigates to the Bedrock console, chooses a foundation model and builds a prompt (we will give examples of prompts in the next session). 5. Bedrock generates content as a response to the prompt, including code generation. 6. The developer might optionally refine the prompt, for example, to gain further insights on the CodeGuru Reviewer recommendation or to request for alternatives to remediate the code. 7. The model can respond with generated code that addresses the issue which can then be pushed back into the repository.
Using Generative AI to Improve Code Quality and Security
Next, we’re going to walk you through a scenario where a developer needs to improve the quality of her code after CodeGuru Reviewer has provided recommendations. But before getting there, let’s choose a code repository and set the Bedrock inference parameters.
A good reference of source repository for exploring CodeGuru Reviewer recommendations is the Amazon CodeGuru Reviewer Python Detector repository. The repository contains a comprehensive list of compliant and non-compliant code which fits well in the context of our discussion.
In terms of Bedrock model, we use Anthropic Claude V1 (v1.3) in our analysis which is specialized in content generation including text and code. We set the required model parameters as follows: temperature=0.5, top_p=0.9, top_k=500, max_tokens=2048. We set temperature and top_p parameters so as to give the model a bit more flexibility to generate responses for the same question. Please check the inference parameter definitions on Bedrock’s user guide for further details on these parameters. Given the randomness level specified by our inference parameters, readers experimenting with the prompts provided in this post might observe slightly different answers than the ones presented.
Requirements
An AWS account with access to CodeCommit, CodeGuru and Bedrock
Save the association ARN value returned after the command is executed (e.g., arn:aws:codeguru-reviewer:xx-xxxx-x:111111111111:association:e85aa20c-41d76-03b-f788-cefd0d2a3590).
Push code to the CodeCommit repository using the codecommit git remote
git push codecommit main:main
Trigger CodeGuru Reviewer to run a repository analysis on the repository’s main branch. Use the repository association ARN you noted in a previous step here.
Navigate to the CodeGuru Reviewer Console to see the various recommendations provided (you might have to wait a few minutes for the code analysis to run).
Amazon CodeGuru Reviewer
On the CodeGuru Reviewer console (see screenshot above), we select the first recommendation on file hashlib_contructor.py, line 12, and take note of the recommendation content: The constructors for the hashlib module are faster than new(). We recommend using hashlib.sha256() instead.
Now let’s extract the affected code. Click on the file name link (hashlib_contructor.py in the figure above) to open the corresponding code in the CodeCommit console.
AWS CodeCommit Repository
The blue arrow in the CodeCommit console above indicates the non-compliant code highlighting the specific line (line 12). We select the wrapping python function from lines 5 through 15 to build our prompt. You may want to experiment reducing the scope to a single line or a given block of lines and check if it yields better responses.
Amazon Bedrock Playground Console
We then navigate to the Bedrock console (see screenshot above).
Search for keyword Bedrock in the AWS console
Select the Bedrock service to navigate to the service console
Choose Playgrounds, then choose Text
Choose model Anthropic Claude V1 (1.3). If you don’t see this model available, please make sure to enable model access.
Set the Inference configuration as shown in the screenshot below including temperature, Top P and the other parameters. Please check the inference parameter definitions on Bedrock’s user guide for further details on these parameters.
Build a Bedrock prompt using three elements, as illustrated in the screenshot below:
The source code copied from CodeCommit
The CodeGuru Reviewer recommendation
A request to refactor the code to address the code analysis finding
A Prompt in the Amazon Bedrock Playground Console
Press the Run button. Notice that Bedrock will automatically add the words Human (at the top) and Assistant (at the bottom) to the prompt. Wait a few seconds and a response is generated (in green). The response includes the refactored code and an explanation on how the code was fixed (see screenshot below).
A Prompt Response (or completion) in the Amazon Bedrock Playground Console
Note that the original code was refactored to use ashlib.sha256() instead of using new in the constructor: hashlib.new(‘sha256’, …). Note that the prompt also asks for an explanation on how the refactored code fixes the issue, so the response includes such details. If we were interested in the refactored code only, we could change the prompt and ask that it returns only the refactored code.
Gaining Insights and Improving Code Quality
So far, our walkthrough showed how to navigate through the CodeCommit, CodeGuru Reviewer and Bedrock consoles to gather relevant content that can be used to build and run a Bedrock prompt. We are now going to explore further prompts to gain insights on the code and the recommendations in order to build more specific prompt to refactor the code. We omit screenshots for brevity. Readers can follow the same process outlined in the previous session.
Learning about the code
Let’s now examine another CodeGuru Reviewer recommendation. Specifically, we want to find the SQL Injection vulnerability raised for file, line 12, as shown below.
Sample non-compliant code
CodeGuru Reviewer provided the following recommendation:
For the sake of the walkthrough, let’s assume the developer reviewing the code above was not the original developer who built the code. We start by asking Bedrock to explain the code, line by line. Note that we have not included the CodeGuru Reviewer recommendation in the prompt this time as our initial goal is to understand the code.
Prompt:
Source Code:
def execute_query_noncompliant(request):
    import sqlite3
    name = request.GET.get("name")
    query = "SELECT * FROM Users WHERE name = " + name + ";"
    with sqlite3.connect("example.db") as connection:
        cursor = connection.cursor()
        # Noncompliant: user input is used without sanitization.
        cursor.execute(query)
        connection.commit()
        connection.close()
Request:
Explain the code logic above line by line.
Response:
Sure, here is a line by line explanation of the code:
def execute_query_noncompliant(request):
This defines a function called execute_query_noncompliant that takes a request as an argument.
import sqlite3
This imports the sqlite3 library to connect to a SQLite database.
name = request.GET.get("name")
This gets a "name" query parameter from the request GET parameters.
query = "SELECT * FROM Users WHERE name = " + name + ";"
This constructs an SQL query string by concatenating the name variable into the query.
So if name was "John", the query would be:
SELECT * FROM Users WHERE name = John;
with sqlite3.connect("example.db") as connection:
This opens a connection to the "example.db" SQLite database.
   cursor = connection.cursor()
This gets a cursor to execute queries on the connection.
    # Noncompliant: user input is used without sanitization.
    cursor.execute(query)
This executes the query on the database. The comment notes that this is noncompliant
because it uses unsanitized user input in the query.
    connection.commit()
    connection.close()
Bedrock provides a line-by-line explanation of the code including the library being used (sqllite3) and a comment about the code using an unsanitized [MOU1] user input. The explanation is detailed helping the developer to understand the code logic and structure.
The developer now has a good understanding of the code. Let’s now gain insights on why and how the code is vulnerable to SQL Injection.
Prompt:
Source Code:
def execute_query_noncompliant(request):
    import sqlite3
    name = request.GET.get("name")
    query = "SELECT * FROM Users WHERE name = " + name + ";"
    with sqlite3.connect("example.db") as connection:
        cursor = connection.cursor()
        # Noncompliant: user input is used without sanitization.
        cursor.execute(query)
        connection.commit()
        connection.close()
Request:
Why is the code above vulnerable to SQL injection?
Response:
The code is vulnerable to SQL injection because it directly concatenates
user input (the name parameter) into an SQL query string. This allows a
malicious user to inject SQL code into the query.
For example, if the name parameter is passed as:

'; DROP TABLE Users; --
Then the resulting SQL query would be:

SELECT * FROM Users WHERE name = ''; DROP TABLE Users; -- ;
This would drop the Users table, causing damage to the database.
To fix this, the user input should be sanitized before being added to the
SQL query string. This can be done by:

Escaping single quotes in the input:
name = request.GET.get("name").replace("'", "''")
query = f"SELECT * FROM Users WHERE name = '{name}';"

Using parameterized queries:
query = "SELECT * FROM Users WHERE name = ?"
cursor.execute(query, (name,))
Again, the response is detailed. It explains that the user input is being concatenated directly into a query string. It gives an example of a SQL injection attack that could cause the Users table to be dropped. It also provides two options to fix the code including escaping single quotes and using parameterized queries.
We continue to dive deep into SQL injection. Let’s build a prompt to gather further examples of possible SQL injection attacks.
Prompt:
Source Code:
def execute_query_noncompliant(request):
    import sqlite3
    name = request.GET.get("name")
    query = "SELECT * FROM Users WHERE name = " + name + ";"
    with sqlite3.connect("example.db") as connection:
        cursor = connection.cursor()
        # Noncompliant: user input is used without sanitization.
        cursor.execute(query)
        connection.commit()
        connection.close()
Request:
Provide examples of SQL injection for the code above
Response:
Here are some examples of SQL injection for that code:

If the name parameter is passed as:
'; DROP TABLE Users; --

Then the executed query would be:
SELECT * FROM Users WHERE name = ''; DROP TABLE Users; -- ;
This would drop the Users table.

If the name parameter is passed as:
OR 1=1; --

Then the executed query would be:
SELECT * FROM Users WHERE name = OR 1=1; -- ;
This would select all rows from the Users table.

If the name parameter is passed as:
'; UPDATE Users SET password = 'hacked' WHERE 1=1; --

Then the executed query would be:
SELECT * FROM Users WHERE name = ''; UPDATE Users SET password = 'hacked' WHERE 1=1; -- ;

This would update all passwords in the Users table to 'hacked'.
So in summary, without sanitizing the input, this code is vulnerable to SQL injection attacks
that can delete data, access unauthorized data, modify data, etc. The input should be sanitized
by escaping special characters before using in the SQL query.
Bedrock responds by including two new forms of SQL injection attacks, one that lists all records from the Users table and another one that updates all passwords in the table.
At this point, the developer has learned a lot about the code, SQL injection attacks and the CodeGuru Reviewer recommendation. It’s now time to build a prompt to fix the code. We leverage what we learned in previous prompts including the term “parameterized queries”, as suggested by CodeGuru Reviewer, to build a specific request in the prompt. Note that we have also included the CodeGuru Reviewer recommendation in the prompt this time.
Prompt:
Source Code:
def execute_query_noncompliant(request):
    import sqlite3
    name = request.GET.get("name")
    query = "SELECT * FROM Users WHERE name = " + name + ";"
    with sqlite3.connect("example.db") as connection:
        cursor = connection.cursor()
        # Noncompliant: user input is used without sanitization.
        cursor.execute(query)
        connection.commit()
        connection.close()

Code Analysis Finding:
It seems that you are constructing an SQL query using formatted strings. This could
make your code vulnerable to SQL injection attacks, which can lead to loss of critical
data. We recommend that you use parameterized queries for constructing SQL queries.
[Learn more](https://cwe.mitre.org/data/definitions/89.html)
Request:
Fix the code above using parameterized query.
Response:
Here is the fixed code using parameterized query:

def execute_query_compliant(request):
   import sqlite3
   name = request.GET.get("name")
   query = "SELECT * FROM Users WHERE name = ?"
   with sqlite3.connect("example.db") as connection:
      cursor = connection.cursor()
      # Compliant: Parameterized query prevents SQL injection
      cursor.execute(query, (name,))
      connection.commit()
      connection.close()

Instead of concatenating the user input directly into the SQL string, we use a ?
placeholder and pass the user input as a tuple argument to cursor.execute(). This
prevents SQL injection since the input is treated as a literal value rather than
part of the SQL syntax.
The response includes a refactored code that uses a parameterized query to prevent SQL injection attacks (cursor.execute(query, (name,)).
We’re excited with the improvements in the code and now decide to go beyond fixing the SQL injection vulnerability. The next prompt asks Bedrock to make two specific improvements to the refactored.
Add python type hints
Add exception handling
Prompt:
Source Code:
def execute_query_compliant(request):
   import sqlite3
   name = request.GET.get("name")
   query = "SELECT * FROM Users WHERE name = ?"
   with sqlite3.connect("example.db") as connection:
      cursor = connection.cursor()
      # Compliant: Parameterized query prevents SQL injection
      cursor.execute(query, (name,))
      connection.commit()
      connection.close()

Request:
Add exception handling and type hints to the code above.
Response:
Here is the code with exception handling and type hints:

def execute_query_compliant(request: Request) -> None:
   """Executes a compliant SQL query"""
   import sqlite3
   name = request.GET.get("name")
   query = "SELECT * FROM Users WHERE name = ?"
   try:
      with sqlite3.connect("example.db") as connection:
          cursor: sqlite3.Cursor = connection.cursor()
          # Compliant: Parameterized query prevents SQL injection
          cursor.execute(query, (name,))
          connection.commit()
   except sqlite3.Error as e:
      print(f"SQLite error: {e}")
   finally:
      connection.close()

I added:

Type hints:
request: Request indicating the request parameter is of type Request

cursor: sqlite3.Cursor indicating cursor is of type sqlite3.Cursor
Exception handling:
A try/except block catching sqlite3.Error exceptions.
A finally block ensuring the connection is always closed.
Let me know if you would like me to explain anything in the updated code!
Note that the generated code now includes a try/except/finally block to handle exceptions and type hints for the function parameter and return value.
However, some variables such as name and query are missing type hints. Here, we’d like to call out the importance of human supervision on automatically generated responses. The developer tweaks the previous prompt to ask that “all variables” have type hint added to them.
Prompt:
Source Code:
def execute_query_compliant(request):
   import sqlite3
   name = request.GET.get("name")
   query = "SELECT * FROM Users WHERE name = ?"
   with sqlite3.connect("example.db") as connection:
      cursor = connection.cursor()
      # Compliant: Parameterized query prevents SQL injection
      cursor.execute(query, (name,))
      connection.commit()
      connection.close()

Request:
Add exception handling and type hints to all variables in the code above.
Response:
Here is the code with exception handling and type hints:

def execute_query_compliant(request: Request) -> None:
   """Executes a compliant SQL query"""
   import sqlite3
   name: str = request.GET.get("name")
   query: str = "SELECT * FROM Users WHERE name = ?"
   try:
      with sqlite3.connect("example.db") as connection:
         cursor: sqlite3.Cursor = connection.cursor()
         # Compliant: Parameterized query prevents SQL injection
         cursor.execute(query, (name,))
         connection.commit()
   except sqlite3.Error as e:
        print(f"SQLite error: {e}")
   finally:
        connection.close()
The new response refactors the code making sure all variables now have type hint. This shows how little changes to a prompt can produce much better results. In our example, by adding “all variables” to the prompt caused the response to indeed add type hints to all variables in the code provided.
Here is a summary of the activities performed via Bedrock prompting:
Gain insights on the code and the CodeGuru recommendation
Explain the code logic above line by line.
Why is the code above vulnerable to SQL injection?
Provide examples of SQL injection for the code above
Refactor and Improve the Code
Fix the code above using parameterized query
Add exception handling and type hints to the code above
Add exception handling and type hints to all variables in the code above.
The main takeaway is that by using a static analysis and security testing tool such as CodeGuru Reviewer in combination with a Generative AI service such as Bedrock, developers can significantly improve their code towards best practices and enhanced security. In addition, prompts which are more specific normally yield better results and that’s when CodeGuru Reviewer can be really helpful as it gives developers hints and keywords that can be used to build powerful prompts.
Cleaning Up
Don’t forget to delete the CodeCommit repository created if you no longer need it.
In this blog, we discussed how CodeGuru Reviewer and Bedrock can be used in combination to improve code quality and security. While CodeGuru Reviewer provides a rich set of recommendations through automated code reviews, Bedrock gives developers the ability to gain deeper insights on the code and the recommendations as well as to refactor the original code to meet compliance and best practices.
We encourage readers to explore new Bedrock prompts beyond the ones introduced in this post and share their feedback with us.
Note: at the time of the writing of this post, Bedrock’s Anthropic Claude 2.0 model was not yet available so we invite readers to also experiment with the prompts provided using that model.
The AWS Cloud Development Kit (AWS CDK) is a popular open source toolkit that allows developers to create their cloud infrastructure using high level programming languages. AWS CDK comes bundled with a construct called CDK Pipelines that makes it easy to set up continuous integration, delivery, and deployment with AWS CodePipeline. The CDK Pipelines construct does all the heavy lifting, such as setting up appropriate AWS IAM roles for deployment across regions and accounts, Amazon Simple Storage Service (Amazon S3) buckets to store build artifacts, and an AWS CodeBuild project to build, test, and deploy the app. The pipeline deploys a given CDK application as one or more AWS CloudFormation stacks.
With CloudFormation stacks, there is the possibility that someone can manually change the configuration of stack resources outside the purview of CloudFormation and the pipeline that deploys the stack. This causes the deployed resources to be inconsistent with the intent in the application, which is referred to as “drift”, a situation that can make the application’s behavior unpredictable. For example, when troubleshooting an application, if the application has drifted in production, it is difficult to reproduce the same behavior in a development environment. In other cases, it may introduce security vulnerabilities in the application. For example, an AWS EC2 SecurityGroup that was originally deployed to allow ingress traffic from a specific IP address might potentially be opened up to allow traffic from all IP addresses.
CloudFormation offers a drift detection feature for stacks and stack resources to detect configuration changes that are made outside of CloudFormation. The stack/resource is considered as drifted if its configuration does not match the expected configuration defined in the CloudFormation template and by extension the CDK code that synthesized it.
In this blog post you will see how CloudFormation drift detection can be integrated as a pre-deployment validation step in CDK Pipelines using an event driven approach.
Amazon EventBridge is a serverless AWS service that offers an agile mechanism for the developers to spin up loosely coupled, event driven applications at scale. EventBridge supports routing of events between services via an event bus. EventBridge out of the box supports a default event bus for each account which receives events from AWS services. Last year, CloudFormation added a new feature that enables event notifications for changes made to CloudFormation-based stacks and resources. These notifications are accessible through Amazon EventBridge, allowing users to monitor and react to changes in their CloudFormation infrastructure using event-driven workflows. Our solution leverages the drift detection events that are now supported by EventBridge. The following architecture diagram depicts the flow of events involved in successfully performing drift detection in CDK Pipelines.
Architecture diagram
The user starts the pipeline by checking code into an AWS CodeCommit repo, which acts as the pipeline source. We have configured drift detection in the pipeline as a custom step backed by a lambda function. When the drift detection step invokes the provider lambda function, it first starts the drift detection on the CloudFormation stack Demo Stack and then saves the drift_detection_id along with pipeline_job_id in a DynamoDB table. In the meantime, the pipeline waits for a response on the status of drift detection.
The EventBridge rules are set up to capture the drift detection state change events for Demo Stack that are received by the default event bus. The callback lambda is registered as the intended target for the rules. When drift detection completes, it triggers the EventBridge rule which in turn invokes the callback lambda function with stack status as either DRIFTED or IN SYNC. The callback lambda function pulls the pipeline_job_id from DynamoDB and sends the appropriate status back to the pipeline, thus propelling the pipeline out of the wait state. If the stack is in the IN SYNC status, the callback lambda sends a success status and the pipeline continues with the deployment. If the stack is in the DRIFTED status, callback lambda sends failure status back to the pipeline and the pipeline run ends up in failure.
Solution Deep Dive
The solution deploys two stacks as shown in the above architecture diagram
CDK Pipelines stack
Pre-requisite stack
The CDK Pipelines stack defines a pipeline with a CodeCommit source and drift detection step integrated into it. The pre-requisite stack deploys following resources that are required by the CDK Pipelines stack.
A Lambda function that implements drift detection step
A DynamoDB table that holds drift_detection_id and pipeline_job_id
An Event bridge rule to capture “CloudFormation Drift Detection Status Change” event
A callback lambda function that evaluates status of drift detection and sends status back to the pipeline by looking up the data captured in DynamoDB.
The pre-requisites stack is deployed first, followed by the CDK Pipelines stack.
Defining drift detection step
CDK Pipelines offers a mechanism to define your own step that requires custom implementation. A step corresponds to a custom action in CodePipeline such as invoke lambda function. It can exist as a pre or post deployment action in a given stage of the pipeline. For example, your organization’s policies may require its CI/CD pipelines to run a security vulnerability scan as a prerequisite before deployment. You can build this as a custom step in your CDK Pipelines. In this post, you will use the same mechanism for adding the drift detection step in the pipeline.
You start by defining a class called DriftDetectionStep that extends Step and implements ICodePipelineActionFactory as shown in the following code snippet. The constructor accepts 3 parameters stackName, account, region as inputs. When the pipeline runs the step, it invokes the drift detection lambda function with these parameters wrapped inside userParameters variable. The function produceAction() adds the action to invoke drift detection lambda function to the pipeline stage.
Please note that the solution uses an SSM parameter to inject the lambda function ARN into the pipeline stack. So, we deploy the provider lambda function as part of pre-requisites stack before the pipeline stack and publish its ARN to the SSM parameter. The CDK code to deploy pre-requisites stack can be found here.
export class DriftDetectionStep
    extends Step
    implements pipelines.ICodePipelineActionFactory
{
    constructor(
        private readonly stackName: string,
        private readonly account: string,
        private readonly region: string
    ) {
        super(`DriftDetectionStep-${stackName}`);
    }

    public produceAction(
        stage: codepipeline.IStage,
        options: ProduceActionOptions
    ): CodePipelineActionFactoryResult {
        // Define the configuraton for the action that is added to the pipeline.
        stage.addAction(
            new cpactions.LambdaInvokeAction({
                actionName: options.actionName,
                runOrder: options.runOrder,
                lambda: lambda.Function.fromFunctionArn(
                    options.scope,
                    `InitiateDriftDetectLambda-${this.stackName}`,
                    ssm.StringParameter.valueForStringParameter(
                        options.scope,
                        SSM_PARAM_DRIFT_DETECT_LAMBDA_ARN
                    )
                ),
                // These are the parameters passed to the drift detection step implementaton provider lambda
                userParameters: {
                    stackName: this.stackName,
                    account: this.account,
                    region: this.region,
                },
            })
        );
        return {
            runOrdersConsumed: 1,
        };
    }
}
Configuring drift detection step in CDK Pipelines
Here you will see how to integrate the previously defined drift detection step into CDK Pipelines. The pipeline has a stage called DemoStage as shown in the following code snippet. During the construction of DemoStage, we declare drift detection as the pre-deployment step. This makes sure that the pipeline always does the drift detection check prior to deployment.
Please note that for every stack defined in the stage; we add a dedicated step to perform drift detection by instantiating the class DriftDetectionStep detailed in the prior section. Thus, this solution scales with the number of stacks defined per stage.
Here you will go through the deployment steps for the solution and see drift detection in action.
Deploy the pre-requisites stack
Clone the repo from the GitHub location here. Navigate to the cloned folder and run script script-deploy.sh You can find detailed instructions in README.md
Deploy the CDK Pipelines stack
Clone the repo from the GitHub location here. Navigate to the cloned folder and run script script-deploy.sh. This deploys a pipeline with an empty CodeCommit repo as the source. The pipeline run ends up in failure, as shown below, because of the empty CodeCommit repo.
Next, check in the code from the cloned repo into the CodeCommit source repo. You can find detailed instructions on that in README.md This triggers the pipeline and pipeline finishes successfully, as shown below.
The pipeline deploys two stacks DemoStackA and DemoStackB. Each of these stacks creates an S3 bucket.
Demonstrate drift detection
Locate the S3 bucket created by DemoStackA under resources, navigate to the S3 bucket and modify the tag aws-cdk:auto-delete-objects from true to false as shown below
Now, go to the pipeline and trigger a new execution by clicking on Release Change
The pipeline run will now end in failure at the pre-deployment drift detection step.
Cleanup
Please follow the steps below to clean up all the stacks.
Navigate to S3 console and empty the buckets created by stacks DemoStackA and DemoStackB.
Navigate to the CloudFormation console and delete stacks DemoStackA and DemoStackB, since deleting CDK Pipelines stack does not delete the application stacks that the pipeline deploys.
Delete the CDK Pipelines stack cdk-drift-detect-demo-pipeline
Delete the pre-requisites stack cdk-drift-detect-demo-drift-detection-prereq
Conclusion
In this post, I showed how to add a custom implementation step in CDK Pipelines. I also used that mechanism to integrate a drift detection check as a pre-deployment step. This allows us to validate the integrity of a CloudFormation Stack before its deployment. Since the validation is integrated into the pipeline, it is easier to manage the solution in one place as part of the overarching pipeline. Give the solution a try, and then see if you can incorporate it into your organization’s delivery pipelines.
About the author:
Damodar Shenvi Wagle is a Senior Cloud Application Architect at AWS Professional Services. His areas of expertise include architecting serverless solutions, CI/CD, and automation.
Load testing is a foundational pillar of building resilient applications. Today, load testing practices across many organizations are often based on desktop tools, where someone must manually run the performance tests and validate the results before a software release can be promoted to production. This leads to increased time to market for new features and products. Load testing applications in automated CI/CD pipelines provides the following benefits:
Early and automated feedback on performance thresholds based on clearly defined benchmarks.
Consistent and reliable load testing process for every feature release.
Reduced overall time to market due to eliminated manual load testing effort.
Improved overall resiliency of the production environment.
The ability to rapidly identify and document bottlenecks and scaling limits of the production environment.
The AWS Cloud Development Kit (AWS CDK) is an open-source software development framework to define cloud infrastructure in code and provision it through AWS CloudFormation. AWS CDK Pipelines is a construct library module for continuous delivery of AWS CDK applications, powered by AWS CodePipeline. AWS CDK Pipelines can automatically build, test, and deploy the new version of your CDK app whenever the new source code is checked in.
Distributed Load Testing is an AWS Solution that automates software applications testing at scale to help you identify potential performance issues before their release. It creates and simulates thousands of users generating transactional records at a constant pace without the need to provision servers or instances.
Prerequisites
To deploy and test this solution, you will need:
AWS Command Line Interface (AWS CLI): This tutorial assumes that you have configured the AWS CLI on your workstation. Alternatively, you can use also use AWS CloudShell.
AWS CDK V2: This tutorial assumes that you have installed AWS CDK V2 on your workstation or in the CloudShell environment.
Solution Overview
In this solution, we create a CI/CD pipeline using AWS CDK Pipelines and use it to deploy a sample RESTful CDK application in two environments; development and production. We load test the application using AWS Distributed Load Testing Solution in the development environment. Based on the load test result, we either fail the pipeline or proceed to production deployment. You may consider running the load test in a dedicated testing environment that mimics the production environment.
For demonstration purposes, we use the following metrics to validate the load test results.
Average Response Time – the average response time, in seconds, for all the requests generated by the test. In this blog post we define the threshold for average response time to 1 second.
Error Count – the total number of errors. In this blog post, we define the threshold for for total number of errors to 1.
For your application, you may consider using additional metrics from the Distributed Load Testing solution documentation to validate your load test.
The AWS Lambda (Lambda) function in the architecture contains a 500 millisecond sleep statement to add latency to the API response.
Typescript code for starting the load test and validating the test results. This code is executed in the ‘Load Test’ step of the ‘Development Deployment’ stage. It starts a load test against the sample restful application endpoint and waits for the test to finish. For demonstration purposes, the load test is started with the following parameters:
Concurrency: 1
Task Count: 1
Ramp up time: 0 secs
Hold for: 30 sec
End point to test: endpoint for the sample RESTful application.
For the purposes of this blog, we deploy the CI/CD pipeline, the RESTful application and the AWS Distributed Load Testing solution into the same AWS account. In your environment, you may consider deploying these stacks into separate AWS accounts based on your security and governance requirements.
To deploy the solution components
Follow the instructions in the the AWS Distributed Load Testing solution Automated Deployment guide to deploy the solution. Note down the value of the CloudFormation output parameter ‘DLTApiEndpoint’. We will need this in the next steps. Proceed to the next step once you are able to login to the User Interface of the solution.
Deploy the CloudFormation stack for the CI/CD pipeline. This step will also commit the AWS CDK code for the sample RESTful application stack and start the application deployment.
cd pipeline && cdk bootstrap && cdk deploy --require-approval never
Follow the below steps to view the load test results:
Open the AWS CodePipeline console.
Click on the pipeline named “blog-pipeline”.
Observe that one of the stages (named ‘LoadTest’) in the CI/CD pipeline (that was provisioned by the CloudFormation stack in the previous step) executes a load test against the application Development environment.
Click on the details of the ‘LoadTest’ step to view the test results. Notice that the load test succeeded.
Change the response time threshold
In this step, we will modify the response time threshold from 1 second to 200 milliseconds in order to introduce a load test failure. Remember from the steps earlier that the Lambda function code has a 500 millisecond sleep statement to add latency to the API response time.
From the AWS Console and then go to CodeCommit. The source for the pipeline is a CodeCommit repository named “blog-repo”.
Click on the “blog-repo” repository, and then browse to the “pipeline” folder. Click on file ‘loadTestEnvVariables.json’ and then ‘Edit’.
Set the response time threshold to 200 milliseconds by changing attribute ‘AVG_RT_THRESHOLD’ value to ‘.2’. Click on the commit button. This will start will start the CI/CD pipeline.
Go to CodePipeline from the AWS console and click on the ‘blog-pipeline’.
Observe the ‘LoadTest’ step in ‘Development-Deploy’ stage will fail in about five minutes, and the pipeline will not proceed to the ‘Production-Deploy’ stage.
Click on the details of the ‘LoadTest’ step to view the test results. Notice that the load test failed.
Log into the Distributed Load Testing Service console. You will see two tests named ‘sampleScenario’. Click on each of them to see the test result details.
Cleanup
Delete the CloudFormation stack that deployed the sample application.
From the AWS Console, go to CloudFormation and delete the stacks ‘Production-Deploy-Application’ and ‘Development-Deploy-Application’.
Delete the CI/CD pipeline.
cd pipeline && cdk destroy
Delete the Distributed Load Testing Service CloudFormation stack.
From CloudFormation console, delete the stack for Distributed Load Testing service that you created earlier.
Conclusion
In the post above, we demonstrated how to automatically load test your applications in a CI/CD pipeline using AWS CDK Pipelines and AWS Distributed Load Testing solution. We defined the performance bench marks for our application as configuration. We then used these benchmarks to automatically validate the application performance prior to production deployment. Based on the load test results, we either proceeded to production deployment or failed the pipeline.
DevOps has revolutionized software development and operations by fostering collaboration, automation, and continuous improvement. By bringing together development and operations teams, organizations can accelerate software delivery, enhance reliability, and achieve faster time-to-market.
In this blog post, we will explore the best practices and architectural considerations for implementing DevOps with Amazon Web Services (AWS), enabling you to build efficient and scalable systems that align with DevOps principles. The Let’s Architect! team wants to share useful resources that help you to optimize your software development and operations.
Distributed systems are adopted from enterprises more frequently now. When an organization wants to leverage distributed systems’ characteristics, it requires a mindset and approach shift, akin to a new model for software development lifecycle.
In this re:Invent 2021 video, Emily Freeman, now Head of Community Engagement at AWS, shares with us the insights gained in the trenches when adapting a new software development lifecycle that will help your organization thrive using distributed systems.
Designing effective DevOps workflows is necessary for achieving seamless collaboration between development and operations teams. The Amazon Builders’ Library offers a wealth of guidance on designing DevOps workflows that promote efficiency, scalability, and reliability. From continuous integration and deployment strategies to configuration management and observability, this resource covers various aspects of DevOps workflow design. By following the best practices outlined in the Builders’ Library, you can create robust and scalable DevOps workflows that facilitate rapid software delivery and smooth operations.
Cloud fitness functions provide a powerful mechanism for driving evolutionary architecture within your DevOps practices. By defining and measuring architectural fitness goals, you can continuously improve and evolve your systems over time.
This AWS Architecture Blog post delves into how AWS services, like AWS Lambda, AWS Step Functions, and Amazon CloudWatch can be leveraged to implement cloud fitness functions effectively. By integrating these services into your DevOps workflows, you can establish an architecture that evolves in alignment with changing business needs: improving system resilience, scalability, and maintainability.
Achieving consistent deployments across multiple regions is a common challenge. This AWS DevOps Blog post demonstrates how to use Terraform, AWS CodePipeline, and infrastructure-as-code principles to automate Multi-Region deployments effectively. By adopting this approach, you can demonstrate the consistent infrastructure and application deployments, improving the scalability, reliability, and availability of your DevOps practices.
The post also provides practical examples and step-by-step instructions for implementing Multi-Region deployments with Terraform and AWS services, enabling you to leverage the power of infrastructure-as-code to streamline DevOps workflows.
Last week the Developer Tools team announced that AWS CodeBuild now supports GitHub Actions. AWS CodeBuild is a fully managed continuous integration service that allows you to build and test code. CodeBuild builds are defined as a collection of build commands and related settings, in YAML format, called a BuildSpec. You can now define GitHub Actions steps directly in the BuildSpec and run them alongside CodeBuild commands. In this post, I will use the Liquibase GitHub Action to deploy changes to an Amazon Aurora database in a private subnet.
Background
The GitHub Marketplace includes a large catalog of actions developed by third-parties and the open-source community. At the time of writing, there are nearly 20,000 actions available in the marketplace. Using an action from the marketplace can save you time and effort that would be spent scripting the installation and configuration of various tools required in the build process.
While I love GitHub actions, I often what to run my build in AWS. For example, I might want to access a resource in a private VPC or simply reduce the latency between the build service and my resources. I could accomplish this by hosting a GitHub Action Runner on Amazon Elastic Compute Cloud (Amazon EC2). However, hosting a GitHub Action runner requires additional effort to configure and maintain the environment that hosts the runner.
AWS CodeBuild is a fully managed continuous integration service. CodeBuild does not require ongoing maintenance and it can access resources in a private subnet. You can now use GitHub Actions in AWS CodeBuild. This feature provides the simplified configuration and management of CodeBuild with the rich marketplace of GitHub Actions. In the following section, I will explain how to configure CodeBuild to run a GitHub Action.
Walkthrough
In this walkthrough, I will configure AWS CodeBuild to use the Liquibase GitHub Action to deploy changelogs to a PostgreSQL database hosted on Amazon Aurora in a private subnet. As shown in the following image, AWS CodeBuild will be configured to run in a private subnet along with my Aurora instance. First, CodeBuild will download the GitHub action using a NAT Gateway to access the internet. Second, CodeBuild will apply the changelog to the Aurora instance in the private subnet.
I already have a GitHub repository with the Liquibase configuration properties and changelogs shown in the following image. Liquibase configuration is not the focus of this blog post, but you can read more in Getting Started with Liquibase. My source also includes the buildspec.yaml file which I will explain later in this post.
To create my build project, I open CodeBuild in the AWS Console and select Create build project. Then I provide a name and optional description for the build. My project is named liquibase-blog-post.
Once I have successfully connected to GitHub, I can paste the URL to my repository as shown in the following image.
I configure my build environment to use the standard build environment on Amazon Linux 2. GitHub actions are built using either JavaScript or a Docker container. If the action uses a Docker container, you must enable the Privileged flag. The Liquibase image is using a Docker container, therefore, I check the box to enabled privileged mode.
For the VPC configuration, I select the VPC and private subnet where my Aurora instance is hosted and then click Validate VPC Settings to ensure my configuration is correct.
My Buildspec file is included I the source. Therefore, I select Use a buildspec file and enter the path to the buildspec file in the repository.
My buildspec.yaml file includes the following content. Notice that the pre_build phase incudes a series of commands. Commands have always been supported in CodeBuild and include a series of command line commands to run. In this case, I am simply logging a few environment variables for later debugging.
Also notice that the build phase incudes a series of steps. Steps are new, and are used to run GitHub Actions. Each build phase supports either a list of commands, or a list of steps, but not both. In this example, I am specifying the Liquibase Update Action (liquibase-github-actions/update) with a few configuration parameters. You can see a full list of parameters in the Liquibase Update Action repository on GitHub.
I want to call you attention to the environment variables used in my buildspec.yml. Note that I pass the URL and PASSWORD for my database as environment variables. This allows me easily change these values from one environment to another. I have configured these environment variables in the CodeBuild project definition as shown in the following image. The URL is configured as Plaintext and the PASSWORD is configured as Secrets Manager. Running the GitHub Action in CodeBuild has the added advantage that I easily access secrets stored in AWS Secrets Manager and configuration data stored in AWS Systems Manager Parameter Store.
It is also important to note that the syntax use to access environment variables in the buildspec.yaml is different when using a GitHub Action. GitHub Actions access environment variables using the environment context. Therefore, in the pre_build phase, I am using CodeBuild syntax, in the format $NAME. However, the in the build phase, I am using GitHub syntax, in the format ${{ env:NAME}}.
With the configuration complete, I select Create build project and then manually start a build to test the configuration. In the following example you can see the logs from the Liquibase update. Notice that two changesets have been successfully applied to the database.
If I connect to the Aurora database and describe the tables you can see that Liquibase has created the actor table (as defined in the Liquibase Quick Start) along with the Liquibase audit tables databasechangelog and databasechangeloglock. Everything is working just as I expected, and I did not have to install and configure Liquibase!
mydatabase=> \dt
List of relations
Schema  |         Name          | Type  |  Owner
--------+-----------------------+-------+----------
public  | actor                 | table | postgres
public  | databasechangelog     | table | postgres
public  | databasechangeloglock | table | postgres
(3 rows)
In this example, I showed you how to update an Aurora database in a private subnet using a the Liquibase GitHub Action running in CodeBuild. GitHub Actions provide a rich catalog of preconfigured actions simplifying the configuration. CodeBuild provides a managed service that simplifies the configuration and maintenance of my build environment. Used together I can get the best features of both CodeBuild and GitHub Actions.
Cleanup
In this walkthrough I showed you how to create a CodeBuild project. If you no longer need the project, you can simply delete it in the console. If you created other resources, for example an Aurora database, that were not explained in this post, you should delete those as well.
Conclusion
The GitHub Marketplace includes a catalog of nearly 20,000 actions developed by third-parties and the open-source community. AWS CodeBuild is a fully managed continuous integration service that integrates tightly with other AWS services. In this post I used the GitHub Action for Liquibase to deploy an update to a database in a private subnet. I am excited to see what you will do with support for GitHub Actions in CodeBuild. You can read more about this exciting new feature in GitHub Action runner in AWS CodeBuild.
Pull Requests play a critical part in the software development process. They ensure that a developer’s proposed code changes are reviewed by relevant parties before code is merged into the main codebase. This is a standard procedure that is followed across the globe in different organisations today. However, pull requests often require code reviewers to read through a great deal of code and manually check it against quality and security standards. These manual reviews can lead to problematic code being merged into the main codebase if the reviewer overlooks any problems.
To help solve this problem, we recommend using Amazon CodeGuru Reviewer to assist in the review process. CodeGuru Reviewer identifies critical defects and deviation from best practices in your code. It provides recommendations to remediate its findings as comments in your pull requests, helping reviewers miss fewer problems that may have otherwise made into production. You can easily integrate your repositories in AWS CodeCommit with Amazon CodeGuru Reviewer following these steps.
The purpose of this post isn’t, however, to show you CodeGuru Reviewer. Instead, our aim is to help you achieve automated code reviews with your pull requests if you already have a code scanning tool and need to continue using it. In this post, we will show you step-by-step how to add automation to the pull request review process using your code scanning tool with AWS CodeCommit (as source code repository) and AWS CodeBuild (to automatically review code using your code reviewer). After following this guide, you should be able to give developers automatic feedback on their code changes and augment manual code reviews so fewer problems make it into your main codebase.
Solution Overview
The solution comprises of the following components:
AWS CodeCommit: AWS service to host private Git repositories.
Amazon EventBridge: AWS service to receive pullRequestCreated and pullRequestSourceBranchUpdated events and trigger Amazon EventBridge rule.
AWS CodeBuild: AWS service to perform code review and send the result to AWS CodeCommit repository as pull request comment.
The following diagram illustrates the architecture:
Figure 1. Architecture Diagram of the proposed solution in the blog
Developer raises a pull request against the main branch of the source code repository in AWS CodeCommit.
The pullRequestCreated event is received by the default event bus.
The default event bus triggers the Amazon EventBridge rule which is configured to be triggered on pullRequestCreated and pullRequestSourceBranchUpdated events.
The EventBridge rule triggers AWS CodeBuild project.
The AWS CodeBuild project runs the code quality check using customer’s choice of tool and sends the results back to the pull request as comments. Based on the result, the AWS CodeBuild project approves or rejects the pull request automatically.
Walkthrough
The following steps provide a high-level overview of the walkthrough:
Create a source code repository in AWS CodeCommit.
Create and associate an approval rule template.
Create AWS CodeBuild project to run the code quality check and post the result as pull request comment.
Create an Amazon EventBridge rule that reacts to AWS CodeCommit pullRequestCreated and pullRequestSourceBranchUpdated events for the repository created in step 1 and set its target to AWS CodeBuild project created in step 3.
Create a feature branch, add a new file and raise a pull request.
Verify the pull request with the code review feedback in comment section.
1. Create a source code repository in AWS CodeCommit
Create an empty test repository in AWS CodeCommit by following these steps. Once the repository is created you can add files to your repository following these steps. If you create or upload the first file for your repository in the console, a branch is created for you named main. This branch is the default branch for your repository. If you are using a Git client instead, consider configuring your Git client to use main as the name for the initial branch. This blog post assumes the default branch is named as main.
2. Create and associate an approval rule template
Create an AWS CodeCommit approval rule template and associate it with the code repository created in step 1 following these steps.
3. Create AWS CodeBuild project to run the code quality check and post the result as pull request comment
This blog post is based on the assumption that the source code repository has JavaScript code in it, so it uses jshint as a code analysis tool to review the code quality of those files. However, users can choose a different tool as per their use case and choice of programming language.
Source: Choose the AWS CodeCommit repository created in step 1 as the source provider.
Environment: Select the latest version of AWS managed image with operating system of your choice. Choose New service role option to create the service IAM role with default permissions.
Buildspec: Use below build specification. Replace <NODEJS_VERSION> with the latest supported nodejs runtime version for the image selected in previous step. Replace <REPOSITORY_NAME> with the repository name created in step 1. The below spec installs the jshint package, creates a jshint config file with a few sample rules, runs it against the source code in the pull request commit, posts the result as comment to the pull request page and based on the results, approves or rejects the pull request automatically.
4. Create an Amazon EventBridge rule that reacts to AWS CodeCommit pullRequestCreated and pullRequestSourceBranchUpdated events for the repository created in step 1 and set its target to AWS CodeBuild project created in step 3
Follow these steps to create an Amazon EventBridge rule that gets triggered whenever a pull request is created or updated using the following event pattern. Replace the <REGION>, <ACCOUNT_ID> and <REPOSITORY_NAME> placeholders with the actual values. Select target of the event rule as AWS CodeBuild project created in step 3.
5. Create a feature branch, add a new file and raise a pull request
Create a feature branch following these steps. Push a new file called “index.js” to the root of the repository with the below content.
function greet(dayofweek) {
  if (dayofweek == "Saturday" || dayofweek == "Sunday") {
    console.log("Have a great weekend");
  } else {
    console.log("Have a great day at work");
  }
}
Now raise a pull request using the feature branch as source and main branch as destination following these steps.
6. Verify the pull request with the code review feedback in comment section
As soon as the pull request is created, the AWS CodeBuild project created in step 3 above will be triggered which will run the code quality check and post the results as a pull request comment. Navigate to the AWS CodeCommit repository pull request page in AWS Management Console and check under the Activity tab to confirm the automated code review result being displayed as the latest comment.
The pull request comment submitted by AWS CodeBuild highlights 6 errors in the JavaScript code. The errors on lines first and third are based on the jshint rule “eqeqeq”. It recommends to use strict equality operator (“===”) instead of the loose equality operator (“==”) to avoid type coercion. The errors on lines second, fourth and fifth are based on jshint rule “quotmark” which recommends to use single quotes with strings instead of double quotes for better readability. These jshint rules are defined in AWS CodeBuild project’s buildspec in step 3 above.
In this blog post we’ve shown how using AWS CodeCommit and AWS CodeBuild services customers can automate their pull request review process by utilising Amazon EventBridge events and using their own choice of code quality tool. This simple solution also makes it easier for the human reviewers by providing them with automated code quality results as input and enabling them to focus their code review more on business logic code changes rather than static code quality issues.
In this blog post, we will explore the process of creating a Continuous Integration/Continuous Deployment (CI/CD) pipeline for a .NET AWS Lambda function using the CDK Pipelines. We will cover all the necessary steps to automate the deployment of the .NET Lambda function, including setting up the development environment, creating the pipeline with AWS CDK, configuring the pipeline stages, and publishing the test reports. Additionally, we will show how to promote the deployment from a lower environment to a higher environment with manual approval.
Background
AWS CDK makes it easy to deploy a stack that provisions your infrastructure to AWS from your workstation by simply running cdk deploy. This is useful when you are doing initial development and testing. However, in most real-world scenarios, there are multiple environments, such as development, testing, staging, and production. It may not be the best approach to deploy your CDK application in all these environments using cdk deploy. Deployment to these environments should happen through more reliable, automated pipelines. CDK Pipelines makes it easy to set up a continuous deployment pipeline for your CDK applications, powered by AWS CodePipeline.
The AWS CDK Developer Guide’s Continuous integration and delivery (CI/CD) using CDK Pipelines page shows you how you can use CDK Pipelines to deploy a Node.js based Lambda function. However, .NET based Lambda functions are different from Node.js or Python based Lambda functions in that .NET code first needs to be compiled to create a deployment package. As a result, we decided to write this blog as a step-by-step guide to assist our .NET customers with deploying their Lambda functions utilizing CDK Pipelines.
In this post, we dive deeper into creating a real-world pipeline that runs build and unit tests, and deploys a .NET Lambda function to one or multiple environments.
Architecture
CDK Pipelines is a construct library that allows you to provision a CodePipeline pipeline. The pipeline created by CDK pipelines is self-mutating. This means, you need to run cdk deploy one time to get the pipeline started. After that, the pipeline automatically updates itself if you add new application stages or stacks in the source code.
The following diagram captures the architecture of the CI/CD pipeline created with CDK Pipelines. Let’s explore this architecture at a high level before diving deeper into the details.
Figure 1: Reference architecture diagram
The solution creates a CodePipeline with a AWS CodeCommit repo as the source (CodePipeline Source Stage). When code is checked into CodeCommit, the pipeline is automatically triggered and retrieves the code from the CodeCommit repository branch to proceed to the Build stage.
Build stage compiles the CDK application code and generates the cloud assembly.
Update Pipeline stage updates the pipeline (if necessary).
Publish Assets stage uploads the CDK assets to Amazon S3.
After Publish Assets is complete, the pipeline deploys the Lambda function to both the development and production environments. For added control, the architecture includes a manual approval step for releases that target the production environment.
Before you use AWS CDK to deploy CDK Pipelines, you must bootstrap the AWS environments where you want to deploy the Lambda function. An environment is the target AWS account and Region into which the stack is intended to be deployed.
In this post, you deploy the Lambda function into a development environment and, optionally, a production environment. This requires bootstrapping both environments. However, deployment to a production environment is optional; you can skip bootstrapping that environment for the time being, as we will cover that later.
This is one-time activity per environment for each environment to which you want to deploy CDK applications. To bootstrap the development environment, run the below command, substituting in the AWS account ID for your dev account, the region you will use for your dev environment, and the locally-configured AWS CLI profile you wish to use for that account. See the documentation for additional details.
‐‐profile specifies the AWS CLI credential profile that will be used to bootstrap the environment. If not specified, default profile will be used. The profile should have sufficient permissions to provision the resources for the AWS CDK during bootstrap process.
‐‐cloudformation-execution-policies specifies the ARNs of managed policies that should be attached to the deployment role assumed by AWS CloudFormation during deployment of your stacks.
For this post, you will use CodeCommit to store your source code. First, create a git repository named dotnet-lambda-cdk-pipeline in CodeCommit by following these steps in the CodeCommit documentation.
After you have created the repository, generate git credentials to access the repository from your local machine if you don’t already have them. Follow the steps below to generate git credentials.
Sign in to the AWS Management Console and open the IAM console.
Next. open the user details page, choose the Security Credentials tab, and in HTTPS Git credentials for AWS CodeCommit, choose Generate.
Download credentials to download this information as a .CSV file.
Clone the recently created repository to your workstation, then cd into dotnet-lambda-cdk-pipeline directory.
git clone <CODECOMMIT-CLONE-URL>
cd dotnet-lambda-cdk-pipeline
Alternatively, you can use git-remote-codecommit to clone the repository with git clone codecommit::<REGION>://<PROFILE>@<REPOSITORY-NAME> command, replacing the placeholders with their original values. Using git-remote-codecommit does not require you to create additional IAM users to manage git credentials. To learn more, refer AWS CodeCommit with git-remote-codecommit documentation page.
Initialize the CDK project
From the command prompt, inside the dotnet-lambda-cdk-pipeline directory, initialize a AWS CDK project by running the following command.
cdk init app --language csharp
Open the generated C# solution in Visual Studio, right-click the DotnetLambdaCdkPipeline project and select Properties. Set the Target framework to .NET 6.
Create a CDK stack to provision the CodePipeline
Your CDK Pipelines application includes at least two stacks: one that represents the pipeline itself, and one or more stacks that represent the application(s) deployed via the pipeline. In this step, you create the first stack that deploys a CodePipeline pipeline in your AWS account.
From Visual Studio, open the solution by opening the .sln solution file (in the src/ folder). Once the solution has loaded, open the DotnetLambdaCdkPipelineStack.cs file, and replace its contents with the following code. Note that the filename, namespace and class name all assume you named your Git repository as shown earlier.
Note: be sure to replace “<CODECOMMIT-REPOSITORY-NAME>” in the code below with the name of your CodeCommit repository (in this blog post, we have used dotnet-lambda-cdk-pipeline).
using Amazon.CDK;
using Amazon.CDK.AWS.CodeBuild;
using Amazon.CDK.AWS.CodeCommit;
using Amazon.CDK.AWS.IAM;
using Amazon.CDK.Pipelines;
using Constructs;
using System.Collections.Generic;

namespace DotnetLambdaCdkPipeline
{
    public class DotnetLambdaCdkPipelineStack : Stack
    {
        internal DotnetLambdaCdkPipelineStack(Construct scope, string id, IStackProps props = null) : base(scope, id, props)
        {

            var repository = Repository.FromRepositoryName(this, "repository", "<CODECOMMIT-REPOSITORY-NAME>");

            // This construct creates a pipeline with 3 stages: Source, Build, and UpdatePipeline
            var pipeline = new CodePipeline(this, "pipeline", new CodePipelineProps
            {
                PipelineName = "LambdaPipeline",
                SelfMutation = true,

                // Synth represents a build step that produces the CDK Cloud Assembly.
                // The primary output of this step needs to be the cdk.out directory generated by the cdk synth command.
                Synth = new CodeBuildStep("Synth", new CodeBuildStepProps
                {
                    // The files downloaded from the repository will be placed in the working directory when the script is executed
                    Input = CodePipelineSource.CodeCommit(repository, "master"),

                    // Commands to run to generate CDK Cloud Assembly
                    Commands = new string[] { "npm install -g aws-cdk", "cdk synth" },

                    // Build environment configuration
                    BuildEnvironment = new BuildEnvironment
                    {
                        BuildImage = LinuxBuildImage.AMAZON_LINUX_2_4,
                        ComputeType = ComputeType.MEDIUM,

                        // Specify true to get a privileged container inside the build environment image
                        Privileged = true
                    }
                })
            });
        }
    }
}
In the preceding code, you use CodeBuildStep instead of ShellStep, since ShellStep doesn’t provide a property to specify BuildEnvironment. We need to specify the build environment in order to set privileged mode, which allows access to the Docker daemon in order to build container images in the build environment. This is necessary to use the CDK’s bundling feature, which is explained in later in this blog post.
Open the file src/DotnetLambdaCdkPipeline/Program.cs, and edit its contents to reflect the below. Be sure to replace the placeholders with your AWS account ID and region for your dev environment.
using Amazon.CDK;

namespace DotnetLambdaCdkPipeline
{
    sealed class Program
    {
        public static void Main(string[] args)
        {
            var app = new App();
            new DotnetLambdaCdkPipelineStack(app, "DotnetLambdaCdkPipelineStack", new StackProps
            {
                Env = new Amazon.CDK.Environment
                {
                    Account = "<DEV-ACCOUNT-ID>",
                    Region = "<DEV-REGION>"
                }
            });
            app.Synth();
        }
    }
}
Note: Instead of committing the account ID and region to source control, you can set environment variables on the CodeBuild agent and use them; see Environments in the AWS CDK documentation for more information. Because the CodeBuild agent is also configured in your CDK code, you can use the BuildEnvironmentVariableType property to store environment variables in AWS Systems Manager Parameter Store or AWS Secrets Manager.
After you make the code changes, build the solution to ensure there are no build issues. Next, commit and push all the changes you just made. Run the following commands (or alternatively use Visual Studio’s built-in Git functionality to commit and push your changes):
Then navigate to the root directory of repository where your cdk.json file is present, and run the cdk deploy command to deploy the initial version of CodePipeline. Note that the deployment can take several minutes.
The pipeline created by CDK Pipelines is self-mutating. This means you only need to run cdk deploy one time to get the pipeline started. After that, the pipeline automatically updates itself if you add new CDK applications or stages in the source code.
After the deployment has finished, a CodePipeline is created and automatically runs. The pipeline includes three stages as shown below.
Source – It fetches the source of your AWS CDK app from your CodeCommit repository and triggers the pipeline every time you push new commits to it.
Build – This stage compiles your code (if necessary) and performs a cdk synth. The output of that step is a cloud assembly.
UpdatePipeline – This stage runs cdk deploy command on the cloud assembly generated in previous stage. It modifies the pipeline if necessary. For example, if you update your code to add a new deployment stage to the pipeline to your application, the pipeline is automatically updated to reflect the changes you made.
Figure 2: Initial CDK pipeline stages
Define a CodePipeline stage to deploy .NET Lambda function
In this step, you create a stack containing a simple Lambda function and place that stack in a stage. Then you add the stage to the pipeline so it can be deployed.
To create a Lambda project, do the following:
In Visual Studio, right-click on the solution, choose Add, then choose New Project.
In the New Project dialog box, choose the AWS Lambda Project (.NET Core – C#) template, and then choose OK or Next.
For Project Name, enter SampleLambda, and then choose Create.
From the Select Blueprint dialog, choose Empty Function, then choose Finish.
Next, create a new file in the CDK project at src/DotnetLambdaCdkPipeline/SampleLambdaStack.cs to define your application stack containing a Lambda function. Update the file with the following contents (adjust the namespace as necessary):
using Amazon.CDK;
using Amazon.CDK.AWS.Lambda;
using Constructs;
using AssetOptions = Amazon.CDK.AWS.S3.Assets.AssetOptions;

namespace DotnetLambdaCdkPipeline
{
    class SampleLambdaStack: Stack
    {
        public SampleLambdaStack(Construct scope, string id, StackProps props = null) : base(scope, id, props)
        {
            // Commands executed in a AWS CDK pipeline to build, package, and extract a .NET function.
            var buildCommands = new[]
            {
                "cd /asset-input",
                "export DOTNET_CLI_HOME=\"/tmp/DOTNET_CLI_HOME\"",
                "export PATH=\"$PATH:/tmp/DOTNET_CLI_HOME/.dotnet/tools\"",
                "dotnet build",
                "dotnet tool install -g Amazon.Lambda.Tools",
                "dotnet lambda package -o output.zip",
                "unzip -o -d /asset-output output.zip"
            };

            new Function(this, "LambdaFunction", new FunctionProps
            {
                Runtime = Runtime.DOTNET_6,
                Handler = "SampleLambda::SampleLambda.Function::FunctionHandler",

                // Asset path should point to the folder where .csproj file is present.
                // Also, this path should be relative to cdk.json file.
                Code = Code.FromAsset("./src/SampleLambda", new AssetOptions
                {
                    Bundling = new BundlingOptions
                    {
                        Image = Runtime.DOTNET_6.BundlingImage,
                        Command = new[]
                        {
                            "bash", "-c", string.Join(" && ", buildCommands)
                        }
                    }
                })
            });
        }
    }
}
Building inside a Docker container
The preceding code uses bundling feature to build the Lambda function inside a docker container. Bundling starts a new docker container, copies the Lambda source code inside /asset-input directory of the container, runs the specified commands that write the package files under /asset-output directory. The files in /asset-output are copied as assets to the stack’s cloud assembly directory. In a later stage, these files are zipped and uploaded to S3 as the CDK asset.
Building Lambda functions inside Docker containers is preferable than building them locally because it reduces the host machine’s dependencies, resulting in greater consistency and reliability in your build process.
Bundling requires the creation of a docker container on your build machine. For this purpose, the privileged: true setting on the build machine has already been configured.
Adding development stage
Create a new file in the CDK project at src/DotnetLambdaCdkPipeline/DotnetLambdaCdkPipelineStage.cs to hold your stage. This class will create the development stage for your pipeline.
using Amazon.CDK;
using Constructs;

namespace DotnetLambdaCdkPipeline
{
    public class DotnetLambdaCdkPipelineStage : Stage
    {
        internal DotnetLambdaCdkPipelineStage(Construct scope, string id, IStageProps props = null) : base(scope, id, props)
        {
            Stack lambdaStack = new SampleLambdaStack(this, "LambdaStack");
        }
    }
}
Edit src/DotnetLambdaCdkPipeline/DotnetLambdaCdkPipelineStack.cs to add the stage to your pipeline. Add the bolded line from the code below to your file.
using Amazon.CDK;
using Amazon.CDK.Pipelines;

namespace DotnetLambdaCdkPipeline
{
    public class DotnetLambdaCdkPipelineStack : Stack
    {
        internal DotnetLambdaCdkPipelineStack(Construct scope, string id, IStackProps props = null) : base(scope, id, props)
        {

            var repository = Repository.FromRepositoryName(this, "repository", "dotnet-lambda-cdk-application");

            // This construct creates a pipeline with 3 stages: Source, Build, and UpdatePipeline
            var pipeline = new CodePipeline(this, "pipeline", new CodePipelineProps
            {
                PipelineName = "LambdaPipeline",
                .
                .
                .
            });

            var devStage = pipeline.AddStage(new DotnetLambdaCdkPipelineStage(this, "Development"));
        }
    }
}
Next, build the solution, then commit and push the changes to the CodeCommit repo. This will trigger the CodePipeline to start.
When the pipeline runs, UpdatePipeline stage detects the changes and updates the pipeline based on the code it finds there. After the UpdatePipeline stage completes, pipeline is updated with additional stages.
Let’s observe the changes:
An Assets stage has been added. This stage uploads all the assets you are using in your app to Amazon S3 (the S3 bucket created during bootstrapping) so that they could be used by other deployment stages later in the pipeline. For example, the CloudFormation template used by the development stage, includes reference to these assets, which is why assets are first moved to S3 and then referenced in later stages.
A Development stage with two actions has been added. The first action is to create the change set, and the second is to execute it.
Figure 3: CDK pipeline with development stage to deploy .NET Lambda function
After the Deploy stage has completed, you can find the newly-deployed Lambda function by visiting the Lambda console, selecting “Functions” from the left menu, and filtering the functions list with “LambdaStack”. Note the runtime is .NET.
Right click on the solution, choose Add, then choose New Project.
In the New Project dialog box, choose the xUnit Test Project template, and then choose OK or Next.
For Project Name, enter SampleLambda.Tests, and then choose Create or Next. Depending on your version of Visual Studio, you may be prompted to select the version of .NET to use. Choose .NET 6.0 (Long Term Support), then choose Create.
Right click on SampleLambda.Tests project, choose Add, then choose Project Reference. Select SampleLambda project, and then choose OK.
Next, edit the src/SampleLambda.Tests/UnitTest1.cs file to add a unit test. You can use the code below, which verifies that the Lambda function returns the input string as upper case.
using Xunit;

namespace SampleLambda.Tests
{
    public class UnitTest1
    {
        [Fact]
        public void TestSuccess()
        {
            var lambda = new SampleLambda.Function();

            var result = lambda.FunctionHandler("test string", context: null);

            Assert.Equal("TEST STRING", result);
        }
    }
}
You can add pre-deployment or post-deployment actions to the stage by calling its AddPre() or AddPost() method. To execute above test cases, we will use a pre-deployment action.
To add a pre-deployment action, we will edit the src/DotnetLambdaCdkPipeline/DotnetLambdaCdkPipelineStack.cs file in the CDK project, after we add code to generate test reports.
To run the unit test(s) and publish the test report in CodeBuild, we will construct a BuildSpec for our CodeBuild project. We also provide IAM policy statements to be attached to the CodeBuild service role granting it permissions to run the tests and create reports. Update the file by adding the new code (starting with “// Add this code for test reports”) below the devStage declaration you added earlier:
using Amazon.CDK;
using Amazon.CDK.Pipelines;
...

namespace DotnetLambdaCdkPipeline
{
    public class DotnetLambdaCdkPipelineStack : Stack
    {
        internal DotnetLambdaCdkPipelineStack(Construct scope, string id, IStackProps props = null) : base(scope, id, props)
        {
            // ...
            // ...
            // ...
            var devStage = pipeline.AddStage(new DotnetLambdaCdkPipelineStage(this, "Development"));


            // Add this code for test reports
            var reportGroup = new ReportGroup(this, "TestReports", new ReportGroupProps
            {
                ReportGroupName = "TestReports"
            });

            // Policy statements for CodeBuild Project Role
            var policyProps = new PolicyStatementProps()
            {
                Actions = new string[] {
                    "codebuild:CreateReportGroup",
                    "codebuild:CreateReport",
                    "codebuild:UpdateReport",
                    "codebuild:BatchPutTestCases"
                },
                Effect = Effect.ALLOW,
                Resources = new string[] { reportGroup.ReportGroupArn }
            };

            // PartialBuildSpec in AWS CDK for C# can be created using Dictionary
            var reports = new Dictionary<string, object>()
            {
                {
                    "reports", new Dictionary<string, object>()
                    {
                        {
                            reportGroup.ReportGroupArn, new Dictionary<string,object>()
                            {
                                { "file-format", "VisualStudioTrx" },
                                { "files", "**/*" },
                                { "base-directory", "./testresults" }
                            }
                        }
                    }
                }
            };
            // End of new code block
        }
    }
}
Finally, add the CodeBuildStep as a pre-deployment action to the development stage with necessary CodeBuildStepProps to set up reports. Add this after the new code you added above.
devStage.AddPre(new Step[]
{
    new CodeBuildStep("Unit Test", new CodeBuildStepProps
    {
        Commands= new string[]
        {
            "dotnet test -c Release ./src/SampleLambda.Tests/SampleLambda.Tests.csproj --logger trx --results-directory ./testresults",
        },
        PrimaryOutputDirectory = "./testresults",
        PartialBuildSpec= BuildSpec.FromObject(reports),
        RolePolicyStatements = new PolicyStatement[] { new PolicyStatement(policyProps) },
        BuildEnvironment = new BuildEnvironment
        {
            BuildImage = LinuxBuildImage.AMAZON_LINUX_2_4,
            ComputeType = ComputeType.MEDIUM
        }
    })
});
Build the solution, then commit and push the changes to the repository. Pushing the changes triggers the pipeline, runs the test cases, and publishes the report to the CodeBuild console. To view the report, after the pipeline has completed, navigate to TestReports in CodeBuild’s Report Groups as shown below.
Figure 4: Test report in CodeBuild report group
Deploying to production environment with manual approval
CDK Pipelines makes it very easy to deploy additional stages with different accounts. You have to bootstrap the accounts and Regions you want to deploy to, and they must have a trust relationship added to the pipeline account.
To bootstrap an additional production environment into which AWS CDK applications will be deployed by the pipeline, run the below command, substituting in the AWS account ID for your production account, the region you will use for your production environment, the AWS CLI profile to use with the prod account, and the AWS account ID where the pipeline is already deployed (the account you bootstrapped at the start of this blog).
The --trust option indicates which other account should have permissions to deploy AWS CDK applications into this environment. For this option, specify the pipeline’s AWS account ID.
Use below code to add a new stage for production deployment with manual approval. Add this code below the “devStage.AddPre(...)” code block you added in the previous section, and remember to replace the placeholders with your AWS account ID and region for your prod environment.
var prodStage = pipeline.AddStage(new DotnetLambdaCdkPipelineStage(this, "Production", new StageProps
{
    Env = new Environment
    {
        Account = "<PROD-ACCOUNT-ID>",
        Region = "<PROD-REGION>"
    }
}), new AddStageOpts
{
    Pre = new[] { new ManualApprovalStep("PromoteToProd") }
});
To support deploying CDK applications to another account, the artifact buckets must be encrypted, so add a CrossAccountKeys property to the CodePipeline near the top of the pipeline stack file, and set the value to true (see the line in bold in the code snippet below). This creates a KMS key for the artifact bucket, allowing cross-account deployments.
var pipeline = new CodePipeline(this, "pipeline", new CodePipelineProps
{
PipelineName = "LambdaPipeline",
SelfMutation = true,
CrossAccountKeys = true,EnableKeyRotation = true, //Enable KMS key rotation for the generated KMS keys
// ...
}
After you commit and push the changes to the repository, a new manual approval step called PromoteToProd is added to the Production stage of the pipeline. The pipeline pauses at this step and awaits manual approval as shown in the screenshot below.
Figure 5: Pipeline waiting for manual review
When you click the Review button, you are presented with the following dialog. From here, you can choose to approve or reject and add comments if needed.
Figure 6: Manual review approval dialog
Once you approve, the pipeline resumes, executes the remaining steps and completes the deployment to production environment.
Figure 7: Successful deployment to production environment
Clean up
To avoid incurring future charges, log into the AWS console of the different accounts you used, go to the AWS CloudFormation console of the Region(s) where you chose to deploy, select and click Delete on the stacks created for this activity. Alternatively, you can delete the CloudFormation Stack(s) using cdk destroy command. It will not delete the CDKToolkit stack that the bootstrap command created. If you want to delete that as well, you can do it from the AWS Console.
Conclusion
In this post, you learned how to use CDK Pipelines for automating the deployment process of .NET Lambda functions. An intuitive and flexible architecture makes it easy to set up a CI/CD pipeline that covers the entire application lifecycle, from build and test to deployment. With CDK Pipelines, you can streamline your development workflow, reduce errors, and ensure consistent and reliable deployments. For more information on CDK Pipelines and all the ways it can be used, see the CDK Pipelines reference documentation.
This post describes how to use the AWS CDK Pipelines module to follow a Gitflow development model using AWS Cloud Development Kit (AWS CDK). Software development teams often follow a strict branching strategy during a solutions development lifecycle. Newly-created branches commonly need their own isolated copy of infrastructure resources to develop new features.
CDK Pipelines is a construct library module for continuous delivery of AWS CDK applications. CDK Pipelines are self-updating: if you add application stages or stacks, then the pipeline automatically reconfigures itself to deploy those new stages and/or stacks.
The following solution creates a new AWS CDK Pipeline within a development account for every new branch created in the source repository (AWS CodeCommit). When a branch is deleted, the pipeline and all related resources are also destroyed from the account. This GitFlow model for infrastructure provisioning allows developers to work independently from each other, concurrently, even in the same stack of the application.
Solution overview
The following diagram provides an overview of the solution. There is one default pipeline responsible for deploying resources to the different application environments (e.g., Development, Pre-Prod, and Prod). The code is stored in CodeCommit. When new changes are pushed to the default CodeCommit repository branch, AWS CodePipeline runs the default pipeline. When the default pipeline is deployed, it creates two AWS Lambda functions.
These two Lambda functions are invoked by CodeCommit CloudWatch events when a new branch in the repository is created or deleted. The Create Lambda function uses the boto3 CodeBuild module to create an AWS CodeBuild project that builds the pipeline for the feature branch. This feature pipeline consists of a build stage and an optional update pipeline stage for itself. The Destroy Lambda function creates another CodeBuild project which cleans all of the feature branch’s resources and the feature pipeline.
Figure 1. Architecture diagram.
Prerequisites
Before beginning this walkthrough, you should have the following prerequisites:
# Command to clone the repository
git clone https://github.com/aws-samples/multi-branch-cdk-pipelines.git
cd multi-branch-cdk-pipelines
Create a new CodeCommit repository in the AWS Account and region where you want to deploy the pipeline and upload the source code from above to this repository. In the config.ini file, change the repository_name and region variables accordingly.
Make sure that you set up a fresh Python environment. Install the dependencies:
pip install -r requirements.txt
Run the initial-deploy.sh script to bootstrap the development and production environments and to deploy the default pipeline. You’ll be asked to provide the following parameters: (1) Development account ID, (2) Development account AWS profile name, (3) Production account ID, and (4) Production account AWS profile name.
sh ./initial-deploy.sh --dev_account_id <YOUR DEV ACCOUNT ID> --
dev_profile_name <YOUR DEV PROFILE NAME> --prod_account_id <YOUR PRODUCTION
ACCOUNT ID> --prod_profile_name <YOUR PRODUCTION PROFILE NAME>
Default pipeline
In the CI/CD pipeline, we set up an if condition to deploy the default branch resources only if the current branch is the default one. The default branch is retrieved programmatically from the CodeCommit repository. We deploy an Amazon Simple Storage Service (Amazon S3) Bucket and two Lambda functions. The bucket is responsible for storing the feature branches’ CodeBuild artifacts. The first Lambda function is triggered when a new branch is created in CodeCommit. The second one is triggered when a branch is deleted.
Then, the CodeCommit repository is configured to trigger these Lambda functions based on two events:
(1) Reference created
# Configure AWS CodeCommit to trigger the Lambda function when a new branch is created
repo.on_reference_created(
    'BranchCreateTrigger',
    description="AWS CodeCommit reference created event.",
    target=aws_events_targets.LambdaFunction(create_branch_func))
(2) Reference deleted
# Configure AWS CodeCommit to trigger the Lambda function when a branch is deleted
repo.on_reference_deleted(
    'BranchDeleteTrigger',
    description="AWS CodeCommit reference deleted event.",
    target=aws_events_targets.LambdaFunction(destroy_branch_func))
Lambda functions
The two Lambda functions build and destroy application environments mapped to each feature branch. An Amazon CloudWatch event triggers the LambdaTriggerCreateBranch function whenever a new branch is created. The CodeBuild client from boto3 creates the build phase and deploys the feature pipeline.
Create function
The create function deploys a feature pipeline which consists of a build stage and an optional update pipeline stage for itself. The pipeline downloads the feature branch code from the CodeCommit repository, initiates the Build and Test action using CodeBuild, and securely saves the built artifact on the S3 bucket.
The second Lambda function is responsible for the destruction of a feature branch’s resources. Upon the deletion of a feature branch, an Amazon CloudWatch event triggers this Lambda function. The function creates a CodeBuild Project which destroys the feature pipeline and all of the associated resources created by that pipeline. The source property of the CodeBuild Project is the feature branch’s source code saved as an artifact in Amazon S3.
On your machine’s local copy of the repository, create a new feature branch using the following git commands. Replace user-feature-123 with a unique name for your feature branch. Note that this feature branch name must comply with the CodePipeline naming restrictions, as it will be used to name a unique pipeline later in this walkthrough.
The first Lambda function will deploy the CodeBuild project, which then deploys the feature pipeline. This can take a few minutes. You can log in to the AWS Console and see the CodeBuild project running under CodeBuild.
Figure 2. AWS Console – CodeBuild projects.
After the build is successfully finished, you can see the deployed feature pipeline under CodePipelines.
Figure 3. AWS Console – CodePipeline pipelines.
The Lambda S3 trigger project from AWS CDK Samples is used as the infrastructure resources to demonstrate this solution. The content is placed inside the src directory and is deployed by the pipeline. When visiting the Lambda console page, you can see two functions: one by the default pipeline and one by our feature pipeline.
Figure 4. AWS Console – Lambda functions.
Destroy a feature branch
There are two common ways for removing feature branches. The first one is related to a pull request, also known as a “PR”. This occurs when merging a feature branch back into the default branch. Once it’s merged, the feature branch will be automatically closed. The second way is to delete the feature branch explicitly by running the following git commands:
The CodeBuild project responsible for destroying the feature resources is now triggered. You can see the project’s logs while the resources are being destroyed in CodeBuild, under Build history.
Figure 5. AWS Console – CodeBuild projects.
Cleaning up
To avoid incurring future charges, log into the AWS console of the different accounts you used, go to the AWS CloudFormation console of the Region(s) where you chose to deploy, and select and click Delete on the main and branch stacks.
Conclusion
This post showed how you can work with an event-driven strategy and AWS CDK to implement a multi-branch pipeline flow using AWS CDK Pipelines. The described solutions leverage Lambda and CodeBuild to provide a dynamic orchestration of resources for multiple branches and pipelines. For more information on CDK Pipelines and all the ways it can be used, see the CDK Pipelines reference documentation.
AWS Glue is a serverless data integration service that makes it easy to discover, prepare, and combine data for analytics, machine learning (ML), and application development. It’s serverless, so there’s no infrastructure to set up or manage.
The AWS CDK is an open-source software development framework for defining cloud infrastructure as code using familiar programming languages and provisioning it through AWS CloudFormation. It provides you with high-level components called constructs that preconfigure cloud resources with proven defaults, cutting down boilerplate code and allowing for faster development in a safe, repeatable manner.
Solution overview
The solution constructs a CI/CD pipeline with multiple stages. The CI/CD pipeline constructs a data pipeline using COVID-19 Harmonized Data managed by Talend / Stitch. The data pipeline crawls the datasets provided by neherlab from the public Amazon Simple Storage Service (Amazon S3) bucket, exposes the public datasets in the AWS Glue Data Catalog so they’re available for SQL queries using Amazon Athena, performs ETL (extract, transform, and load) transformations to denormalize the datasets to a table, and makes the denormalized table available in the Data Catalog.
The solution is designed as follows:
A data engineer deploys the initial solution. The solution creates two stacks:
cdk-covid19-glue-stack-pipeline – This stack creates the CI/CD infrastructure as shown in the architectural diagram (labeled Tool Chain).
cdk-covid19-glue-stack – The cdk-covid19-glue-stack-pipeline stack deploys the cdk-covid19-glue-stack stack to create the AWS Glue based data pipeline as shown in the diagram (labeled ETL).
The data engineer makes changes on cdk-covid19-glue-stack (when a change in the ETL application is required).
The data engineer pushes the change to a CodeCommit repository (generated in the cdk-covid19-glue-stack-pipeline stack).
The pipeline is automatically triggered by the push, and deploys and updates all the resources in the cdk-covid19-glue-stack stack.
At the time of publishing of this post, the AWS CDK has two versions of the AWS Glue module: @aws-cdk/aws-glue and @aws-cdk/aws-glue-alpha, containing L1 constructs and L2 constructs, respectively. At this time, the @aws-cdk/aws-glue-alpha module is still in an experimental stage. We use the stable @aws-cdk/aws-glue module for the purpose of this post.
The following diagram shows all the components in the solution.
Figure 1 – Architecture diagram
The data pipeline consists of an AWS Glue workflow, triggers, jobs, and crawlers. The AWS Glue job uses an AWS Identity and Access Management (IAM) role with appropriate permissions to read and write data to an S3 bucket. AWS Glue crawlers crawl the data available in the S3 bucket, update the AWS Glue Data Catalog with the metadata, and create tables. You can run SQL queries on these tables using Athena. For ease of identification, we followed the naming convention for triggers to start with t_*, crawlers with c_*, and jobs with j_*. A CI/CD pipeline based on CodeCommit, CodeBuild, and CodePipeline builds, tests and deploys the solution. The complete infrastructure is created using the AWS CDK.
The following table lists the tables created by this solution that you can query using Athena.
Denormalized table that combines all the preceding tables into one table
s3://<your-S3-bucket-name>/neherlab_denormalized
Read/Write
Reader’s AWS account
Anatomy of the AWS CDK application
In this section, we visit key concepts and anatomy of the AWS CDK application, review the important sections of the code, and discuss how the AWS CDK reduces complexity of the solution as compared to AWS CloudFormation.
An AWS CDK app defines one or more stacks. Stacks (equivalent to CloudFormation stacks) contain constructs, each of which defines one or more concrete AWS resources. Each stack in the AWS CDK app is associated with an environment. An environment is the target AWS account ID and Region into which the stack is intended to be deployed.
In the AWS CDK, the top-most object is the AWS CDK app, which contains multiple stacks vs. the top-level stack in AWS CloudFormation. Given this difference, you can define all the stacks required for the application in the AWS CDK app. In AWS Glue based ETL projects, developers need to define multiple data pipelines by subject area or business logic. In AWS CloudFormation, we can achieve this by writing multiple CloudFormation stacks and often deploy them independently. In some cases, developers write nested stacks, which over time becomes very large and complicated to maintain. In the AWS CDK, all stacks are deployed from the AWS CDK app, increasing modularity of the code and allowing developers to identify all the data pipelines associated with an application easily.
Our AWS CDK application consists of four main files:
app.py – This is the AWS CDK app and the entry point for the AWS CDK application
pipeline.py – The pipeline.py stack, invoked by app.py, creates the CI/CD pipeline
etl/infrastructure.py – The etl/infrastructure.py stack, invoked by pipeline.py, creates the AWS Glue based data pipeline
default-config.yaml – The configuration file contains the AWS account ID and Region.
The AWS CDK application reads the configuration from the default-config.yaml file, sets the environment information (AWS account ID and Region), and invokes the PipelineCDKStack class in pipeline.py. Let’s break down the preceding line and discuss the benefits of this design.
For every application, we want to deploy in pre-production environments and a production environment. The application in all the environments will have different configurations, such as the size of the deployed resources. In the AWS CDK, every stack has a property called env, which defines the stack’s target environment. This property receives the AWS account ID and Region for the given stack.
Lines 26–34 in app.py show the aforementioned details:
The env=env line sets the target AWS account ID and Region for PipelieCDKStack. This design allows an AWS CDK app to be deployed in multiple environments at once and increases the parity of the application in all environment. For our example, if we want to deploy PipelineCDKStack in multiple environments, such as development, test, and production, we simply call the PipelineCDKStack stack after populating the env variable appropriately with the target AWS account ID and Region. This was more difficult in AWS CloudFormation, where developers usually needed to deploy the stack for each environment individually. The AWS CDK also provides features to pass the stage at the command line. We look into this option and usage in the later section.
Coming back to the AWS CDK application, the PipelineCDKStack class in pipeline.py uses the aws_cdk.pipeline construct library to create continuous delivery of AWS CDK applications. The AWS CDK provides multiple opinionated construct libraries like aws_cdk.pipeline to reduce boilerplate code from an application. The pipeline.py file creates the CodeCommit repository, populates the repository with the sample code, and creates a pipeline with the necessary AWS CDK stages for CodePipeline to run the CdkGlueBlogStack class from the etl/infrastructure.py file.
Line 99 in pipeline.py invokes the CdkGlueBlogStack class.
The CdkGlueBlogStack class in etl/infrastructure.py creates the crawlers, jobs, database, triggers, and workflow to provision the AWS Glue based data pipeline.
Refer to line 539 for creating a crawler using the CfnCrawler construct, line 564 for creating jobs using the CfnJob construct, and line 168 for creating the workflow using the CfnWorkflow construct. We use the CfnTrigger construct to stitch together multiple triggers to create the workflow. The AWS CDK L1 constructs expose all the available AWS CloudFormation resources and entities using methods from popular programing languages. This allows developers to use popular programing languages to provision resources instead of working with JSON or YAML files in AWS CloudFormation.
Source – This stage fetches the source of the AWS CDK app from the CodeCommit repo and triggers the pipeline every time a new commit is made.
Build – This stage compiles the code (if necessary), runs the tests, and performs a cdk synth. The output of the step is a cloud assembly, which is used to perform all the actions in the rest of the pipeline. The pytest is run using the amazon/aws-glue-libs:glue_libs_3.0.0_image_01Docker image. This image comes with all the required libraries to run tests for AWS Glue version 3.0 jobs using a Docker container. Refer to Develop and test AWS Glue version 3.0 jobs locally using a Docker container for additional information.
UpdatePipeline – This stage modifies the pipeline if necessary. For example, if the code is updated to add a new deployment stage to the pipeline or add a new asset to your application, the pipeline is automatically updated to reflect the changes.
Assets – This stage prepares and publishes all AWS CDK assets of the app to Amazon S3 and all Docker images to Amazon Elastic Container Registry (Amazon ECR). When the AWS CDK deploys an app that references assets (either directly by the app code or through a library), the AWS CDK CLI first prepares and publishes the assets to Amazon S3 using a CodeBuild job. This AWS Glue solution creates four assets.
CDKGlueStage – This stage deploys the assets to the AWS account. In this case, the pipeline deploys the AWS CDK template etl/infrastructure.py to create all the AWS Glue artifacts.
This step creates a Python virtual environment specific to the project on the client machine. We use a virtual environment in order to isolate the Python environment for this project and not install software globally.
Activate the virtual environment according to your OS:
On MacOS and Linux, use the following code:
$ source .venv/bin/activate
On a Windows platform, use the following code:
% .venv\Scripts\activate.bat
After this step, the subsequent steps run within the bounds of the virtual environment on the client machine and interact with the AWS account as needed.
Install the required dependencies described in requirements.txt to the virtual environment:
$ pip install -r requirements.txt
Bootstrap the AWS CDK app:
cdk bootstrap
This step populates a given environment (AWS account ID and Region) with resources required by the AWS CDK to perform deployments into the environment. Refer to Bootstrapping for additional information. At this step, you can see the CloudFormation stack CDKToolkit on the AWS CloudFormation console.
Synthesize the CloudFormation template for the specified stacks:
$ cdk synth # optional if not default (-c stage=default)
You can verify the CloudFormation templates to identify the resources to be deployed in the next step.
Deploy the AWS resources (CI/CD pipeline and AWS Glue based data pipeline):
$ cdk deploy # optional if not default (-c stage=default)
At this step, you can see CloudFormation stacks cdk-covid19-glue-stack-pipeline and cdk-covid19-glue-stack on the AWS CloudFormation console. The cdk-covid19-glue-stack-pipeline stack gets deployed first, which in turn deploys cdk-covid19-glue-stack to create the AWS Glue pipeline.
Verify the solution
When all the previous steps are complete, you can check for the created artifacts.
CloudFormation stacks
You can confirm the existence of the stacks on the AWS CloudFormation console. As shown in the following screenshot, the CloudFormation stacks have been created and deployed by cdk bootstrap and cdk deploy.
Figure 2 – AWS CloudFormation stacks
CodePipeline pipeline
On the CodePipeline console, check for the cdk-covid19-glue pipeline.
Figure 3 – AWS CodePipeline summary view
You can open the pipeline for a detailed view.
Figure 4 – AWS CodePipeline detailed view
AWS Glue workflow
To validate the AWS Glue workflow and its components, complete the following steps:
On the AWS Glue console, choose Workflows in the navigation pane.
Confirm the presence of the Covid_19 workflow.
Figure 5 – AWS Glue Workflow summary view
You can select the workflow for a detailed view.
Figure 6 – AWS Glue Workflow detailed view
Choose Triggers in the navigation pane and check for the presence of seven t-* triggers.
Figure 7 – AWS Glue Triggers
Choose Jobs in the navigation pane and check for the presence of three j_* jobs.
Figure 8 – AWS Glue Jobs
The jobs perform the following tasks:
etlScripts/j_emit_start_event.py – A Python job that starts the workflow and creates the event
etlScripts/j_neherlab_denorm.py – A Spark ETL job to transform the data and create a denormalized view by combining all the base data together in Parquet format
etlScripts/j_emit_ended_event.py – A Python job that ends the workflow and creates the specific event
Choose Crawlers in the navigation pane and check for the presence of five neherlab-* crawlers.
Figure 9 – AWS Glue Crawlers
Execute the solution
The solution creates a scheduled AWS Glue workflow which runs at 10:00 AM UTC on day 1 of every month. A scheduled workflow can also be triggered on-demand. For the purpose of this post, we will execute the workflow on-demand using the following command from the AWS CLI. If the workflow is successfully started, the command returns the run ID. For instructions on how to run and monitor a workflow in Amazon Glue, refer to Running and monitoring a workflow in Amazon Glue.
aws glue start-workflow-run --name Covid_19
You can verify the status of a workflow run by execution the following command from the AWS CLI. Please use the run ID returned from the above command. A successfully executed Covid_19 workflow should return a value of 7 for SucceededActions and 0 for FailedActions.
(Optional) To verify the status of the workflow run using AWS Glue console, choose Workflows in the navigation pane, select the Covid_19 workflow, click on the History tab, select the latest row and click on View run details. A successfully completed workflow is marked in green check marks. Please refer to the Legend section in the below screenshot for additional statuses.
Figure 10 – AWS Glue Workflow successful run
Check the output
When the workflow is complete, navigate to the Athena console to check the successful creation and population of neherlab_denormalized table. You can run SQL queries against all 5 tables to check the data. A sample SQL query is provided below.
In this post, we demonstrated a step-by-step guide to define, test, provision, and manage changes to an AWS Glue based ETL solution using the AWS CDK. We used an AWS Glue example, which has all the components to build a complex ETL solution, and demonstrated how to integrate individual AWS Glue components into a frictionless CI/CD pipeline. We encourage you to use this post and associated code as the starting point to build your own CI/CD pipelines for AWS Glue based ETL solutions.
About the authors
Puneet Babbar is a Data Architect at AWS, specialized in big data and AI/ML. He is passionate about building products, in particular products that help customers get more out of their data. During his spare time, he loves to spend time with his family and engage in outdoor activities including hiking, running, and skating. Connect with him on LinkedIn.
Suvojit Dasgupta is a Sr. Lakehouse Architect at Amazon Web Services. He works with customers to design and build data solutions on AWS.
Justin Kuskowski is a Principal DevOps Consultant at Amazon Web Services. He works directly with AWS customers to provide guidance and technical assistance around improving their value stream, which ultimately reduces product time to market and leads to a better customer experience. Outside of work, Justin enjoys traveling the country to watch his two kids play soccer and spending time with his family and friends wake surfing on the lakes in Michigan.
In Part 1 and Part 2 of this series, we discussed how to build application layer and infrastructure layer resiliency.
In Part 3, we explore how to develop resilient applications, and the need to test and break our operational processes and run books. Processes are needed to capture baseline metrics and boundary conditions. Detecting deviations from accepted baselines requires logging, distributed tracing, monitoring, and alerting. Testing automation and rollback are part of continuous integration/continuous deployment (CI/CD) pipelines. Keeping track of network, application, and system health requires automation.
In order to meet recovery time and point objective (RTO and RPO, respectively) requirements of distributed applications, we need automation to implement failover operations across multiple layers. Let’s explore how a distributed system’s operational resiliency needs to be addressed before it goes into production, after it’s live in production, and when a failure happens.
Pattern 1: Standardize and automate AWS account setup
Create processes and automation for onboarding users and providing access to AWS accounts according to their role and business unit, as defined by the organization. Federated access to AWS accounts and organizations simplifies cost management, security implementation, and visibility. Having a strategy for a suitable AWS account structure can reduce the blast radius in case of a compromise.
Have auditing mechanisms in place. AWS CloudTrail monitors compliance, improving security posture, and auditing all the activity records across AWS accounts.
Practice the least privilege security model when setting up access to the CloudTrail audit logs plus network and applications logs. Follow best practices on service control policies and IAM boundaries to help ensure your AWS accounts stay within your organization’s access control policies.
Use AWS CloudFormation and AWS Config to detect infrastructure drift and take corrective actions to make resources compliant, as demonstrated in Figure 1.
Figure 1. Compliance control and drift detection
Pattern 2: Documenting knowledge about the distributed system
Document high-level infrastructure and dependency maps.
Define availability characteristics of distributed system. Systems have components with varying RTO and RPO needs. Document application component boundaries and capture dependencies with other infrastructure components, including Domain Name System (DNS), IAM permissions; and access patterns, secrets, and certificates. Discover dependencies through solutions, such as Workload Discovery on AWS, to plan resiliency methods and ensure the order of execution of various steps during failover are correct.
Capture non-functional requirements (NFRs), such as business key performance indicators (KPIs), RTO, and RPO, for your composing services. NFRs are quantifiable and define system availability, reliability, and recoverability requirements. They should include throughput, page-load, and response time requirements. Quantify the RTO and RPO of different components of the distributed system by defining them. The KPIs measure if you are meeting the business objectives. As mentioned in Part 2: Infrastructure layer, RTO and RPO help define the failover and data recovery procedures.
Pattern 3: Define CI/CD pipelines for application code and infrastructure components
Establish a branching strategy. Implement automated checks for version and tagging compliance in feature/sprint/bug fix/hot fix/release candidate branches, according to your organization’s policies. Define appropriate release management processes and responsibility matrices, as demonstrated in Figures 2 and 3.
Test at all levels as part of an automated pipeline. This includes security, unit, and system testing. Create a feedback loop that provides the ability to detect issues and automate rollback in case of production failures, which are indicated by business KPI negative impact and other technical metrics.
Figure 2. Define the release management process
Figure 3. Sample roles and responsibility matrix
Pattern 4: Keep code in a source control repository, regardless of GitOps
Merge requests and configuration changes follow the same process as application software. Just like application code, manage infrastructure as code (IaC) by checking the code into a source control repository, submitting pull requests, scanning code for vulnerabilities, alerting and sending notifications, running validation tests on deployments, and having an approval process.
You can audit your infrastructure drift, design reusable and repeatable patterns, and adhere to your distributed application’s RTO objectives by building your IaC (Figure 4). IaC is crucial for operational resilience.
Figure 4. CI/CD pipeline for deploying IaC
Pattern 5: Immutable infrastructure
An immutable deployment pipeline launches a set of new instances running the new application version. You can customize immutability at different levels of granularity depending on which infrastructure part is being rebuilt for new application versions, as in Figure 5.
The more immutable infrastructure components being rebuilt, the more expensive deployments are in both deployment time and actual operational costs. Immutable infrastructure also is easier to rollback.
Figure 5. Different granularity levels of immutable infrastructure
Pattern 6: Test early, test often
In a shift-left testing approach, begin testing in the early stages, as demonstrated in Figure 6. This can surface defects that can be resolved in a more time- and cost-effective manner compared with after code is released to production.
Figure 6. Shift-left test strategy
Continuous testing is an essential part of CI/CD. CI/CD pipelines can implement various levels of testing to reduce the likelihood of defects entering production. Testing can include: unit, functional, regression, load, and chaos.
Continuous testing requires testing and breaking existing boundary conditions, and updating test cases if the boundaries have changed. Test cases should test distributed systems’ idempotency. Chaos testing benefits our incidence response mechanisms for distributed systems that have multiple integration points. By testing our auto scaling and failover mechanisms, chaos testing improves application performance and resiliency.
AWS Fault Injection Simulator (AWS FIS) is a service for chaos testing. An experiment template contains actions, such as StopInstance and StartInstance, along with targets on which the test will be performed. In addition, you can mention stop conditions and check if they triggered the required Amazon CloudWatch alarms, as demonstrated in Figure 7.
Figure 7. AWS Fault Injection Simulator architecture for chaos testing
Pattern 7: Providing operational visibility
In production, operational visibility across multiple dimensions is necessary for distributed systems (Figure 8). To identify performance bottlenecks and failures, use AWS X-Ray and other open-source libraries for distributed tracing.
Write application, infrastructure, and security logs to CloudWatch. When metrics breach alarm thresholds, integrate the corresponding alarms with Amazon Simple Notification Service or a third-party incident management system for notification.
Monitoring services, such as Amazon GuardDuty, are used to analyze CloudTrail, virtual private cloud flow logs, DNS logs, and Amazon Elastic Kubernetes Service audit logs to detect security issues. Monitor AWS Health Dashboard for maintenance, end-of-life, and service-level events that could affect your workloads. Follow the AWS Trusted Advisor recommendations to ensure your accounts follow best practices.
Figure 8. Dimensions for operational visibility (click the image to enlarge)
Figure 9 explores various application and infrastructure components integrating with AWS logging and monitoring components for increased problem detection and resolution, which can provide operational visibility.
Figure 9. Tooling architecture to provide operational visibility
Having an incident response management plan is an important mechanism for providing operational visibility. Successful execution of this requires educating the stakeholders on the AWS shared responsibility model, simulation of anticipated and unanticipated failures, documentation of the distributed system’s KPIs, and continuous iteration. Figure 10 demonstrates the features of a successful incidence response management plan.
Figure 10. An incidence response management plan (click the image to enlarge)
Conclusion
In Part 3, we discussed continuous improvement of our processes by testing and breaking them. In order to understand the baseline level metrics, service-level agreements, and boundary conditions of our system, we need to capture NFRs. Operational capabilities are required to capture deviations from baseline, which is where alerting, logging, and distributed tracing come in. Processes should be defined for automating frequent testing in CI/CD pipelines, detecting network issues, and deploying alternate infrastructure stacks in failover regions based on RTOs and RPOs. Automating failover steps depends on metrics and alarms, and by using chaos testing, we can simulate failover scenarios.
Prepare for failure, and learn from it. Working to maintain resilience is an ongoing task.
Amazon Web Services (AWS) users ask how to accelerate their teams’ deployments on AWS while maintaining compliance with security controls. In this blog post, we describe common governance models introduced in mature organizations to manage their teams’ AWS deployments. These models are best used to increase the maturity of your cloud infrastructure deployments.
Governance models for AWS deployments
We distinguish three common models used by mature cloud adopters to manage their infrastructure deployments on AWS. The models differ in what they control: the infrastructure code, deployment toolchain, or provisioned AWS resources. We define the models as follows:
Central pattern library, which offers a repository of curated deployment templates that application teams can re-use with their deployments.
Continuous Integration/Continuous Delivery (CI/CD) as a service, which offers a toolchain standard to be re-used by application teams.
Centrally managed infrastructure, which allows application teams to deploy AWS resources managed by central operations teams.
The decision of how much responsibility you shift to application teams depends on their autonomy, operating model, application type, and rate of change. The three models can be used in tandem to address different use cases and maximize impact. Typically, organizations start by gathering pre-approved deployment templates in a central pattern library.
Model 1: Central pattern library
With this model, cloud platform engineers publish a central pattern library from which teams can reference infrastructure as code templates. Application teams reuse the templates by forking the central repository or by copying the templates into their own repository. Application teams can also manage their own deployment AWS account and pipeline with AWS CodePipeline), as well as the resource-provisioning process, while reusing templates from the central pattern library with a service like AWS CodeCommit. Figure 1 provides an overview of this governance model.
Figure 1. Deployment governance with central pattern library
The central pattern library represents the least intrusive form of enablement via reusable assets. Application teams appreciate the central pattern library model, as it allows them to maintain autonomy over their deployment process and toolchain. Reusing existing templates speeds up the creation of your teams’ first infrastructure templates and eases policy adherence, such as tagging policies and security controls.
After the reusable templates are in the application team’s repository, incremental updates can be pulled from the central library when the template has been enhanced. This allows teams to pull when they see fit. Changes to the team’s repository will trigger the pipeline to deploy the associated infrastructure code.
With the central pattern library model, application teams need to manage resource configuration and CI/CD toolchain on their own in order to gain the benefits of automated deployments. Model 2 addresses this.
Model 2: CI/CD as a service
In Model 2, application teams launch a governed deployment pipeline from AWS Service Catalog. This includes the infrastructure code needed to run the application and “hello world” source code to show the end-to-end deployment flow.
Cloud platform engineers develop the service catalog portfolio (in this case the CI/CD toolchain). Then, application teams can launch AWS Service Catalog products, which deploy an instance of the pipeline code and populated Git repository (Figure 2).
The pipeline is initiated immediately after the repository is populated, which results in the “hello world” application being deployed to the first environment. The infrastructure code (for example, Amazon Elastic Compute Cloud [Amazon EC2] and AWS Fargate) will be located in the application team’s repository. Incremental updates can be pulled by launching a product update from AWS Service Catalog. This allows application teams to pull when they see fit.
Figure 2. Deployment governance with CI/CD as a service
This governance model is particularly suitable for mature developer organizations with full-stack responsibility or platform projects, as it provides end-to-end deployment automation to provision resources across multiple teams and AWS accounts. This model also adds security controls over the deployment process.
Since there is little room for teams to adapt the toolchain standard, the model can be perceived as very opinionated. The model expects application teams to manage their own infrastructure. Model 3 addresses this.
Model 3: Centrally managed infrastructure
This model allows application teams to provision resources managed by a central operations team as self-service. Cloud platform engineers publish infrastructure portfolios to AWS Service Catalog with pre-approved configuration by central teams (Figure 3). These portfolios can be shared with all AWS accounts used by application engineers.
Provisioning AWS resources via AWS Service Catalog products ensures resource configuration fulfills central operations requirements. Compared with Model 2, the pre-populated infrastructure templates launch AWS Service Catalog products, as opposed to directly referencing the API of the corresponding AWS service (for example Amazon EC2). This locks down how infrastructure is configured and provisioned.
Figure 3. Deployment governance with centrally managed infrastructure
In our experience, it is essential to manage the variety of AWS Service Catalog products. This avoids proliferation of products with many templates differing slightly. Centrally managed infrastructure propagates an “on-premises” mindset so it should be used only in cases where application teams cannot own the full stack.
Models 2 and 3 can be combined for application engineers to launch both deployment toolchain and resources as AWS Service Catalog products (Figure 4), while also maintaining the opportunity to provision from pre-populated infrastructure templates in the team repository. After the code is in their repository, incremental updates can be pulled by running an update from the provisioned AWS Service Catalog product. This allows the application team to pull an update as needed while avoiding manual deployments of service catalog products.
Figure 4. Using AWS Service Catalog to automate CI/CD and infrastructure resource provisioning
Comparing models
The three governance models differ along the following aspects (see Table 1):
Governance level: What component is managed centrally by cloud platform engineers?
Role of application engineers: What is the responsibility split and operating model?
Use case: When is each model applicable?
Table 1. Governance models for managing infrastructure deployments
Model 1: Central pattern library
Model 2: CI/CD as a service
Model 3: Centrally managed infrastructure
Governance level
Centrally defined infrastructure templates
Centrally defined deployment toolchain
Centrally defined provisioning and management of AWS resources
Role of cloud platform engineers
Manage pattern library and policy checks
Manage deployment toolchain and stage checks
Manage resource provisioning (including CI/CD)
Role of application teams
Manage deployment toolchain and resource provisioning
Manage resource provisioning
Manage application integration
Use case
Federated governance with application teams maintaining autonomy over application and infrastructure
Platform projects or development organizations with strong preference for pre-defined deployment standards including toolchain
Applications without development teams (e.g., “commercial-off-the-shelf”) or with separation of duty (e.g., infrastructure operations teams)
Conclusion
In this blog post, we distinguished three common governance models to manage the deployment of AWS resources. The three models can be used in tandem to address different use cases and maximize impact in your organization. The decision of how much responsibility is shifted to application teams depends on your organizational setup and use case.
Underwriting for life insurance can be quite manual and often time-intensive with lots of re-keying by advisers before underwriting decisions can be made and policies finally issued. In the digital age, people purchasing life insurance want self-service interactions with their prospective insurer. People want speed of transaction with time to cover reduced from days to minutes. While this has been achieved in the general insurance space with online car and home insurance journeys, this is not always the case in the life insurance space. This is where Munich Re Automation Solutions Ltd (MRAS) offers its customers, a competitive edge to shrink the quote-to-fulfilment process using their ALLFINANZ solution.
ALLFINANZ is a cloud-based life insurance and analytics solution to underwrite new life insurance business. It is designed to transform the end consumer’s journey, delivering everything they need to become a policyholder. The core digital services offered to all ALLFINANZ customers include Rulebook Hub, Risk Assessment Interview delivery, Decision Engine, deep analytics (including predictive modeling capabilities), and technical integration services—for example, API integration and SSO integration.
Current state architecture
The ALLFINANZ application began as a traditional three-tier architecture deployed within a datacenter. As MRAS migrated their workload to the AWS cloud, they looked at their regulatory requirements and the technology stack, and decided on the silo model of the multi-tenant SaaS system. Each tenant is provided a dedicated Amazon Virtual Private Cloud (VPC) that holds network and application components, fully isolated from other primary insurers.
As an entry point into the ALLFINANZ environment, MRAS uses Amazon Route 53 to route incoming traffic to the appropriate Amazon VPC. The routing relies on a model where subdomains are assigned to each tenant, for example the subdomain allfinanz.tenant1.munichre.cloud is the subdomain for tenant 1. The diagram below shows the ALLFINANZ architecture. Note: not all links between components are shown here for simplicity.
Figure 1. Current high-level solution architecture for the ALLFINANZ solution
The solution uses Route 53 as the DNS service, which provides two entry points to the SaaS solution for MRAS customers:
The URL allfinanz.<tenant-id>.munichre.cloud allows user access to the ALLFINANZ Interview Screen (AIS). The AIS can exist as a standalone application, or can be integrated with a customer’s wider digital point-of -sale process.
The URL api.allfinanz.<tenant-id>.munichre.cloud is used for accessing the application’s Web services and REST APIs.
Traffic from both entry points flows through the load balancers. While HTTP/S traffic from the application user access entry point flows through an Application Load Balancer (ALB), TCP traffic from the REST API clients flows through a Network Load Balancer (NLB). Transport Layer Security (TLS) termination for user traffic happens at the ALB using certificates provided by the AWS Certificate Manager. Secure communication over the public network is enforced through TLS validation of the server’s identity.
Unlike application user access traffic, REST API clients use mutual TLS authentication to authenticate a customer’s server. Since NLB doesn’t support mutual TLS, MRAS opted for a solution to pass this traffic to a backend NGINX server for the TLS termination. Mutual TLS is enforced by using self-signed client and server certificates issued by a certificate authority that both the client and the server trust.
Authenticated traffic from ALB and NGINX servers is routed to EC2 instances hosting the application logic. These EC2 instances are hosted in an auto-scaling group spanning two Availability Zones (AZs) to provide high availability and elasticity, therefore, allowing the application to scale to meet fluctuating demand.
Application transactions are persisted in the backend Amazon Relational Database Service MySQL instances. This database layer is configured across multi-AZs, providing high availability and automatic failover.
The application requires the capability to integrate evidence from data sources external to the ALLFINANZ service. This message sharing is enabled through the Amazon MQ managed message broker service for Apache Active MQ.
Amazon CloudWatch is used for end-to-end platform monitoring through logs collection and application and infrastructure metrics and alerts to support ongoing visibility of the health of the application.
Software deployment and associated infrastructure provisioning is automated through infrastructure as code using a combination of Git, Amazon CodeCommit, Ansible, and Terraform.
Amazon GuardDuty continuously monitors the application for malicious activity and delivers detailed security findings for visibility and remediation. GuardDuty also allows MRAS to provide evidence of the application’s strong security posture to meet audit and regulatory requirements.
High availability, resiliency, and security
MRAS deploys their solution across multiple AWS AZs to meet high-availability requirements and ensure operational resiliency. If one AZ has an ongoing event, the solution will remain operational, as there are instances receiving production traffic in another AZ. As described above, this is achieved using ALBs and NLBs to distribute requests to the application subnets across AZs.
The ALLFINANZ solution uses private subnets to segregate core application components and the database storage platform. Security groups provide networking security measures at the elastic network interface level. MRAS restrict access from incoming connection requests to ranges of IP addresses by attaching security groups to the ALBs. Amazon Inspector monitors workloads for software vulnerabilities and unintended network exposure. AWS WAF is integrated with the ALB to protect from SQL injection or cross-site scripting attacks on the application.
Optimizing the existing workload
One of the key benefits of this architecture is that now MRAS can standardize the infrastructure configuration and ensure consistent versioning of the workload across tenants. This makes onboarding new tenants as simple as provisioning another VPC with the same infrastructure footprint.
MRAS are continuing to optimize their architecture iteratively, examining components to modernize to cloud-native components and evolving towards the pool model of multi-tenant SaaS architecture wherever possible. For example, MRAS centralized their per-tenant NAT gateway deployment to a centralized outbound Internet routing design using AWS Transit Gateway, saving approximately 30% on their overall NAT gateway spend.
Conclusion
The AWS global infrastructure has allowed MRAS to serve more than 40 customers in five AWS regions around the world. This solution improves customers’ experience and workload maintainability by standardizing and automating the infrastructure and workload configuration within a SaaS model, compared with multiple versions for the on-premise deployments. SaaS customers are also freed up from the undifferentiated heavy lifting of infrastructure operations, allowing them to focus on their business of underwriting for life insurance.
In this blog post, we present a lifecycle that helps you build, validate, and improve your own AWS Well-Architected Custom Lens, in order to roll it out across your whole organization. The AWS Well-Architected Custom Lens is a new feature of the AWS Well-Architected Tool that lets you bring your own best practices to complement the existing Well-Architected Framework.
The Custom Lens lifecycle: how a Custom Lens can benefit your organization
Figure 1. The AWS Well-Architected Custom Lens lifecycle
Each organization has its own requirements, processes, best practices, and tools, but the information can be spread over many systems and knowledge bases. A Custom Lens can capture the specifics of a working environment and let coworkers access this information in a single place—from the AWS console—without the need to go to a separate tool. A Custom Lens can be created in a central management account and securely shared with other accounts.
A Custom Lens can be updated periodically as either a major or minor version. If it is a minor version, the change is automatically applied to all accounts that the lens has been shared with. If it is a major version, the user has to accept the updated Custom Lens and a summary of the changes is displayed to the user. Accepting the changes then applies the update for existing workload reviews, and prompts the user to review the workload. Thus, updating a Custom Lens is an effective mechanism to continuously inform teams about new best practices.
In addition, maintaining and improving a Custom Lens continuously helps to identify gaps in organization-wide tooling, guidance, or documentation. You can aggregate feedback and metrics from reviews that have been performed and use it to drive the improvement process of the content. More importantly, the gathered metrics help measure the overall adherence to best practices and requirements in your organization. If you focus on creating clear, concise, and actionable content for your Custom Lens, the time needed to identify and implement improvements is reduced. As teams realize the value of the Custom Lens, more reviews will be performed, and you will receive more data to construct a comprehensive view.
1. Plan
The Plan phase identifies the benefits that a Custom Lens can provide your organization by identifying current gaps. You also define the scope of your Custom Lens, which is the type of content that supports your desired business outcomes. Depending on the scope, you need to identify the appropriate stakeholders and gain support for the initiative.
2. Implement
In the Implement phase, content is created for the Custom Lens with a working group. While doing this, you can identify missing supplementary artefacts, like documentation or tooling. If that is the case, you can create these artefacts and link to them from the Custom Lens Improvement Plan.
As part of the implementation, the Custom Lens is created by uploading a JSON file in the appropriate format to a central management account, then, sharing the lens with the organization’s AWS accounts. You can share the Custom Lens with IAM Principals, such as users, roles, and AWS accounts. For broader and more efficient sharing, you now have the ability to scale by sharing your Custom Lens with individual organizational units or the entire AWS Organizations. This feature reduces management overhead and removes the need for a custom automation.
3. Measure
The Measure phase aggregates feedback and metrics from reviews that have been performed with your Custom Lens; this information is used to drive the improvement process.
The Well-Architected Tool offers a way to share workload reviews, and you can use this to share all reviews with a central AWS account. You can then analyze the reviews in the central account by extracting the data and analyzing it, for example, by building a dashboard. The Well-Architected Lab for building custom reports provides a solution that can be implemented.
4. Improve
In the Improve phase, the gathered metrics and feedback are used to identify areas for future improvement. For example, you might find common gaps among the performed workload reviews, where the same best practices are not fulfilled. When you investigate the root cause, you can learn that the existing content lacks clarity or that the suggested tools are difficult to use.
In addition, improvements, such as content gaps that were not addressed during the first iteration of the Custom Lens, can be added to the backlog before you repeat the cycle.
To roll out changes of your Custom Lens in an automated and repeatable fashion, you can implement the architecture depicted in Figure 2.
Figure 2. Combining AWS CodeCommit with AWS Lambda to update your Custom Lens whenever a file change is pushed to the code repository
This architecture enables automated releases of new versions of your Custom Lens whenever you commit an updated JSON file to the code repository. In detail, the steps are:
The JSON file of your Custom Lens is stored in an AWS CodeCommit repository. An author pushes an updated version of the file to the repository.
The CodeCommit repository is configured with a trigger action that invokes an AWS Lambda function on each commit.
The Lambda function downloads the updated file by using the GetFile API of CodeCommit. Then, the Lambda function imports the updated Custom Lens and publishes it as a new version by using ImportLens and CreateLensVersion APIs of the AWS Well-Architected Tool, then shares the Custom Lens using CreateLensShare.
The updated Custom Lens is available in all accounts that the lens has been shared with.
Reviewers can create new workload reviews with the Custom Lens or upgrade to the newest version for existing workload reviews.
Conclusion
In this blog post, we walked you through the Custom Lens lifecycle, a process to create and continuously improve a Custom Lens for your organization. If you have a special software development lifecycle, a customized security and compliance framework, or other highly specific requirements or best practices that you want disseminated and measurable, learn more about how to create a Custom Lens in the Well-Architected Tool.
AWS Well-Architected is a set of guiding design principles developed by AWS to help organizations build secure, high-performing, resilient, and efficient infrastructure for a variety of applications and workloads. Use the AWS Well-Architected Tool to review your workloads periodically to address important design considerations and ensure that they follow the best practices and guidance of the AWS Well-Architected Framework. For follow up questions or comments, join our growing community on AWS re:Post.
How to mitigate Docker Hub’s pull rate limit errors
Docker, Inc. has announced that its hosted repository service, Docker Hub, will begin limiting the rate at which the Docker images are being pulled. The pull rate limit will purely be based on the individual IP Address. The anonymous user can do 100 pulls per 6 hours per IP Address, while the authenticated user can do 200 pulls per 6 hours.
For this post, we’ll be using the following AWS services
AWS CodeCommit – a fully-managed source control service that hosts secure Git-based repositories.
AWS CodeBuild – a fully managed continuous integration service that compiles source code, runs tests, and produces software packages that are ready to deploy.
Amazon ECR – an AWS managed container image registry service that is secure, scalable, and reliable.
Prerequisites
The prerequisites, before we build the pipeline, are as follows:
Install a Git client to clone the source code and to push the code to CodeCommit.
Dockerfile – Sample file to produce the Docker image and push it to an Amazon ECR.
We’ll be setting up two Amazon ECR repositories. The first repository, “golang”, will hold the base image which we will be migrating from Docker hub. And the second repository, “mydemorepo”, will hold the final image for your sample application.
Figure 2. ECR Repositories with Source and Target image.
Migrate your existing Docker image from Docker Hub to Amazon ECR
Note that for this post, I’ll be using golang:1.12-alpine as the base Docker image to be migrated to Amazon ECR.
Once you have your base repository setup, the next step is to pull the golang:1.12-alpine public image from docker hub to you laptop/Server.
To do that, log in to your local server where you have deployed all of the prerequisites. This includes the Docker engine, Git Client, AWS CLI, etc., and run the following command:
docker pull golang:1.12-alpine
Authenticate to your Amazon ECR private registry, and click here to learn more about private registry authentication.
Once your image gets pushed to Amazon ECR with all of the required tags, the next step is to use this base image as the source image to build our sample application. Furthermore, while going through the “Overview of the Solution” section, you might have noticed that we must have a source code repository for CodeBuild to fetch the latest code from, and to build a sample application. Let’s go through how to set up your source code repository.
Set up a source code repository using CodeCommit
Let’s start by setting up the repository name. In this case, let’s call it “mysampleapp”. Keep rest of the settings as is, and then select create.
Figure 4. Screenshot for creating a repository under AWS Code Commit.
Once the repository gets created, go to the top-right corner. Under Clone URL, select Clone HTTPS.
Figure 5. Clone URL to copy the code Locally on your desktop or server.
Point your Dockfile to use Amazon ECR repository instead of Docker hub.
FROM golang:1.12-alpine AS build << Replace the public Image with ECR private image
FROM 150359982618.dkr.ecr.us-east-1.amazonaws.com/golang: 1.12-alpine
AS build
#Install git
RUN apk add --no-cache git
#Get the hello world package from a GitHub repository
RUN go get github.com/golang/example/hello
WORKDIR /go/src/github.com/golang/example/hello
#Build the project and send the output to /bin/HelloWorld
RUN go build -o /bin/HelloWorld
README.md
> Demo Repository has files related to CodeBuild spec and Dockerfile
* buildspec.yaml * Dockerfile
Now, commit your changes locally, and push them to Amazon ECR. Note that to learn more about how to set up HTTPS users using Git Credentials, click here.
git add . git commit -m "My First Commit - Sample App" git push -u origin master
Now, go back to your AWS Management Console, and Under Developer Tools, select CodeCommit. Go to mysampleapp, and you should see three files with the latest commits.
Figure 7. Screenshot with buildspec, Dockerfile and README
That concludes our setup to CodeCommit. Next, we’ll set up a build project.
Set up a CodeBuild project
Enter the project name, in this case let’s use “mysamplbuild”.
Figure 8. Setting up a Build Project.
Select the provider as CodeCommit, followed by the repository and the branch that contains the latest commit.
Figure 9. Selecting the source code provider which is Code Commit and the source repository.
Select the runtime as standard, and then choose the latest Amazon Linux image. Make sure that the environment type is set to Linux. Privileged option should be checked. For the rest of the options, go with the defaults.
Figure 10. Required environment variables and attributes.
Figure 11. Choose the buildspec.
Once the project gets created, select the project, and select start Build.
Figure 12. Screenshot of the build project along with details.
Once you trigger the build, you will notice that CodeBuild is pulling the image from Amazon ECR instead of Docker hub.
Figure 13. The log file for the build.
Clean up
To avoid incurring future charges, delete the resources.
Developers can use AWS to host both their private and public container images. This decreases the need to use different public websites and registries. Public images will be geo-replicated for reliable availability around the world, and they’ll offer fast downloads to quickly serve up images on-demand. Anyone (with or without an AWS account) will be able to browse and pull containerized software for use in their own applications.
As of February 2022, the AWS Cloud spans 84 Availability Zones within 26 geographic Regions, with announced plans for more Availability Zones and Regions. Customers can leverage this global infrastructure to expand their presence to their primary target of users, satisfying data residency requirements, and implementing disaster recovery strategy to make sure of business continuity. Although leveraging multi-Region architecture would address these requirements, deploying and configuring consistent infrastructure stacks across multi-Regions could be challenging, as AWS Regions are designed to be autonomous in nature. Multi-region deployments with Terraform and AWS CodePipeline can help customers with these challenges.
In this post, we’ll demonstrate the best practice for multi-Region deployments using HashiCorp Terraform as infrastructure as code (IaC), and AWS CodeBuild , CodePipeline as continuous integration and continuous delivery (CI/CD) for consistency and repeatability of deployments into multiple AWS Regions and AWS Accounts. We’ll dive deep on the IaC deployment pipeline architecture and the best practices for structuring the Terraform project and configuration for multi-Region deployment of multiple AWS target accounts.
You can find the sample code for this solution here
Solutions Overview
Architecture
The following architecture diagram illustrates the main components of the multi-Region Terraform deployment pipeline with all of the resources built using IaC.
DevOps engineer initially works against the infrastructure repo in a short-lived branch. Once changes in the short-lived branch are ready, DevOps engineer gets them reviewed and merged into the main branch. Then, DevOps engineer git tags the repo. For any future changes in the infra repo, DevOps engineer repeats this same process.
Fig 1. Tagging to release from the main branch.
The deployment is triggered from DevOps engineer git tagging the repo, which contains the Terraform code to be deployed. This action starts the deployment pipeline execution. Tagging with ‘dev_us-east-1/research/1.0’ triggers a pipeline to deploy the research dev account to us-east-1. In our example git tag ‘dev_us-east-1/research/1.0’ contains the target environment (i.e., dev), AWS Region (i.e. us-east-1), team (i.e., research), and a version number (i.e., 1.0) that maps to an annotated tag on a commit ID. The target workload account aliases (i.e., research dev, risk qa) are mapped to AWS account numbers in the environment configuration files of the infra repo in AWS CodeCommit.
Fig 2. Multi-Region AWS deployment with IaC and CI/CD pipelines.
To capture the exact git tag that starts a pipeline, we use an Amazon EventBridge rule. The rule is triggered when the tag is created with an environment prefix for deploying to a respective environment (i.e., dev). The rule kicks off an AWS CodeBuild project that takes the git tag from the AWS CodeCommit event and stores it with a full clone of the repo into a versioned Amazon Simple Storage Service (Amazon S3) bucket for the corresponding environment.
We have a continuous delivery pipeline defined in AWS CodePipeline. To make sure that the pipelines for each environment run independent of each other, we use a separate pipeline per environment. Each pipeline consists of three stages in addition to the Source stage:
IaC linting stage – A stage for linting Terraform code. For illustration purposes, we’ll use the open source tool tflint.
IaC security scanning stage – A stage for static security scanning of Terraform code. There are many tooling choices when it comes to the security scanning of Terraform code. Checkov, TFSec, and Terrascan are the commonly used tools. For illustration purposes, we’ll use the open source tool Checkov.
IaC build stage – A stage for Terraform build. This includes an action for the Terraform execution plan followed by an action to apply the plan to deploy the stack to a specific Region in the target workload account.
Once the Terraform apply is triggered, it deploys the infrastructure components in the target workload account to the AWS Region based on the git tag. In turn, you have the flexibility to point the deployment to any AWS Region or account configured in the repo.
The sample infrastructure in the target workload account consists of an AWS Identity and Access Management (IAM) role, an external facing Application Load Balancer (ALB), as well as all of the required resources down to the Amazon Virtual Private Cloud (Amazon VPC). Upon successful deployment, browsing to the external facing ALB DNS Name URL displays a very simple message including the location of the Region.
Architectural considerations
Multi-account strategy
Leveraging well-architected multi-account strategy, we have a separate central tooling account for housing the code repository and infrastructure pipeline, and a separate target workload account to house our sample workload infra-architecture. The clean account separation lets us easily control the IAM permission for granular access and have different guardrails and security controls applied. Ultimately, this enforces the separation of concerns as well as minimizes the blast radius.
Fig 3. A separate pipeline per environment.
The sample architecture shown above contained a pipeline per environment (DEV, QA, STAGING, PROD) in the tooling account deploying to the target workload account for the respective environment. At scale, you can consider having multiple infrastructure deployment pipelines for multiple business units in the central tooling account, thereby targeting workload accounts per environment and business unit. If your organization has a complex business unit structure and is bound to have different levels of compliance and security controls, then the central tooling account can be further divided into the central tooling accounts per business unit.
Pipeline considerations
The infrastructure deployment pipeline is hosted in a central tooling account and targets workload accounts. The pipeline is the authoritative source managing the full lifecycle of resources. The goal is to decrease the risk of ad hoc changes (e.g., manual changes made directly via the console) that can’t be easily reproduced at a future date. The pipeline and the build step each run as their own IAM role that adheres to the principle of least privilege. The pipeline is configured with a stage to lint the Terraform code, as well as a static security scan of the Terraform resources following the principle of shifting security left in the SDLC.
As a further improvement for resiliency and applying the cell architecture principle to the CI/CD deployment, we can consider having multi-Region deployment of the AWS CodePipeline pipeline and AWS CodeBuild build resources, in addition to a clone of the AWS CodeCommit repository. We can use the approach detailed in this post to sync the repo across multiple regions. This means that both the workload architecture and the deployment infrastructure are multi-Region. However, it’s important to note that the business continuity requirements of the infrastructure deployment pipeline are most likely different than the requirements of the workloads themselves.
Fig 4. Multi-Region CI/CD dev pipelines targeting the dev workload account resources in the respective Region.
Deeper dive into Terraform code
Backend configuration and state
As a prerequisite, we created Amazon S3 buckets to store the Terraform state files and Amazon DynamoDB tables for the state file locks. The latter is a best practice to prevent concurrent operations on the same state file. For naming the buckets and tables, our code expects the use of the same prefix (i.e., <tf_backend_config_prefix>-<env> for buckets and <tf_backend_config_prefix>-lock-<env> for tables). The value of this prefix must be passed in as an input param (i.e., “tf_backend_config_prefix”). Then, it’s fed into AWS CodeBuild actions for Terraform as an environment variable. Separation of remote state management resources (Amazon S3 bucket and Amazon DynamoDB table) across environments makes sure that we’re minimizing the blast radius.
Fig 5. Terraform state file buckets and state lock tables per environment in the central tooling account.
The git tag that kicks off the pipeline is named with the following convention of “<env>_<region>/<team>/<version>” for regional deployments and “<env>_global/<team>/<version>” for global resource deployments. The stage following the source stage in our pipeline, tflint stage, is where we parse the git tag. From the tag, we derive the values of environment, deployment scope (i.e., Region or global), and team to determine the Terraform state Amazon S3 object key uniquely identifying the Terraform state file for the deployment. The values of environment, deployment scope, and team are passed as environment variables to the subsequent AWS CodeBuild Terraform plan and apply actions.
We set the Region to the value of AWS_REGION env variable that is made available by AWS CodeBuild, and it’s the Region in which our build is running.
-backend-config="region=$AWS_REGION"
The following is how the Terraform backend config initialization looks in our AWS CodeBuild buildspec files for Terraform actions, such as tflint, plan, and apply.
Using this approach, the Terraform states for each combination of account and Region are kept in their own distinct state file. This means that if there is an issue with one Terraform state file, then the rest of the state files aren’t impacted.
Fig 6. Terraform state files per account and Region for each environment in the central tooling account
Following the example, a git tag of the form “dev_us-east-1/research/1.0” that kicks off the dev pipeline works against the research team’s dev account’s state file containing us-east-1 Regional resources (i.e., Amazon S3 object key “research/dev-us-east-1/terraform.tfstate” in the S3 bucket <tf_backend_config_prefix>-dev), and a git tag of the form “dev_ap-southeast-1/risk/1.0” that kicks off the dev pipeline works against the risk team’s dev account’s Terraform state file containing ap-southeast-1 Regional resources (i.e., Amazon S3 object key “risk/dev-ap-southeast-1/terraform.tfstate”). For global resources, we use a git tag of the form “dev_global/research/1.0” that kicks off a dev pipeline and works against the research team’s dev account’s global resources as they are at account level (i.e., “research/dev-global/terraform.tfstate).
Fig 7. Git tags and the respective Terraform state files.
This backend configuration makes sure that the state file for one account and Region is independent of the state file for the same account but different Region. Adding or expanding the workload to additional Regions would have no impact on the state files of existing Regions.
If we look at the further improvement where we make our deployment infrastructure also multi-Region, then we can consider each Region’s CI/CD deployment to be the authoritativesource for its local Region’s deployments and Terraform state files. In this case, tagging against the repo triggers a pipeline within the local CI/CD Region to deploy resources in the Region. The Terraform state files in the local Region are used for keeping track of state for the account’s deployment within the Region. This further decreases cross-regional dependencies.
Fig 8. Multi-Region CI/CD with Terraform state resources stored in the same Region as the workload account resources for the respective Region
Provider
For deployments, we use the default Terraform AWS provider. The provider is parametrized with the value of the region passed in as an input parameter.
provider "aws" {
  region = var.region
   ...
}
Once the provider knows which Region to target, we can refer to the current AWS Region in the rest of the code.
# The value of the current AWS region is the name of the AWS region configured on the provider
# https://registry.terraform.io/providers/hashicorp/aws/latest/docs/data-sources/region
data "aws_region" "current" {}

locals {
    region = data.aws_region.current.name # then use local.region where region is needed
}
Provider is configured to assume a cross account IAM role defined in the workload account. The value of the account ID is fed as an input parameter.
We keep the Regional resources and the global resources (e.g., IAM role or policy) in distinct namespaces following the cell architecture principle. We treat each Region as one cell, with the goal of decreasing cross-regional dependencies. Regional resources are created once in each Region. On the other hand, global resources are created once globally and may have cross-regional dependencies (e.g., DynamoDB global table with a replica table in multiple Regions). There’s no “global” Terraform AWS provider since the AWS provider requires a Region. This means that we pick a specific Region from which to deploy our global resources (i.e., global_resource_deploy_from_region input param). By creating a distinct Terraform namespace for Regional resources (e.g., module.regional) and a distinct namespace for global resources (e.g., module.global), we can target a deployment for each using pipelines scoped to the respective namespace (e.g., module.global or module.regional).
Fig 9. Deploying regional and global resources scoped to the Terraform namespace
As global resources have a scope of the whole account regardless of Region while Regional resources are scoped for the respective Region in the account, one point of consideration and a trade-off with having to pick a Region to deploy global resources is that this introduces a dependency on that region for the deployment of the global resources. In addition, in the case of a misconfiguration of a global resource, there may be an impact to each Region in which we deployed our workloads. Let’s consider a scenario where an IAM role has access to an S3 bucket. If the IAM role is misconfigured as a result of one of the deployments, then this may impact access to the S3 bucket in each Region.
There are alternate approaches, such as creating an IAM role per Region (myrole-use1 with access to the S3 bucket in us-east-1, myrole-apse1 with access to the S3 bucket in ap-southeast-1, etc.). This would make sure that if the respective IAM role is misconfigured, then the impact is scoped to the Region. Another approach is versioning our global resources (e.g., myrole-v1, myrole-v2) with the ability to move to a new version and roll back to a previous version if needed. Each of these approaches has different drawbacks, such as the duplication of global resources that may make auditing more cumbersome with the tradeoff of minimizing cross Regional dependencies.
We recommend looking at the pros and cons of each approach and selecting the approach that best suits the requirements for your workloads regarding the flexibility to deploy to multiple Regions.
Consistency
We keep one copy of the infrastructure code and deploy the resources targeted for each Region using this same copy. Our code is built using versioned module composition as the “lego blocks”. This follows the DRY (Don’t Repeat Yourself) principle and decreases the risk of code drift per Region. We may deploy to any Region independently, including any Regions added at a future date with zero code changes and minimal additional configuration for that Region. We can see three advantages with this approach.
The total deployment time per Region remains the same regardless of the addition of Regions. This helps for restrictions, such as tight release windows due to business requirements.
If there’s an issue with one of the regional deployments, then the remaining Regions and their deployment pipelines aren’t affected.
It allows the ability to stagger deployments or the possibility of not deploying to every region in non-critical environments (e.g., dev) to minimize costs and remain in line with the Well Architected Sustainability pillar.
Conclusion
In this post, we demonstrated a multi-account, multi-region deployment approach, along with sample code, with a focus on architecture using IaC tool Terraform and CI/CD services AWS CodeBuild and AWS CodePipeline to help customers in their journey through multi-Region deployments.
Thanks to Welly Siauw, Kenneth Jackson, Andy Taylor, Rodney Bozo, Craig Edwards and Curtis Rissi for their contributions reviewing this post and its artifacts.
Everything fails all the time — Werner Vogels, AWS CTO
At the moment of imminent failure, you want to avoid an unlucky deployment. I’ll start here with a short story that demonstrates the purpose of this post.
The DevOps team has just started a database upgrade with a planned outage of 30 minutes. The team automated the entire upgrade flow, triggered a CI/CD pipeline with no human intervention, and the upgrade is progressing smoothly. Then, 20 minutes in, the pipeline is stuck, and your upgrade isn’t progressing. The maintenance window has expired and customers can’t transact. You’ve created a support case, and the AWS engineer confirmed that the upgrade is failing because of a running AWS Health incident in the us-west-2 Region. The engineer has directed the DevOps team to continue monitoring the status.aws.amazon.com page for updates regarding incident resolution. The event continued running for three hours, during which time customers couldn’t transact. Once resolved, the DevOps team retried the failed pipeline, and it completed successfully.
After the incident, the DevOps team explored the possibilities for avoiding these types of incidents in the future. The team was made aware of AWS Health API that provides programmatic access to AWS Health information. In this post, we’ll help the DevOps team make the most of the AWS Health API to proactively prevent unintended outages.
AWS provides Business and Enterprise Support customers with access to the AWS Health API. Customers can have access to running events in the AWS infrastructure that may impact their service usage. Incidents could be Regional, AZ-specific, or even account specific. During these incidents, it isn’t recommended to deploy or change services that are impacted by the event.
In this post, I will walk you through how to embed AWS Health API insights into your CI/CD pipelines to automatically stop deployments whenever an AWS Health event is reported in a Region that you’re operating in. Furthermore, I will demonstrate how you can automate detection and remediation.
The Demo
In this demo, I will use AWS CodePipeline to demonstrate the idea. I will build a simple pipeline that demonstrates the concept without going into the build, test, and deployment specifics.
CodePipeline Flow
The CodePipeline flow consists of three steps:
Source stage that downloads a CloudFormation template from AWS CodeCommit. The template will be deployed in the last stage.
Custom stage that invokes the AWS Lambda function to evaluate the AWS Health. The Lambda function calls the AWS Health API, evaluates the health risk, and calls back CodePipeline with the assessment result.
Deploy stage that deploys the CloudFormation templates downloaded from CodeCommit in the first stage.
Figure 1. CodePipeline workflow.
Lambda evaluation logic
The Lambda function evaluates whether or not a running AWS Health event may be impacted by the deployment. In this case, the following criteria must be met to consider it as safe to deploy:
Deployment will take place in the North Virginia Region and accordingly the Lambda function will filter on the us-east-1 Region.
A closed event is irrelevant. The Lambda function will filter events with only the open status.
AWS Health API can return different event types that may not be relevant, such as: Scheduled Maintenance, and Account and Billing notifications. The Lambda function will filter only “Issue” type events.
The AWS Health API follows a multi-Region application architecture and has two regional endpoints in an active-passive configuration. To support active-passive DNS failover, AWS Health provides a global endpoint. The Python code is available on GitHub with more information in the README on how to build the Lambda code package.
The Lambda function requires the following AWS Identity and Access Management (IAM) permissions to access AWS Health API, CodePipeline, and publish logs to CloudWatch:
In CodePipeline, create a new stage with a single action to asynchronously invoke a Lambda function. The function will call AWS Health DescribeEvents API to retrieve the list of active health incidents. Then, the function will complete the event analysis and decide whether or not it may impact the running deployment. Finally, the function will call back CodePipeline with the evaluation results through either PutJobSuccessResult or PutJobFailureResult API operations.
If the Lambda evaluation succeeds, then it will call back the pipeline with a PutJobSuccessResult API. In turn, the pipeline will mark the step as successful and complete the execution.
If the Lambda evaluation fails, then it will call back the pipeline with a PutJobFailureResult API specifying a failure message. Once the DevOps team is made aware that the event has been resolved, select the Retry button to re-evaluate the health status.
Your DevOps team must be aware of failed deployments. Therefore, it’s a good idea to configure alerts to notify concerned stakeholders with failed stage executions. Create a notification rule that posts a Slack message if a stage fails. For detailed steps, see Create a notification rule – AWS CodePipeline. In case of failure, a Slack notification will be sent through AWS Chatbot.
Figure 5. Slack UI snapshot notification for a failed deployment.
A more elegant solution involves pushing the notification to an SNS topic that in turns calls a Lambda function to retry the failed stage. The Lambda function extracts the pipeline failed stage identifier, and then calls the RetryStageExecution CodePipeline API.
Conclusion
We’ve learned how to create an automation that evaluates the risk associated with proceeding with a deployment in conjunction with a running AWS Health event. Then, the automation decides whether to proceed with the deployment or block the progress to avoid unintended downtime. Accordingly, this results in the improved availability of your application.
This solution isn’t exclusive to CodePipeline. However, the pattern can be applied to other CI/CD tools that your DevOps team uses.
Author:
The collective thoughts of the interwebz
Manage Consent
To provide the best experiences, we use technologies like cookies to store and/or access device information. Consenting to these technologies will allow us to process data such as browsing behavior or unique IDs on this site. Not consenting or withdrawing consent, may adversely affect certain features and functions.
Functional
Always active
The technical storage or access is strictly necessary for the legitimate purpose of enabling the use of a specific service explicitly requested by the subscriber or user, or for the sole purpose of carrying out the transmission of a communication over an electronic communications network.
Preferences
The technical storage or access is necessary for the legitimate purpose of storing preferences that are not requested by the subscriber or user.
Statistics
The technical storage or access that is used exclusively for statistical purposes.The technical storage or access that is used exclusively for anonymous statistical purposes. Without a subpoena, voluntary compliance on the part of your Internet Service Provider, or additional records from a third party, information stored or retrieved for this purpose alone cannot usually be used to identify you.
Marketing
The technical storage or access is required to create user profiles to send advertising, or to track the user on a website or across several websites for similar marketing purposes.


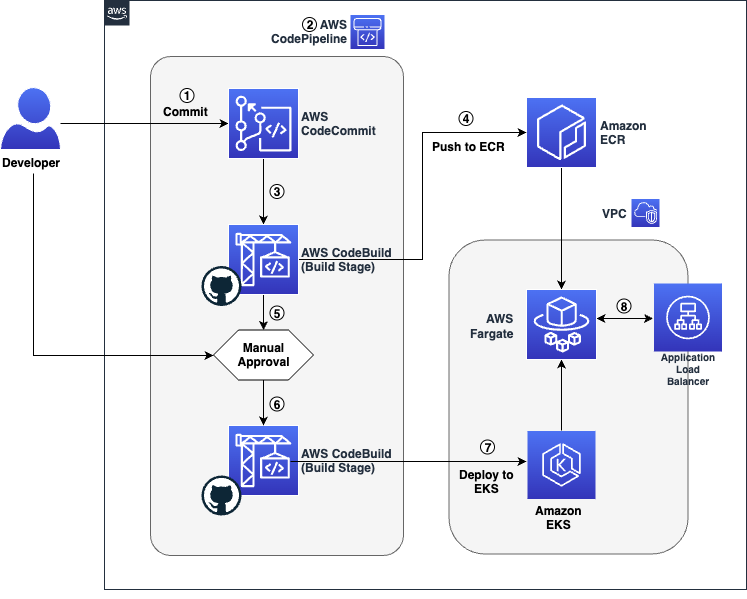


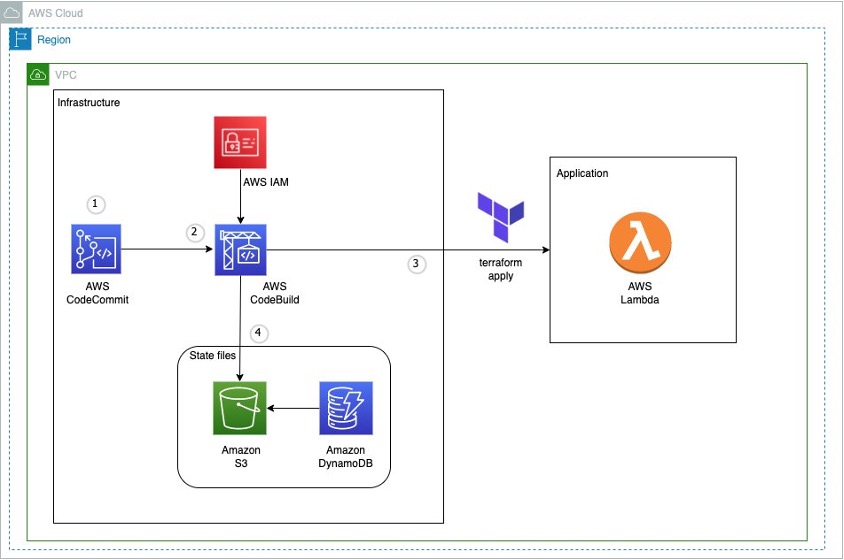
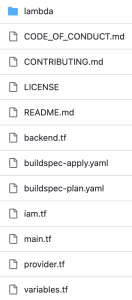
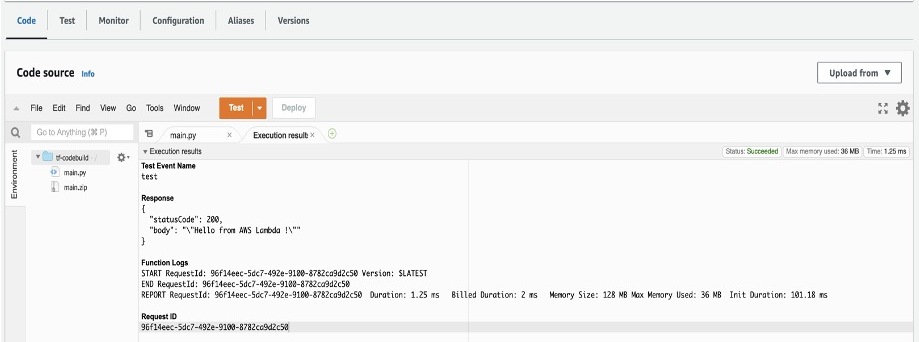
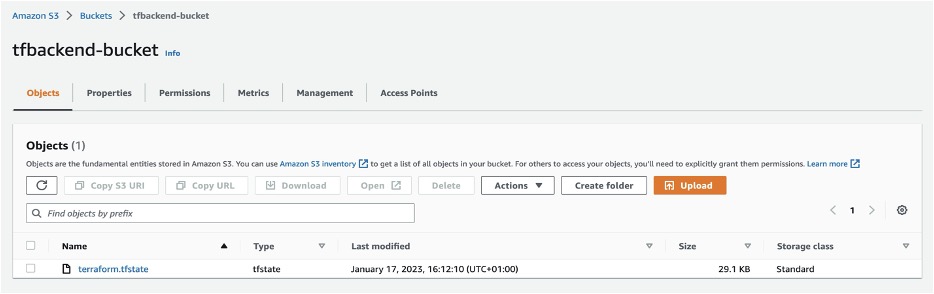
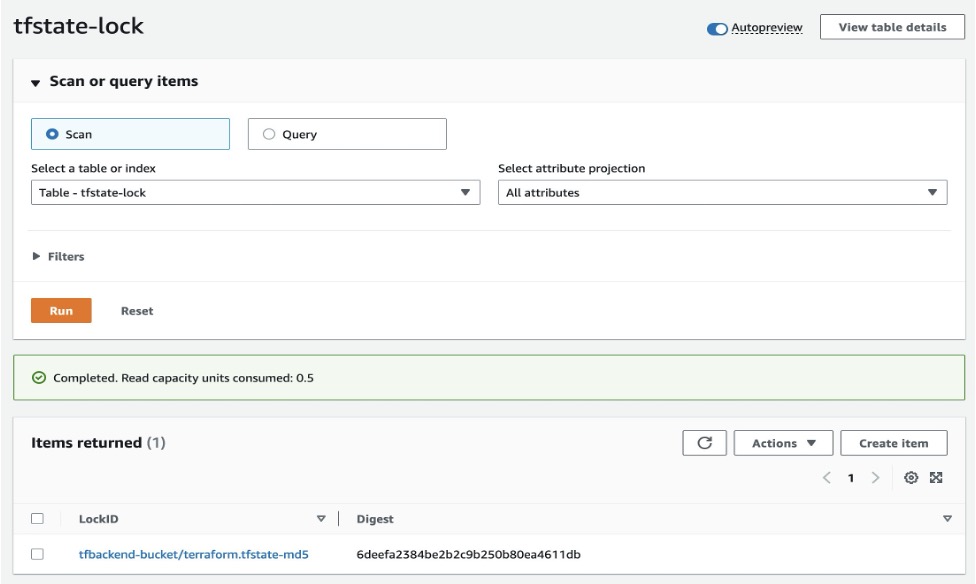


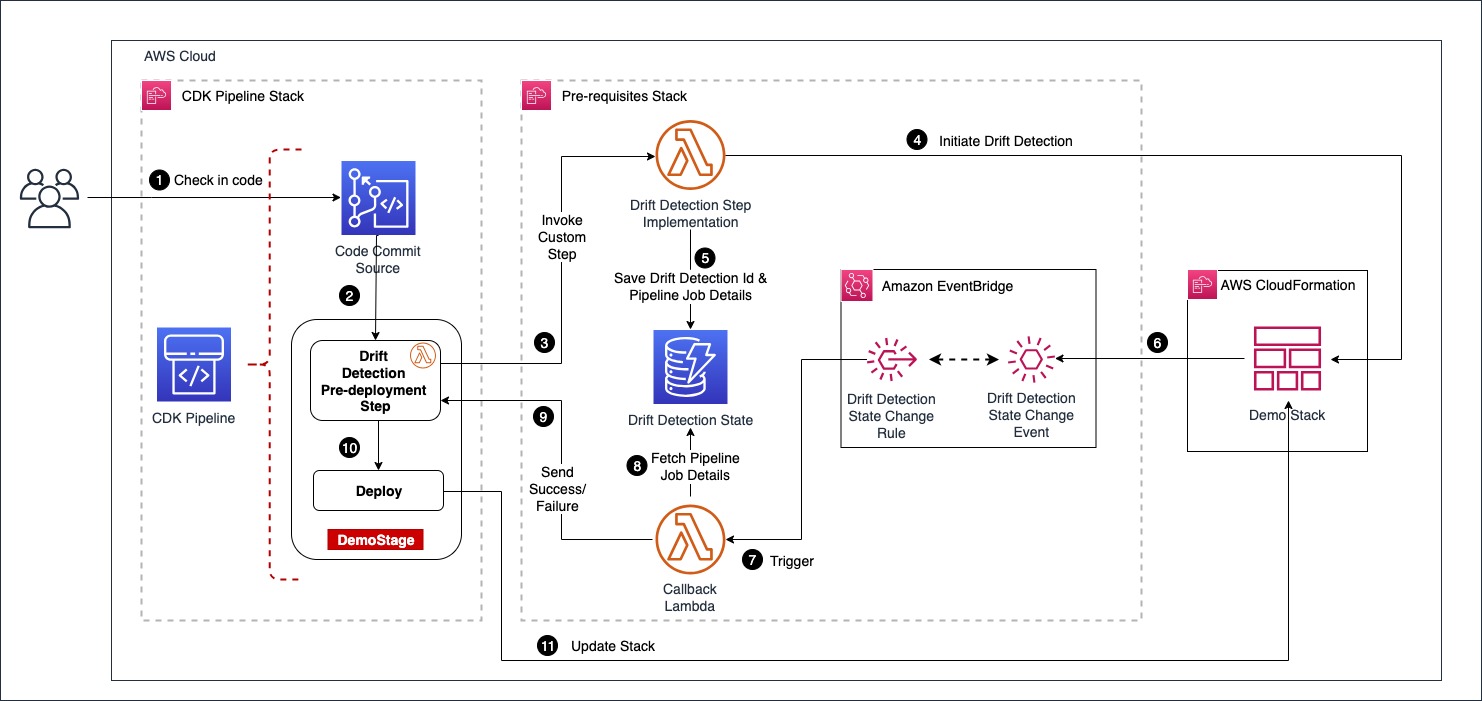


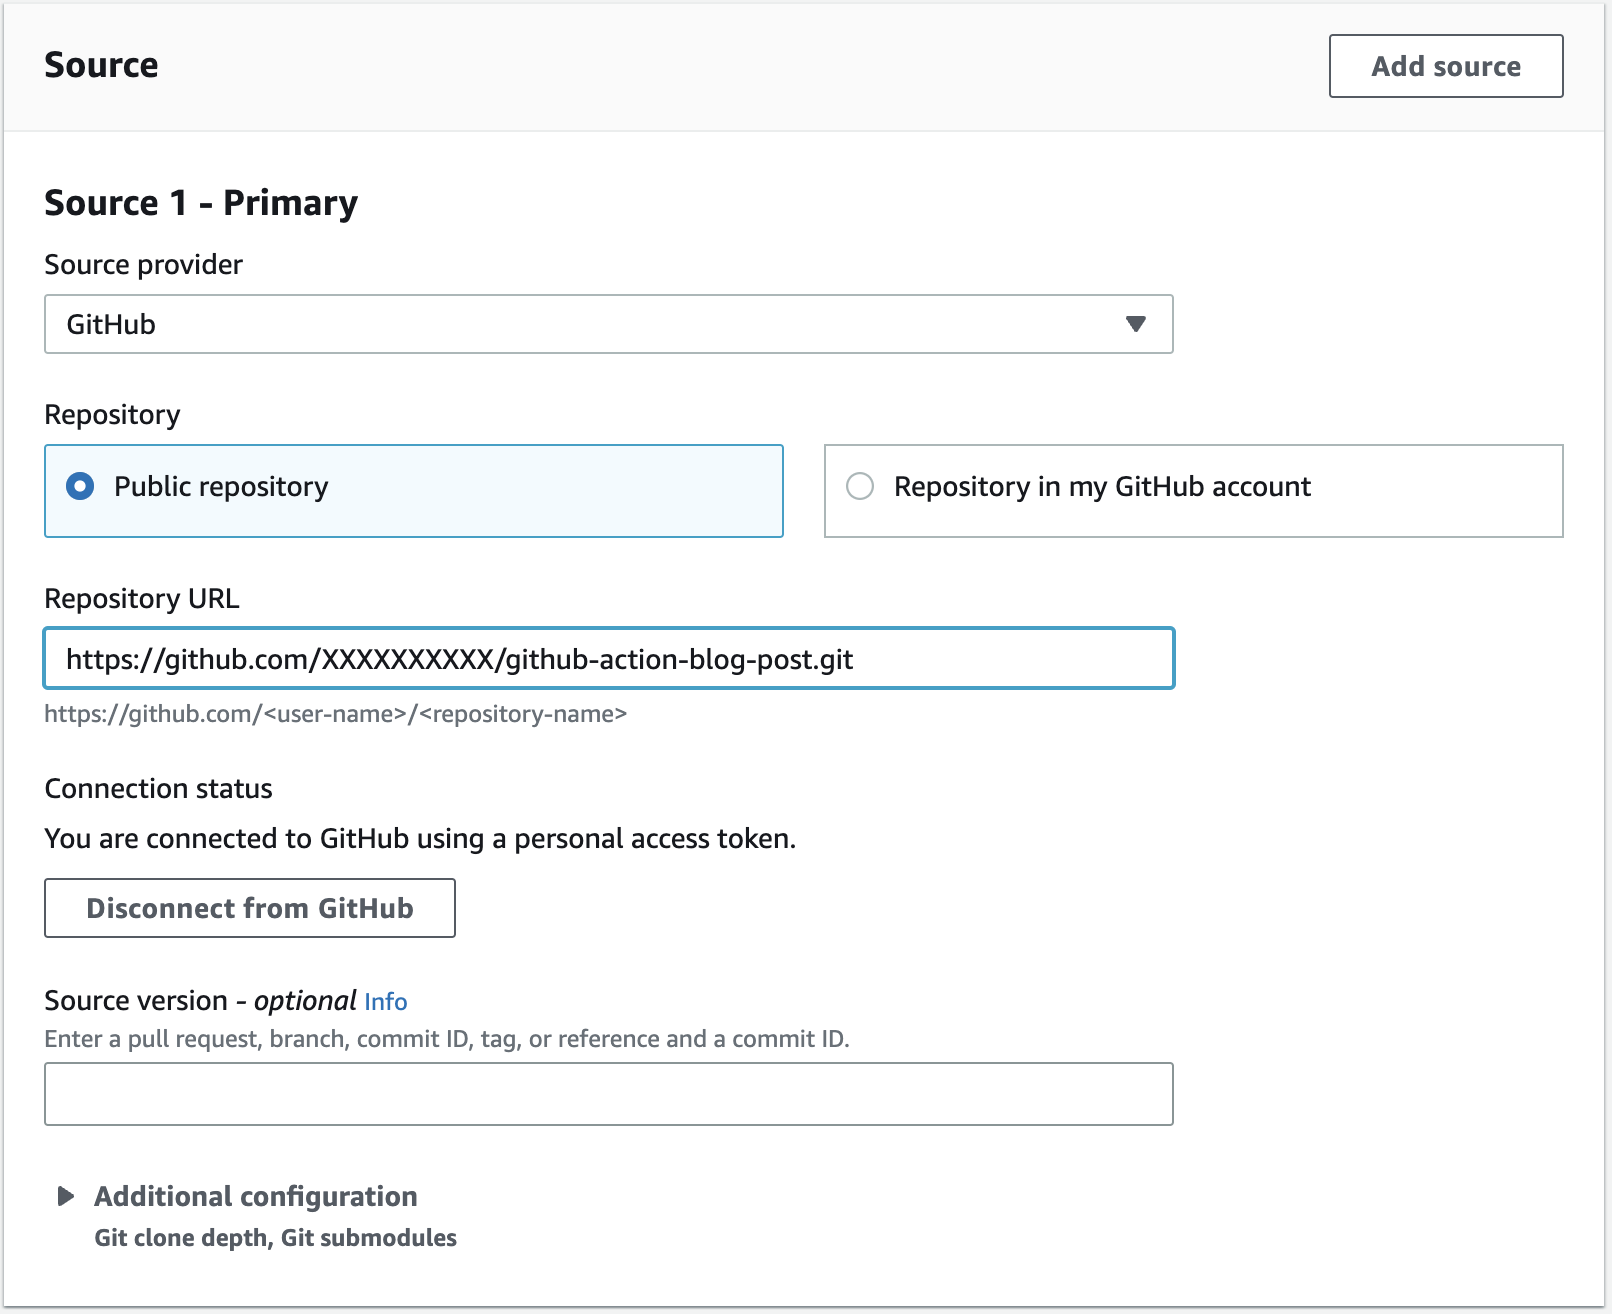


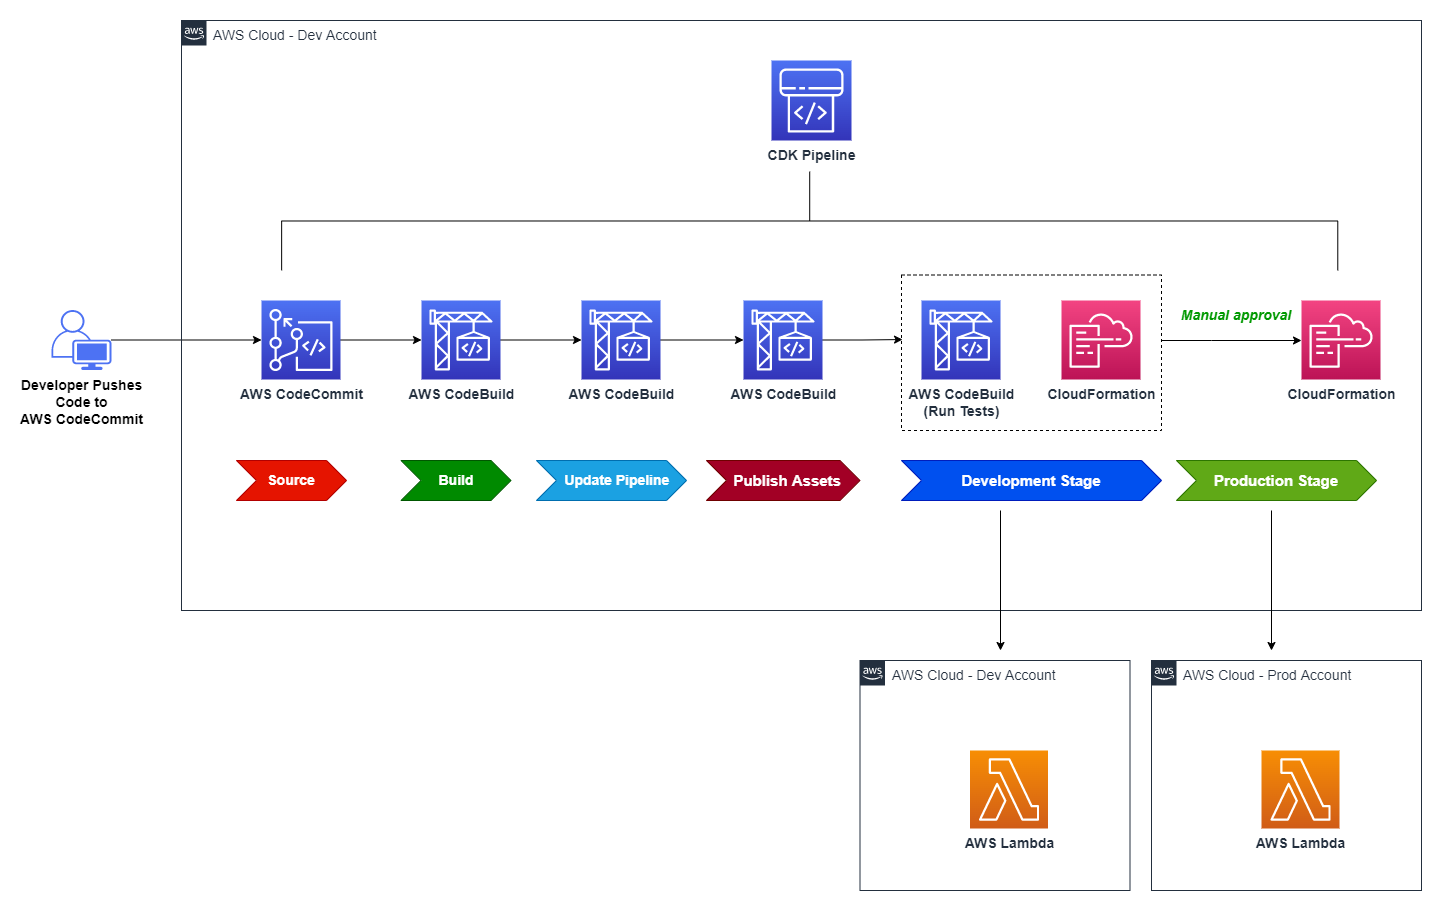
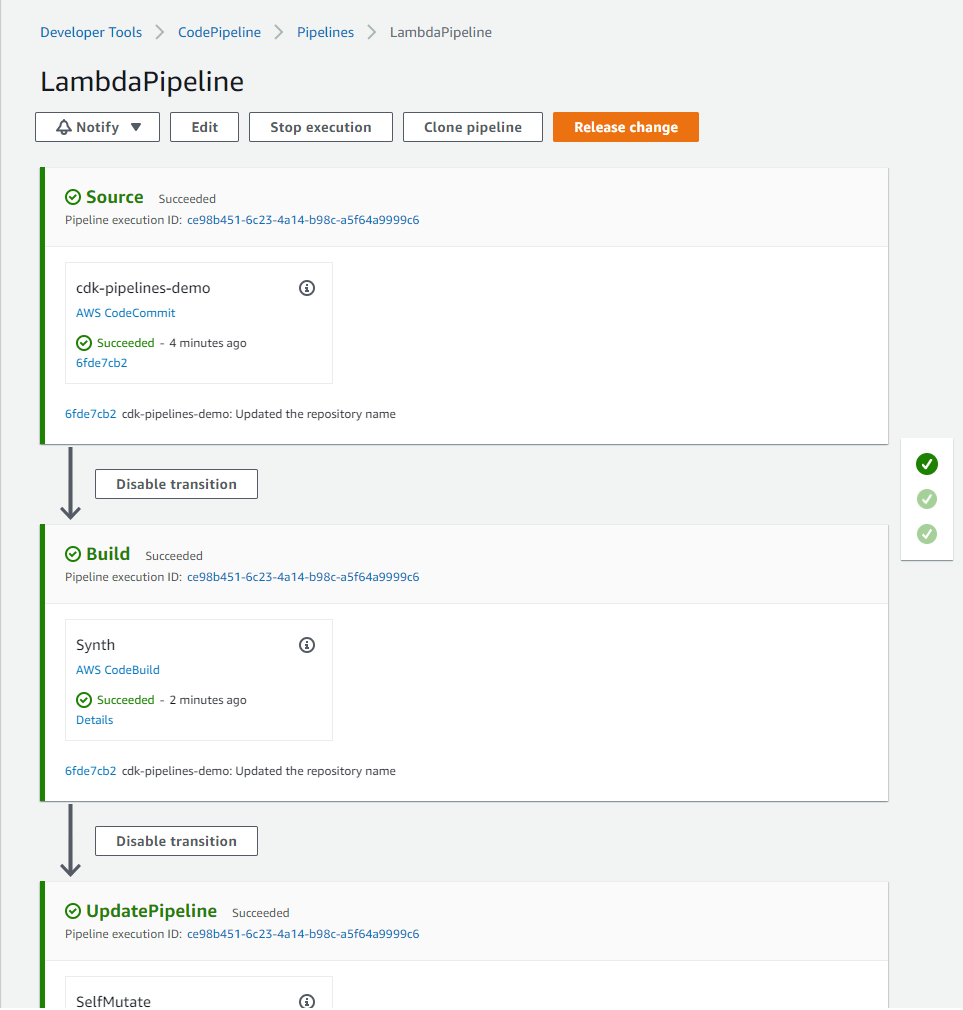
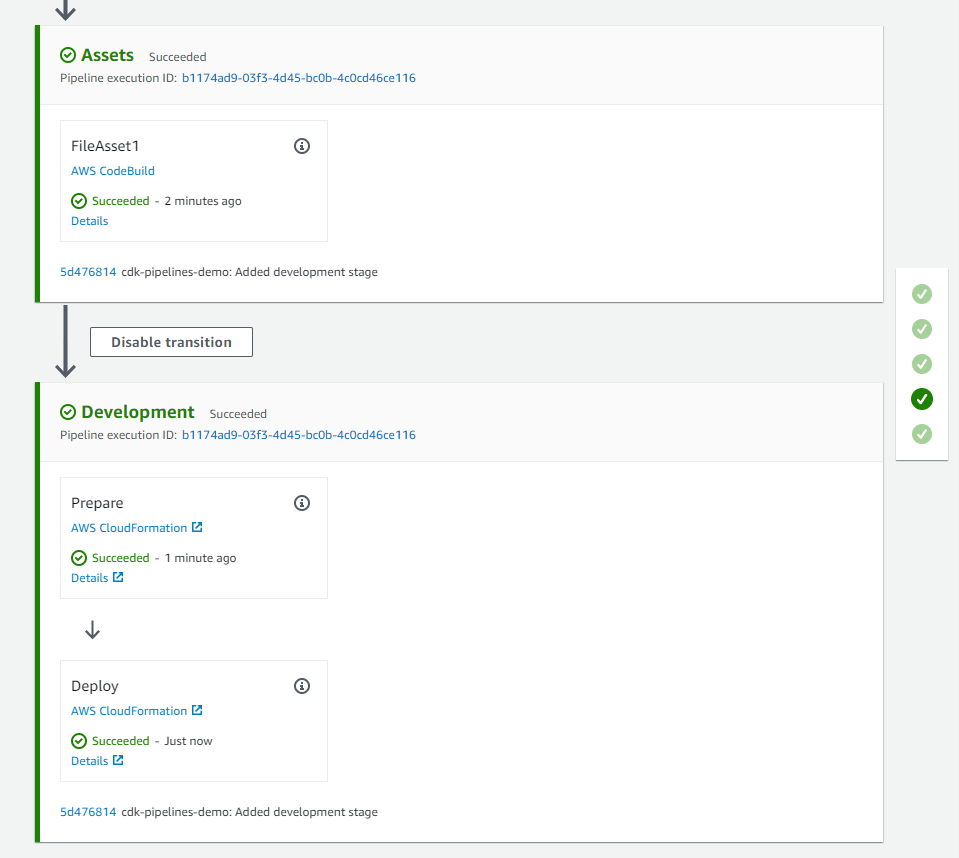
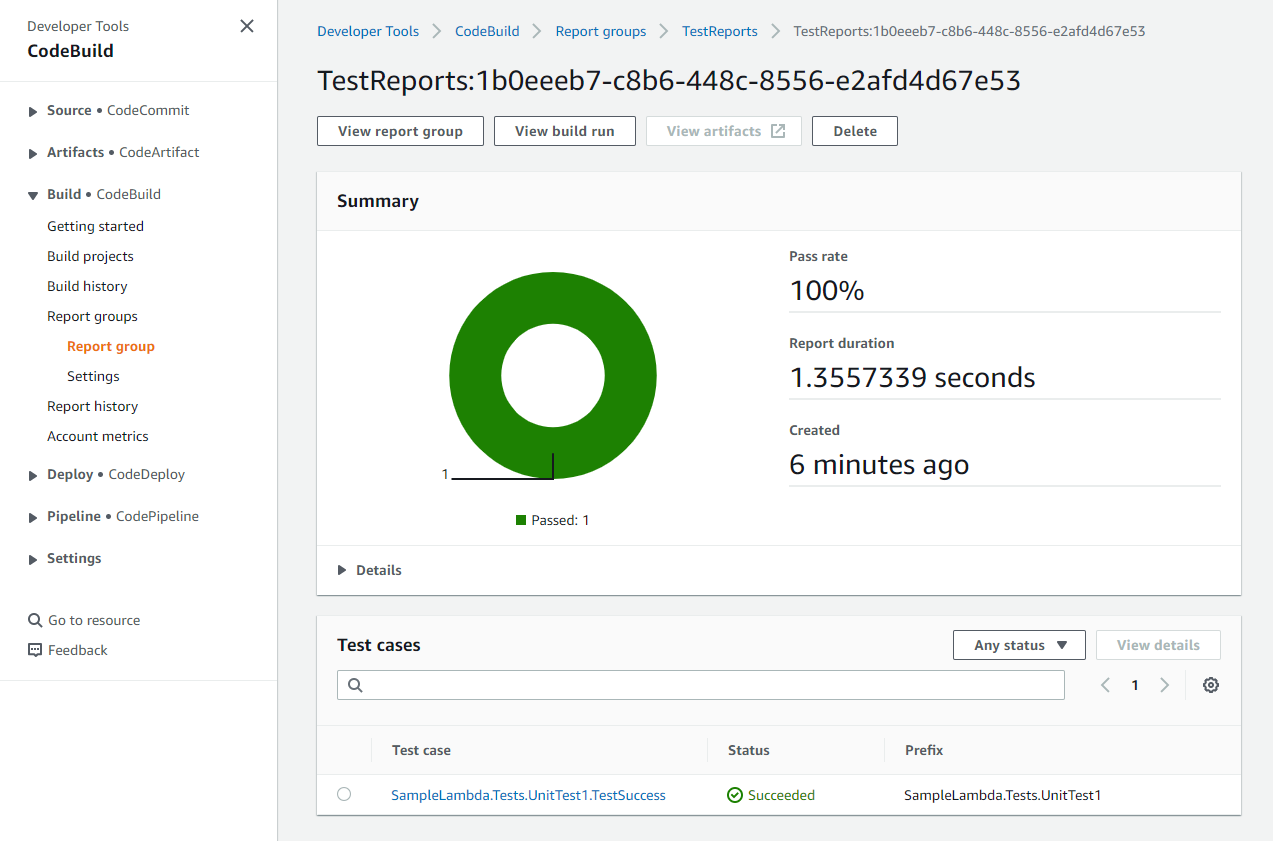
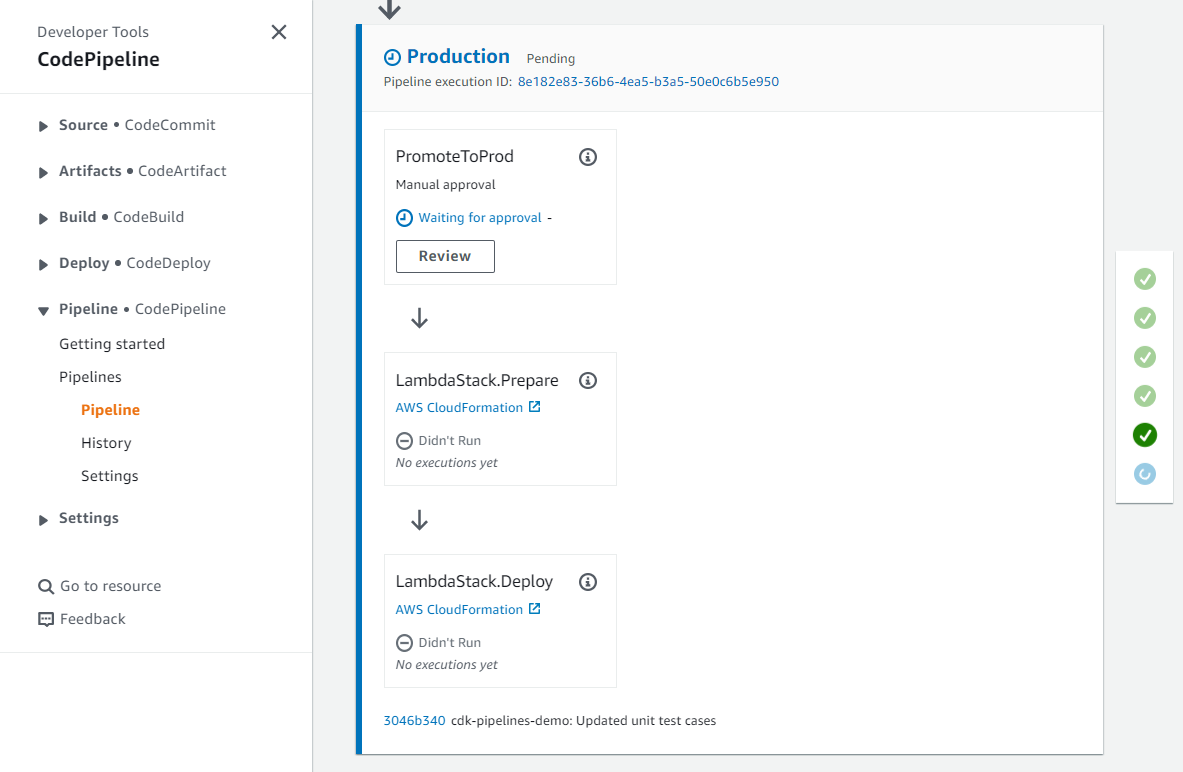
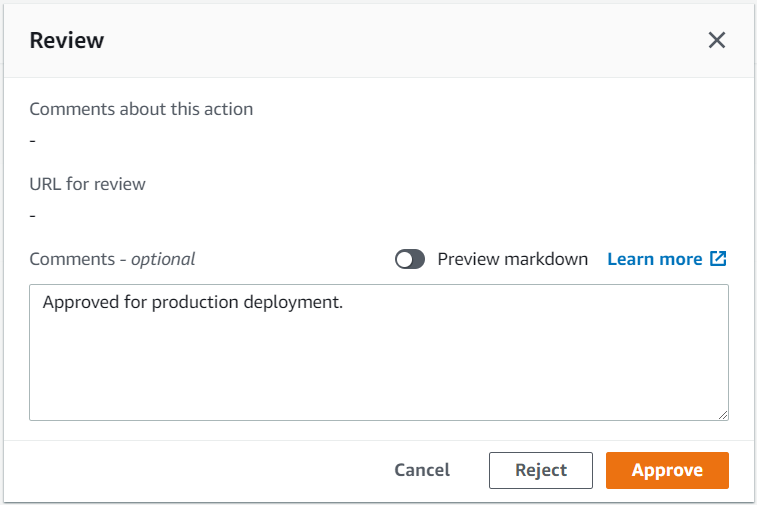
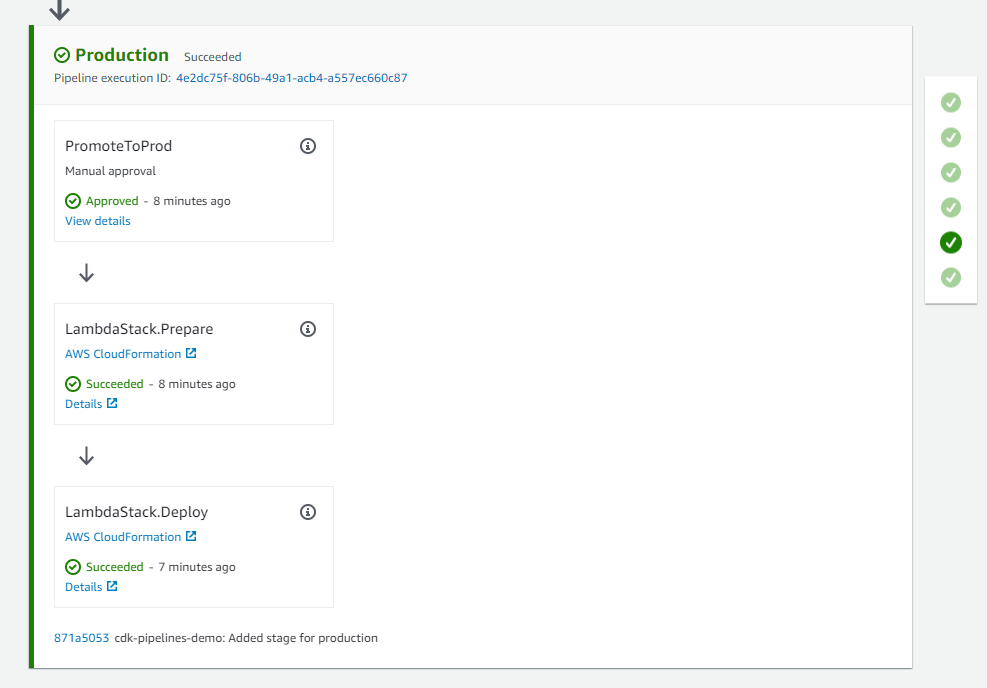


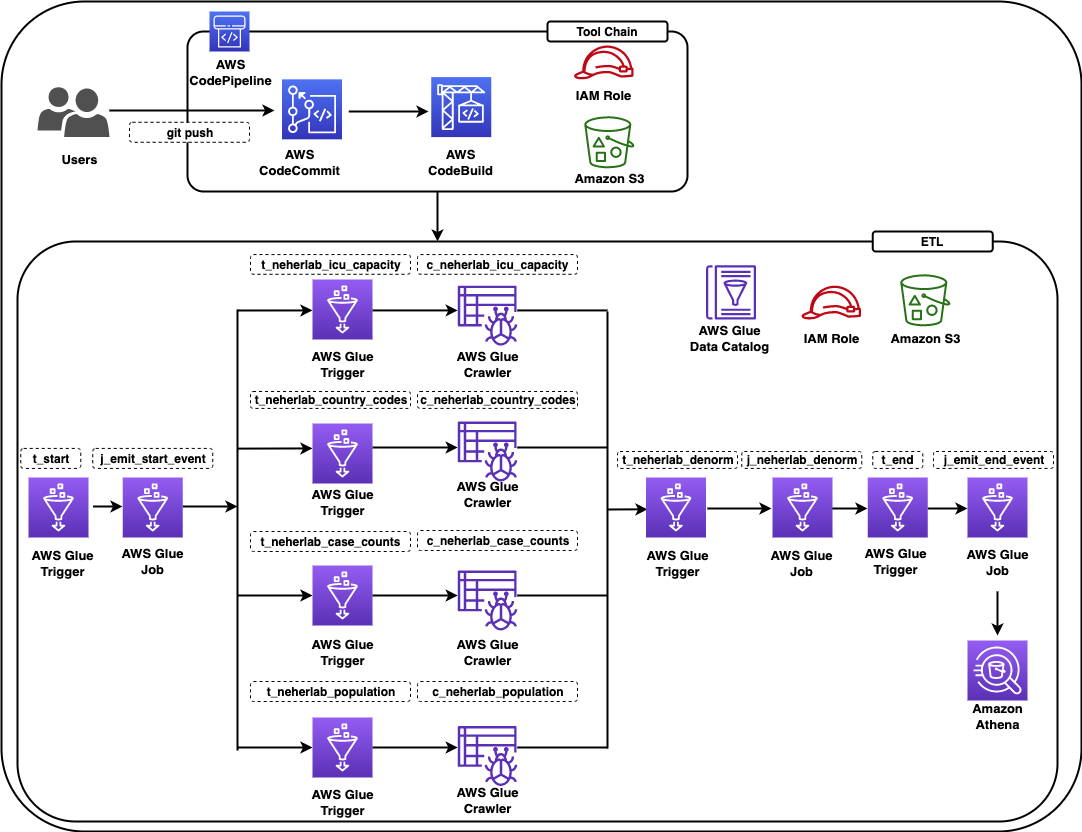
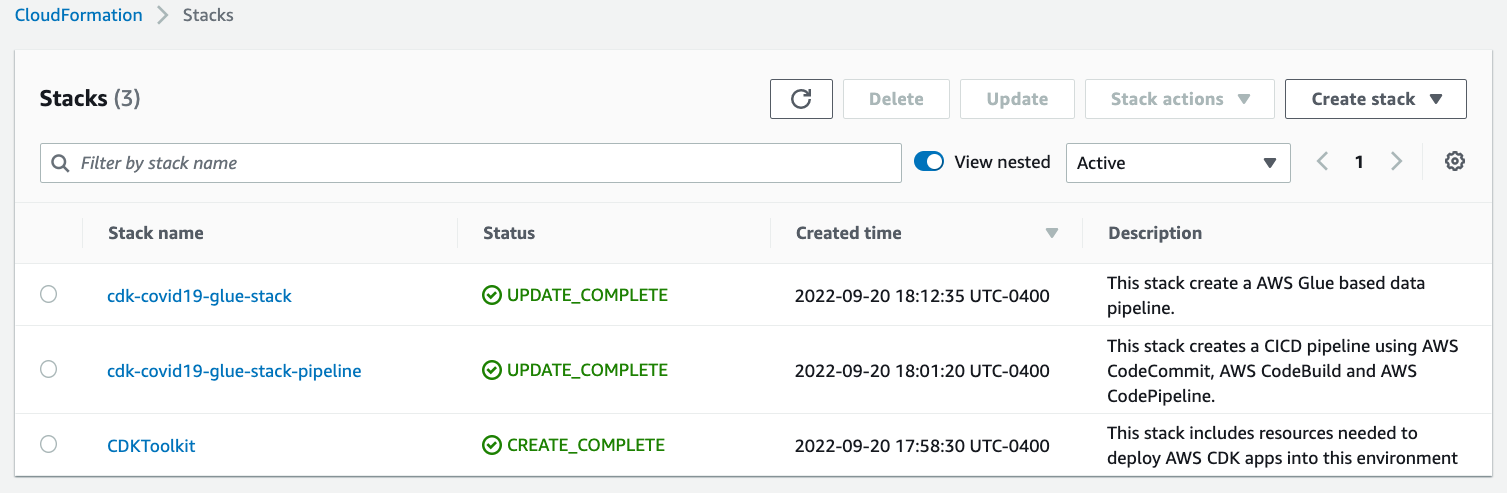
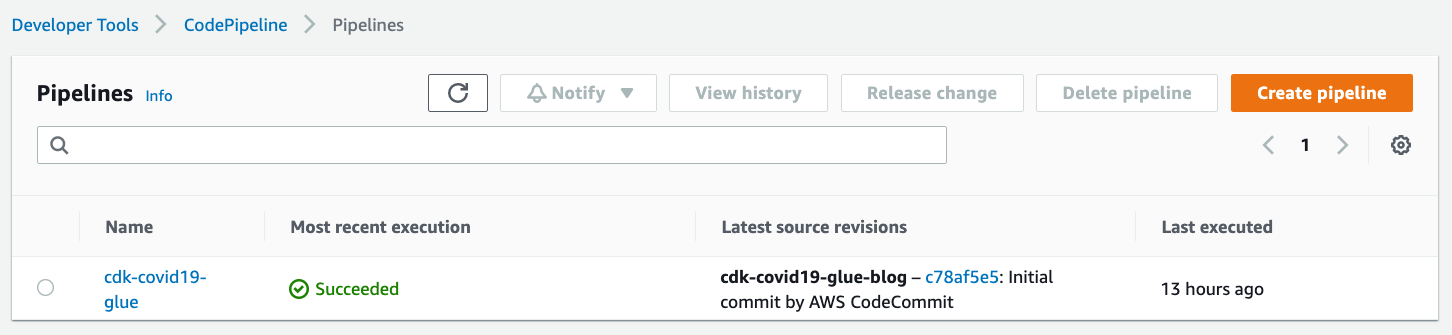
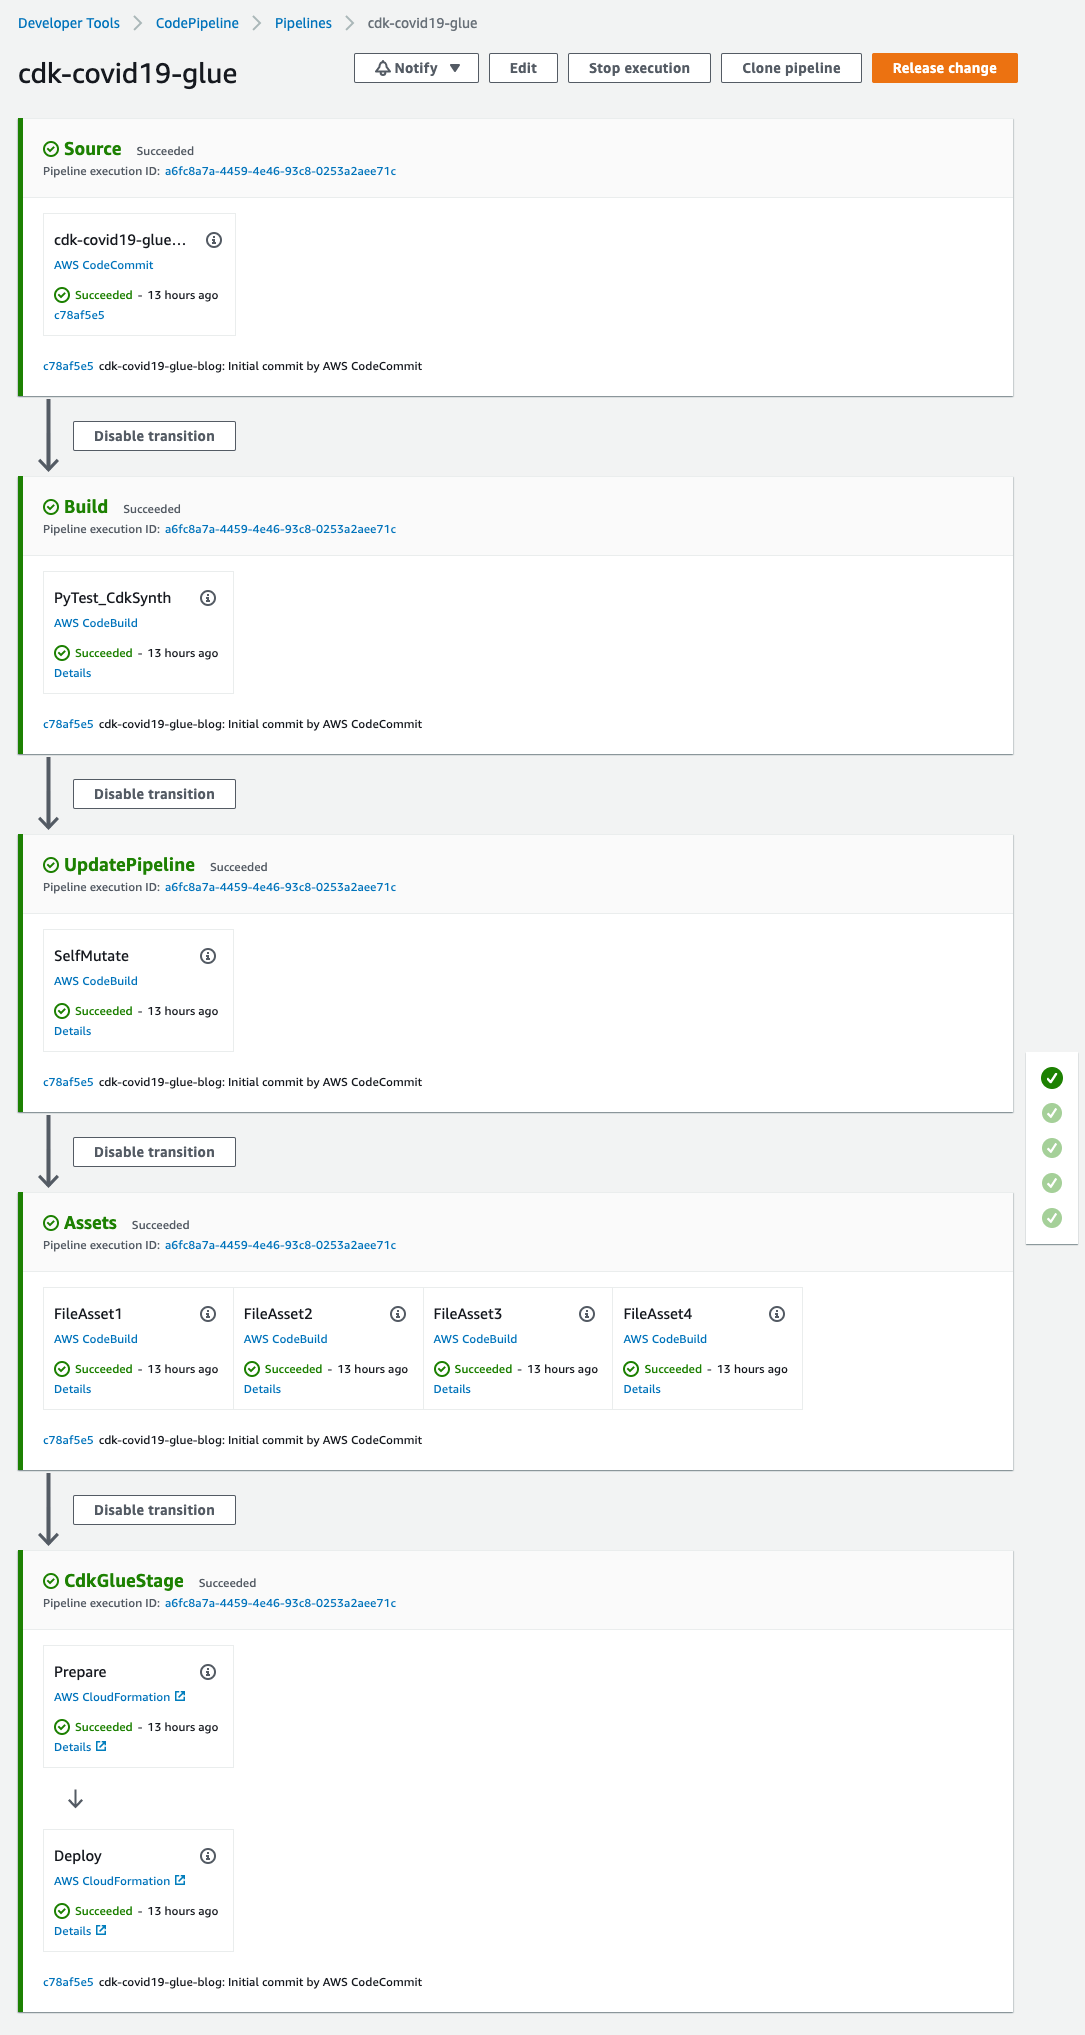
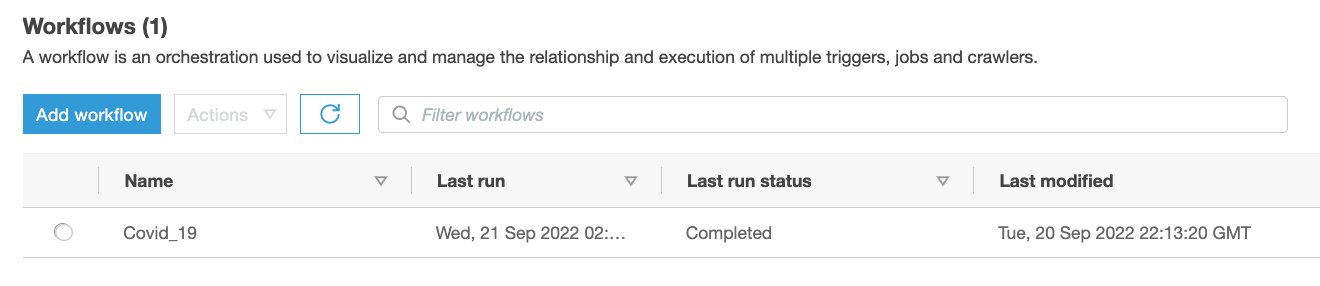
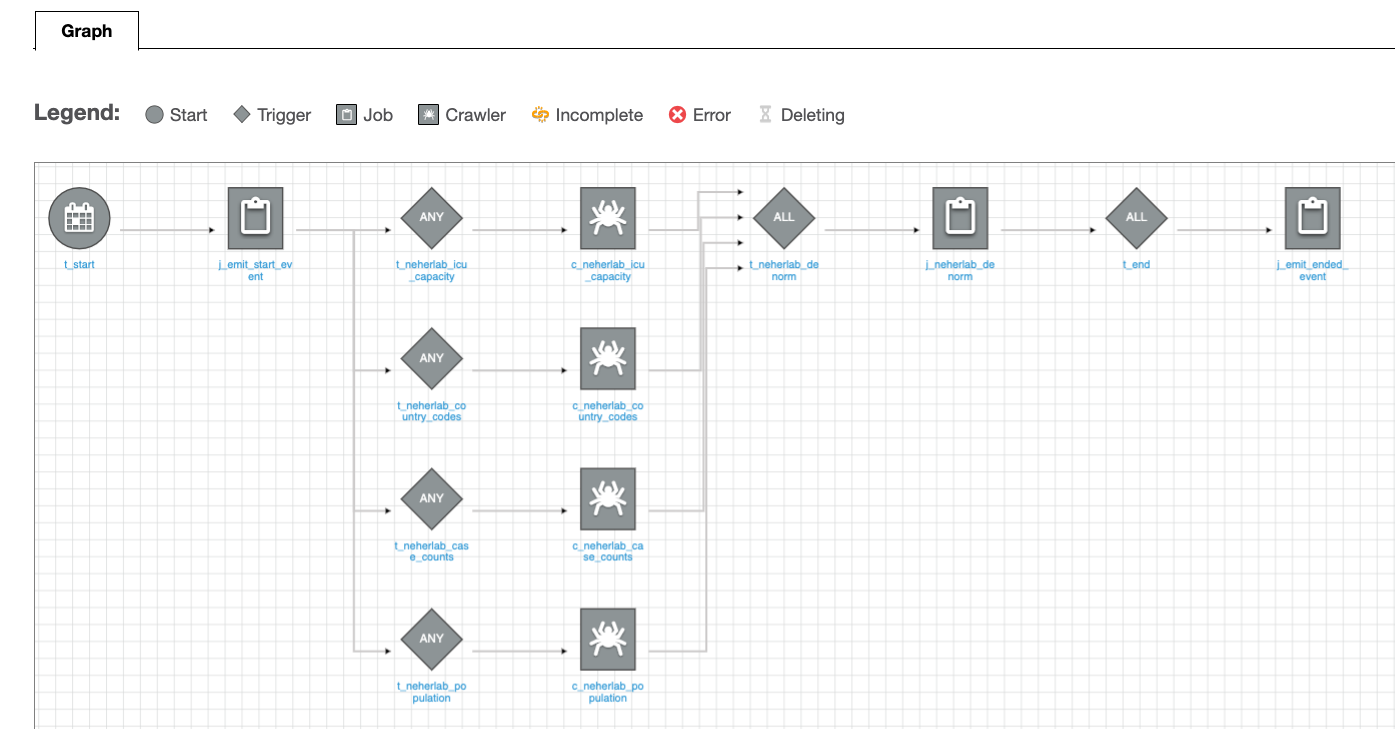
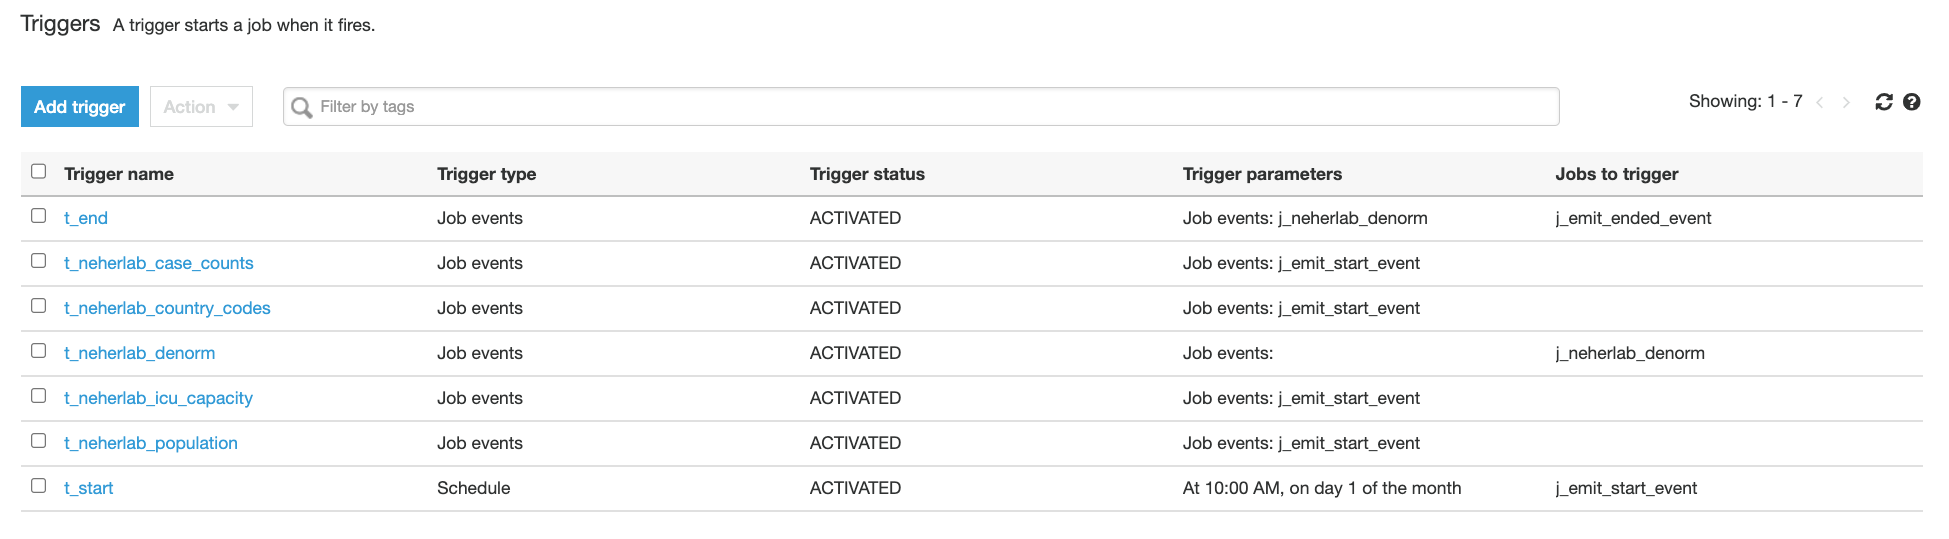
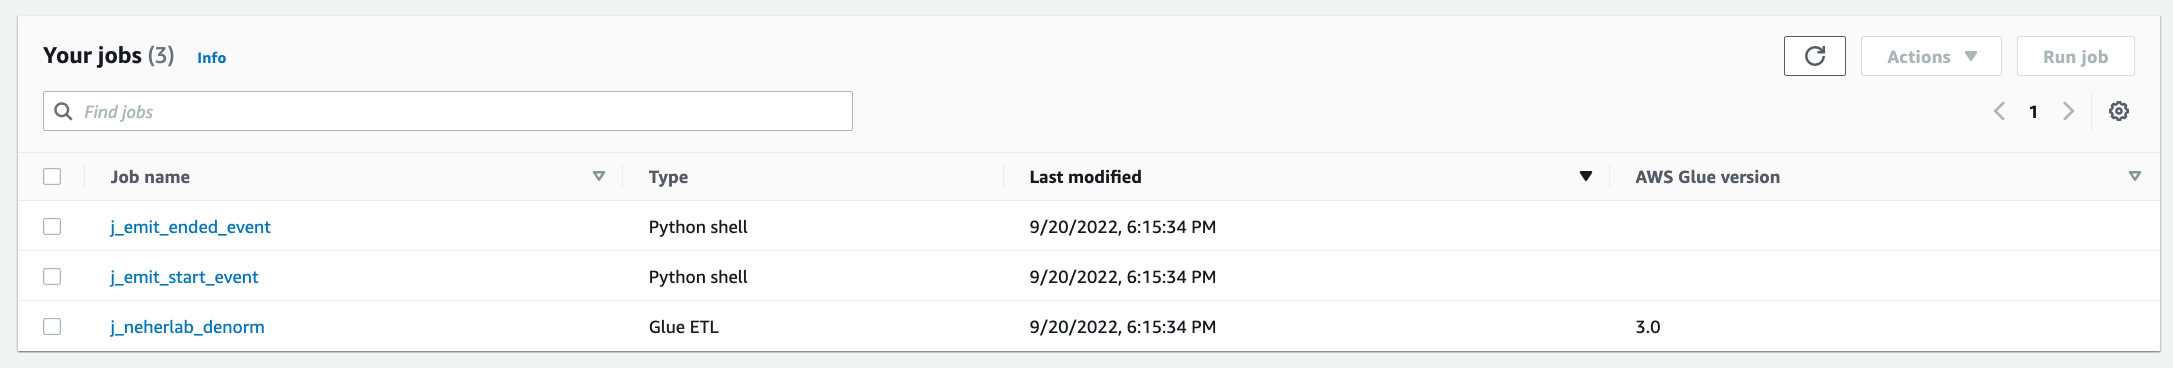
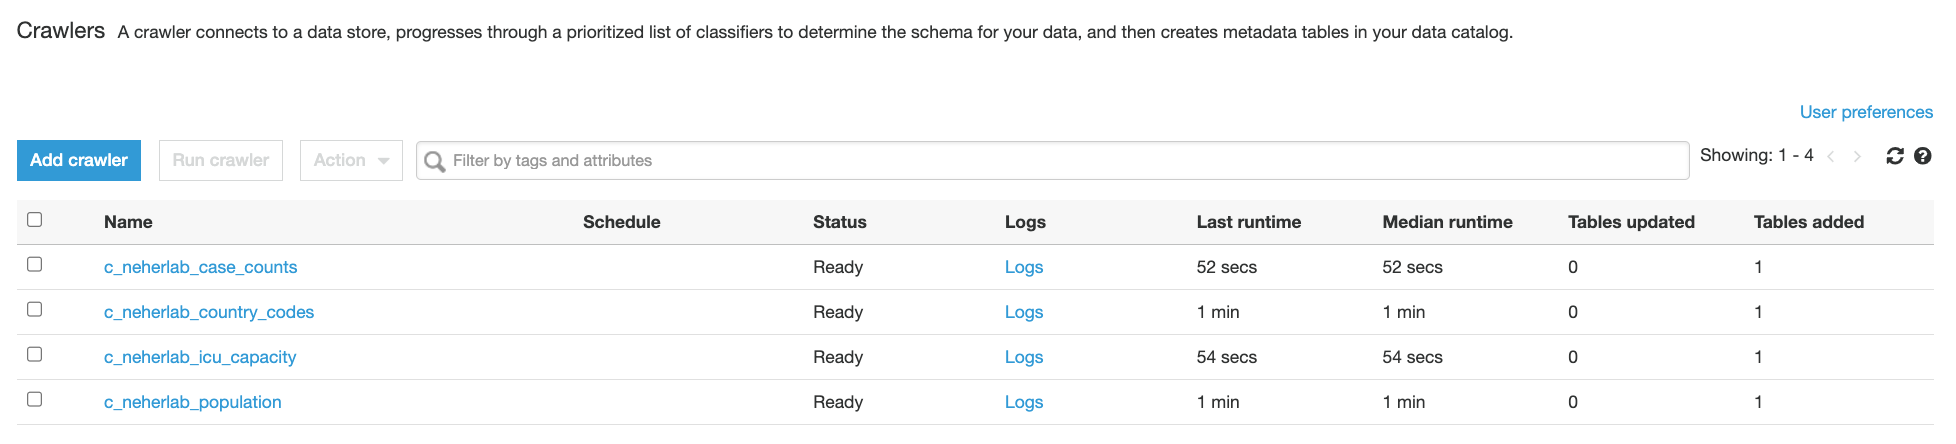

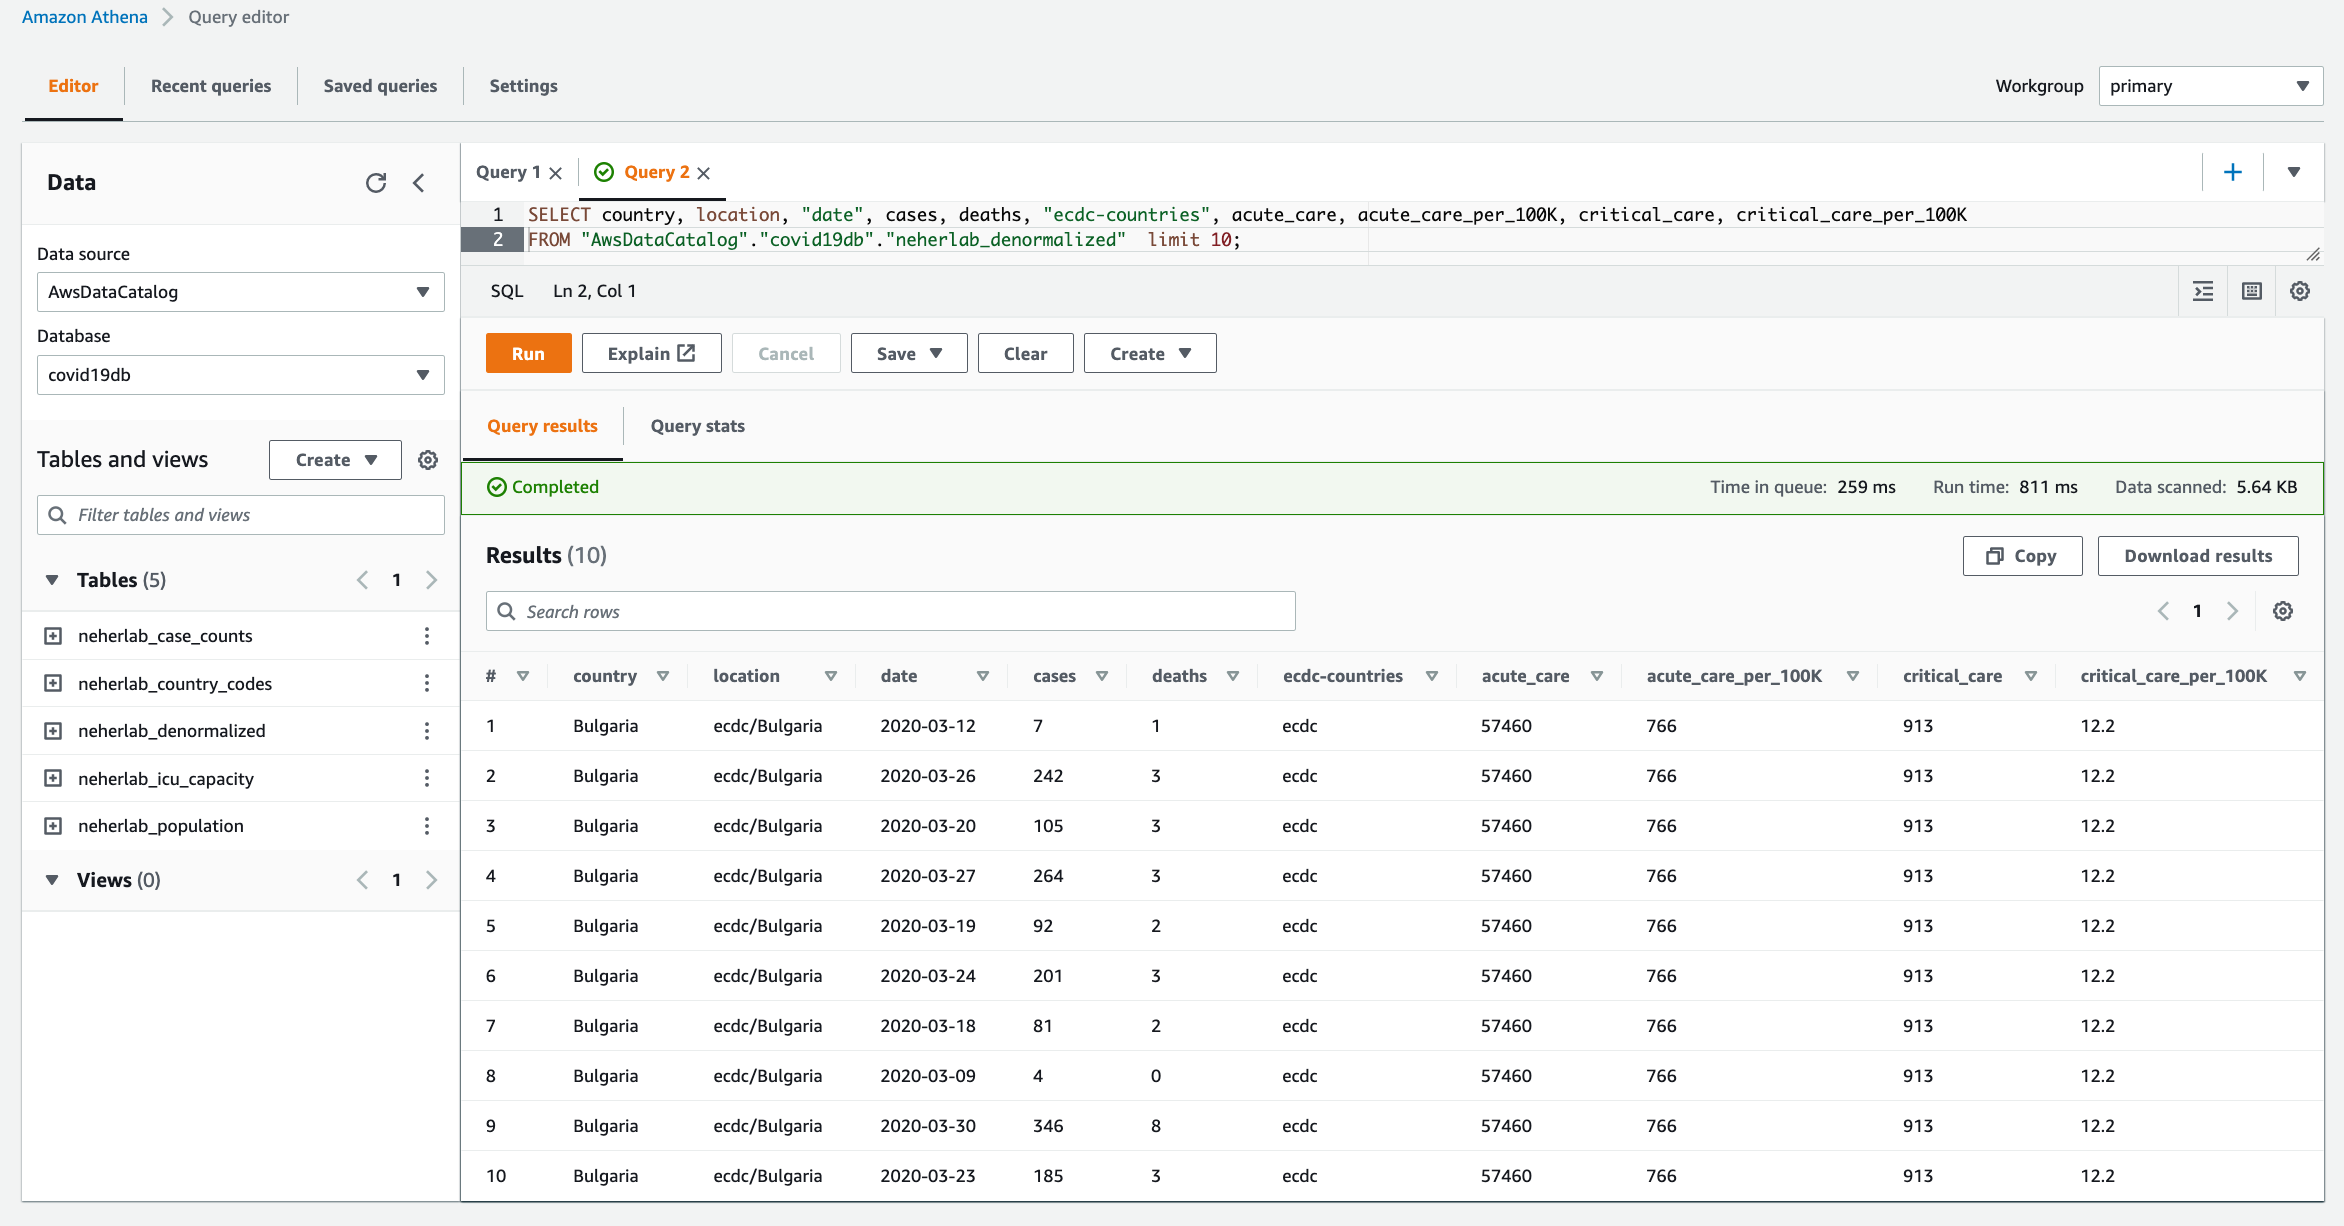


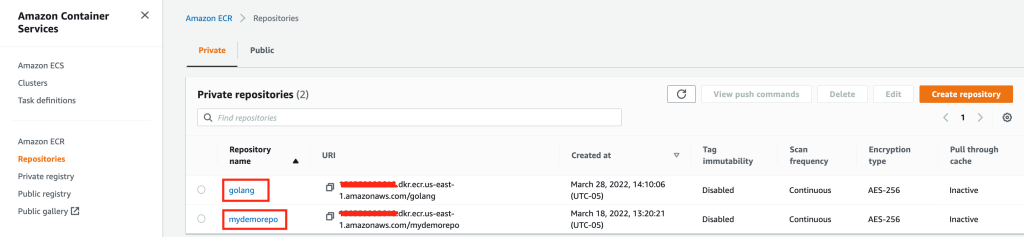

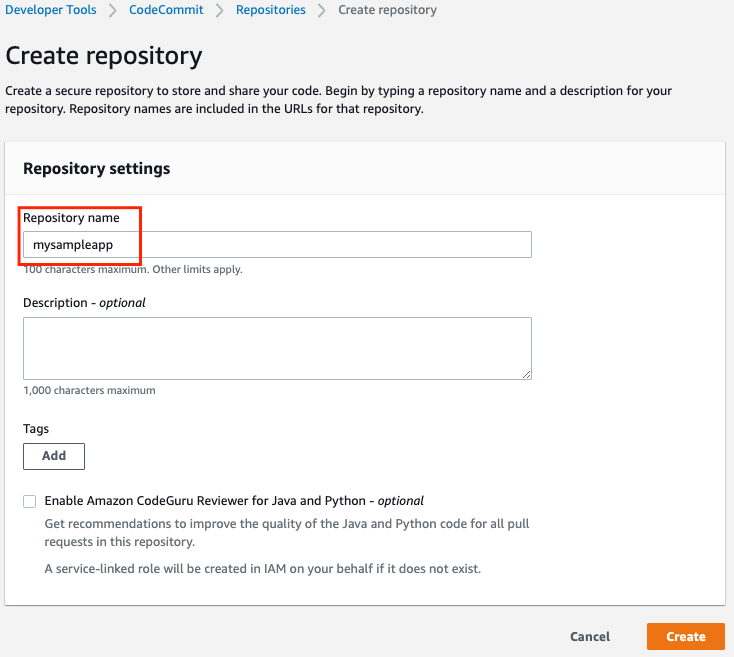

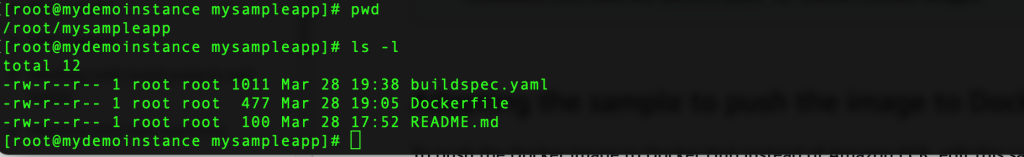


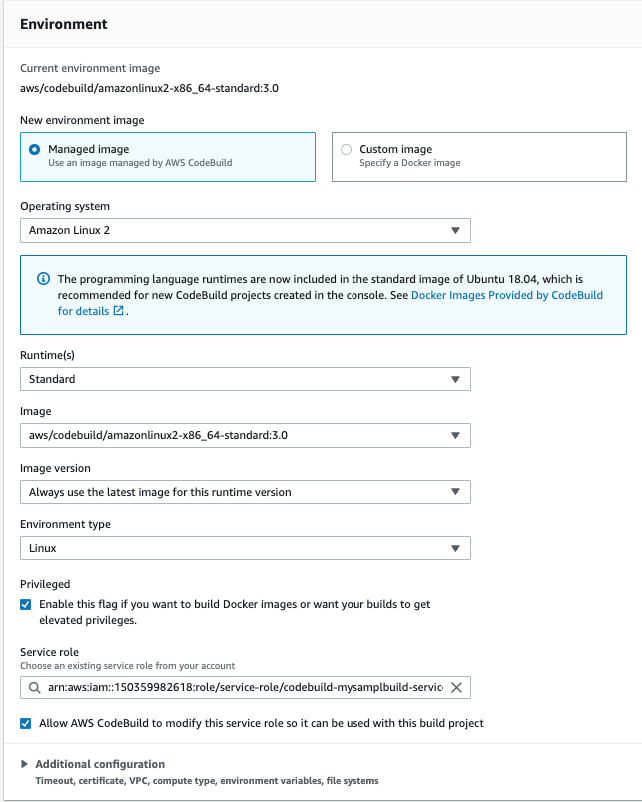
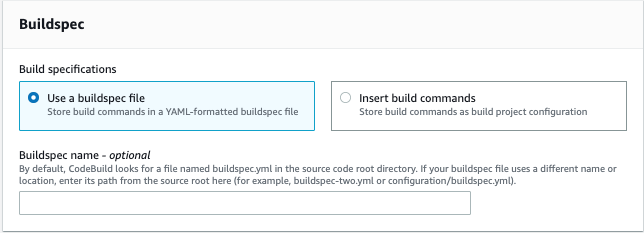


 Fig 5. Terraform state file buckets and state lock tables per environment in the central tooling account.
 Fig 6. Terraform state files per account and Region for each environment in the central tooling account
 Fig 7. Git tags and the respective Terraform state files.
 Fig 8. Multi-Region CI/CD with Terraform state resources stored in the same Region as the workload account resources for the respective Region


