Tag Archives: Continuous Deployment

Blue/Green deployments using AWS CDK Pipelines and AWS CodeDeploy

Post Syndicated from Luiz Decaro original https://aws.amazon.com/blogs/devops/blue-green-deployments-using-aws-cdk-pipelines-and-aws-codedeploy/

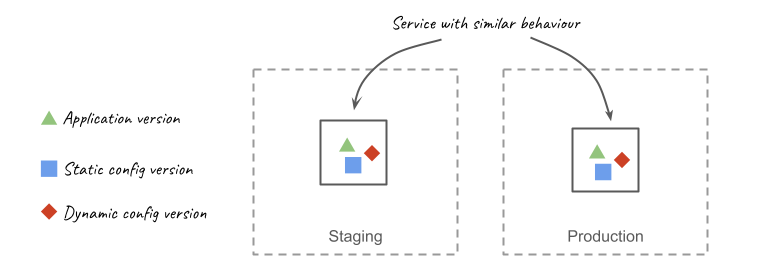
Customers often ask for help with implementing Blue/Green deployments to Amazon Elastic Container Service (Amazon ECS) using AWS CodeDeploy. Their use cases usually involve cross-Region and cross-account deployment scenarios. These requirements are challenging enough on their own, but in addition to those, there are specific design decisions that need to be considered when using CodeDeploy. These include how to configure CodeDeploy, when and how to create CodeDeploy resources (such as Application and Deployment Group), and how to write code that can be used to deploy to any combination of account and Region.

Today, I will discuss those design decisions in detail and how to use CDK Pipelines to implement a self-mutating pipeline that deploys services to Amazon ECS in cross-account and cross-Region scenarios. At the end of this blog post, I also introduce a demo application, available in Java, that follows best practices for developing and deploying cloud infrastructure using AWS Cloud Development Kit (AWS CDK).

The Pipeline

CDK Pipelines is an opinionated construct library used for building pipelines with different deployment engines. It abstracts implementation details that developers or infrastructure engineers need to solve when implementing a cross-Region or cross-account pipeline. For example, in cross-Region scenarios, AWS CloudFormation needs artifacts to be replicated to the target Region. For that reason, AWS Key Management Service (AWS KMS) keys, an Amazon Simple Storage Service (Amazon S3) bucket, and policies need to be created for the secondary Region. This enables artifacts to be moved from one Region to another. In cross-account scenarios, CodeDeploy requires a cross-account role with access to the KMS key used to encrypt configuration files. This is the sort of detail that our customers want to avoid dealing with manually.

AWS CodeDeploy is a deployment service that automates application deployment across different scenarios. It deploys to Amazon EC2 instances, On-Premises instances, serverless Lambda functions, or Amazon ECS services. It integrates with AWS Identity and Access Management (AWS IAM), to implement access control to deploy or re-deploy old versions of an application. In the Blue/Green deployment type, it is possible to automate the rollback of a deployment using Amazon CloudWatch Alarms.

CDK Pipelines was designed to automate AWS CloudFormation deployments. Using AWS CDK, these CloudFormation deployments may include deploying application software to instances or containers. However, some customers prefer using CodeDeploy to deploy application software. In this blog post, CDK Pipelines will deploy using CodeDeploy instead of CloudFormation.

A pipeline build with CDK Pipelines that deploys to Amazon ECS using AWS CodeDeploy. It contains at least 5 stages: Source, Build, UpdatePipeline, Assets and at least one Deployment stage.

Design Considerations

In this post, I’m considering the use of CDK Pipelines to implement different use cases for deploying a service to any combination of accounts (single-account & cross-account) and regions (single-Region & cross-Region) using CodeDeploy. More specifically, there are four problems that need to be solved:

CodeDeploy Configuration

The most popular options for implementing a Blue/Green deployment type using CodeDeploy are using CloudFormation Hooks or using a CodeDeploy construct. I decided to operate CodeDeploy using its configuration files. This is a flexible design that doesn’t rely on using custom resources, which is another technique customers have used to solve this problem. On each run, a pipeline pushes a container to a repository on Amazon Elastic Container Registry (ECR) and creates a tag. CodeDeploy needs that information to deploy the container.

I recommend creating a pipeline action to scan the AWS CDK cloud assembly and retrieve the repository and tag information. The same action can create the CodeDeploy configuration files. Three configuration files are required to configure CodeDeploy: appspec.yaml, taskdef.json and imageDetail.json. This pipeline action should be executed before the CodeDeploy deployment action. I recommend creating template files for appspec.yaml and taskdef.json. The following script can be used to implement the pipeline action:

##
#!/bin/sh
#
# Action Configure AWS CodeDeploy
# It customizes the files template-appspec.yaml and template-taskdef.json to the environment
#
# Account = The target Account Id
# AppName = Name of the application
# StageName = Name of the stage
# Region = Name of the region (us-east-1, us-east-2)
# PipelineId = Id of the pipeline
# ServiceName = Name of the service. It will be used to define the role and the task definition name
#
# Primary output directory is codedeploy/. All the 3 files created (appspec.json, imageDetail.json and 
# taskDef.json) will be located inside the codedeploy/ directory
#
##
Account=$1
Region=$2
AppName=$3
StageName=$4
PipelineId=$5
ServiceName=$6
repo_name=$(cat assembly*$PipelineId-$StageName/*.assets.json | jq -r '.dockerImages[] | .destinations[] | .repositoryName' | head -1) 
tag_name=$(cat assembly*$PipelineId-$StageName/*.assets.json | jq -r '.dockerImages | to_entries[0].key')  
echo ${repo_name} 
echo ${tag_name} 
printf '{"ImageURI":"%s"}' "$Account.dkr.ecr.$Region.amazonaws.com/${repo_name}:${tag_name}" > codedeploy/imageDetail.json                     
sed 's#APPLICATION#'$AppName'#g' codedeploy/template-appspec.yaml > codedeploy/appspec.yaml 
sed 's#APPLICATION#'$AppName'#g' codedeploy/template-taskdef.json | sed 's#TASK_EXEC_ROLE#arn:aws:iam::'$Account':role/'$ServiceName'#g' | sed 's#fargate-task-definition#'$ServiceName'#g' > codedeploy/taskdef.json 
cat codedeploy/appspec.yaml
cat codedeploy/taskdef.json
cat codedeploy/imageDetail.json

Using a Toolchain

A good strategy is to encapsulate the pipeline inside a Toolchain to abstract how to deploy to different accounts and regions. This helps decoupling clients from the details such as how the pipeline is created, how CodeDeploy is configured, and how cross-account and cross-Region deployments are implemented. To create the pipeline, deploy a Toolchain stack. Out-of-the-box, it allows different environments to be added as needed. Depending on the requirements, the pipeline may be customized to reflect the different stages or waves that different components might require. For more information, please refer to our best practices on how to automate safe, hands-off deployments and its reference implementation.

In detail, the Toolchain stack follows the builder pattern used throughout the CDK for Java. This is a convenience that allows complex objects to be created using a single statement:

 Toolchain.Builder.create(app, Constants.APP_NAME+"Toolchain")
        .stackProperties(StackProps.builder()
                .env(Environment.builder()
                        .account(Demo.TOOLCHAIN_ACCOUNT)
                        .region(Demo.TOOLCHAIN_REGION)
                        .build())
                .build())
        .setGitRepo(Demo.CODECOMMIT_REPO)
        .setGitBranch(Demo.CODECOMMIT_BRANCH)
        .addStage(
                "UAT",
                EcsDeploymentConfig.CANARY_10_PERCENT_5_MINUTES,
                Environment.builder()
                        .account(Demo.SERVICE_ACCOUNT)
                        .region(Demo.SERVICE_REGION)
                        .build())                                                                                                             
        .build();

In the statement above, the continuous deployment pipeline is created in the TOOLCHAIN_ACCOUNT and TOOLCHAIN_REGION. It implements a stage that builds the source code and creates the Java archive (JAR) using Apache Maven.  The pipeline then creates a Docker image containing the JAR file.

The UAT stage will deploy the service to the SERVICE_ACCOUNT and SERVICE_REGION using the deployment configuration CANARY_10_PERCENT_5_MINUTES. This means 10 percent of the traffic is shifted in the first increment and the remaining 90 percent is deployed 5 minutes later.

To create additional deployment stages, you need a stage name, a CodeDeploy deployment configuration and an environment where it should deploy the service. As mentioned, the pipeline is, by default, a self-mutating pipeline. For example, to add a Prod stage, update the code that creates the Toolchain object and submit this change to the code repository. The pipeline will run and update itself adding a Prod stage after the UAT stage. Next, I show in detail the statement used to add a new Prod stage. The new stage deploys to the same account and Region as in the UAT environment:

... 
        .addStage(
                "Prod",
                EcsDeploymentConfig.CANARY_10_PERCENT_5_MINUTES,
                Environment.builder()
                        .account(Demo.SERVICE_ACCOUNT)
                        .region(Demo.SERVICE_REGION)
                        .build())                                                                                                                                      
        .build();

In the statement above, the Prod stage will deploy new versions of the service using a CodeDeploy deployment configuration CANARY_10_PERCENT_5_MINUTES. It means that 10 percent of traffic is shifted in the first increment of 5 minutes. Then, it shifts the rest of the traffic to the new version of the application. Please refer to Organizing Your AWS Environment Using Multiple Accounts whitepaper for best-practices on how to isolate and manage your business applications.

Some customers might find this approach interesting and decide to provide this as an abstraction to their application development teams. In this case, I advise creating a construct that builds such a pipeline. Using a construct would allow for further customization. Examples are stages that promote quality assurance or deploy the service in a disaster recovery scenario.

The implementation creates a stack for the toolchain and another stack for each deployment stage. As an example, consider a toolchain created with a single deployment stage named UAT. After running successfully, the DemoToolchain and DemoService-UAT stacks should be created as in the next image:

Two stacks are needed to create a Pipeline that deploys to a single environment. One stack deploys the Toolchain with the Pipeline and another stack deploys the Service compute infrastructure and CodeDeploy Application and DeploymentGroup. In this example, for an application named Demo that deploys to an environment named UAT, the stacks deployed are: DemoToolchain and DemoService-UAT

CodeDeploy Application and Deployment Group

CodeDeploy configuration requires an application and a deployment group. Depending on the use case, you need to create these in the same or in a different account from the toolchain (pipeline). The pipeline includes the CodeDeploy deployment action that performs the blue/green deployment. My recommendation is to create the CodeDeploy application and deployment group as part of the Service stack. This approach allows to align the lifecycle of CodeDeploy application and deployment group with the related Service stack instance.

CodePipeline allows to create a CodeDeploy deployment action that references a non-existing CodeDeploy application and deployment group. This allows us to implement the following approach:

  • Toolchain stack deploys the pipeline with CodeDeploy deployment action referencing a non-existing CodeDeploy application and deployment group
  • When the pipeline executes, it first deploys the Service stack that creates the related CodeDeploy application and deployment group
  • The next pipeline action executes the CodeDeploy deployment action. When the pipeline executes the CodeDeploy deployment action, the related CodeDeploy application and deployment will already exist.

Below is the pipeline code that references the (initially non-existing) CodeDeploy application and deployment group.

private IEcsDeploymentGroup referenceCodeDeployDeploymentGroup(
        final Environment env, 
        final String serviceName, 
        final IEcsDeploymentConfig ecsDeploymentConfig, 
        final String stageName) {

    IEcsApplication codeDeployApp = EcsApplication.fromEcsApplicationArn(
            this,
            Constants.APP_NAME + "EcsCodeDeployApp-"+stageName,
            Arn.format(ArnComponents.builder()
                    .arnFormat(ArnFormat.COLON_RESOURCE_NAME)
                    .partition("aws")
                    .region(env.getRegion())
                    .service("codedeploy")
                    .account(env.getAccount())
                    .resource("application")
                    .resourceName(serviceName)
                    .build()));

    IEcsDeploymentGroup deploymentGroup = EcsDeploymentGroup.fromEcsDeploymentGroupAttributes(
            this,
            Constants.APP_NAME + "-EcsCodeDeployDG-"+stageName,
            EcsDeploymentGroupAttributes.builder()
                    .deploymentGroupName(serviceName)
                    .application(codeDeployApp)
                    .deploymentConfig(ecsDeploymentConfig)
                    .build());

    return deploymentGroup;
}

To make this work, you should use the same application name and deployment group name values when creating the CodeDeploy deployment action in the pipeline and when creating the CodeDeploy application and deployment group in the Service stack (where the Amazon ECS infrastructure is deployed). This approach is necessary to avoid a circular dependency error when trying to create the CodeDeploy application and deployment group inside the Service stack and reference these objects to configure the CodeDeploy deployment action inside the pipeline. Below is the code that uses Service stack construct ID to name the CodeDeploy application and deployment group. I set the Service stack construct ID to the same name I used when creating the CodeDeploy deployment action in the pipeline.

   // configure AWS CodeDeploy Application and DeploymentGroup
   EcsApplication app = EcsApplication.Builder.create(this, "BlueGreenApplication")
           .applicationName(id)
           .build();

   EcsDeploymentGroup.Builder.create(this, "BlueGreenDeploymentGroup")
           .deploymentGroupName(id)
           .application(app)
           .service(albService.getService())
           .role(createCodeDeployExecutionRole(id))
           .blueGreenDeploymentConfig(EcsBlueGreenDeploymentConfig.builder()
                   .blueTargetGroup(albService.getTargetGroup())
                   .greenTargetGroup(tgGreen)
                   .listener(albService.getListener())
                   .testListener(listenerGreen)
                   .terminationWaitTime(Duration.minutes(15))
                   .build())
           .deploymentConfig(deploymentConfig)
           .build();

CDK Pipelines roles and permissions

CDK Pipelines creates roles and permissions the pipeline uses to execute deployments in different scenarios of regions and accounts. When using CodeDeploy in cross-account scenarios, CDK Pipelines deploys a cross-account support stack that creates a pipeline action role for the CodeDeploy action. This cross-account support stack is defined in a JSON file that needs to be published to the AWS CDK assets bucket in the target account. If the pipeline has the self-mutation feature on (default), the UpdatePipeline stage will do a cdk deploy to deploy changes to the pipeline. In cross-account scenarios, this deployment also involves deploying/updating the cross-account support stack. For this, the SelfMutate action in UpdatePipeline stage needs to assume CDK file-publishing and a deploy roles in the remote account.

The IAM role associated with the AWS CodeBuild project that runs the UpdatePipeline stage does not have these permissions by default. CDK Pipelines cannot grant these permissions automatically, because the information about the permissions that the cross-account stack needs is only available after the AWS CDK app finishes synthesizing. At that point, the permissions that the pipeline has are already locked-in­­. Hence, for cross-account scenarios, the toolchain should extend the permissions of the pipeline’s UpdatePipeline stage to include the file-publishing and deploy roles.

In cross-account environments it is possible to manually add these permissions to the UpdatePipeline stage. To accomplish that, the Toolchain stack may be used to hide this sort of implementation detail. In the end, a method like the one below can be used to add these missing permissions. For each different mapping of stage and environment in the pipeline it validates if the target account is different than the account where the pipeline is deployed. When the criteria is met, it should grant permission to the UpdatePipeline stage to assume CDK bootstrap roles (tagged using key aws-cdk:bootstrap-role) in the target account (with the tag value as file-publishing or deploy). The example below shows how to add permissions to the UpdatePipeline stage:

private void grantUpdatePipelineCrossAccoutPermissions(Map<String, Environment> stageNameEnvironment) {

    if (!stageNameEnvironment.isEmpty()) {

        this.pipeline.buildPipeline();
        for (String stage : stageNameEnvironment.keySet()) {

            HashMap<String, String[]> condition = new HashMap<>();
            condition.put(
                    "iam:ResourceTag/aws-cdk:bootstrap-role",
                    new String[] {"file-publishing", "deploy"});
            pipeline.getSelfMutationProject()
                    .getRole()
                    .addToPrincipalPolicy(PolicyStatement.Builder.create()
                            .actions(Arrays.asList("sts:AssumeRole"))
                            .effect(Effect.ALLOW)
                            .resources(Arrays.asList("arn:*:iam::"
                                    + stageNameEnvironment.get(stage).getAccount() + ":role/*"))
                            .conditions(new HashMap<String, Object>() {{
                                    put("ForAnyValue:StringEquals", condition);
                            }})
                            .build());
        }
    }
}

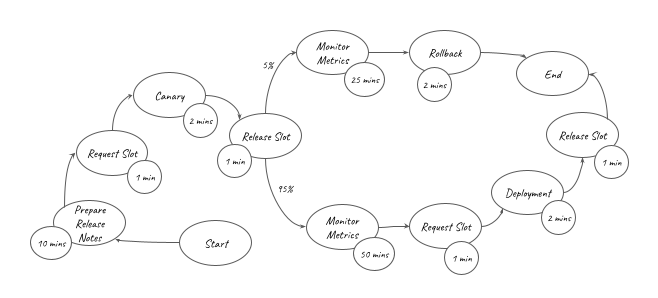
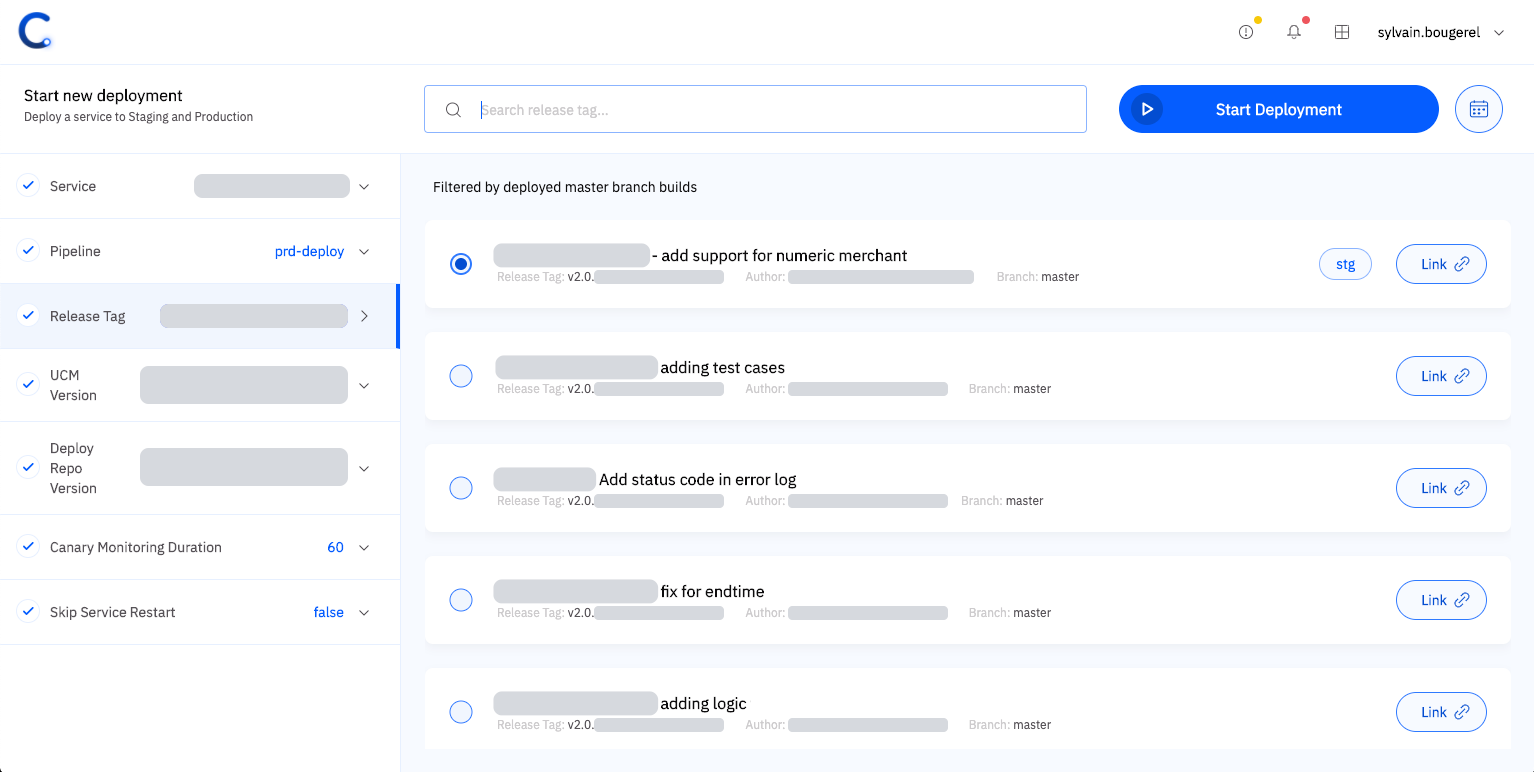
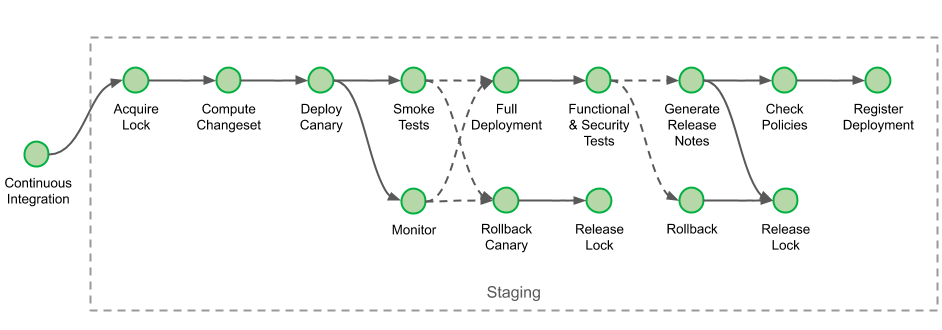
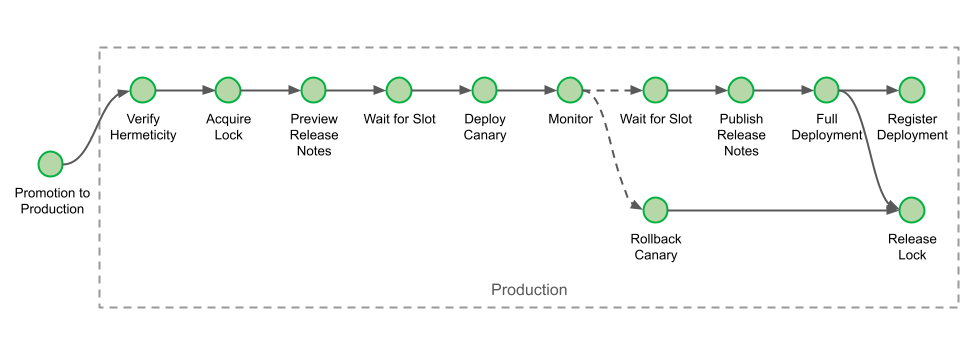
The Deployment Stage

Let’s consider a pipeline that has a single deployment stage, UAT. The UAT stage deploys a DemoService. For that, it requires four actions: DemoService-UAT (Prepare and Deploy), ConfigureBlueGreenDeploy and Deploy.

When using CodeDeploy the deployment stage is expected to have four actions: two actions to create CloudFormation change set and deploy the ECS or compute infrastructure, an action to configure CodeDeploy and the last action that deploys the application using CodeDeploy. In the diagram, these are (in the diagram in the respective order): DemoService-UAT.Prepare and DemoService-UAT.Deploy, ConfigureBlueGreenDeploy and Deploy.

The
DemoService-UAT.Deploy action will create the ECS resources and the CodeDeploy application and deployment group. The
ConfigureBlueGreenDeploy action will read the AWS CDK
cloud assembly. It uses the configuration files to identify the Amazon Elastic Container Registry (Amazon ECR) repository and the container image tag pushed. The pipeline will send this information to the
Deploy action.  The
Deploy action starts the deployment using CodeDeploy.
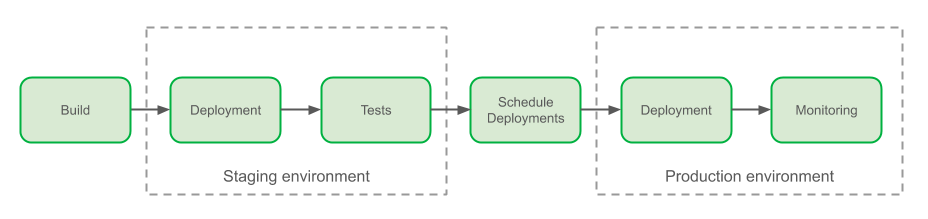
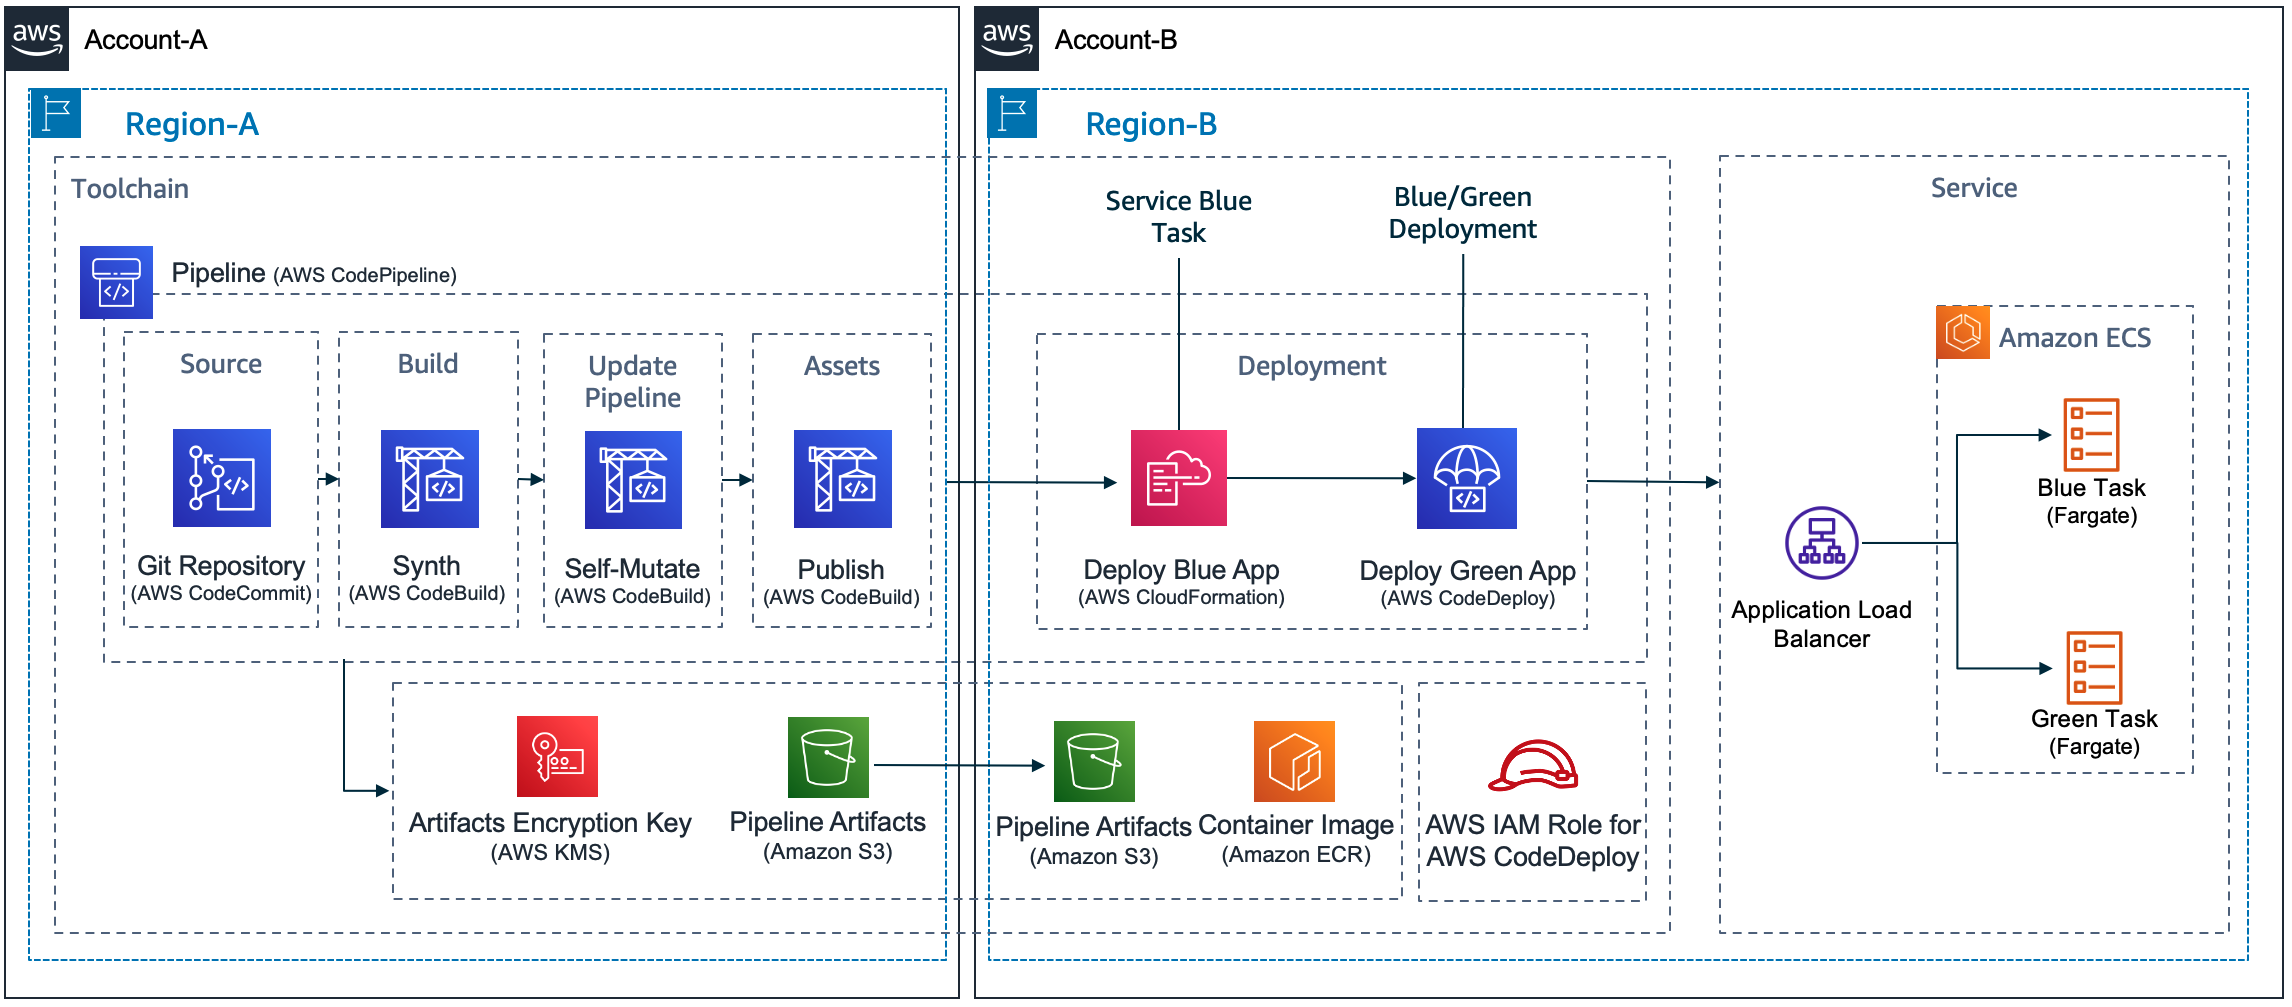
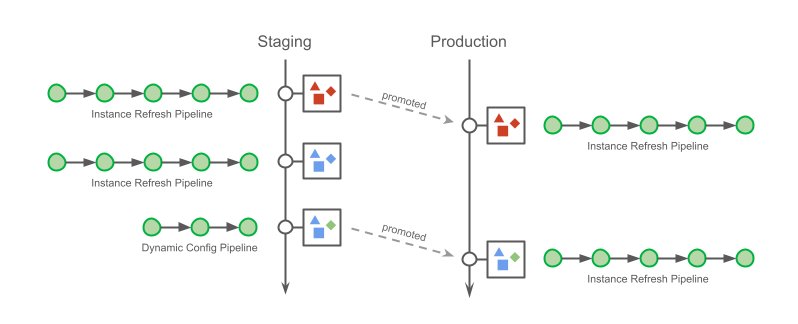
Solution Overview

As a convenience, I created an application, written in Java, that solves all these challenges and can be used as an example. The application deployment follows the same 5 steps for all deployment scenarios of account and Region, and this includes the scenarios represented in the following design:

A pipeline created by a Toolchain should be able to deploy to any combination of accounts and regions. This includes four scenarios: single-account and single-Region, single-account and cross-Region, cross-account and single-Region and cross-account and cross-Region

Conclusion

In this post, I identified, explained and solved challenges associated with the creation of a pipeline that deploys a service to Amazon ECS using CodeDeploy in different combinations of accounts and regions. I also introduced a demo application that implements these recommendations. The sample code can be extended to implement more elaborate scenarios. These scenarios might include automated testing, automated deployment rollbacks, or disaster recovery. I wish you success in your transformative journey.

Luiz Decaro

Luiz is a Principal Solutions architect at Amazon Web Services (AWS). He focuses on helping customers from the Financial Services Industry succeed in the cloud. Luiz holds a master’s in software engineering and he triggered his first continuous deployment pipeline in 2005.

Our Journey to Continuous Delivery at Grab (Part 2)

Post Syndicated from Grab Tech original https://engineering.grab.com/our-journey-to-continuous-delivery-at-grab-part2

In the first part of this blog post, you’ve read about the improvements made to our build and staging deployment process, and how plenty of manual tasks routinely taken by engineers have been automated with Conveyor: an in-house continuous delivery solution.

This new post begins with the introduction of the hermeticity principle for our deployments, and how it improves the confidence with promoting changes to production. Changes sent to production via Conveyor’s deployment pipelines are then described in detail.

Overview of Grab delivery process

Finally, looking back at the engineering efficiency improvements around velocity and reliability over the last 2 years, we answer the big question – was the investment on a custom continuous delivery solution like Conveyor the right decision for Grab?

Improving Confidence in our Production Deployments with Hermeticity

The term deployment hermeticity is borrowed from build systems. A build system is called hermetic if builds always produce the same artefacts regardless of changes in the environment they run on. Similarly, we call our deployments hermetic if they always result in the same deployed artefacts regardless of the environment’s change or the number of times they are executed.

The behaviour of a service is rarely controlled by a single variable. The application that makes up your service is an important driver of its behaviour, but its configuration is an important contributor, for example. The behaviour for traditional microservices at Grab is dictated mainly by 3 versioned artefacts: application code, static and dynamic configuration.

Conveyor has been integrated with the systems that operate changes in each of these parameters. By tracking all 3 parameters at every deployment, Conveyor can reproducibly deploy microservices with similar behaviour: its deployments are hermetic.

Building upon this property, Conveyor can ensure that all deployments made to production have been tested before with the same combination of parameters. This is valuable to us:

  • An outcome of staging deployments for a specific set of parameters is a good predictor of outcomes in production deployments for the same set of parameters and thus it makes testing in staging more relevant.
  • Rollbacks are hermetic; we never rollback to a combination of parameters that has not been used previously.

In the past, incidents had resulted from an application rollback not compatible with the current dynamic configuration version; this was aggravating since rollbacks are expected to be a safe recovery mechanism. The introduction of hermetic deployments has largely eliminated this category of problems.

Hermeticity is maintained by registering the deployment parameters as artefacts after each successfully completed pipeline. Users must then select one of the registered deployment metadata to promote to production.

At this point, you might be wondering: why not use a single pipeline that includes both staging and production deployments? This was indeed how it started, with a single pipeline spanning multiple environments. However, engineers soon complained about it.

The most obvious reason for the complaint was that less than 20% of changes deployed in staging will make their way to production. This meant that engineers would have toil associated with each completed staging deployment since the pipeline must be manually cancelled rather than continued to production.

The other reason is that this multi-environment pipeline approach reduced flexibility when promoting changes to production. There are different ways to apply changes to a cluster. For example, lengthy pipelines that refresh instances can be used to deploy any combination of changes, while there are quicker pipelines restricted to dynamic configuration changes (such as feature flags rollouts). Regardless of the order in which the changes are made and how they are applied, Conveyor tracks the change.

Eventually, engineers promote a deployment artefact to production. However they do not need to apply changes in the same sequence with which were applied to staging. Furthermore, to prevent erroneous actions, Conveyor presents only changes that can be applied with the requested pipeline (and sometimes, no changes are available). Not being forced into a specific method of deploying changes is one of added benefits of hermetic deployments.

Returning to Our Journey Towards Engineering Efficiency

If you can recall, the first part of this blog post series ended with a description of staging deployment. Our deployment to production starts with a verification that we uphold our hermeticity principle, as explained above.

Our production deployment pipelines can run for several hours for large clusters with rolling releases (few run for days), so we start by acquiring locks to ensure there are no concurrent deployments for any given cluster.

Before making any changes to the environment, we automatically generate release notes, giving engineers a chance to abort if the wrong set of changes are sent to production.

The pipeline next waits for a deployment slot. Early on, engineers adopted deployment windows that coincide with office hours, such that if anything goes wrong, there is always someone on hand to help. Prior to the introduction of Conveyor, however, engineers would manually ask a Slack bot for approval. This interaction is now automated, and the only remaining action left is for the engineer to approve that the deployment can proceed via a single click, in line with our hands-off deployment principle.

When the canary is in production, Conveyor automates monitoring it. This process is similar to the one already discussed in the first part of this blog post: Engineers can configure a set of alerts that Conveyor will keep track of. As soon as any one of the alerts is triggered, Conveyor automatically rolls back the service.

If no alert is raised for the duration of the monitoring period, Conveyor waits again for a deployment slot. It then publishes the release notes for that deployment and completes the deployments for the cluster. After the lock is released and the deployment registered, the pipeline finally comes to its successful completion.

Benefits of Our Journey Towards Engineering Efficiency

All these improvements made over the last 2 years have reduced the effort spent by engineers on deployment while also reducing the failure rate of our deployments.

If you are an engineer working on DevOps in your organisation, you know how hard it can be to measure the impact you made on your organisation. To estimate the time saved by our pipelines, we can model the activities that were previously done manually with a rudimentary weighted graph. In this graph, each edge carries a probability of the activity being performed (100% when unspecified), while each vertex carries the time taken for that activity.

Focusing on our regular staging deployments only, such a graph would look like this:

The overall amount of effort automated by the staging pipelines () is represented in the graph above. It can be converted into the equation below:

This equation shows that for each staging deployment, around 16 minutes of work have been saved. Similarly, for regular production deployments, we find that 67 minutes of work were saved for each deployment:

Moreover, efficiency was not the only benefit brought by the use of deployment pipelines for our traditional microservices. Surprisingly perhaps, the rate of failures related to production changes is progressively reducing while the amount of production changes that were made with Conveyor increased across the organisation (starting at 1.5% of failures per deployments, and finishing at 0.3% on average over the last 3 months for the period of data collected):

Keep Calm and Automate

Since the first draft for this post was written, we’ve made many more improvements to our pipelines. We’ve begun automating Database Migrations; we’ve extended our set of hermetic variables to Amazon Machine Image (AMI) updates; and we’re working towards supporting container deployments.

Through automation, all of Conveyor’s deployment pipelines have contributed to save more than 5,000 man-days of efforts in 2020 alone, across all supported teams. That’s around 20 man-years worth of effort, which is around 3 times the capacity of the team working on the project! Investments in our automation pipelines have more than paid for themselves, and the gains go up every year as more workflows are automated and more teams are onboarded.

If Conveyor has saved efforts for engineering teams, has it then helped to improve velocity? I had opened the first part of this blog post with figures on the deployment funnel for microservice teams at Grab, towards the end of 2018. So where do the figures stand today for these teams?

In the span of 2 years, the average number of build and staging deployment performed each day has not varied much. However, in the last 3 months of 2020, engineers have sent twice more changes to production than they did for the same period in 2018.

Perhaps the biggest recognition received by the team working on the project, was from Grab’s engineers themselves. In the 2020 internal NPS survey for engineering experience at Grab, Conveyor received the highest score of any tools (built in-house or not).


All these improvements in efficiency for our engineers would never have been possible without the hard work of all team members involved in the project, past and present: Tanun Chalermsinsuwan, Aufar Gilbran, Deepak Ramakrishnaiah, Repon Kumar Roy (Kowshik), Su Han, Voislav Dimitrijevikj, Stanley Goh, Htet Aung Shine, Evan Sebastian, Qijia Wang, Oscar Ng, Jacob Sunny, Subhodip Mandal and many others who have contributed and collaborated with them.


Join Us

Grab is the leading superapp platform in Southeast Asia, providing everyday services that matter to consumers. More than just a ride-hailing and food delivery app, Grab offers a wide range of on-demand services in the region, including mobility, food, package and grocery delivery services, mobile payments, and financial services across 428 cities in eight countries.

Powered by technology and driven by heart, our mission is to drive Southeast Asia forward by creating economic empowerment for everyone. If this mission speaks to you, join our team today!

Our Journey to Continuous Delivery at Grab (Part 1)

Post Syndicated from Grab Tech original https://engineering.grab.com/our-journey-to-continuous-delivery-at-grab

This blog post is a two-part presentation of the effort that went into improving the continuous delivery processes for backend services at Grab in the past two years. In the first part, we take stock of where we started two years ago and describe the software and tools we created while introducing some of the integrations we’ve done to automate our software delivery in our staging environment.


Continuous Delivery is the principle of delivering software often, every day.

As a backend engineer at Grab, nothing matters more than the ability to innovate quickly and safely. Around the end of 2018, Grab’s transportation and deliveries backend architecture consisted of roughly 270 services (the majority being microservices). The deployment process was lengthy, required careful inputs and clear communication. The care needed to push changes in production and the risk associated with manual operations led to the introduction of a Slack bot to coordinate deployments. The bot ensures that deployments occur only during off-peak and within work hours:

Overview of the Grab Delivery Process

Once the build was completed, engineers who desired to deploy their software to the Staging environment would copy release versions from the build logs, and paste them in a Jenkins job’s parameter. Tests needed to be manually triggered from another dedicated Jenkins job.

Prior to production deployments, engineers would generate their release notes via a script and update them manually in a wiki document. Deployments would be scheduled through interactions with a Slack bot that controls release notes and deployment windows. Production deployments were made once again by pasting the correct parameters into two dedicated Jenkins jobs, one for the canary (a.k.a. one-box) deployment and the other for the full deployment, spread one hour apart. During the monitoring phase, engineers would continuously observe metrics reported on our dashboards.

In spite of the fragmented process and risky manual operations impacting our velocity and stability, around 614 builds were running each business day and changes were deployed on our staging environment at an average rate of 300 new code releases per business day, while production changes averaged a rate of 28 new code releases per business day.

Our Deployment Funnel, Towards the End of 2018

These figures meant that, on average, it took 10 business days between each service update in production, and only 10% of the staging deployments were eventually promoted to production.

Automating Continuous Deployments at Grab

With an increased focus on Engineering efficiency, in 2018 we started an internal initiative to address frictions in deployments that became known as Conveyor. To build Conveyor with a small team of engineers, we had to rely on an already mature platform which exhibited properties that are desirable to us to achieve our mission.

Hands-off deployments

Deployments should be an afterthought. Engineers should be as removed from the process as possible, and whenever possible, decisions should be taken early, during the code review process. The machine will do the heavy lifting, and only when it can’t decide for itself, should the engineer be involved. Notifications can be leveraged to ensure that engineers are only informed when something goes wrong and a human decision is required.

Hands-off Deployment Principle

Confidence in Deployments

Grab’s focus on gathering internal Engineering NPS feedback helped us collect valuable metrics. One of the metrics we cared about was our engineers’ confidence in their production deployments. A team’s entire deployment process to production could last for more than a day and may extend up to a week for teams with large infrastructures running critical services. The possibility of losing progress in deployments when individual steps may last for hours is detrimental to the improvement of Engineering efficiency in the organisation. The deployment automation platform is the bedrock of that confidence. If the platform itself fails regularly or does provide a path of upgrade that is transparent to end-users, any features built on top of it would suffer from these downtimes and ultimately erode confidence in deployments.

Tailored To Most But Extensible For The Few

Our backend engineering teams are working on diverse stacks, and so are their deployment processes. Right from the start, we wanted our product to benefit the largest population of engineers that had adopted the same process, so as to maximize returns on our investments. To ease adoption, we decided to tailor a deployment pipeline such that:

  1. It would model the exact sequence of manual processes followed by this population of engineers.
  2. Switching to use that pipeline should require as little work as possible by service teams.

However, in cases where this model would not fit a team’s specific process, our deployment platform should be open and extensible and support new customizations even when they are not originally supported by the product’s ecosystem.

Cloud-Agnosticity

While we were going to target a specific process and team, to ensure that our solution would stand the test of time, we needed to ensure that our solution would support the variety of environments currently used in production. This variety was also likely to increase, and we wanted a platform that would mature together with the rest of our ecosystem.

Overview Of Conveyor

Setting Sail With Spinnaker

Conveyor is based on Spinnaker, an open-source, multi-cloud continuous delivery platform. We’ve chosen Spinnaker over other platforms because it is a mature deployment platform with no single point of failure, supports complex workflows (referred to as pipelines in Spinnaker), and already supports a large array of cloud providers. Since Spinnaker is open-source and extensible, it allowed us to add the features we needed for the specificity of our ecosystem.

To further ease adoption within our organization, we built a tailored  user interface and created our own domain-specific language (DSL) to manage its pipelines as code.

Outline of Conveyor's Architecture
Outline of Conveyor’s Architecture

Onboarding To A Simpler Interface

Spinnaker comes with its own interface, it has all the features an engineer would want from an advanced continuous delivery system. However, Spinnaker interface is vastly different from Jenkins and makes for a steep learning curve.

To reduce our barrier to adoption, we decided early on to create a simple interface for our users. In this interface, deployment pipelines take the center stage of our application. Pipelines are objects managed by Spinnaker, they model the different steps in the workflow of each deployment. Each pipeline is made up of stages that can be assembled like lego-bricks to form the final pipeline. An instance of a pipeline is called an execution.

Conveyor dashboard. Sensitive information like authors and service names are redacted.
Conveyor Dashboard

With this interface, each engineer can focus on what matters to them immediately: the pipeline they have started, or those started by other teammates working on the same services as they are. Conveyor also provides a search bar (on the top) and filters (on the left) that work in concert to explore all pipelines executed at Grab.

We adopted a consistent set of colours to model all information in our interface:

  • blue: represent stages that are currently running;
  • red: stages that have failed or important information;
  • yellow: stages that require human interaction;
  • and finally, in green: stages that were successfully completed.

Conveyor also provides a task and notifications area, where all stages requiring human intervention are listed in one location. Manual interactions are often no more than just YES or NO questions:

Conveyor tasks. Sensitive information like author/service names is redacted.
Conveyor Tasks

Finally, in addition to supporting automated deployments, we greatly simplified the start of manual deployments. Instead of being required to copy/paste information, each parameter can be selected on the interface from a set of predefined items, sorted chronologically, and presented with contextual information to help engineers in their decision.

Several parameters are required for our deployments and their values are selected from the UI to ensure correctness.

Simplified manual deployments
Simplified Manual Deployments

Ease Of Adoption With Our Pipeline-As-Code DSL

Ease of adoption for the team is not simply about the learning curve of the new tools. We needed to make it easy for teams to configure their services to deploy with Conveyor. Since we focused on automating tasks that were already performed manually, we needed only to configure the layer that would enable the integration.

We set on creating a pipeline-as-code implementation when none were widely being developed in the Spinnaker community. It’s interesting to see that two years on, this idea has grown in parallel in the community, with the birth of other pipeline-as-code implementations. Our pipeline-as-code is referred to as the Pipeline DSL, and its configuration is located inside each team’s repository. Artificer is the name of our Pipeline DSL interpreter and it runs with every change inside our monorepository:

Artificer: Our Pipeline DSL

Pipelines are being updated at every commit if necessary.

Creating a conveyor.jsonnet file inside with the service’s directory of our monorepository with the few lines below is all that’s required for Artificer to do its work and get the benefits of automation provided by Conveyor’s pipeline:

local default = import 'default.libsonnet';
[
 {
 name: "service-name",
 group: [
 "group-name",
 ]
 }
]

Sample minimal conveyor.jsonnet configuration to onboard services.

In this file, engineers simply specify the name of their service and the group that a user should belong to, to have deployment rights for the service.

Once the build is completed, teams can log in to Conveyor and start manual deployments of their services with our pipelines. Three pipelines are provided by default: the integration pipeline used for tests and developments, the staging pipeline used for pre-production tests, and the production pipeline for production deployment.

Thanks to the simplicity of this minimal configuration file, we were able to generate these configuration files for all existing services of our monorepository. This resulted in the automatic onboarding of a large number of teams and was a major contributing factor to the adoption of Conveyor throughout our organisation.

Our Journey To Engineering Efficiency (for backend services)

The sections below relate some of the improvements in engineering efficiency we’ve delivered since Conveyor’s inception. They were not made precisely in this order but for readability, they have been mapped to each step of the software development lifecycle.

Automate Deployments at Build Time

Continuous Integration Job

Continuous delivery begins with a pushed code commit in our trunk-based development flow. Whenever a developer pushes changes onto their development branch or onto the trunk, a continuous integration job is triggered on Jenkins. The products of this job (binaries, docker images, etc) are all uploaded into our artefact repositories. We’ve made two additions to our continuous integration process.

The first modification happens at the step “Upload & Register artefacts”. At this step, each artefact created is now registered in Conveyor with its associated metadata. When and if an engineer needs to trigger a deployment manually, Conveyor can display the list of versions to choose from, eliminating the need for error-prone manual inputs:

 Staging
Staging

Each selectable version shows contextual information: title, author, version and link to the code change where it originated. During registration, the commit time is also recorded and used to order entries chronologically in the interface. To ensure this integration is not a single point of failure for deployments, manual input is still available optionally.

The second modification implements one of the essential feature continuous delivery: your deployments should happen often, automatically. Engineers are now given the possibility to start automatic deployments once continuous integration has successfully completed, by simply modifying their project’s continuous integration settings:

 "AfterBuild": [
  {
      "AutoDeploy": {
      "OnDiff": false,
      "OnLand": true
    }
    "TYPE": "conveyor"
  }
 ],

Sample settings needed to trigger auto-deployments. ‘Diff’ refers to code review submissions, and ‘Land’ refers to merged code changes.

Staging Pipeline

Before deploying a new artefact to a service in production, changes are validated on the staging environment. During the staging deployment, we verify that canary (one-box) deployments and full deployments with automated smoke and functional tests suites.

Staging Pipeline
Staging Pipeline

We start by acquiring a deployment lock for this service and this environment. This prevents another deployment of the same service on the same environment to happen concurrently, other deployments will be waiting in a FIFO queue until the lock is released.

The stage “Compute Changeset” ensures that the deployment is not a rollback. It verifies that the new version deployed does not correspond to a rollback by comparing the ancestry of the commits provided during the artefact registration at build time: since we automate deployments after the build process has completed, cases of rollback may occur when two changes are created in quick succession and the latest build completes earlier than the older one.

After the stage “Deploy Canary” has completed, smoke test run. There are three kinds of tests executed at different stages of the pipeline: smoke, functional and security tests. Smoke tests directly reach the canary instance’s endpoint, by-passing load-balancers. If the smoke tests fail,  the canary is immediately rolled back and this deployment is terminated.

All tests are generated from the same builds as the artefact being tested and their versions must match during testing. To ensure that the right version of the test run and distinguish between the different kind of tests to perform, we provide additional metadata that will be passed by Conveyor to the tests system, known internally as Gandalf:

local default = import 'default.libsonnet';
[
  {
    name: "service-name",
    group: [
    "group-name",
    ],
    gandalf_smoke_tests: [
    {
        path: "repo.internal/path/to/my/smoke/tests"
      }
      ],
      gandalf_functional_tests: [
      {
        path: "repo.internal/path/to/my/functional/tests"
      }
      gandalf_security_tests: [
      {
        path: "repo.internal/path/to/my/security/tests"
      }
      ]
    }
]

Sample conveyor.jsonnet configuration with integration tests added.

Additionally, in parallel to the execution of the smoke tests, the canary is also being monitored from the moment its deployment has completed and for a predetermined duration. We leverage our integration with Datadog to allow engineers to select the alerts to monitor. If an alert is triggered during the monitoring period, and while the tests are executed, the canary is again rolled back, and the pipeline is terminated. Engineers can specify the alerts by adding them to the conveyor.jsonnet configuration file together with the monitoring duration:

local default = import 'default.libsonnet';
[
 {
   name: "service-name",
   group: [
   "group-name",
   ],
    gandalf_smoke_tests: [
    {
      path: "repo.internal/path/to/my/smoke/tests"
   }
   ],
   gandalf_functional_tests: [
   {
   path: "repo.internal/path/to/my/functional/tests"
  }
     gandalf_security_tests: [
     {
     path: "repo.internal/path/to/my/security/tests"
     }
     ],
     monitor: {
     stg: {
     duration_seconds: 300,
     alarms: [
     {
   type: "datadog",
   alert_id: 12345678
   },
   {
   type: "datadog",
   alert_id: 23456789
      }
      ]
      }
    }
  }
]

Sample conveyor.jsonnet configuration with alerts in staging added.

When the smoke tests and monitor pass and the deployment of new artefacts is completed, the pipeline execution triggers functional and security tests. Unlike smoke tests, functional & security tests run only after that step, as they communicate with the cluster through load-balancers, impersonating other services.

Before releasing the lock, release notes are generated to inform engineers of the delta of changes between the version they just released and the one currently running in production. Once the lock is released, the stage “Check Policies” verifies that the parameters and variable of the deployment obeys a specific set of criteria, for example: if its service metadata is up-to-date in our service inventory, or if the base image used during deployment is sufficiently recent.

Here’s how the policy stage, the engine, and the providers interact with each other:

Check Policy Stage
Check Policy Stage

In Spinnaker, each event of a pipeline’s execution updates the pipeline’s state in the database. The current state of the pipeline can be fetched by its API as a single JSON document, describing all information related to its execution: including its parameters, the contextual information related to each stage or even the response from the various interfacing components. The role of our “Policy Check” stage is to query this JSON representation of the pipeline, to extract and transform the variables which are forwarded to our policy engine for validation. Our policy engine gathers judgements passed by different policy providers. If the validation by the policy engine fails, the deployment is not rolled back this time; however, promotion to production is not possible and the pipeline is immediately terminated.

The journey through staging deployment finally ends with the stage “Register Deployment”. This stage registers that a successful deployment was made in our staging environment as an artefact. Similarly to the policy check above, certain parameters of the deployment are picked up and consolidated into this document. We use this kind of artefact as proof for upcoming production deployment.

Continuing Our Journey to Engineering Efficiency

With the advancements made in continuous integration and deployment to staging, Conveyor has reduced the efforts needed by our engineers to just three clicks in its interface, when automated deployment is used. Even when the deployment is triggered manually, Conveyor gives the assurance that the parameters selected are valid and it does away with copy/pasting and human interactions across heterogeneous tools.

In the sequel to this blog post, we’ll dive into the improvements that we’ve made to our production deployments and introduce a crucial concept that led to the creation of our proof for successful staging deployment. Finally, we’ll cover the impact that Conveyor had on the continuous delivery of our backend services, by comparing our deployment velocity when we started two years ago versus where we are today.


All these improvements in efficiency for our engineers would never have been possible without the hard work of all team members involved in the project, past and present: Evan Sebastian, Tanun Chalermsinsuwan, Aufar Gilbran, Deepak Ramakrishnaiah, Repon Kumar Roy (Kowshik), Su Han, Voislav Dimitrijevikj, Qijia Wang, Oscar Ng, Jacob Sunny, Subhodip Mandal, and many others who have contributed and collaborated with them.


Join us

Grab is more than just the leading ride-hailing and mobile payments platform in Southeast Asia. We use data and technology to improve everything from transportation to payments and financial services across a region of more than 620 million people. We aspire to unlock the true potential of Southeast Asia and look for like-minded individuals to join us on this ride.

If you share our vision of driving South East Asia forward, apply to join our team today.