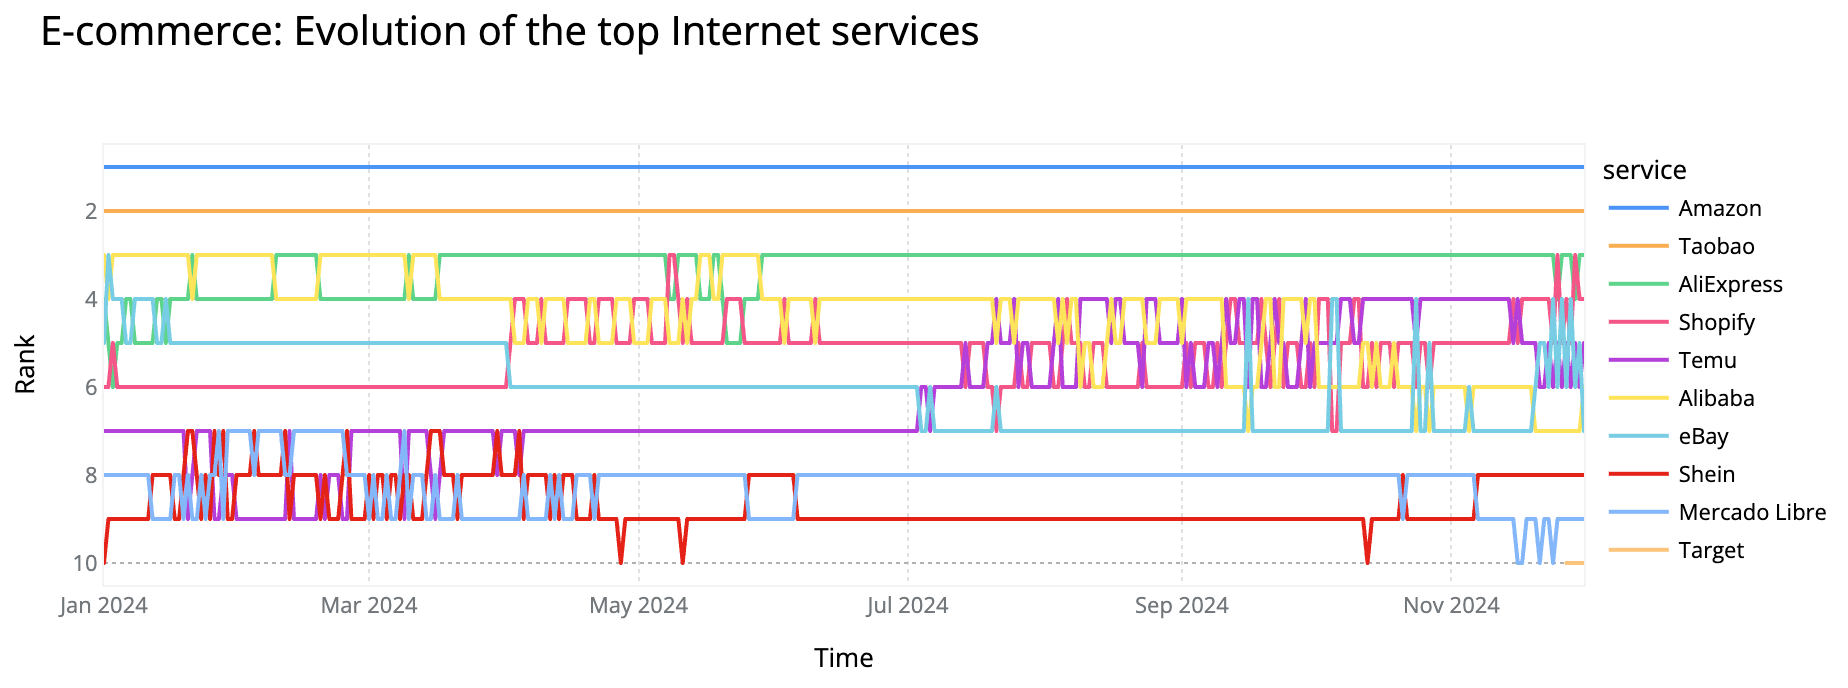
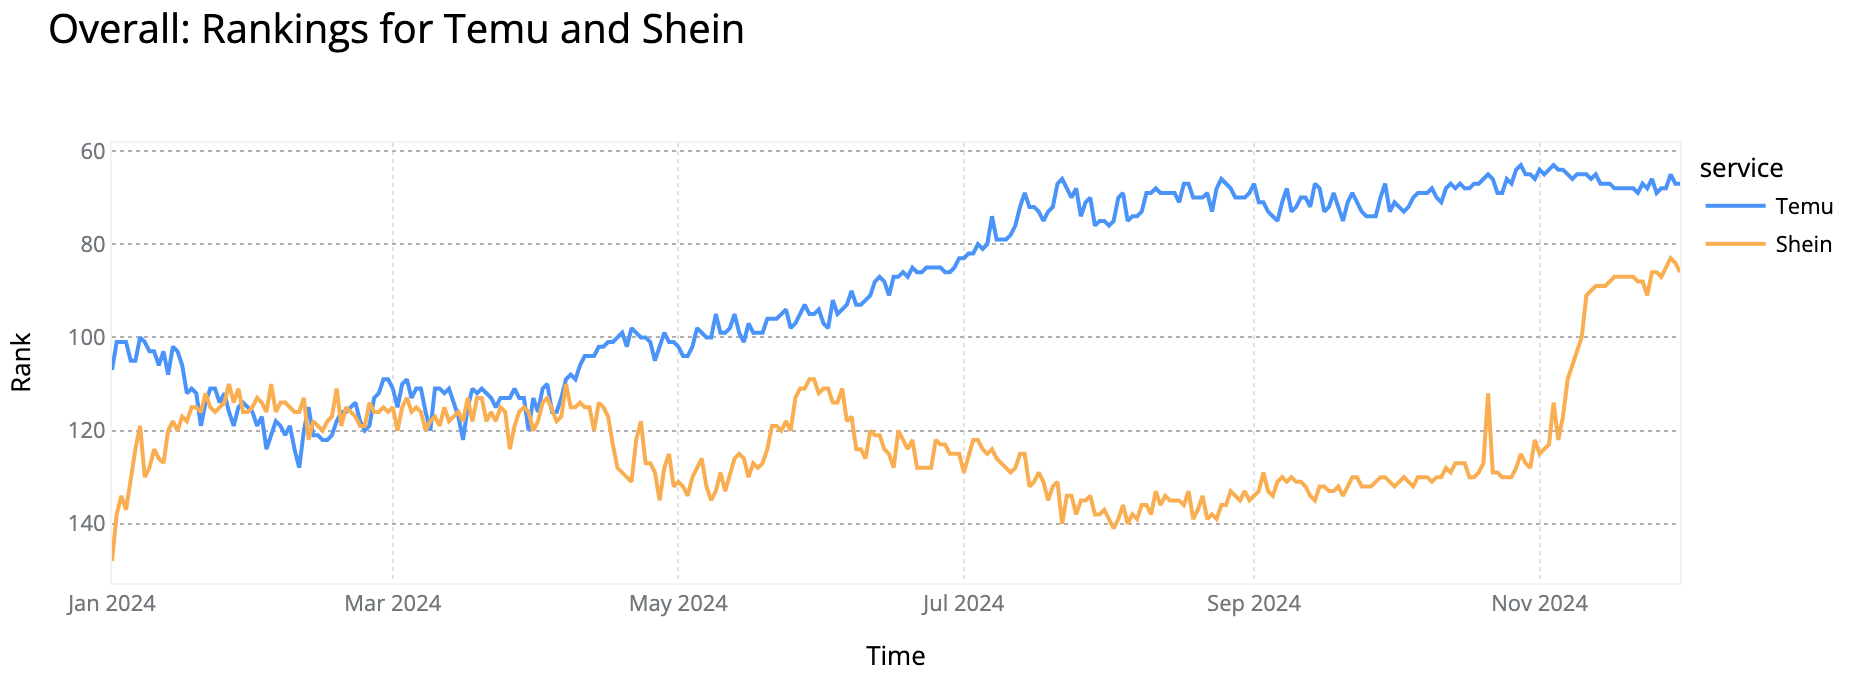
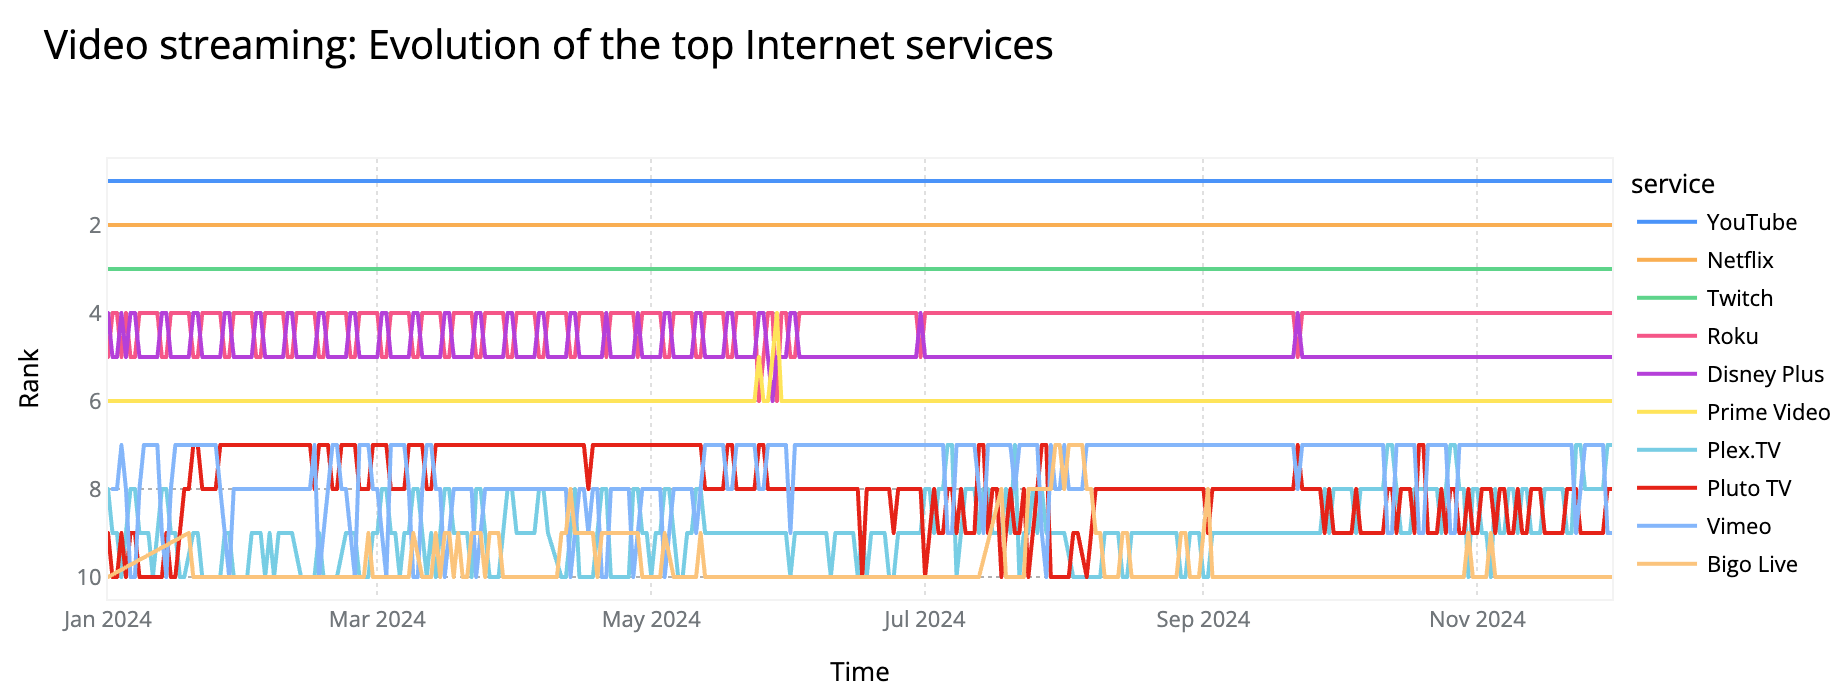
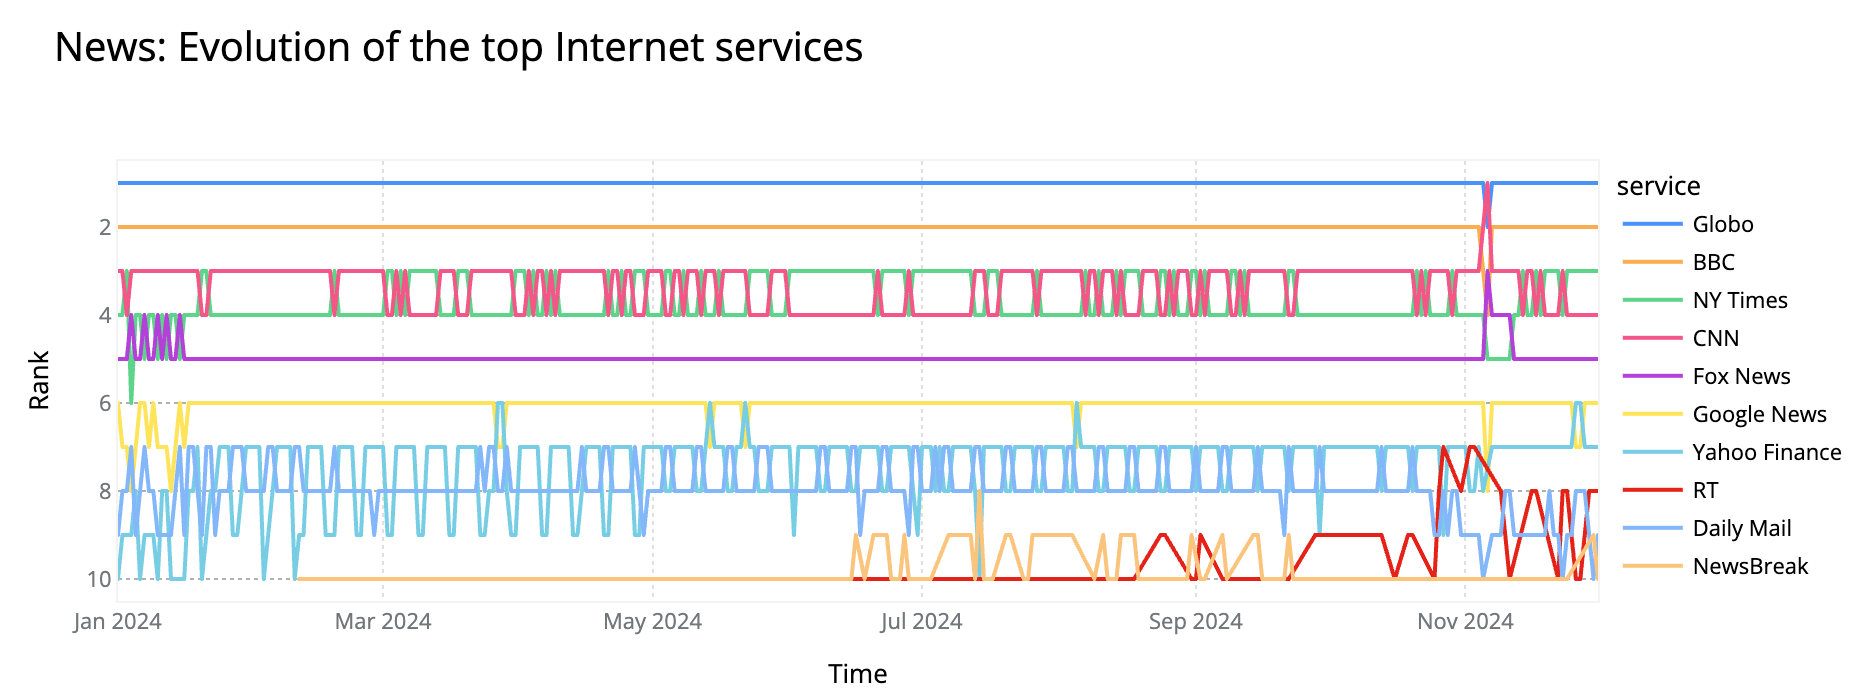
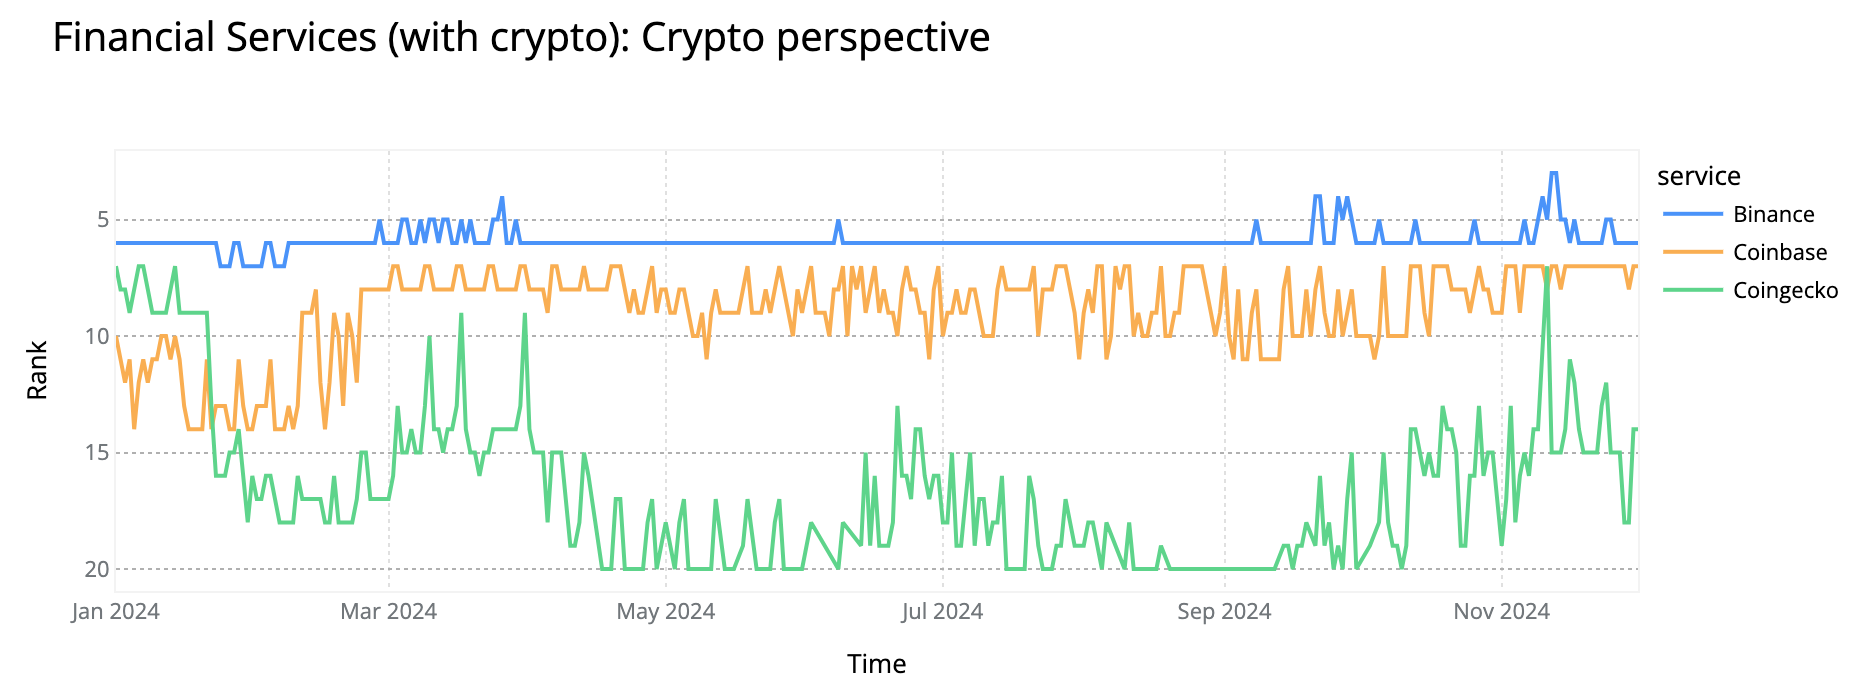
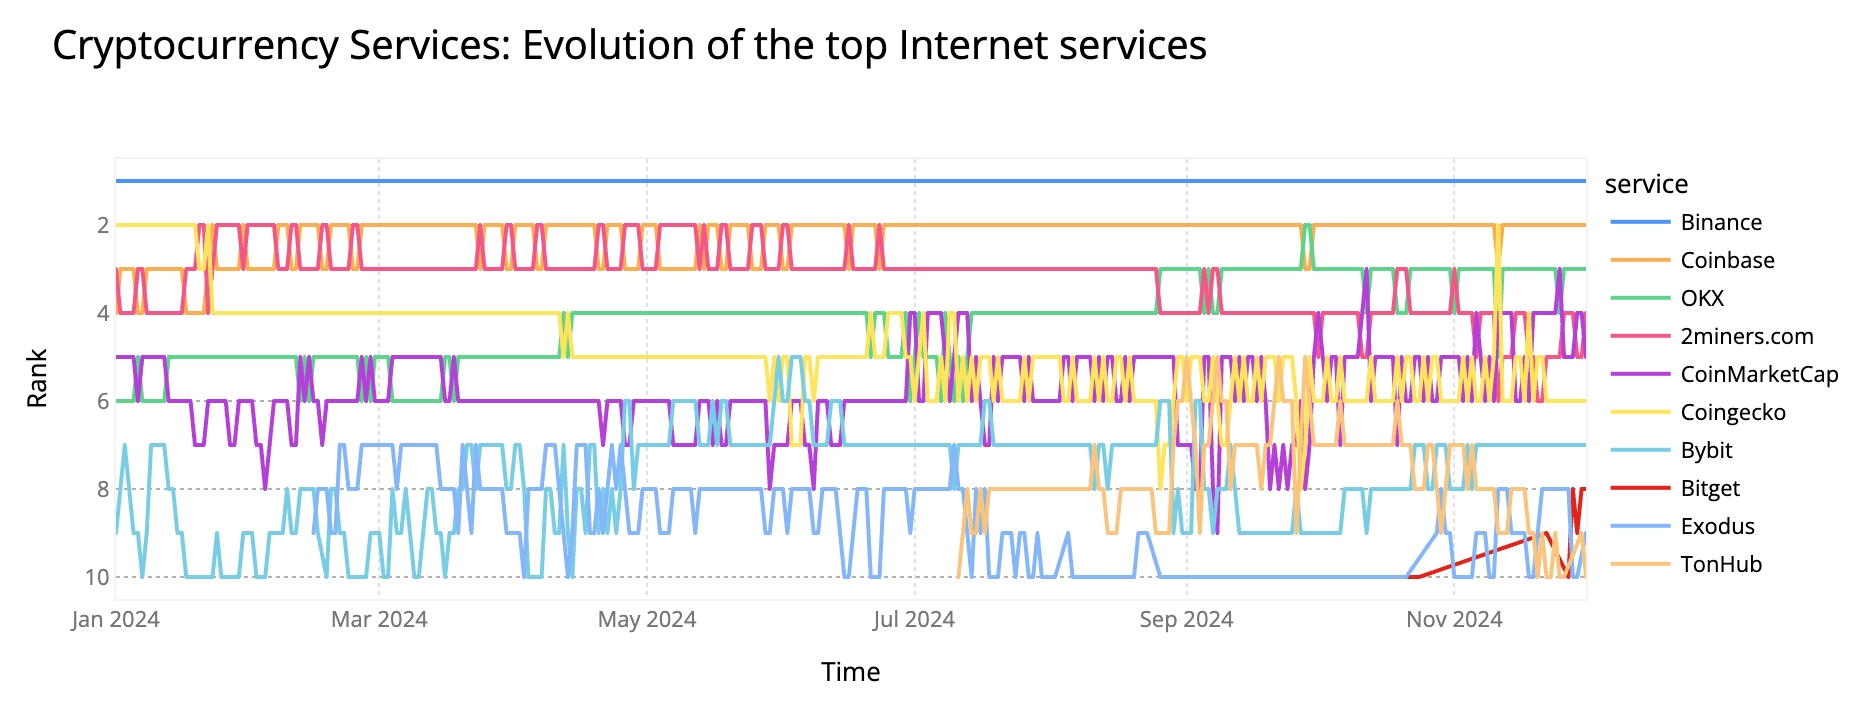
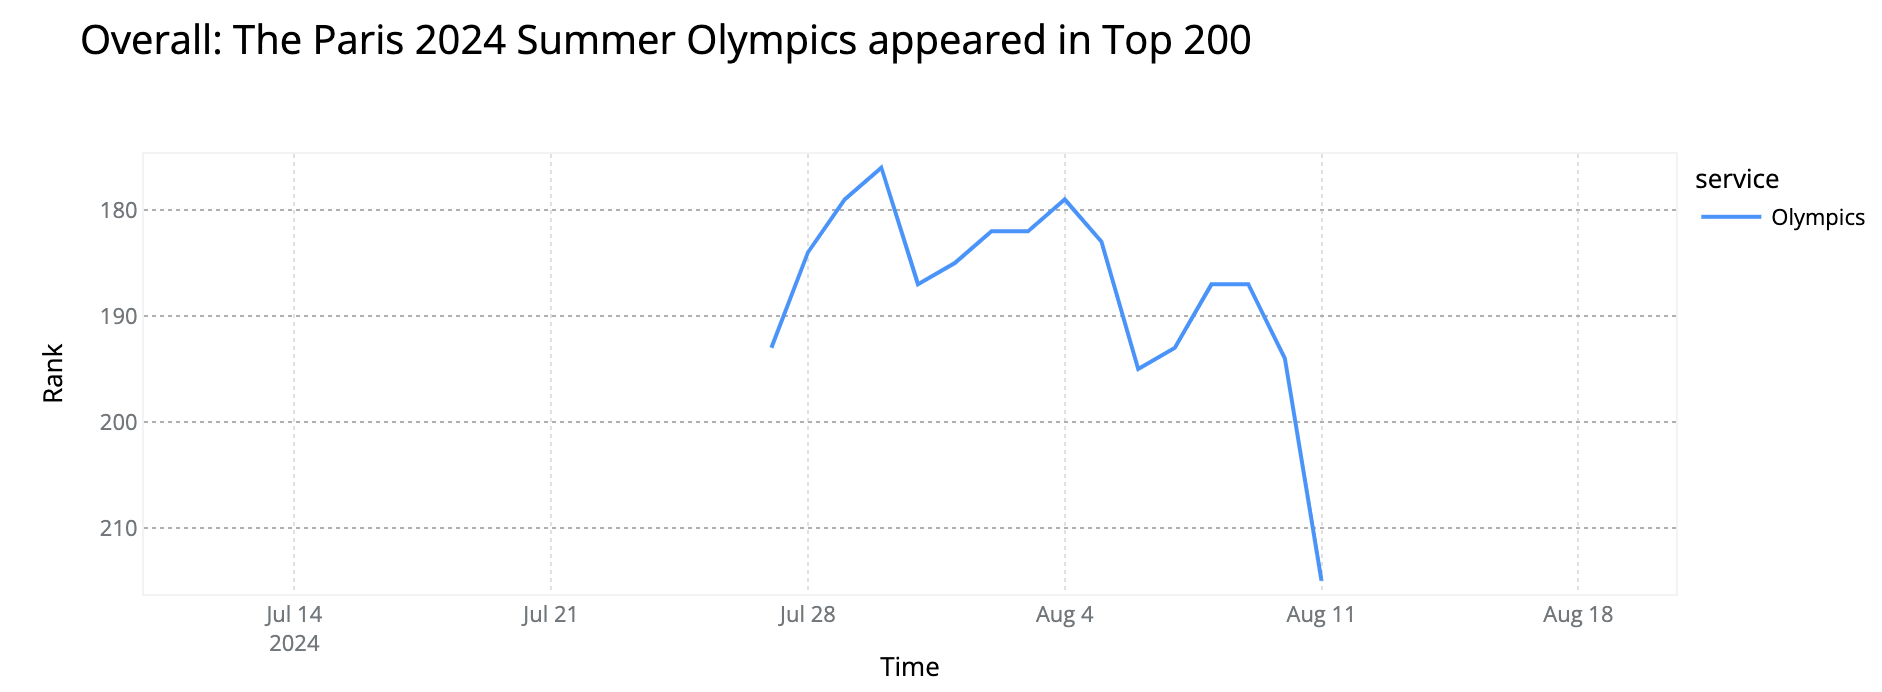
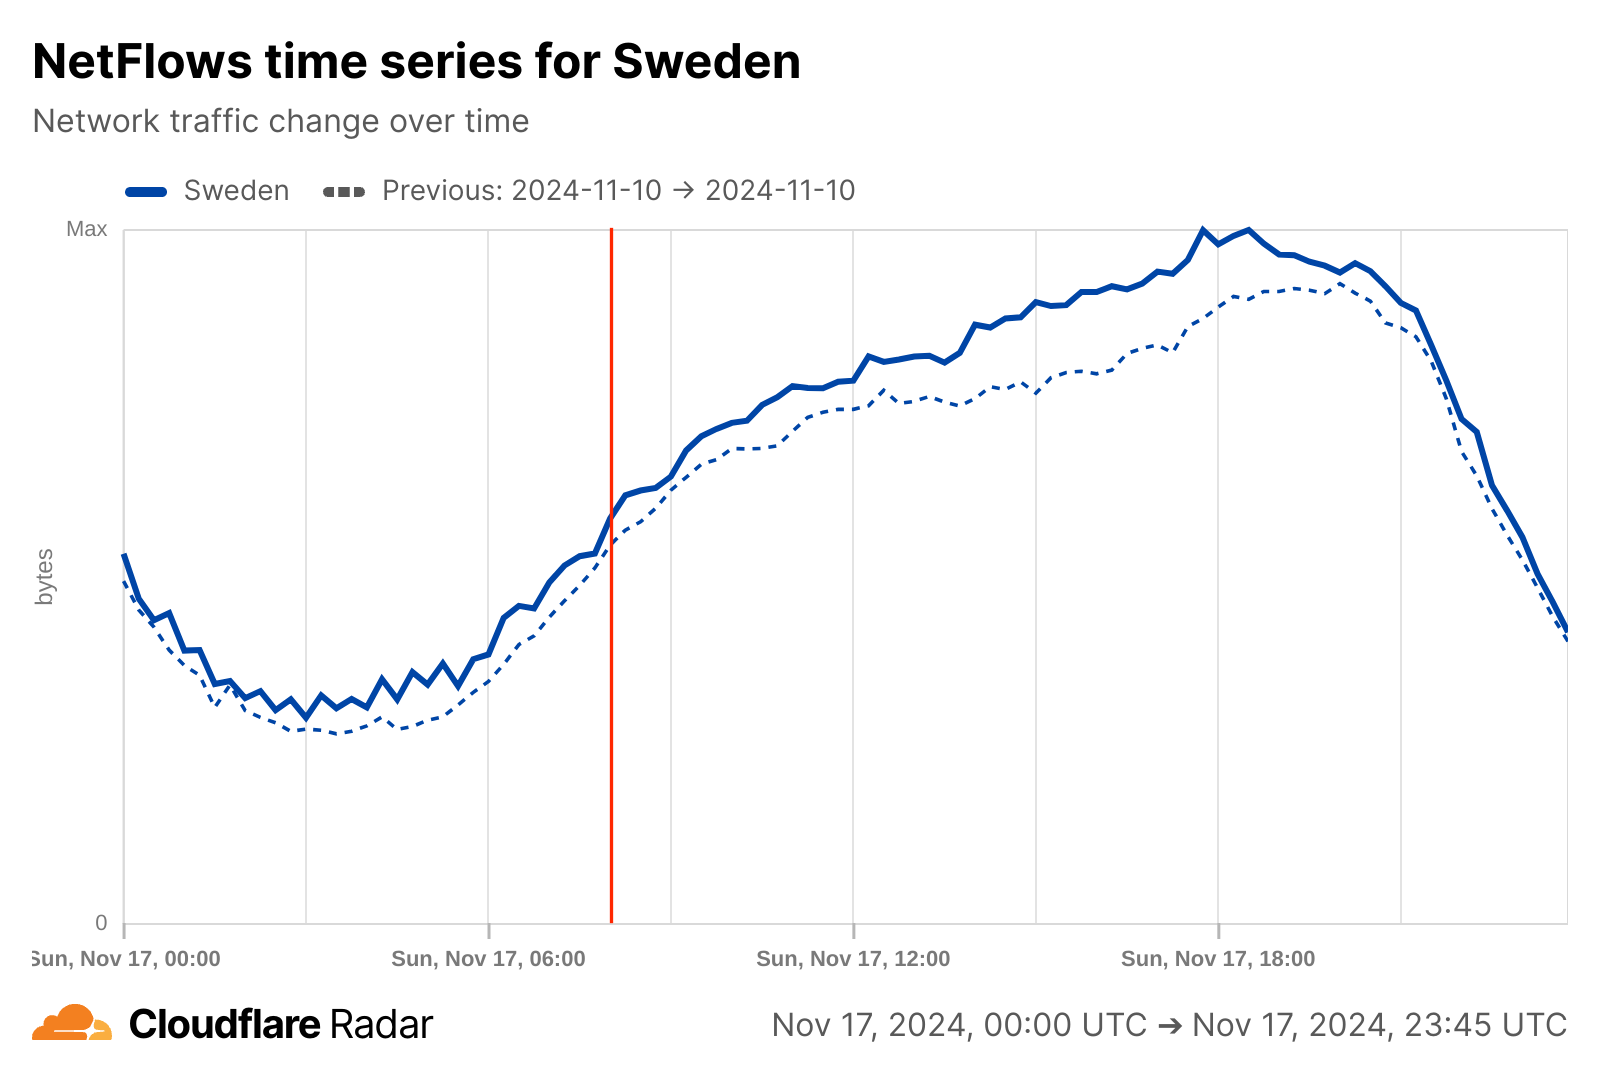
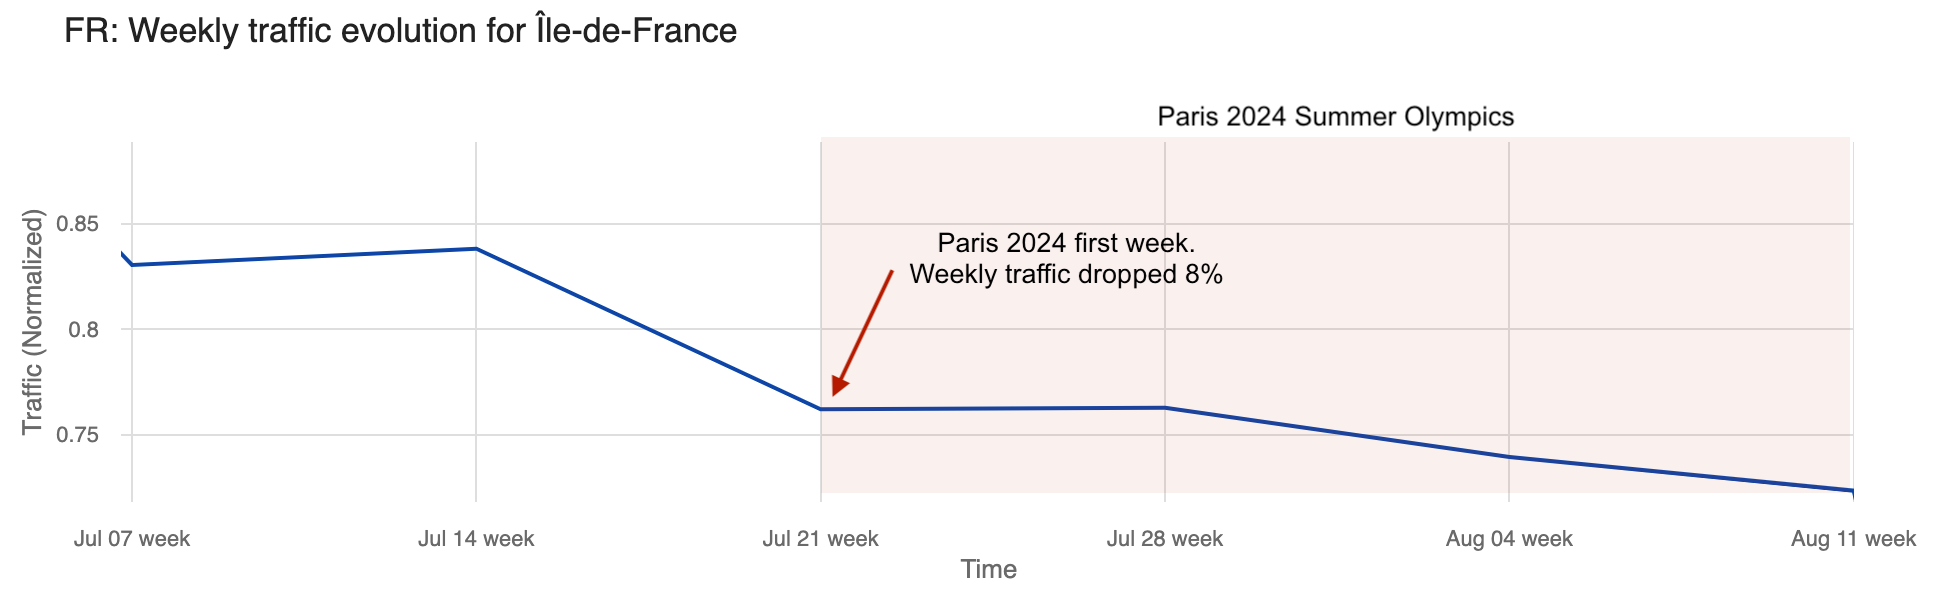
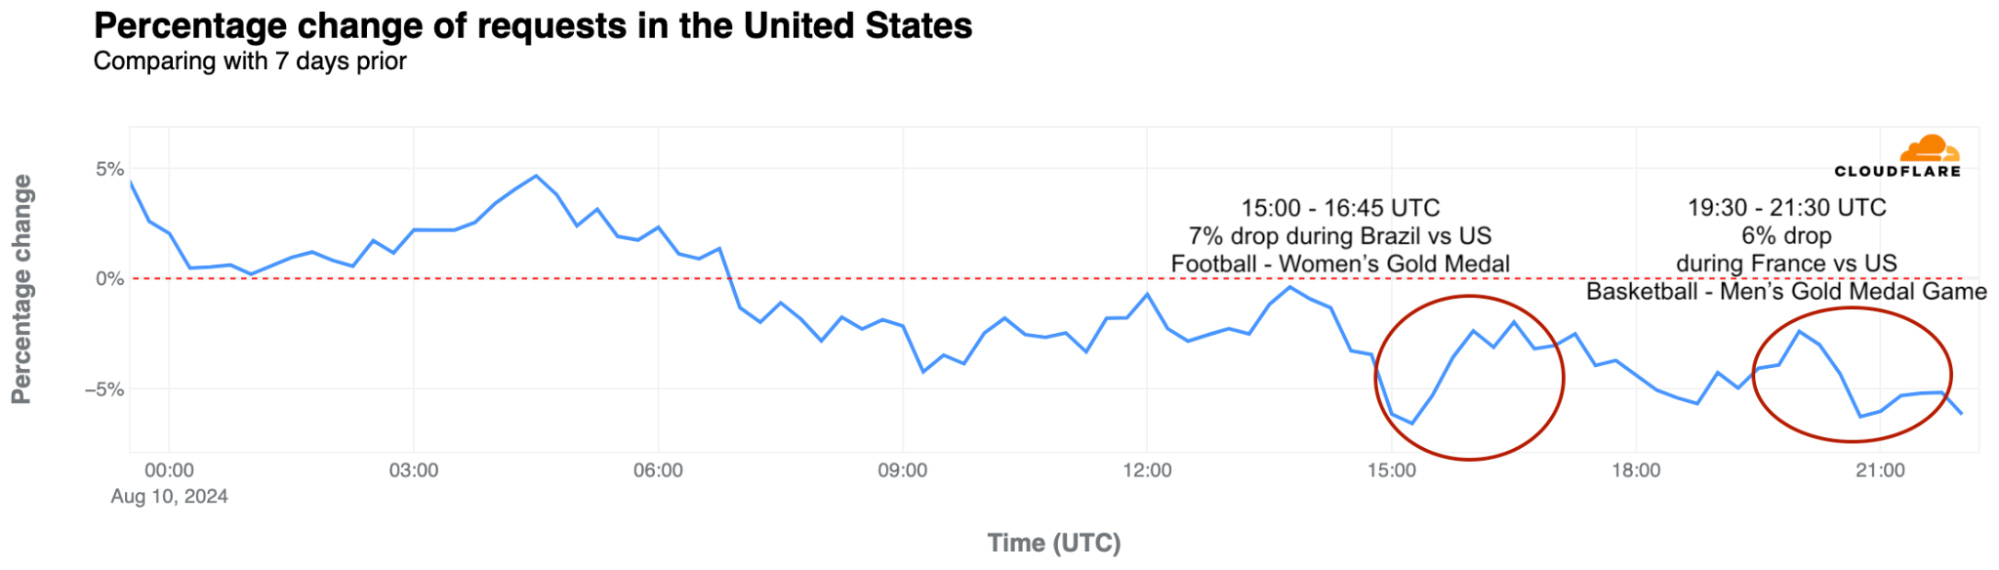
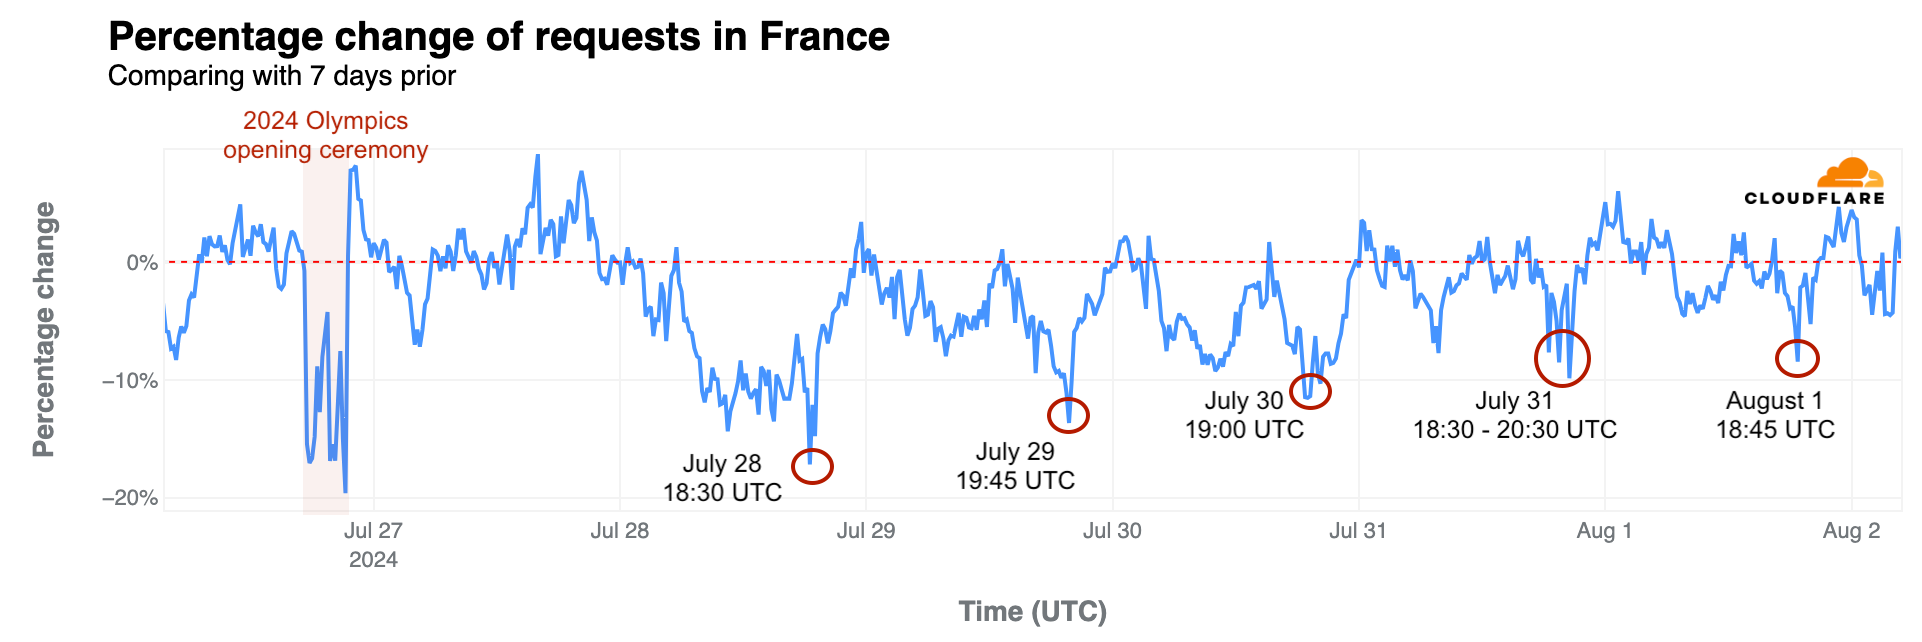
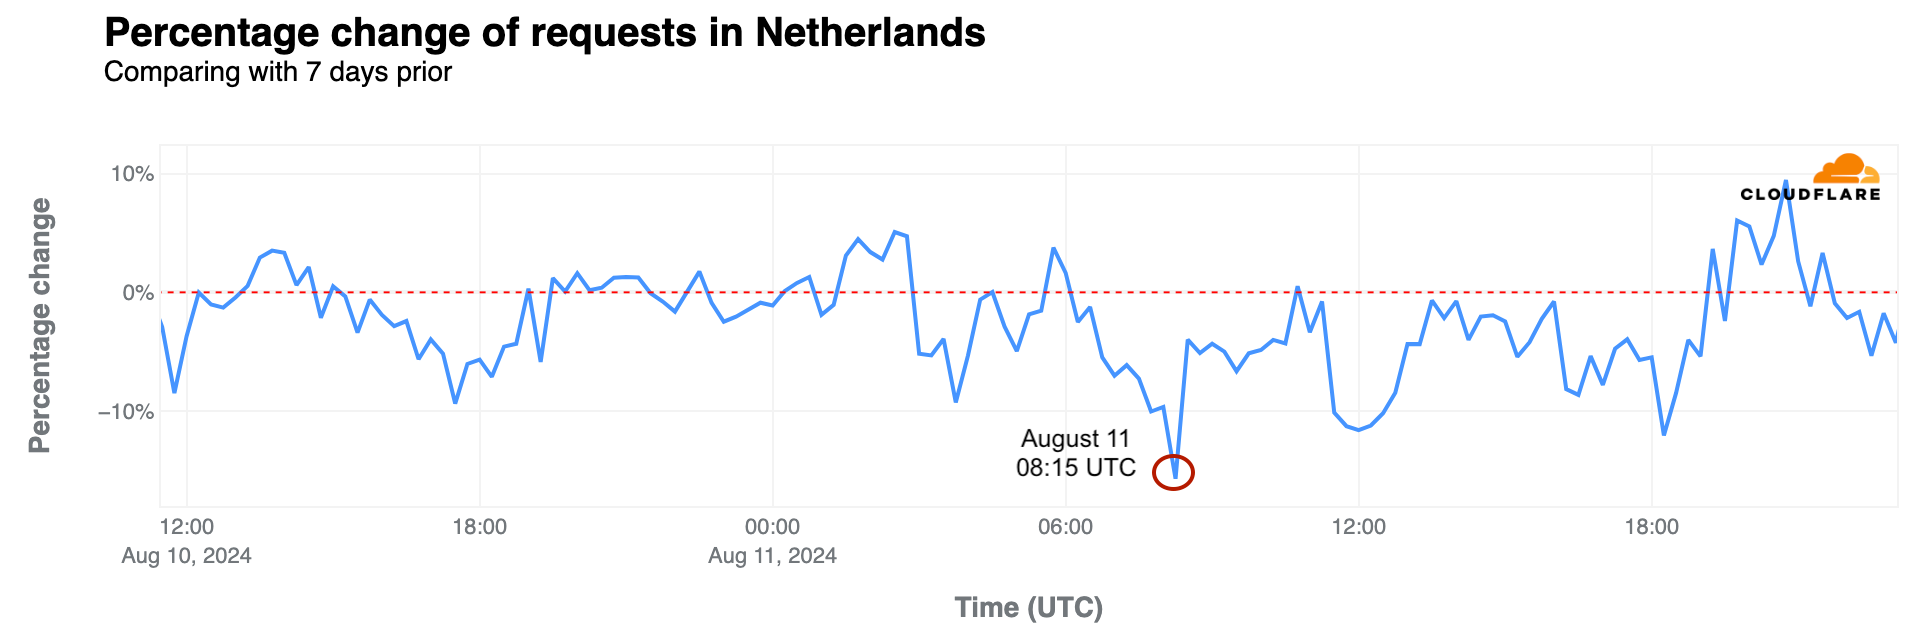
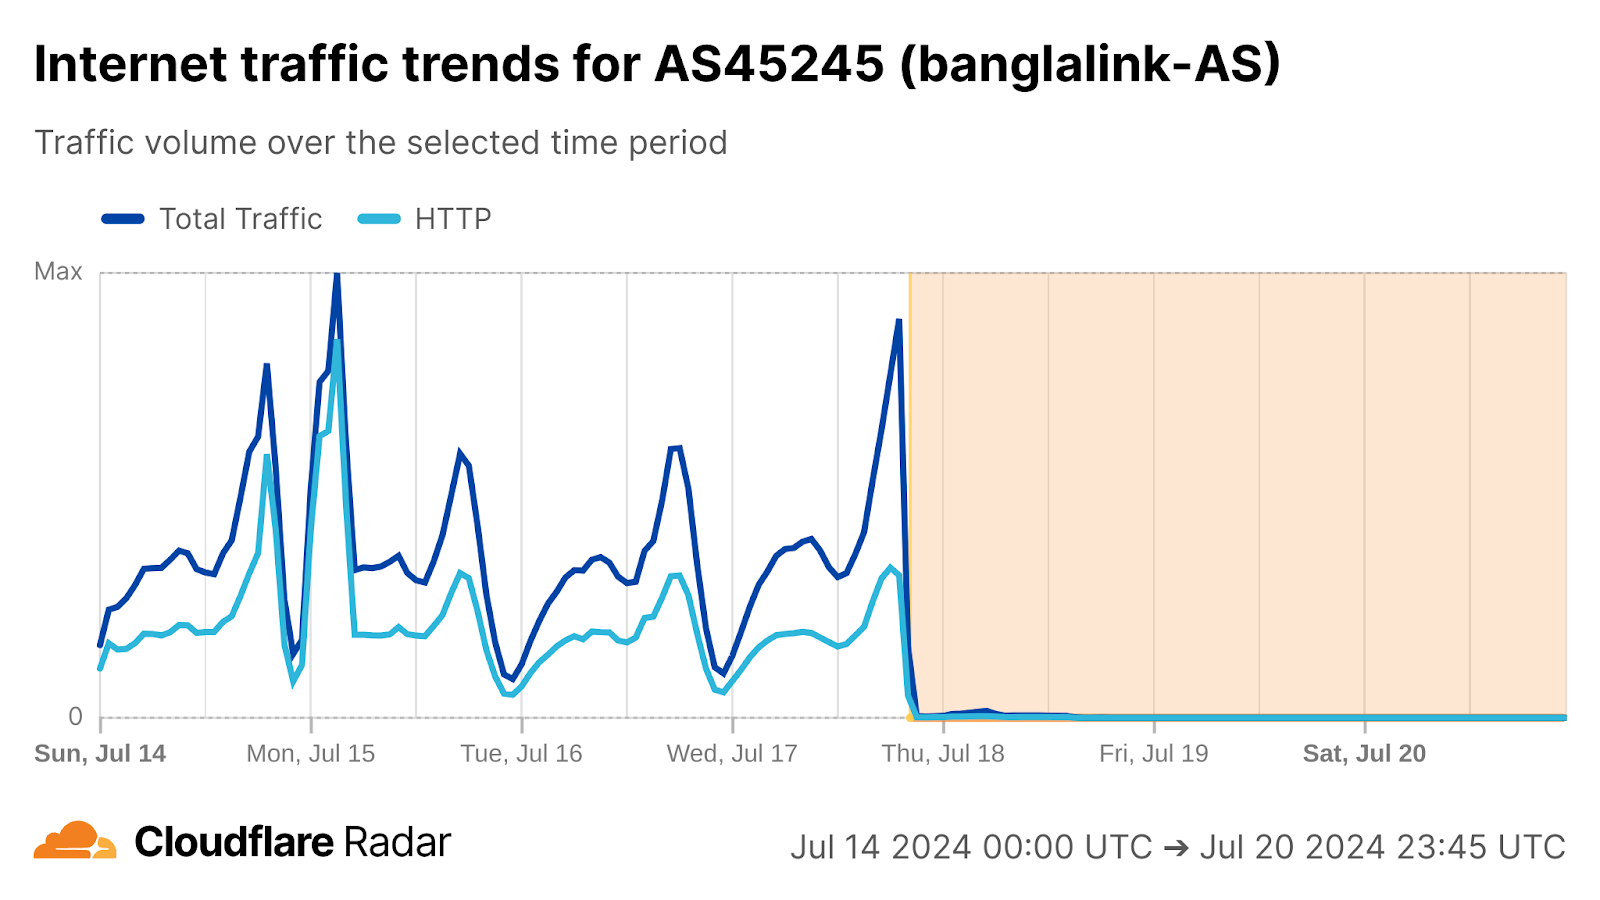
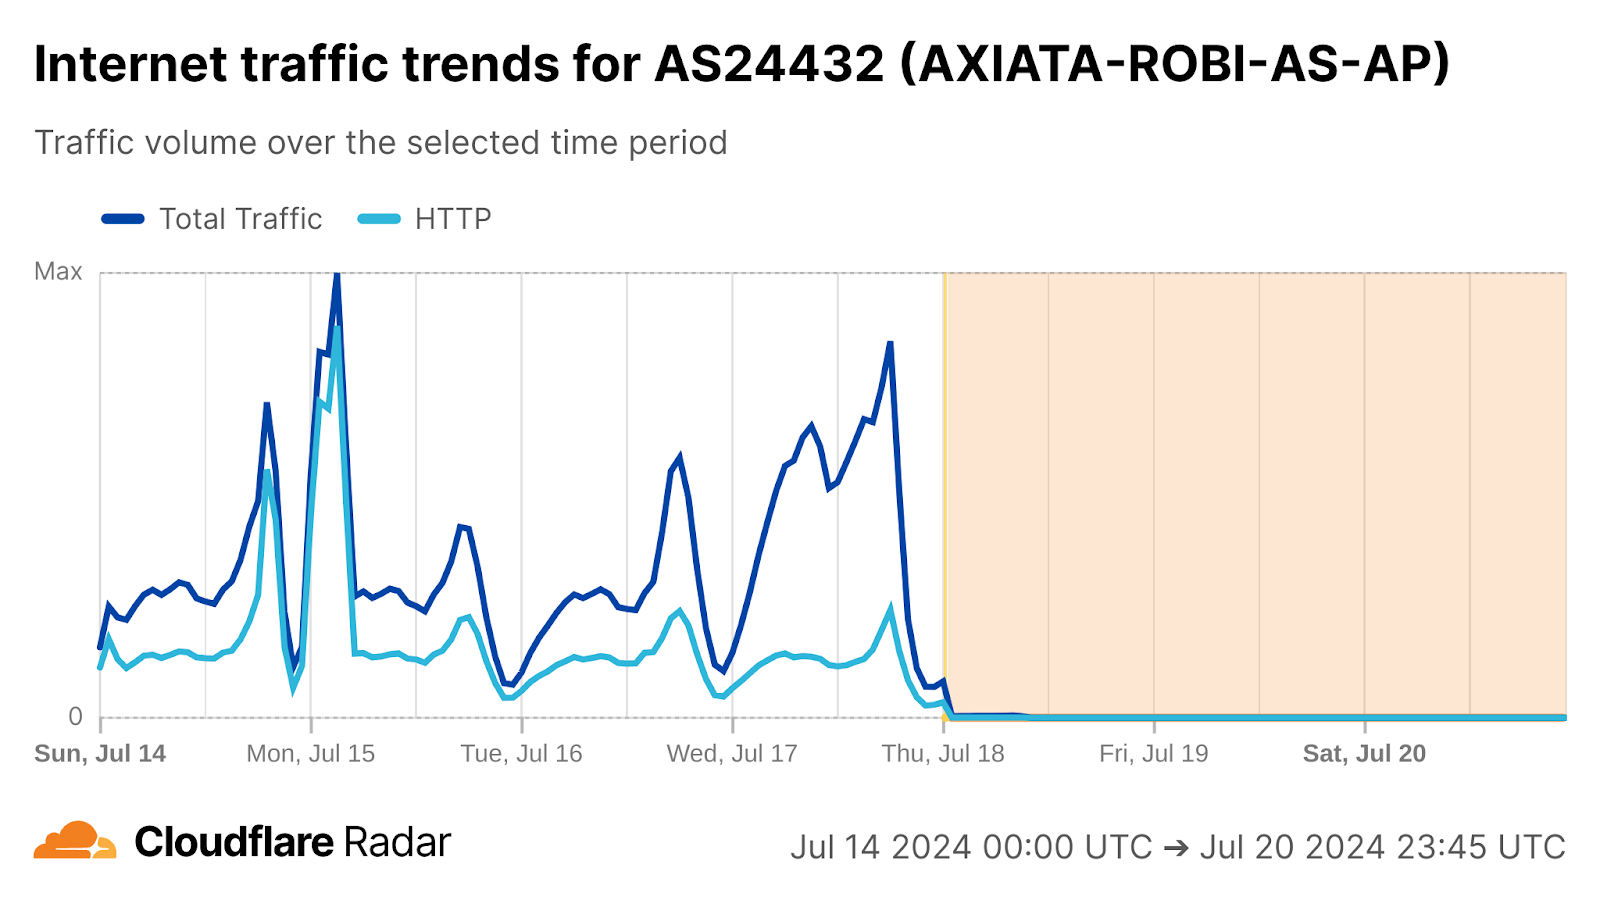
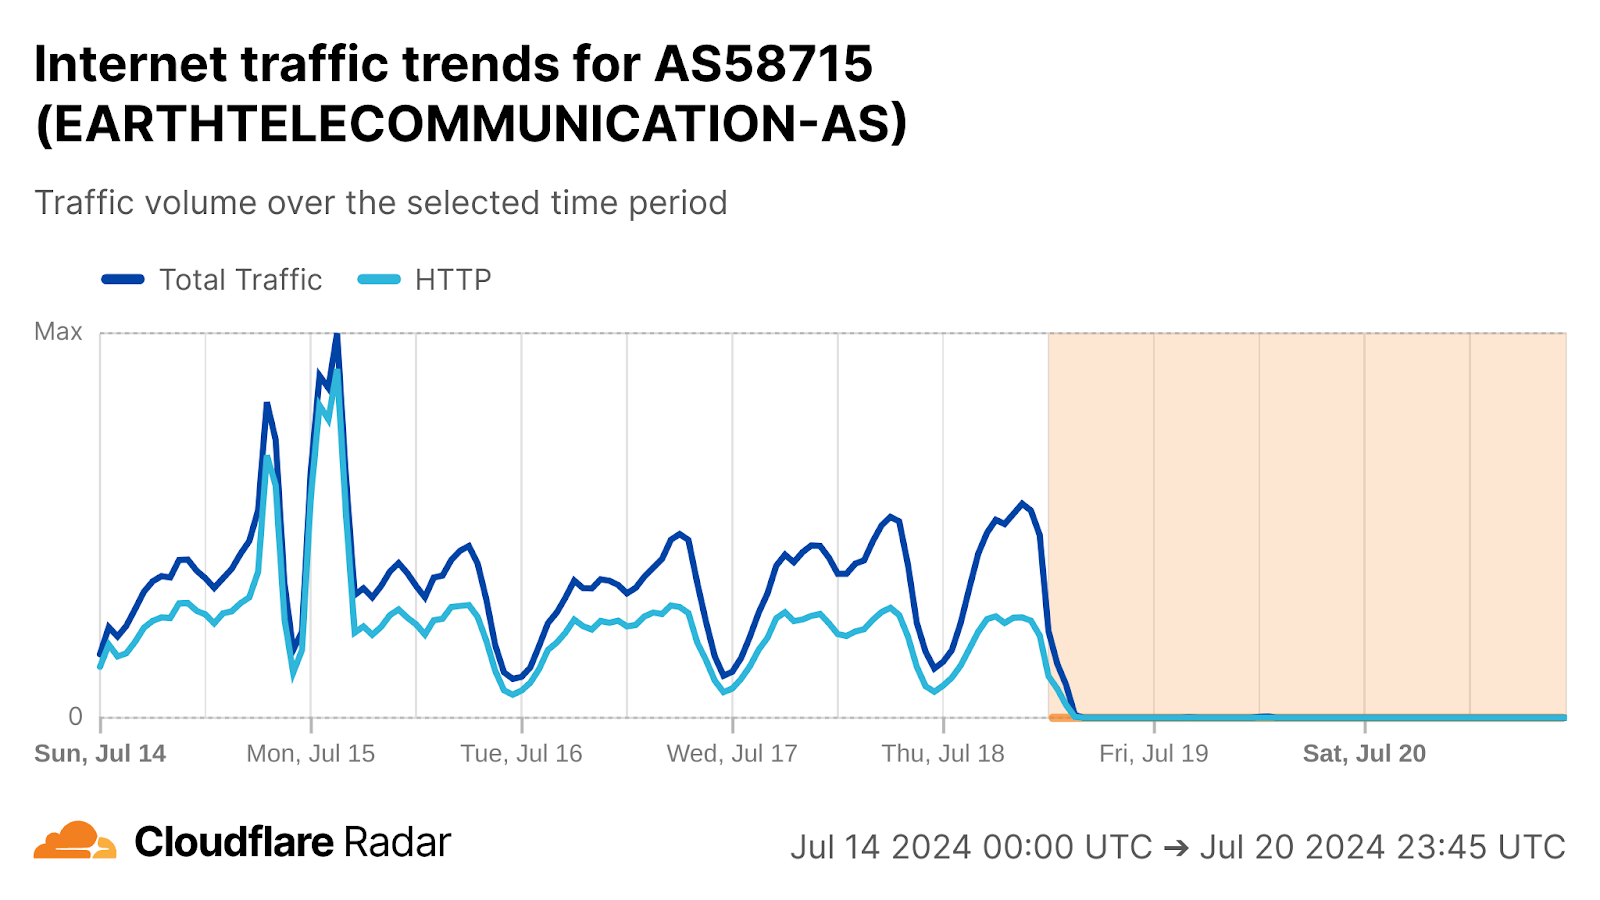
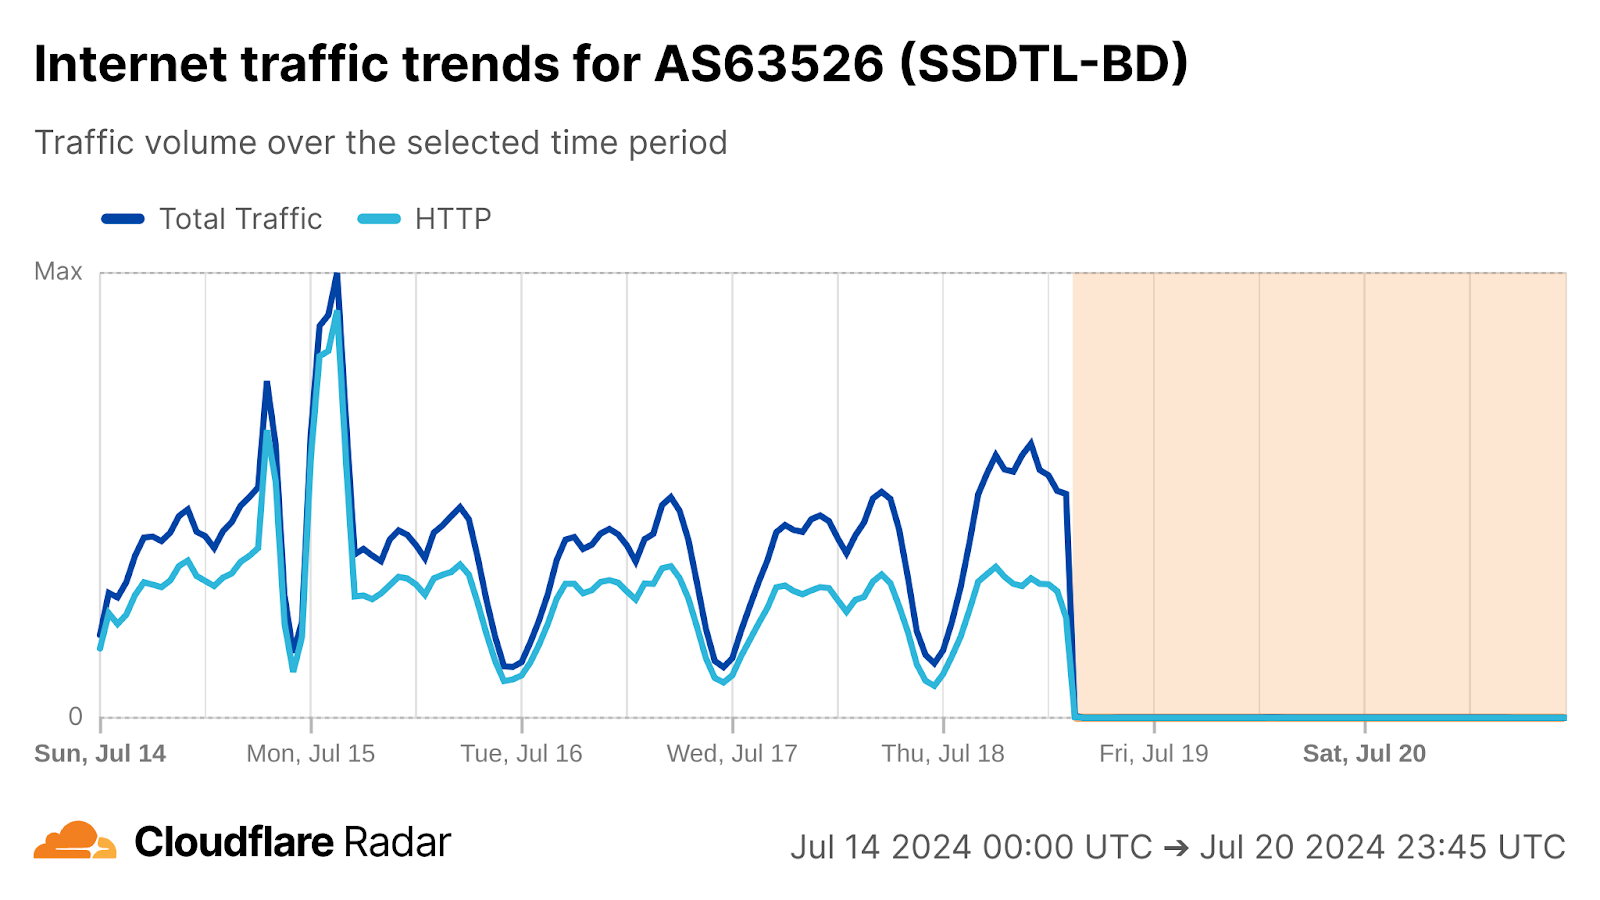
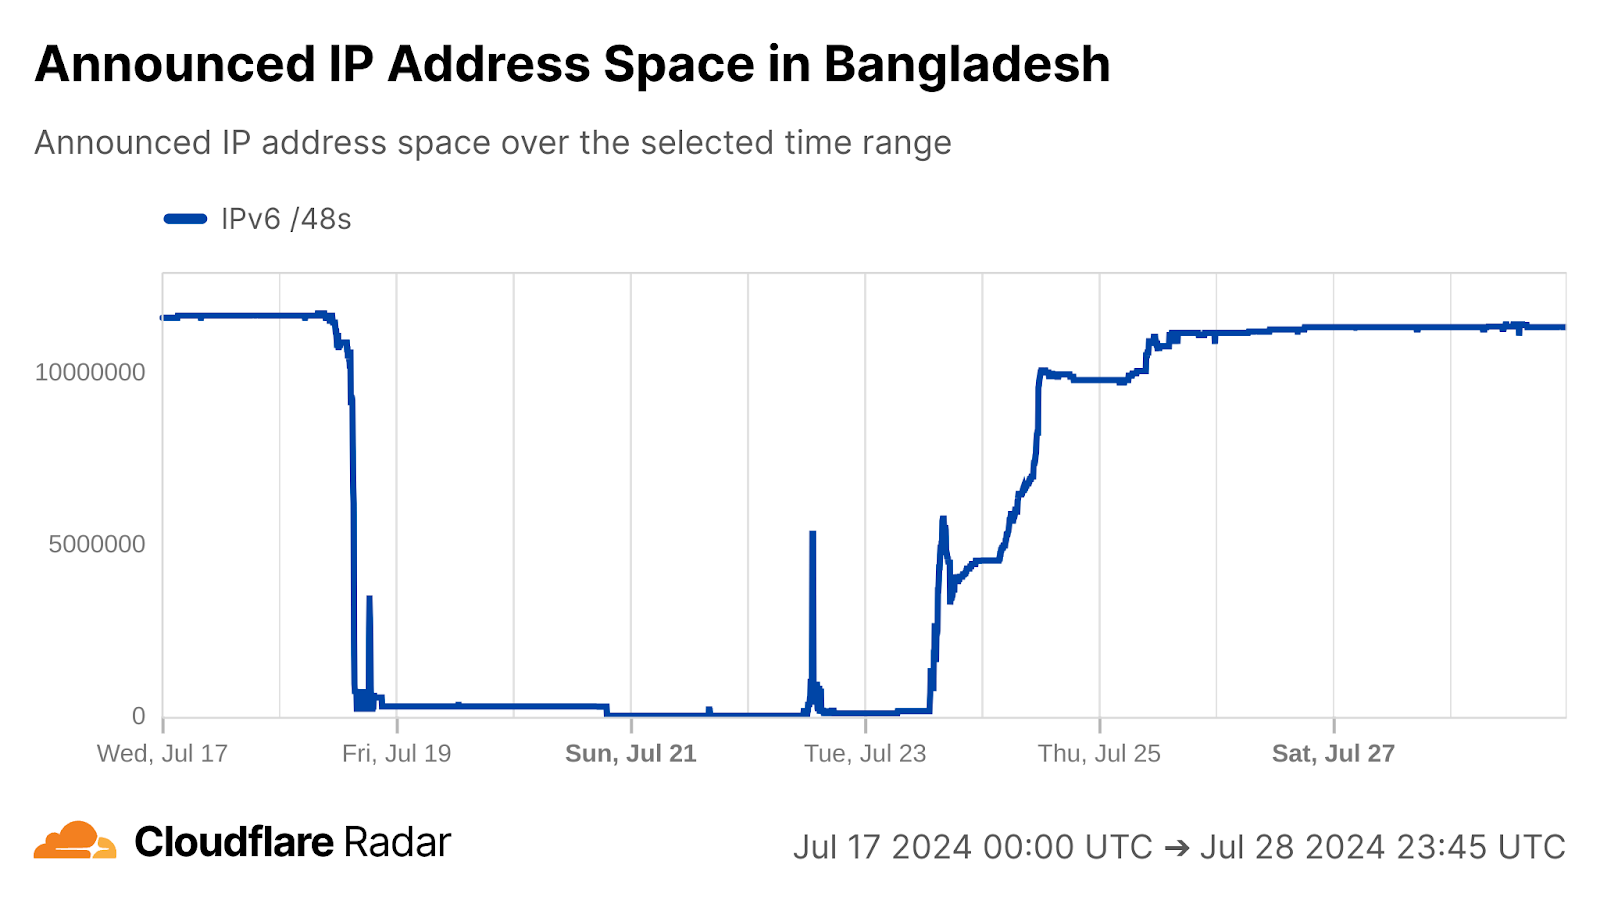
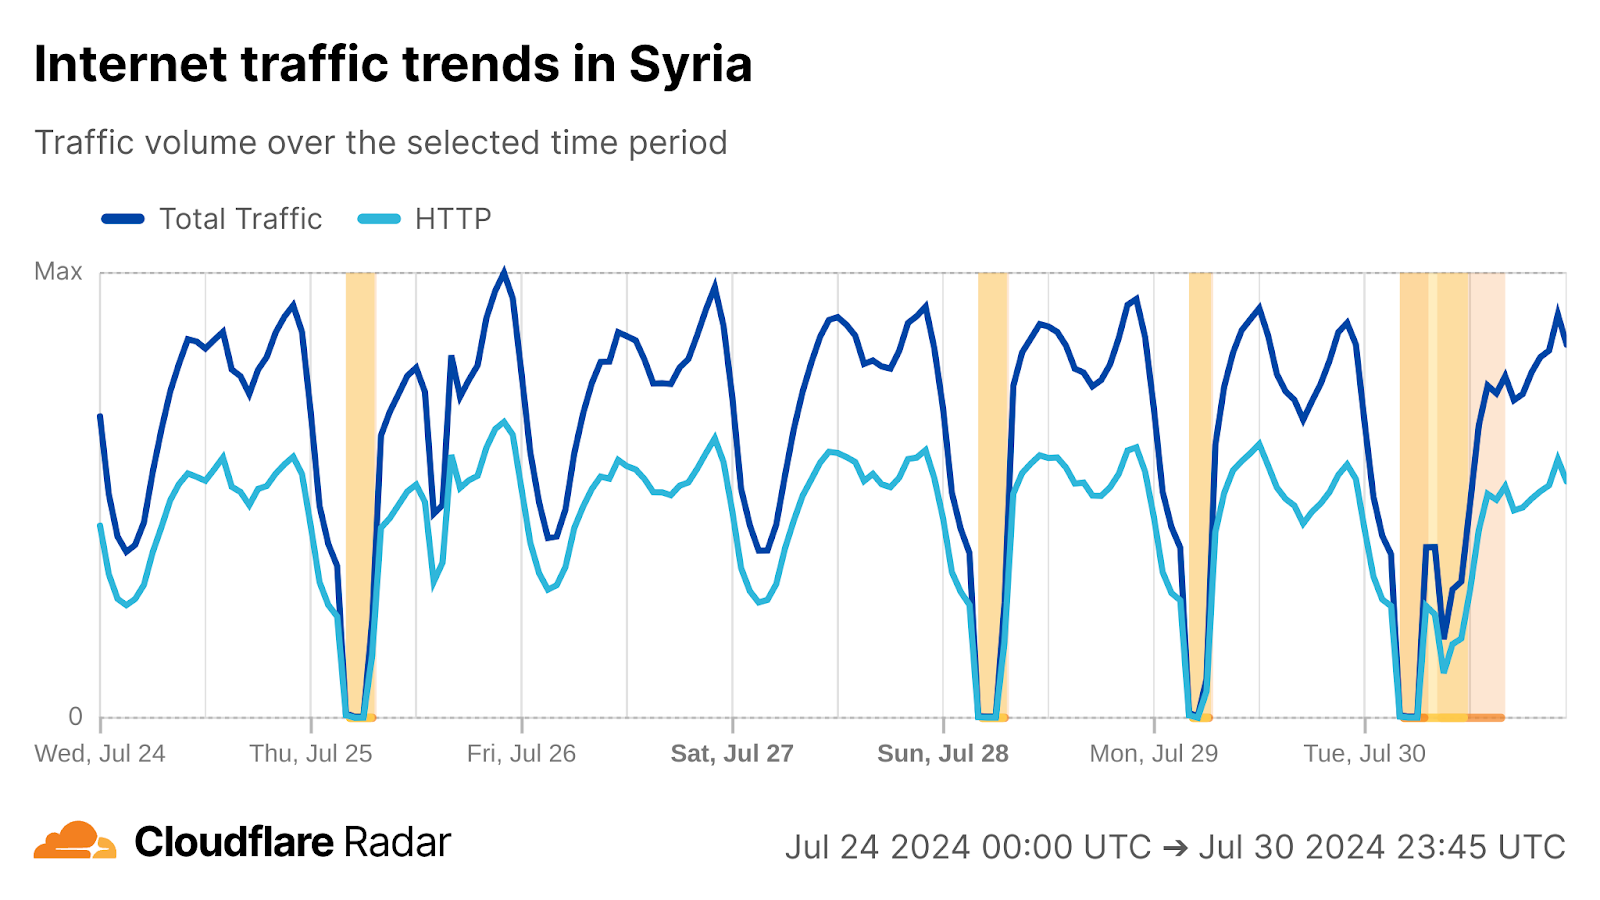
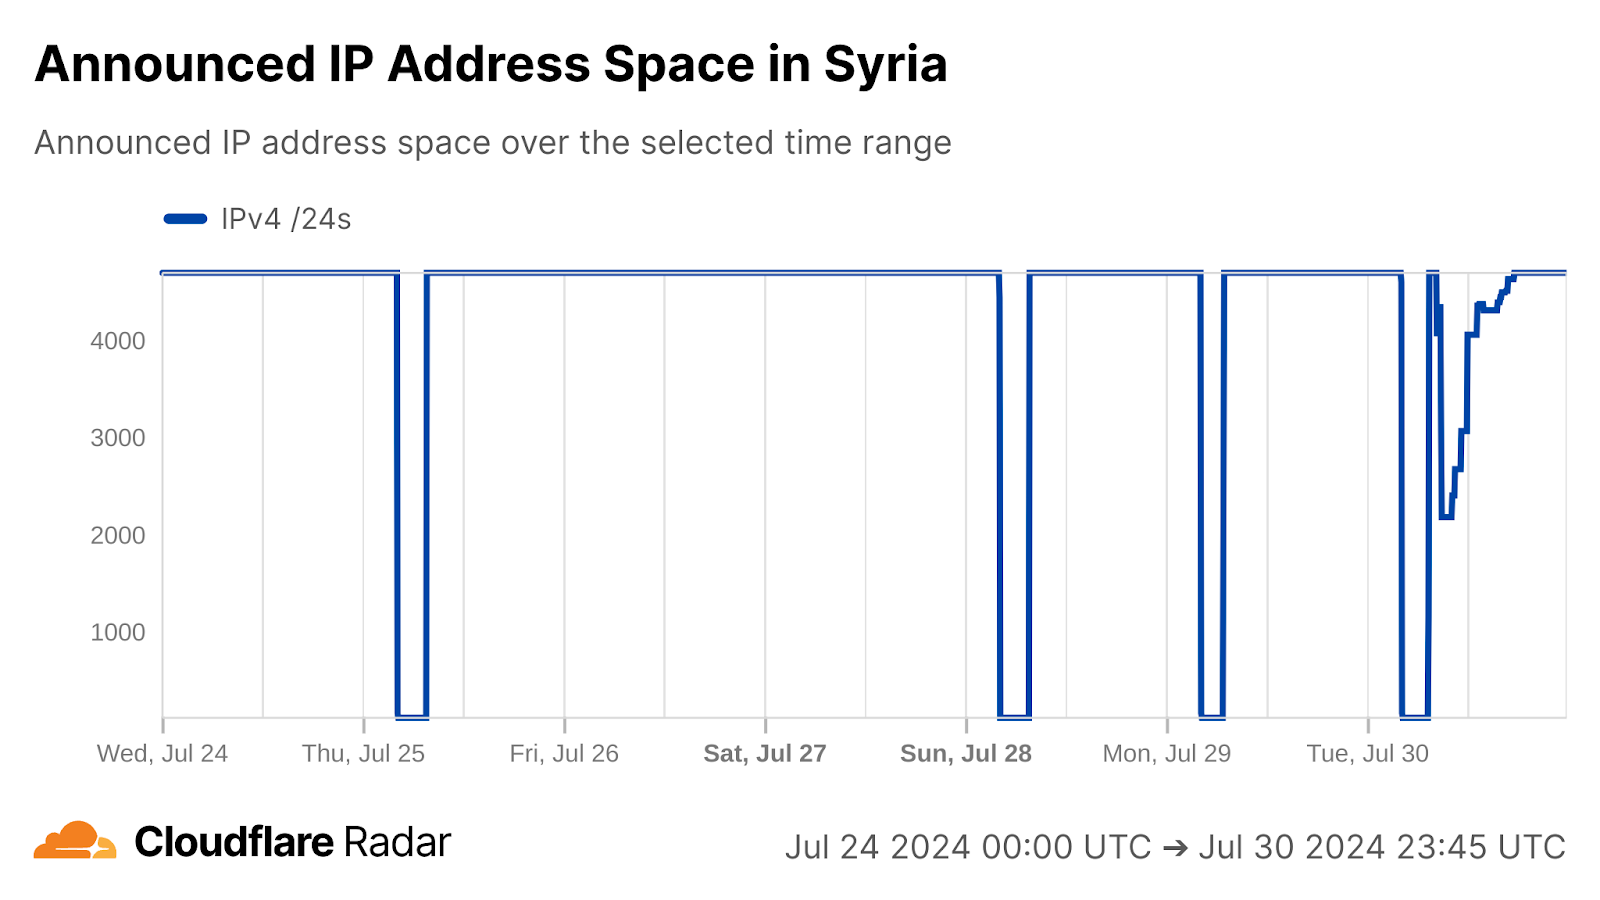
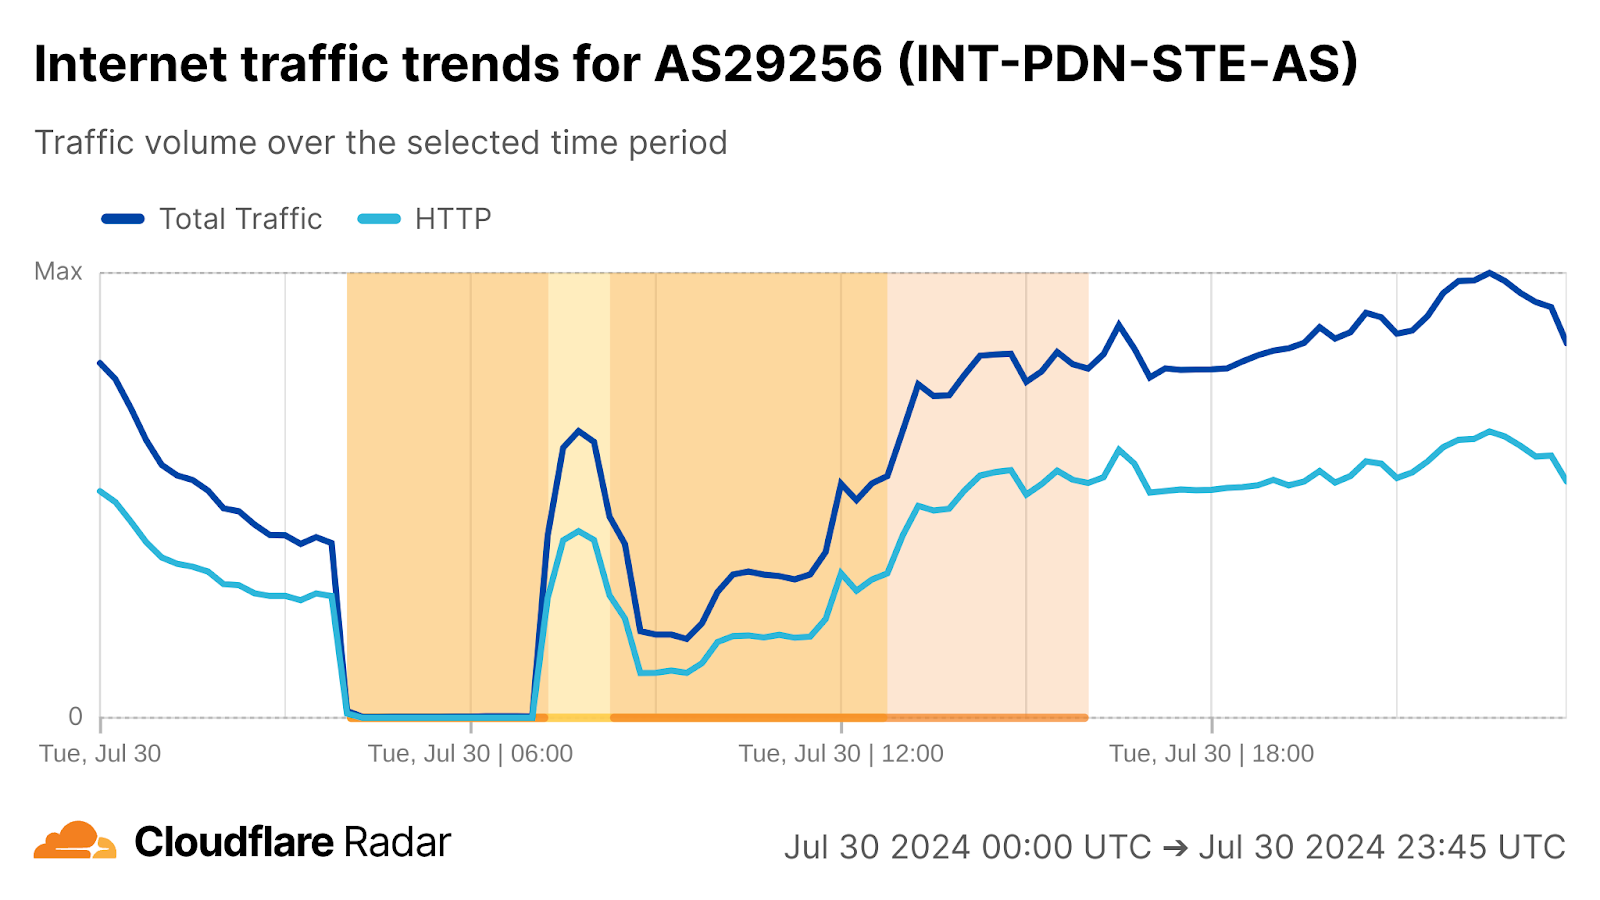
Cloudflare’s network spans more than 330 cities in over 120 countries, where we interconnect with over 13,000 network providers in order to provide a broad range of services to millions of customers. The breadth of both our network and our customer base provides us with a unique perspective on Internet resilience, enabling us to observe the impact of Internet disruptions at both a local and national level, as well as at a network level.
As we have noted in the past, this post is intended as a summary overview of observed and confirmed disruptions, and is not an exhaustive or complete list of issues that have occurred during the quarter. A larger list of detected traffic anomalies is available in the Cloudflare Radar Outage Center.
In the third quarter we covered quite a few government-directed Internet shutdowns, including many intended to prevent cheating on exams. In the fourth quarter, however, we only observed a single government-directed shutdown, this one related to protests. Terrestrial cable cuts impacted connectivity in two African countries. As we have seen multiple times before, both unexpected power outages and rolling power outages following military action resulted in Internet disruptions. Violent storms and an earthquake predictably caused Internet outages in the affected countries. And unexpected issues with maintenance efforts caused outages at two European providers, while Verizon customers in several US states experienced a brief but unexplained outage.
Cable cuts
Rwanda
On October 1, local mobile provider MTN Rwanda (AS36890)published a post on X alerting subscribers of a double fiber cut in Tanzania and Uganda that may impact connection quality. As a result of these fiber cuts, Internet traffic began to drop sharply after 12:45 local time (10:45 UTC), with a full outage visible between 13:15 – 13:30 local time (11:15 – 11:30 UTC). Traffic then began to rapidly recover, recovering to expected levels around 19:00 local time (17:00 UTC). Several hours later, MTN Rwanda published a followup post confirming that all services had been restored.
On November 30, local mobile provider Airtel Niger (AS37531)posted a thread of messages on X apologizing for Internet service disruptions, explaining that (translated) “Indeed, due to a simultaneous interruption on the national optical fiber on the Niamey-Dosso, Niamey-Balleyara exits, our internet services are completely interrupted throughout the territory, beyond our control.” These simultaneous fiber cuts resulted in a near complete outage between 17:30 local time (16:30 UTC) on November 29 until 19:45 local time (18:45 UTC) on November 30.
It seems unusual that the message thread was not posted until after the outage was resolved. It is possible that Airtel Niger themselves had no backup connectivity, and could not post an update until connectivity was restored. Alternately, given that the first post of the thread starts with “[COMMUNIQUÉ IMPORTANT📢]” (“[IMPORTANT PRESS RELEASE 📢 ]”), it is possible that the alert and apology was communicated through more official channels, such as Airtel’s website, in a timely manner, with the thread on X simply a follow-up once Internet services were again available.
Power outages
Cuba
Instability in a country’s electrical infrastructure often causes widespread power outages, which, in turn, disrupt Internet connectivity. This happened on October 18 in Cuba, where a post on X from the Ministry of Energy and Mines of Cuba noted (translated) “Following the unexpected departure of the Antonio Guiteras CTE, the National Electricity System was completely disconnected at 11 a.m. today. The Unión Eléctrica is working on its restoration.” The power outage caused Internet traffic within the country to drop by more than half within minutes (15:15 UTC). Connectivity was disrupted for approximately three-and-a-half days, as it returned to expected levels around 23:00 local time on October 21 (03:00 UTC on October 22).
The Ministry posted several status updates on October 19 and 20, covering the work being done to restore power across the country. A final X post on October 22 signaled the end of the power outage, proclaiming (translated) “At 02:44 pm the National Electric System was synchronized.”
Several weeks later, power issues again impacted Internet connectivity in Cuba. On November 6, the Electrical Union of Cuba (Uníon Eléctrica) posted on X that (translated) “14:48 hours. Strong winds caused by the intense Hurricane Rafael, cause the disconnection of the National Electric System. Contingency protocols are applied.” The timing of this post aligns with a sharp decline in traffic observed from Cuba, which fell sharply around 14:30 local time (19:30 UTC). Over the following days, after Hurricane Rafael passed the island, the Uníon Eléctrica posted numerous updates on the restoration of electrical service. Internet traffic appeared to return to expected levels around 13:00 local time (18:00 UTC) on November 9, although full restoration of electrical services took several days longer.
On December 4, Cuba suffered its third nationwide power outage in as many months. Early that morning, the Ministry of Energy and Mines posted on X that (translated) “At 2:08 this morning, the Electrical System, SEN, was disconnected when the Antonio Guiteras thermoelectric plant went out due to the automatic tripping.” The loss of this electrical power due to the failure of this generation plant caused a significant drop in Internet traffic from Cuba, falling approximately 60% as compared to the previous week at just before 02:15 local time (07:15 UTC). Traffic recovered to expected levels almost a day later at around 00:30 local time (05:30 UTC). This timing aligns with a follow-on X post from the Ministry that announced that all units had been synchronized, signaling a restoration of electrical service.
Guadeloupe
An article published in The Guardian on October 25 noted that “The French Caribbean island of Guadeloupe has been left entirely without power after striking workers seized control of the territory’s power station.” Workers entered the power station’s command room “and caused an emergency shutdown of all the engines”, according to the article. The power outage caused by this “emergency shutdown” resulted in traffic dropping nearly 70% as compared to the previous week at 08:30 local time (12:30 UTC). Although “restored electricity supply for the 230,000 affected households was expected at 3 pm local time (19:00 UTC) at best”, it appears that recovery took significantly longer than expected, as Internet traffic did not return to expected levels until around 22:00 local time on October 26 (02:00 UTC on October 27) . A press release from the government at 11:00 local time (15:00 UTC) on October 26 gave an update on the recovery efforts, noting (translated) “160,000 users have had their electricity restored. The restoration of service for the 70,000 customers still cut off is continuing, with a return to normal expected over the weekend.” It also noted that “76% of Orange subscribers have been able to regain their network connection. 1,800 homes are still without internet.”
Kenya
Power outages in Kenya resulted in multiple Internet disruptions during both the second and third quarters of 2024. A similar event occurred during the fourth quarter as well. An X post from Kenya Power contained a “Customer Alert” issued at 01:28 local time on December 18 (22:28 UTC on December 17) that informed customers that “We are experiencing a widespread power outage affecting most of the country, except parts of Western and North Rift regions.” This outage caused Internet traffic from the country to drop by over 70% starting just after midnight local time on December 18 (21:00 UTC on December 17). On December 18 at 07:35 local time (04:35 UTC), an update from Kenya Power posted to X reported that power had been restored to all affected areas. Internet traffic from the country had recovered to near expected levels by that time as well.
Natural disasters
United States, Florida
At 20:30 local time on October 9 (00:30 UTC on October 10), Hurricane Milton made landfall in Florida as a Category 3 storm. Damage from Milton was extensive, including flooding, downed trees and power lines, and damage to homes and businesses. The power outages and other infrastructure damage caused by the storm, coupled with evacuation from impacted areas, resulted in a notable Internet disruption at a state level. As seen in the graph below, peak traffic levels on October 10, after Milton’s arrival, were approximately 40% lower than the preceding days. As recovery and restoration efforts began over the following days, and as evacuees returned to home, school, and work, the state’s Internet traffic began to gradually increase.
This gradual recovery is also visible in the series of maps below, which illustrate cities where Internet traffic was over 50% lower than the same time the prior week, with snapshots taken at 09:00 local time (13:00 UTC) on October 10, 11, and 14. On October 10, over 70 cities had significantly lower traffic, while on October 14, it was just over 10 cities.
Mayotte
On December 14, Cyclone Chido caused significant destruction on the French territory of Mayotte in the Indian Ocean. Power, water, and communications infrastructure were all damaged, as well as homes and public facilities. Over three dozen people were killed, with thousands more injured. With such widespread devastation, Internet traffic from the country was also impacted, as would be expected. Chido made landfall in Mayotte early in the morning on December 14, and traffic dropped sharply around 09:00 local time (06:00 UTC), causing a near-complete Internet outage. After extremely slow growth over the following week, a diurnal pattern is once again visible, with peak traffic levels continuing to gradually increase through the end of the month. As of the third week of January 2025, Mayotte’s Internet traffic continues to slowly increase, but remains well below pre-Chido levels.
Vanuatu
A magnitude 7.3 earthquake struck 24 km WNW of Port-Vila, Vanuatu at 17:46 local time (01:47 UTC) on December 17. Internet traffic from the country dropped sharply almost immediately, falling nearly 90% compared to the previous week. A significant drop in announced IPv4 address space was also observed, suggesting that damage from the earthquake took core network provider infrastructure offline as well. Recovery was slow, with Internet traffic not returning to expected levels until around 23:00 local time (12:00 UTC) on December 26.
An editorial published on The Maritime Executive website highlights that Vanuatu is currently reliant on the Interchange Cable Network 1 (ICN1) submarine cable connection to Fiji for international Internet connectivity. The editorial states that “A fire at the cable landing station temporarily interrupted the power supply, disabling internet traffic. The connection was restored 10 days later…” The resolution of the power outage at the cable landing station roughly aligns with traffic returning to expected levels, suggesting that this was a significant driver of the drop in traffic seen from Vanuatu after the earthquake. Starlink’s satellite Internet service provides some nominal redundancy, as the company announced service availability on October 7. The TAMTAM submarine cable, connecting Vanuatu to New Caledonia, is expected to be ready for service in 2026 — once available, it will provide additional redundancy for Internet connectivity.
Government directed
Mozambique
On October 25 in Mozambique, mobile Internet connectivity across multiple providers was shut down after protests against the re-election of the ruling Frelimo party became violent. Starting around 13:00 local time (11:00 UTC), significant drops in traffic were observed across AS30619 (Telecomiuncacoes de Mocambique), AS37342 (Movitel), and AS37223 (Vodacom). Both Vodacom and Movitel experienced near complete outages almost immediately, while some traffic remained on Telecomiuncacoes de Mocambique until just before 02:00 local time (00:00 UTC) on October 26. Connectivity was restored the morning of October 26, as traffic returned around 08:00 local time (06:00 UTC). However, after connectivity returned, some social media platforms and messaging applications remained unavailable.
Just over a week later, on November 3, subscribers on these mobile networks experienced another Internet shutdown. At around 20:30 local time (18:30 UTC) traffic dropped significantly on each of these networks, with connectivity disrupted for nearly 12 hours before recovering around 08:00 (06:00 UTC) the morning of November 4. Similar shutdowns (“Internet curfews”) were observed November 4-5 and November 6-7 on all three networks, and November 7-8 on Movitel and Vodacom. According to a published report, the country’s Minister of Transport and Communications “admitted that Internet access was restricted in order ‘to avoid the destruction of the country’”, but shifted blame to the impacted services providers, claiming that when they note misuse of their services, they can take the initiative of interrupting the services, as part of their “civil responsibility” to safeguard “the stability and welfare of the population”.
Military action
Syria
An Internet disruption observed in Syria on November 9 may have been caused by damage from an Israeli airstrike near Aleppo and Idlib reported to have taken place earlier that morning. Internet traffic from the country dropped by about 80% at around 04:00 local time (01:00 UTC), with announced IP address space from the country falling significantly at that time as well. The disruption lasted approximately four hours, with traffic and announced IP address space returning to expected levels around 08:00 local time (05:00 UTC).
Internal analysis of city-level Internet traffic shows a similar disruption in Aleppo, suggesting that it may have been caused by the airstrike.
Ukraine
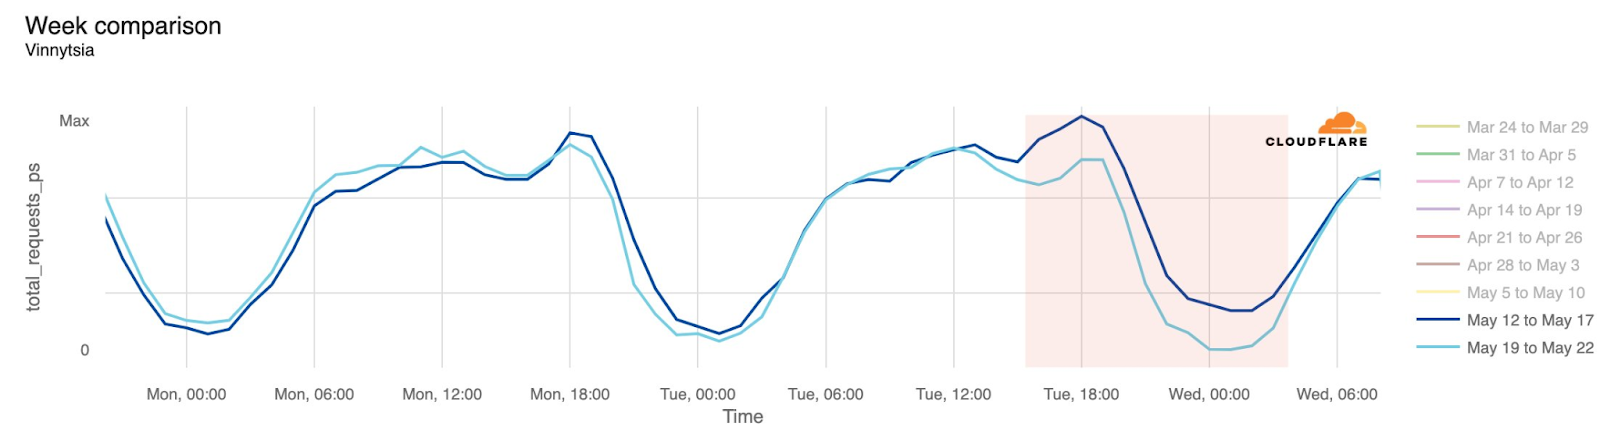
Russian missile strikes on November 17 targeting electrical power infrastructure in Ukraine resulted in rolling power outages in multiple regions across the country. As we have seen multiple times throughout the nearly three-year-old conflict, these power outages result in disruptions to Internet traffic, impacting both service provider infrastructure and subscriber connectivity.
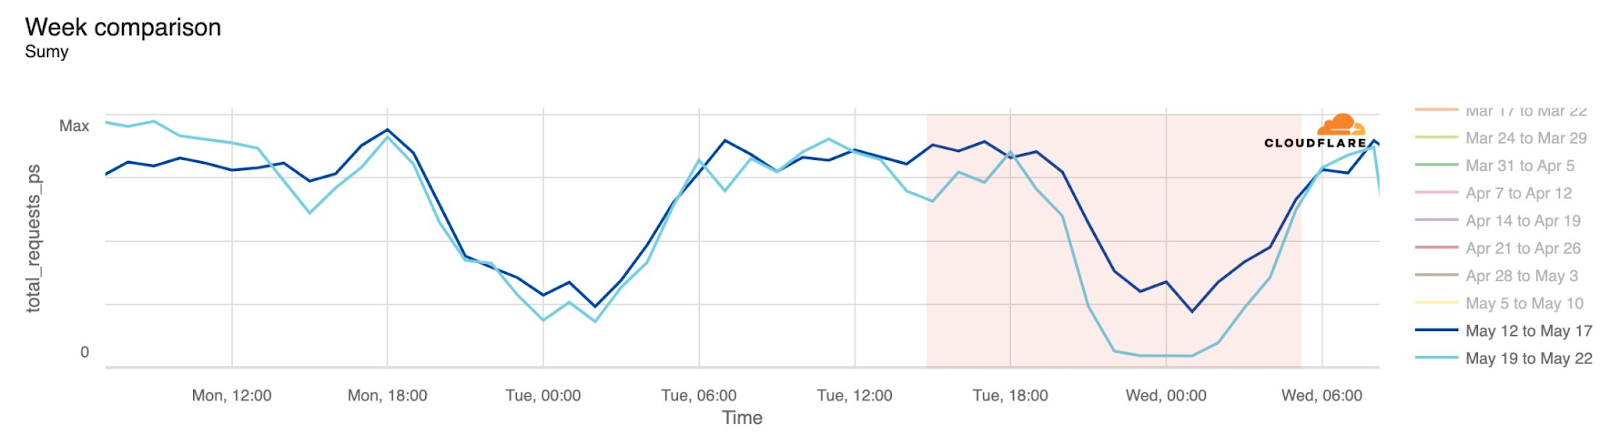
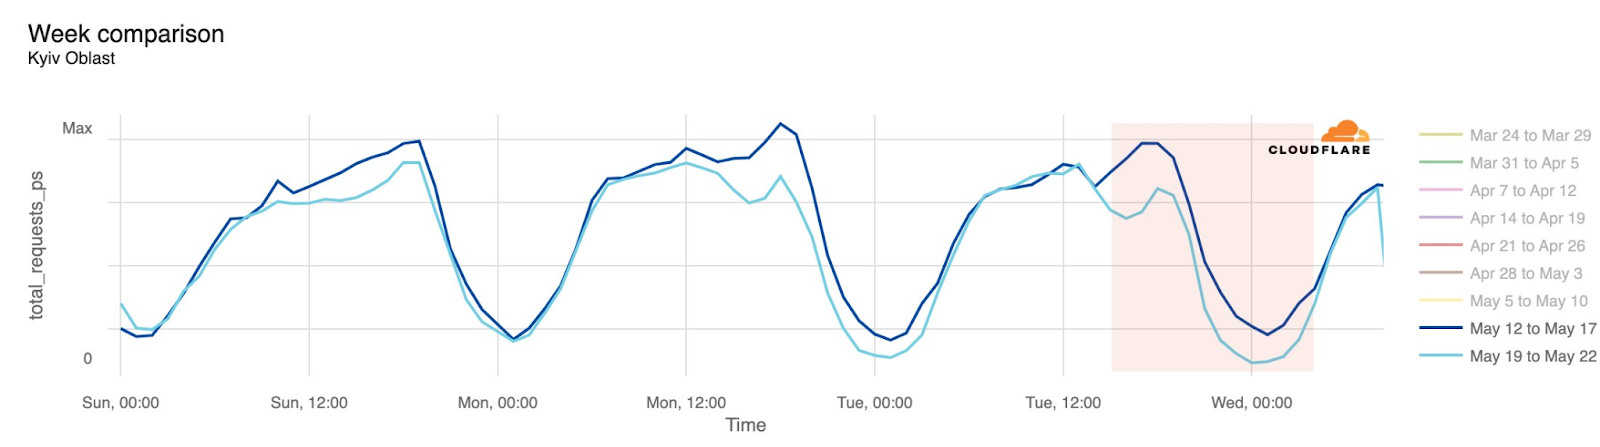
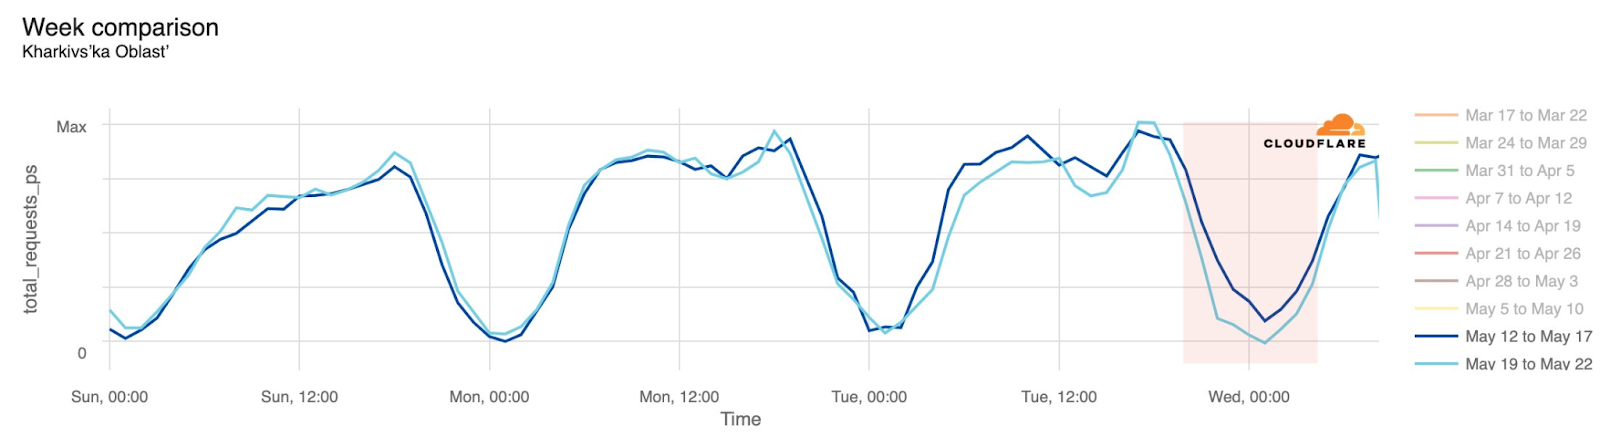
During the period between 07:30 local time (05:30 UTC) on November 17 and 02:00 local time (00:00 UTC) on November 23, we observed lower Internet traffic as compared to the previous week in Odessa, Zaporizhzhia, Mykolaiv, and Sumy. Traffic in Odessa initially dropped on November 17 by around 50% as compared to the prior week, while on November 18, traffic dropped by over 20% in the other regions. Traffic largely recovered in Odessa by November 21, while the other regions took several additional days.
Similar attacks took place just a few days later, with additional Russian airstrikes again targeting electrical infrastructure in Ukraine. Once again, Ukrainian officials implemented emergency power outages, which impacted Internet traffic in multiple areas across the country. Starting around 07:00 local time (05:00 UTC) on November 28, we observed traffic drop by as much as 65% as compared to the previous week in Kherson Oblast, Mykolaiv, Ternopil Oblast, Rivna, and Lviv. Traffic remained lower over the next several days, but appears to have generally recovered by December 1.
Maintenance
Switzerland, Salt Mobile
According to the image below, which replaced the homepage of Swiss provider Salt Mobile (AS15796), reported maintenance took the network completely offline early in the morning of December 3.
The outage lasted nearly three hours, with observed traffic at or near zero, between 01:25 and 04:20 local time (00:25 – 03:20 UTC).
Greenland, Tusass A/S
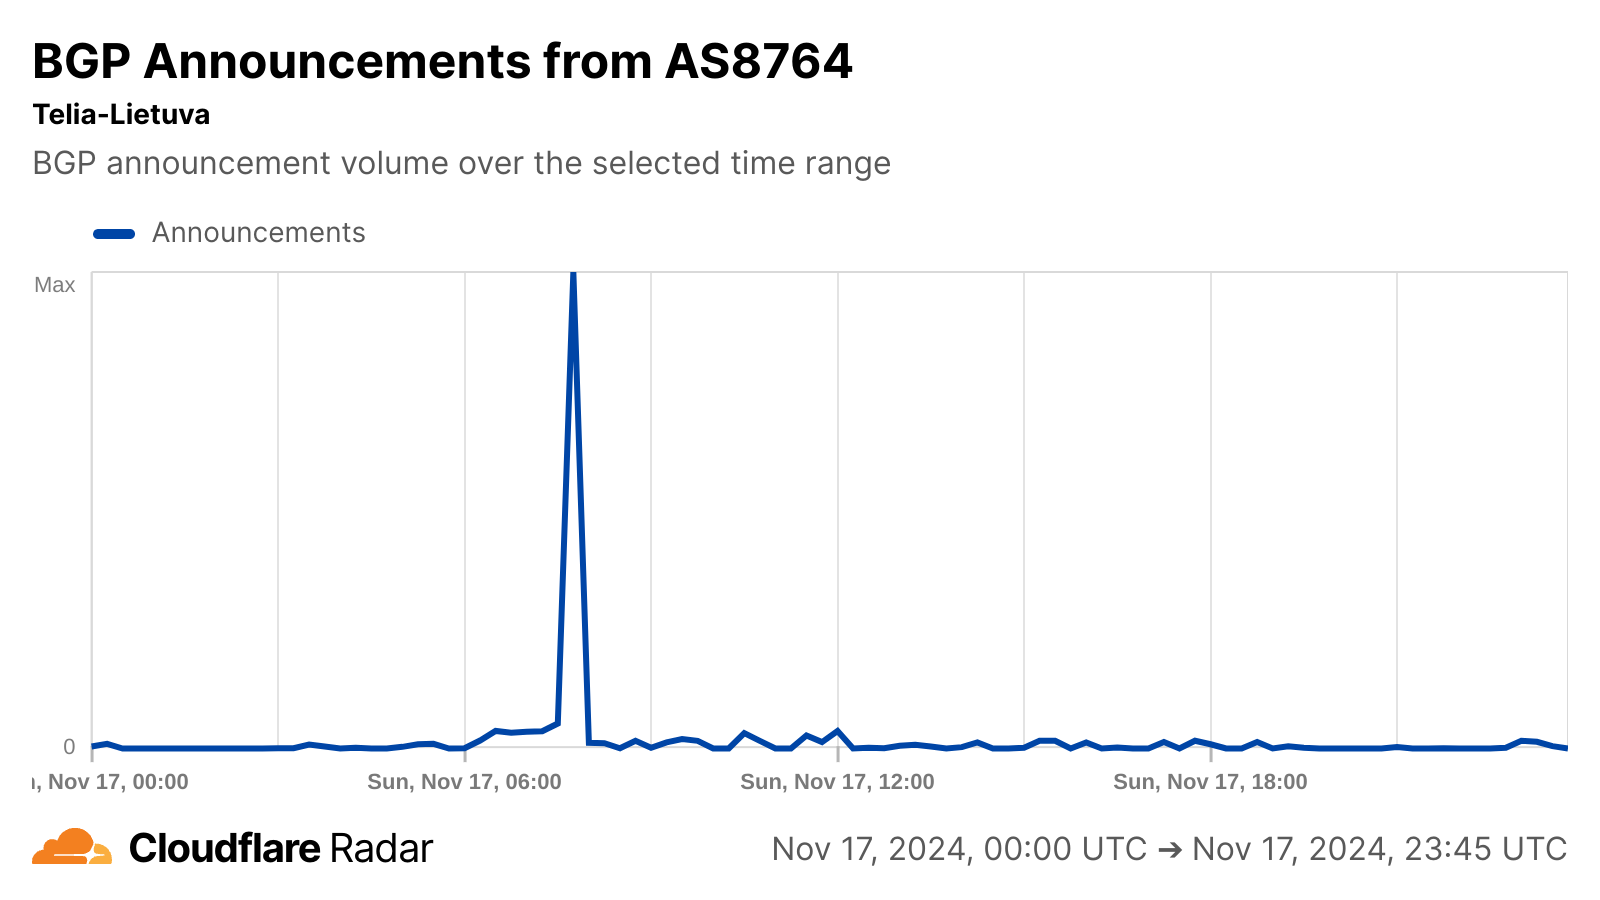
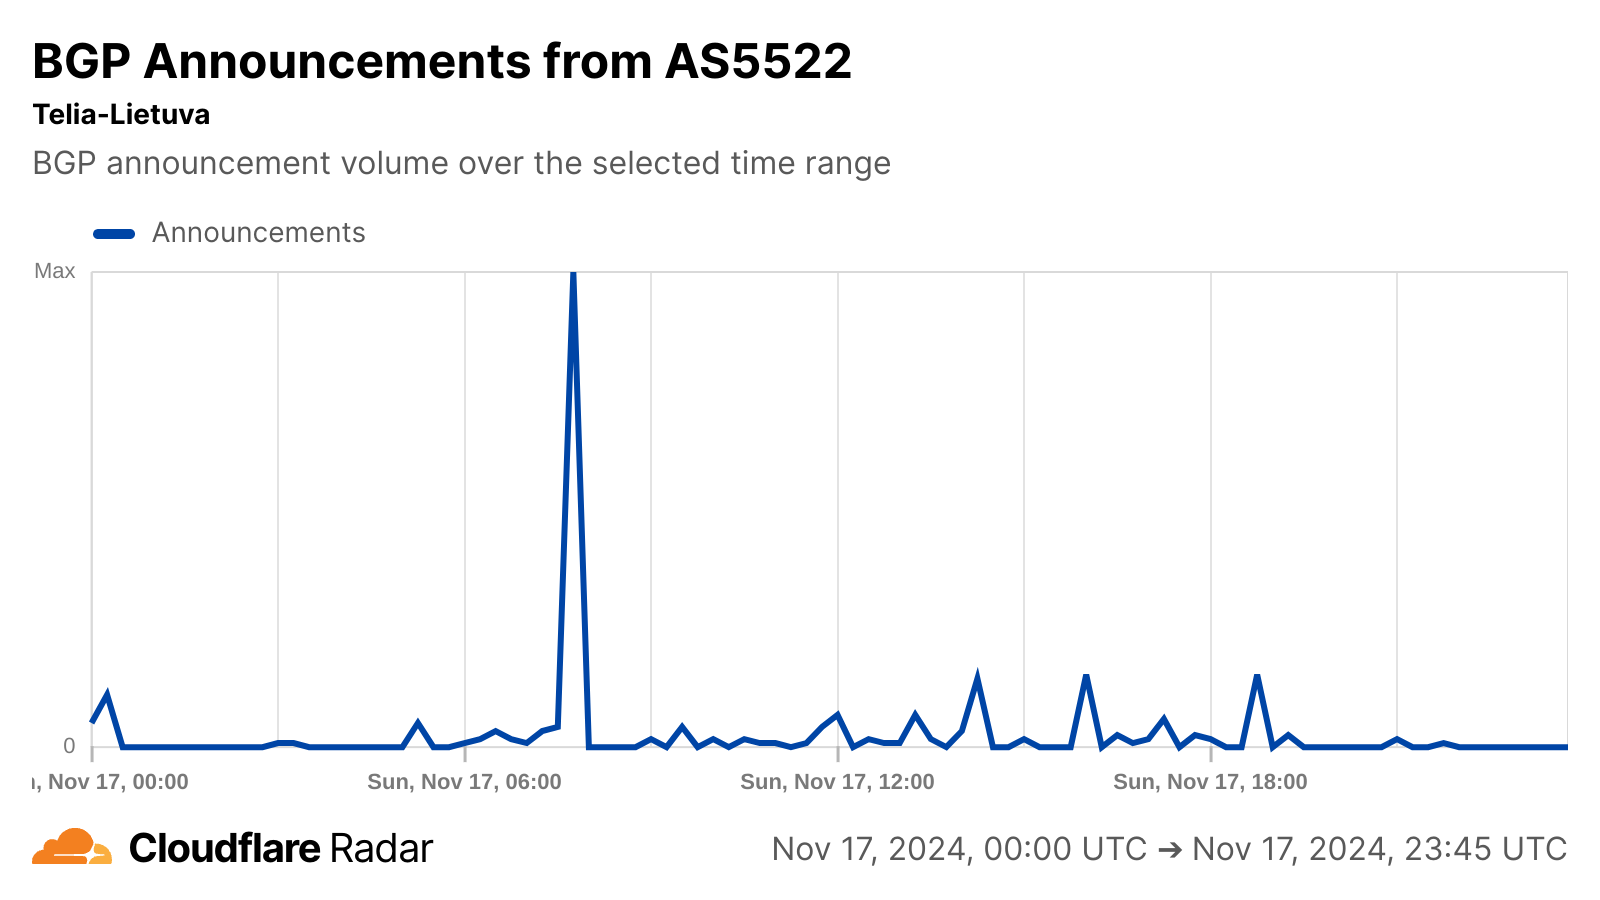
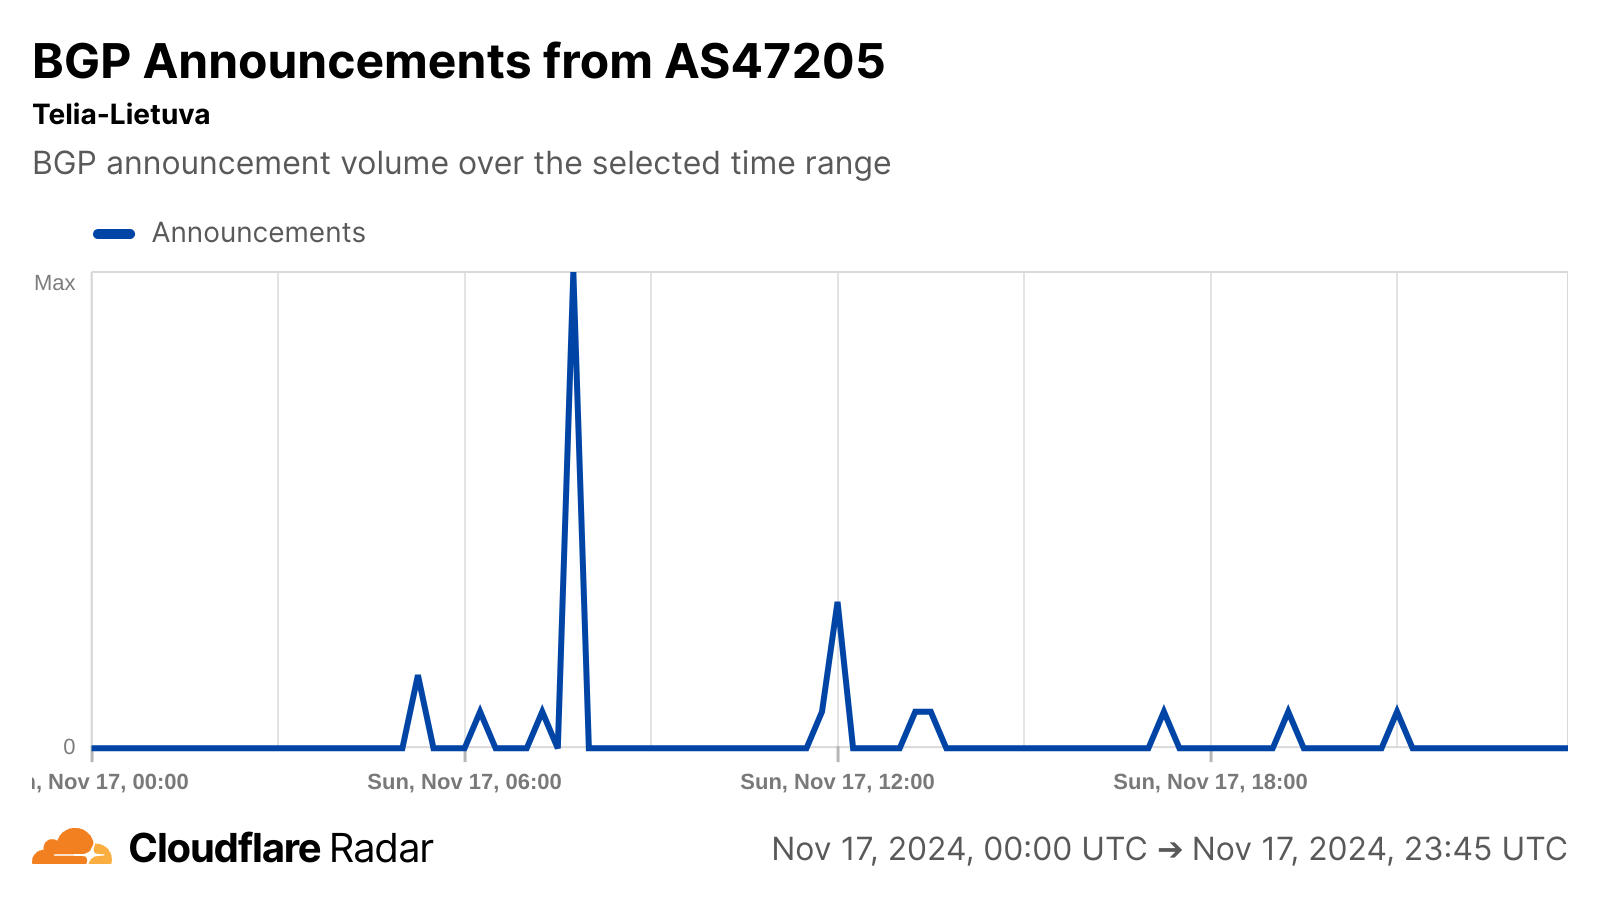
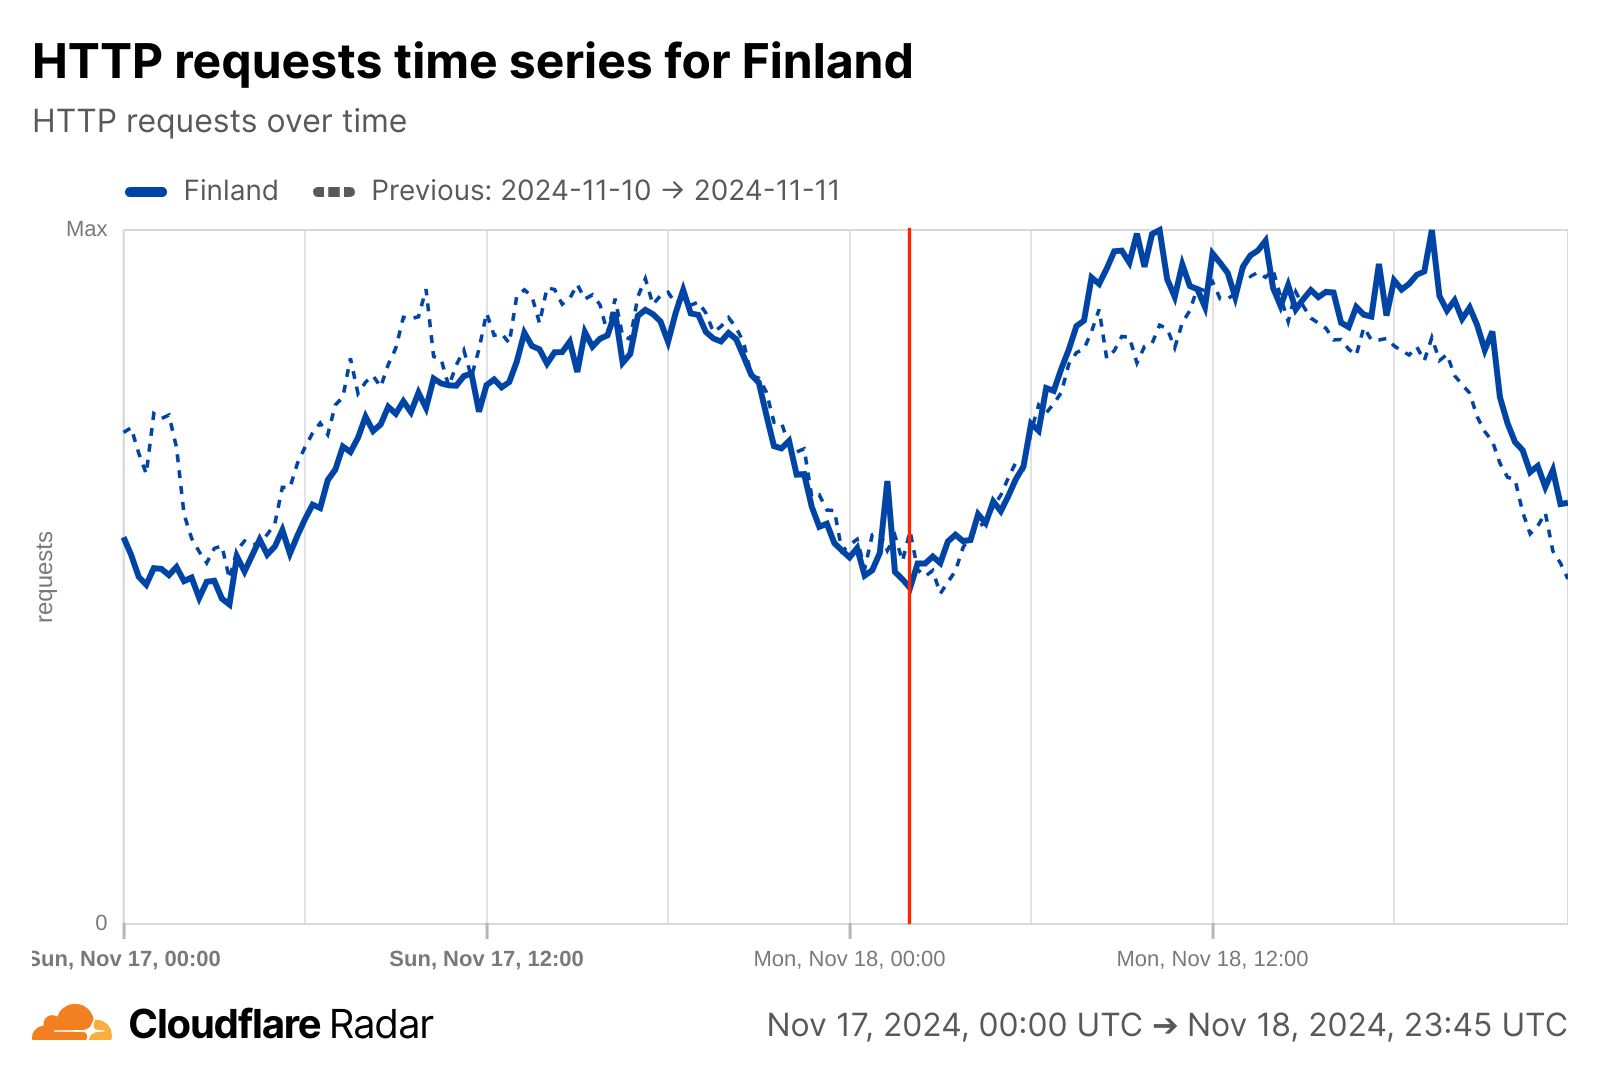
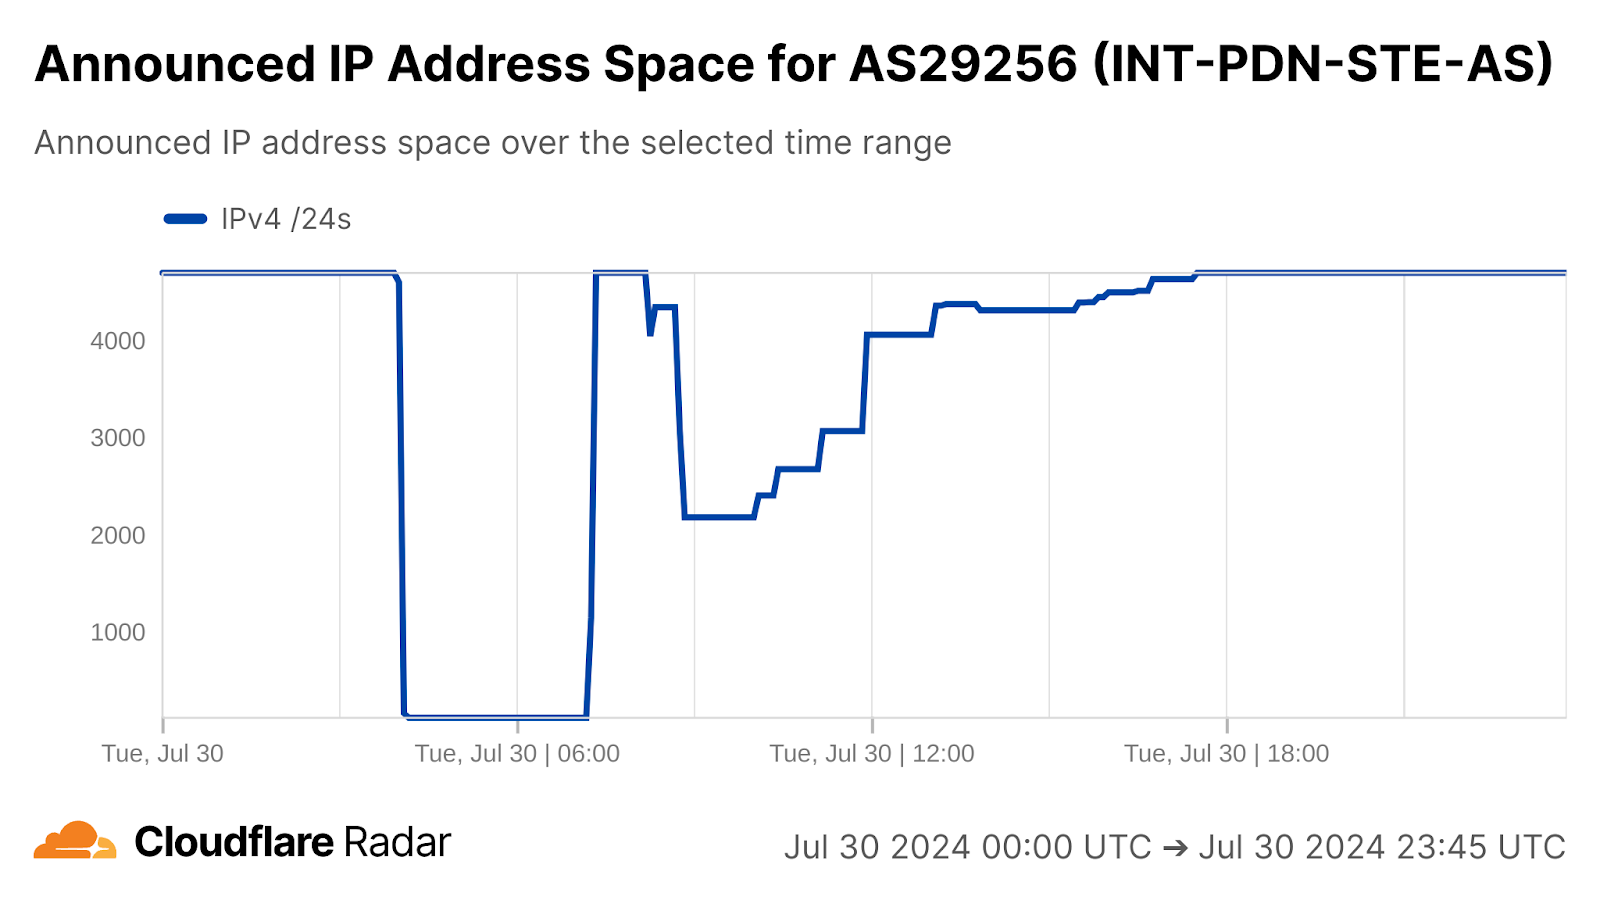
A December 10 update from Tusass A/S(AS8818, formerly TeleGreenland) explained why the provider experienced a complete Internet outage between 02:30 and 05:15 local time (04:30 – 07:15 UTC) that morning. The post noted “This happened because preventive maintenance was to be done on the connections in Canada between 02:00 and 06:00 last night, but with a combined fault on our connection to Denmark we lost nationwide connectivity. Fortunately, the fault on the connection to Denmark occurred on land, and therefore easy to repair.” The graphs below show that for the duration of the outage, traffic from the network dropped to zero, no IPv6 address space was announced, and the volume of announced IPv4 address space fell by 94%.
According to Telegeography’s Submarine Cable Map, the Greenland Connect cable system connects Greenland to Newfoundland, Canada. It is possible that the fault on the connection to Denmark may have occurred on the Greenland-to-Iceland segment of the Greenland Connect cable system; the Iceland-to-Denmark connection is made over the DANICE submarine cable.
Unknown
United States, Verizon
Very early in the morning of November 12, some subscribers of Verizon’s Fios Internet service experienced a disruption to their Internet connectivity. A post to the Outages mailing list noted that a major multi-state Verizon Fios outage began at 12:28am EST, impacting Virginia, Washington DC, Maryland, and New Jersey, as well as parts of eastern Pennsylvania. Traffic from AS701, the autonomous system used by Verizon for their Fios service, dropped by approximately 30% around 00:30 Eastern time (05:30 UTC). At a state level, traffic from AS701 dropped between 50-70% in Pennsylvania, Delaware, Maryland, and Washington DC.
A subsequent post on the Outages mailing list stated that the outage was resolved everywhere at 3:23am EST (08:23 UTC). Nearly six hours after the outage ended, Verizon Support published a post on X acknowledging the issue, stating “A network issue early this morning disrupted service for some Verizon Fios customers in the Northeast for a short period of time. As soon as the issue was identified, our engineering teams quickly restored the service.” However, they did not provide any information on what ultimately caused the service disruption.
Conclusion
In addition to the outages and disruptions covered above, resilient Internet connectivity meant that two Baltic Sea cable cuts that occurred on November 17 and 18 had minimal impact. Whether accidental or sabotage, the security and resiliency of submarine cable infrastructure continues to be an important topic. The security and resilience of terrestrial cable infrastructure, as well as other critical Internet infrastructure, must also remain top of mind to help speed recovery from storms, earthquakes, military action, and power outages.
The United States ban on TikTok went into effect on January 19, 2025, and although service began to be restored after just 14 hours, it was only close to the inauguration of Donald Trump as the 47th President of the United States that associated DNS traffic started to recover to closer to previous levels. In this post, we analyze the events of January 19 and 20, and what they meant for TikTok-related DNS traffic, but also other competitors (including their growth outside the US).
For context, we wrote an initial blog post about the TikTok ban on Sunday, January 19, 2025. The ban was part of the “Protecting Americans from Foreign Adversary Controlled Applications Act,” proposed in Congress, which ordered ByteDance to divest due to alleged security concerns. The bill was signed into law by Congress and President Biden in April 2024, and was upheld by the Supreme Court on January 17, 2025.
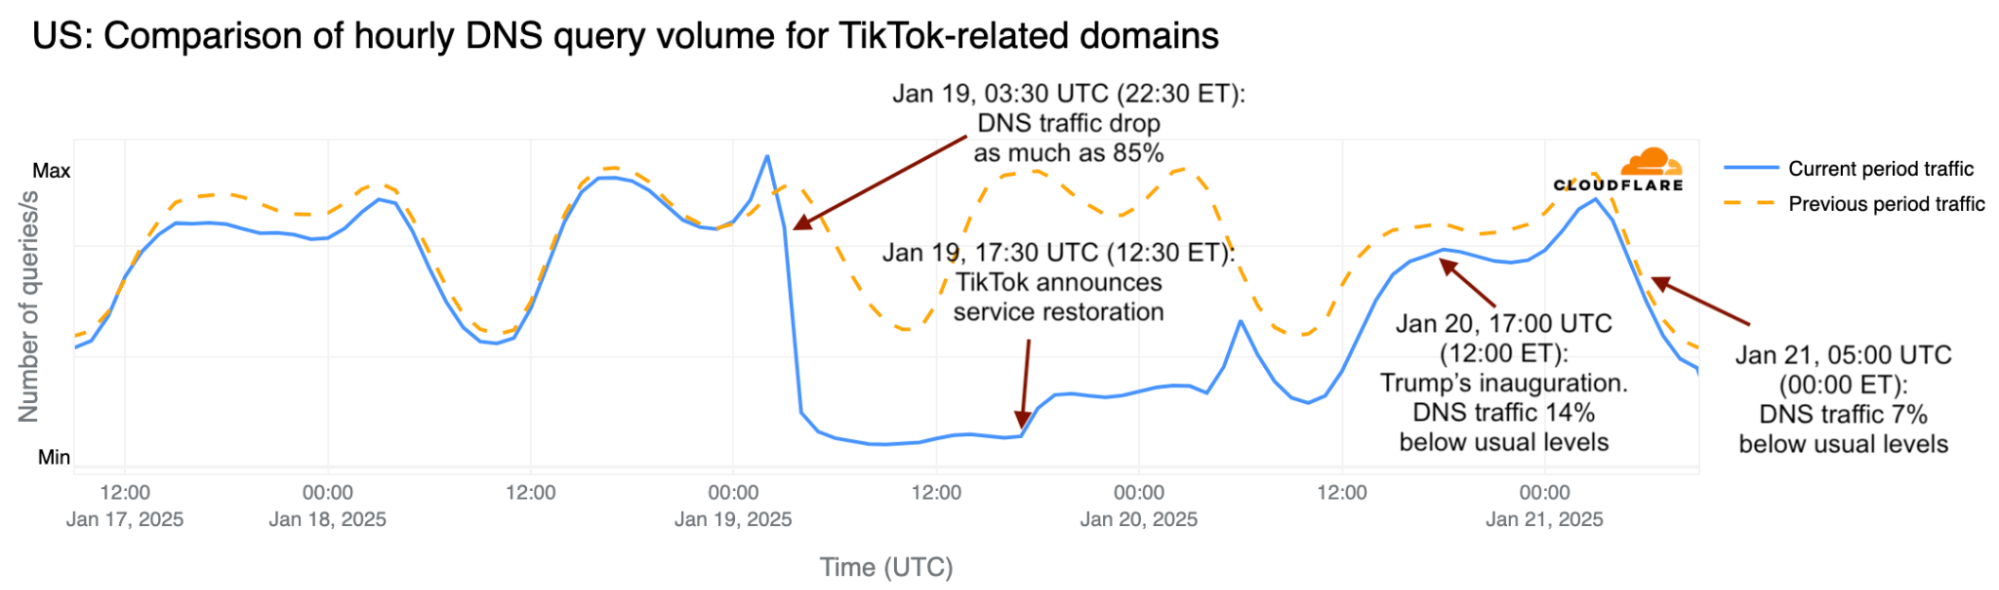
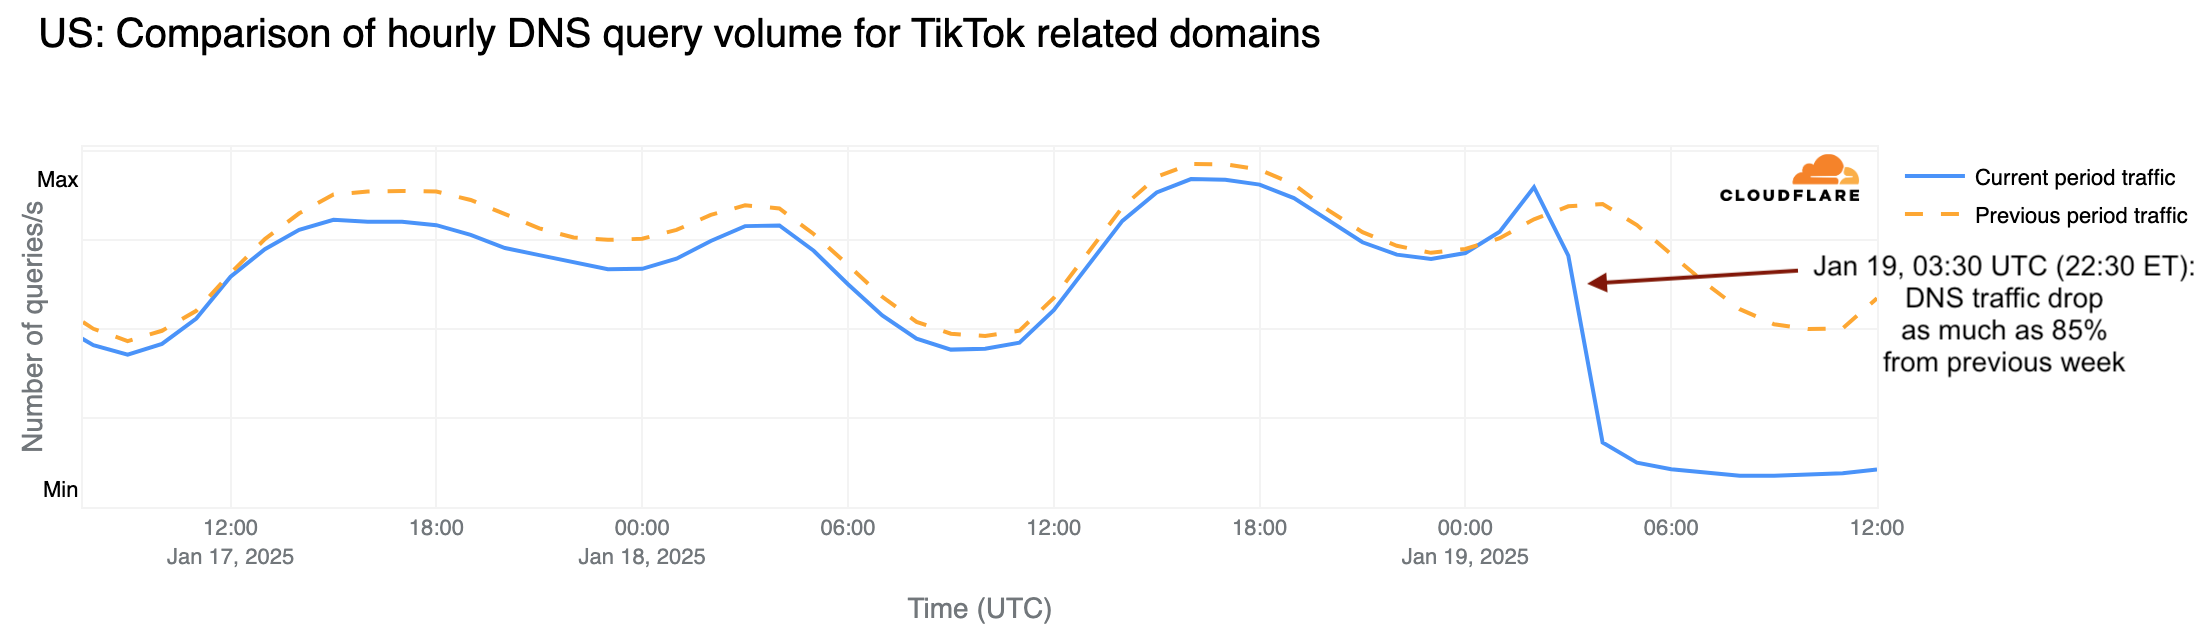
Aggregated data from our 1.1.1.1 DNS resolver shows — as we’ve posted on social media — that the TikTok shutdown in the US began to impact DNS traffic to TikTok-related domains on January 19, just after 03:30 UTC (22:30 ET on January 18). This includes DNS traffic not only for TikTok, but also for other ByteDance-owned platforms, such as the CapCut video editor. Here’s the timeline focused on DNS traffic for TikTok related domains (with the respective line chart), as we’ve observed it:
January 19, just after 03:30 UTC (22:30 ET on January 18): DNS traffic to TikTok-related domains dropped by as much as 85% compared to the previous week, and showed signs of further decline in the following hours.
January 19, 17:30 UTC (12:30 ET): After a 14-hour shutdown, TikTok announced it was starting service restoration following assurances from Donald Trump. DNS traffic began to recover slightly after 18:00 UTC but stayed near “shutdown” levels for several hours. Traffic from AS396986 (ByteDance) showed a similar trend.
January 20, 06:00 UTC (01:00 ET): A short-lived spike in DNS traffic for TikTok-related domains occurred, with traffic still 25% below the previous week.
January 20, 14:00–15:00 UTC (09:00–10:00 ET): DNS traffic picked up, moving from 27% to 18% below pre-shutdown levels.
January 20, 17:00 UTC (12:00 ET): During Donald Trump’s inauguration ceremony, DNS traffic increased to 12% below pre-shutdown levels, with a trend of continued growth, reaching 10% below previous levels at 18:00 UTC (13:00 ET).
January 21, 05:00 UTC (00:00 ET): DNS traffic was 7% below pre-shutdown levels.
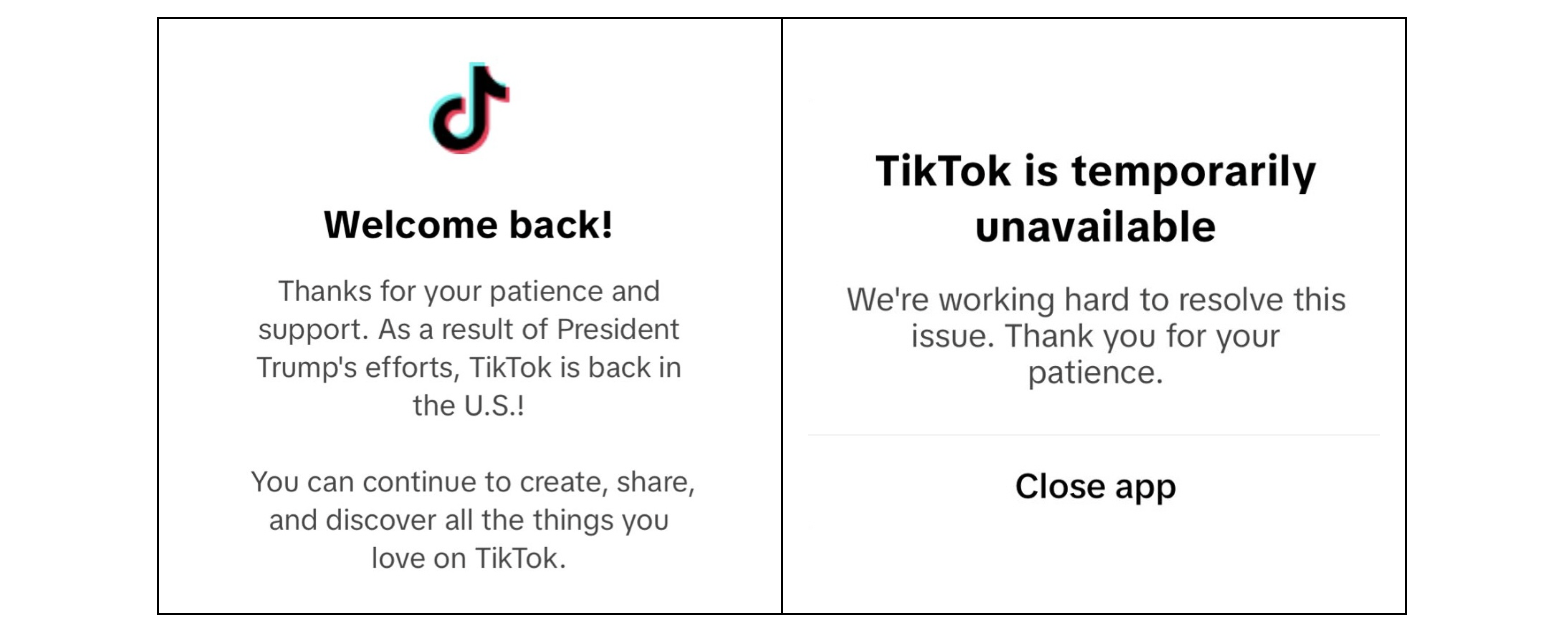
On January 19, around 17:30 UTC (12:30 ET), TikTok released a statement: “In agreement with our service providers, TikTok is in the process of restoring service. We thank President Trump for providing the necessary clarity and assurance to our service providers that they will face no penalties.” A message indicating the TikTok ban was over appeared for US users (image on the left). However, a few hours later, some users reported difficulties accessing the app (image on the right).
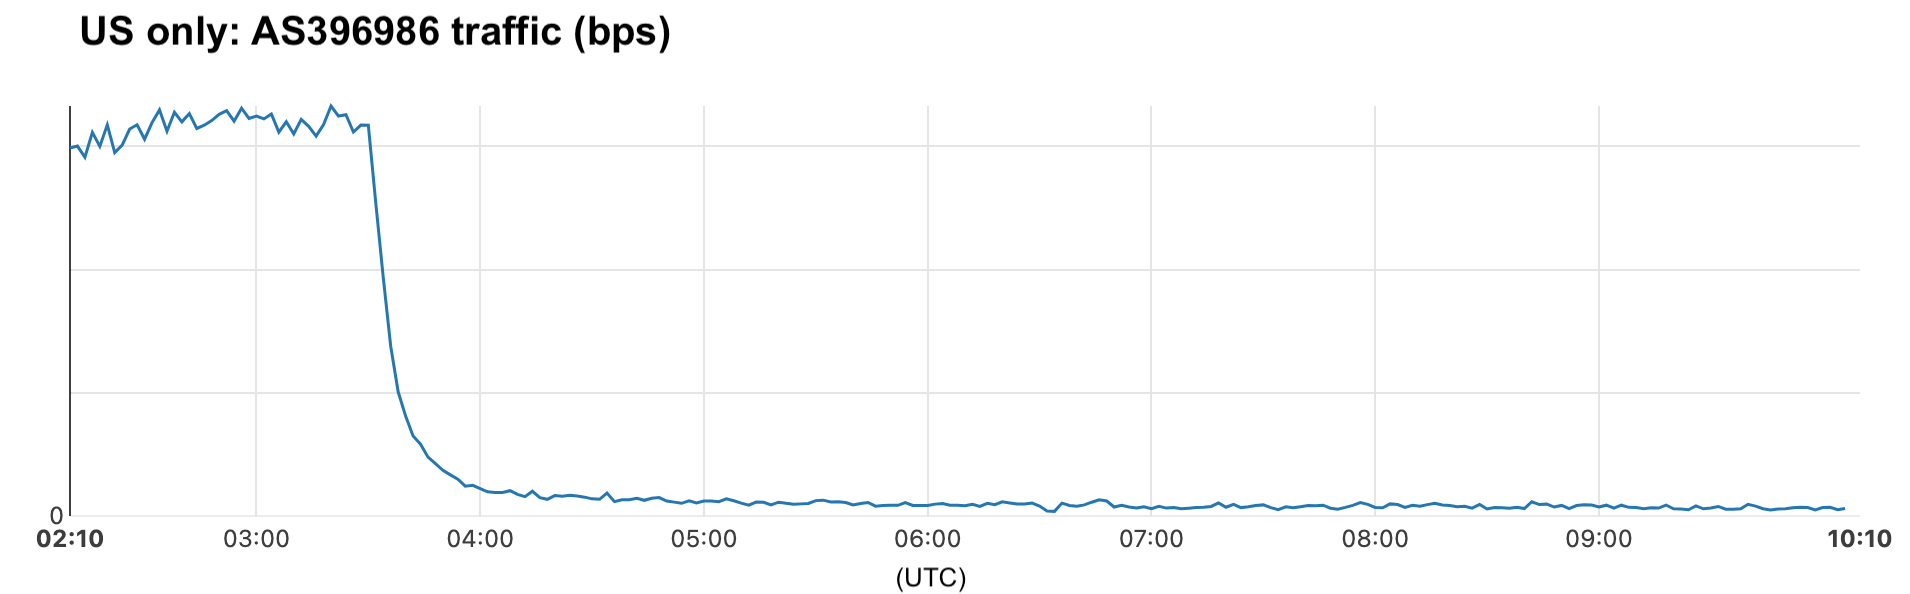
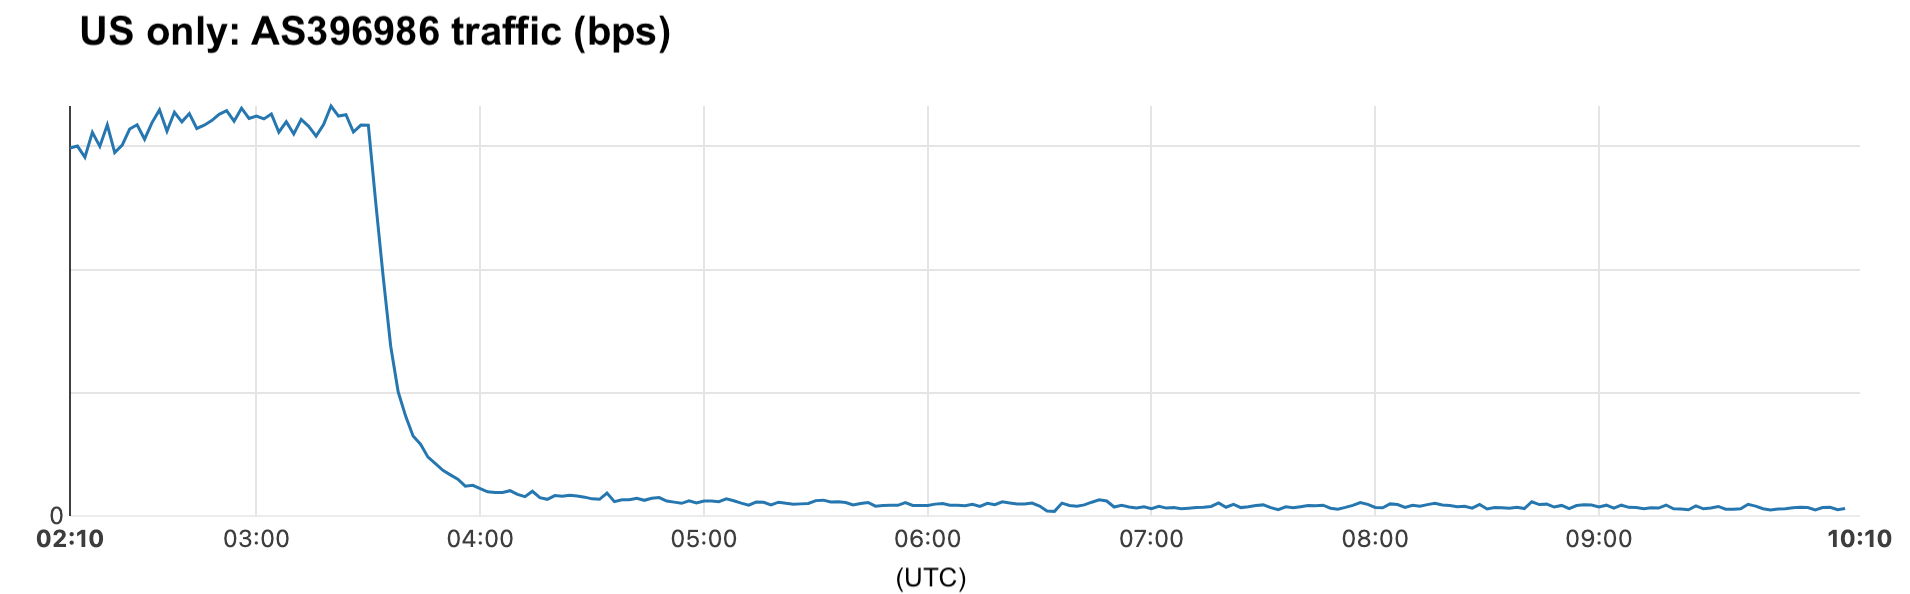
Analyzing data from autonomous system-level data, traffic from TikTok owner ByteDance’s network (AS396986) in the US to Cloudflare experienced a sharp decline, dropping by as much as 95% after 03:30 UTC on January 19 (22:30 ET on January 18).
Our data shows that traffic within ByteDance’s network (AS396986) never fully recovered, remaining around 80% below pre-shutdown levels. This suggests that ByteDance may have used other solutions after the shutdown.
Alternatives like RedNote (Xiaohongshu)
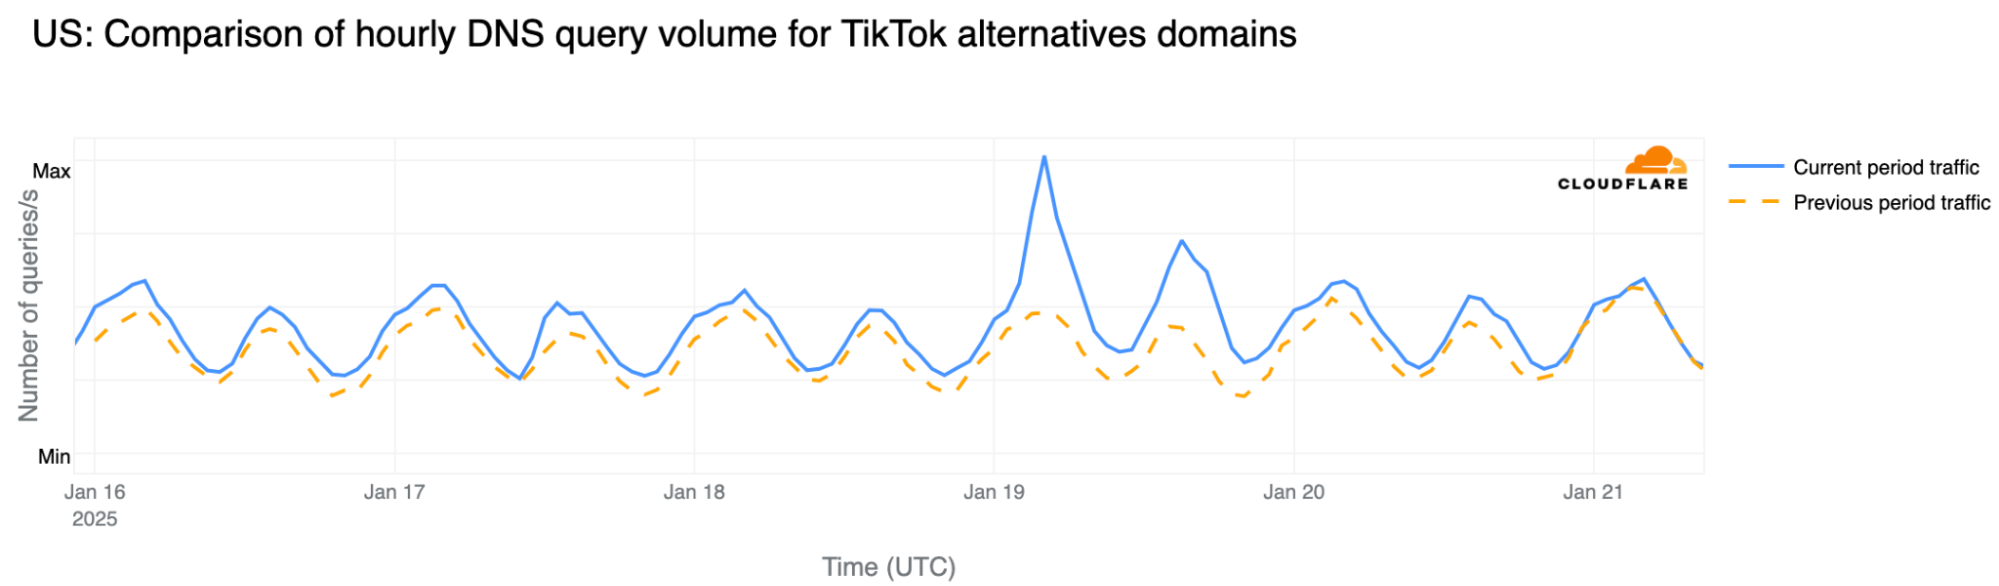
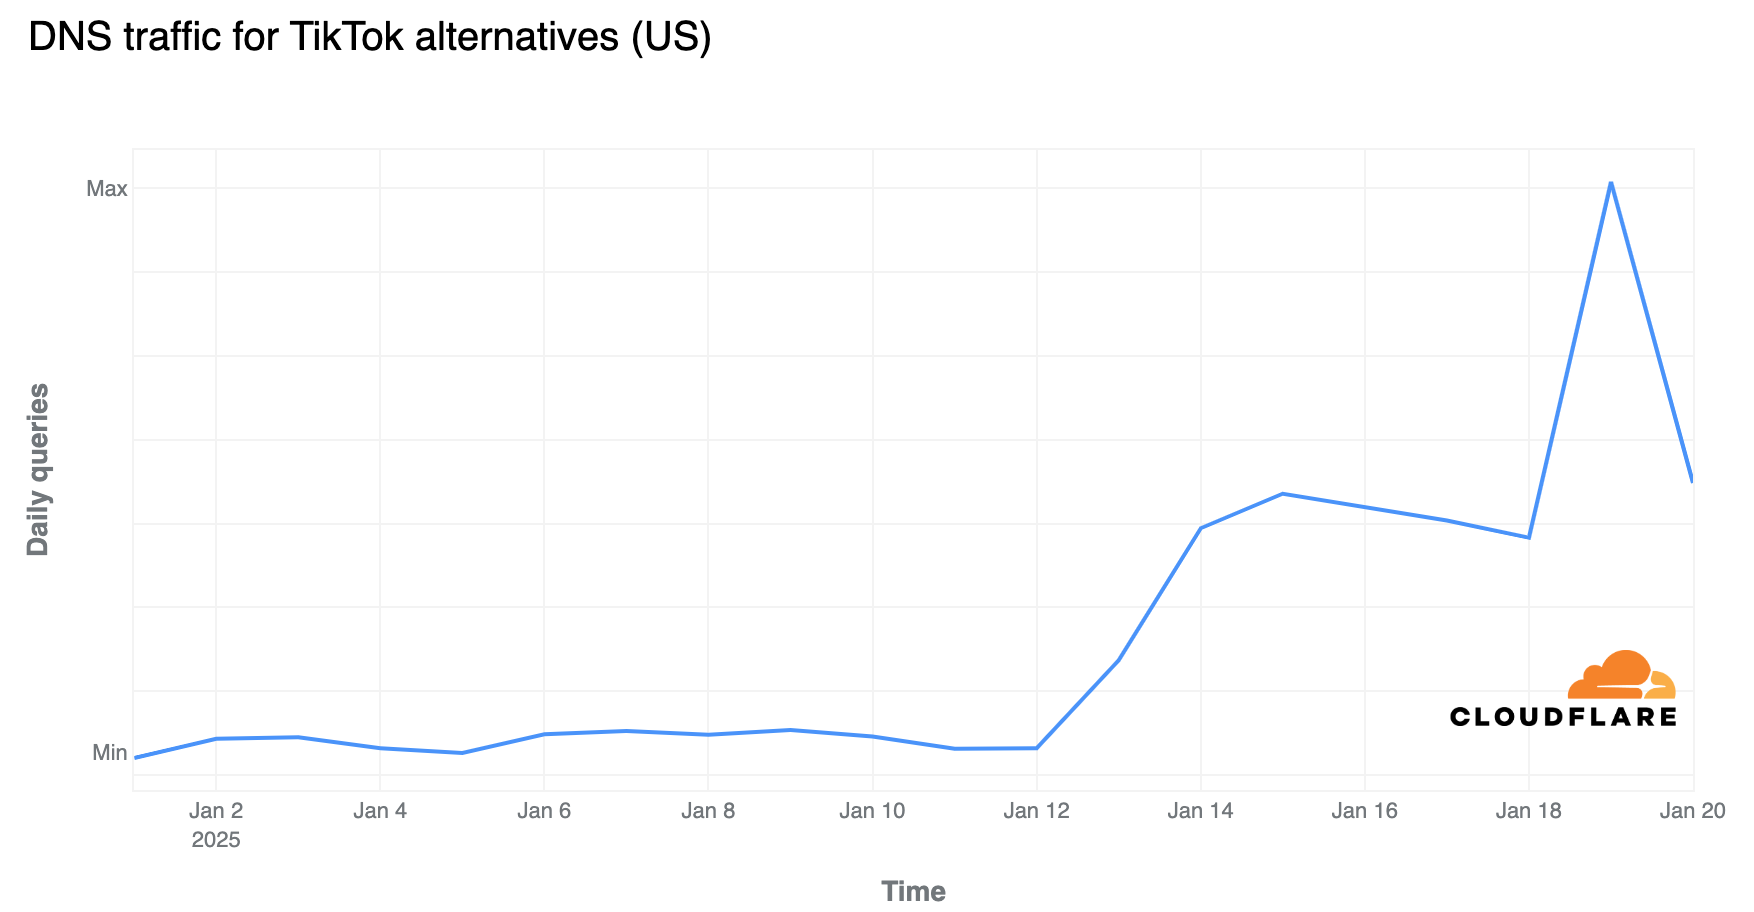
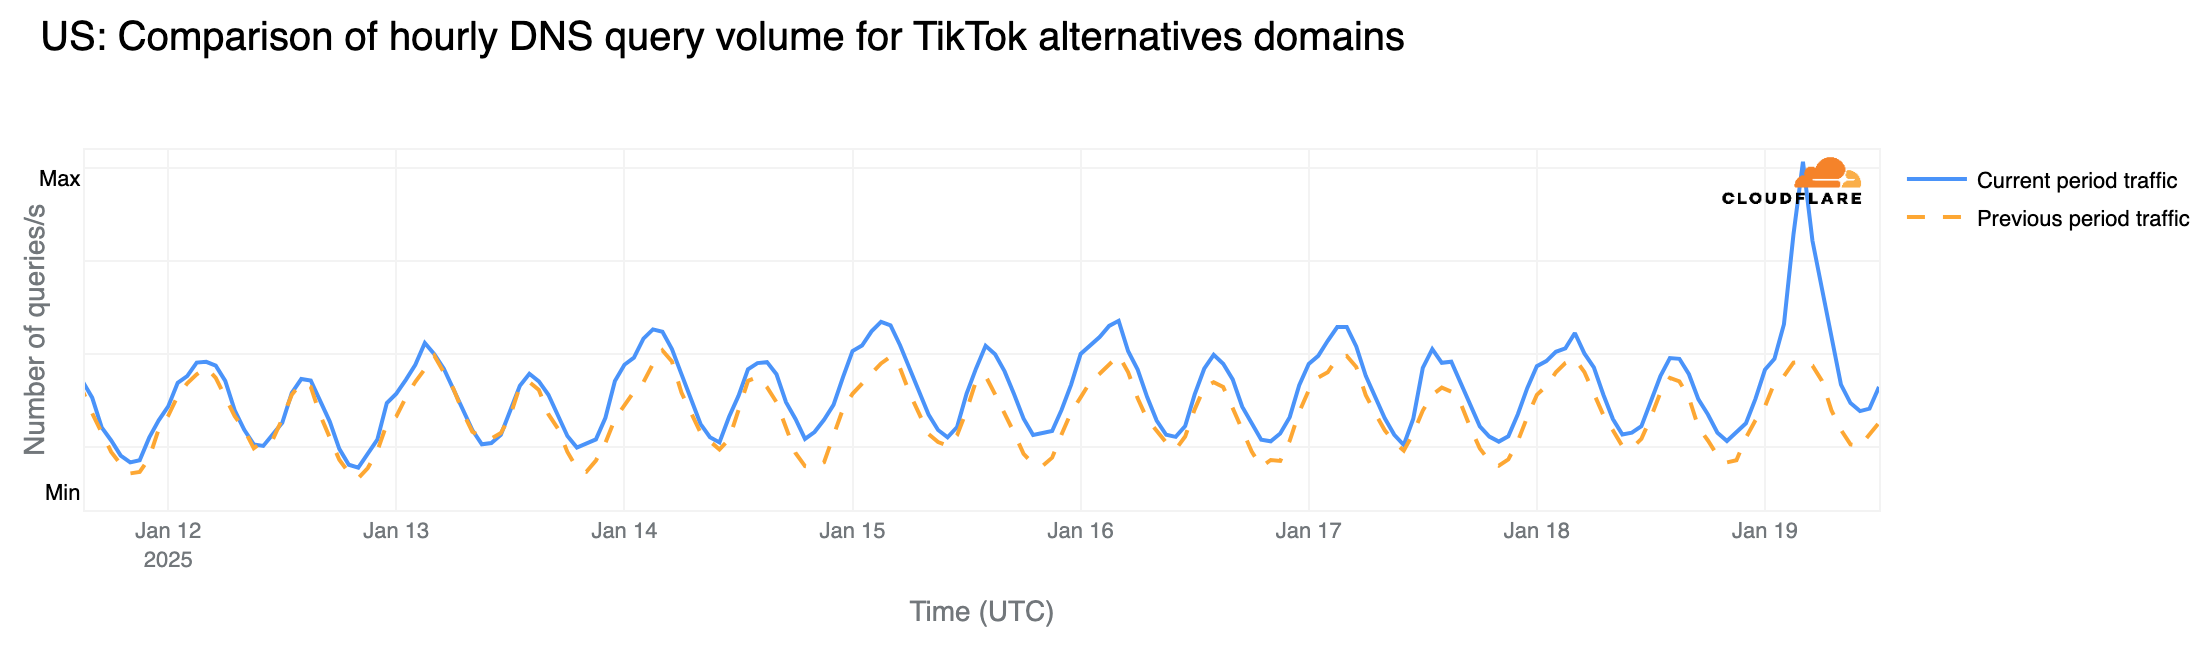
As mentioned previously, DNS traffic in the US for TikTok alternatives, driven by RedNote (Xiaohongshu or Little Red Book), has been steadily increasing since January 13. It surged on January 19 by up to 74% around 04:00 UTC (23:00 ET on January 18) compared to the previous week, with lower growth seen later that day in the US (around 52% at 17:00 UTC (12:00 ET)). Traffic subsequently declined, and was only 17% higher than the previous week after TikTok announced it was beginning to restore its services in the US around 22:00 UTC (17:00 ET), and it lost even more growth momentum after that.
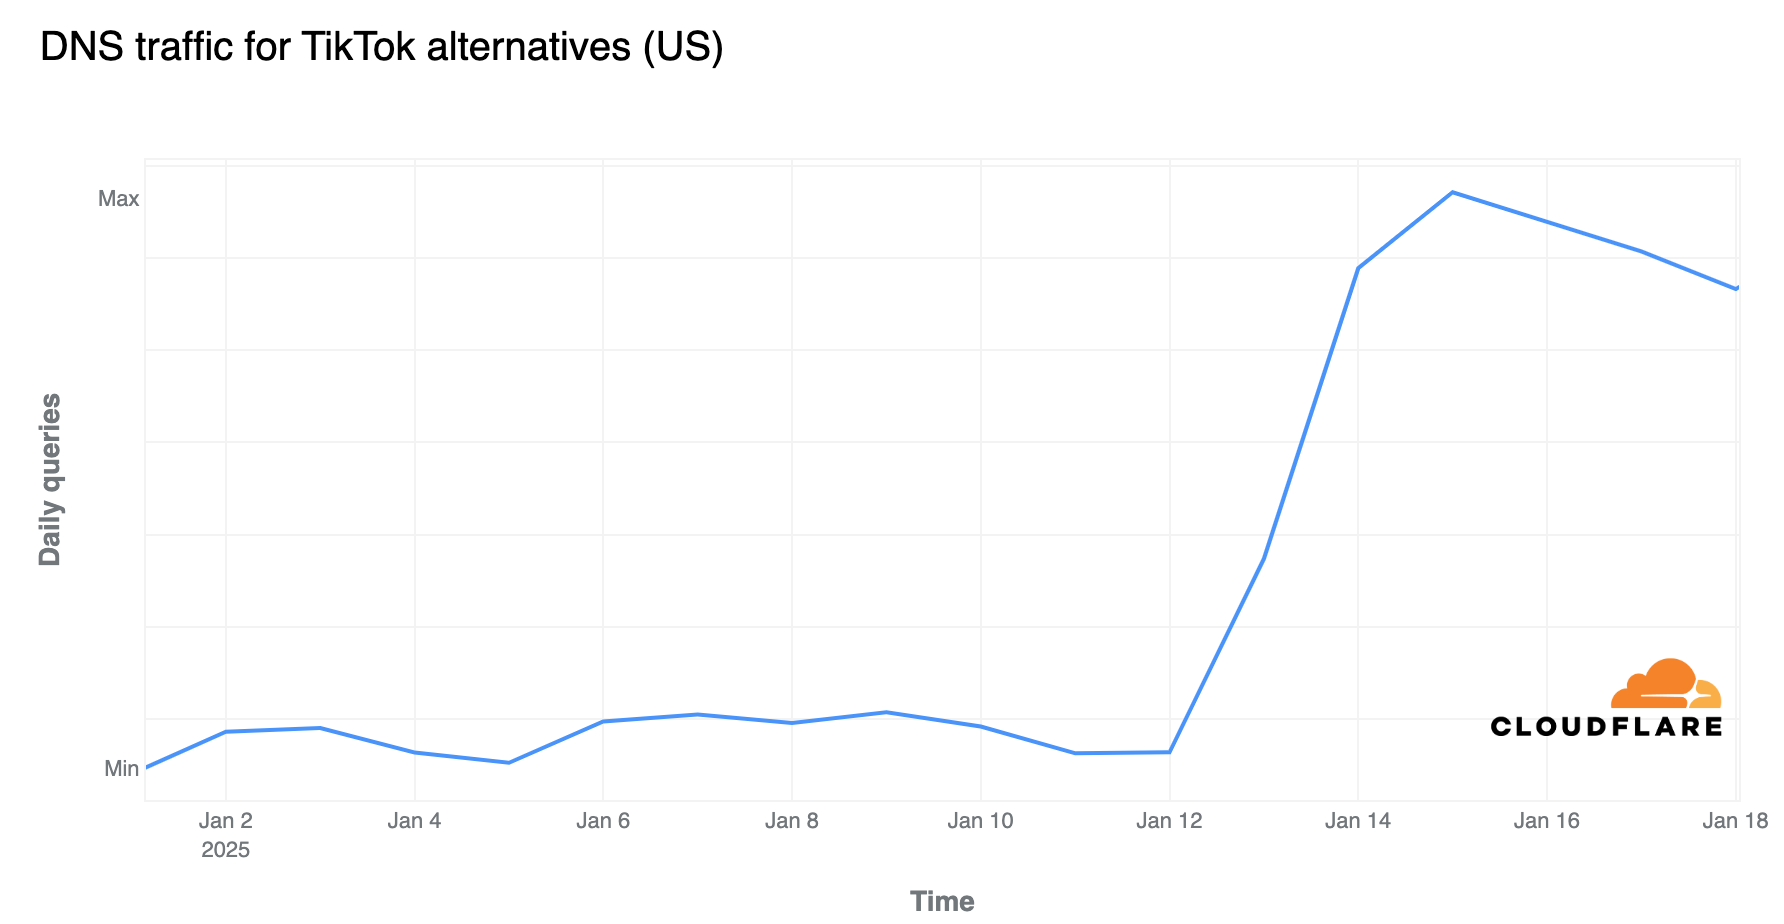
Daily DNS traffic in the US for TikTok alternatives has been rising since January 13, reaching 116% higher than the previous week on January 15. On Sunday, January 19, the day of the TikTok ban, it peaked with a 291% increase compared to the previous week.
RedNote impacting other countries
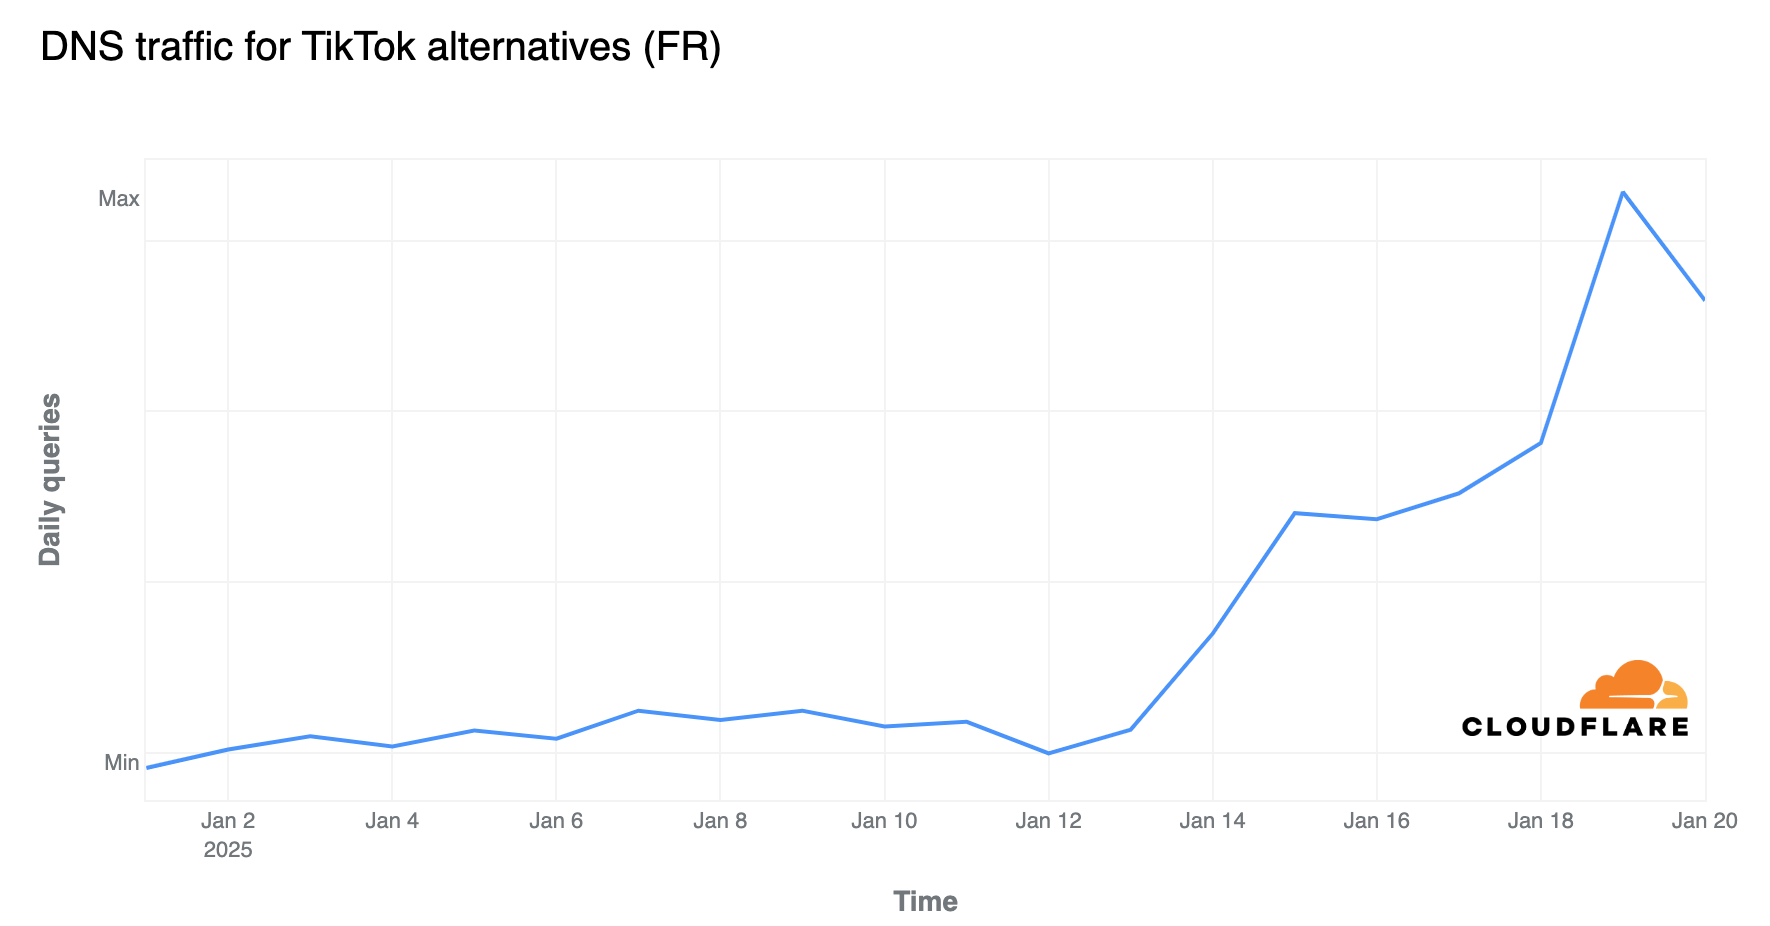
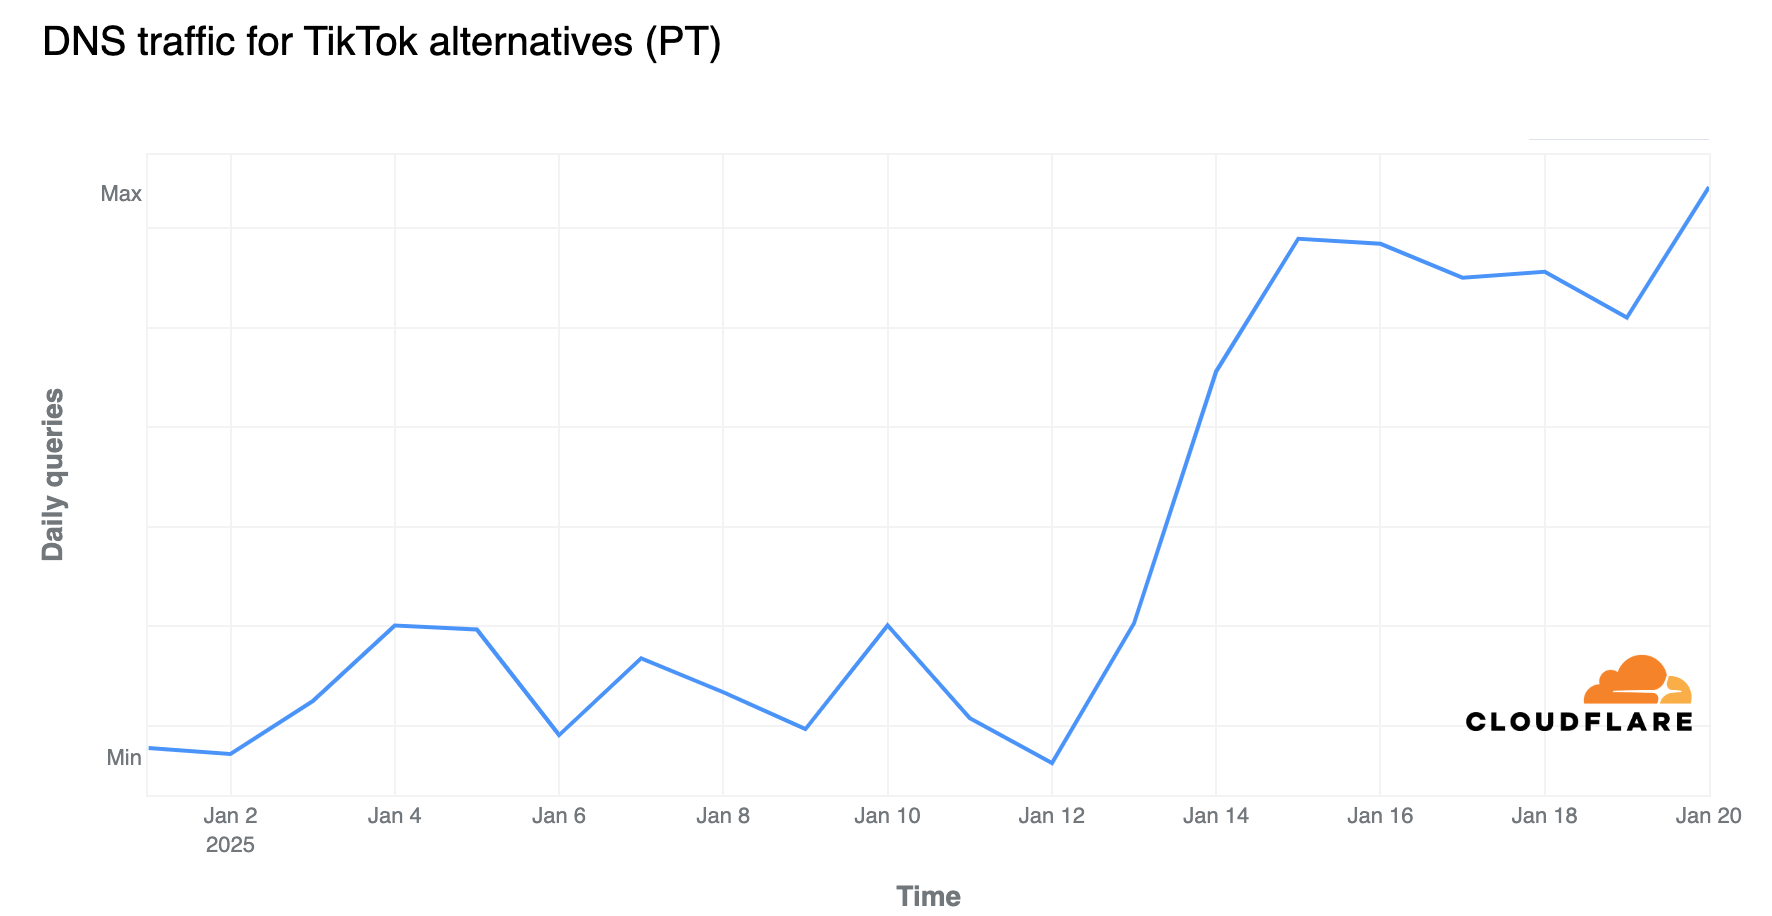
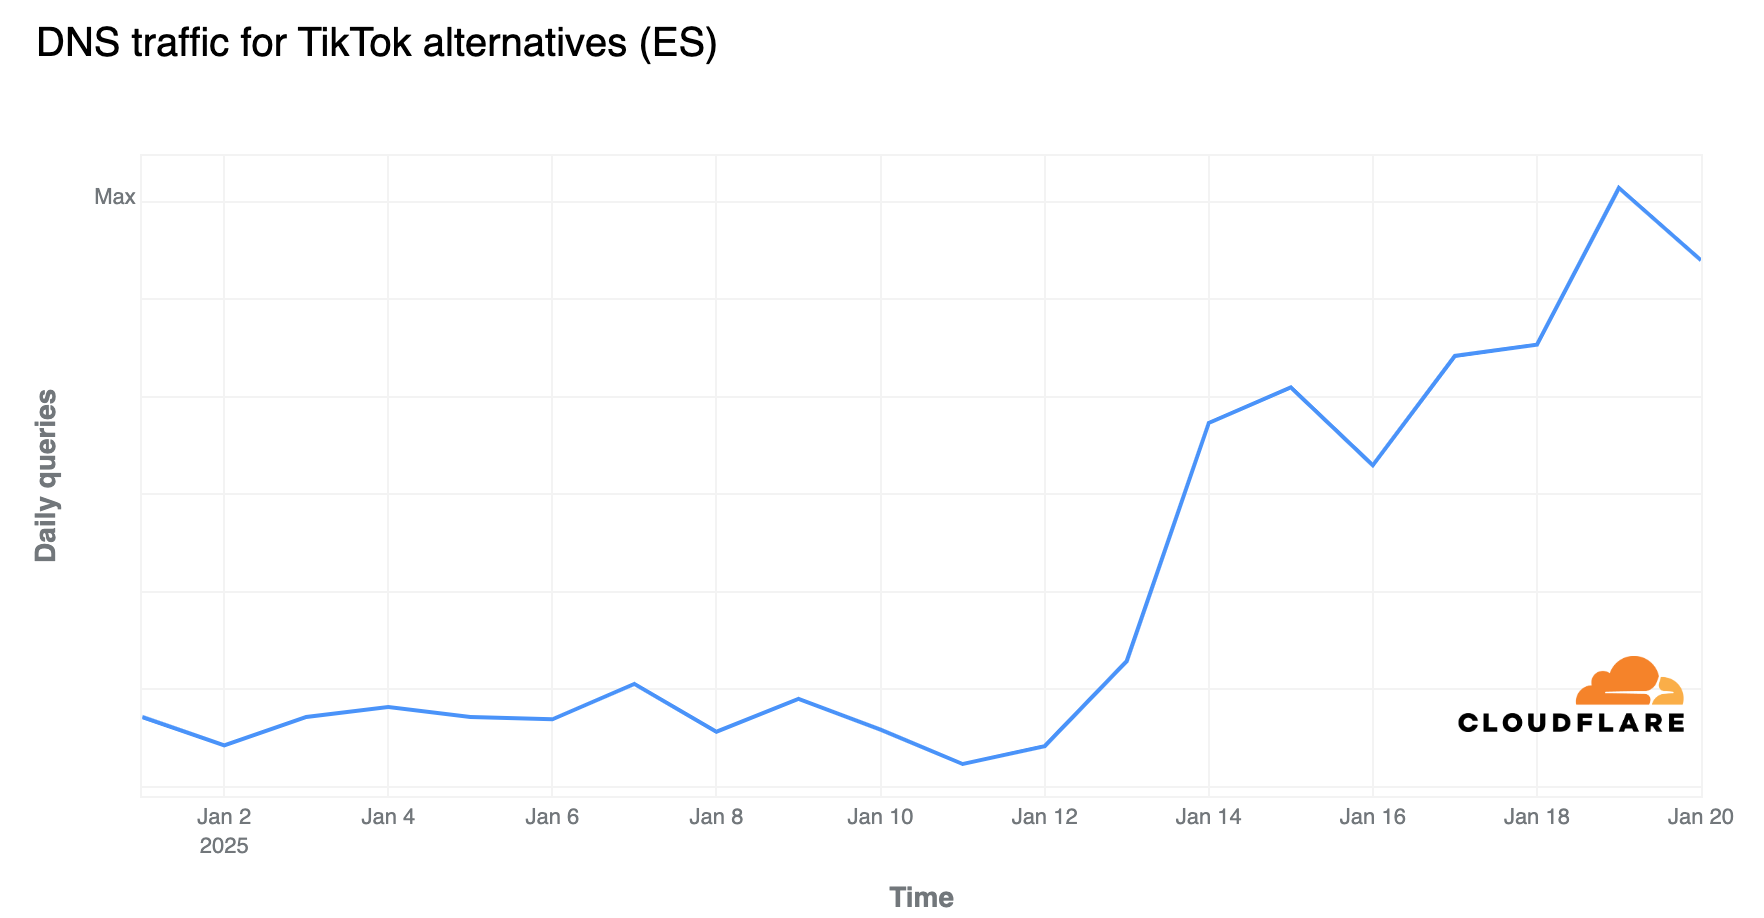
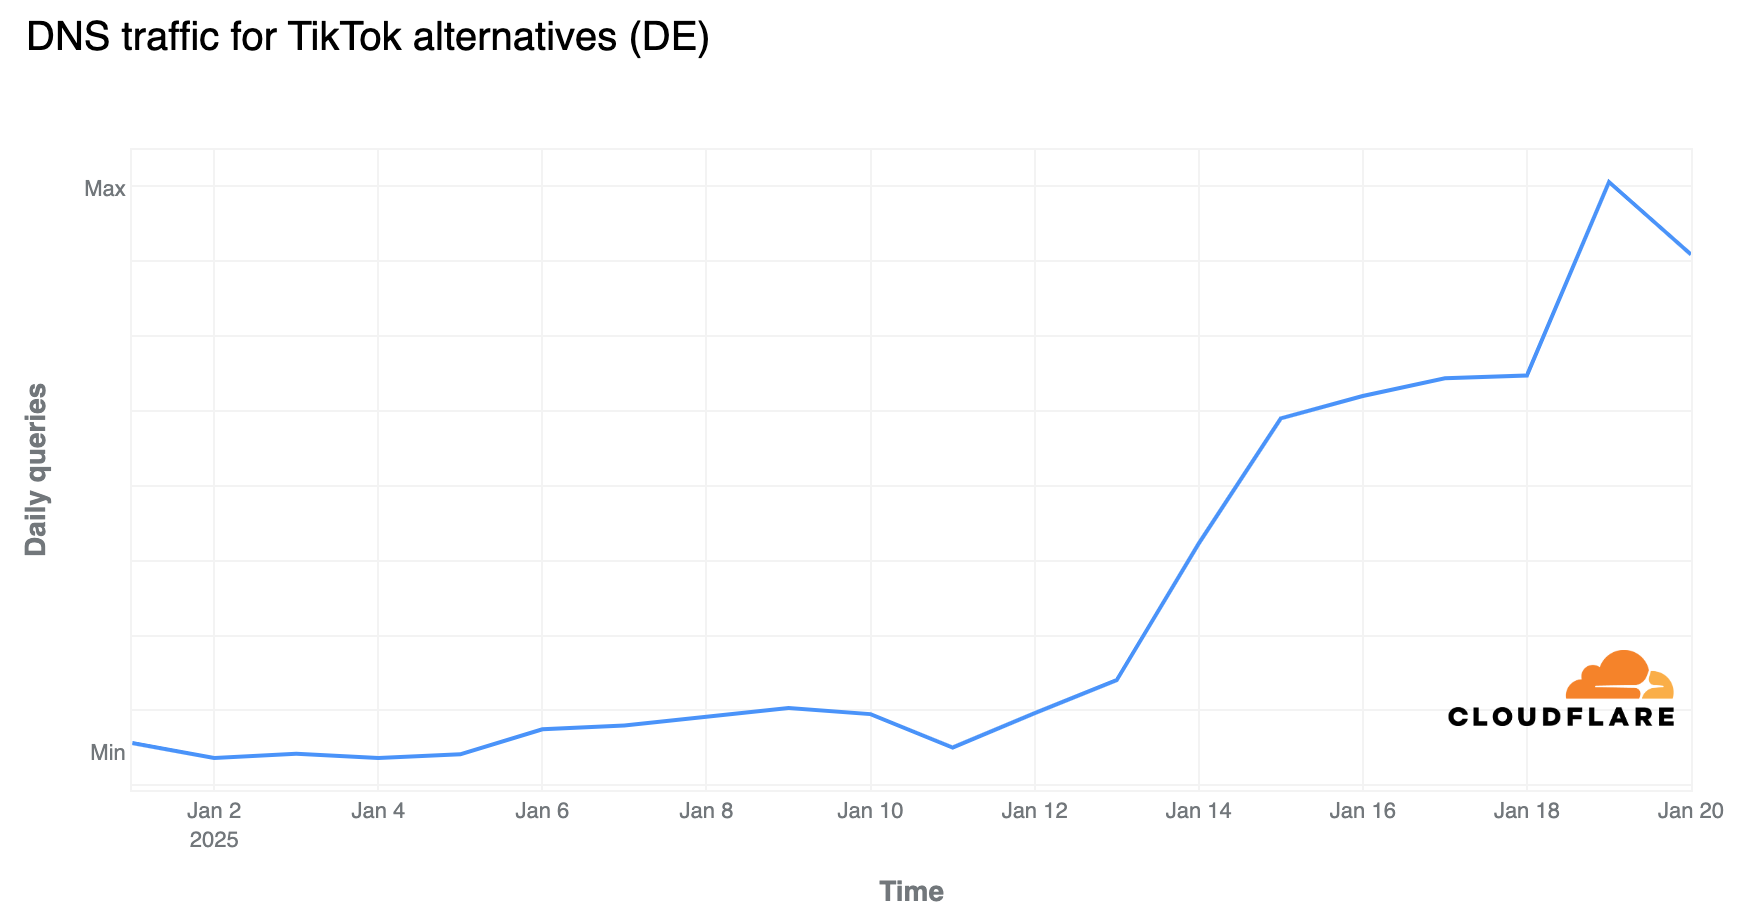
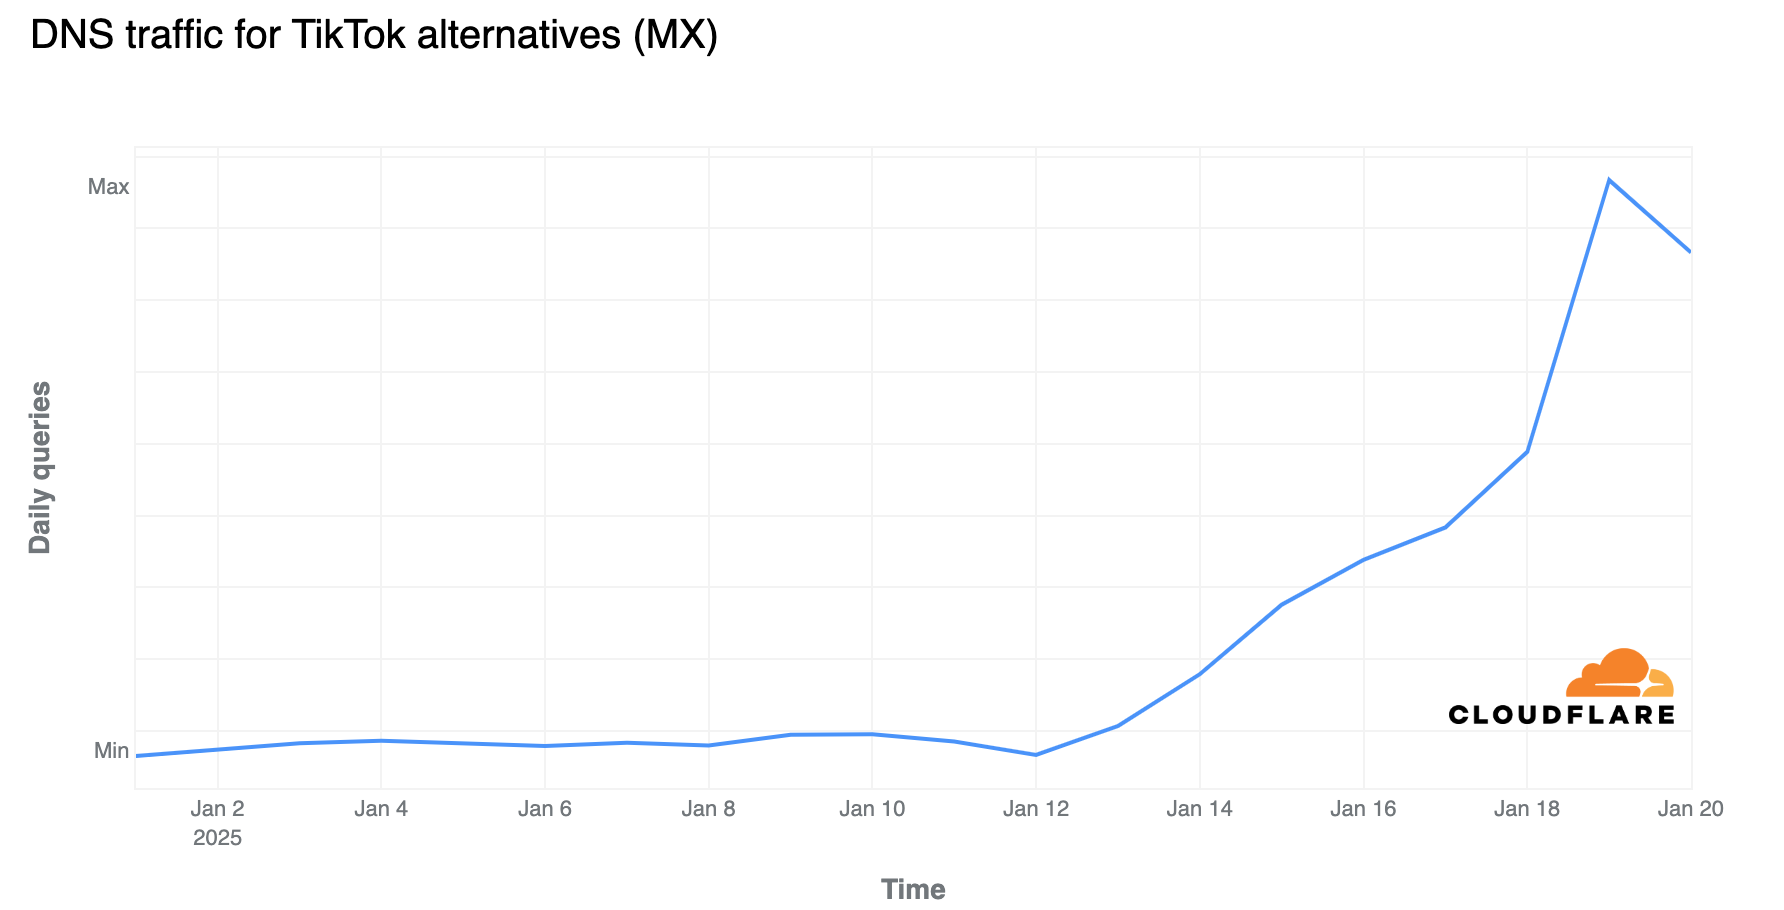
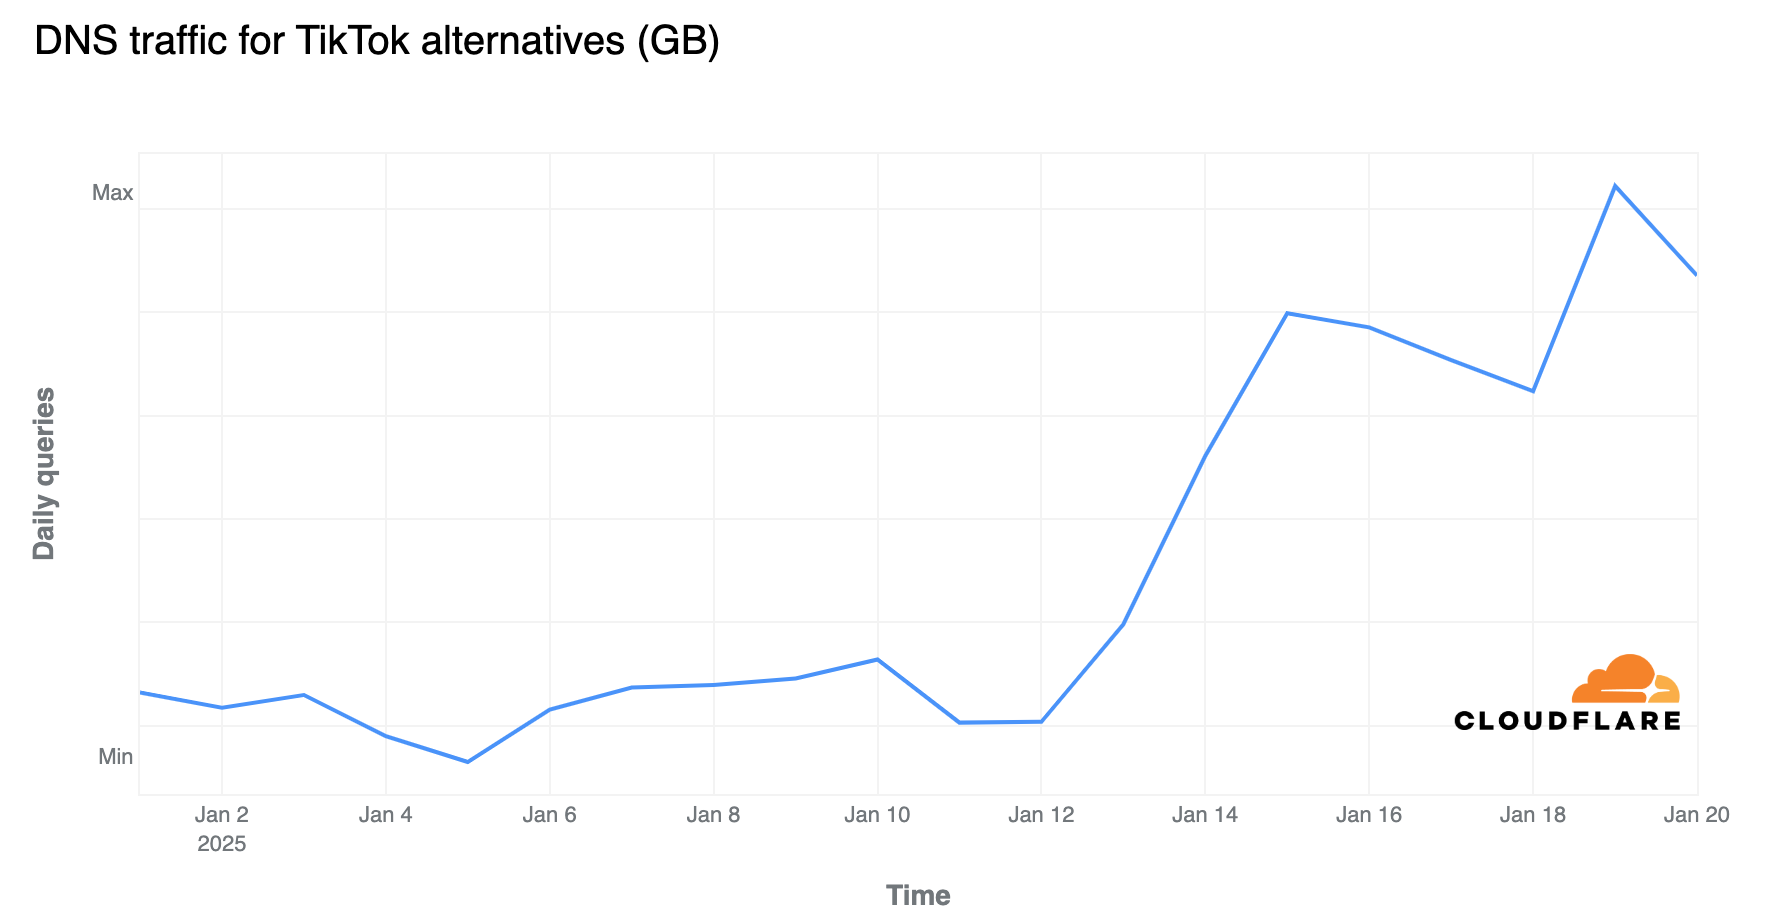
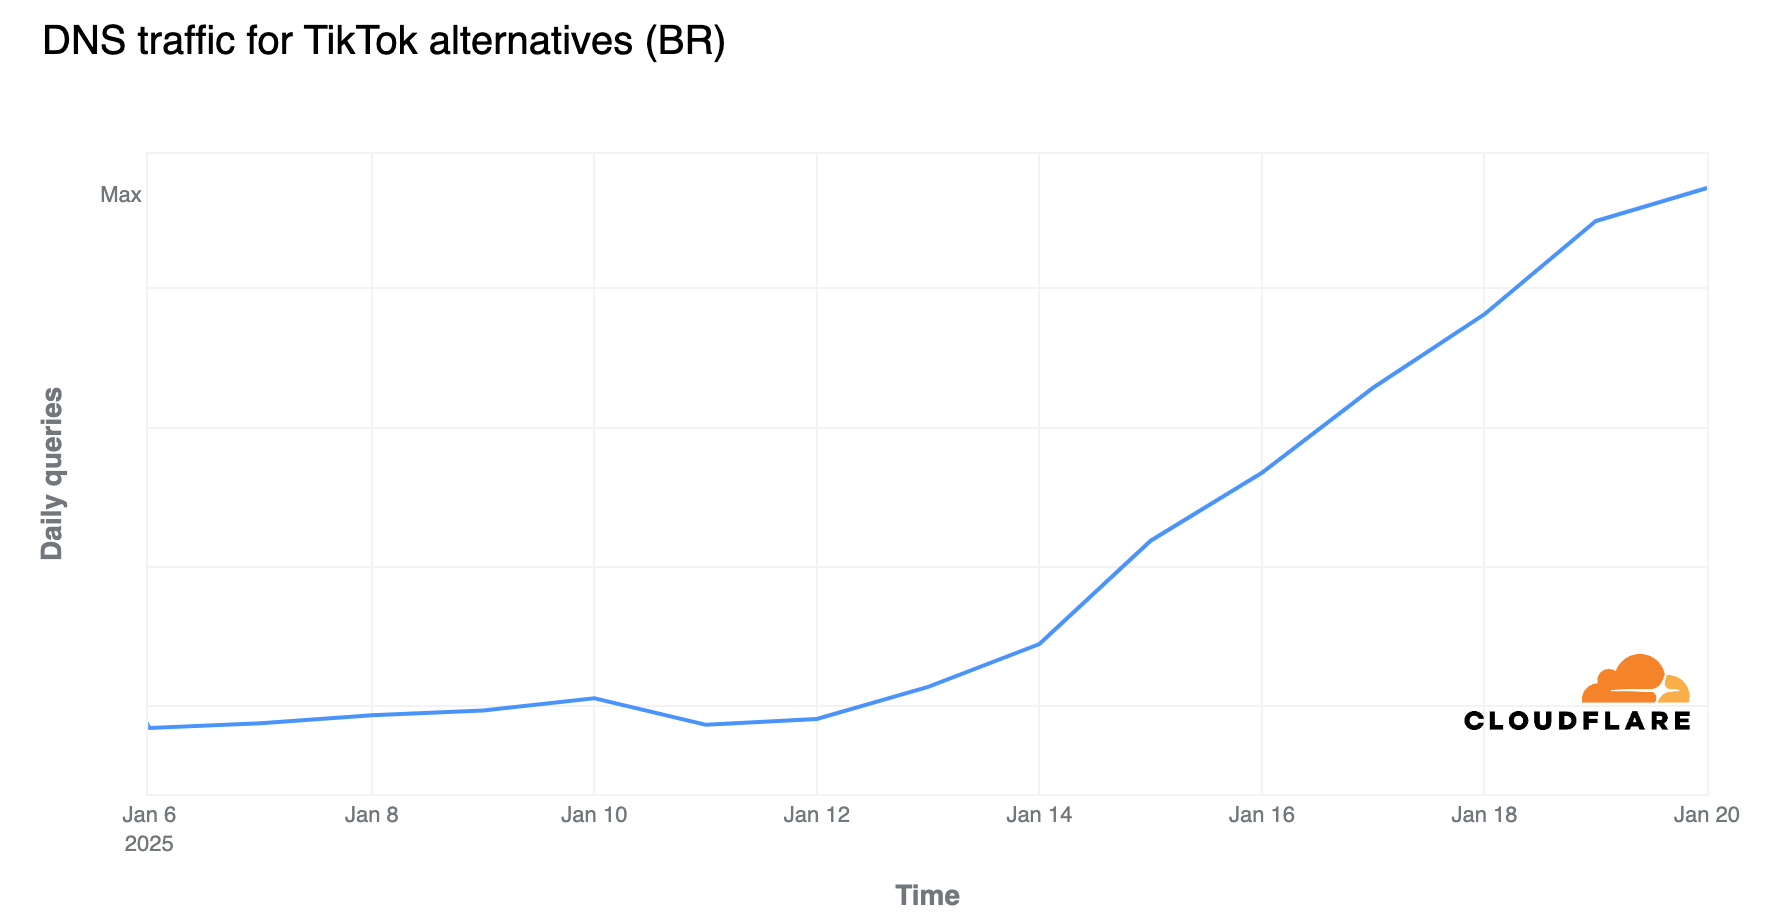
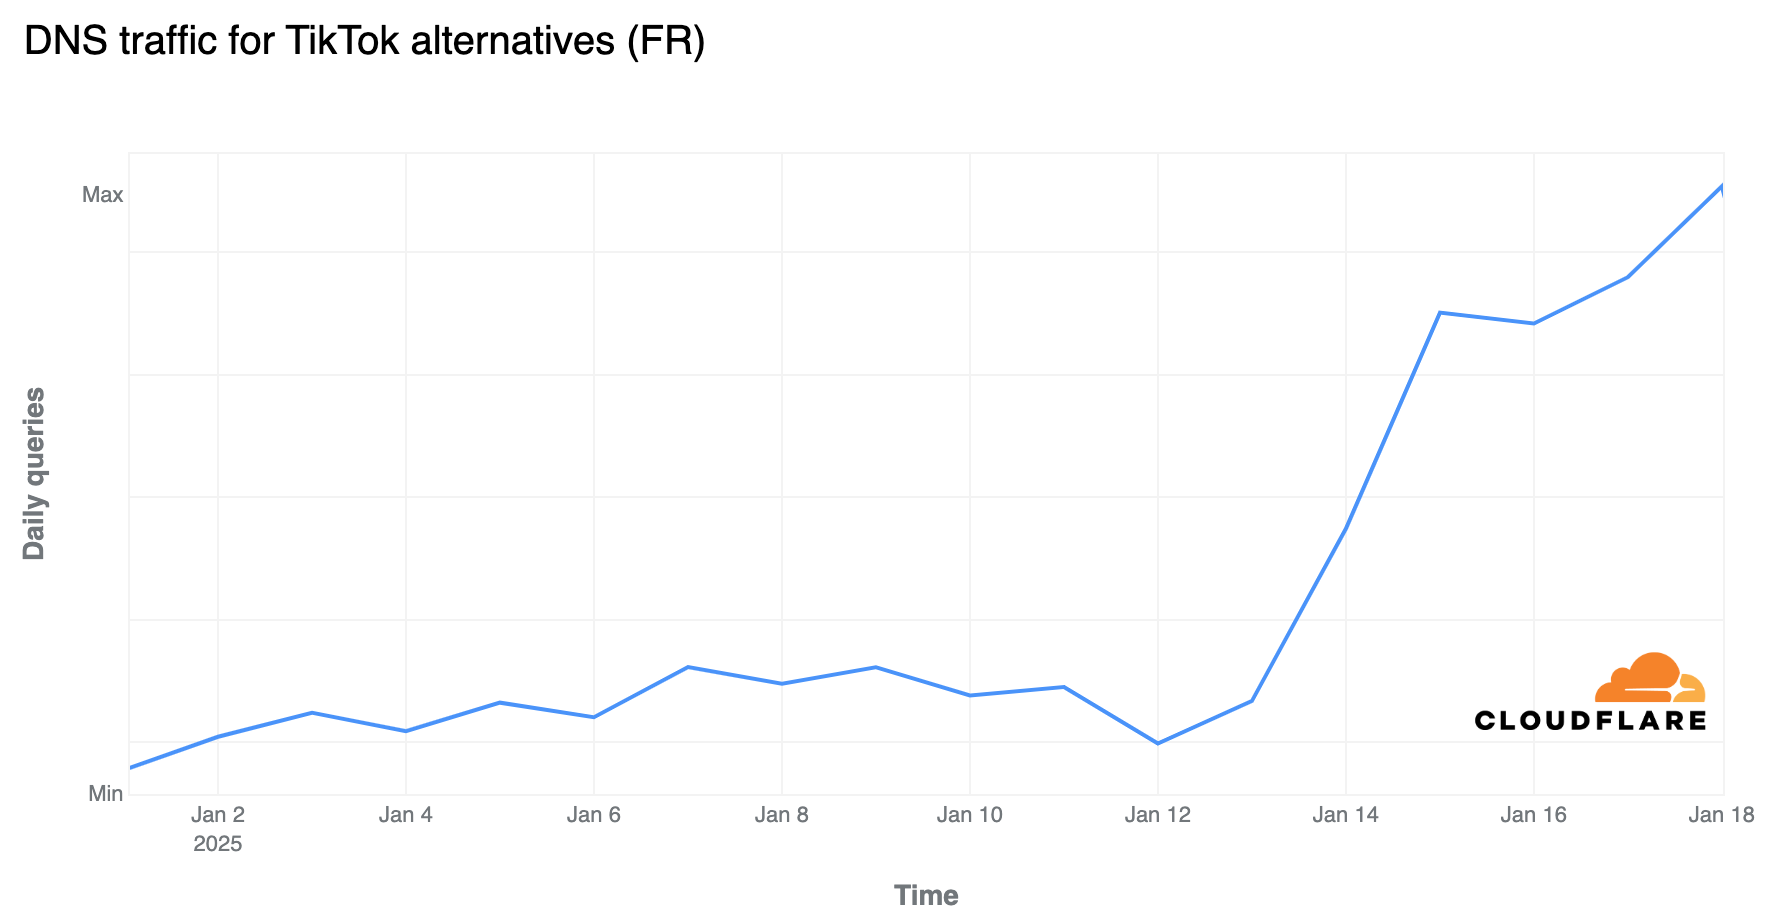
DNS traffic for TikTok alternatives, driven by RedNote, has also been increasing in other countries, with a noticeable rise in daily DNS traffic to these platforms. Below is the breakdown of the most impacted countries, with a few updates from our most recent blog post. We highlight the peak day of DNS traffic and the percentage growth compared to the previous week.
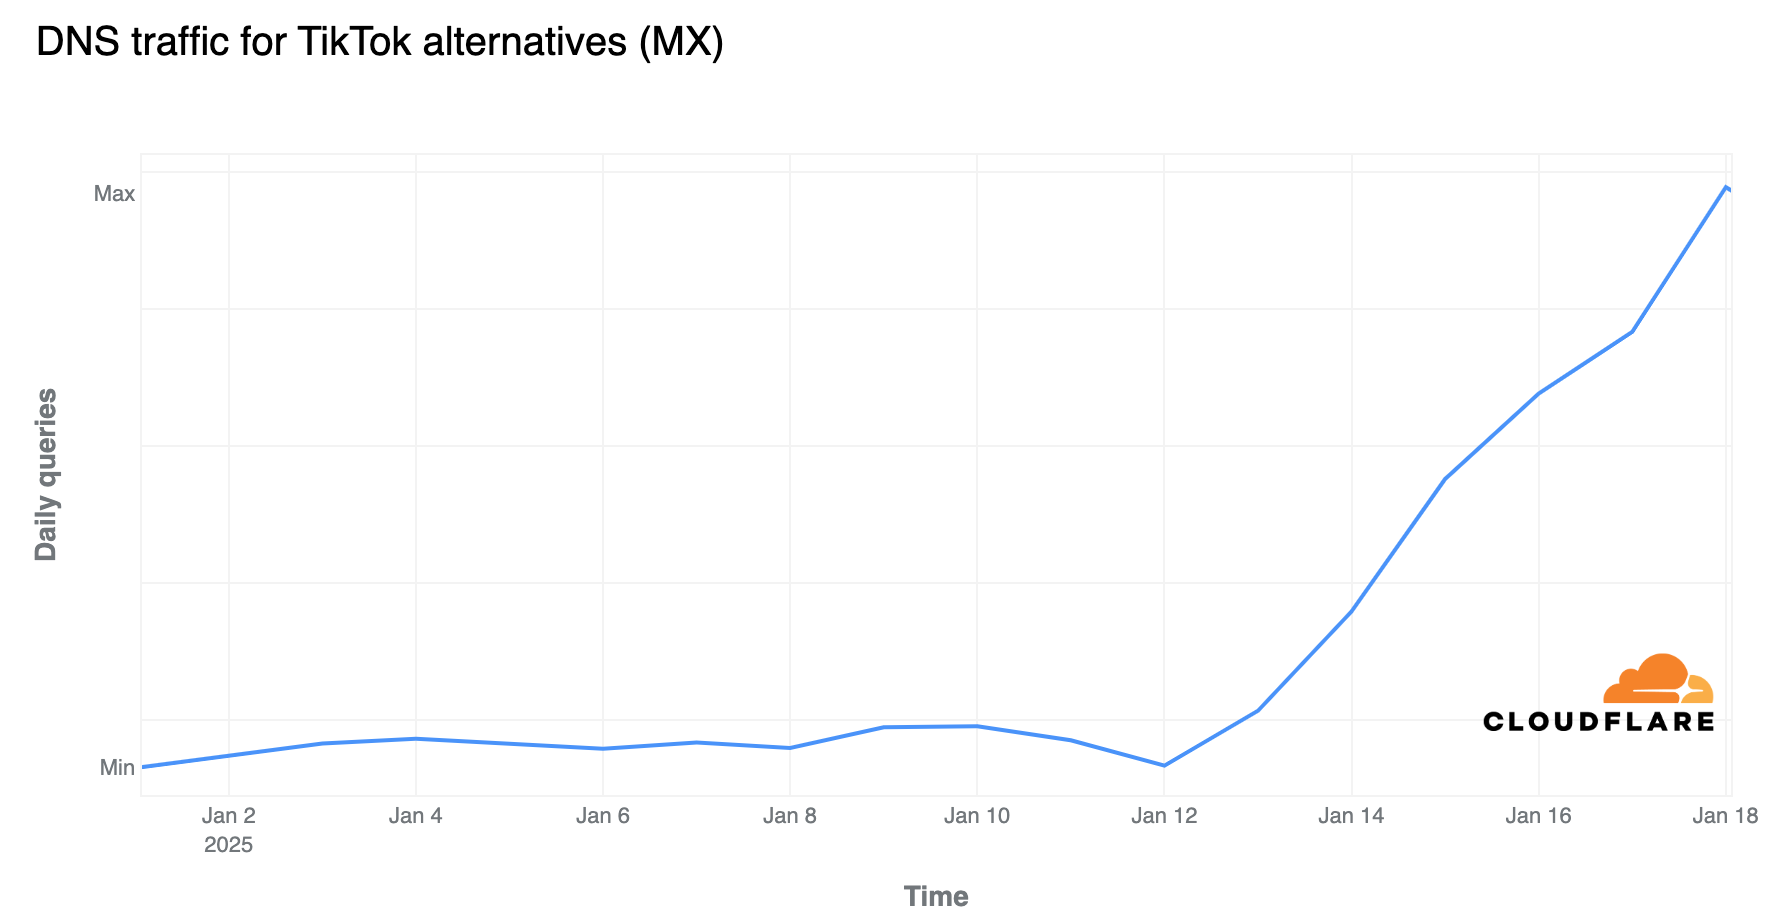
Mexico (+1200% on January 19)
Brazil (+185% on January 20)
France (+165% on January 19)
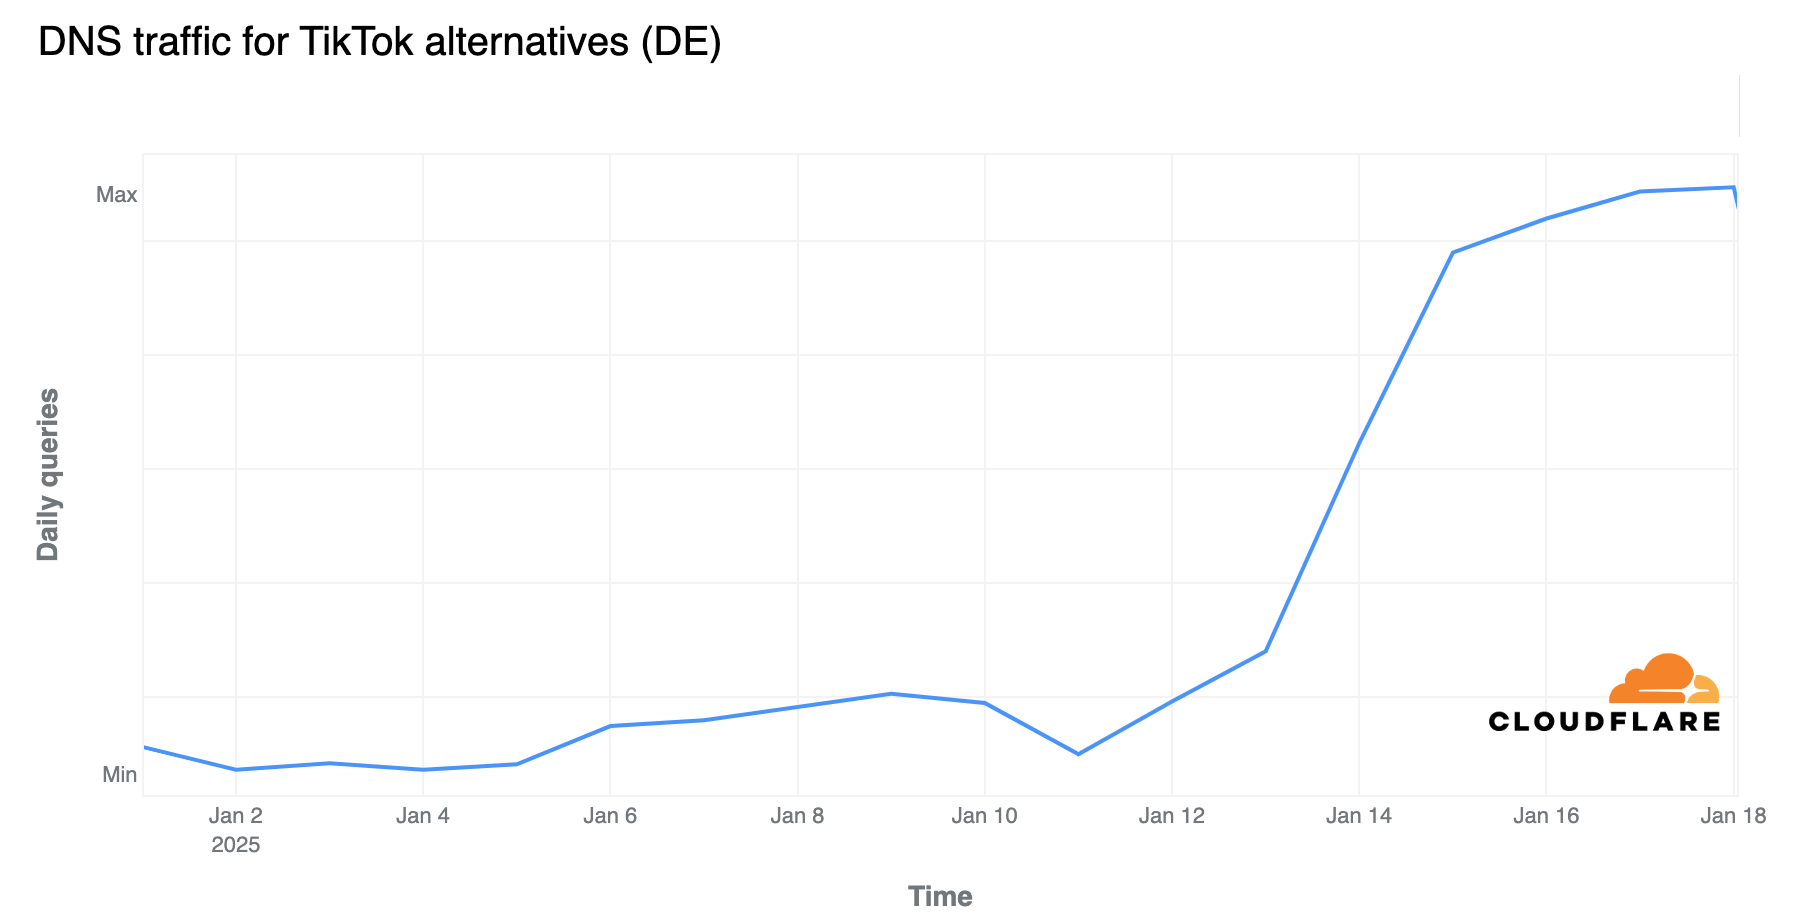
Germany (+142% on January 19)
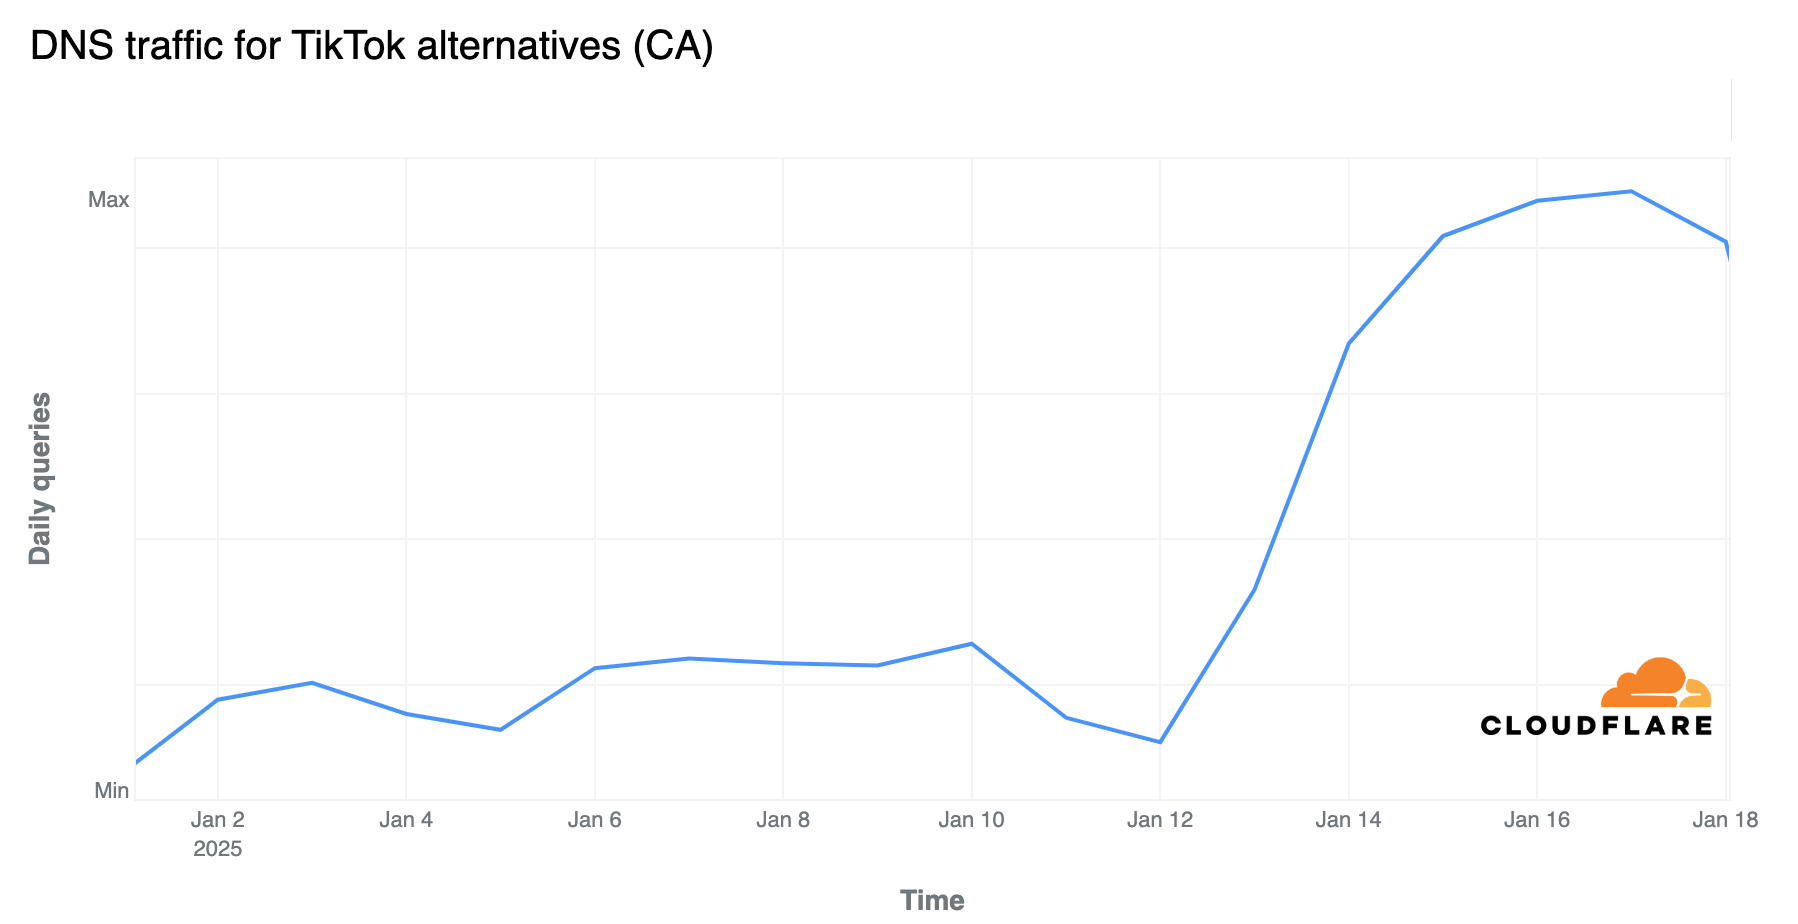
Canada (+119% on January 19)
Spain (+106% on January 19)
Portugal (+97% on January 19)
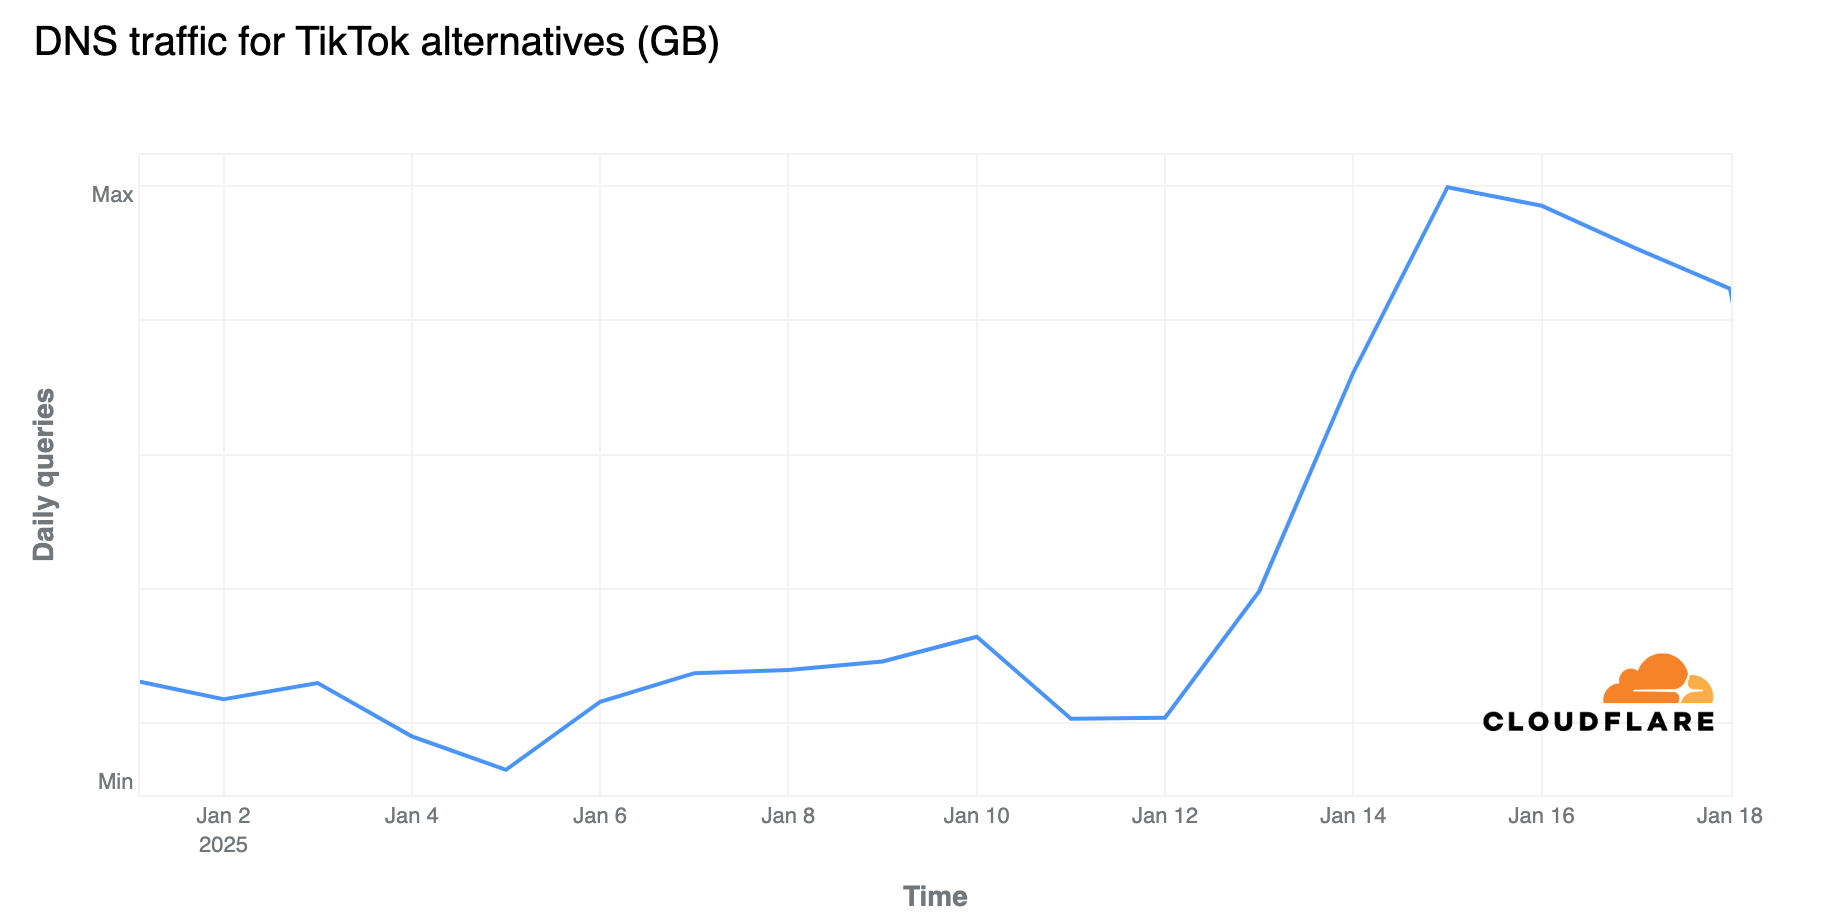
The UK (+86% on January 19)
Australia (+19% on January 15)
Japan (+18% on January 18)
(Note: In many cases, DNS traffic had been growing for more than a week, so countries with recent growth may show higher percentages.)
Those trends are consistent with apps like RedNote rising on top of the Android and iOS App Stores, according to Data.ai.
The rapid increases in DNS traffic can be clearly seen in the graphs below:
The United States ban on TikTok went into effect on January 19, 2025, and our data showed a clear impact starting after 03:30 UTC (10:30 PM ET on January 18, 2025). The ban was part of the “Protecting Americans from Foreign Adversary Controlled Applications Act,” proposed in Congress, which ordered ByteDance to divest due to alleged security concerns. The bill was signed into law by Congress and President Biden in April 2024, and was upheld by the Supreme Court.
Aggregated data from our 1.1.1.1 DNS resolver shows — as we’ve posted on X — that the TikTok shutdown in the US began to impact DNS traffic to TikTok-related domains on January 19, just after 03:30 UTC (22:30 ET on January 18). This includes DNS traffic not only for TikTok, but also for other ByteDance-owned platforms, such as the CapCut video editor. Traffic dropped by as much as 85% compared to the previous week and showed signs of further decline in the following hours.
Around that time, a message indicating the TikTok ban began appearing for US users.
Analyzing data from autonomous systems or networks, traffic from TikTok owner ByteDance’s network (AS396986) in the US to Cloudflare experienced a sharp decline, dropping by as much as 95% after 03:30 UTC (22:30 ET).
Alternatives like RedNote (Xiaohongshu) surge in the US
DNS traffic in the US for TikTok alternatives, driven by RedNote (Xiaohongshu or Little Red Book), has been steadily growing since January 13. It surged on January 19 by as much as 74% around 04:00 UTC (23:00 ET on January 18) compared to the previous week, with growth being less intensive during nighttime in the US (around 22%).
Daily DNS traffic in the US for TikTok alternatives has increased since January 13, reaching as much as 116% growth on January 15. Sunday, January 19, is on track to surpass that growth.
RedNote impacting other countries
DNS traffic for TikTok alternatives, driven by RedNote, has been growing in the last few days, and not only in the US.
The other countries where we observed a clear increase in daily DNS traffic to TikTok alternatives were Mexico (a 500% increase on January 18), Canada (68% on January 18), the UK (53% on January 18), Germany (110% on January 18), and France (75% on January 18). These increases are shown in the graphs below:
Those trends are consistent with apps like RedNote rising on top of the Android and iOS App Stores, according to Data.ai.
President-elect Donald Trump indicated on January 18 that he plans to grant TikTok a 90-day extension following his inauguration on Monday, January 20, 2025.
As January approaches and the year comes to a close, distinct changes in global Internet usage emerge. Year-end traditions — ranging from Christmas feasts to New Year’s Eve (NYE) countdowns — shape online behavior across continents and cultures. Looking back at Christmas and NYE 2023 offers insights into how these trends may repeat this year, and by January 2025, we’ll be able to directly compare patterns. Examining data from 50 countries and regions reveals how people celebrated in 2023-2024, providing a timely reminder of typical holiday trends.
With Cloudflare’s global reach, we observe planet-wide and local Internet habits during the holiday season. In the past, unintended trends during Christmas and New Year’s Eve have surfaced through our Outage Center, which uses automatic traffic anomaly alerts to detect Internet outages or unusual patterns. In the 2023 overview below, traffic dropped enough on those days to trigger dozens of anomaly alerts (orange and pink bubbles):
While Christmas dominates in many regions, other cultural and religious holidays — like Hanukkah or regional festivities — shape online rhythms in places where Western traditions are less central.
In countries and regions where Christmas is deeply rooted, Internet traffic slows during Christmas Eve dinners, midnight masses, morning gift exchanges, and Christmas Day lunches.
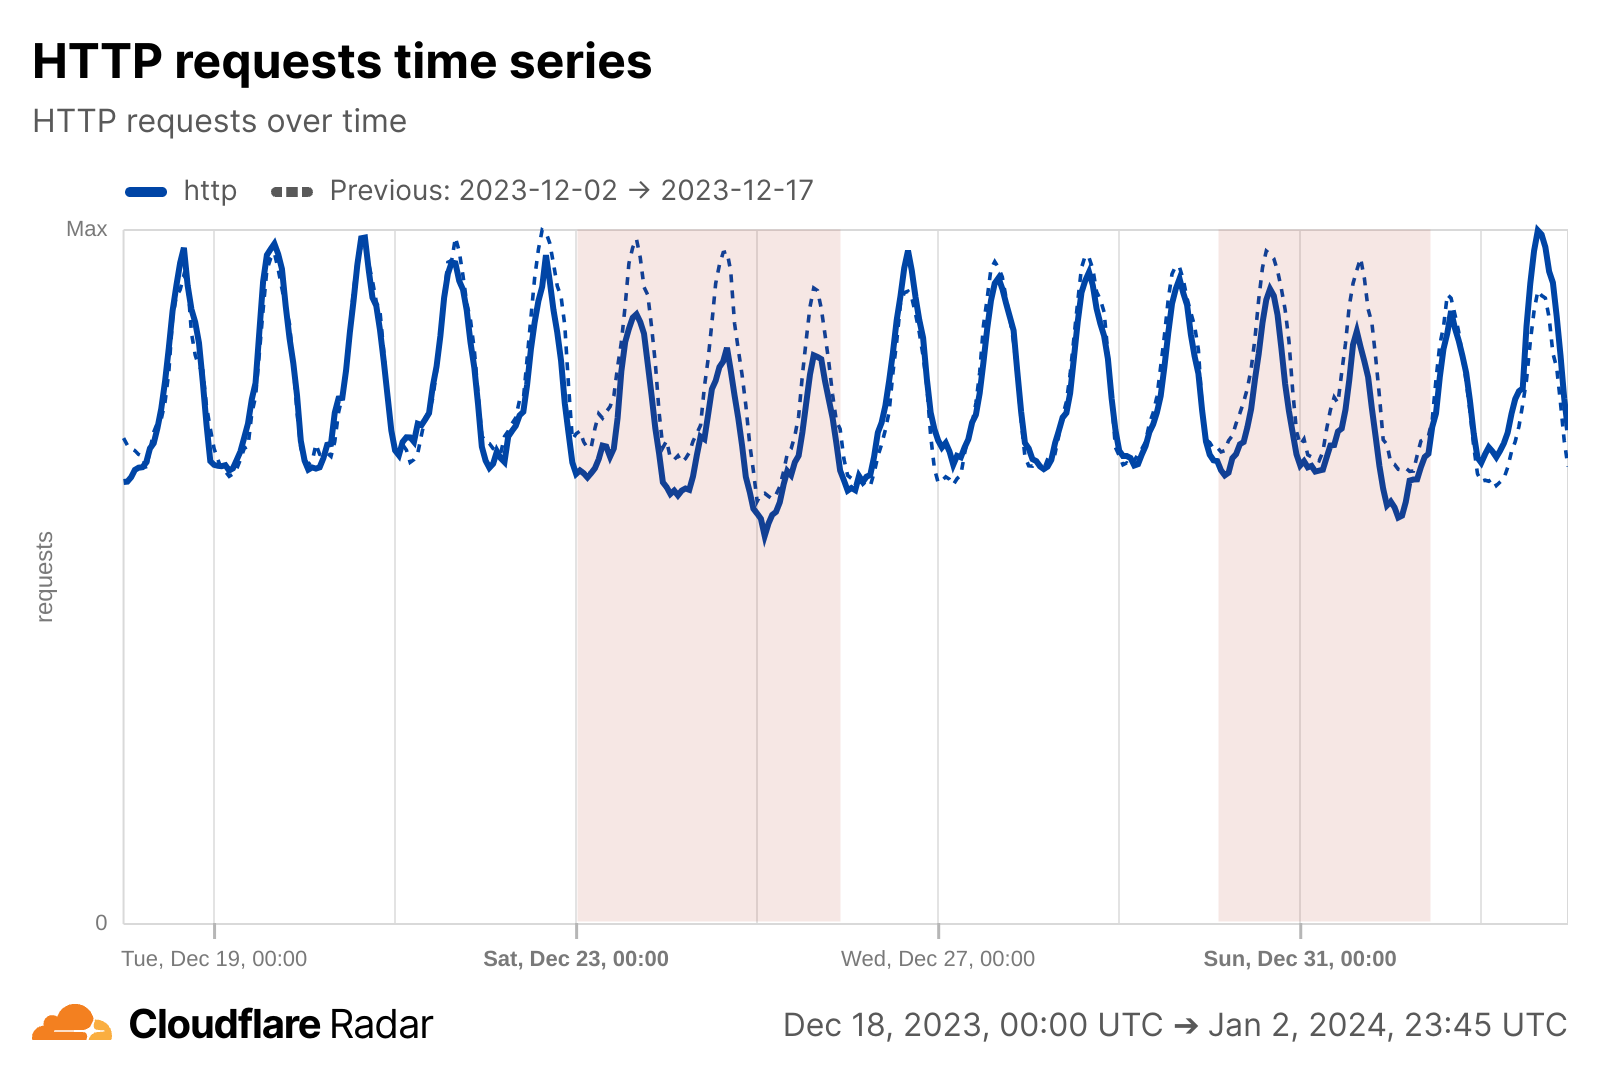
This blog post focuses exclusively on non-bot-related Internet traffic requests, filtering out automated activity to provide a clearer view of genuine human behavior during the holiday season. Before going into location-specific perspectives, here’s a global hourly view of Internet traffic during Christmas and New Year’s Eve 2023 from Cloudflare Radar Data Explorer, highlighting notable drops (in UTC, so it captures impacts across more days due to time zones spanning over 23 hours, from New Zealand to Hawaii in the US):
Global Christmas and New Year’s Eve daily trends
Let’s start with a ranking of countries and regions and their top low-traffic holiday dates, showing each day’s percentage drop. Many locations like the US see clear dips on December 24 and 25 as people celebrate Christmas Eve and Christmas Day offline, and some show smaller declines (compared to Christmas) around December 31 as the New Year approaches. Still, the exact order and magnitude differ, reflecting cultural nuances — some nations experience greater drops on Christmas Eve, others on Christmas Day, and others signal unique patterns tied to New Year’s Eve or January 1 celebrations.
In the next table, locations are listed first (in the left column) by those with the lowest traffic on December 24 (and the highest percentage of traffic drop), followed by December 25, and finally December 31 (in the right column).
Top days with the lowest Internet traffic in December 2023 – January 2024
(with respective percentage drops, if any, from the previous week)
Denmark
#1 December 24 (-35%)
#2 December 25 (-11%)
#3 December 31
South Africa
#1 December 25 (-27%)
#2 December 24 (-15%)
#3 December 31 (-5%)
Norway
#1 December 24 (-32%)
#2 December 25 (-12%)
#3 December 31
United Kingdom
#1 December 25 (-26%)
#2 December 24 (-19%)
#3 December 31
Portugal
#1 December 24 (-32%)
#2 December 25 (-24%)
#3 December 31
Italy
#1 December 25 (-25%)
#2 December 24 (-25%)
#3 December 31
Poland
#1 December 24 (-31%)
#2 December 25 (-21%)
#3 December 31
Australia
#1 December 25 (-25%)
#2 December 24 (-15%)
#3 December 31 (-1%)
Spain
#1 December 24 (-28%)
#2 December 25 (-25%)
#3 December 31
Ireland
#1 December 25 (-24%)
#2 December 24 (-22%)
#3 December 23
Sweden
#1 December 24 (-26%)
#2 December 25 (-6%)
#3 December 31
New Zealand
#1 December 25 (-22%)
#2 December 24 (-8%)
#3 December 31 (-4%)
Chile
#1 December 24 (-23%)
#2 December 25 (-24%)
#3 December 31 (-3%)
Canada
#1 December 25 (-19%)
#2 December 24 (-15%)
#3 December 31
Finland
#1 December 24 (-23%)
#2 December 25 (-16%)
#3 December 31
Nigeria
#1 December 25 (-18%)
#2 December 24 (-19%)
#3 January 1
France
#1 December 24 (-22%)
#2 December 25 (-19%)
#3 December 23
Philippines
#1 December 25 (-16%)
#2 December 24 (-7%)
#3 December 31
Germany
#1 December 24 (-21%)
#2 December 25 (-9%)
#3 December 31
Hong Kong
#1 December 25 (-9%)
#2 December 24 (-6%)
#3 December 23
Mexico
#1 December 24 (-21%)
#2 December 25 (-19%)
#3 December 31
Belgium
#1 December 31 (-1%)
#2 December 24 (-20%)
#3 December 25 (-17%)
Belgium
#1 December 24 (-20%)
#2 December 25 (-17%)
#3 December 31 (-1%)
Indonesia
#1 December 31 (-1%)
#2 December 25 (-7%)
#3 December 24
Romania
#1 December 24 (-20%)
#2 December 25 (-14%)
#3 December 31 (-3%)
Netherlands
#1 December 31 (-10%)
#2 December 24 (-10%)
#3 December 25 (-20%)
United States
#1 December 24 (-16%)
#2 December 25 (-21%)
#3 December 31
Ukraine
#1 December 31 (-10%)
#2 December 24 (-5%)
#3 December 30
Brazil
#1 December 24 (-14%)
#2 December 25 (-26%)
#3 December 31
Thailand
#1 December 31 (-6%)
#2 January 1 (-2%)
#3 December 25 (-2%)
Colombia
#1 December 24 (-14%)
#2 December 25 (-26%)
#3 December 31 (-4%)
The data shows that in many European countries — such as Denmark, Norway, the United Kingdom, Portugal, Italy, Poland, Spain, Ireland, Sweden, Finland, France, Germany, Belgium, the Netherlands, and Romania — Christmas Eve (December24) and Christmas Day (December25) consistently register the biggest drops in Internet traffic. These dips suggest that in much of Europe, Christmas traditions take people firmly offline, whether it’s for family gatherings, festive meals, or religious observances. Outside Europe, similar patterns appear in predominantly Christian-influenced regions, including Australia, New Zealand, Canada, the United States, and several Latin American countries (like Brazil, Chile, and Colombia), confirming that the holiday’s cultural importance is mirrored in their online habits.
In contrast, locations less influenced by Western Christmas traditions, such as those in Asia, show subtler or different patterns. For example, Hong Kong and the Philippines do show declines in traffic, reflecting a hybrid of local and global influences, while places like Thailand and Indonesia present smaller dips on Christmas compared to other days or emphasize different holidays altogether. These variations highlight that while Christmas exerts a strong pull offline in many parts of the world, its impact on Internet usage is shaped by local cultural contexts.
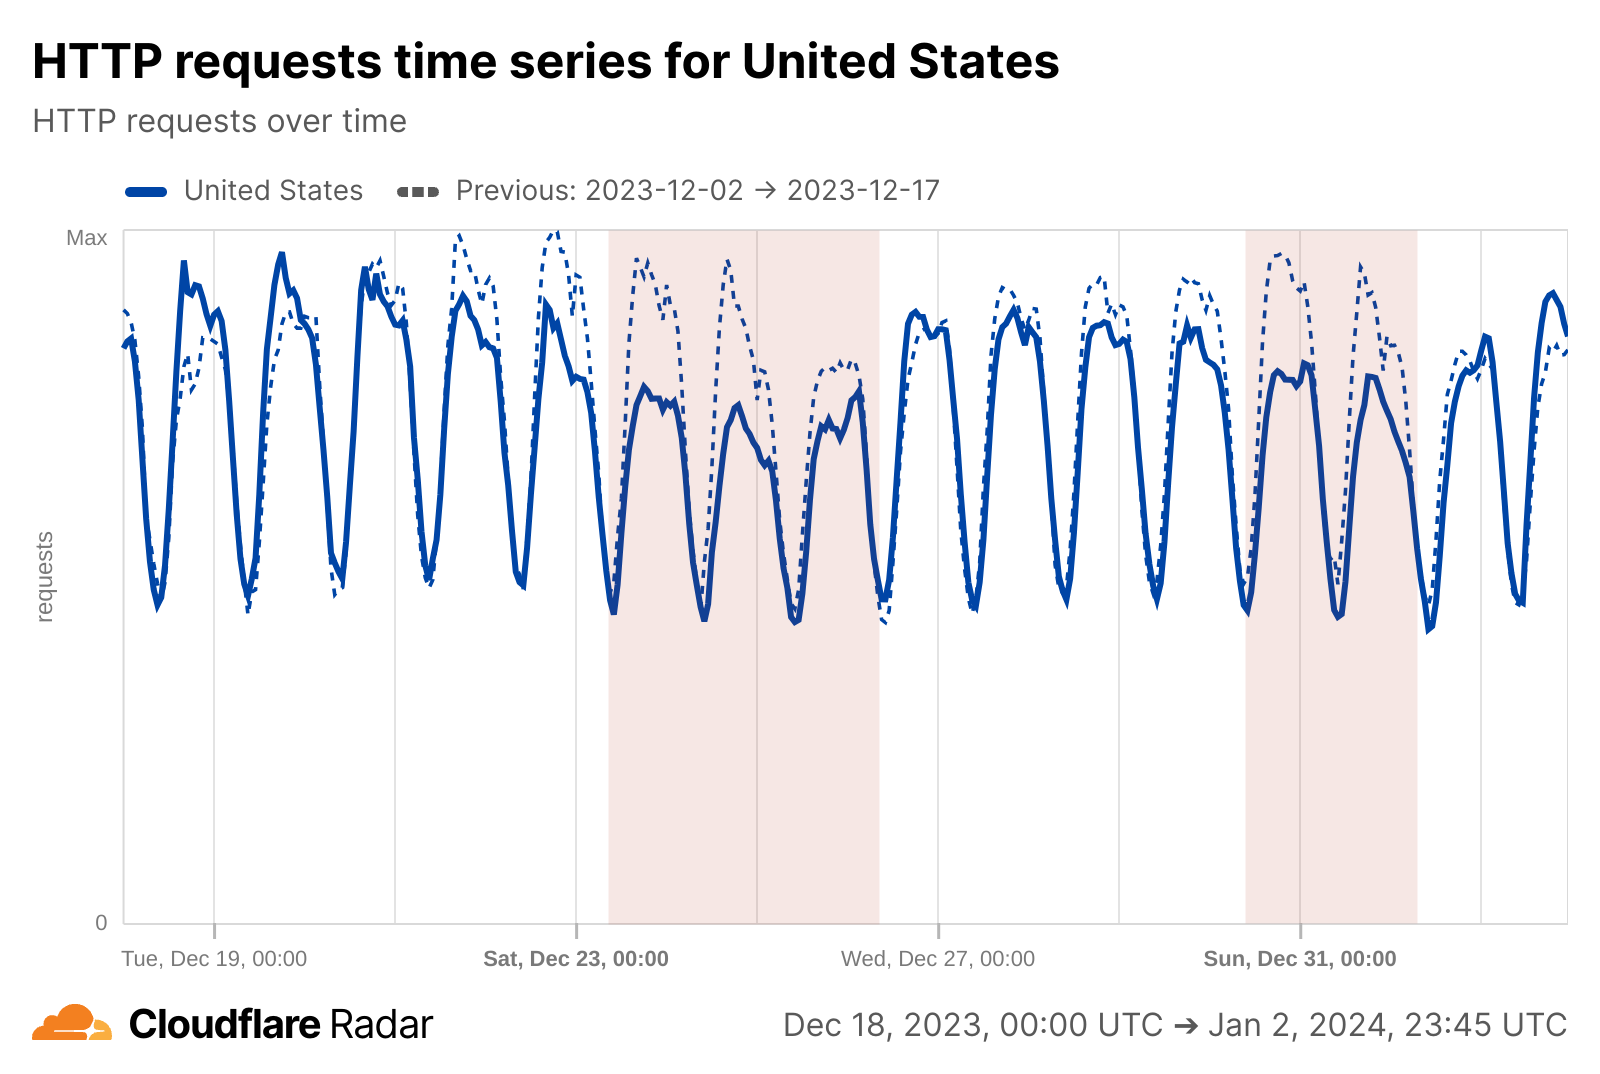
As an example, here’s the US perspective from Cloudflare Radar Data Explorer, where the drop in traffic during Christmas and New Year 2023 is evident:
Where Christmas isn’t central
Not every country’s December revolves around Christmas. In Israel, for example, Hanukkah’s timing changes year to year, influencing when people log off. In 2023, Hanukkah started on December 7, leading to an 8% traffic drop that day and 7% on the following days through December 10. Interestingly, in some years like 2024, Hanukkah begins closer to December 25, potentially overlapping with Western Christmas.
Countries where Christmas didn’t have a clear impact
Turkey
#1 December 31 (-18%)
#2 December 29
#3 December 30
Israel
#1 December 29
#2 January 5
#3 December 30
Japan
#1 December 31 (-8%)
#2 January 1
#3 December 30 — December 24 with -3%
Vietnam
#1 January 1 (-7%)
#2 December 31 (-3%)
#3 January 2
Russia
#1 December31 (-23%)
#2 January 1 (-15%)
#3 December 30
Singapore
#1 December 16
#2 December 17
#3 December 18
India
#1 December 17
#2 December 16
#3 December 24
Bangladesh
#1 December 15
#2 December 16
#3 December 18
Saudi Arabia
#1 January 5
#2 January 6
#3 January 8
China
#1 December 19
#2 December 15
#3 December 18
Now, let’s focus on a more granular perspective of these trends, showing the impact of Christmas dinners and lunches, and also New Year’s Eve drops in traffic.
Note: Unless otherwise noted, all times used in this blog post are local ones; in countries with several timezones, we’re using the timezone where more people live (for the US, Eastern time is used).
A more granular perspective of Christmas: offline feasts and morning quiet
Europe
In Europe, Christmas traditions dominate, leading to the most significant Internet traffic drops. Christmas Eve dinner is a near-universal offline moment, with countries like Spain (-70% at 21:45), Portugal (-70% at 20:30), and Denmark (-68% at 19:45) experiencing the steepest declines. On Christmas Day, mornings are quieter as people relax or attend religious services, while festive lunches drive further drops, with traffic down 43% at 13:45 in Portugal and 44% at 07:15 in France.
By Boxing Day (December 26), digital activity rebounds as people return online for sales or socializing. For instance, the UK shows a 16% increase at 13:00, while Canada records a 19% rise at 08:15. In Australia, traffic climbs by 20% at 09:30, illustrating regional differences in how the day is celebrated.
Americas
In the Americas, holiday patterns reflect a mix of cultural traditions. In the United States, Christmas Eve traffic drops by 29% at 20:15, aligning with evening family gatherings, and Christmas Day sees a 32% decline at 09:15, reflecting quieter mornings.
In Latin America, Christmas Eve (Nochebuena) takes center stage, with significant traffic declines aligning with late-night traditions like the Midnight Toast (in Argentina, the late-night feast is quite popular) and Misa de Gallo (Midnight Mass). For example:
Colombia: -48% at 21:45
Argentina: -58% at 22:00; -67% at midnight
Chile: -64% at 22:45
Mexico: -50% at 21:45
Brazil: -22% at 21:45
These late-night traffic dips highlight the region’s emphasis on midnight celebrations, family feasts, and religious observances.
Asia Pacific
Asian locations influenced by Western traditions, such as the Philippines and Hong Kong, experience moderate Christmas dips but shift focus to New Year’s celebrations — more on NYE below.
In the Southern Hemisphere, Australia and New Zealand experience their steepest traffic drops during Christmas lunch, with Australia seeing a 43% decrease at 13:45 and New Zealand recording a 42% decline.
Middle East and Africa
In regions less influenced by Christmas, holiday traffic patterns vary significantly. For example, Nigeria sees a 26% drop at lunchtime on Christmas Day, while South Africa records a 37% decline at 14:15, reflecting offline family gatherings.
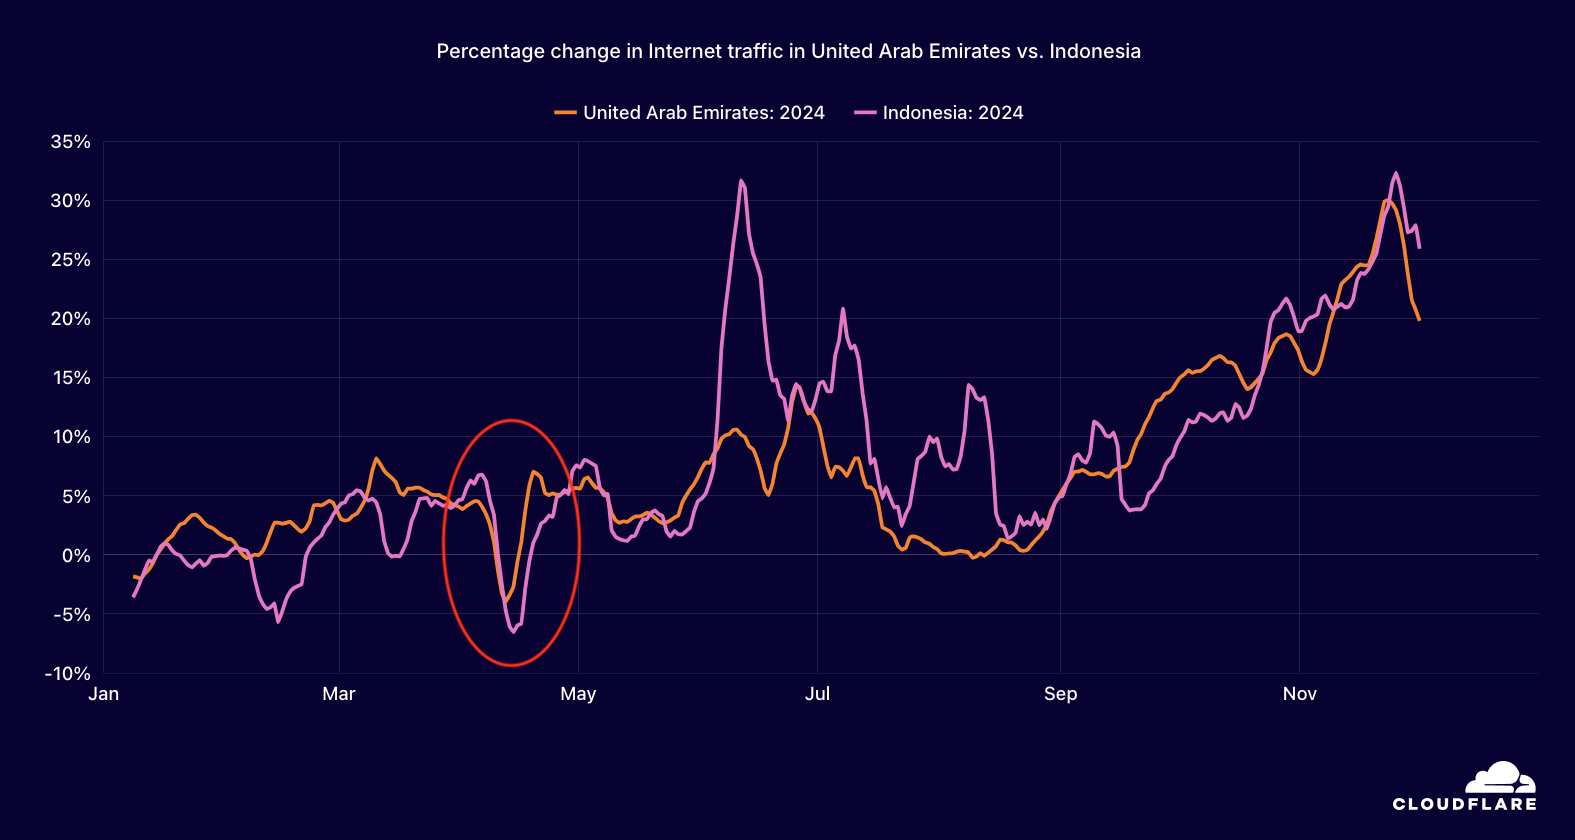
In predominantly non-Christian countries like Egypt and Saudi Arabia, December 24-25 does not show significant dips; instead, other cultural holidays drive offline moments. For example, as we’ve noted, Israel experienced up to an 8% drop in 2023 during Hanukkah, particularly in the first four days after December 7. In previous blog posts, we have shown how events like Ramadan clearly impact Internet traffic in countries with large Muslim populations. One example from our Year in Review 2024 highlights Indonesia and the United Arab Emirates, where traffic dropped during Eid al-Fitr, the festival marking the end of Ramadan (April 9-10, 2024).
The Boxing Day revival
Boxing Day on December 26 marks a significant digital rebound in countries like the UK, Canada, Australia (where there is a higher increase from the previous week, with daily traffic growing 9%), and New Zealand, as people return online after the Christmas break. Traditionally associated with charitable activities, family gatherings, and shopping, the day sees traffic spikes across these regions:
Location
December 26 increase in daily traffic
Higher traffic increase on December 26
Australia
+9%
December 26; 09:30: +20%
United Kingdom
+2%
December 26; 13:00: +16%
Canada
+1%
December 26, 08:15: +19%
Here is the list of locations that saw a clear drop in traffic on Christmas Eve or Christmas Day morning or lunch. We selected the time (morning or lunch) with the bigger drop compared to the previous week for further analysis. The list is ordered by the Christmas Eve dinner drop. Countries like Russia (where Orthodox Christians celebrate Christmas later, on January 7), Japan, China, Indonesia, Turkey, Israel, Thailand, Egypt, Singapore, Vietnam, and Bangladesh showed no impact during Christmas Eve dinner or Christmas Day morning or lunch.
Location
Christmas Eve Dinner Drop
Christmas Day Morning/Lunch Drop
Spain
-70% at 21:45
-51% at 08:00 (morning)
Portugal
-70% at 20:30
-43% at 13:45 (lunch)
Denmark
-68% at 19:45
-43% at 06:15 (morning)
Chile
-64% at 22:45; (-65% at 00:00, December 25)
-49% at 09:00 (morning)
Norway
-63% at 18:45
-50% at 06:45 (morning)
Czech Republic
-60% at 18:15
-43% at 06:30 (morning)
Poland
-59% at 17:15
-51% at 07:15 (morning)
Argentina
-58% at 22:00 (-67% at 00:00, December 25)
-52% at 09:00 (morning)
Italy
-55% at 21:15
-44% at 07:00 (morning)
France
-55% at 20:45
-44% at 07:15 (morning)
Mexico
-50% at 21:45
-38% at 08:15 (morning)
Belgium
-50% at 20:15
-46% at 07:15 (morning)
Switzerland
-50% at 19:45
-46% at 06:30 (morning)
Austria
-50% at 19:15
-42% at 06:15 (morning)
Nigeria
-49% at 18:00
-26% at 12:30 (lunch)
Colombia
-48% at 21:45
-49% at 08:00 (morning)
Germany
-47% at 19:15
-36% at 07:15 (morning)
Sweden
-47% at 16:30
-36% at 07:00 (morning)
Finland
-42% at 17:45
-42% at 08:00 (morning)
Ireland
-40% at 18:15
-36% at 15:15 (lunch)
South Africa
-37% at 19:00
-37% at 14:15 (lunch)
Romania
-34% at 20:45
-34% at 06:30 (morning)
United Kingdom
-34% at 18:00
-38% at 14:45 (lunch)
Canada
-32% at 20:30
-31% at 09:30 (morning)
Netherlands
-30% at 20:45
-35% at 06:45 (morning)
United States
-29% at 20:15
-32% at 09:15 (morning)
Australia
-23% at 20:45
-43% at 13:45 (lunch)
New Zealand
-23% at 18:30
-42% at 13:15 (lunch)
Brazil
-22% at 21:45
-42% at 08:00 (morning)
Philippines
-22% at 21:30
-29% at 06:45 (morning)
New Year’s Eve: A planetary offline moment
Midnight, December 31 is a shared offline moment worldwide, as people step away from their screens to celebrate. To provide a more accurate assessment of New Year’s Eve’s impact, we compare traffic at 00:00 on January 1 with 00:00 on December 18, avoiding distortions caused by Christmas-related patterns. This approach highlights the distinct drop in Internet activity due to New Year’s celebrations.
Across Europe, countries like Portugal (-60%) and Romania (-60%) see dramatic traffic drops, reflecting widespread offline gatherings. Spain (-56%) and Germany (-49%) also experience steep declines, emphasizing the importance of this tradition across the region. Even Northern Europe mirrors this trend, with Denmark (-41%), Norway (-39%), and Sweden (-29%) showing significant dips.
In the Americas, this offline moment is particularly pronounced in Latin America, where family and communal gatherings dominate. Argentina (-66%) and Chile (-74%) lead the region, with Brazil (-46%) and Colombia (-44%) following closely. In North America, the impact is less dramatic due to time zone variations — in this case, with millions of people spread out in distinct time zones. Canada records a 14% drop, and the United States shows a modest 12% decline compared to December 18.
In Asia and the Pacific, New Year’s Eve celebrations heavily influence Internet trends. Thailand saw a 31% drop, Indonesia 23%, and Japan 16%, also reflecting this region’s focus on communal gatherings and celebrations. Australia (-21%) and New Zealand (-11%), among the first countries to welcome the New Year, also show noticeable declines as midnight festivities take center stage.
In the Middle East and Africa, Turkey (-23%), South Africa (-32%), and Nigeria (-15%) exhibit significant offline engagement at midnight. Israel records a smaller but notable 6% dip before midnight, reflecting localized variations in celebration styles.
Of course, this offline intermission doesn’t last long. After a few hours, people return to their devices. France sees a 37% surge at 3:15 on January 1, while Turkey experiences a 36% upswing in the early hours.
Next, we present the list of locations with clear drops in traffic at midnight on New Year’s Eve, compared to December 18, ordered by percentage of drop.
Locations
January 1, 00:00 drop compared to December 18
Locations
January 1, 00:00 drop compared to December 18
Chile
-74%
Thailand
-31%
Argentina
-66%
Italy
-30%
Romania
-60%
Sweden
-29%
Portugal
-60%
Vietnam
-27%
Spain
-56%
United Kingdom
-25%
Germany
-49%
Ukraine
-25%
Brazil
-46%
Indonesia
-23%
Mexico
-44%
Turkey
-23%
Colombia
-44%
Australia
-21%
Philippines
-43%
Hong Kong
-21%
Netherlands
-42%
Ireland
-19%
Poland
-41%
France
-17%
Denmark
-41%
Japan
-16%
Austria
-40%
South Korea
-16%
Switzerland
-39%
Nigeria
-15%
Norway
-39%
Canada
-14%
Czech Republic
-33%
Finland
-14%
Russia
-32%
Singapore
-13%
Belgium
-32%
United States
-12%
South Africa
-32%
China
-12%
Conclusion: A mosaic of traditions and digital habits
What emerges from these patterns is a rich tapestry of cultural habits. While Christmas Eve and Day are central offline moments in Europe and the Americas, other regions mark their quiet days on different dates, shaped by unique holidays and customs. The insights from 50 countries and regions confirm how cultural traditions guide when people step away from screens.
As the Gregorian calendar year comes to a close, the universal appeal of stepping offline becomes clear. Whether raising glasses at the stroke of midnight, exchanging greetings, or lighting candles for festivals like Hanukkah, these moments remind us that while the Internet connects billions, cultural rhythms still shape our relationship with technology. Whether feasting with loved ones or counting down to a new year, humans everywhere find reasons to unplug — if only for a moment.
The 2024 Cloudflare Radar Year in Review is our fifth annual review of Internet trends and patterns observed throughout the year at both a global and country/region level across a variety of metrics. In this year’s review, we have added several new traffic, adoption, connectivity, and email security metrics, as well as the ability to do year-over-year and geographic comparisons for selected metrics.
Below, we present a summary of key findings, and then explore them in more detail in subsequent sections.
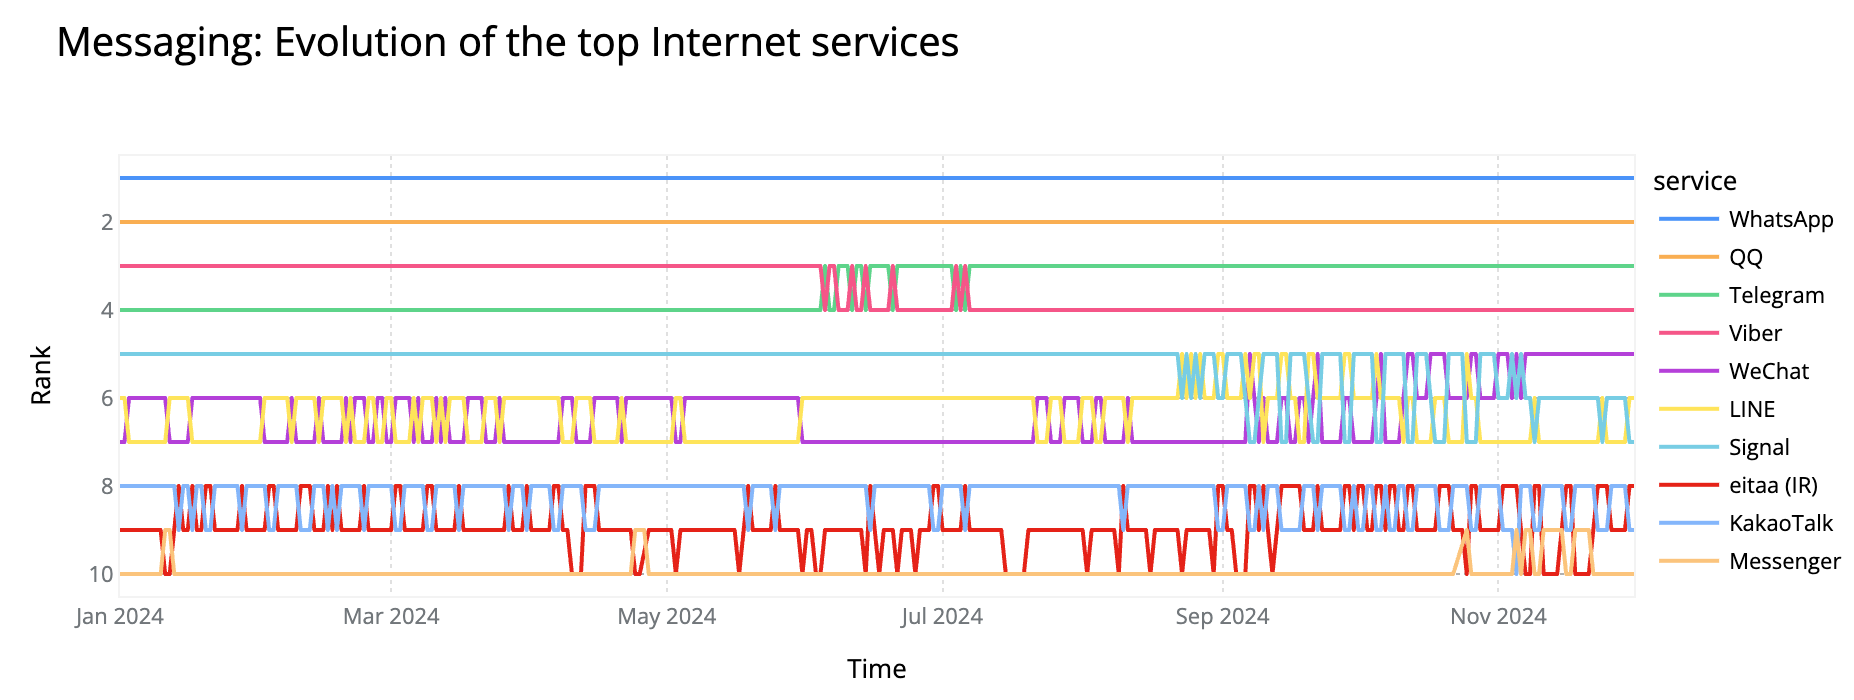
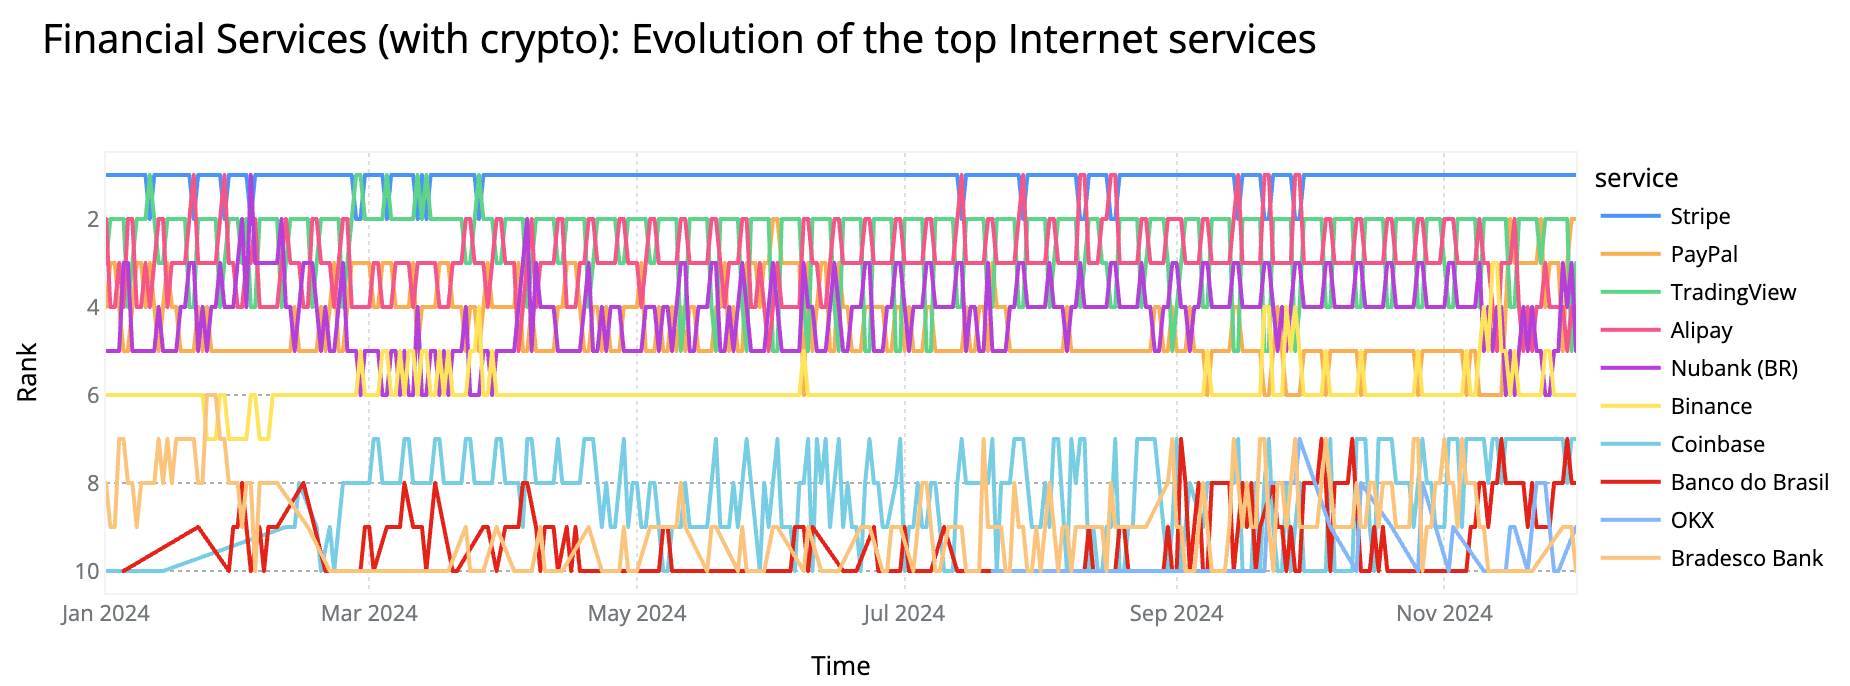
Google maintained its position as the most popular Internet service overall. OpenAI remained at the top of the Generative AI category. Binance remained at the top of the Cryptocurrency category. WhatsApp remained the top Messaging platform, and Facebook remained the top Social Media site. 🔗
Global traffic from Starlink grew 3.3x in 2024, in line with last year’s growth rate. After initiating service in Malawi in July 2023, Starlink traffic from that country grew 38x in 2024. As Starlink added new markets, we saw traffic grow rapidly in those locations. 🔗
Googlebot, Google’s web crawler, was responsible for the highest volume of request traffic to Cloudflare in 2024, as it retrieved content from millions of Cloudflare customer sites for search indexing. 🔗
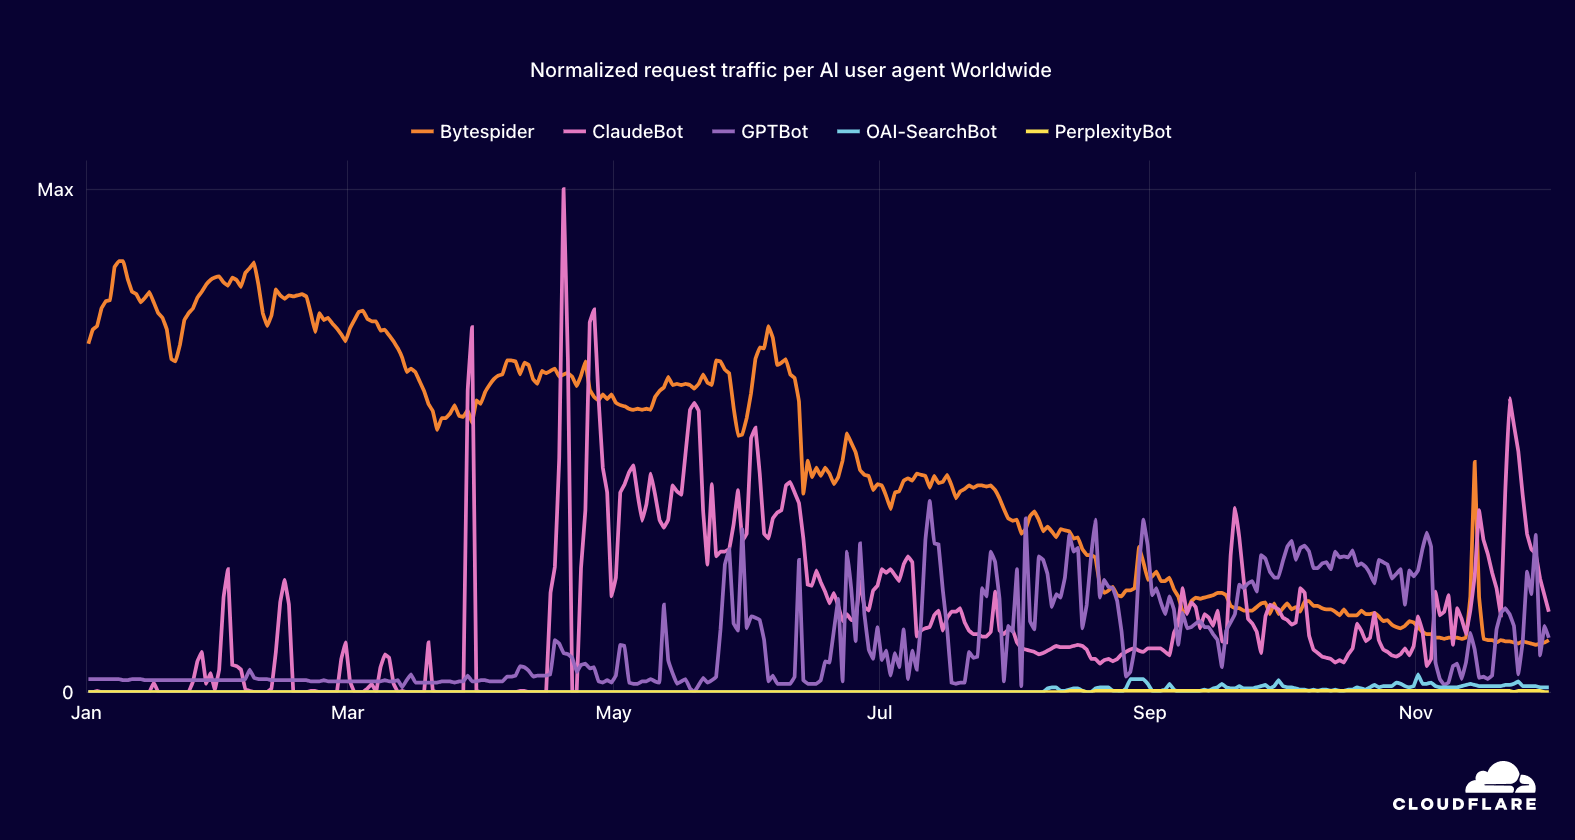
Traffic from ByteDance’s AI crawler (Bytespider) gradually declined over the course of 2024. Anthropic’s AI crawler (ClaudeBot) first started showing signs of ongoing crawling activity in April, then declined after an initial peak in May & June. 🔗
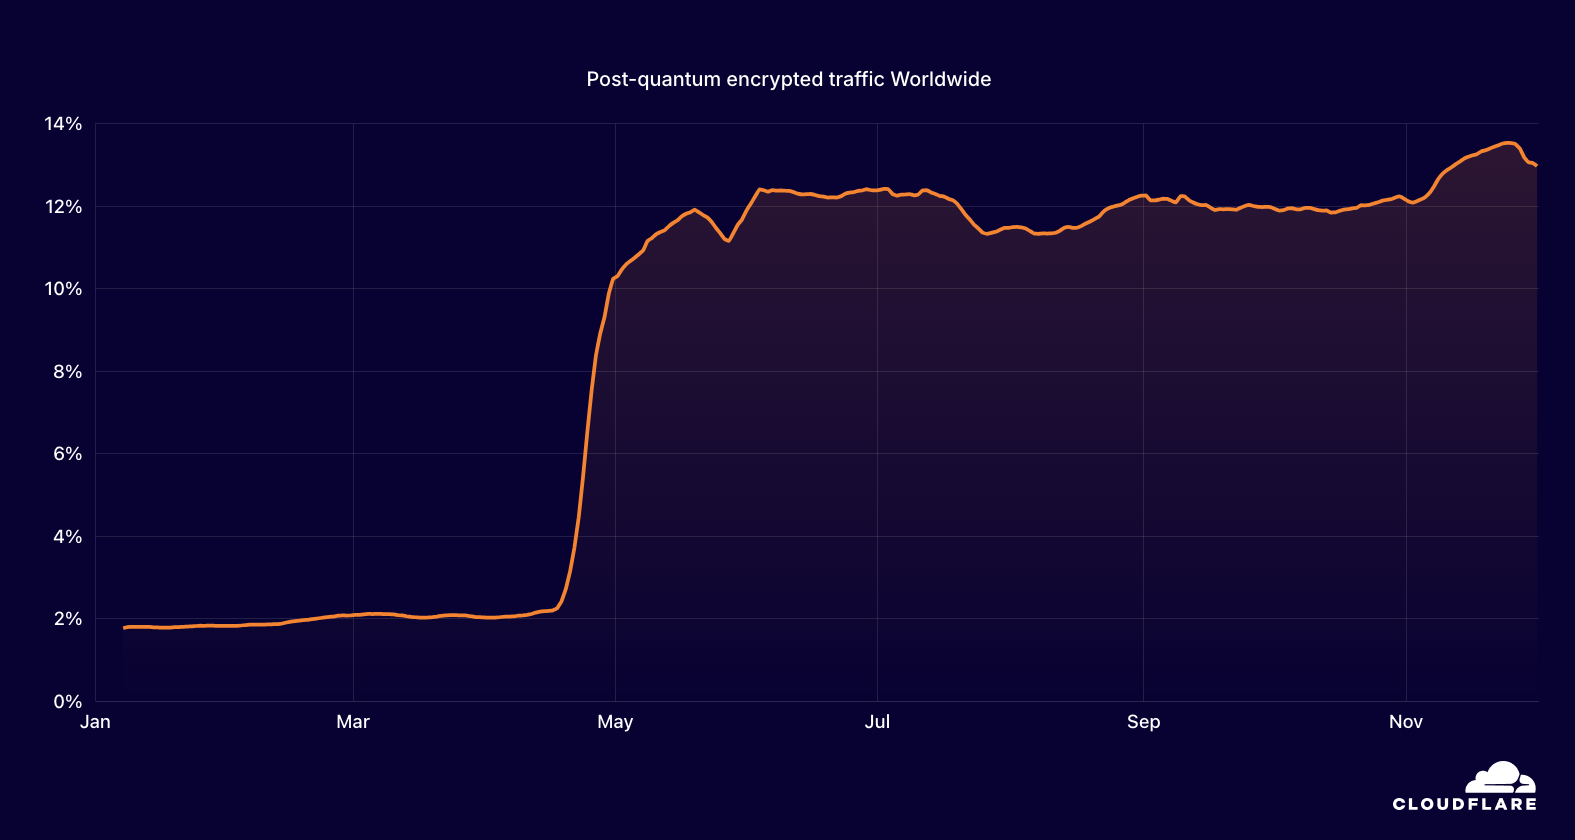
13.0% of TLS 1.3 traffic is using post-quantum encryption. 🔗
Adoption & Usage
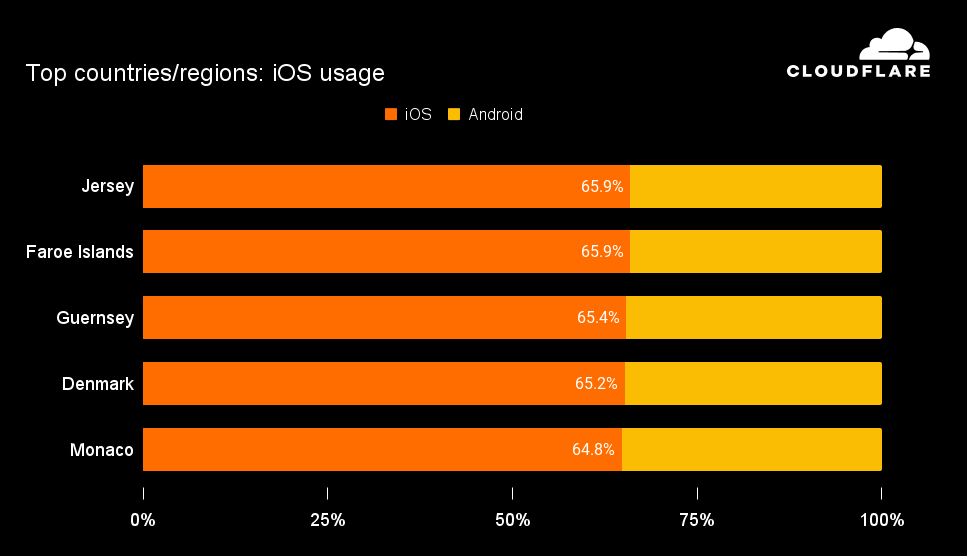
Globally, nearly one-third of mobile device traffic was from Apple iOS devices. Android had a >90% share of mobile device traffic in 29 countries/regions; peak iOS mobile device traffic share was over 60% in eight countries/regions. 🔗
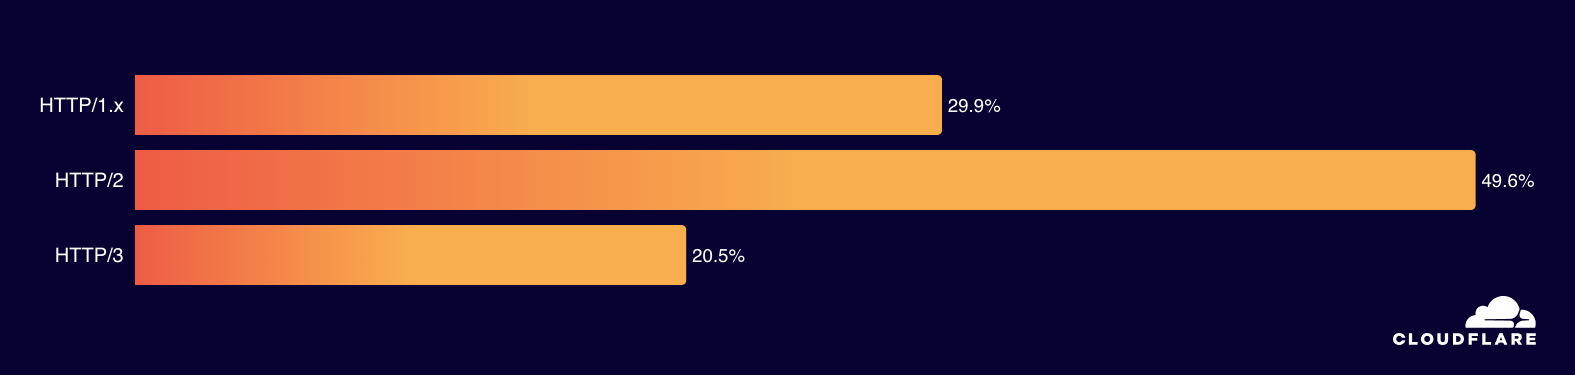
Globally, nearly half of web requests used HTTP/2, with 20.5% using HTTP/3. Usage of both versions was up slightly from 2023. 🔗
React, PHP, and jQuery were among the most popular technologies used to build websites, while HubSpot, Google, and WordPress were among the most popular vendors of supporting services and platforms. 🔗
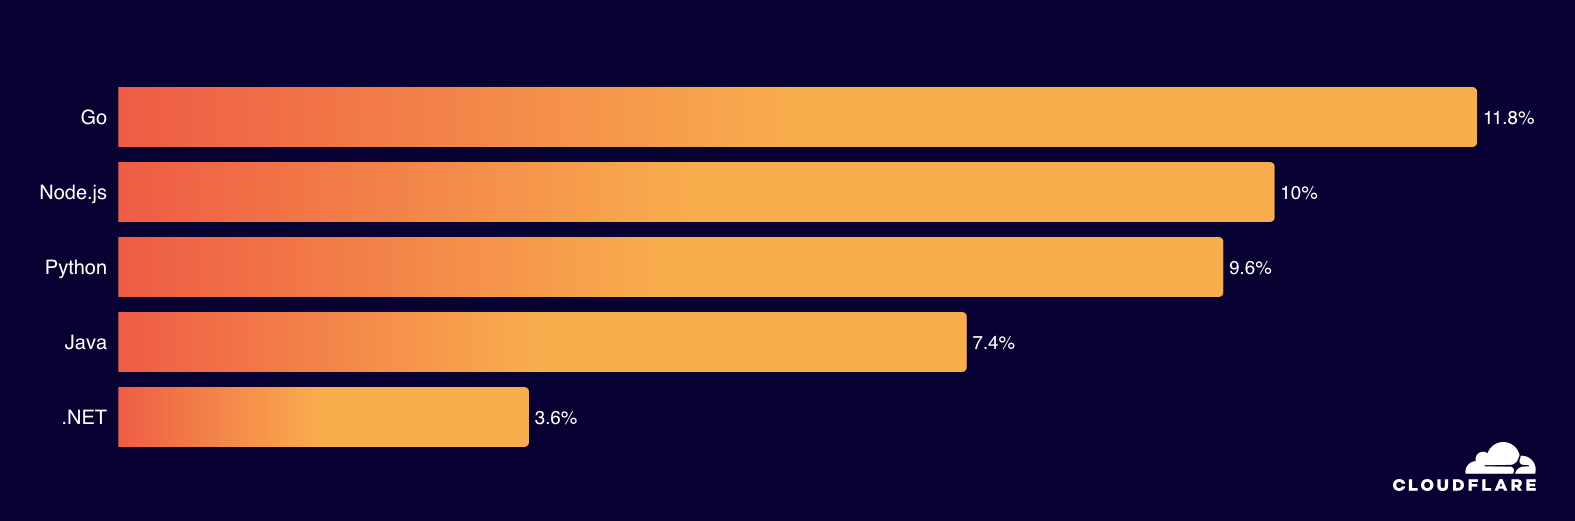
Go surpassed NodeJS as the most popular language used for making automated API requests. 🔗
Google is far and away the most popular search engine globally, across all platforms. On mobile devices and operating systems, Baidu is a distant second. Bing is a distant second across desktop and Windows devices, with DuckDuckGo second most popular on macOS. Shares vary by platform and country/region. 🔗
Google Chrome is far and away the most popular browser overall. While this is also true on macOS devices, Safari usage is well ahead of Chrome on iOS devices. On Windows, Edge is the second most popular browser as it comes preinstalled and is the initial default. 🔗
Connectivity
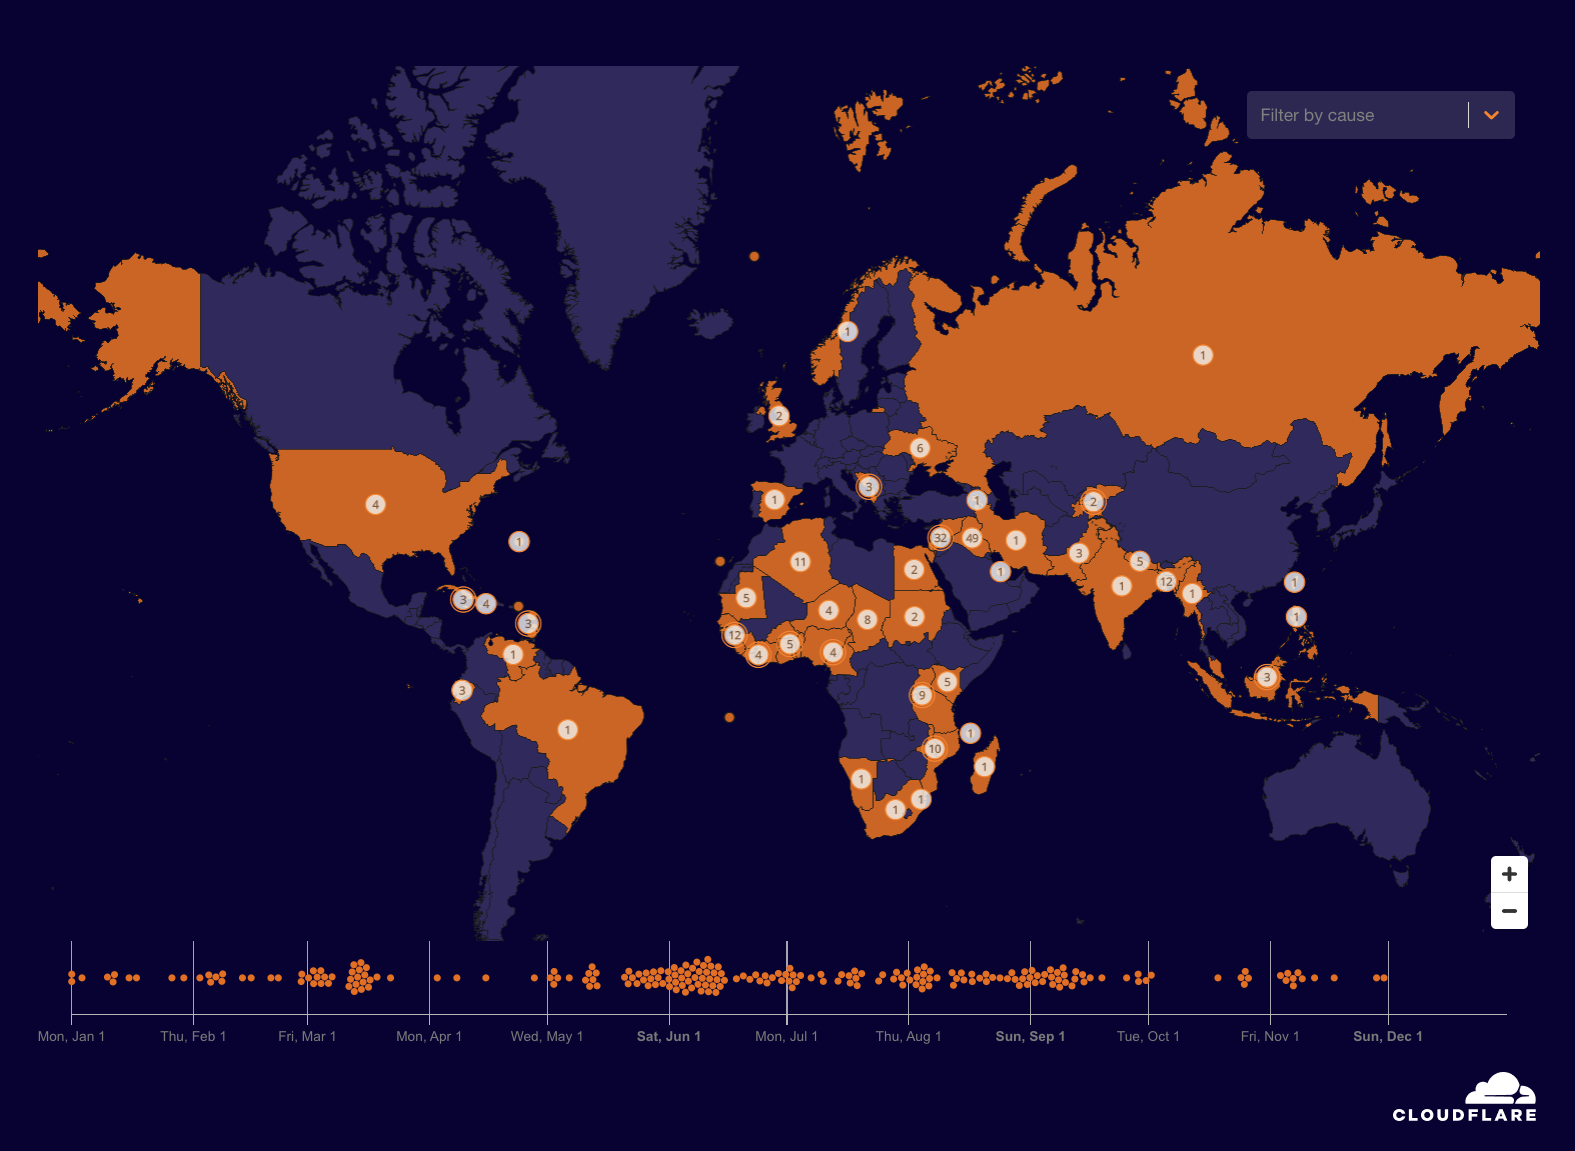
225 major Internet disruptions were observed globally in 2024, with many due to government-directed regional and national shutdowns of Internet connectivity. Cable cuts and power outages were also leading causes. 🔗
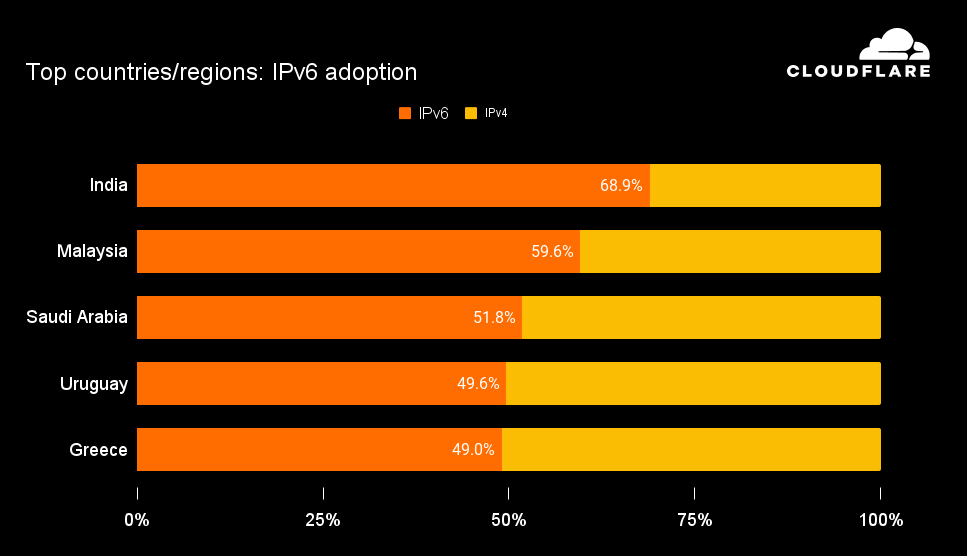
Aggregated across 2024, 28.5% of IPv6-capable requests were made over IPv6. India and Malaysia were the strongest countries, at 68.9% and 59.6% IPv6 adoption respectively. 🔗
The top 10 countries ranked by Internet speed all had average download speeds above 200 Mbps. Spain was consistently among the top locations across the measured Internet quality metrics. 🔗
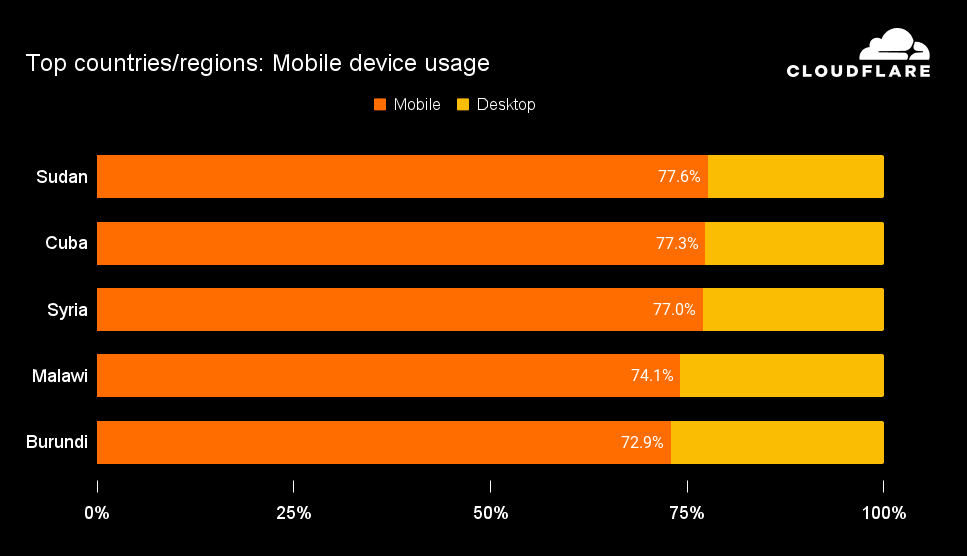
41.3% of global traffic comes from mobile devices. In nearly 100 countries/regions, the majority of traffic comes from mobile devices. 🔗
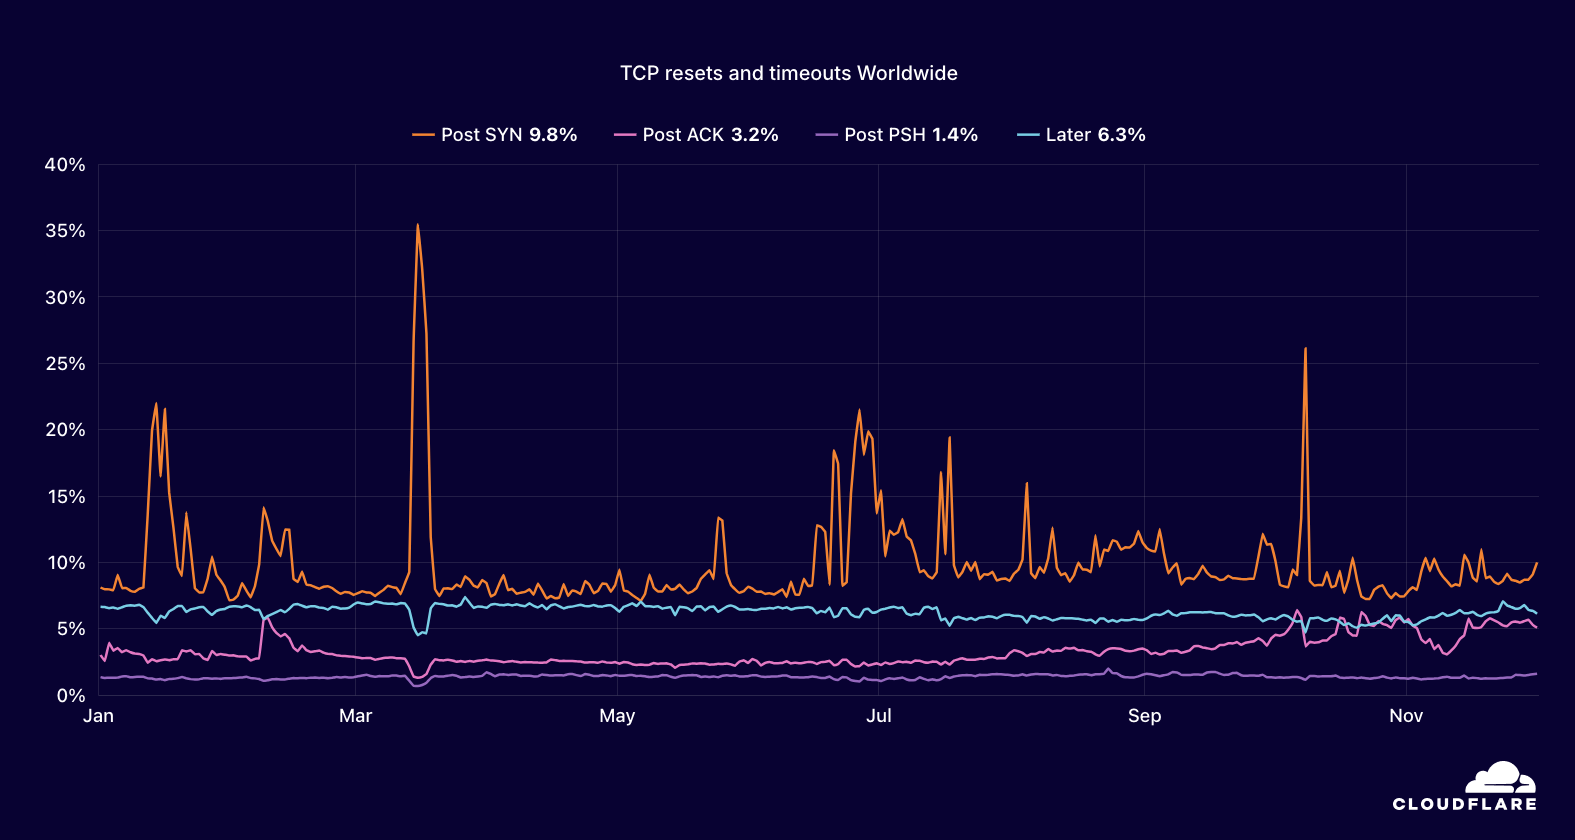
20.7% of TCP connections are unexpectedly terminated before any useful data can be exchanged. 🔗
Security
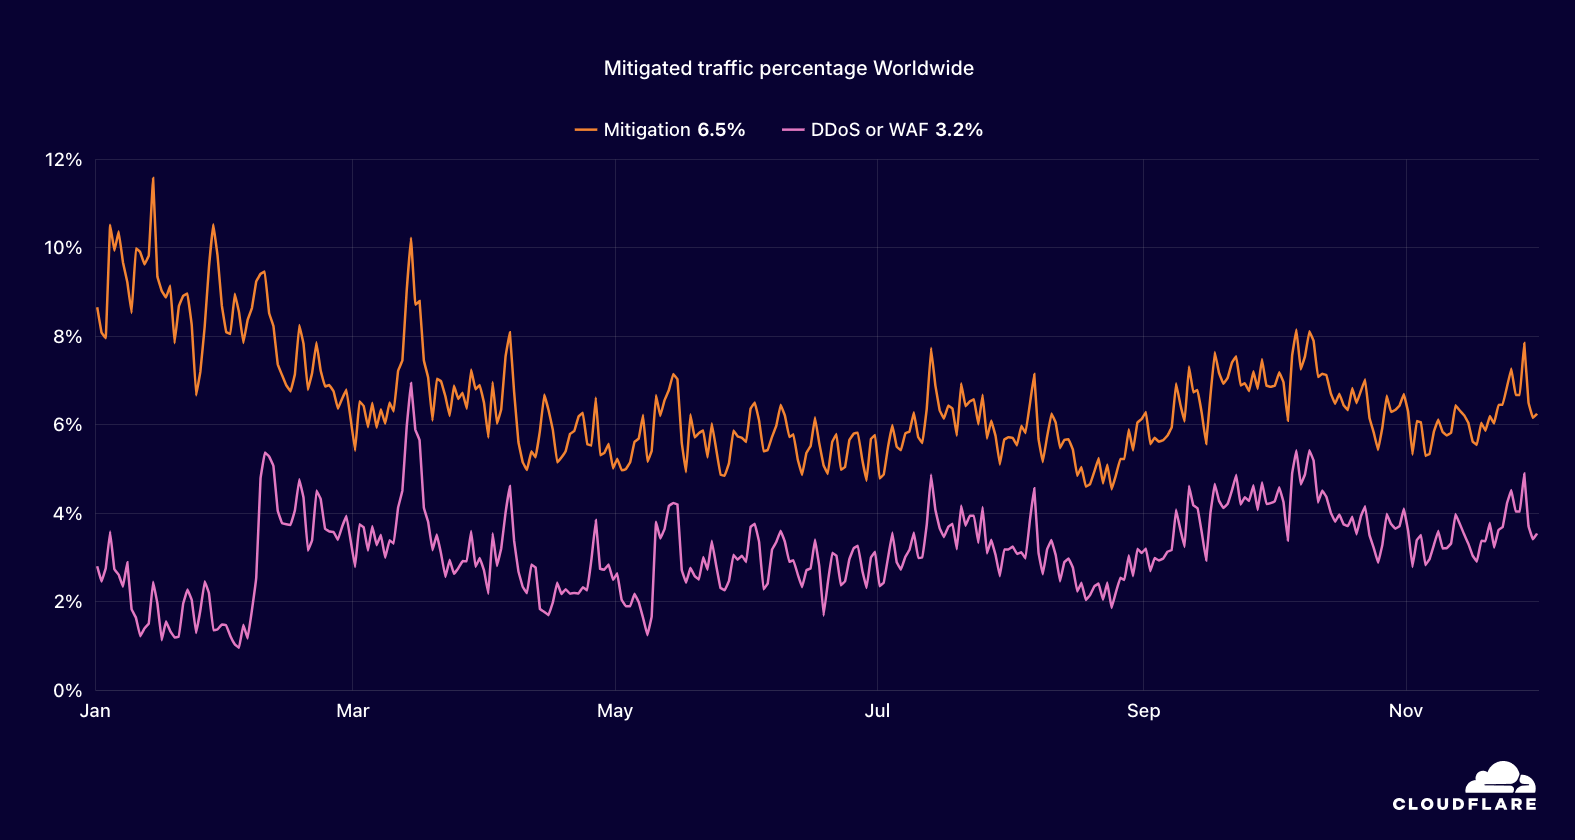
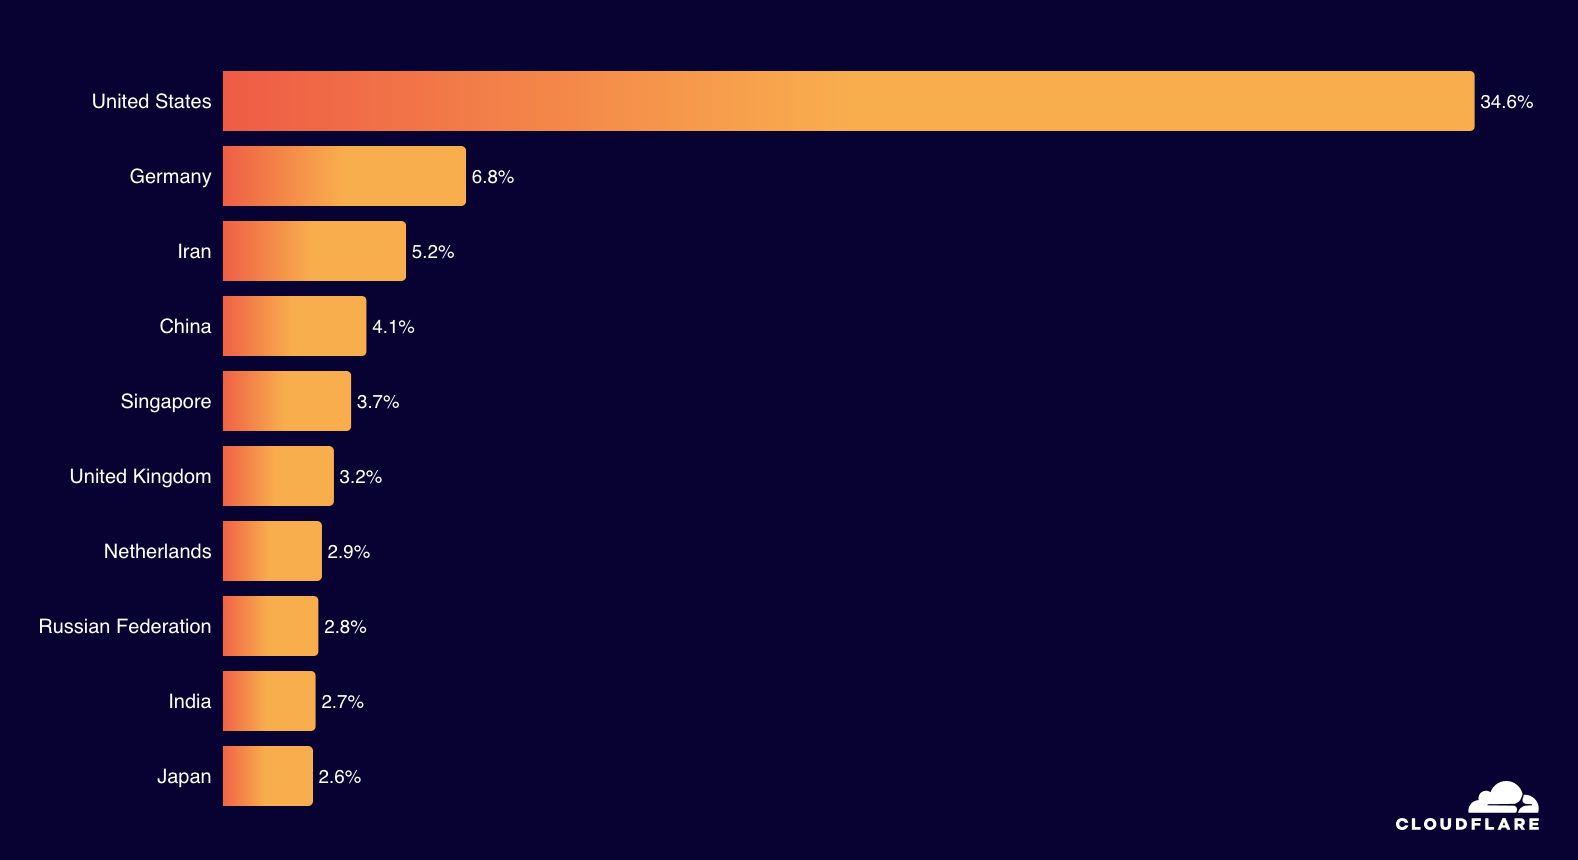
6.5% of global traffic was mitigated by Cloudflare’s systems as being potentially malicious or for customer-defined reasons. In the United States, the share of mitigated traffic grew to 5.1%, while in South Korea, it dropped slightly to 8.1%. In 44 countries/regions, over 10% of traffic was mitigated. 🔗
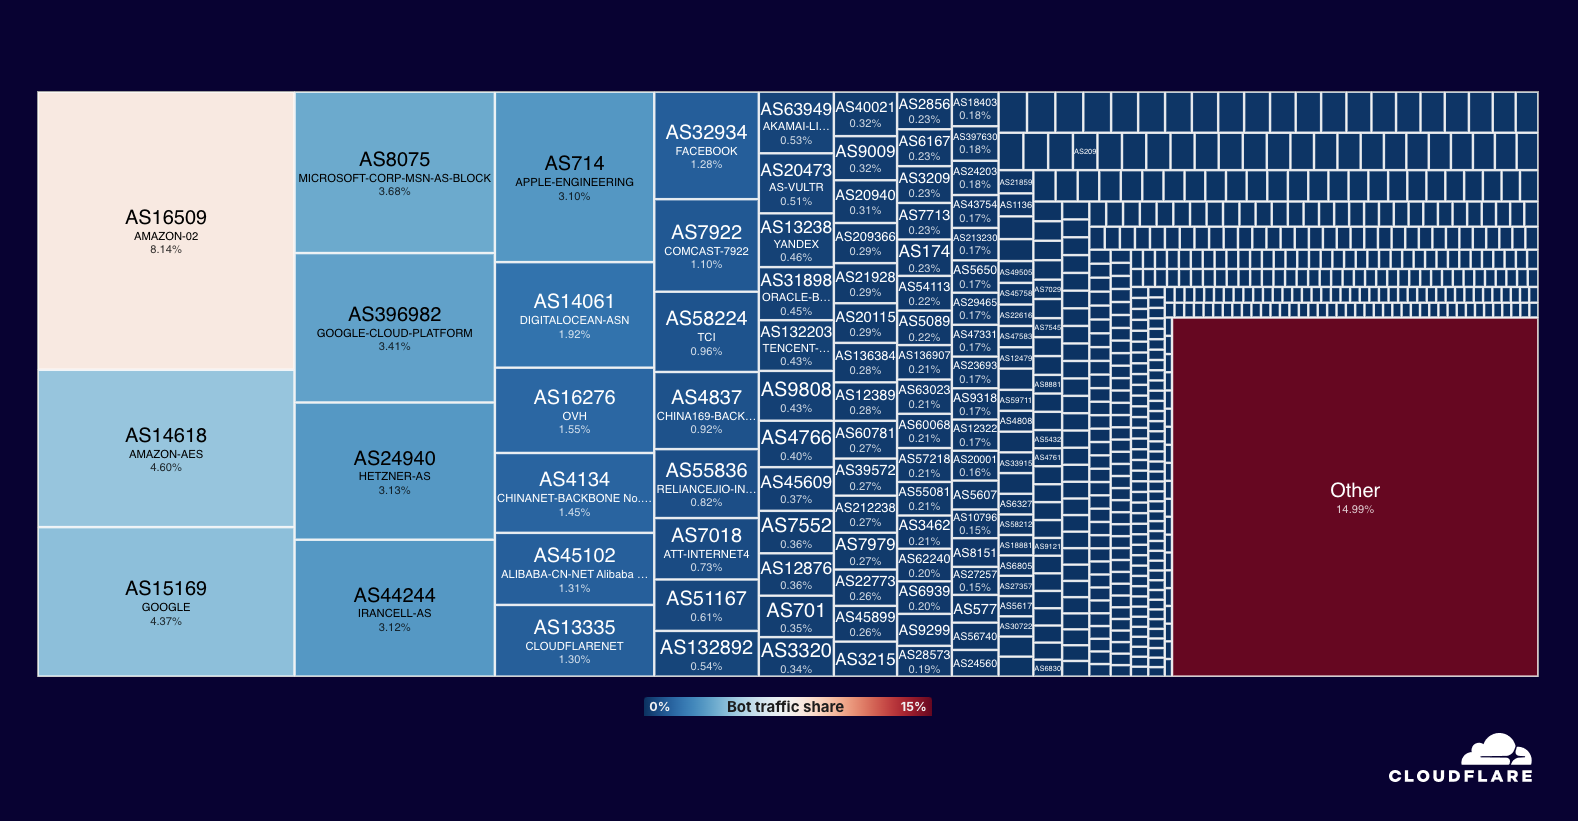
The United States was responsible for over a third of global bot traffic. Amazon Web Services was responsible for 12.7% of global bot traffic, and 7.8% came from Google. 🔗
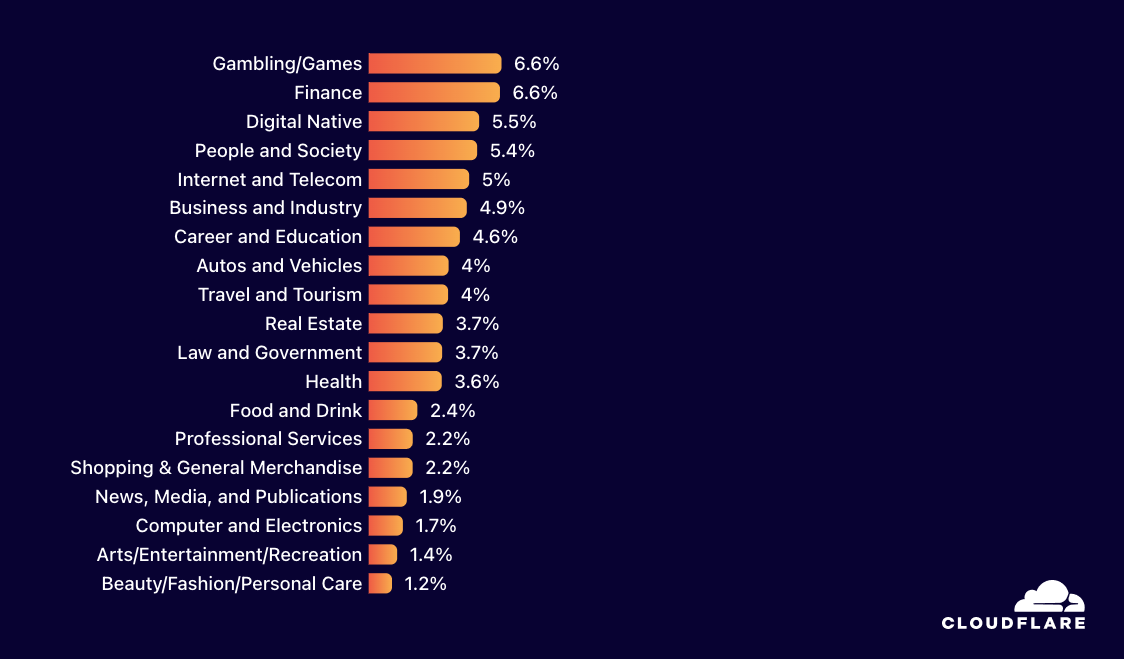
Globally, Gambling/Games was the most attacked industry, slightly ahead of 2023’s most targeted industry, Finance. 🔗
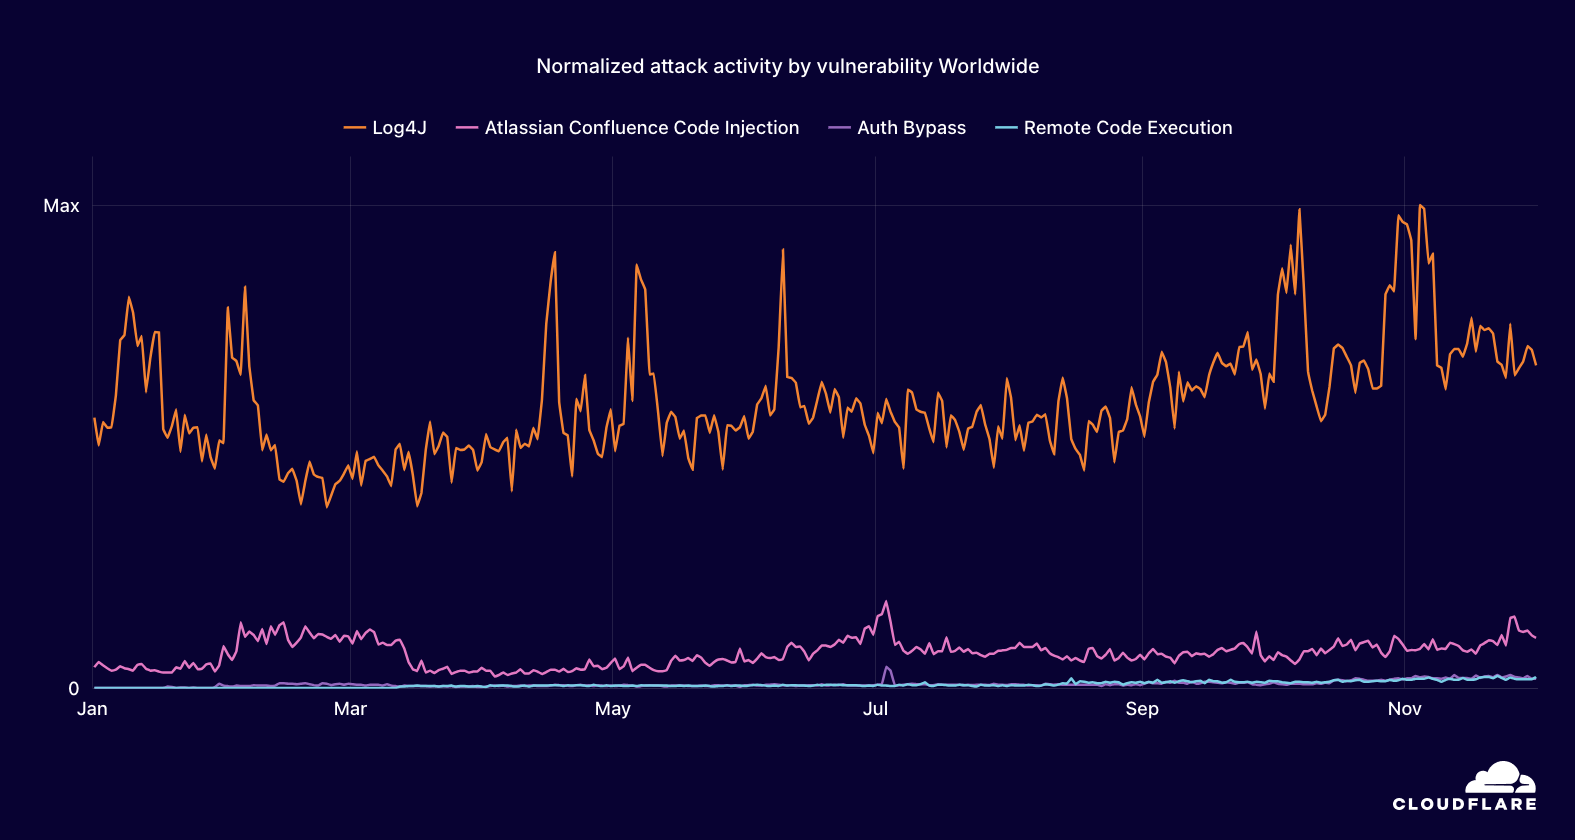
Log4j, a vulnerability discovered in 2021, remains a persistent threat and was actively targeted throughout 2024. 🔗
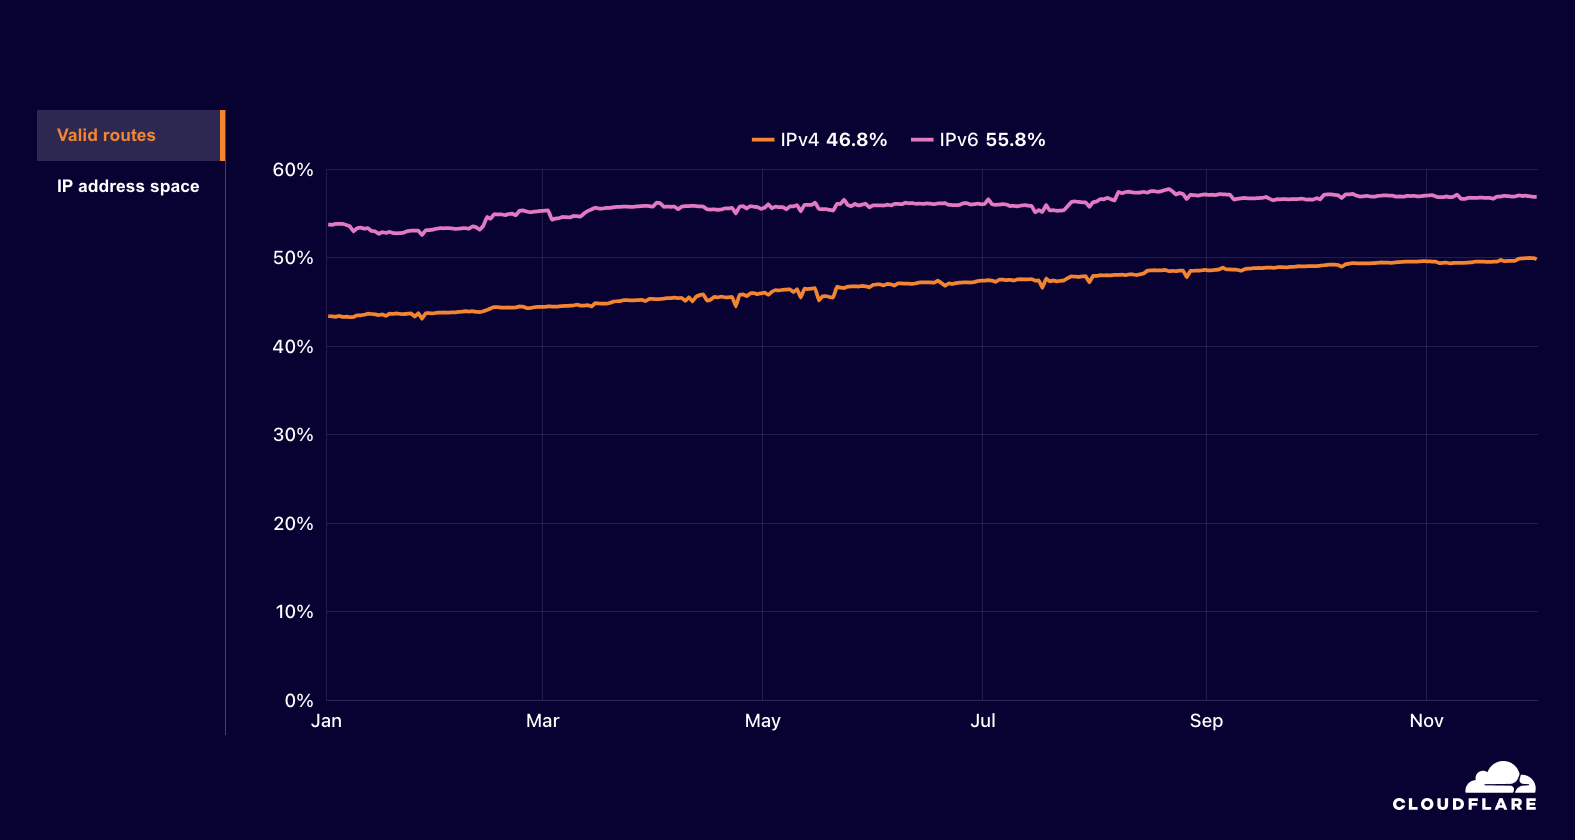
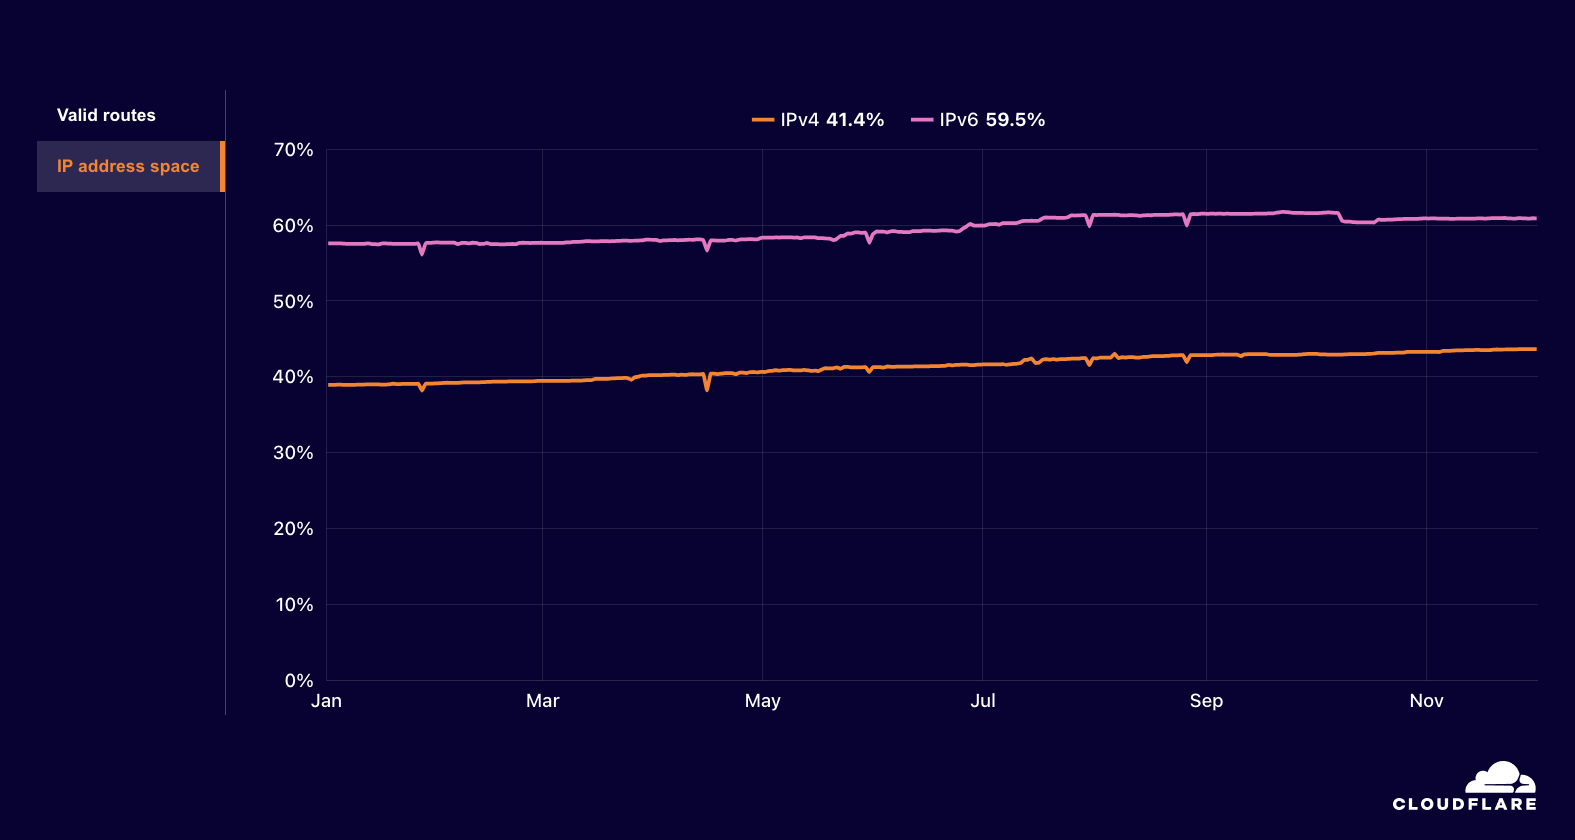
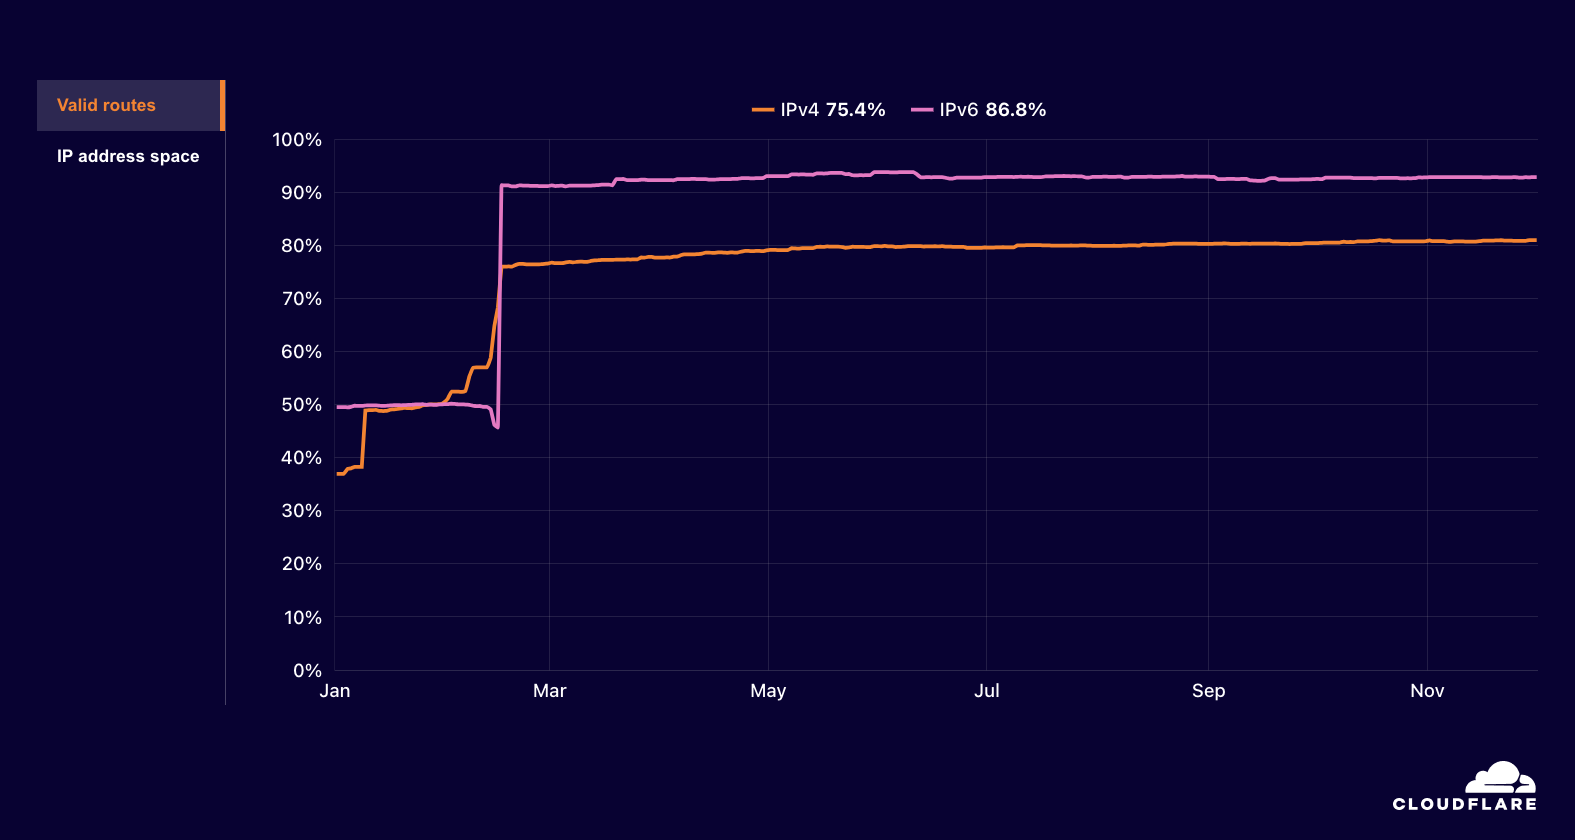
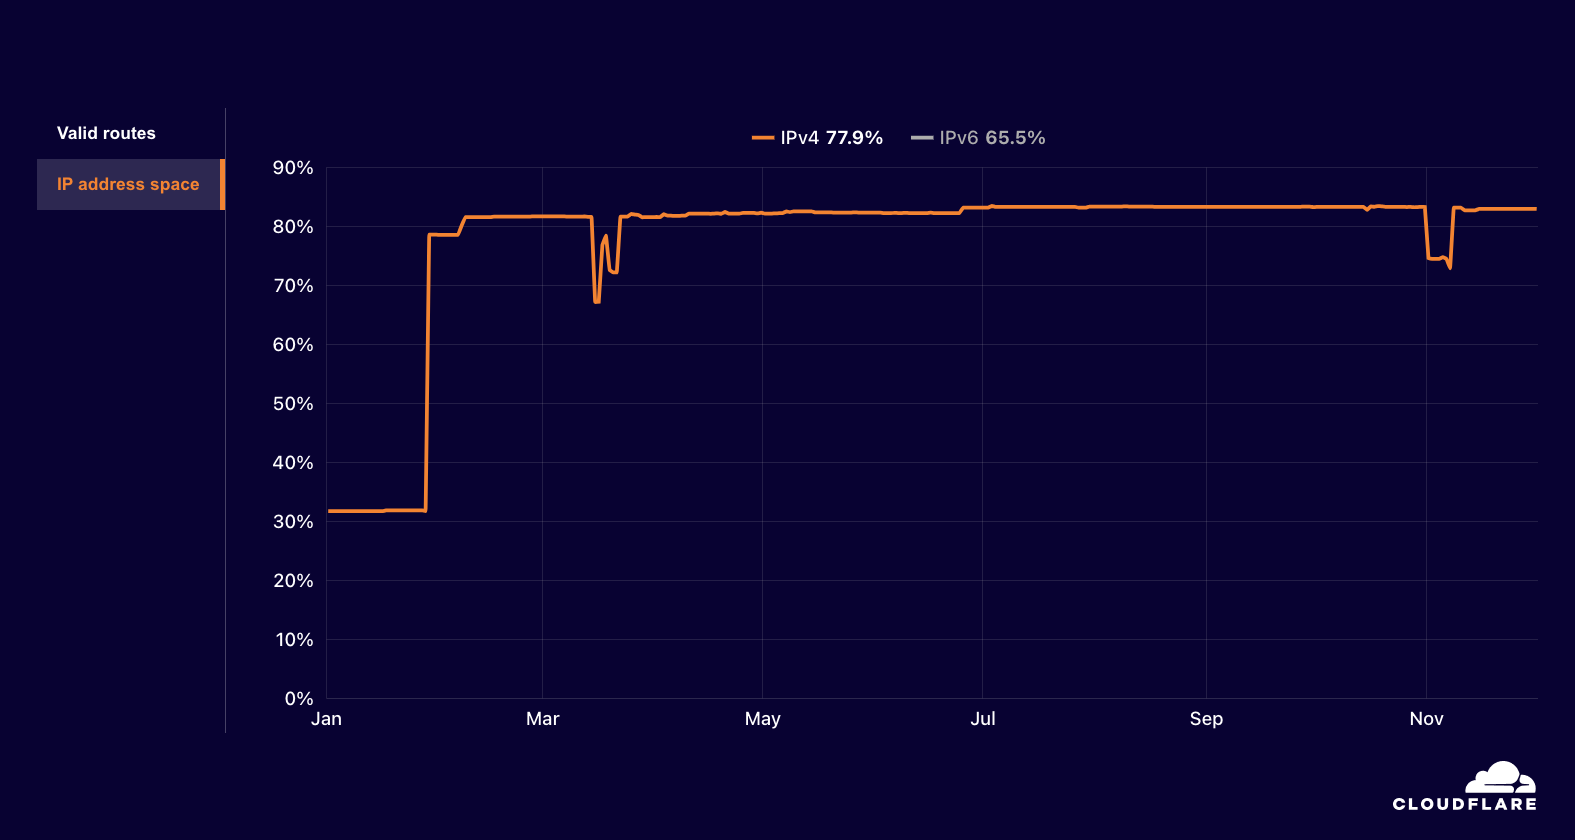
Routing security, measured as the share of RPKI valid routes and the share of covered IP address space, continued to improve globally throughout 2024. We saw a 4.7% increase in RPKI valid IPv4 address space in 2024, and a 6.4% increase in RPKI valid routes in 2024. 🔗
Email Security
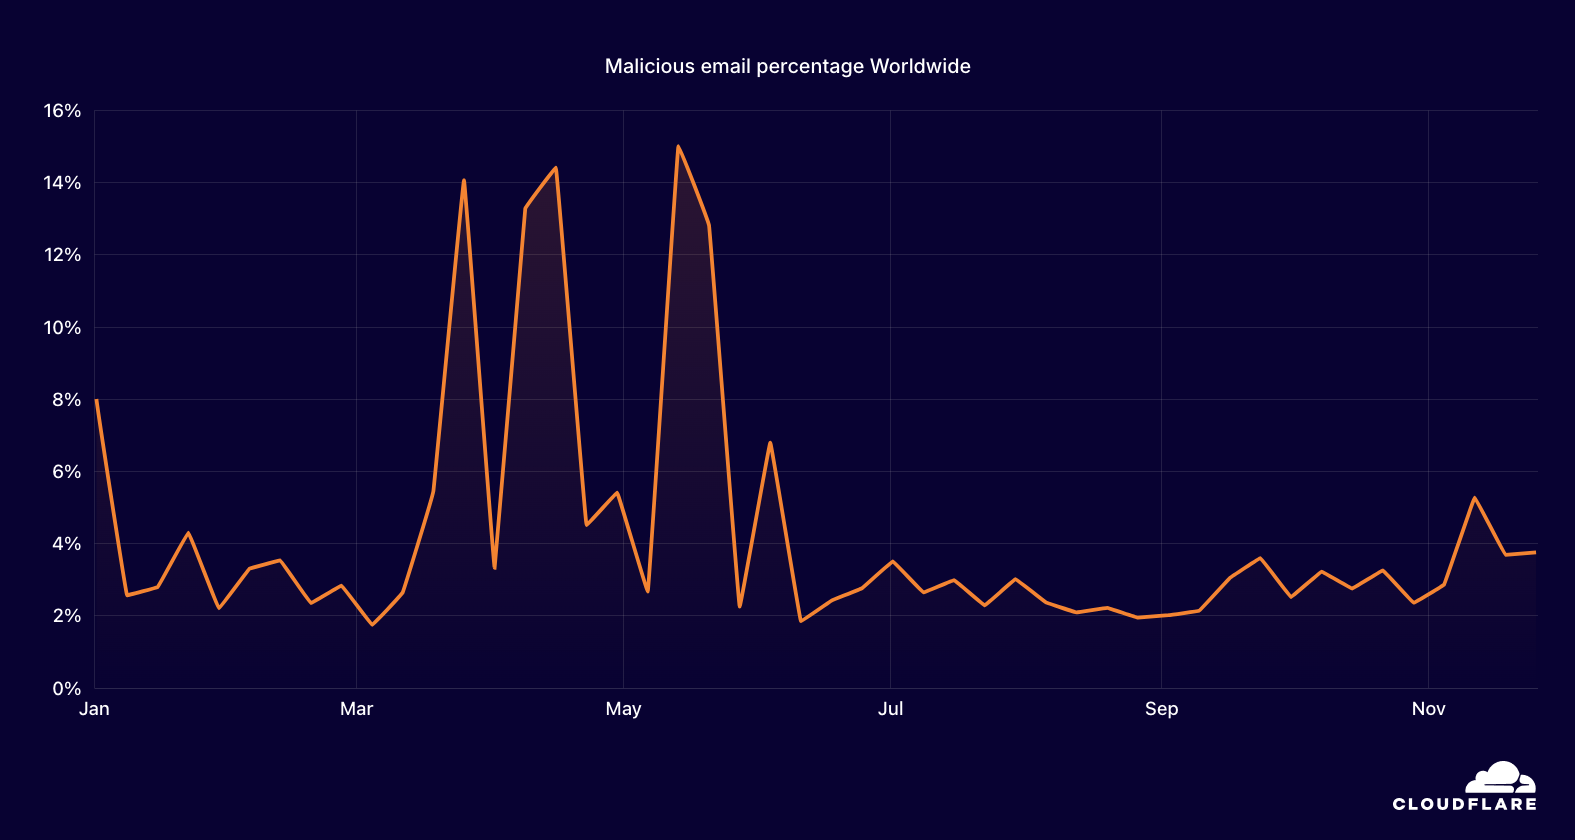
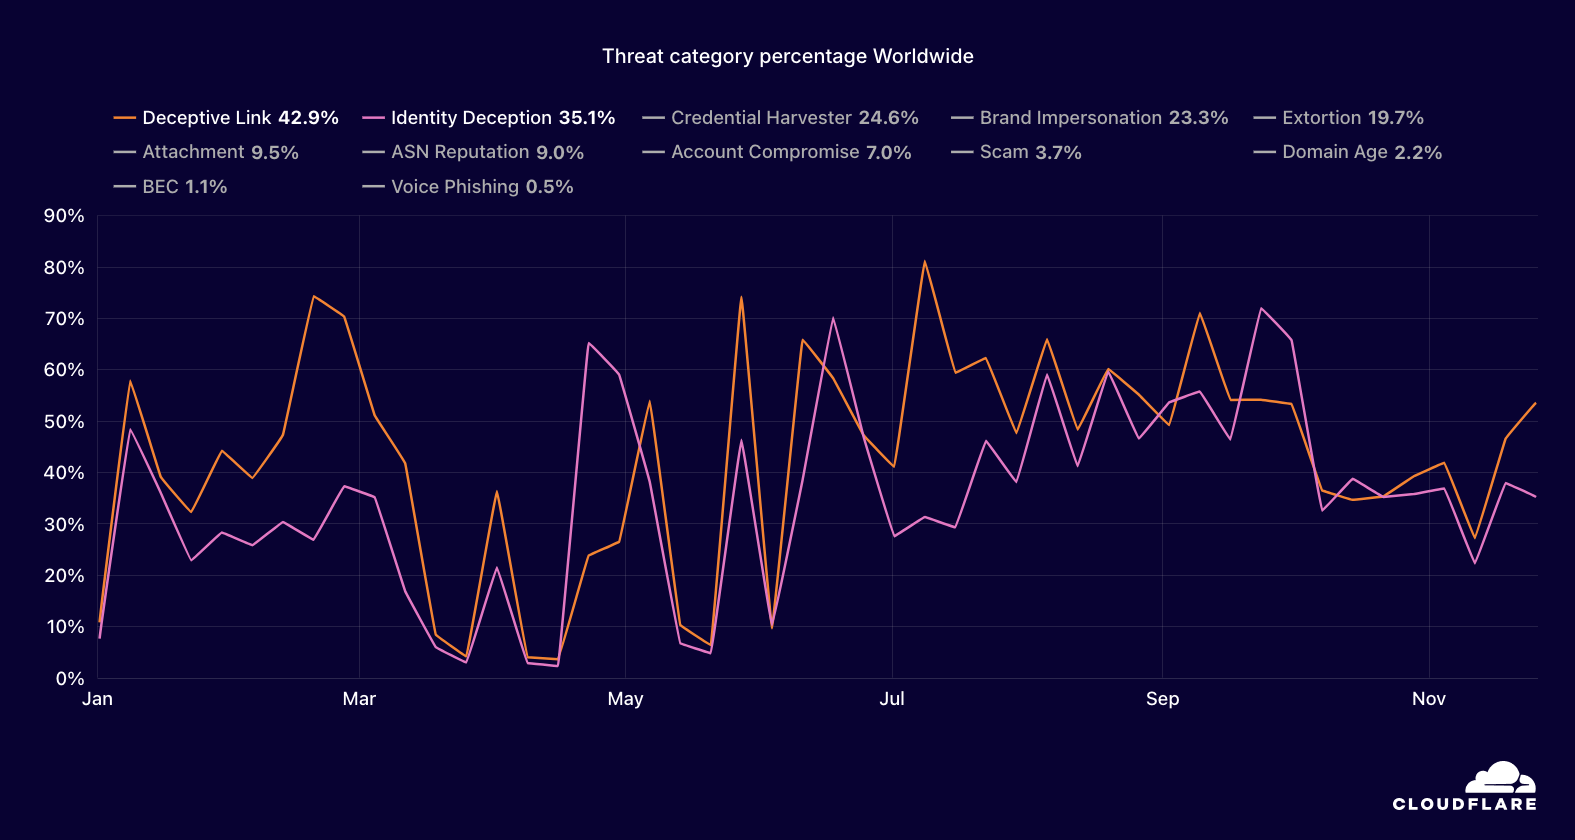
An average of 4.3% of emails were determined to be malicious in 2024, although this figure was likely influenced by spikes observed in March, April, and May. Deceptive links and identity deception were the two most common types of threats found in malicious email messages. 🔗
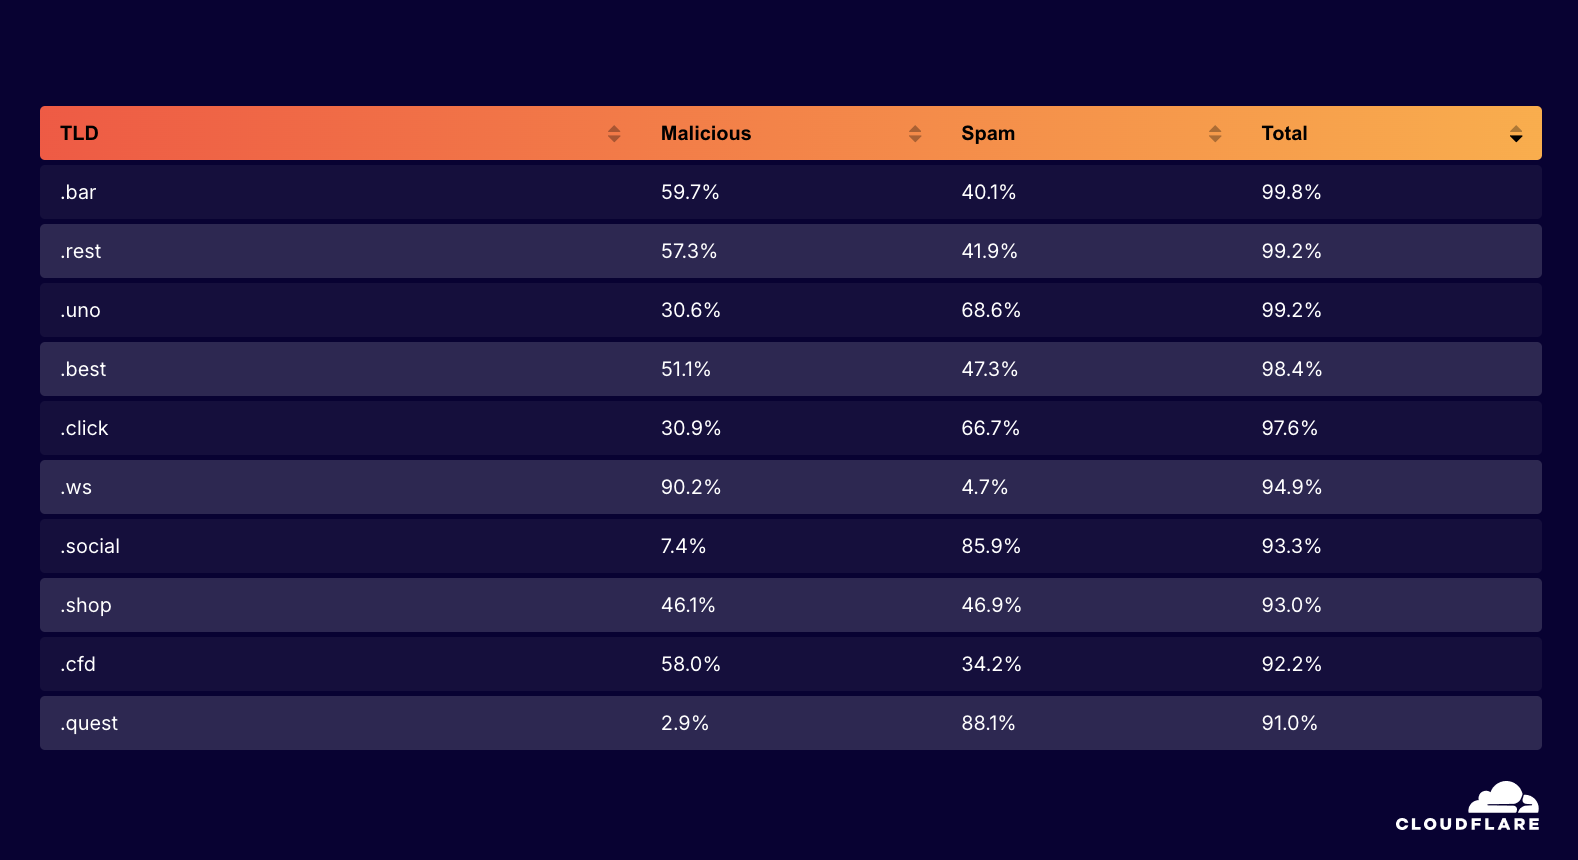
Over 99% of the email messages processed by Cloudflare Email Security from the .bar, .rest, and .uno top level domains (TLDs) were found to be either spam or malicious in nature. 🔗
Introduction
Over the last four years (2020, 2021, 2022, 2023), we have aggregated perspectives from Cloudflare Radar into an annual Year In Review, illustrating the Internet’s patterns across multiple areas over the course of that year. The Cloudflare Radar 2024 Year In Review microsite continues that tradition, featuring interactive charts, graphs, and maps you can use to explore and compare notable Internet trends observed throughout this past year.
Cloudflare’s network currently spans more than 330 cities in over 120 countries/regions, serving an average of over 63 million HTTP(S) requests per second for millions of Internet properties, in addition to handling over 42 million DNS requests per second on average. The resulting data generated by this usage, combined with data from other complementary Cloudflare tools, enables Radar to provide unique near-real time perspectives on the patterns and trends around security, traffic, performance, and usage that we observe across the Internet.
The 2024 Year In Review is organized into five sections: Traffic, Adoption & Usage, Connectivity, Security, and Email Security and covers the period from January 1 to December 1, 2024. We have incorporated several new metrics this year, including AI bot & crawler traffic, search engine and browser market share, connection tampering, and “most dangerous” top level domains (TLDs). To ensure consistency, we have kept underlying methodologies consistent with previous years’ calculations. Trends for 200 countries/regions are available on the microsite; smaller or less populated locations are excluded due to insufficient data. Some metrics are only shown worldwide, and are not displayed if a country/region is selected.
Below, we provide an overview of the content contained within the major Year In Review sections (Traffic, Adoption & Usage, Connectivity, Security, and Email Security), along with notable observations and key findings. In addition, we have also published a companion blog post that specifically explores trends seen across Top Internet Services.
The key findings and associated discussion within this post only provide a high-level perspective on the unique insights that can be found in the Year in Review microsite. Visit the microsite to explore the various datasets and metrics in more detail, including trends seen in your country/region, how these trends have changed as compared to 2023, and how they compare to other countries/regions of interest. Surveying the Internet from this vantage point provides insights that can inform decisions on everything from an organization’s security posture and IT priorities to product development and strategy.
Traffic trends
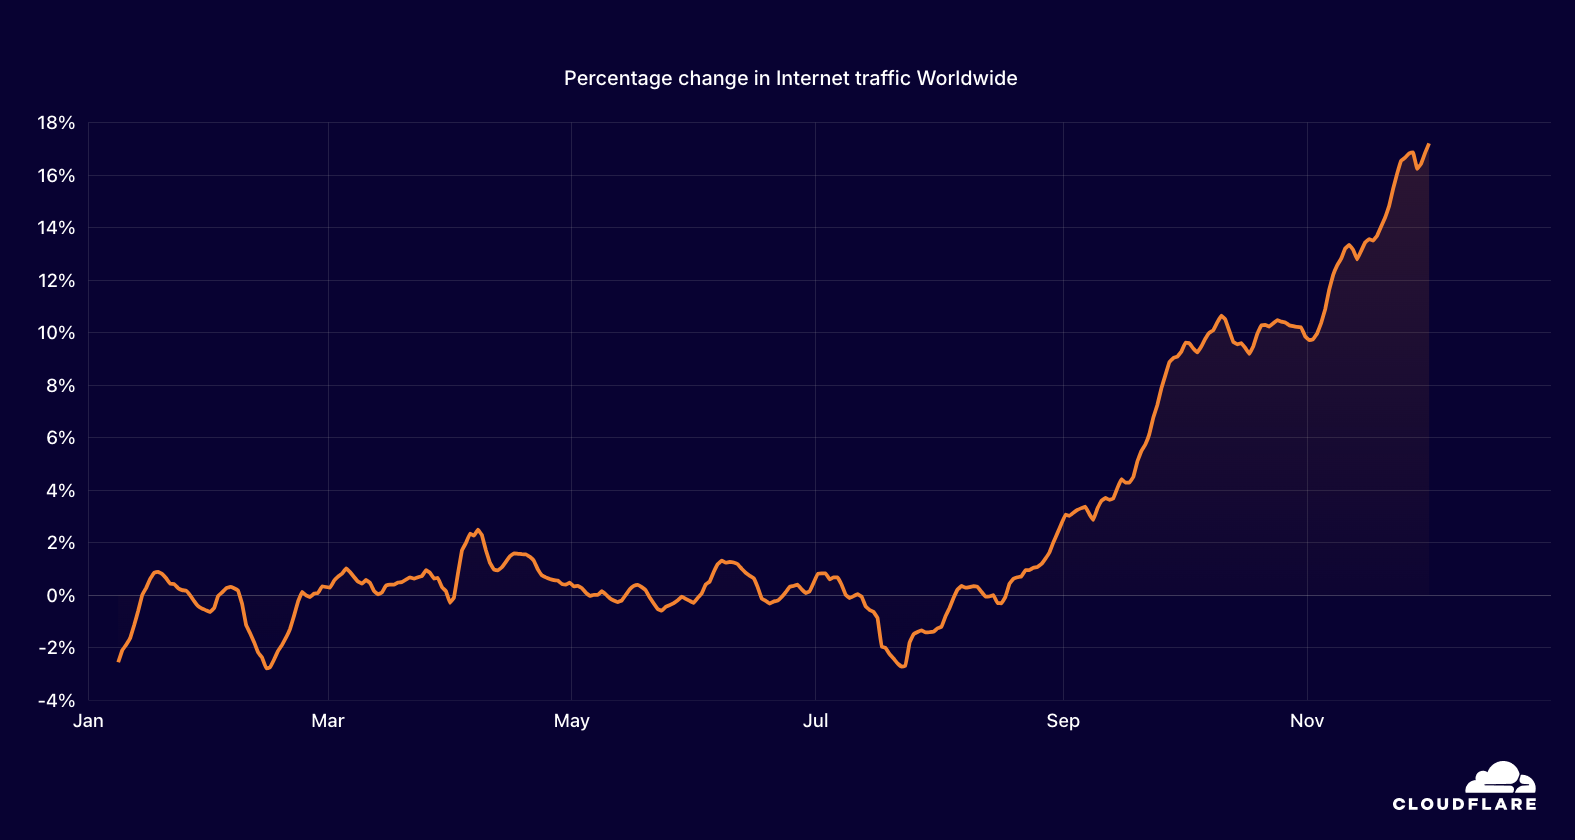
Global Internet traffic grew 17.2% in 2024.
An inflection point for Internet traffic arguably occurred thirty years ago. The World Wide Web went mainstream in 1994, thanks to the late 1993 release of the NCSA Mosaic browser for multiple popular operating systems, which included support for embedded images. In turn, “heavier” (in contrast to text-based) Internet content became the norm, and coupled with the growth in consumption through popular online services and the emerging consumer ISP industry, Internet traffic began to rapidly increase, and that trend has continued to the present.
To determine the traffic trends over time for the Year in Review, we use the average daily traffic volume (excluding bot traffic) over the second full calendar week (January 8-15) of 2024 as our baseline. (The second calendar week is used to allow time for people to get back into their “normal” school and work routines after the winter holidays and New Year’s Day. The percent change shown in the traffic trends chart is calculated relative to the baseline value — it does not represent absolute traffic volume for a country/region. The trend line represents a seven-day trailing average, which is used to smooth the sharp changes seen with data at a daily granularity. To compare 2024’s traffic trends with 2023 data and/or other locations, click the “Compare” icon at the upper right of the graph.
Throughout the first half of 2024, worldwide Internet traffic growth appeared to be fairly limited, within a percent or two on either side of the baseline value through mid-August. However, at that time growth clearly began to accelerate, climbing consistently through the end of November, growing 17.2% for the year. This trend is similar to those also seen in 2023 and 2022, as we discussed in the 2023 Year in Review blog post.
Internet traffic trends in 2024, worldwide
The West African country of Guinea experienced the most significant Internet traffic growth seen in 2024, reaching as much as 350% above baseline. Traffic growth didn’t begin in earnest until late February, and reached an initial peak in early April. It remained between 100% and 200% above baseline until September, when it experienced several multi-week periods of growth. While the September-November periods of traffic growth also occurred in 2023, they peaked at under 90% above baseline.
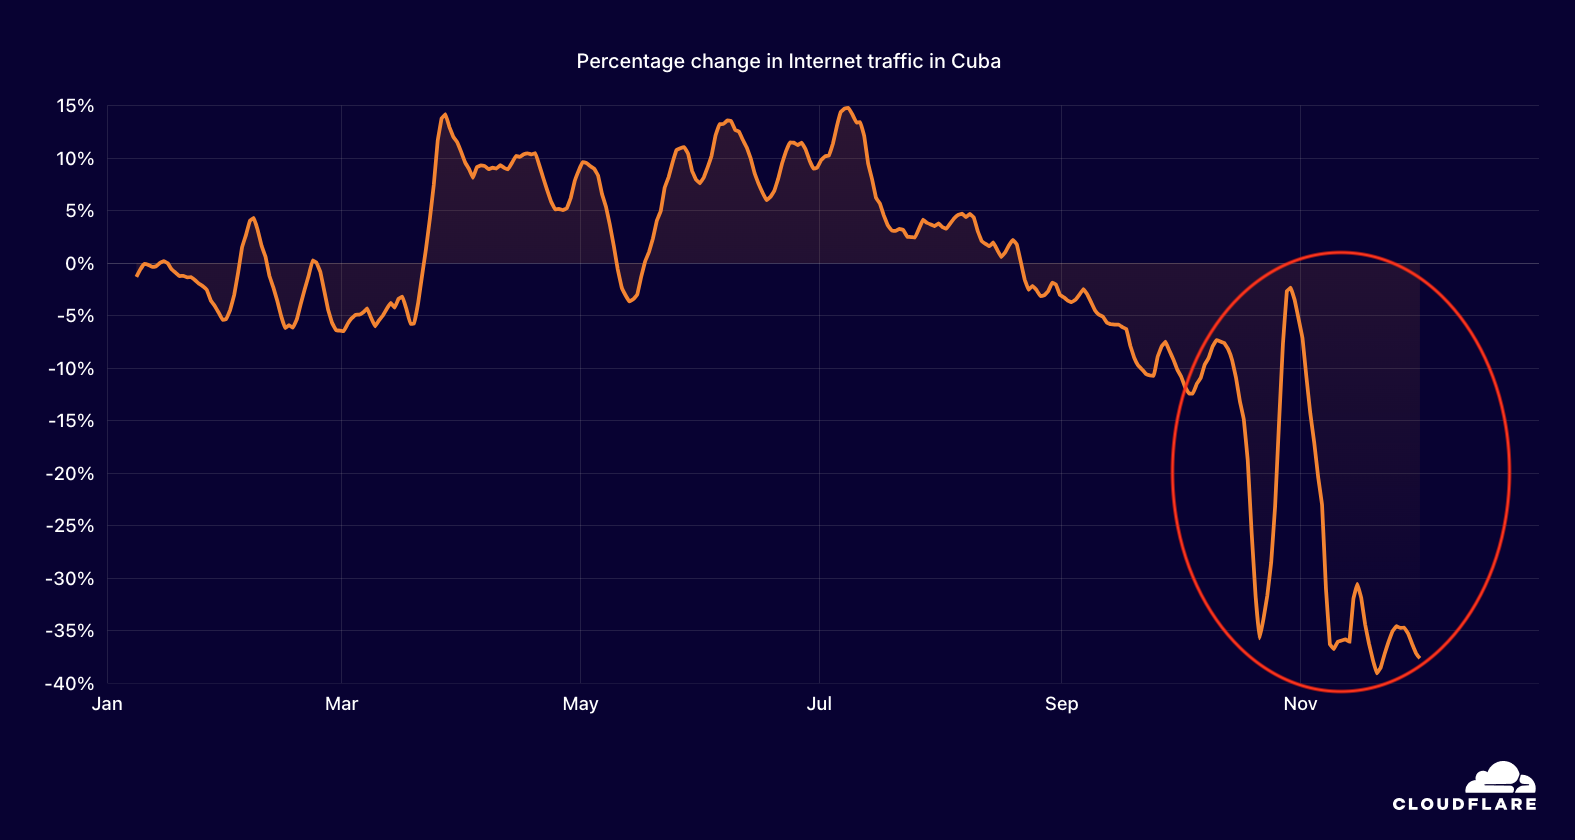
The impact of significant Internet outages is also clearly visible when looking at data across the year. Two significant Internet outages in Cuba are clearly visible as large drops in traffic in October and November. A reported “complete disconnection” of the national electricity system on the island occurred on October 18, lasting just over three days. Just a couple of weeks later, on November 6, damage from Hurricane Rafael caused widespread power outages in Cuba, resulting in another large drop in Internet traffic. Traffic has remained lower as Cuba’s electrical infrastructure continues to struggle.
Internet traffic trends in 2024, Cuba
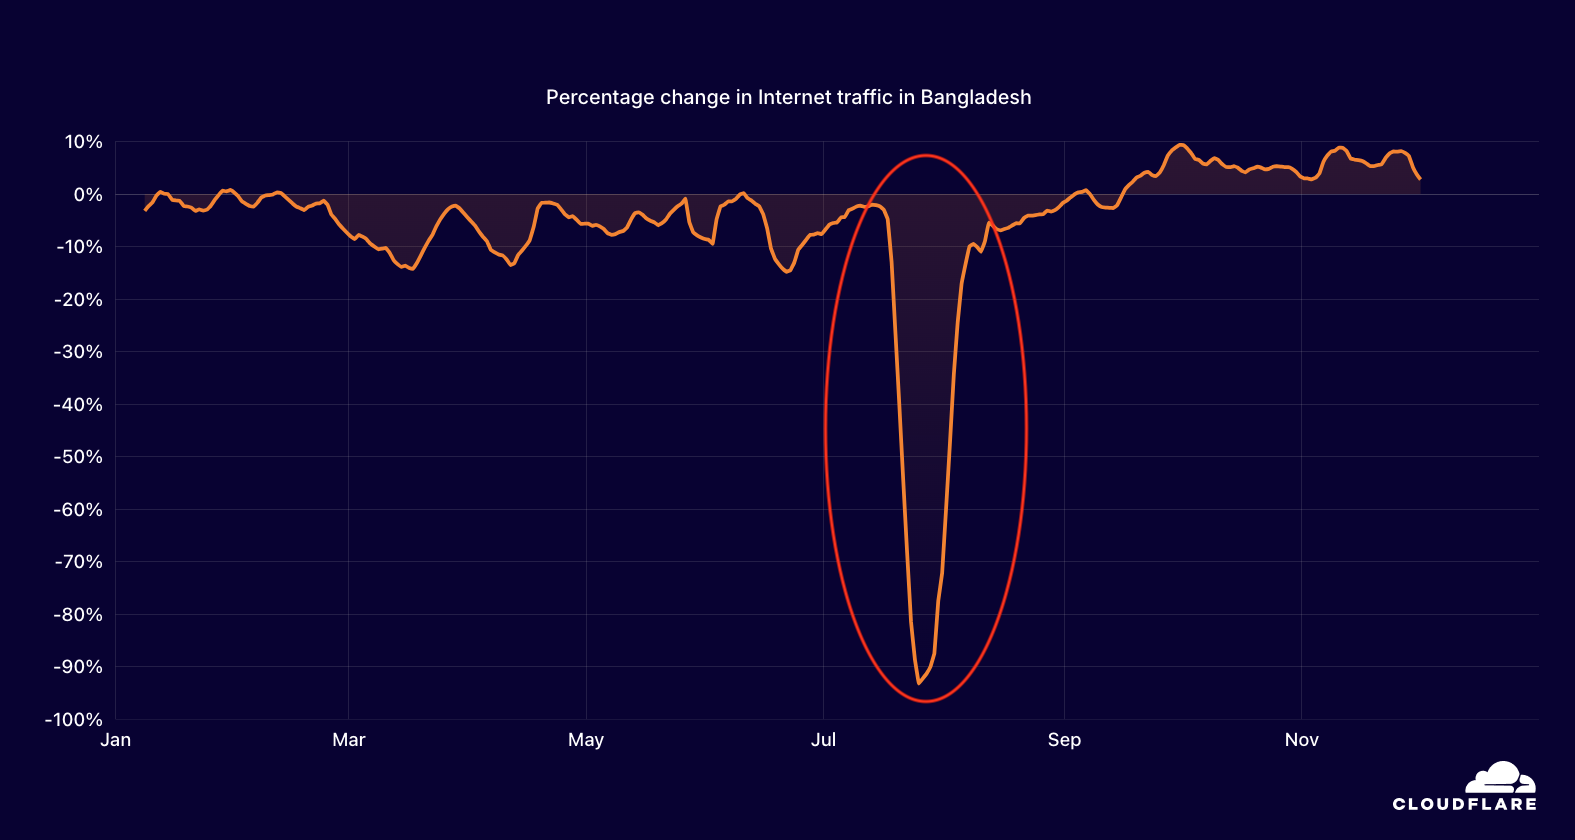
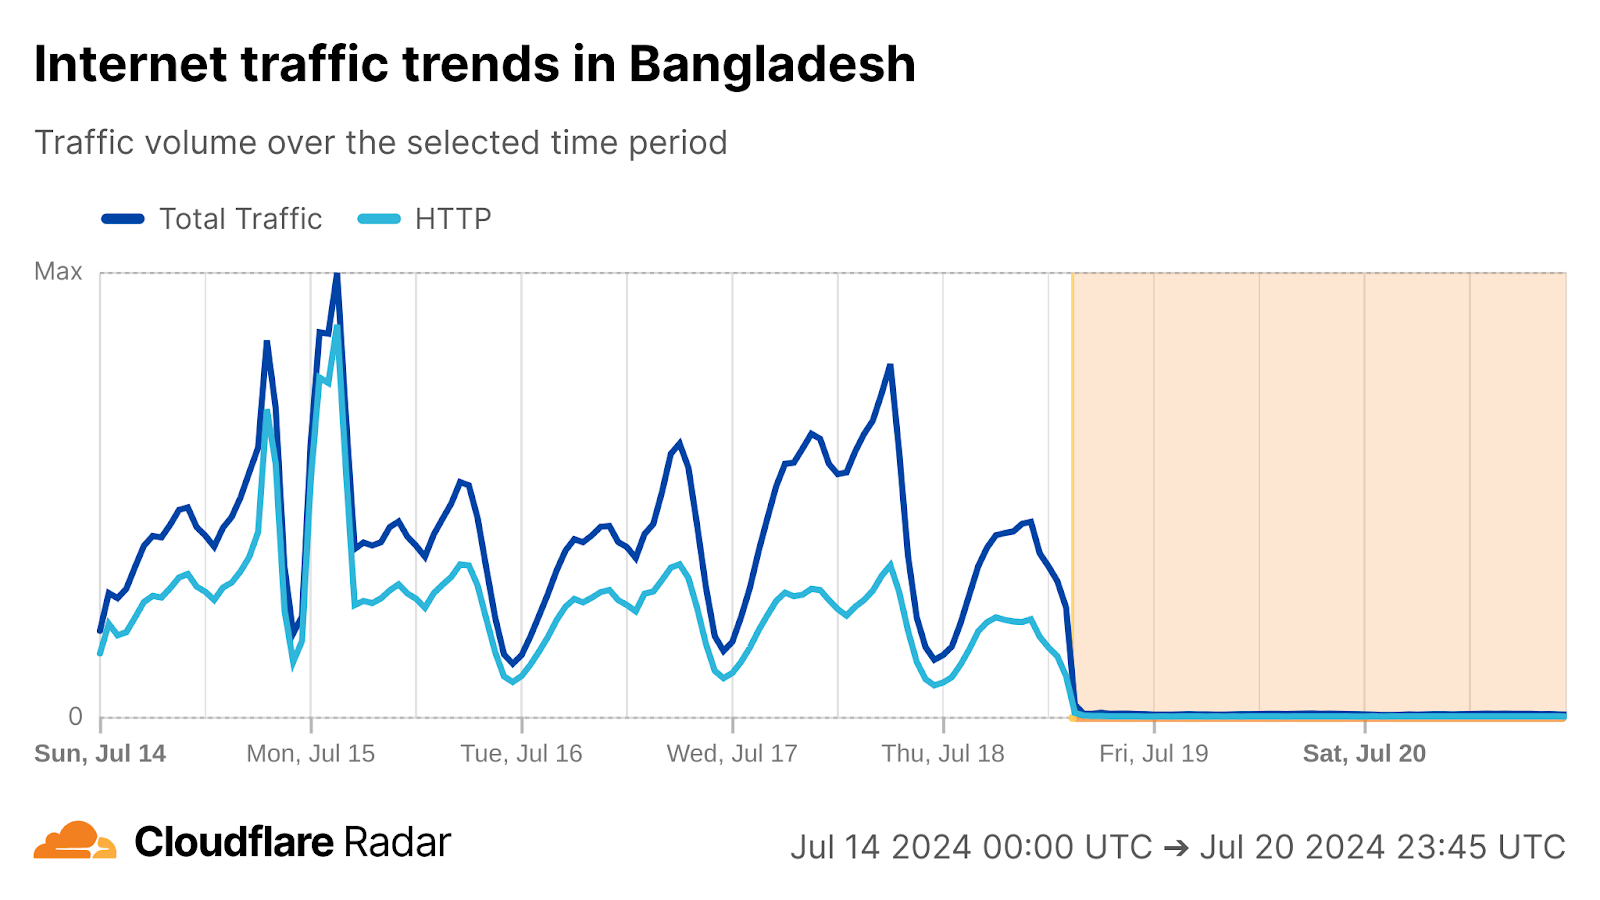
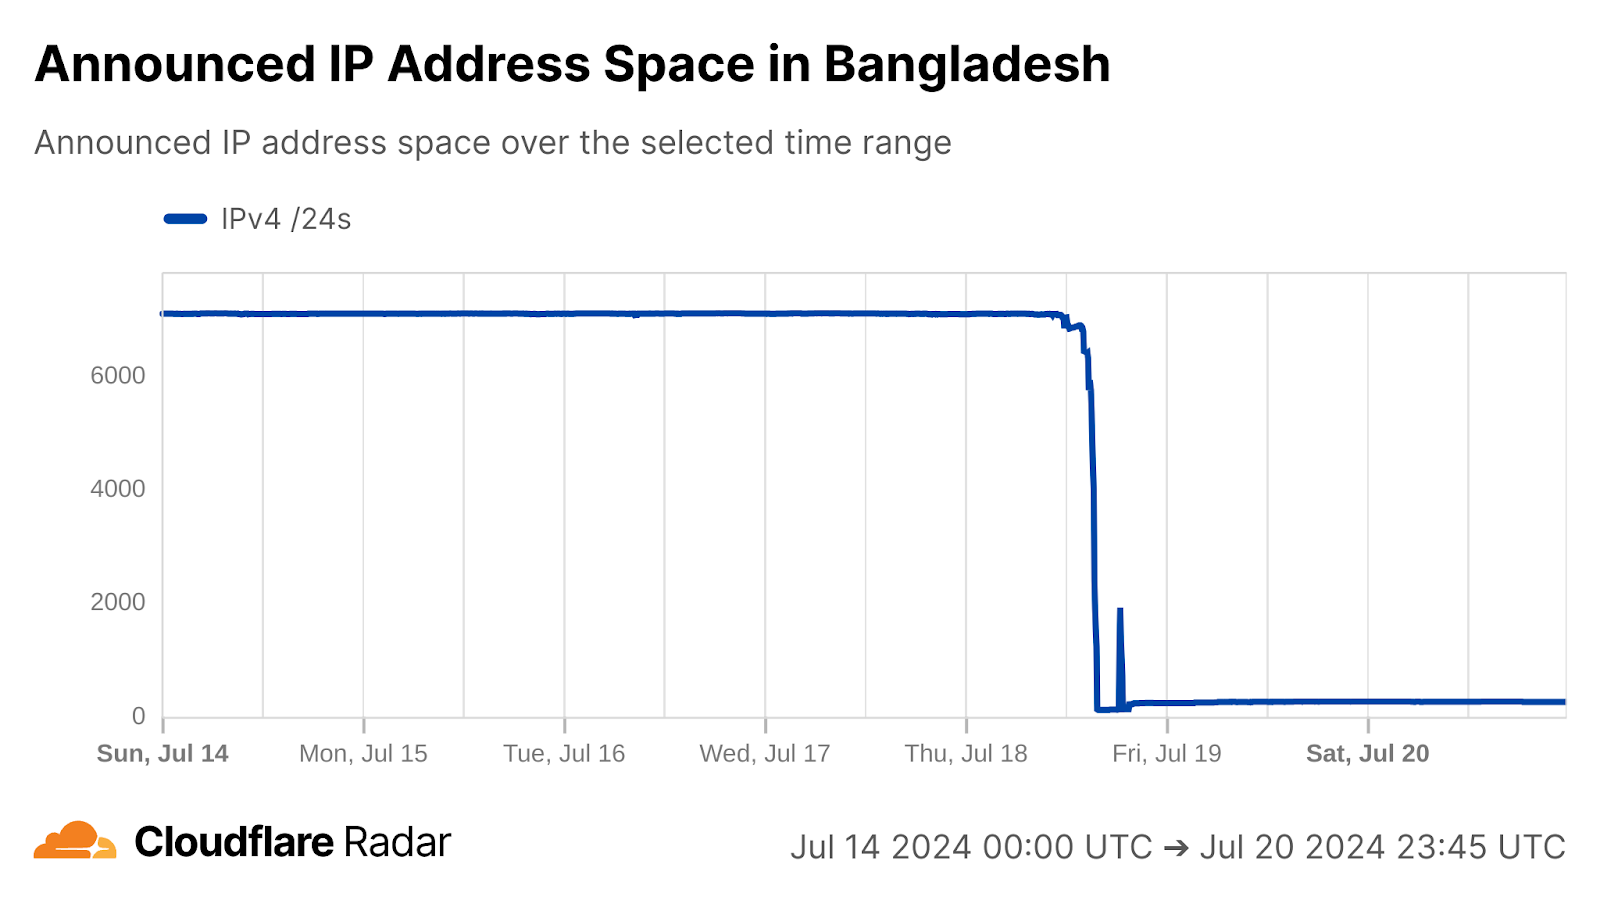
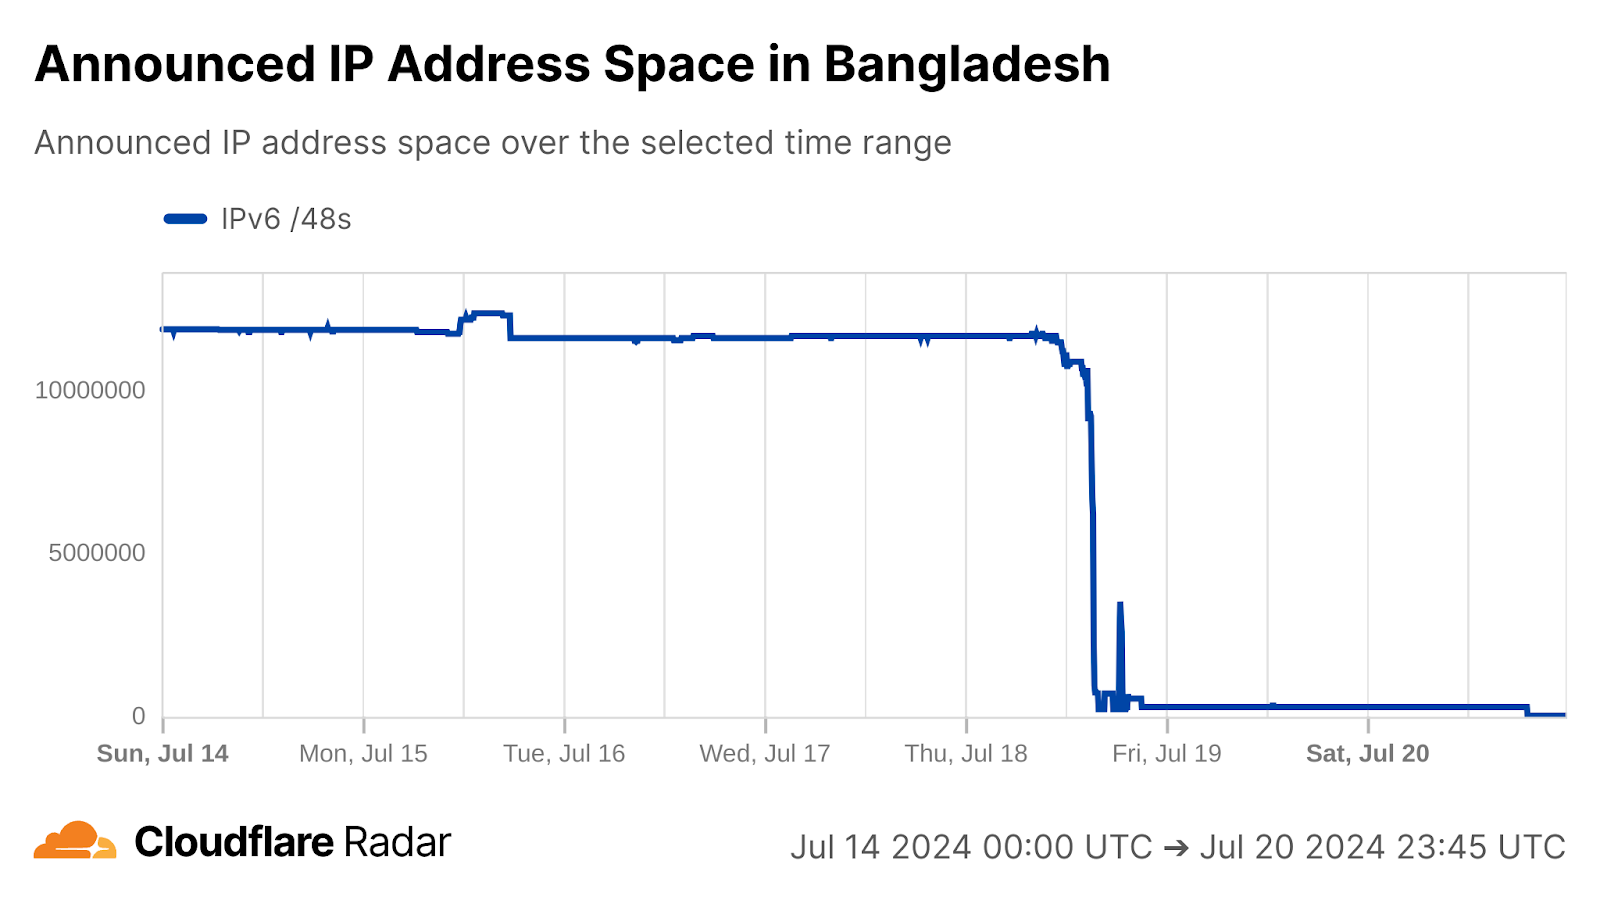
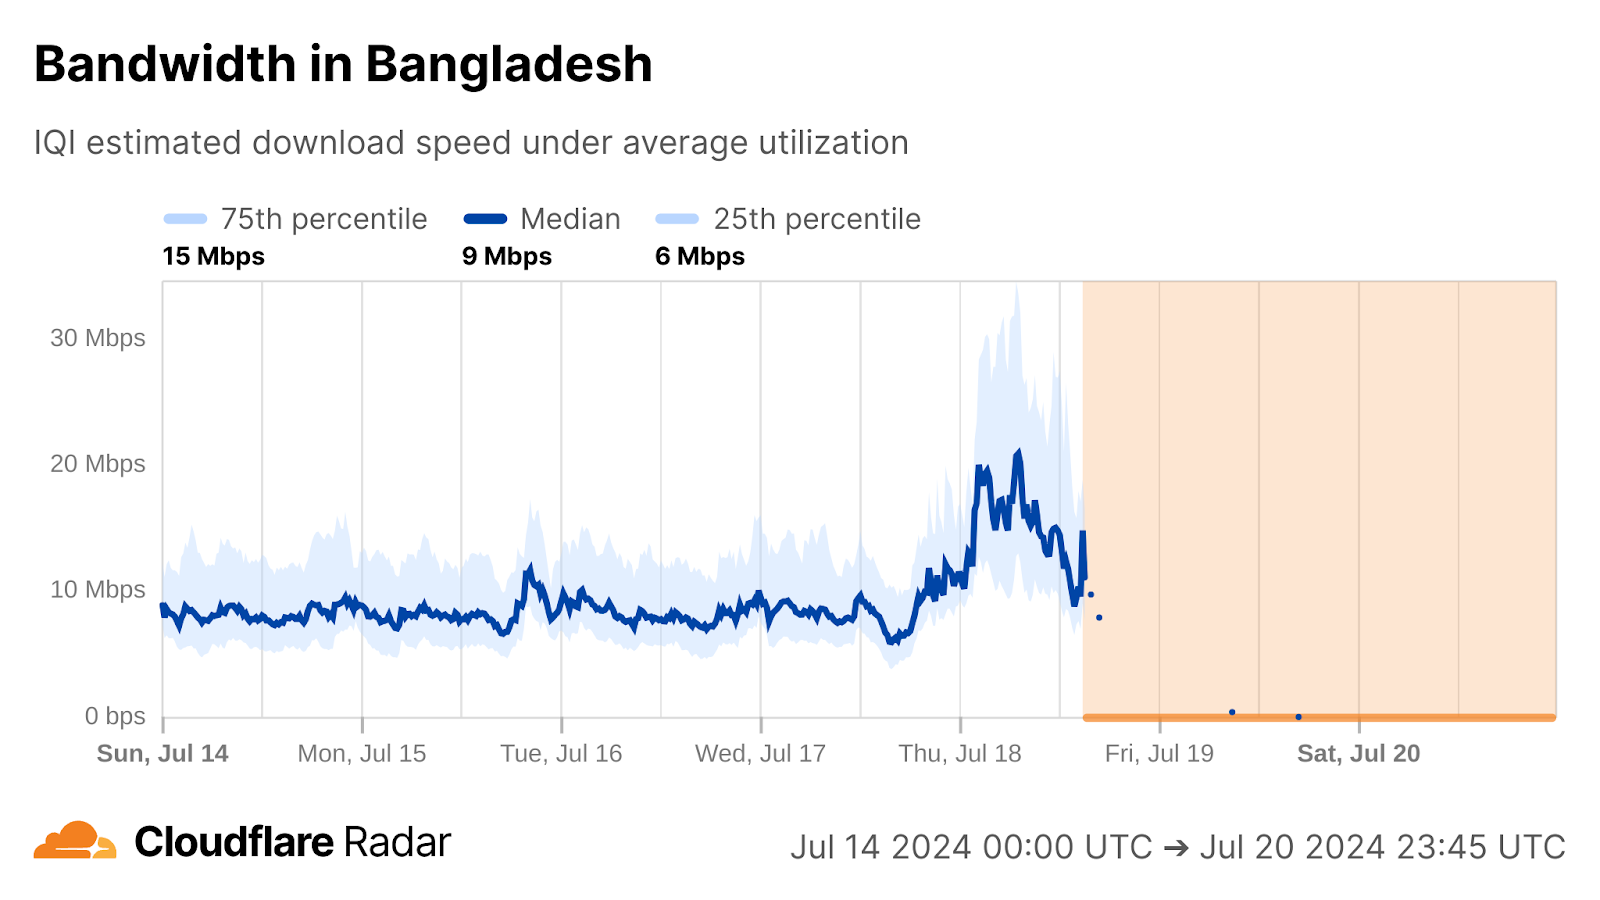
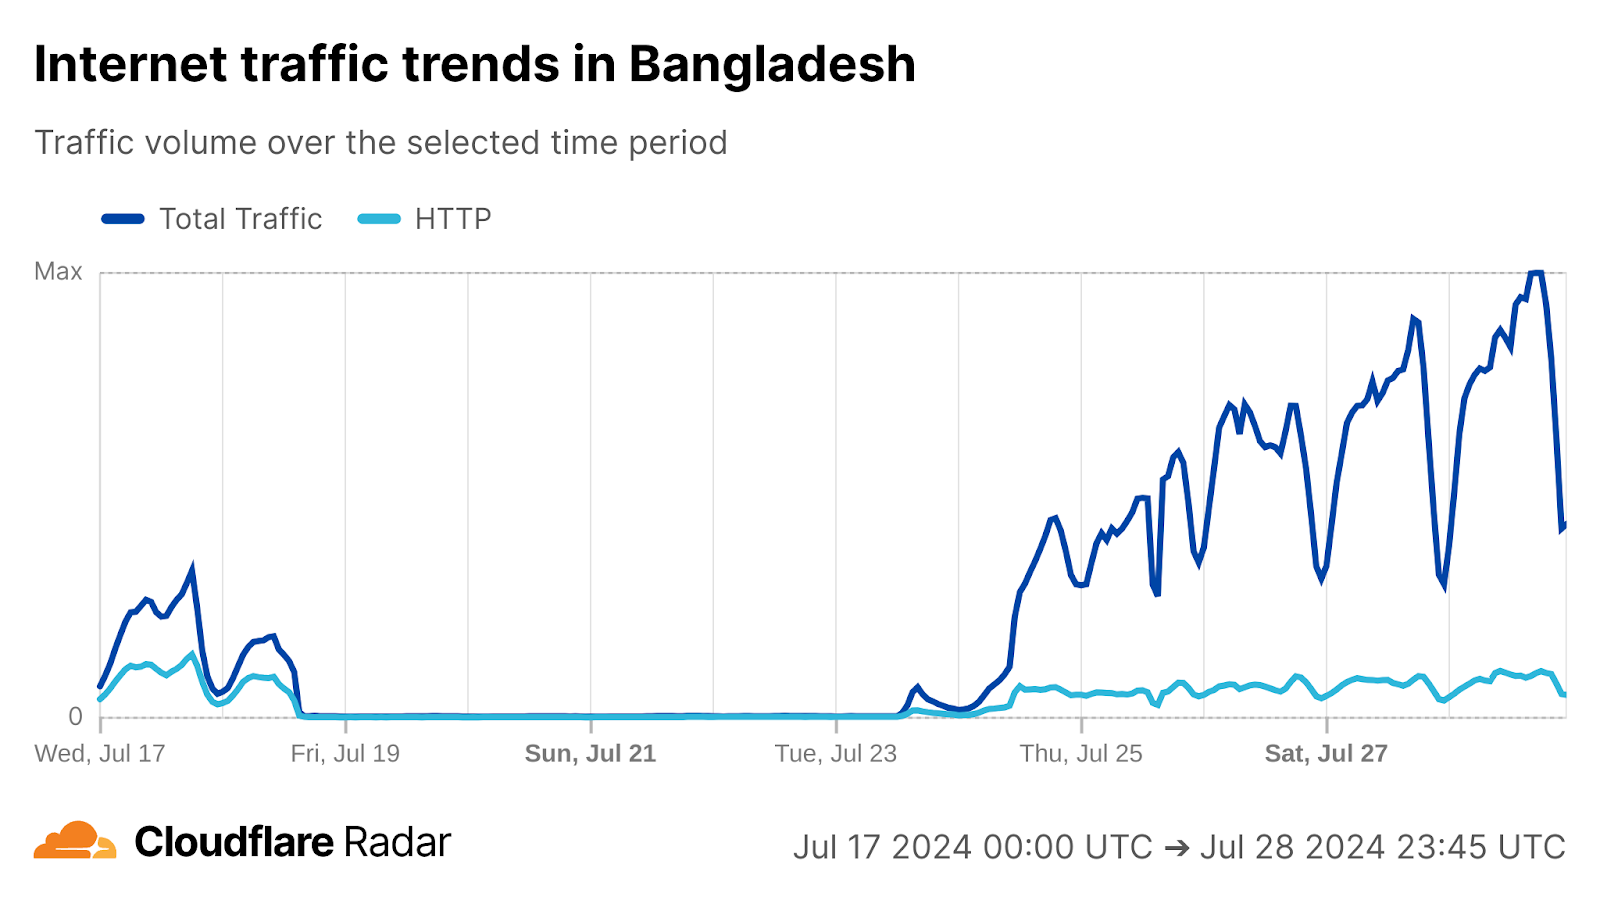
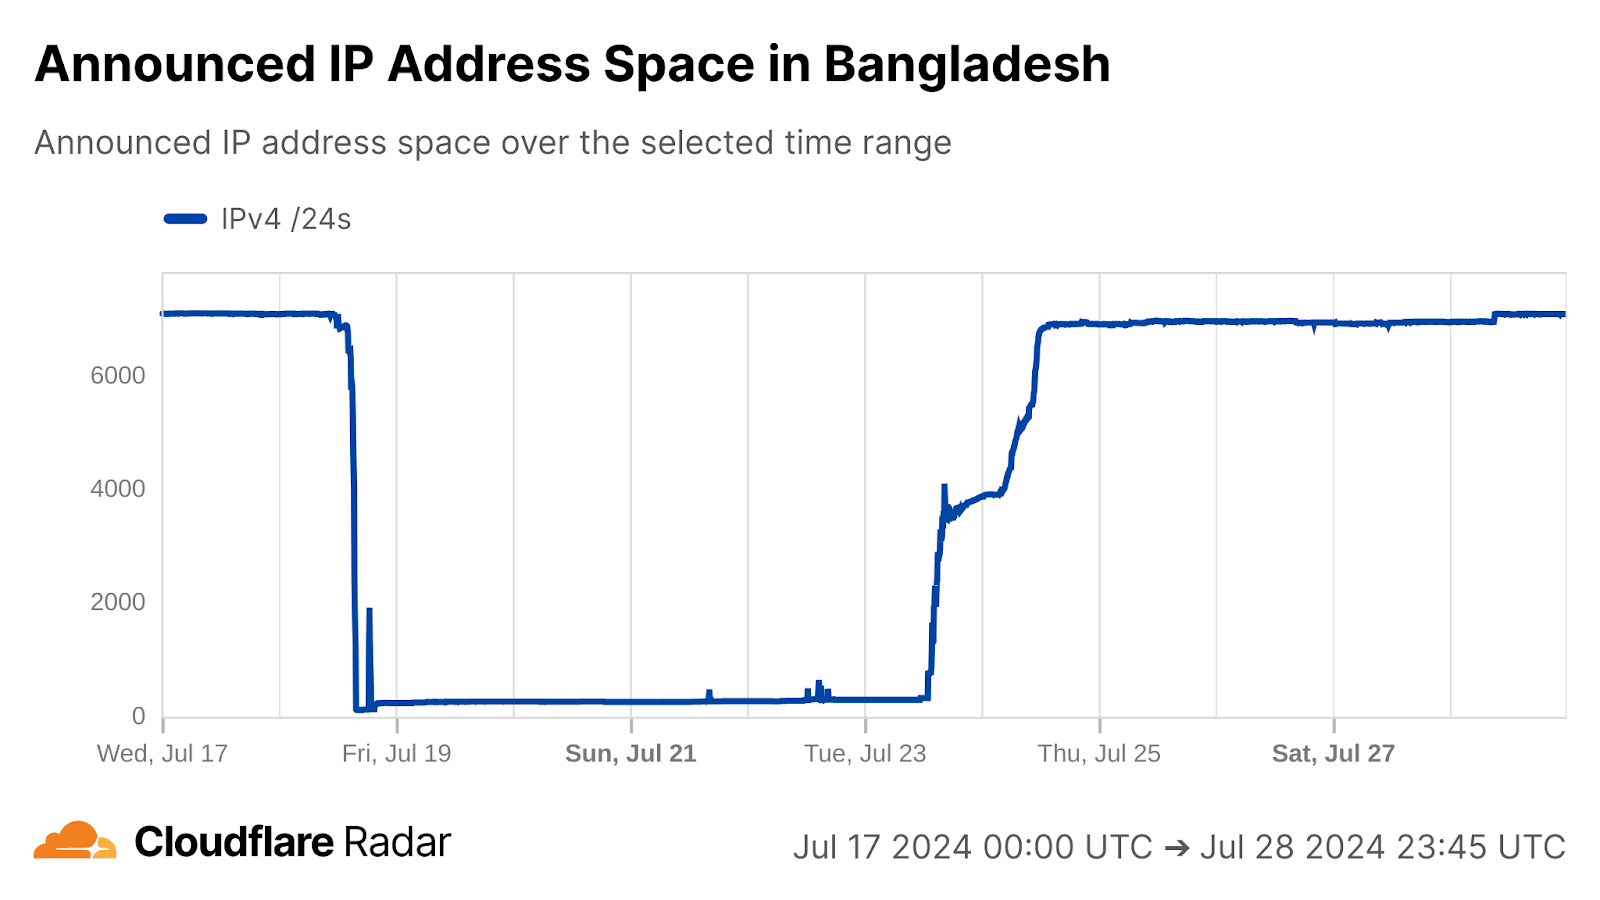
As we frequently discuss in Cloudflare Radar blog and social media posts, government-directed Internet shutdowns occur all too frequently, and the impact of these actions are also clearly visible when looking at long-term traffic data. In Bangladesh, the government ordered the shutdown of mobile Internet connectivity on July 18, in response to student protests. Shortly after mobile networks were shut down, fixed broadband networks were taken offline as well, resulting in a near complete loss of Internet traffic from the country. Connectivity gradually returned over the course of several days, between July 23-28.
Internet traffic trends in 2024, Bangladesh
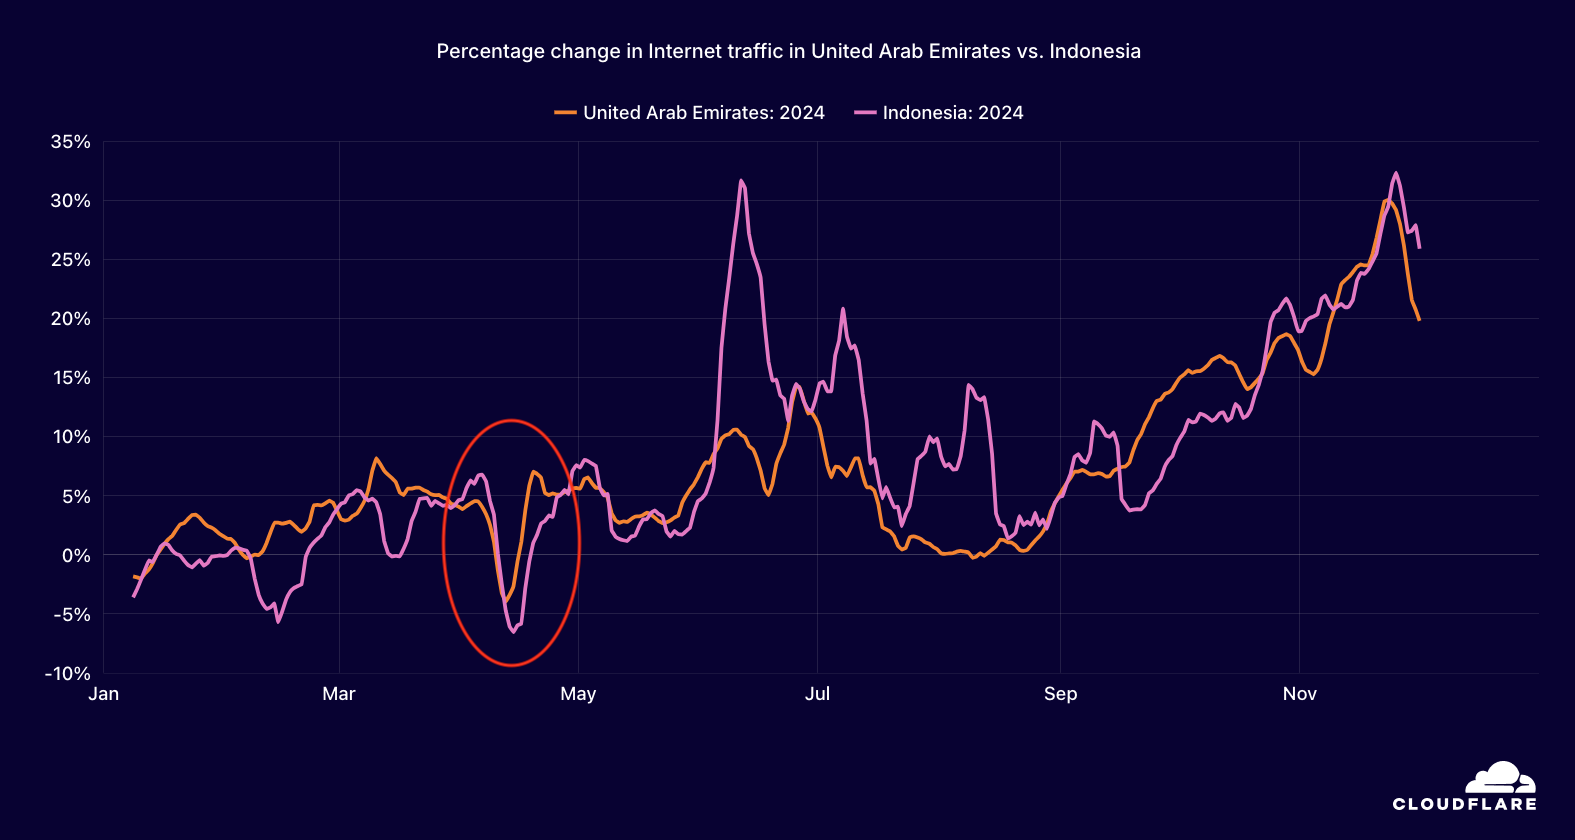
As we also noted last year, the celebration of major holidays can also have a visible impact on Internet traffic at a country level. For example, in Muslim countries including Indonesia and the United Arab Emirates, the celebration of Eid al-Fitr, the festival marking the end of the fast of Ramadan, is visible as a noticeable drop in traffic around April 9-10.
Internet traffic trends in 2024, Indonesia and United Arab Emirates
Google maintained its position as the most popular Internet service. OpenAI, Binance, WhatsApp, and Facebook led their respective categories.
Over the last several years, the Year In Review has ranked the most popular Internet services. These rankings cover an “overall” perspective, as well as a dozen more specific categories, based on analysis of anonymized query data of traffic to our 1.1.1.1 public DNS resolver from millions of users around the world. For the purposes of these rankings, domains that belong to a single Internet service are grouped together.
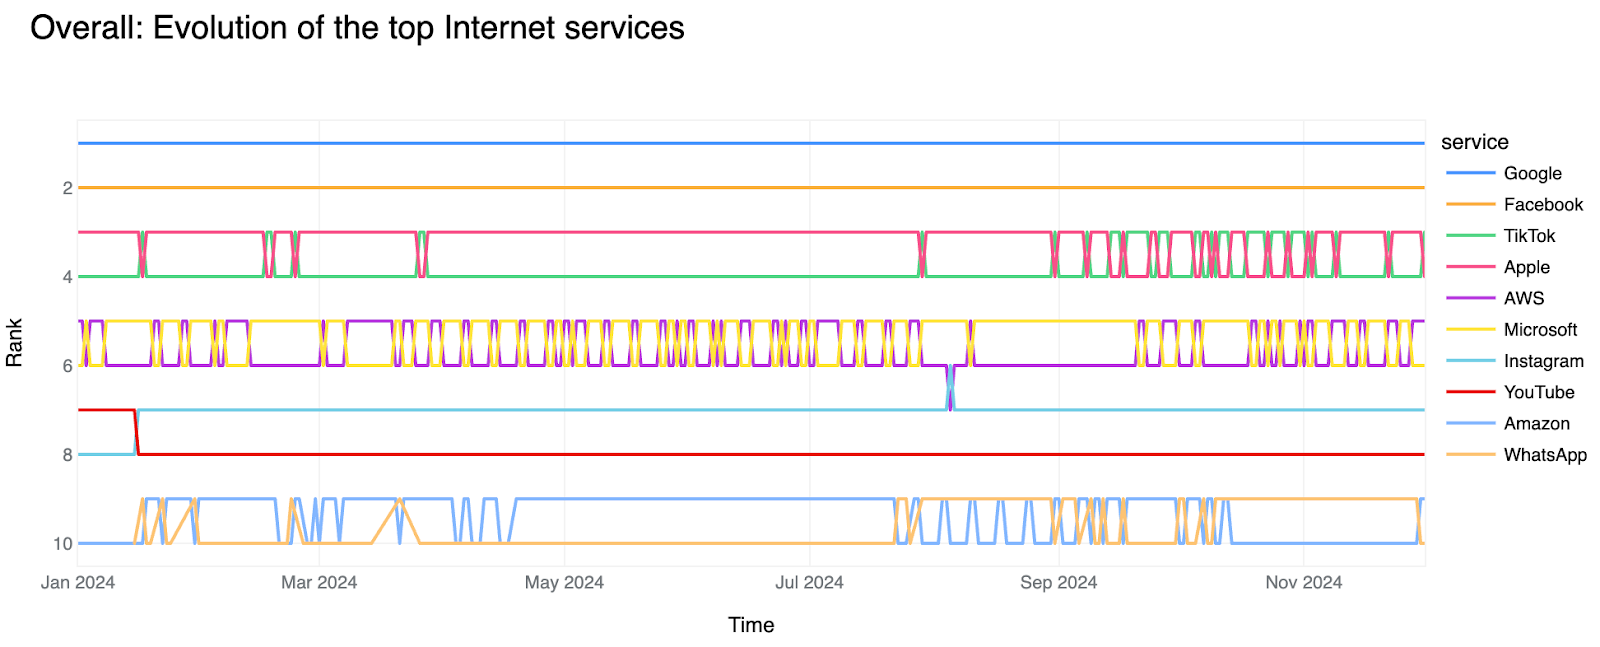
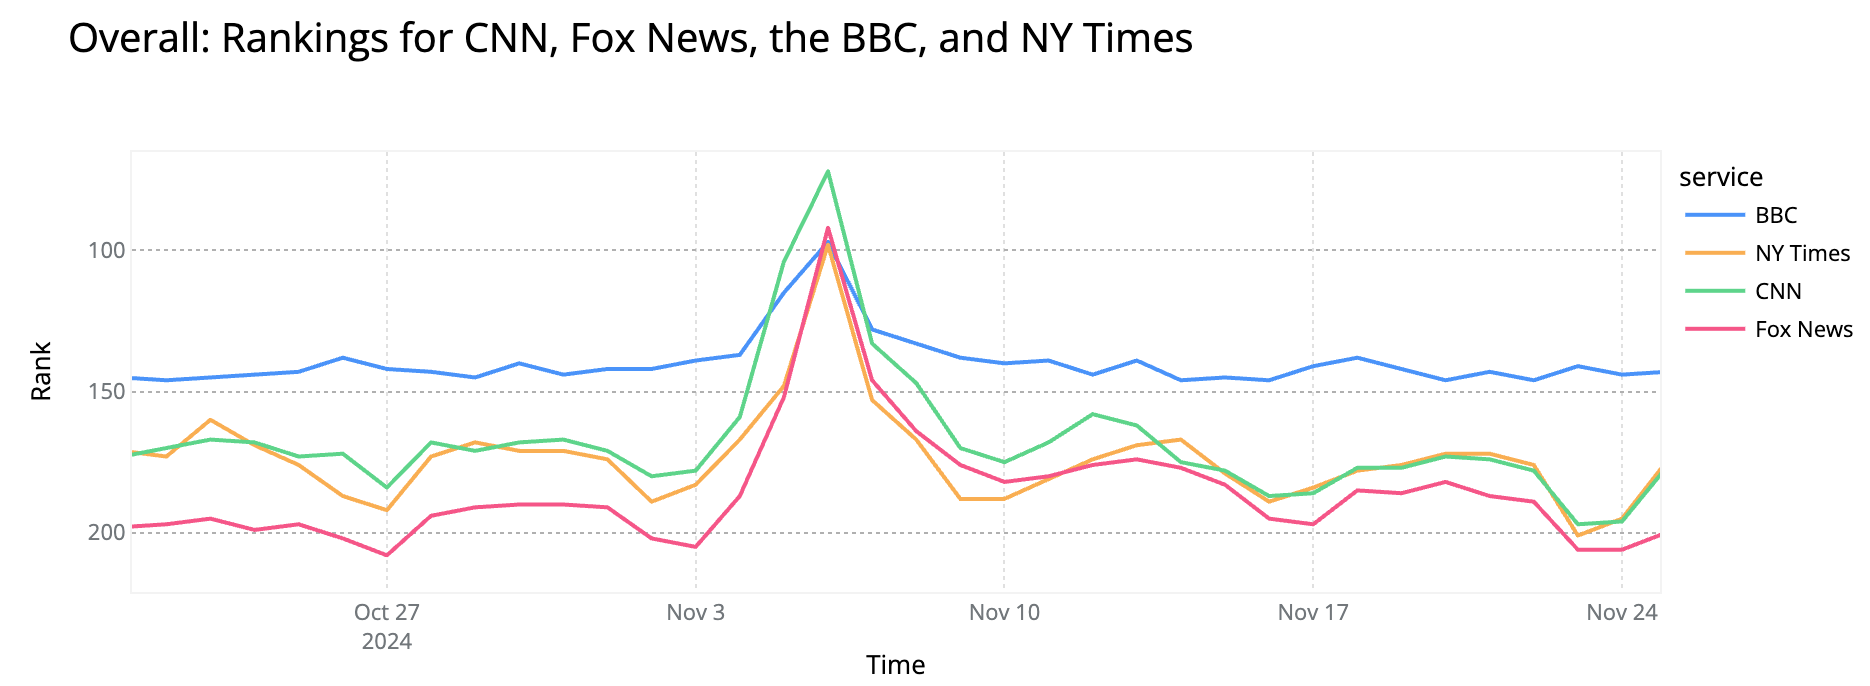
Google once again held the top spot overall, supported by its broad portfolio of services, as well as the popularity of the Android mobile operating system (more on that below). Meta properties Facebook, Instagram, and WhatsApp also held spots in the top 10.
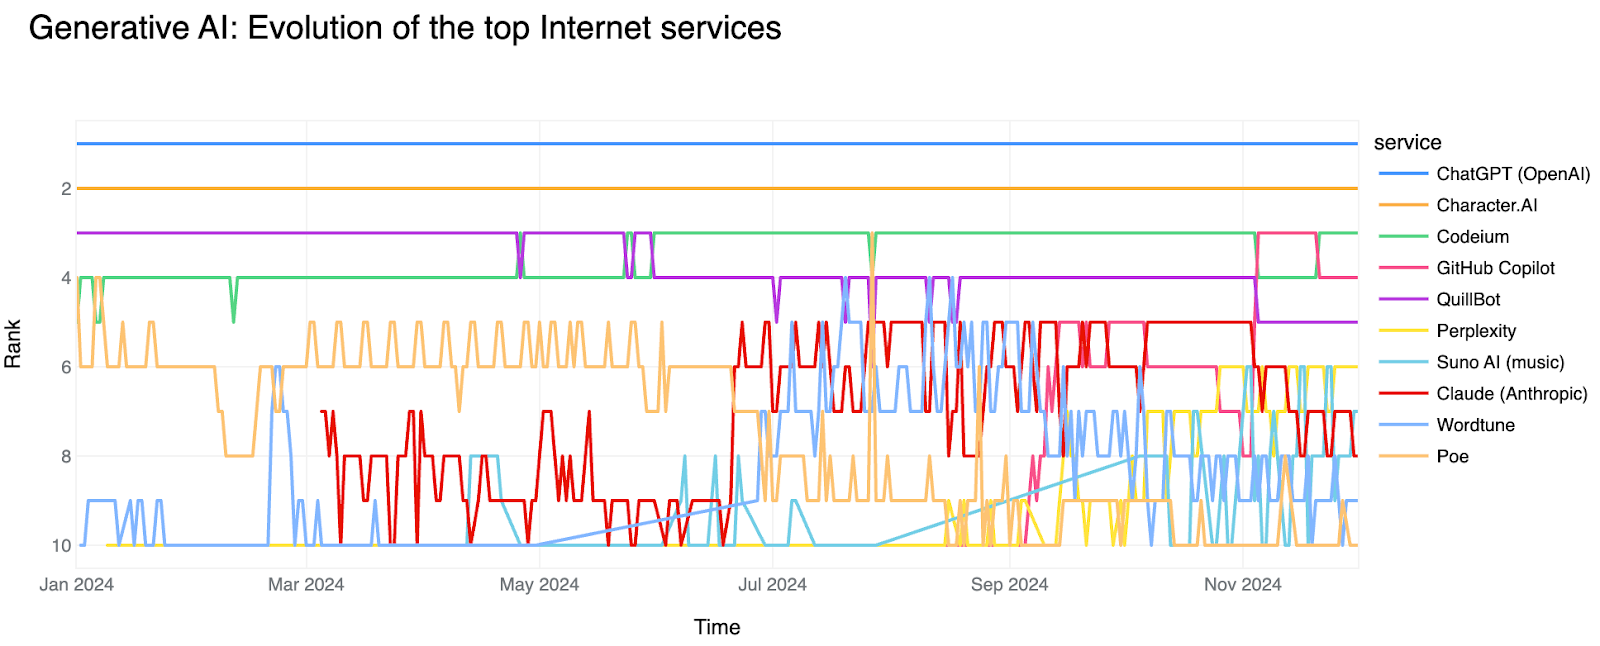
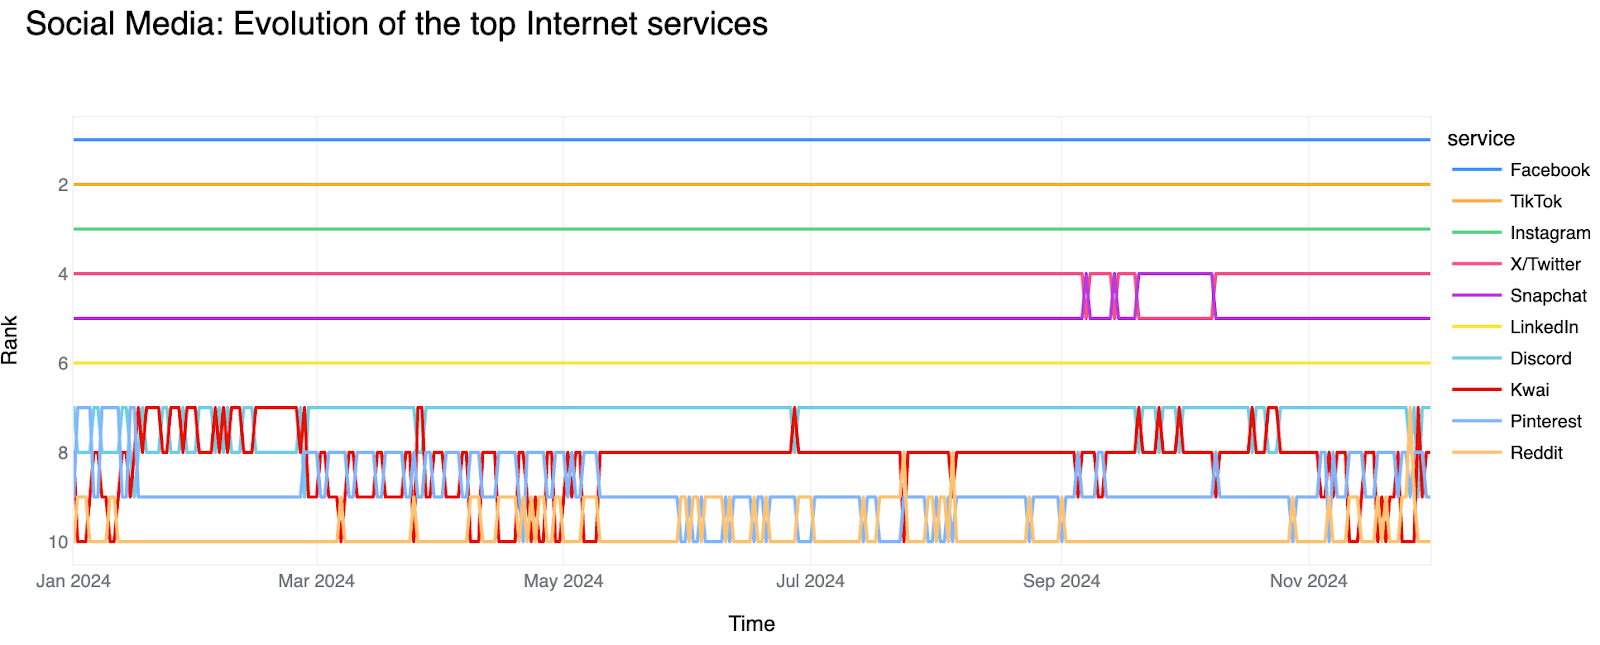
Generative AI continued to grow in popularity throughout 2024, and in this category, OpenAI again held the top spot, building on the continued success and popularity of ChatGPT. Within Social Media, the top five remained consistent with 2023’s and 2022’s ranking, including Facebook, TikTok, Instagram, X, and Snapchat.
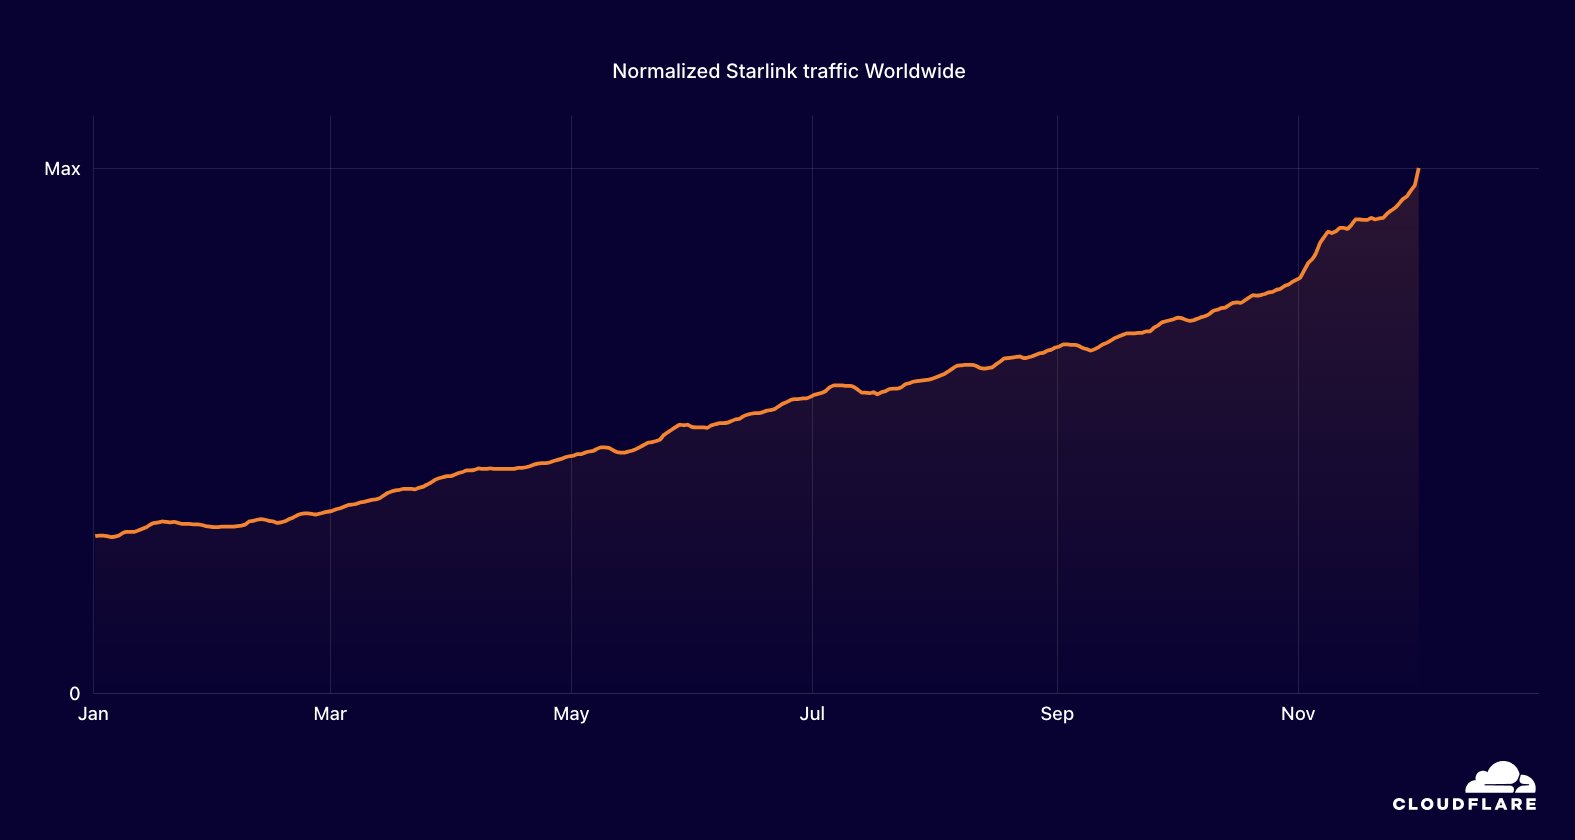
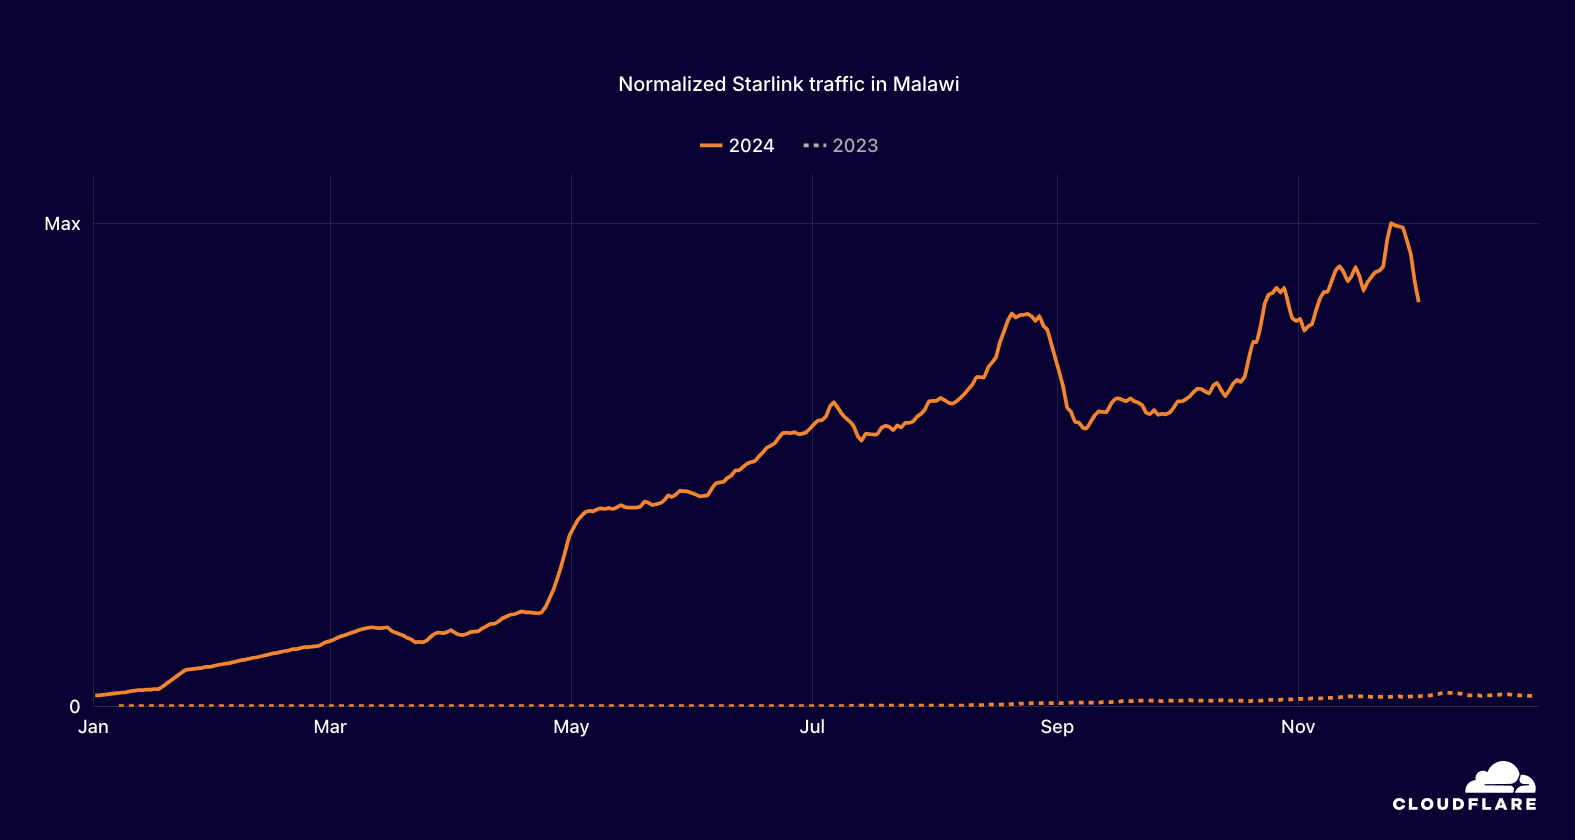
Global traffic from Starlink grew 3.3x in 2024, in line with last year’s growth rate. After initiating service in Malawi in July 2023, Starlink traffic from that country grew 38x in 2024.
SpaceX’s Starlink continues to be the leading satellite Internet service provider, bringing connectivity to unserved or underserved areas. In addition to opening up new markets in 2024, Starlink also announced relationships to provide in-flight connectivity to multiple airlines, and on cruise ships and trains, as well as enabling subscribers to roam with their subscription using the Starlink Mini.
We analyzed aggregate Cloudflare traffic volumes associated with Starlink’s primary autonomous system (AS14593) to track the growth in usage of the service throughout 2024. Similar to the traffic trends discussed above, the request volume shown on the trend line in the chart represents a seven-day trailing average. Comparisons with 2023 data can be shown by clicking the “Compare” icon at the upper right of the graph. Within comparative views, the lines are scaled to the maximum value shown.
On a worldwide basis, steady, consistent growth was seen across the year, though it accelerates throughout November. This acceleration may have been driven by traffic associated with customer-specific large software updates.
Starlink traffic growth worldwide in 2024
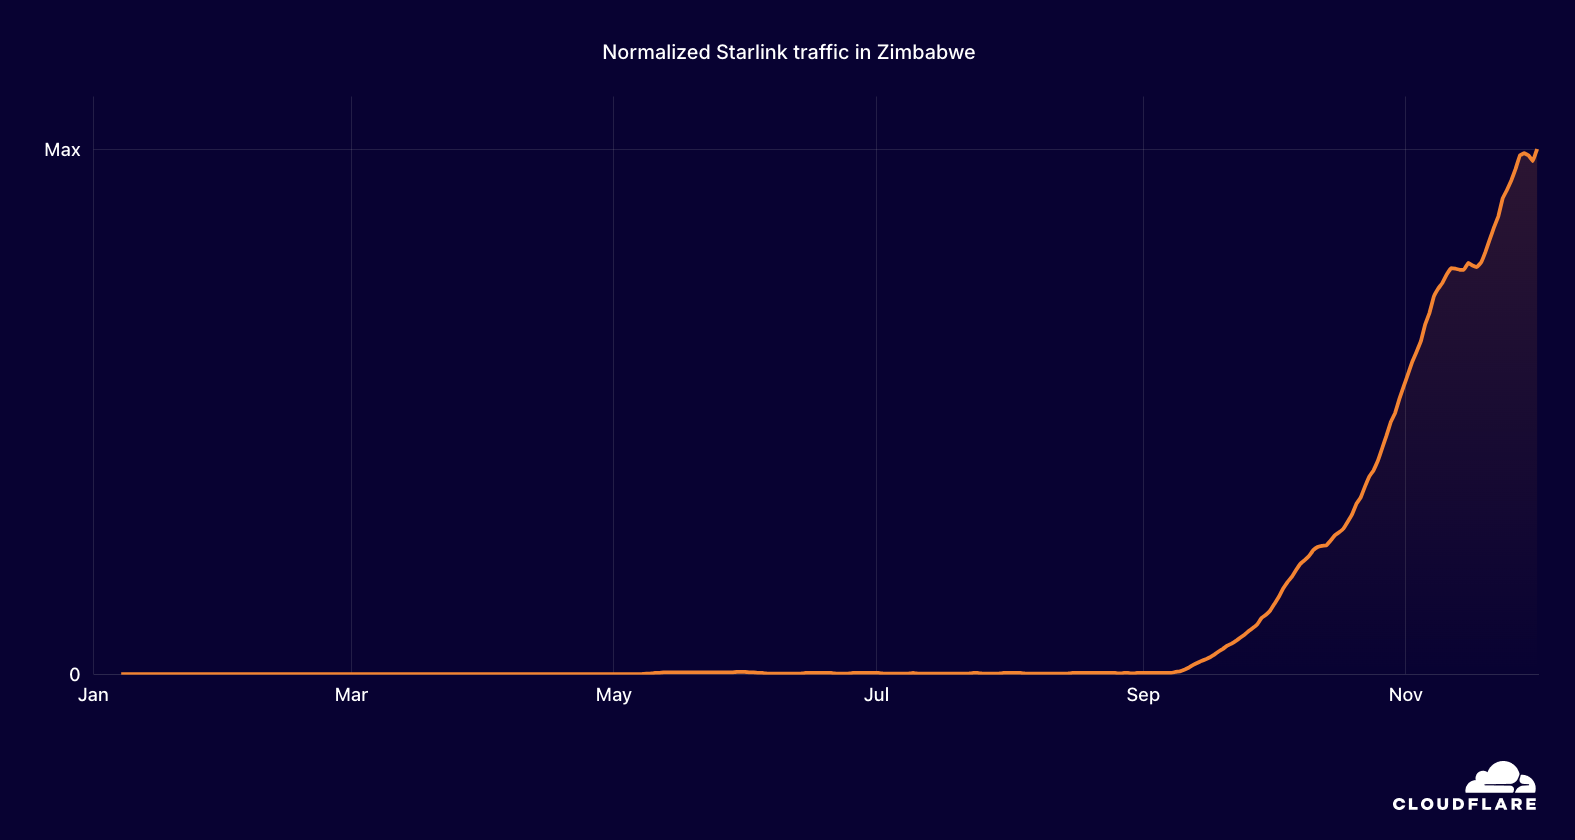
In many locations, there is pent-up demand for “alternative” connectivity providers such as Starlink, and in these countries/regions, we see rapid traffic growth when service becomes available, such as in Zimbabwe. Service availability was announced on September 7, and traffic from the country began to grow rapidly almost immediately thereafter.
Starlink traffic growth in Zimbabwe in 2024
In new markets, traffic growth continues after that initial increase. For example Starlink service became available in Malawi in July 2023, and throughout 2024, Starlink traffic from the country grew 38x. While Malawi’s 38x increase is impressive, other countries also experienced significant growth. In the Eastern European country of Georgia, service became available on November 1, 2023. After a slow ramp, traffic began to take off growing over 100x through 2024. In Paraguay, service availability was announced on December 21, and began to grow at the beginning of January, registering an increase of over 900x across the year.
Starlink traffic growth in Malawi in 2024
Googlebot was responsible for the highest volume of request traffic to Cloudflare in 2024 as it retrieved content from millions of Cloudflare customer sites for search indexing.
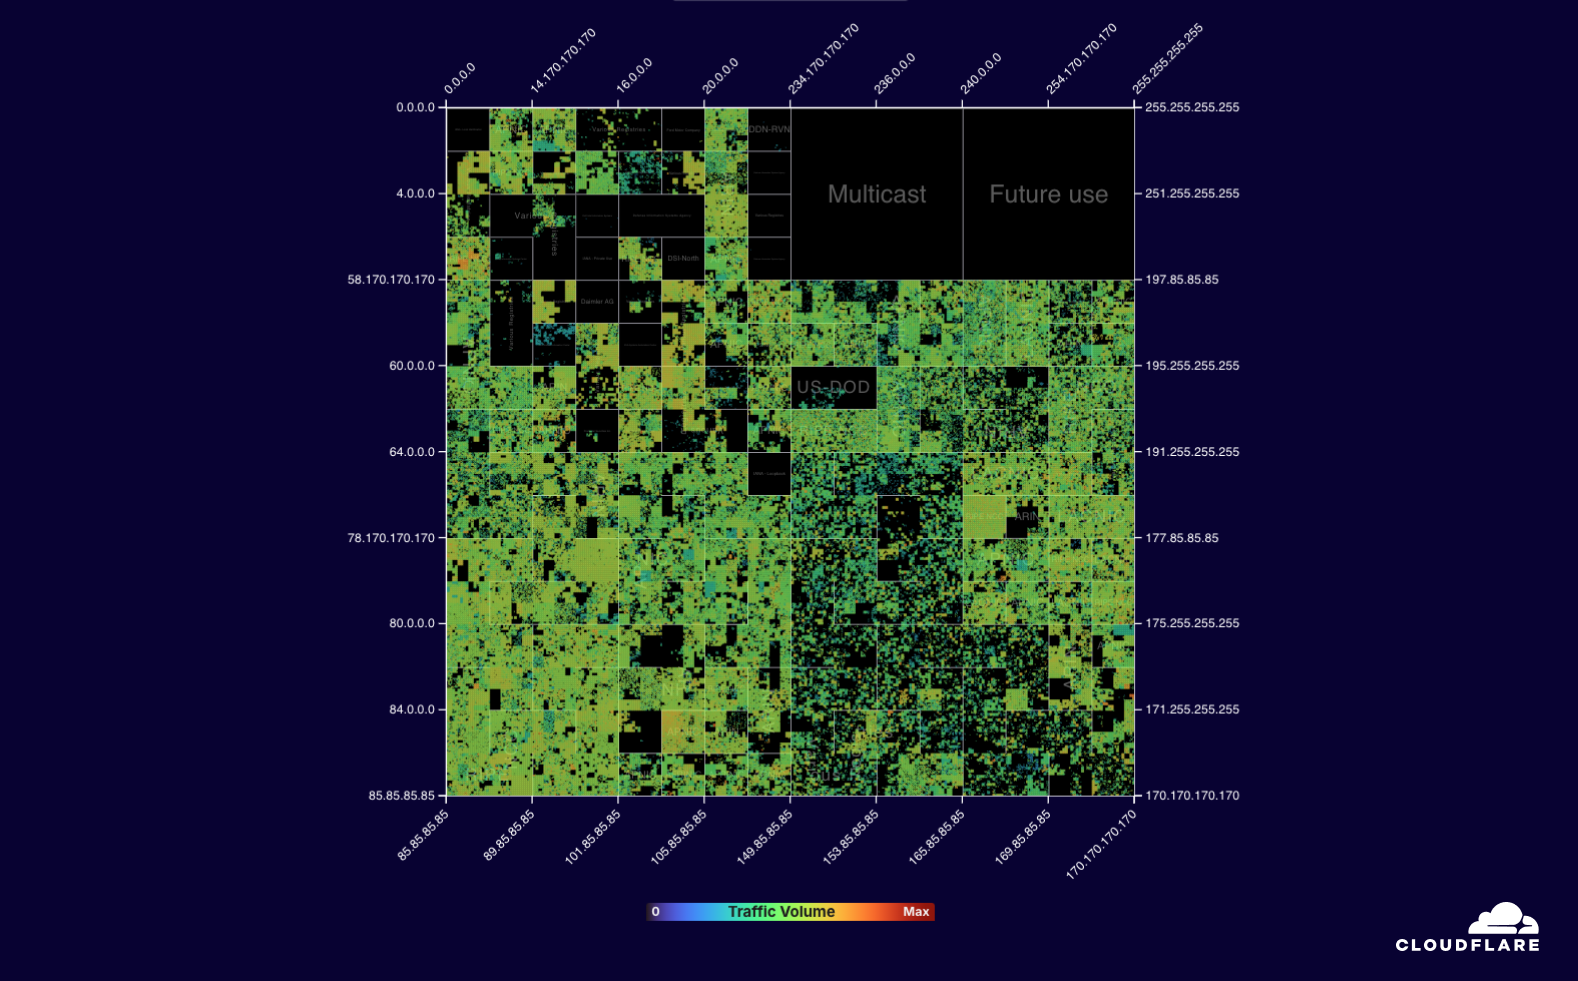
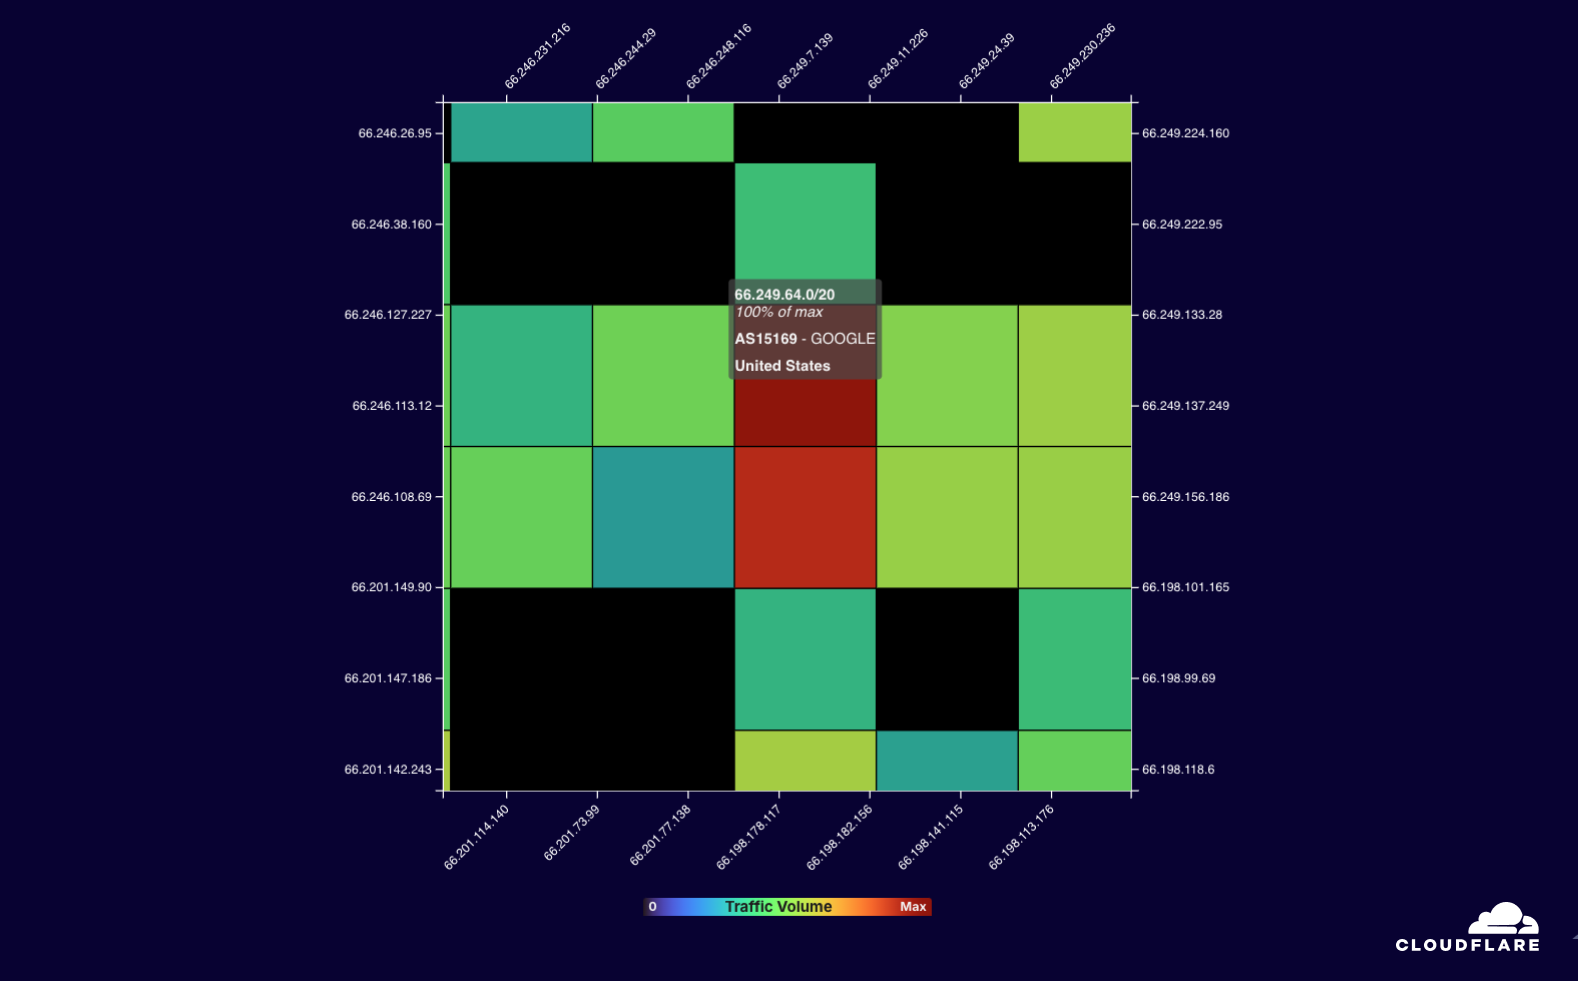
Cloudflare Radar shows users Internet traffic trends over a selected period of time, but at a country/region or network level. However, as we did in 2023, we again wanted to look at the traffic Cloudflare saw over the course of the full year from the entire IPv4 Internet. To do so, we can use Hilbert curves, which allow us to visualize a sequence of IPv4 addresses in a two-dimensional pattern that keeps nearby IP addresses close to each other, making them useful for surveying the Internet’s IPv4 address space.
Using a Hilbert curve, we can visualize aggregated IPv4 request traffic to Cloudflare from January 1 through December 1, 2024. Within the visualization, we aggregate IPv4 addresses at a /20 level, meaning that at the highest zoom level, each square represents traffic from 4,096 IPv4 addresses. This aggregation is done to keep the amount of data used for the visualization manageable. (While we would like to create a similar visualization for IPv6 traffic, the enormity of the full IPv6 address space would make associated traffic very hard to see in such a visualization, especially as such a small amount has been allocated for assignment by the Regional Internet Registries.)
Within the visualization, IP addresses are grouped by ownership, and for much of the IP address space shown there, a mouseover at the default zoom level will show the Regional Internet Registry (RIR) that the address block belongs to. However, there are also a number of blocks that were assigned prior to the existence of the RIR system, and for these, they are labeled with the name of the organization that owns them. Progressive zooming ultimately shows the autonomous system and country/region that the IP address block is associated with, as well as its share of traffic relative to the maximum. (If a country/region is selected, only the IP address blocks associated with that location are visible.) Overall traffic shares are indicated by shading based on a color scale, and although a number of large unshaded blocks are visible, this does not necessarily mean that the associated address space is unused, but rather that it may be used in a way that does not generate traffic to Cloudflare.
Hilbert curve showing aggregated 2024 traffic to Cloudflare across the IPv4 Internet
Warmer orange/red shading within the visualization represents areas of higher request volume, and buried within one of those areas is the IP address block that had the maximum request volume to Cloudflare during 2024. As it was in 2023, this address block was 66.249.64.0/20, which belongs to Google, and is one of several used by the Googlebot web crawler to retrieve content for search indexing. This use of that address space is a likely explanation for the high request volume, given the number of web properties on Cloudflare’s network.
Zoomed Hilbert curve view showing the IPv4 address block that generated the highest volume of requests
In addition to Google, owners of other prefixes in the top 20 include Alibaba, Microsoft, Amazon, and Apple. To explore the IPv4 Internet in more detail, we encourage you to go to the Year in Review microsite and explore it by dragging and zooming to move around IPv4 address space.
Among AI bots and crawlers, Bytespider (ByteDance) traffic gradually declined over the course of 2024, while ClaudeBot (Anthropic) was more active during the back half of the year.
AI bots and crawlers have been in the news throughout 2024 as they voraciously consume content to train ever-evolving models. Controversy has followed them, as not all bots and crawlers respect content owner directives to restrict crawling activity. In July, Cloudflare enabled customers to block these bots and crawlers with a single click, and during Birthday Week we introduced AI Audit to give website owners even more visibility into and control over how AI platforms access their content.
Tracking traffic trends for AI bots can help us better understand their activity over time — observing which are the most aggressive and have the highest volume of requests, which perform crawls on a regular basis, etc. The new AI bot & crawler traffic graph on Radar’s Traffic page, launched in September, provides insight into these traffic trends gathered over the selected time period for the top known AI bots.
Looking at traffic trends from two of those bots, we can see some interesting patterns. Bytespider is a crawler operated by ByteDance, the Chinese owner of TikTok, and is reportedly used to download training data for ByteDance’s Large Language Models (LLMs). Bytespider’s crawling activity trended generally downwards over the course of 2024, with end-of-November activity approximately 80-85% lower than that seen at the start of the year. ClaudeBot is Anthropic’s crawler, which downloads training data for its LLMs that power AI products like Claude. Traffic from ClaudeBot appeared to be mostly non-existent through mid-April, except for some small spikes that possibly represent test runs. Traffic became more consistently non-zero starting in late April, but after an early spike, trailed off through the remainder of the year.
Traffic trends for AI crawlers Bytespider and ClaudeBot in 2024
13.0% of TLS 1.3 traffic is using post-quantum encryption.
The term “post-quantum” refers to a new set of cryptographic techniques designed to protect data from adversaries that have the ability to capture and store current data for decryption by sufficiently powerful quantum computers in the future. The Cloudflare Research team has been exploring post-quantum cryptography since 2017.
In October 2022, we enabled post-quantum key agreement on our network by default, but use of it requires that browsers and clients support it as well. In 2024, Google’s Chrome 124 enabled it by default on April 17, and adoption grew rapidly following that release, increasing from just over 2% of requests to around 12% within a month, and ended November at 13%. We expect that adoption will continue to grow into and during 2025 due to support in other Chromium-based browsers, growing default support in Mozilla Firefox, and initial testing in Apple Safari.
Growth trends in post-quantum encrypted TLS 1.3 traffic during 2024
Adoption & Usage insights
Globally, nearly one-third of mobile device traffic was from Apple iOS devices. Android had a >90% share of mobile device traffic in 29 countries/regions; peak iOS mobile device traffic share was over 60% in eight countries/regions.
The two leading mobile device operating systems globally are Apple’s iOS and Google’s Android, and by analyzing information in the user agent reported with each request, we can get insight into the distribution of traffic by client operating system throughout the year. Again, we found that Android is responsible for the majority of mobile device traffic when aggregated globally, due to the wide distribution of price points, form factors, and capabilities.
Global distribution of mobile device traffic by operating system in 2024
In contrast, iOS adoption tops out in the 65% range in Jersey, the Faroe Islands, Guernsey, and Denmark. Adoption rates of 50% or more were seen in a total of 26 countries/regions, including Norway, Sweden, Australia, Japan, the United States, and Canada. These locations likely have a greater ability to afford higher priced devices, owing to their comparatively higher gross national income per capita.
Countries/regions with the largest share of iOS traffic in 2024
Globally, nearly half of web requests used HTTP/2, with 20.5% using HTTP/3.
HTTP (HyperText Transfer Protocol) is the core protocol that the web relies upon. HTTP/1.0 was first standardized in 1996, HTTP/1.1 in 1999, and HTTP/2 in 2015. The most recent version, HTTP/3, was completed in 2022, and runs on top of a new transport protocol known as QUIC. By running on top of QUIC, HTTP/3 can deliver improved performance by mitigating the effects of packet loss and network changes, as well as establishing connections more quickly. HTTP/3 also provides encryption by default, which mitigates the risk of attacks.
Current versions of desktop and mobile Google Chrome (and Chromium-based variants), Mozilla Firefox, and Apple Safari all support HTTP/3 by default. Cloudflare makes HTTP/3 available for free to all of our customers, although not every customer chooses to enable it.
Analysis of the HTTP version negotiated for each request provides insight into the distribution of traffic by the various versions of the protocol aggregated across the year. (“HTTP/1.x” aggregates requests made over HTTP/1.0 and HTTP/1.1.) At a global level, 20.5% of requests in 2024 were made using HTTP/3. Another 29.9% of requests were made over the older HTTP/1.x versions, while HTTP/2 remained dominant, accounting for the remaining 49.6%.
Global distribution of traffic by HTTP version in 2024
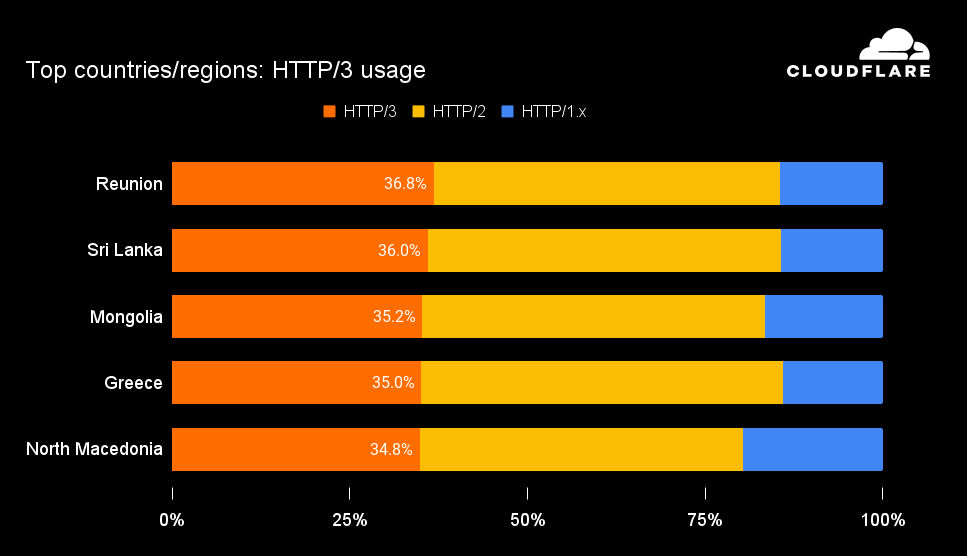
Looking at version distribution geographically, we found eight countries/regions sending more than a third of their requests over HTTP/3, with Reunion, Sri Lanka, Mongolia, Greece, and North Macedonia comprising the top five as shown below. Eight other countries/regions, including Iran, Ireland, Hong Kong, and China, sent more than half of their requests over HTTP/1.x throughout 2024. More than half of requests were made over HTTP/2 in a total of 147 countries/regions.
Countries/regions with the largest shares of HTTP/3 traffic in 2024
React, PHP, and jQuery were among the most popular technologies used to build websites, while Hubspot, Google, and WordPress were among the most popular vendors of supporting services and platforms.
Modern websites and applications are extremely complex, built on and integrating on a mix of frameworks, platforms, services, and tools. In order to deliver a seamless user experience, developers must ensure that all of these components happily coexist with each other. Using Cloudflare Radar’s URL Scanner, we again scanned websites associated with the top 5000 domains to identify the most popular technologies and services used across a dozen different categories.
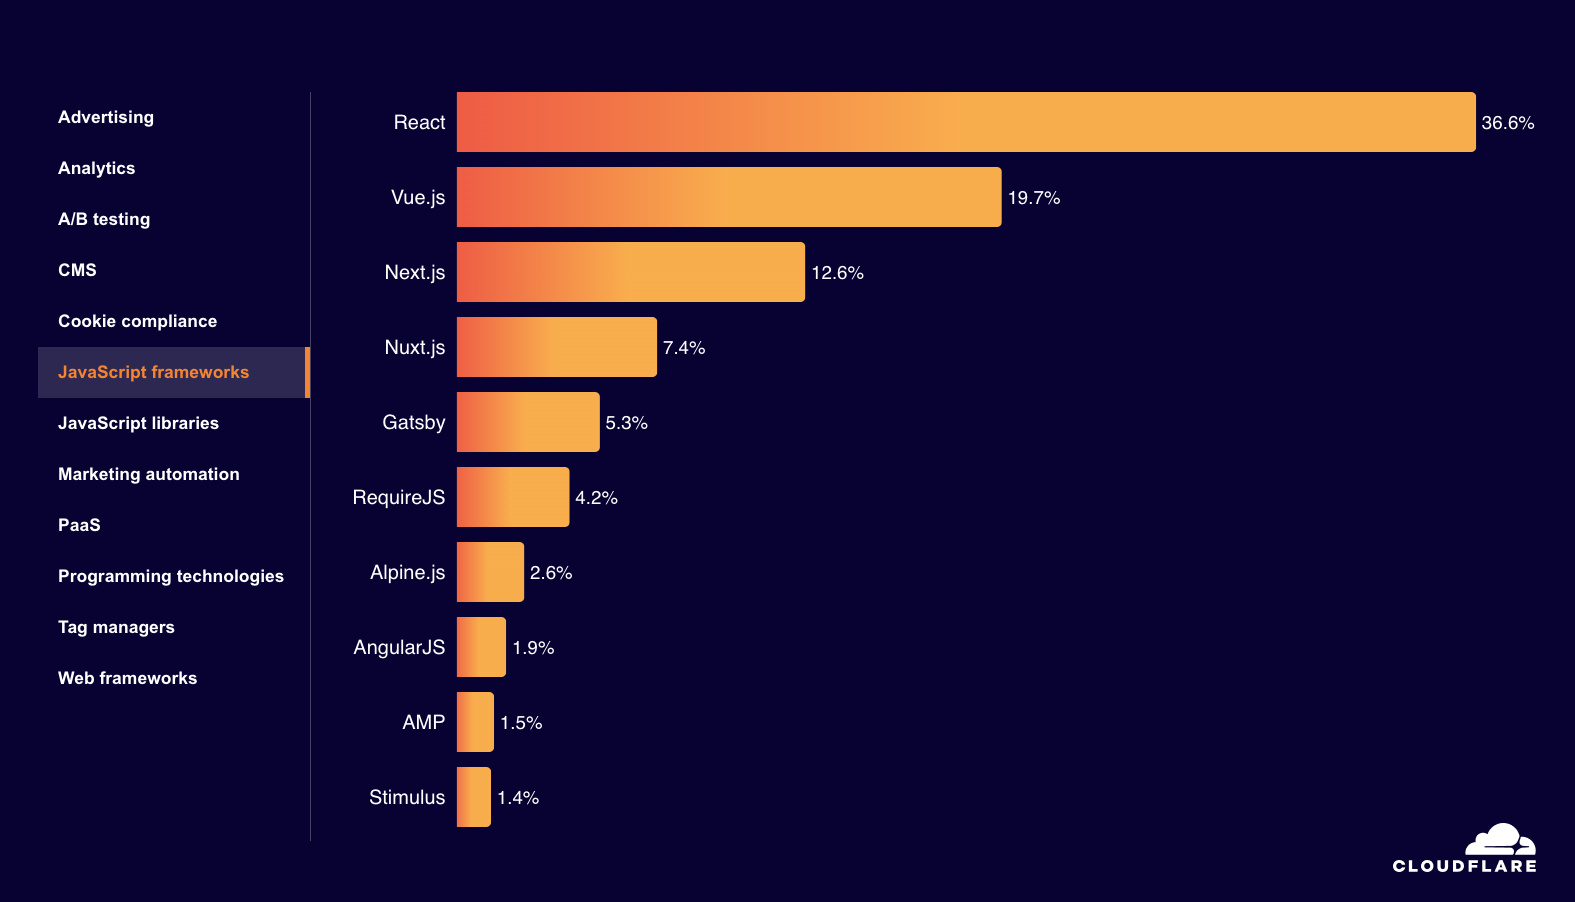
In looking at core technologies used to build websites, React had a commanding lead over Vue.js and other JavaScript frameworks, PHP was the most popular programming technology, and jQuery’s share was 10x other popular JavaScript libraries.
Third-party services and platforms are also used by websites and applications to support things like analytics, content management, and marketing automation. Google Analytics remained the most widely used analytics provider, WordPress had a greater than 50% share among content management systems, and for marketing automation providers, category leader HubSpot had nearly twice the usage share of Marketo and MailChimp.
Top website technologies, JavaScript frameworks category in 2024
Go surpassed NodeJS as the most popular language used for making automated API requests.
Many dynamic websites and applications are built on automated API calls, and we can use our unique visibility into Web traffic to identify the top languages these API clients are written in. Applying heuristics to API-related requests determined to not be coming from a person using a browser or native mobile application helps us to identify the language used to build the API client.
Our analysis found that almost 12% of automated API requests are made by Go-based clients, with NodeJS, Python, Java, and .NET holding smaller shares. Compared to 2023, Go’s share increased by approximately 40%, allowing it to capture the top spot, while NodeJS’s share fell by just over 30%. Python and Java also saw their shares increase, while .NET’s fell.
Most popular API client languages in 2024
Google is the most popular search engine globally, across all platforms. On mobile devices/OS, Baidu is a distant second. Bing is a distant second across desktop and Windows devices, with DuckDuckGo second most popular on macOS.
Protecting and accelerating websites and applications for millions of customers, Cloudflare is in a unique position to measure search engine market share data. Our methodology uses HTTP’s referer header to identify the search engine sending traffic to customer sites and applications. The market share data is presented as an overall aggregate, as well as broken out by device type and operating system. (Device type and operating system data is derived from the User-Agent and Client Hints headers accompanying a content request.)
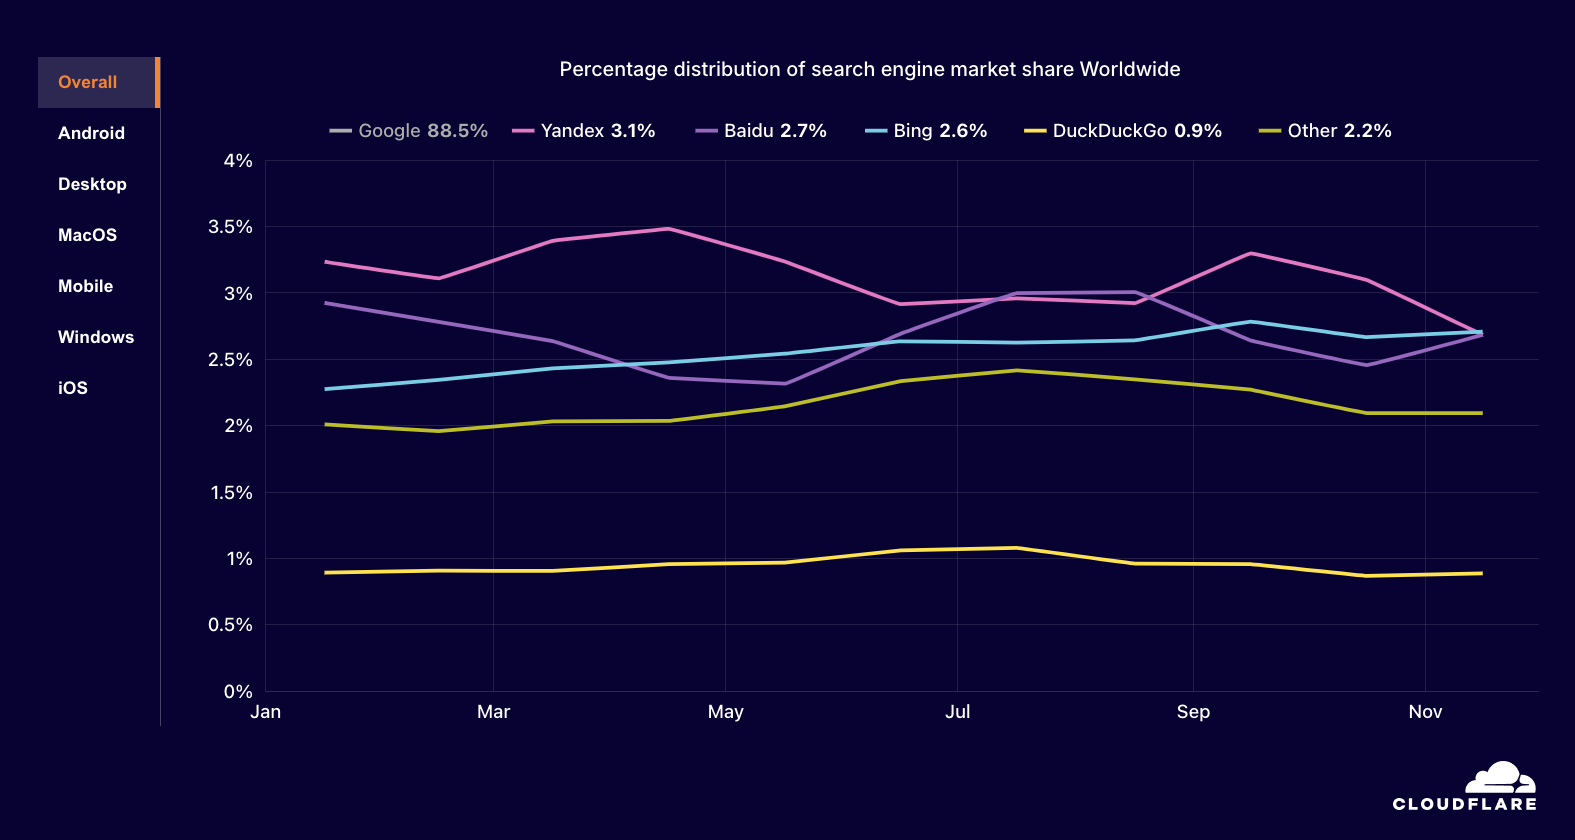
Aggregated at a global level, Google referred the most traffic to Cloudflare customers, with a greater than 88% share across 2024. Yandex, Baidu, Bing, and DuckDuckGo round out the top five, all with single digit percentage shares.
Overall worldwide search engine market share in 2024
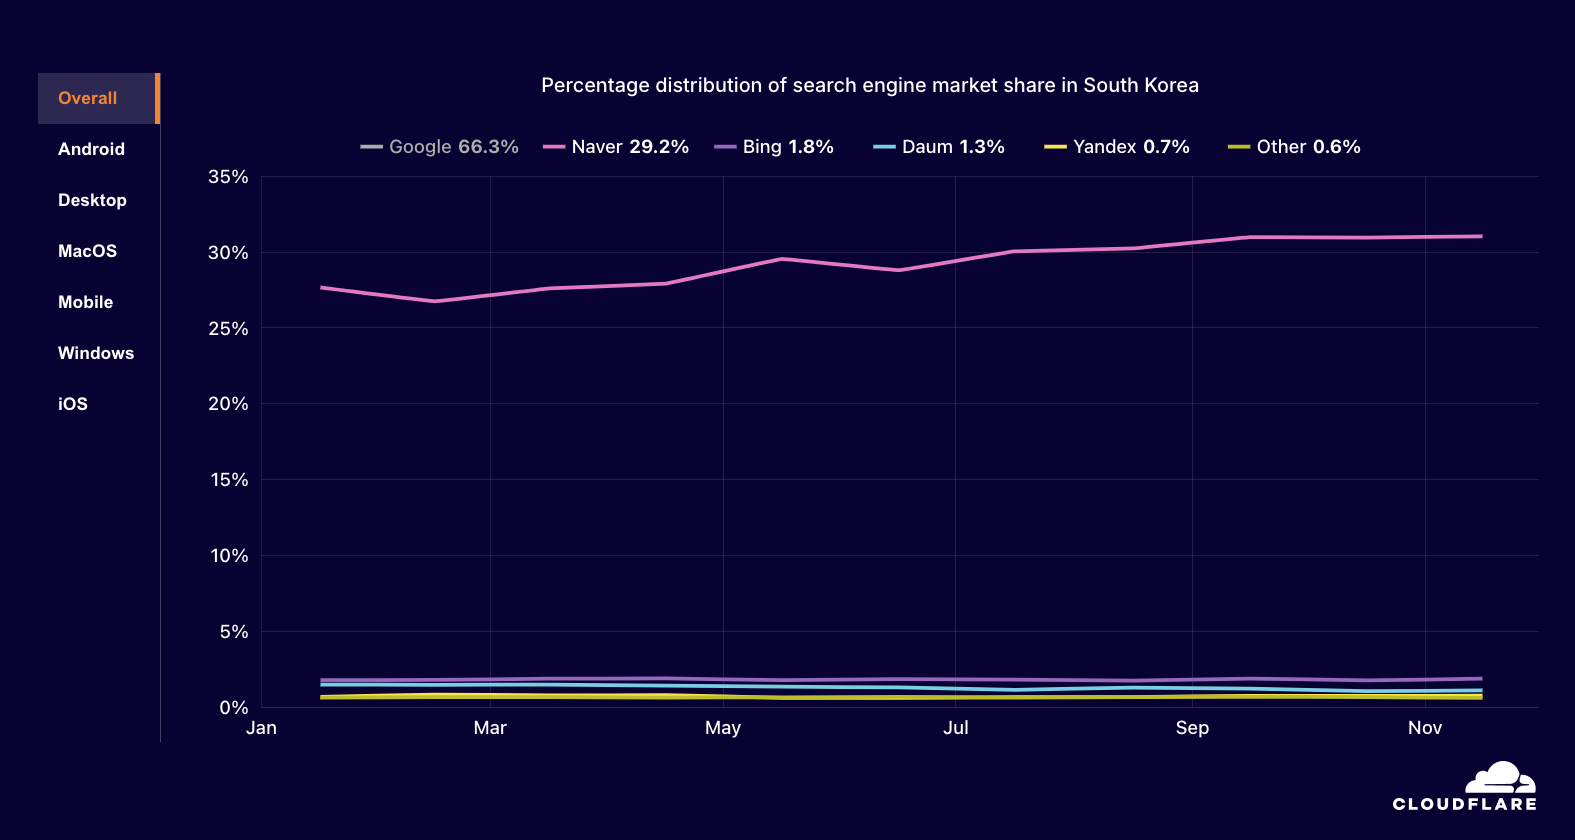
However, when drilling down by location or platform, differences are apparent in the top search engines and their shares. For example, in South Korea, Google is responsible for only two-thirds of referrals, while local platform Naver drives 29.2%, with local portal Daum also in the top five at 1.3%.
Overall search engine market share in South Korea in 2024
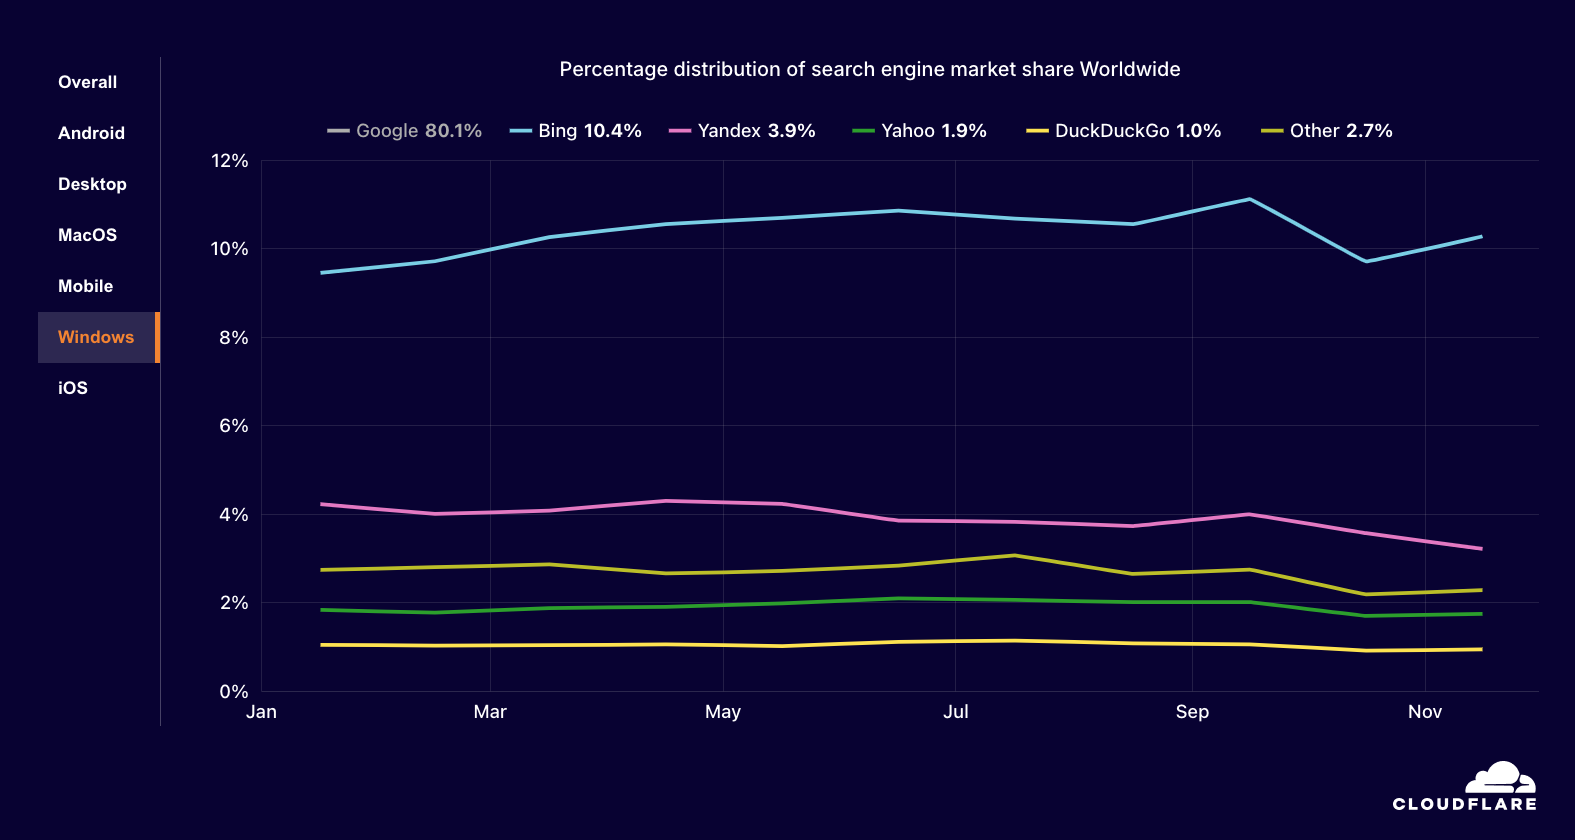
Google’s dominance is also blunted a bit on Windows devices, where it drives only 80% of referrals globally. Unsurprisingly, Bing holds the second spot for Windows users, with a 10.4% share. Yandex, Yahoo, and DuckDuckGo round out the top 5, all with shares below 5%.
Overall worldwide search engine market share for Windows devices in 2024
For additional details, including search engines aggregated under “Other”, please refer to the quarterly Search Engine Referral Reports on Cloudflare Radar.
Google Chrome is the most popular browser overall. While also true on MacOS devices, Safari usage is well ahead of Chrome on iOS devices. On Windows, Edge is the second most popular browser.
Similar to our ability to measure search engine market share, Cloudflare is also in a unique position to measure browser market share. Our methodology uses information from the User-Agent and Client Hints headers to identify the browser making content requests, along with the associated operating system. Browser market share data is presented as an overall aggregate, as well as broken out by device type and operating system. Note that the shares of browsers available on both desktop and mobile devices, such as Chrome or Safari, are presented in aggregate.
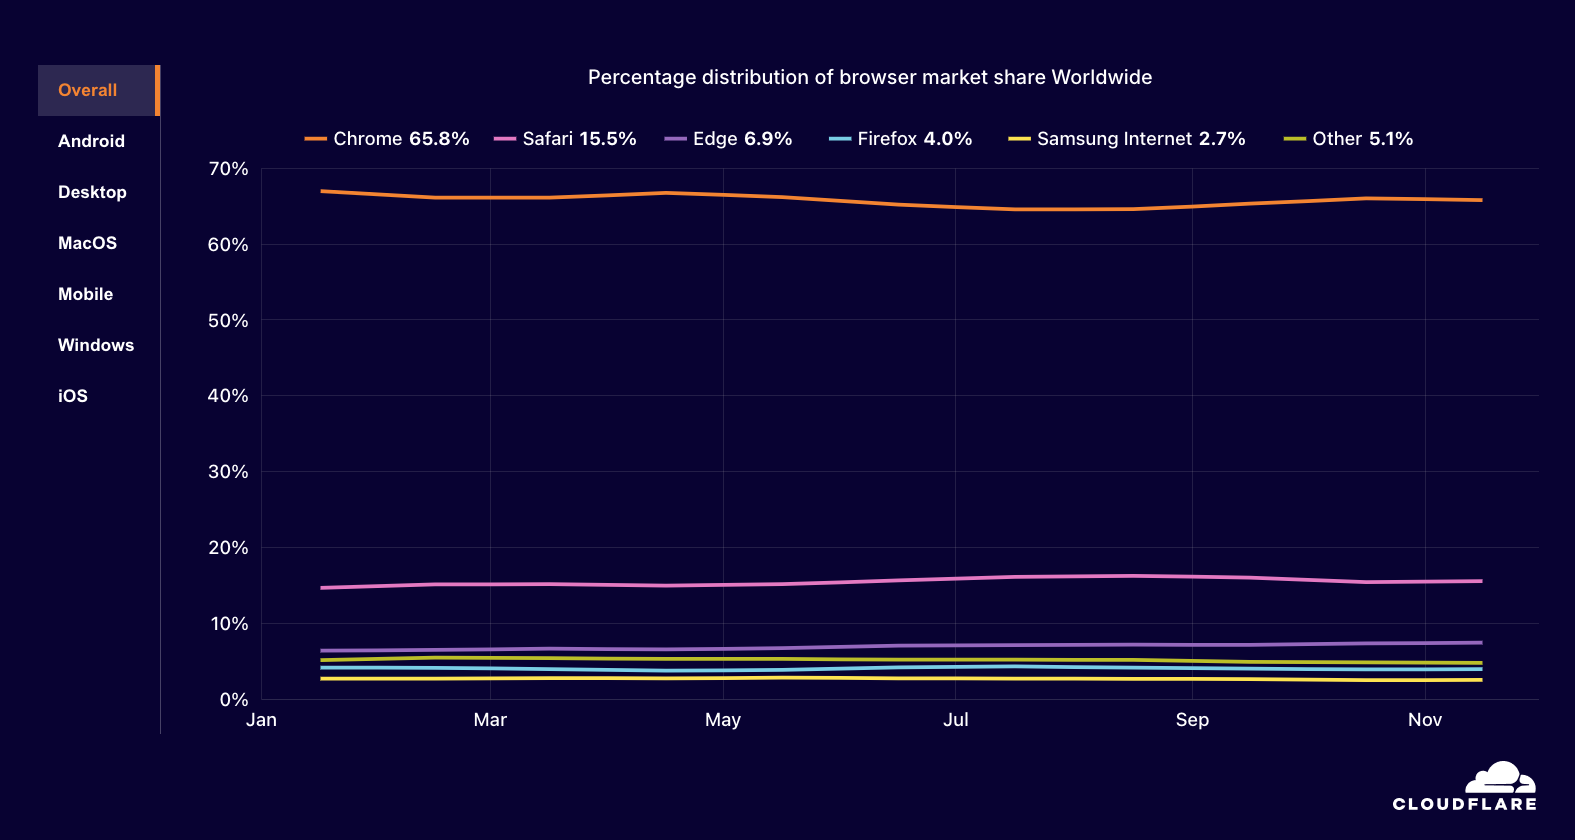
Globally, we found that 65.8% of requests came from Google’s Chrome browser across 2024, and that just 15.5% came from Apple’s Safari browser. Microsoft Edge, Mozilla Firefox, and the Samsung Internet browser rounded out the top five, all with shares below 10%.
Overall worldwide web browser market share in 2024
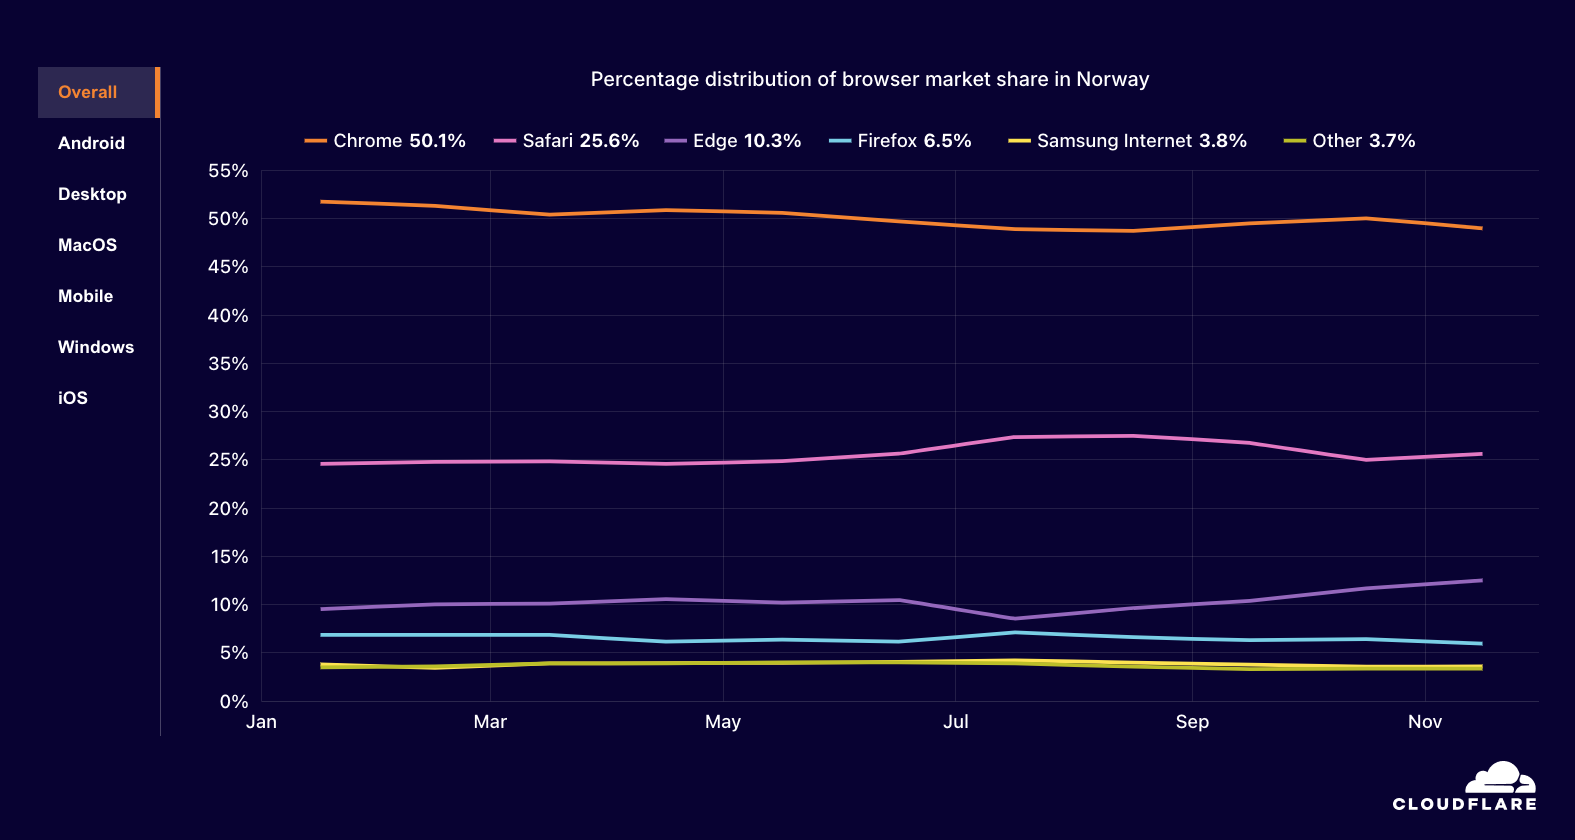
Similar to the search engine statistics discussed above, differences are clearly visible when drilling down by location or platform. In some countries where iOS holds a larger market share than Android, Chrome remains the leading browser, but by a much lower margin. For example, in Sweden, Chrome’s share fell to 56.2%, while Safari’s increased to 22.5%. In Norway, Chrome fell to just 50%, while Safari grew to 25.6%.
Overall web browser market share in Norway in 2024
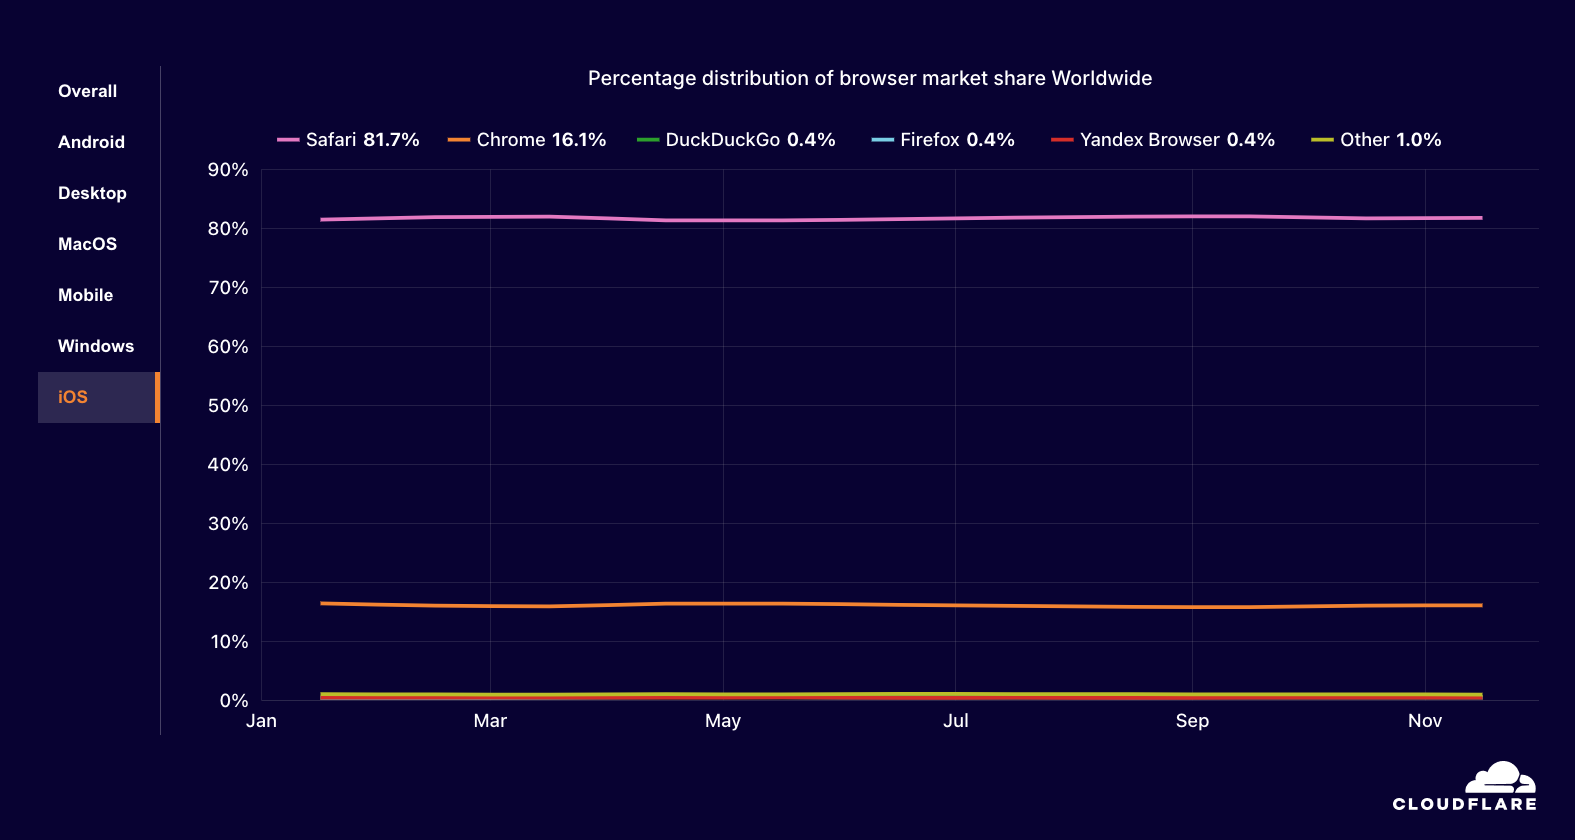
As the default browser on devices running iOS, Apple Safari was the most popular browser for iOS devices, commanding an 81.7% market share across the year, with Chrome at just 16.1%. And despite being the preinstalled default browser on Windows devices, Edge held just a 17.3% share, in comparison to Chrome’s 68.5%
Overall worldwide web browser market share for iOS devices in 2024
For additional details, including browsers aggregated under “Other”, please refer to the quarterly Browser Market Share Reports on Cloudflare Radar.
Connectivity
225 major Internet outages were observed around the world in 2024, with many due to government-directed regional and national shutdowns of Internet connectivity.
Throughout 2024, as we have over the last several years, we have written frequently about observed Internet outages, whether due to cable cuts, unspecified technical issues, government-directed shutdowns, or a number of other reasons covered in our quarterly summary posts (Q1, Q2, Q3). The impacts of these outages can be significant, including significant economic losses and severely limited communications. The Cloudflare Radar Outage Center tracks these Internet outages, and uses Cloudflare traffic data for insights into their scope and duration.
Some of the outages seen through the year were short-lived, lasting just a few hours, while others stretched on for days or weeks. In the latter category, an Internet outage in Haiti dragged on for eight days in September because repair crews were barred from accessing a damaged submarine cable due to a business dispute, while shutdowns of mobile and fixed Internet providers in Bangladesh lasted for approximately 10 days in July. In the former category, Iraq frequently experienced multi-hour nationwide Internet shutdowns intended to prevent cheating on academic exams — these contribute to the clustering visible in the timeline during June, July, August, and September.
Within the timeline on the Year in Review microsite, hovering over a dot will display metadata about that outage, and clicking on it will open a page with additional information. Below the map and timeline, we have added a bar graph illustrating the recorded reasons associated with the observed outages. In 2024, over half were due to government-directed shutdowns. If a country/region is selected, only outages and reasons for that country/region will be displayed.
Over 200 Internet outages were observed around the world during 2024
Aggregated across 2024, 28.5% of IPv6-capable requests were made over IPv6. India and Malaysia were the strongest countries, at 68.9% and 59.6% IPv6 adoption respectively.
The IPv4 protocol still used by many Internet-connected devices was developed in the 1970s, and was never meant to handle the vast and growing scale of the modern Internet. An initial specification for its successor, IPv6, was published in December 1995, evolving to a draft standard three years later, offering an expanded address space intended to better support the expected growth in the number of Internet-connected devices. At this point, available IPv4 space has long since been exhausted, and connectivity providers use solutions like Network Address Translation to stretch limited IPv4 resources. Hungry for IPv4 address space as their businesses and infrastructure grow, cloud and hosting providers are acquiring blocks of IPv4 address space for as much as \$30 – \$50 per address.
Cloudflare has been a vocal and active advocate for IPv6 since 2011, when we announced our Automatic IPv6 Gateway, which enabled free IPv6 support for all of our customers. In 2014, we enabled IPv6 support by default for all of our customers, but not all customers choose to keep it enabled for a variety of reasons. Note that server-side support is only half of the equation for driving IPv6 adoption, as end user connections need to support it as well. (In reality, it is a bit more complex than that, but server and client side support across applications, operating systems, and network environments are the two primary requirements. From a network perspective, implementing IPv6 also brings a number of other benefits.) By analyzing the IP version used for each request made to Cloudflare, aggregated throughout the year, we can get insight into the distribution of traffic by the various versions of the protocol.
At a global level, 28.5% of IPv6-capable (“dual-stack”) requests were made over IPv6, up from 26.4% in 2023. India was again the country with the highest level of IPv6 adoption, at 68.9%, carried in large part by 94% IPv6 adoption at Reliance Jio, one of the country’s largest Internet service providers. India was followed closely by Malaysia, where 59.6% of dual-stacked requests were made over IPv6 during 2024, thanks to strong IPv6 adoption rates across leading Internet providers within the country. IPv6 adoption in India was up from 66% in 2023, and in Malaysia, it was up from 57.3% last year. Saudi Arabia was the only other country with an IPv6 adoption rate above 50% this year, at 51.8%, whereas that list also included Vietnam, Greece, France, Uruguay, and Thailand in 2023. Thirty four countries/regions, including many in Africa, still have IPv6 adoption rates below 1%, while a total of 96 countries/regions have adoption rates below 10%.
Global distribution of traffic by IP version in 2024
Countries/regions with the largest shares of IPv6 traffic in 2024
The top 10 countries ranked by Internet speed all had average download speeds above 200 Mbps. Spain was consistently among the top locations across measured Internet quality metrics.
As more and more of our everyday lives move online, including entertainment, work, education, finance, shopping, and even basic social and personal interaction, the quality of our Internet connections is arguably more important than ever, necessitating higher connection speeds and lower latency. Although Internet providers continue to evolve their service portfolios to offer increased connection speeds and reduced latency in order to support growth in use cases like videoconferencing, live streaming, and online gaming, consumer adoption is often mixed due to cost, availability, or other issues. By aggregating the results of speed.cloudflare.com tests taken during 2024, we can get a geographic perspective on connection quality metrics including average download and upload speeds, and average idle and loaded latencies, as well as the distribution of the measurements.
In 2024, Spain was a leader in download speed (292.6 Mbps) and upload speed (192.6 Mbps) metrics, and placed second globally for loaded latency (78.6 ms). (Loaded latency is the round-trip time when data-heavy applications are being used on the network.) Spain’s leadership in these connection quality metrics is supported by the strong progress that the country has made towards achieving the EU’s “Digital Decade” objectives, including fixed very high capacity network (VHCN) deployment, fiber-to-the-premises (FTTP) coverage, and 5G coverage with the latter two reaching 95.2% and 92.3% respectively. High speed fiber broadband connections are also relatively affordable, with research showing major providers offering 100 Mbps, 300 Mbps, 600 Mbps, and 1 Gbps packages, with the latter priced between €30 and €46 per month. The figures below for Spain show the largest clusters of speed measurements around the 100 Mbps mark, with slight bumps also visible around 300 Mbps, suggesting that the former package has the highest subscription rate, followed by the latter. Further, they show these connections are also relatively low latency, with 87% of idle latency measurements below 50 ms and 65% of loaded latency measurements below 100 ms, providing users with good gaming and videoconferencing/streaming experiences.
Measured download/upload speed distribution in Spain in 2024
Measured idle/loaded latency distribution in Spain in 2024
41.3% of global traffic comes from mobile devices. In nearly 100 countries/regions, the majority of traffic comes from mobile devices.
With approximately 70% of the world’s population using smartphones, and 91% of Americans owning a smartphone, these mobile devices have become an integral part of both our personal and professional lives, providing us with Internet access from nearly any place at any time. In some countries/regions, mobile devices primarily connect to the Internet via Wi-Fi, while other countries/regions are “mobile first”, where 4G/5G services are the primary means of Internet access.
Analysis of information contained with the user agent reported with each request to Cloudflare enables us to categorize it as coming from a mobile, desktop, or other type of device. Aggregating this categorization throughout the year at a global level, we found that 41.3% of traffic came from mobile devices, with 58.7% coming from desktop devices such as laptops and “classic” PCs. These traffic shares were in line with those measured in both 2023 and 2022, suggesting that mobile device usage has achieved a “steady state”. Over 77% of traffic came from mobile devices in Sudan, Cuba, and Syria, making them the countries/regions with the largest mobile device traffic share in 2024. Other countries/regions that had more than 50% of traffic come from mobile devices were concentrated in the Middle East/Africa, the Asia Pacific region, and South/Central America.
Global distribution of traffic by device type in 2024
Countries/regions with the largest shares of mobile device usage in 2024
20.7% of TCP connections are unexpectedly terminated before any useful data can be exchanged.
Cloudflare is in a unique position to help measure the health and behaviors of Internet networks around the world. One way we do this is passively measuring rates of connections to Cloudflare that appear anomalous, meaning that they are unexpectedly terminated before any useful data exchange occurs. The underlying causes of connection anomalies are varied and range from DoS attacks to quirky client behavior to third-party connection tampering (e.g., when a network monitors and selectively disrupts connections to filter content).
Connection anomalies are symptoms — visible signs that “something abnormal” is happening in a network, but the underlying root cause is not always clear from the outset. However, we can gain a better understanding by incorporating previously-reported network behaviors, active measurements and on-the-ground reports, and macro trends across networks. Additional details on such analysis can be found in the blog posts A global assessment of third-party connection tampering andBringing insights into TCP resets and timeouts to Cloudflare Radar.
Insights into TCP connection anomalies were launched on Cloudflare Radar in September, with the plot lines in the associated graph corresponding to the stage of the TCP connection in which the connection anomalously closed (using shorthand, the first three messages we typically receive from the client in a TCP connection are “SYN” and “ACK” packets to establish a connection, and then a “PSH” packet indicating the requested resource). In aggregate globally, over 20% of connections to Cloudflare were terminated unexpectedly, with the largest share (nearly half) being closed “Post SYN” — that is, after our server has received a client’s SYN packet, but before we have received a subsequent acknowledgement (ACK) from the client or any useful data that would follow the acknowledgement. These terminations can often be attributed to DoS attacks or Internet scanning. Post-ACK (3.1% globally) and Post-PSH (1.4% globally) anomalies are more often associated with connection tampering, especially when they occur at high rates in specific networks.
Trends in TCP connection anomalies by stage in 2024
Security
6.5% of global traffic was mitigated by Cloudflare’s systems as being potentially malicious or for customer-defined reasons.
To protect customers from threats posed by malicious bots used to attack websites and applications, Cloudflare mitigates this attack traffic using DDoS mitigation techniques or Web Application Firewall (WAF) Managed Rules. For a variety of other reasons, customers may also want Cloudflare to mitigate traffic using techniques like rate-limiting requests, or blocking all traffic from a given location, even if it isn’t malicious. Analyzing traffic to Cloudflare’s network throughout 2024, we looked at the overall share that was mitigated for any reason, as well as the share that was blocked as a DDoS attack or by WAF Managed Rules.
In 2024, 6.5% of global traffic was mitigated, up almost one percentage point from 2023. Just 3.2% was mitigated as a DDoS attack, or by WAF Managed Rules, a rate slightly higher than in 2023. More than 10% of the traffic originating from 44 countries/regions had mitigations generally applied, while DDoS/WAF mitigations were applied to more than 10% of the traffic originating from just seven countries/regions.
At a country/region level, Albania had one of the highest mitigated traffic shares throughout the year, at 42.9%, while Libya had one of the highest shares of traffic that was mitigated as a DDoS attack or by WAF Managed Rules, at 19.2%. In 2023’s Year in Review blog post, we highlighted the United States and Korea. This year, the share of mitigated traffic grew to 5.0% in the United States (up from 3.65% in 2023), while in South Korea, it dropped slightly to 8.1%, down from 8.36%.
Trends in mitigated traffic worldwide in 2024
The United States was responsible for over a third of global bot traffic. Amazon Web Services was responsible for 12.7% of global bot traffic, and 7.8% came from Google.
Bot traffic describes any non-human Internet traffic, and by monitoring traffic suspected to be from bots site and application owners can spot and, if necessary, block potentially malicious activity. However, not all bots are malicious — bots can also be helpful, and Cloudflare maintains a list of verified bots that includes those used for things like search engine indexing, performance testing, and availability monitoring. Regardless of intent, we analyzed where bot traffic was originating from in 2024, using the IP address of a request to identify the network (autonomous system) and country/region associated with the bot making the request. Cloud platforms remained among the leading sources of bot traffic due to a number of factors. These include the ease of using automated tools to quickly provision compute resources, the relatively low cost of using these compute resources in an ephemeral manner, the broadly distributed geographic footprint of cloud platforms, and the platforms’ high-bandwidth Internet connectivity.
Globally, we found that 68.5% of observed bot traffic came from the top 10 countries in 2024, with the United States responsible for half of that total, over 5x the share of second place Germany. (In comparison to 2023, the US share was up slightly, while Germany’s was down slightly.) Among cloud platforms that originate bot traffic, Amazon Web Services was responsible for 12.7% of global bot traffic, and 7.8% came from Google. Microsoft, Hetzner, Digital Ocean, and OVH all also contributed more than a percent each.
Global bot traffic distribution by source country in 2024
Global bot traffic distribution by source network in 2024
Globally, Gambling/Games was the most attacked industry, slightly ahead of 2023’s most targeted industry, Finance.
The industries targeted by attacks often shift over time, depending on the intent of the attackers. They may be trying to cause financial harm by attacking ecommerce sites during a busy shopping period, gain an advantage against opponents by attacking an online game, or make a political statement by attacking government-related sites. To identify industry-targeted attack activity during 2024, we analyzed mitigated traffic for customers that had an associated industry and vertical within their customer record. Mitigated traffic was aggregated weekly by source country/region across 19 target industries.
Companies in the Gambling/Games industry were, in aggregate, the most attacked during 2024, with 6.6% of global mitigated traffic targeting the industry. The industry was slightly ahead of Finance, which led 2023’s aggregate list. (Both industries are shown at 6.6% in the Summary view due to rounding.) Gambling/Games sites saw the largest shares of mitigated traffic in January and the first week of February, possibly related to National Football League playoffs in the United States, heading into the Super Bowl.
Attacks targeting Finance organizations were most active in May, reaching a peak of 15.3% of mitigated traffic the week of May 13. This is in line with the figure in our DDoS threat report for Q2 2024 that shows that Financial Services was the most attacked industry by request volume during the quarter in South America and the Middle East region.
As we have seen in the past, peak attack activity varied by industry on a weekly basis. The highest peaks for the year were seen in attacks targeting People & Society organizations (19.6% of mitigated traffic, week of January 1), the Autos & Vehicles industry (29.7% of mitigated traffic, week of January 15), and the Real Estate industry (27.5% of mitigated traffic, week of August 26).
Global mitigated traffic share by industry in 2024, summary view
Log4j remains a persistent threat and was actively targeted throughout 2024.
In December 2021, we published a series of blog posts about the Log4j vulnerability, highlighting the threat that it posed, our observations of attempted exploitation, and the steps we took to protect customers. Two years on, in our 2023 Year in Review, we noted that even as an older vulnerability, Log4j remained a top target for attacks during 2023, with related attack activity significantly higher than other commonly exploited vulnerabilities.
In 2024, three years after the initial Log4j disclosure, we found that Log4j remains an active threat. This year, we compared normalized daily attack activity for Log4j with attack activity for Atlassian Confluence Code Injection, a vulnerability we examined in the 2023 Year in Review, as well as aggregated daily attack activity for multiple CVEs related to Authentication Bypass and Remote Code Execution vulnerabilities published in 2024.
Log4j attack activity appeared to trend generally upwards across the year, with several significant spikes visible during the first half of the year, and then again in October and November. In terms of the difference in activity, Log4j ranges from approximately 4x to over 20x the activity seen for Atlassian Confluence Code Injection, and as much as 100x the aggregated activity seen for Authentication Bypass or Remote Code Injection vulnerabilities.
Global attack activity trends for commonly exploited vulnerabilities in 2024
Routing security, measured as the share of RPKI valid routes and the share of covered IP address space, continued to improve globally throughout 2024.
As the routing protocol that underpins the Internet, Border Gateway Protocol (BGP) communicates routes between networks, enabling traffic to flow between source and destination. BGP, however, relies on trust between networks, and incorrect information shared between peers, whether or not it was shared intentionally, can send traffic to the wrong place, potentially with malicious results. Resource Public Key Infrastructure (RPKI) is a cryptographic method of signing records that associate a BGP route announcement with the correct originating autonomous system (AS) number, providing a way of ensuring that the information being shared originally came from a network that is allowed to do so. (It is important to note that this is only half of the challenge of implementing routing security, because network providers also need to validate these signatures and filter out invalid announcements to prevent sharing them further.)
Cloudflare has long been an advocate for routing security, including being a founding participant in the MANRS CDN and Cloud Programme and providing a public tool that enables users to test whether their Internet provider has implemented BGP safely. Building on insights available in the Routing page on Cloudflare Radar, we analyzed data from RIPE NCC’s RPKI daily archive to determine the share of RPKI valid routes (as opposed to those route announcements that are invalid or whose status is unknown) and how that share has changed over the course of 2024, as well as determining the share of IP address space covered by valid routes. The latter metric is of interest because a route announcement covering a significant amount of IP address space (millions of IPv4 addresses, for example) has a greater potential impact than an announcement covering a small block of IP address space (hundreds of IPv4 addresses, for example).
At a global level during 2024, we saw a 6.4 percentage point increase (from 43.4% to 49.8%) in valid IPv4 routes, and a 3.2 percentage point increase (from 53.7% to 56.9%) in valid IPv6 routes. Given the trajectory, it is likely that over half of IPv4 routes will be RPKI valid by the end of calendar year 2024. Looking at the global share of IP address space covered by valid routes, we saw a 4.7 percentage point increase (from 38.9% to 43.6%) for IPv4, and a 3.3 percentage point increase (from 57.6% to 60.9%) for IPv6.
Shares of global RPKI valid routing entries by IP version in 2024
Shares of globally announced IP address space covered by RPKI valid routes in 2024
Spain started 2024 with less than half of its routes (both IPv4 and IPv6) RPKI valid. However, the share of valid routes grew significantly on February 15, when AS12479 (Orange Espagne) signed records associated with 98% of their IP address prefixes that were previously in an “unknown” (or NotFound) state of RPKI validity, thus converting these prefixes from unknown to valid. That drove an immediate increase for IPv4 to 76%, reaching 81% validity by December 1, and an immediate increase for IPv6 to 91%, reaching 92.9% validity by December 1. A notable change in covered IP address space was observed in Cameroon, where covered IPv4 space more than doubled at the end of January, growing from 32% to 82%. This was due to AS36912 (Orange Cameroun) signing records associated with all of their IPv4 address prefixes, changing the associated IP address space to RPKI valid.
IPv4 and IPv6 shares of RPKI valid routes for Spain in 2024
Share of IPv4 address space covered by RPKI valid routes for Cameroon in 2024
Email Security
An average of 4.3% of emails were determined to be malicious in 2024.
Despite the growing enterprise use of collaboration/messaging apps, email remains an important business application and is a very attractive entry point into enterprise networks for attackers. Attackers will send targeted malicious emails that attempt to impersonate an otherwise legitimate sender (such as a corporate executive), that try to get the user to click on a deceptive link, or that contain a dangerous attachment, among other types of threats. Cloudflare Email Security protects customers from email-based attacks, including those carried out through targeted malicious email messages. During 2024, an average of 4.3% of emails analyzed by Cloudflare were found to be malicious. Aggregated at a weekly level, spikes above 14% were seen in late March, early April, and mid-May. We believe that these spikes were related to targeted “backscatter” attacks, where the attacker flooded a target with undeliverable messages, which then bounced the messages to the victim, whose email had been set as the reply-to: address.
Global malicious email share trends in 2024
Deceptive links and identity deception were the two most common types of threats found in malicious email messages.
Attackers use a variety of techniques, which we refer to as threat categories, when they use malicious email messages as an attack vector. These categories are defined and explored in detail in our phishing threats report. In our analysis of malicious emails, we have found that such messages may contain multiple types of threats. In reviewing a weekly aggregation of threat activity trends for these categories, we found that, averaged across 2024, 42.9% of malicious email messages contained deceptive links, with the share reaching 70% at times throughout the year. Activity for this thread category was spiky, with low points seen in the March to May timeframe, and a general downward trend visible from July through November.
Identity deception was a similarly active threat category, with such threats also found in up to 70% of analyzed emails several weeks throughout the year. Averaged across 2024, 35.1% of emails contained attempted identity deception. The activity pattern for this threat category appears to be somewhat similar to deceptive links, with a number of the peaks and valleys occurring during the same weeks. At times, identity deception was a more prevalent threat in analyzed emails than deceptive links, as seen in the graph below.
Among other threat categories, extortion saw the most significant change throughout the year. After being found in 86% of malicious emails during the first week of January, its share gradually trended lower throughout the year, finishing November under 10%.
Global malicious email threat category trends for Deceptive Links and Identity Deception in 2024
Over 99% of the email messages processed by Cloudflare Email Security from the .bar, .rest, and .uno top level domains (TLDs) were found to be either spam or malicious in nature.
In March 2024, we launched a set of email security insights on Cloudflare Radar, including visibility into so-called “dangerous domains” — those top level domains (TLDs) that were found to be the sources of the most spam or malicious email among messages analyzed by Cloudflare Email Security. The analysis is based on the sending domain’s TLD, found in the From: header of an email message. For example, if a message came from [email protected], then example.com is the sending domain, and .com is the associated TLD.
In aggregate across 2024, we found that the .bar, .rest, and .uno TLDs were the “most dangerous”, each with over 99% of analyzed email messages characterized as either spam or malicious. (These TLDs are all at least a decade old, and each sees at least some usage, with between 20,000 and 60,000 registered domain names.) Sorting by malicious email share, the .ws ccTLD (country code top level domain) belonging to Western Samoa came out on top, with over 90% of analyzed emails categorized as malicious. Sorting by spam email share, .quest is the biggest offender, with over 88% of emails originating from associated domains characterized as spam.
TLDs originating the largest total shares of malicious and spam email in 2024
Conclusion
The Internet is an amazingly complex and dynamic organism, constantly changing, growing, and evolving.
With the Cloudflare Radar 2024 Year In Review, we are providing insights into the change, growth, and evolution that we have measured and observed throughout the year. Trend graphs, maps, tables, and summary statistics provide our unique perspectives on Internet traffic, Internet quality, and Internet security, and how key metrics across these areas vary around the world and over time.
We strongly encourage you to visit the Cloudflare Radar 2024 Year In Review microsite and explore the trends for your country/region, and to consider how they impact your organization so that you are appropriately prepared for 2025. In addition, for insights into the top Internet services across multiple industry categories, we encourage you to read the companion Year in Review blog post, From ChatGPT to Temu: ranking top Internet services in 2024.
As it is every year, it truly is a team effort to produce the data, microsite, and content for our annual Year in Review, and I’d like to acknowledge those team members that contributed to this year’s effort. Thank you to: Jorge Pacheco, Sabina Zejnilovic, Carlos Azevedo, Mingwei Zhang (Data Analysis); André Jesus, Nuno Pereira (Front End Development); João Tomé (Most popular Internet services); Jackie Dutton, Kari Linder, Guille Lasarte (Communications); Eunice Giles (Brand Design); Jason Kincaid (blog editing); and Paula Tavares (Engineering Management), as well as countless other colleagues for their answers, edits, support, and ideas.
Since the late 1990s, millions have relied on the Internet for searching, communicating, shopping, and working, though 2.6 billion people (about 31% of the global population) still lack Internet access. Over the years, use of the Internet has evolved from email and static sites to social media, streaming, e-commerce, cloud tools, and more recently AI chatbots, reflecting its constant adaptation to users’ needs. This post explores how people interacted online in 2024, based on Cloudflare’s observations and a review of the year’s DNS trends.
Building on similar reports we’ve done over the past several years, we have compiled a ranking of the top Internet properties of 2024, with the same categories included in 2023, including Generative AI. In addition to our overall ranking, we chose 9 categories to focus on:
As we have done since 2022, our analysis uses anonymized DNS query data from our 1.1.1.1 public DNS resolver, used by millions globally. We aggregate domains for each service (e.g., twitter.com, t.co, and x.com for X) and identify the sites that provide services to humans, thus excluding technical domains like root-servers.net. Rankings reflect relative popularity within categories, not absolute traffic. Therefore, a drop in rank doesn’t always indicate less traffic to a specific Internet service — it may simply reflect increased competition from other services, leading to a change in rank.
This part of the 2024 Cloudflare Radar Year in Review highlights shifts in Internet services, with rising platforms like Temu, GitHub Copilot, and WeChat reflecting changing user preferences. ChatGPT (OpenAI) also played a more prominent role in the generative AI space and in our Overall ranking, nearly reaching the Top 50. Major events like the Paris Olympics and US elections influenced rankings as well, boosting Olympics-related sites and news platforms like CNN and Fox News.
Keep reading for a detailed look at the evolution of trends throughout the year. For more, visit our 2024 Cloudflare Radar Year in Review microsite. Along with the lists of most popular Internet services, the Year in Review microsite and its associated blog post explore a number of additional metrics.
Google is again #1. Facebook, Apple and TikTok follow
Since 2021, we’ve started our review of rankings with an Overall Top 10 list, showcasing the most popular Internet services globally based on DNS traffic from our 1.1.1.1 resolver. Unsurprisingly, Google (including services like Google Maps and Google Calendar) remained the #1 Internet service in 2024. Since introducing our ranking method two years ago, no other service has come close to challenging Google’s top spot. It’s important to note that Apple and Microsoft are similar to Google in that their main domains (apple.com or microsoft.com) are used for many different services. We include other services separately, such as Outlook or iCloud, which use their own specific domains.
Top 10 most popular Internet services in 2024, overall
Google
Facebook
Apple
TikTok
Amazon Web Services
Microsoft
Instagram
YouTube
Amazon
WhatsApp
Beyond Google, Facebook consistently held the #2 spot throughout 2024. Last year, it competed with Apple for that position. Apple, which uses domains like apple.com for services related to its software and devices, was generally #3. However, TikTok challenged that position on several days since late August. Amazon Web Services (AWS), differentiated from Amazon by domains like amazonaws.com, performed better this year compared to 2023. It held the #5 spot but often traded places with Microsoft during the year.
Instagram also rose in the rankings. It was around #8 in 2023 and steadily improved. Now, it holds the #7 spot, ahead of YouTube.
Amazon remained at #9 for most of the year, the same as in 2023. WhatsApp, owned by Meta, appeared in the Top 10 for the first time, taking the #10 spot.
Close to the Top 10 were Apple’s iCloud, Netflix (which performs better on weekends), and Microsoft’s Outlook.
In the chart below, you can follow the evolution of the top Internet services in our Overall ranking throughout the year.
In 2022, X (then known as Twitter) ranked as high as #10 in our overall ranking and was close to Instagram. It never reached the top 10 in 2023, and in 2024, X dropped further, to #14 or #15. More on X’s performance in the Social Media category below.
Ready to face the Generative AI era?
Generative AI gained global attention in late 2022 with the launch of ChatGPT, and became a global phenomenon during 2023. By 2024, ChatGPT (OpenAI) continues to be by far the most popular service in this category, which includes chatbots, coding bots, and more. Other generative AI services had more stable rankings compared to 2023.
Top 10 Generative AI services in 2024
ChatGPT (OpenAI)
Character.AI
Codeium
QuillBot
Claude (Anthropic)
Perplexity
GitHub Copilot
Wordtune
Poe
Tabnine
Significant changes occurred below ChatGPT’s first place ranking throughout the year. Character.AI, an AI-driven chatbot platform, maintained a strong #2 position, staying ahead of Codeium, a code-generation AI tool that has improved its position since June, and Quillbot, an AI writing and paraphrasing tool.
Claude, the AI chatbot from Anthropic, rose in the rankings, particularly after March 4, when the new model, Claude 3, was introduced, and again later in May when it became available in Europe. It reached #5 in June. Perplexity, an AI-driven search and Q&A platform, started the year outside the Top 10 but ended close to Claude. It surpassed Claude for the first time on November 6, 2024, the day after the U.S. elections, reaching #6.
This next chart shows movement among the Generative AI services that were more popular later in the year.
GitHub Copilot’s rise to the Top 10
Several new players entered the Top 10 AI rankings in 2024, showing strong growth. GitHub Copilot, an AI-powered coding assistant, experienced the fastest rise, entering the Top 10 in September (after reaching the Top 20 in June) and staying mostly between #5 and #3 by November, as the next chart shows. Similarly, Suno AI, an AI-powered audio and music generation platform, entered the Top 10 in April, briefly dropped out, but stabilized between #6 and #10 after October — in November, it ranked #6 on weekends.
Some platforms lost ground in the rankings. Wordtune, an AI writing assistant, peaked at #4 during mid-year but declined afterward. Tabnine, another AI-powered coding assistant, held the #5 spot for months but slipped after July. In contrast, Sider AI, a coding assistant, entered the Top 20 in March and finished the year around #12. Poe, an AI chatbot platform, ranked #5 in 2023 and between #5 and #6 before June, but ended 2024 moving around #10, performing better during weekends.
Google Gemini, Google’s AI assistant and model, performed better on weekdays and started the year ranking between #7 and #10, but dropped out of the Top 10 after July as newer AI platforms gained momentum. Hugging Face, an open-source AI and machine learning platform, mostly fluctuated between #7 and #9 during the year, peaking at #4 on August 18 around the time several models were updated, and and as it reached its milestone of 5 million users. However, it fell out of the Top 10 by September.
Midjourney, an AI-powered platform for generating images, performed well until June, when it was close to the Top 10. Additionally, the OpenAI API ranked #18 in the Generative AI category on May 14-15, coinciding with OpenAI’s announcement of GPT-4o availability, including in the API.
ChatGPT’s growth to the Top 50 of our Overall category
Notable trends that we observed when looking at trends for Generative AI services within our larger Overall ranking include:
ChatGPT continued its growth in 2024, similar to 2023. In early 2023, it ranked around #200 and ended the year near the top 100. In 2024, it started close to the top 100, reached the top 60 in May with the release of the 4o model, and has been near the top 50 since September, aligning with the return of workers and students to their routines. It ranks higher on weekdays, averaging #56, and drops on weekends.
Comparing ChatGPT with other known and non-AI related websites, by late November, ChatGPT ranked ahead of Weather.com, Temu, eBay, Telegram, Google Calendar, and Prime Video, but trailed Disney Plus
Character.ai also showed a clear growth trend in our Overall ranking, from outside the top 200 earlier in the year, to above #180 after July, performing better in August, reaching as high as #161. The AI-driven chatbot platform performed better on weekends than on weekdays, the opposite of ChatGPT.
Codeium entered the top 300 in July. It ranked higher on weekdays than weekends.
Social media: Snapchat closing in on X
According to Kepios, there are an estimated 5.22 billion social media users worldwide in 2024 (up from 4.95 billion last year), representing 63.8% of the global population. Social media continues to play a major role in daily life, serving as a key platform for communication, information, and attention.
Once again, social media giants like Facebook, TikTok, and Instagram dominate, ranking among the top 10 most popular Internet services overall.
Top 10 Social Media services in 2024
Facebook
TikTok
Instagram
X
Snapchat
LinkedIn
Discord
Kwai
Pinterest
Reddit
In the Social Media category rankings, the top seven remain unchanged from last year. However, there are notable developments in this category. In 2022, X briefly challenged Instagram for the #3 spot during a few days. Since 2023, X has held a solid #4 position, with Snapchat closing in and reaching #4 for the first time on several days in September and October.
LinkedIn stayed steady at #6, followed by Discord. Kwai, a Chinese video app popular in Brazil (with 60 million reported users) and other countries (a reported ), rose from #10 last year to #8. Further down the list, Pinterest kept its #9 rank, while Reddit, previously #8 in 2023, dropped to #10 this year, but peaked at #7 on November 26, just before Black Friday and Thanksgiving in the US. Here’s the Social Media Top 10 chart for 2024:
Our global ranking also highlights several non-Western platforms in the Top 20. These include Douyin (#11), the Chinese version of TikTok; VK (#12), often referred to as the Russian Facebook; and TikTok rivals popular in Southeast Asia SnackVideo (#13) by Chinese Kuaishou (that also owns Kwai). OnlyFans appeared consistently in the Top 20 starting in September, ranking around #18 and surpassing Tumblr by late November.
The #18 spot was briefly held by X alternative Threads (by Instagram) in late September and by Bluesky starting November 18. Mastodon-related servers reached as high as #19 for several days since late August. Here’s a look at X (on top) and its alternatives in this category:
Alternatives to X: Bluesky, Threads, and Mastodon
Let’s move beyond the Social Media category to see how these platforms performed in our Overall ranking, where bigger shifts between services are evident.
As we’ve seen, Threads, Bluesky, and Mastodon (via an aggregation of popular servers) didn’t break into the Top 10 of the Social Media category. However, in the Overall ranking, Mastodon servers, bundled together, consistently ranked between #208 and #248, performing better on weekends.
Bluesky entered the Top 250 in September 2024, and gained additional attention after the US elections. It rose sharply after November 14, peaking at #193 on November 20, and has since stabilized around #220.
Threads entered the Top 250 in August 2024, peaking at #183 on September 24 before dropping out in October. In 2023, Threads peaked at #227 in early July but fell out of the Top 250 by late August. It’s worth noting that Threads also uses Instagram’s cdninstagram.com for images and videos, which may influence Threads position in our DNS rankings (that said, Instagram wasn’t impacted by Threads appearance in our rankings).
Here are some other trends we observed among social media apps, and how they did in our Overall ranking:
Instagram’s best day (#6 in the Overall ranking) was August 5, 2024, coinciding with the week the app was banned in Turkey.
X’s best day of the year in our ranking was April 14, when it reached #12. This coincided with Arsenal losing the top position in the English football/soccer Premier League (the most-watched sports league in the world) to Manchester City, which went on to win its fourth title in a row. Last year, we noted how football/soccer in England impacted X’s ranking. X also reached #13 on August 9 and 10, during the final weekend of the Paris 2024 Olympics.
X performed better on weekdays, while LinkedIn ranked higher between Mondays and Wednesdays. Snapchat and Discord performed better on weekends.
Reddit consistently stayed in our Top 50 in 2024, showing growth from around #45 to #40 by November, with a peak at #38 on November 26. It performed better between Mondays and Wednesdays.
Quora displayed a downward trend in our ranking, dropping from around #140 to #160. It performed better between Mondays and Wednesdays.
Tinder, which performs better on Sundays, started the year around #150 but eventually dropped below #160.
Tumblr followed a similar pattern, dropping out of the Top 200, where it was in early 2024, to outside the ranking entirely since September. Tumblr performed better on weekends.
OnlyFans showed growth in our Overall ranking, sitting around the Top 220 with a peak at #213 on December 1. It performed better on weekends.
E-commerce: Temu means growth
The importance of e-commerce continues to grow, as highlighted in our recent Cyber Week 2024 blog post. Amazon leads the category, followed by Taobao, the Chinese marketplace, holding a steady #2 spot as it also did in 2023. New to #3 is AliExpress, the global online retail giant from China.
Top 10 E-commerce services in 2024
Amazon
Taobao
AliExpress
Shopify
Temu
Alibaba
eBay
Shein
Mercado Libre
Wildberries (RU)
Compared to 2023, eBay lost its #3 spot globally and dropped down to #7, despite starting 2024 at #3 for several days. AliExpress claimed #3, followed by Shopify (#4), the Canadian platform hosting numerous online stores, and Temu (#5). Temu, the low-cost, fast-fashion marketplace launched in the US in September 2022, ended 2023 at #7 but rose to #5 in 2024, occasionally reaching #4 since August. Alibaba dropped to #6 in September.
Shein, the Chinese fast-fashion brand, continued its growth and overtook Mercado Libre (#8) in November. A surprise this year was Wildberries, often called Russia’s “Amazon,” that has been expanding to several neighboring countries (including some in Europe). It climbed to #10 in September, surpassing OLX (which held #10 for several months), Rakuten, and Lazada.
The Black Friday overall effect
Looking at how e-commerce sites performed in our Overall ranking, we observed the following trends:
Amazon fluctuated between #9 and #10 after October, returning to #9 on November 30 and December 1, during the Black Friday weekend. It often performed better on weekends.
Shopify’s best day of the year was Black Friday, November 29, when it reached #55. The global e-commerce platform performed better during weekdays.
Temu, known for low-cost products, started 2024 outside the Top 100 but climbed into the Top 70 by year-end. It performed best in late October and early November, peaking at #63, with a Black Friday spike to #65.
Shein, the Chinese fast-fashion brand, showed growth, nearing the Top 100 in early 2024 before dropping to the Top 140 between June and October. It rebounded in November, peaking at #83 on Black Friday. A similar trend was observed in 2023, when it ended the year around the Top 120. Here’s the comparison between recent players Temu and Shein:
eBay consistently ranked between #72 and #80, peaking at #62 on October 5-6 and again in late November, just before Black Friday. It often performed better on weekends.
Mercado Libre, the Latin American marketplace, had its best day on Black Friday, November 29, reaching #100.
Adidas entered the Top 250, ranking #232 on Black Friday, November 29.
Target performed well in November, peaking at #133 on November 27, the day before Thanksgiving in the US, and at #127 on December 1. It often performed better on Sundays.
Walmart improved its performance from September onward, with its best days on November 25-26, reaching #150.
Ikea, the Swedish furniture retailer, peaked at #247 on June 29.
Video streaming: YouTube and Netflix remain uncontested leaders
The relevance of video streaming platforms shows no signs of fading. In 2024, the Top 3 rankings stayed unchanged from 2023, with YouTube firmly holding the #1 spot, followed by Netflix. Among paid streaming services, Netflix leads, trailed by Disney Plus and Amazon Prime Video. Other paid streaming services are outside the Top 10, including, in ranked order: HBO/Max, Hulu, Peacock, and Paramount Plus.
Top 10 — Video streaming services 2024
YouTube
Netflix
Twitch
Roku
Disney Plus
Amazon Prime Video
Vimeo
Plex.TV
Pluto TV
Bigo Live
Twitch, a live-streaming platform for gaming, kept the #3 spot, as it did in 2023 and 2022. Roku, a digital media player that also offers streaming services, ranked #4, maintaining its position from last year. Similarly, Disney Plus (#5) and Amazon Prime Video (#6) held their spots, while Hulu dropped out of the Top 10.
The creative video platform Vimeo showed clear popularity growth since May, followed by recent players like Plex TV, a media platform with streaming that performed better starting in October, and Pluto TV, a free ad-supported streaming service that also showed growth throughout the year. Bigo Live, a live-streaming social platform, entered the Top 10 rankings in May.
Next, the Top 10 overtime perspective:
Throughout the year, Disney Plus occasionally challenged Roku, especially on weekends, a trend similar to what was observed in 2023.
Looking at how video streaming services performed in our Overall ranking, we found:
Netflix consistently ranked #12 on most weekends, particularly Sundays, through late May and resumed the same trend after August. Netflix, Disney Plus, Prime Video, and HBO/Max were more popular on weekends, especially Sundays.
Disney Plus ranged between #50 and #60, with a strong start to the year and a spike to #51 on September 22, coinciding with the premiere of the new Marvel show Agatha All Along.
Prime Video had its best day in the rankings on May 25, at #56, the day the movie Bombshell with Nicole Kidman premiered on the platform.
HBO/Max was consistently around the Top 100 until August. but dropped out after October.
Peacock had an inconsistent presence in the Top 250 but reappeared in late July during the Paris 2024 Olympics, reaching #176 on July 28. That was one of the busiest days for Olympic events, as detailed in our blog post on the event.
Paramount Plus was mostly outside the Top 250 this year but peaked at #216 on February 11, the day of the Super Bowl, which the platform streamed.
The News: Globo and BBC global perspectives
News organizations are vital for keeping the public informed, especially during crises. With that in mind, this ranking of news services, some of which are well-established news outlets while others are news aggregators, also highlights a few newsworthy trends.
Top 10 News services in 2024
Globo
BBC
NY Times
CNN
Fox News
Google News
Yahoo Finance
Daily Mail
RT
NewsBreak
This year’s rankings in the news category mirrored 2023 at the top. Globo, the Brazilian media giant — one of the largest in Latin America and globally — encompassing radio, TV, newspapers, and magazines, stayed #1, followed by the British BBC at #2, that operates globally and in 42 languages.
The New York Times rose to #3 this year (it was #5 in 2023), overtaking CNN (#4) and Fox News (#5), which dropped from its position at #3 in 2023 and this year came behind CNN.
Several prominent outlets, such as the Washington Post, The Guardian, NPR, and the Wall Street Journal, fell out of the Top 10 this year. These outlets had higher rankings in late 2023 following the start of the Hamas-Israel conflict on October 7. News aggregators gained prominence, with Google News (#6) and also Yahoo Finance (#7), focused on financial news (and that came in front of Yahoo News), and NewsBreak (#10), a US-based local news app, entering the Top 10.
The British Daily Mail, which has also expanded its focus to the US and Australia, ranked #8, followed by RT, the Russian news TV network with a global presence. RT launched its Brazil/Portuguese version in late 2023 and was recently highlighted in a report and an alert from the US Department of State regarding its global operations.
The US elections impacted rankings. CNN climbed to #2 on November 5, election day, and reached #1 on November 6, while Fox News peaked at #3. NBC News also improved, reaching #11 on November 5 and #7 the following day. Associated Press ranked #8 on November 5 as well. Here’s the News ranking:
US elections, attacks and protests
Notable news trends we identified in our larger Overall ranking include:
As we’ve seen in the News category, the US elections on November 5, 2024, caused CNN, Fox News, and others to jump in our rankings. This trend was also evident in the Overall ranking for the following media outlets, listed by performance. November 6 was the best day of 2024 for each:
CNN: #105 on November 5; #72 on November 6
Fox News: #153 on November 5; #92 on November 6
BBC: #115 on November 5, and #97 on November 6
NY Times: #149 on November 5; #98 on November 6
NBC News: #160 on November 6
Associated Press: #166 on November 6
Google News: #250 on November 5; #228 on November 6
Wall Street Journal: #241 on November 6
Washington Post: #245 on November 6
In the next chart we show rankings for CNN, Fox News, the BBC, and NY Times:
Brazil made headlines in late February when thousands of Bolsonaro supporters protested to defend the former president against investigations. During this period, Globo moved up the rankings, reaching #60 on February 24-25, 2024.
WP, the news aggregator from Poland, had its best day on July 26 (#188), coinciding with Polish lawmakers voting to allow security forces to use lethal weapons with “impunity”, particularly at the tense border with Belarus. WP peaked again on November 6 (#180), the day after the US elections, when the result of the election was mentioned in Poland’s parliament. Its third and final peak was on Black Friday, November 29, again at #180.
Messaging remains relevant, especially for specific communication purposes. Apple’s iMessage is excluded from this category because it lacks a unique domain name for traffic analysis. With that in mind, WhatsApp retained its position as the top messaging service in 2024, consistent with 2023 and 2022.
Top Messaging services in 2024
WhatsApp
QQ
Telegram
Viber
WeChat
Signal
LINE
KakaoTalk
eitaa.com
Facebook Messenger
Following WhatsApp at #2 is, for the second year in a row, the Chinese service QQ, also known as Tencent QQ, which includes games and mobile payments and is popular in Asia. Telegram, widely used in Eastern Europe and Asia, took the #3 spot from Viber in June. Viber remains popular in Eastern Europe, Asia, and the Middle East.
WeChat rose this year, securing #5 in October and surpassing Signal, which held that position for most of the year but dropped to #6 (the same position in which it ended 2023). LINE from Japan ranked #7, while new entries to the Top 10 included South Korea’s KakaoTalk (#8) and Iran’s eitaa.com (#9), a messaging application, designed for both mobile and desktop platforms, that is popular in Iran and among the Farsi (Persian) language diaspora.
Facebook Messenger rounded out the Top 10 at #10.
Here are other messaging trends from our Overall ranking:
WhatsApp, as noted, performed better this year, growing in popularity since late July, stabilizing at #9 by mid-October, and performing better during weekdays.
Telegram’s best days were between July 16-18, during developments in the Ukraine war, including the Russian Black Sea Fleet leaving Crimea. Telegram is widely used by thousands of Russian ‘war correspondents,’ as recently reported.
Metaverse & Gaming: Roblox leads, Steam grows, Oculus is out
Gaming and metaverse both involve immersing players in other worlds. Leaving concepts aside, we’ve grouped gaming and the metaverse into the same category since 2022. Roblox dominated this category again in 2024, retaining its top spot, followed by Microsoft’s Xbox at #2. Epic Games, the creator of Fortnite, ranked third.
Top 10 Metaverse & Gaming services in 2024
Roblox
Xbox/Xbox Live
Epic Games/Fortnite
Steam
PlayStation
Electronic Arts
Blizzard
Riot Games/League of Legends
Minecraft
Garena
Xbox/Xbox Live held #2 consistently, but Epic Games/Fortnite contested the position earlier in the year and again in November. Steam was a surprise this year, jumping to #4, ahead of PlayStation. It even rose to #2 in late March and early April, coinciding with the launch of a new demo. Other platforms on the rise included Electronic Arts, Blizzard, and Riot Games/League of Legends.
Minecraft made the Top 10 at #9, performing best on July 5, 6, and 10, when it reached #7. Garena, the Singaporean game developer and publisher, entered the Top 10 for the first time. Oculus, Meta’s VR headset and metaverse service, dropped out of the Top 10 to #11, after ending 2023 at #5. It performed better earlier in the year (until April) and in late November.
Here’s the top chart across 2024:
Here are other metaverse and gaming trends from our Overall ranking:
Roblox’s best day in 2024 was January 21, when it reached #20. The platform performed better on weekends, especially Sundays, similar to other popular gaming platforms like Xbox/Xbox Live, Epic Games/Fortnite, Steam, and PlayStation.
Epic Games/Fortnite’s best day was January 1, 2024.
Xbox/Xbox Live (#37) and PlayStation (#43) had their best day on November 2, 2024, the day before the launch of the new version of the classic game Aero the Acro-Bat: Rascal Rival Revenge.
Steam’s best day was August 24, 2024, during the week of Gamescom 2024 in Germany. Several new games were released that week, including Tactical Breach Wizards and Dustborn.
Minecraft, celebrating its 15th anniversary in May 2024, had its best days on June 15 (#90), following the release of the Tricky Trials game update by Mojang Studios, and August 17 (#90), coinciding with the release of Minecraft: Java Edition Snapshot 24w33a.
Financial services: Stripe keeps lead, Black Friday impact
Financial services cover everything from traditional banking to cryptocurrencies and tax tools. Stripe, the Irish-American payment platform, kept its #1 spot for the second year, after overtaking PayPal in this category in 2023.
Top 10 Financial Services in 2024
Stripe
TradingView
Alipay
PayPal
Nubank (BR)
Binance
Coinbase
Banco do Brasil
Bradesco Bank
Itau
PayPal spent only a few days at #2 and a few others at #3 this year, but ultimately dropped to #4. TradingView, a platform specializing in tools for traders and investors, climbed to #2, followed by AliPay, the Chinese mobile and online payment platform, which secured #3.
Nubank, the Brazilian neobank (only online) and considered to be the most valuable, one of the biggest Latin America financial groups and the world’s biggest digital bank, entered the Top 10 at #5, while Binance rose to #6 (up from #8 last year). Binance also peaked at #3 on November 12-13, following the US elections, as Bitcoin reached new highs. In the crypto space, Coinbase joined the Top 10 for the first time.
Brazil’s growth in online banking, digital banks, and payments in Latin America has driven traditional banks to expand their digital presence. In 2024, Banco do Brasil, Bradesco, and Itaú performed well and rose into the Top 10, moving more than ever to the online space including in partnership with each other (as detailed in these two (1), (2) articles in Portuguese).
And here’s the crypto perspective in this Financial services category:
Next, we highlight other financial services trends from our Overall ranking:
Stripe’s best days were just before Black Friday, on November 18-19 and November 25, reaching #81 during those days. Stripe performed better on weekends and maintained consistent rankings throughout the year.
PayPal ranked higher around Black Friday week, peaking at #89 on November 21 and on Black Friday, November 29.
Brazilian bank Nubank performed best a few days before Carnival in Brazil (February 10-14), reaching #87 on February 1 and 3 and #92 on February 10. It also ranked well on Black Friday, November 29, peaking at #90.
Crypto: Binance is back (and the impact of US elections)
In addition to our Financial Services category, we evaluated cryptocurrency-related services specifically. Despite a few crashes over recent years, the crypto sector continued to evolve in 2024, experiencing a late-year boom, as we explore below. Binance and Coinbase retained the top two spots, while OKX climbed to #3 this year.
Top 10 Cryptocurrency services in 2024
Binance
Coinbase
OKX
2miners.com
CoinMarketCap
Coingecko
Bybit
Exodus
Tonkeeper
NiceHash
CoinGecko, a cryptocurrency data platform, dropped to #6, making way for OKX in late August, while new entrant 2miners.com rose to #4. CoinMarketCap ranked #5, followed by several dynamic new entrants in the Top 10:
Bybit (#7): A cryptocurrency exchange offering spot and derivatives trading.
Exodus (#8): A user-friendly, multi-asset cryptocurrency wallet.
Tonkeeper (#9): A secure wallet for managing Toncoin and related assets.
NiceHash, a platform connecting cryptocurrency miners and buyers, performed better in 2023, but dropped from #5 to #10 this year.
The US elections also had an apparent effect on the Overall ranking:
Binance entered the Top 100 for the first time on September 26, when Bitcoin surged past $65,000, driven by positive US employment data and China’s announcement of economic stimulus measures. It peaked at #97 on November 13, following the US elections and Donald Trump’s victory, as Bitcoin’s price surpassed $90,000 for the first time.
Coinbase’s best day was November 21, reaching #131, as Bitcoin approached $100,000 (which it surpassed on December 4, although our ranking only covers up to December 1).
OKX peaked at #149 on November 22, and CoinMarketCap reached #176 on November 23.
CoinGecko’s best day was November 11, the week following the US elections, when it climbed to #137.
Other overall trends: Olympics, Tesla, GitHub, and more
Outside the categories we reviewed as part of the Year in Review, several notable trends emerged in our Overall ranking:
The Paris 2024 Summer Olympics (July 26–August 11, 2024) appeared in our Top 250 Overall ranking, with Olympics-related sites debuting on July 27 (#195), the first full day of events. The peak was on July 30 (#177), driven by Léon Marchand’s swimming performances and the US women’s artistic gymnastics medal, as detailed in our Olympics blog post. The final day in the Top 250 was August 11 (#217).
Spotify ranked between #17 and #18 this year, performing best in October, spending most of the month at #17. However, as our list ends on December 1, we are not tracking the impact of the recently launched Spotify Wrapped.
Tesla entered the Top 250 after October. Its best day was October 12 (#245), following the Cybercab robotaxi reveal. It also ranked higher on November 17 (#246), after a post-US elections stock rally.
GitHub’s best day was November 8 (#31), coinciding with its announcement of enhanced security protocols, including mandatory two-factor authentication (2FA) for organizations.
NBA appeared in the Top 250 until early March, with its best day on February 4, during these games.
Nike ranked only once, on March 26 (#236), during the annual Air Max Day celebration.
Brazil’s official Judiciary site peaked at #105 on October 6, during the first round of municipal elections.
Ticketmaster peaked at #169 on October 8, during a major service disruption, followed by October 9 (#170), the day Australian F1 tickets went on sale.
Intuit’s best day was April 15 (#121), US Tax Day, consistent with previous years.
Weather.com peaked at #61 between August 4–6, during Hurricane Debby’s landfall in Florida.
The best day for IMDb (the Internet Movie Database)was January 1 (#220).
The Internet continues to shape how we socialize, work, and stay informed. Our 2024 rankings highlight the enduring dominance of platforms like Google, Facebook, and TikTok, alongside the rapid rise of generative AI services like OpenAI’s ChatGPT, with new players like GitHub Copilot and Claude making strides.
In social media, X shows declining influence, while Threads, Bluesky, and Mastodon are carving out niches but remain far from overtaking established platforms. Temu continues to rise in e-commerce, while Shein and AliExpress strengthened their global positions. In cryptocurrency, Binance regained momentum as Bitcoin surged, and newer players entered the scene. Gaming saw Roblox maintain its lead, with Steam experiencing notable growth.
Events like the Paris 2024 Summer Olympics, US elections, and war-related attacks also shaped Internet trends, emphasizing how global events influence online activity. These trends mirror real-world developments and set the stage for an interconnected, tech-driven future.
On a final note, creating rankings is a team effort that comes with its own challenges and requires careful attention and frequent updates. We welcome your feedback and suggestions for new categories to explore in the Year in Review.
(Our data scientist, Sabina Zejnilovic, played a crucial role in gathering the Internet services data.)
In 2024, Thanksgiving (November 28), Black Friday (November 29), and Cyber Monday (December 2) significantly impacted Internet traffic, similar to trends seen in 2023 and previous years. This year, Thanksgiving in the US drove a 20% drop in daily traffic compared to the previous week, with a notable 33% dip at 15:45 ET. In contrast, Black Friday and Cyber Monday drove traffic spikes. But how global is this trend, and do attacks increase during Cyber Week?
At Cloudflare, we manage and protect a substantial amount of traffic for our customers, providing a unique vantage point to analyze traffic and attack patterns across the Internet. This perspective reveals insights like Cyber Monday being the busiest Internet traffic day of 2024 globally, followed by Black Friday, with patterns varying across countries. Notably, global HTTP request volume on Cyber Monday 2024 was 36% higher than 2023, with 5% of that traffic blocked as potential attacks.
For this analysis, we examined anonymized and aggregated HTTP requests and DNS queries across our network to uncover key patterns. Cyber Monday, December 2, was the day with peak traffic, and key findings for that day include:
Cloudflare processed a peak of 99.8 million HTTP requests per second at 15:33 UTC on Cyber Monday, December 2.
Cloudflare handled approximately 5.4 trillion daily requests on Cyber Monday, with blocked potential attacks comprising around 5% of all traffic. This was higher than the 5.1 trillion daily requests on Black Friday, where 6% of request traffic consisted of blocked potential attacks.
Daily global HTTP request volume on Cyber Monday 2024 (December 2) increased by 36% compared to Cyber Monday 2023. In comparison, Cyber Monday 2023 had shown a 27% increase over Cyber Monday 2022.
Ranking Cyber Week daily Internet traffic
This year’s trends, like those observed in previous years, show how Internet traffic typically peaks in late November but tends to drop in December. In 2024, Cyber Monday was again the busiest day for global Internet traffic. However, Black Friday didn’t make the Top 3, as Sunday, December 1, and Tuesday, November 26, saw higher traffic. Black Friday ranked #5, coming behind November 21.
Note: On December 1, 2024, a customer-specific software update event contributed to the increased Internet traffic observed that day, including at the country level.
Highest Internet traffic days, worldwide
#1 Cyber Monday, December 2, 2024
#2 Sunday, December 1, the day before Cyber Monday
#3 Tuesday, November 26, 2024
In the US, the ranking was similar, with Cyber Monday, Sunday, and Black Friday being the busiest days for Internet traffic. On Cyber Monday, traffic was 12% higher than the previous week and 57% higher than Cyber Monday 2023.
Highest Internet traffic days, United States
#1 Cyber Monday, December 2
#2 Sunday, December 1
#3 Black Friday, November 29
Additionally, most US states show a similar trend, with Cyber Monday generating the most traffic, followed by Sunday, December 1, and Black Friday, November 29. Arizona, West Virginia, and Arkansas saw increases in traffic of over 20% compared to the previous week. Almost all other states experienced traffic increases exceeding 10%, including some of the most populous ones like California (11%), Florida (11%), and New York (11%).
In looking at just traffic to Shopping and Retail sites based in the US that use Cloudflare, Cyber Monday recorded the highest traffic, followed by Black Friday and the Black Friday weekend. Traffic to these sites increased significantly during Cyber Week, starting on Monday, November 25, with a 7% increase compared to the previous week and a 57% jump compared to the first week of November.
Black Friday goes mobile, Cyber Monday goes desktop
During Thanksgiving Day, mobile usage in the US increased significantly, with mobile device traffic accounting for 51.7% of all traffic, compared to 42.4% the previous week. The trend intensified on Black Friday, with mobile’s share peaking at 51.9% (up from 43.9% the prior Friday) and reaching a similar level on Saturday, November 30, at 52%. However, Cyber Monday saw a shift to desktop use, with mobile device share dropping to 43.4%, lower than the previous Monday. This mirrors a similar trend observed in 2023.
These patterns suggest that Black Friday shopping in the US often involves more out of home/office activities, with people relying on mobile devices for Internet access while on the go, whereas the opposite tends to occur on Cyber Monday, a day when many return to work and school in the US.
How are other countries impacted by Cyber Week?
Internationally, a trend of peak Internet traffic in November is observed in most countries, as highlighted in our 2023 Year in Review. This trend is likely linked to colder weather in the Northern Hemisphere, where approximately 87% of the world’s population resides, as well as holidays and shopping periods, among other factors.
Here’s a table summarizing the November and early December days with the most traffic, where Cyber Week plays a significant role.
Highest Internet traffic days
UK
#1 Black Friday, November 29
#2 Cyber Monday, December 2
#3 Sunday, December 1 (Black Friday weekend)
Canada
#1 Cyber Monday, December 2
#2 Black Friday, November 29
#3 Sunday, December 1 (Black Friday weekend)
Germany
#1 Sunday, December 1 (Black Friday weekend)
#2 Black Friday, November 29
#3 Cyber Monday, December 2
Mexico
#1 Cyber Monday, December 2
#2 Wednesday, November 27
#3 Tuesday, November 26
France
#1 Sunday, December 1 (Black Friday weekend)
#2 Cyber Monday, December 2
#3 Wednesday, November 27
Brazil
#1 Tuesday, November 26
#2 Cyber Monday, December 2
#3 Thursday, November 21
Spain
#1 Sunday, December 1 (Black Friday weekend)
#2 Cyber Monday, December 2
#3 Tuesday, November 26
Australia
#1 Black Friday, November 29
#2 Cyber Monday, December 2
#3 Sunday, December 1 (Black Friday weekend)
Egypt
#1 Wednesday, November 27
#2 Sunday, December 1 (Black Friday weekend)
#3 Sunday, November 24
Singapore
#1 Friday, November 22
#2 Cyber Monday, December 2
#3 Tuesday, November 26
India
#1 Cyber Monday, December 2
#2 Black Friday, November 29
#3 Sunday, December 1 (Black Friday weekend)
Turkey
#1 Sunday, December 1 (Black Friday weekend)
#2 Cyber Monday, December 2
#3 Singles’ Day, November 10-11
Saudi Arabia
#1 Sunday, December 1 (Black Friday weekend)
#2 Saturday, November 30 (Black Friday weekend)
#3 Cyber Monday, December 2
South Africa
#1 Wednesday, November 27
#2 Tuesday, November 26
#3 Black Friday, November 29
Countries like the Philippines (where Singles’ Day was the top shopping day again this year), Japan, South Korea, Thailand, and Indonesia (where Cyber Monday ranked second this year) show increased traffic in October and November compared to other months. However, they do not exhibit an obvious increase in traffic during Cyber Week.
As noted earlier, Singles’ Day (November 11), a major Asian shopping event, ranked among the Top 3 traffic days in Turkey, the Philippines, and other countries.
E-commerce DNS trends
Aggregated data from our 1.1.1.1 resolver reveals category-specific DNS traffic growth to E-commerce sites, showing a steady increase throughout November, similar to the overall Internet traffic trends.
In the US, E-commerce DNS traffic in November 2024 followed a similar pattern compared to 2023. Black Friday (November 29) ranked as the top day for DNS traffic in the E-commerce category, followed closely by Cyber Monday and Tuesday, November 26. This aligns more closely with overall US Internet traffic trends, where Cyber Monday ranked #1.
Also in the E-commerce category, DNS traffic on Black Friday peaked between 15:00 and 18:00 ET (13:00 and 15:00 PT), with an 18% increase at 18:00 ET compared to the previous week. On Cyber Monday, peak traffic occurred later, from 20:00 to 22:00 ET (17:00 to 19:00 PT).
A glimpse into Europe’s DNS E-commerce trends
The UK showed a similar trend in DNS traffic to E-commerce sites, mirroring its Internet traffic patterns, and following the same pattern as 2023. In 2024, Black Friday (November 29) ranked #1, followed by Cyber Monday (December 2), and Thursday, November 21.
In Australia, Saturday, November 30 (the day after Black Friday), was the top day for E-commerce DNS traffic, followed by Cyber Monday and Black Friday. Canada followed a similar trend, with Black Friday ranking highest, followed by Cyber Monday.
In Germany, the busiest E-commerce day was Thursday, November 21, a week before Black Friday, followed by Black Friday (November 29) and Monday, November 25. Cyber Monday did not make the top three, consistent with 2023.
In France, Black Friday remained the top E-commerce day, as in 2023, followed by Cyber Monday (December 2) and Thursday, November 21.
Low-cost and second-hand DNS trends
Focusing on the US again, so-called “low-cost” E-commerce sites (which include recent entrants like Temu and fast-fashion brands) have become increasingly popular, and experienced more DNS traffic in the days leading up to Black Friday and Thanksgiving, specifically November 26 and 27. Cyber Monday ranked third.
As observed last year, second-hand shopping sites (ones that offer previously used items) in the US gained more momentum and DNS traffic during the two weeks before Black Friday week. Traffic to these sites peaked on November 12, with Cyber Monday coming in as a close second.
Growth of cyber threats in November
DDoS (distributed denial-of-service) attacks remain a common tactic for disrupting Internet properties. Our data shows that Shopping and Retail sites in the United States protected by Cloudflare experienced a significant rise in DDoS activity on Cyber Monday. On that day, 7% of all traffic in this category was mitigated as DDoS attacks, with an additional 8% flagged as potential threats.
More broadly, DDoS activity targeting the US in general (not limited to E-commerce) also spiked during Black Friday week. Starting November 24, the share blocked as DDoS attacks rose sharply, peaking at over 2% of all traffic on November 25. Across the entire Cyber Week, there was a 41% increase in blocked DDoS attack requests compared to the previous week.
Email threat trends around “Black Friday” and “Cyber Monday”
From a cybersecurity perspective, trending events, topics, and individuals often trigger spikes in email traffic, including malicious, phishing, and spam messages. This was evident during the Paris 2024 Olympics, the US elections, and shopping periods like Black Friday and Cyber Monday. Between November 1 and December 2, 2024, Cloudflare’s Cloud Email Security service processed nearly 24 million emails mentioning “Black Friday” or “Cyber Monday” in the subject. Of those, 19.4 million referenced “Black Friday” while 4.2 million mentioned “Cyber Monday”, with 76% (3.2 million) of the Cyber Monday emails sent on December 2, 2024.
During this period, “Black Friday” emails were not only higher volume but also showed higher percentages of spam (10.8%) and malicious content (0.9%) compared to emails mentioning “Cyber Monday” in the subject, which had 1.8% spam and 0.2% malicious content.
In the next chart, we focus on emails with “Black Friday” in the subject, given that it generated the highest percentage of spam and malicious emails. Spam emails peaked in mid-November, making up 29% of all emails, and reached 26% on Cyber Monday. Malicious email percentages were also higher in mid-November, with 3% recorded on November 14, before Black Friday week.
The busiest day for “Black Friday” emails was November 29, Black Friday itself, with 4.1 million emails, followed by Saturday, November 30 (1.5 million), and Wednesday, November 27 (1.4 million).
Wrap up
Internet traffic trends during Black Friday and Cyber Monday show varying patterns globally and regionally. Cyber Monday leads in traffic overall, followed closely by Black Friday. While the US and Canada share similar trends, countries like the UK, Germany, and Australia saw traffic higher on Black Friday than Cyber Monday. In most countries, activity also increased in the days leading up to Black Friday.
On the cybersecurity front, DDoS attacks were more noticeable during Cyber Week in 2024, especially targeting shopping-related sites.
When cable cuts occur, whether submarine or terrestrial, they often result in observable disruptions to Internet connectivity, knocking a network, city, or country offline. This is especially true when there is insufficient resilience or alternative paths — that is, when a cable is effectively a single point of failure. Associated observations of traffic loss resulting from these disruptions are frequently covered by Cloudflare Radar in social media and blog posts. However, two recent cable cuts that occurred in the Baltic Sea resulted in little-to-no observable impact to the affected countries, as we discuss below, in large part because of the significant redundancy and resilience of Internet infrastructure in Europe.
BCS East-West Interlink
Traffic volume indicators
On Sunday, November 17 2024, the BCS East-West Interlink submarine cable connecting Sventoji, Lithuania and Katthammarsvik, Sweden was reportedly damaged around 10:00 local (Lithuania) time (08:00 UTC). A Data Center Dynamics article about the cable cut quotes the CTO of Telia Lietuva, the telecommunications provider that operates the cable, and notes “The Lithuanian cable carried about a third of the nation’s Internet capacity, but capacity was carried via other routes.”
As the Cloudflare Radar graphs below show, there was no apparent impact to traffic volumes in either country at the time that the cables were damaged. The NetFlows graphs represent the number of bytes that Cloudflare sends to users and clients in response to their requests.
Internet quality
Internet quality metrics for both countries show changes in measured bandwidth and latency throughout the day on Sunday, but with no sudden anomalous shifts visible around the time of the cable cut. (The loss of connectivity associated with a cable cut potentially manifests itself as an increase in latency and concurrent decrease in bandwidth due to loss of capacity.) The latency graph for Sweden does show an increase in latency, but it began before the cable cut occurred, is similar to a pattern visible several hours earlier, and is matched by an increase in measured bandwidth, so it is unlikely to be related to the cable cut event.
Visibility in BGP events, announced IP address space unaffected
BGP announcements are a way for network providers to communicate routing information to other networks, and announcement activity observed on Telia Lietuva’s autonomous systems around the time of the cable cut may be related to the re-routing referenced in the article. No change in announced IP address space was visible for any of these autonomous systems, suggesting no loss of connectivity as the capacity was re-routed.
Telegeography’s submarinecablemap.com illustrates, at least in part, the resilience in connectivity enjoyed by these two countries. In addition to the damaged cable, it shows that Lithuania is connected to neighboring Latvia as well as to the Swedish mainland. Over 20 submarine cables land in Sweden, connecting it to multiple countries across Europe. In addition to the submarine resilience, network providers in both countries can take advantage of terrestrial fiber connections to neighboring countries, such as those illustrated in a European network map from Arelion (formerly Telia), which is only one of the large European backbone providers.
C-Lion1
Traffic volume indicators
Less than a day later, the C-Lion1 submarine cable, which connects Helsinki, Finland and Rostock Germany was reportedly damaged during the early morning hours of Monday, November 18. Cinia, the telecommunications company that owns the cable, said that the cable stopped working at about 02:00 UTC.
In this situation as well, as the Cloudflare Radar graphs below show, there was no apparent impact to traffic volumes in either country at the time that the cables were damaged. The Finland graphs, week-on-week, show fewer bytes transferred and fewer HTTP requests, but that difference is present before the cable cut at 02:00 UTC. However, the trend of the current line does not change after the cable cut, so the two events would appear unrelated.
Internet quality
By looking at volume-related metrics, alone, Internet connectivity would appear to be unaffected by the cable cut.
If, however, we change perspective and look at Internet quality, a brief yet interesting change is visible for Finland around the reported time of the cable damage, though it isn’t clear whether it is related in any way. Just after midnight, median measured bandwidth, previously consistent around 50 Mbps begins to grow, peaking just over 200 Mbps around 03:00 UTC. Around that same time, measured median latency also begins to drop, falling from around 30 ms to a low of 13 ms, also around 03:00 UTC. Median bandwidth returned to normal levels around 06:00 UTC, while latency took about two hours longer to return to normal levels. These observed improvements in bandwidth and latency could have been due to traffic being re-routed to along paths with better connectivity to measurement endpoints, but because the shifts began before the cable damage occurred, and recovered shortly thereafter, that is unlikely to be the root cause.
In Germany, a brief minor increase in median bandwidth peaked around 02:45 UTC, while no notable changes were observed in latency.
BGP business as usual
From a routing perspective, there was no notable BGP announcement activity observed for top autonomous systems in either Finland or Germany around 02:00 on November 18, and total announced IP address space aggregated at a country level also demonstrated no change.
Telegeography’s submarinecablemap.com shows that both Finland and Germany also have significant redundancy and resilience from a submarine cable perspective, with over 10 cables landing in Finland, and nearly 10 landing in Germany, including Atlantic Crossing-1 (AC-1), which connects to the United States over two distinct paths. Terrestrial fiber maps from Arelion and eunetworks (as just two examples) show multiple redundant fiber routes within both countries, as well as cross-border routes to other neighboring countries, enabling more resilient Internet connectivity.
Conclusion
As we have discussed in multiple prior blog posts (Jersey, 2016; AAE-1/SMW5, 2022; WACS/MainOne/SAT3/ACE, 2024; EASSy/Seacom, 2024), cable cuts often cause significant disruptions to Internet connectivity, in many cases because they represent a concentrated point of vulnerability, whether for an individual network provider, city/state, or country. These disruptions are often quite lengthy as well, due to the time needed to marshal repair resources, identify the location of the damage, etc. Although it is not always feasible due to financial or geographic constraints, building redundant and resilient network architecture, at multiple levels, is a best practice. This includes the sending traffic over multiple physical cables (both submarine and terrestrial), connecting to multiple peer and upstream network providers, and even avoiding single points of failure in core Internet resources like DNS servers.
Elections are not just a matter of casting ballots. They depend on citizens being able to register to vote and accessing information about candidates and the election process, which in turn depend on the strength and security of the Internet. Despite the risks posed by potential cyberattacks aimed to disrupt democracy, Cloudflare did not observe any significant disruptions to campaigns or local government websites from cyberattack.
Tuesday, November 5, 2024 was Election Day in the United States. It not only decided the next president and vice president but also included elections for the US Senate, House of Representatives, state governorships, and state legislatures. Results confirm that Republican Donald Trump won the presidential election.
In this blog post, we examine online attacks against election-related sites — some of which were notable but none were disruptive — and how initial election results impacted Internet traffic across the US at both national and state levels, with increases in traffic as much as 15% nationwide. We’ll also explore email phishing trends and general DNS data around news interest, the candidates, and election-related activity.
We’ve been tracking 2024 elections globally through our blog and election report on Cloudflare Radar, covering some of the more than 60 national elections around the globe this year. At Cloudflare, we support many of these efforts to ensure a secure and trustworthy election process. We worked closely with election officials, government agencies, and civil society groups across the country to ensure that groups working in the election space had the tools they needed to stay online.
In the 24 hour period from October 31 – November 1, Cloudflare automatically mitigated over 6 billion HTTP DDoS requests that targeted US election-related websites–such as state and local government election sites and political campaigns. There were no significant disruptions to the targeted websites during this time period.
The day before the election, DNS traffic to Trump/Republican and Harris/Democrat websites peaked, with daily DNS traffic rising 59% and 4% respectively.
On election day, states in the midwest saw the highest traffic growth across the US, as compared to the previous week.
Internet traffic in the US peaked after the first polling stations closed, with a 15% increase over the previous week.
DNS traffic to news, polling, and election websites also saw large traffic jumps. Polling services were up 756% near poll closures and news sites were up 325% by late evening.
How Cloudflare assists with election infrastructure
Cloudflare’s goal is to ensure that sites that enable democracy — such as voter registration sites, election information portals, campaign websites, and results reporting platforms — remain secure and accessible, especially under heavy traffic periods or cyberattacks. Through our Impact programs, we provide essential cybersecurity resources to more than 800 websites that work on election infrastructure.
Project Galileo: Launched in 2014, Project Galileo provides free Business level services to media organizations, human rights defenders and non-profit organizations around the world. We protect more than 65 Internet properties related to elections in the United States that work on a range of topics related to voting rights, promoting free and fair elections, and posting election results. These organizations include Vote America, Decision Desk HQ, US Vote Foundation, and Electionland.
Athenian Project: Launched in 2017, the Athenian Project provides state and local governments that run elections with free Enterprise level services to ensure that voters can access accurate and up-to-date information about voter registration, polling places, and election results without interruption. We currently protect 423 websites in 33 states under the project.
Cloudflare for Campaigns: Launched in 2020, in partnership with Defending Digital Campaigns, Cloudflare for Campaigns provides a package of products to address the increasing risks posed by cyberattacks on political campaigns and state parties. We currently protect more than 354 campaigns and 34 state-level political parties in the United States.
Since 2020, we’ve strengthened our partnerships with election officials, government agencies, and nonprofits to provide essential protections. Throughout 2024, we’ve collaborated with CISA (Cybersecurity and Infrastructure Security Agency) and the Joint Cyber Defense Collaborative, briefing over 300 election officials on emerging threats and conducting 50+ calls with state and local governments to review security practices. Additionally, we held webinars on cyber threats to election groups and strategies for protecting election infrastructure.
With Defending Digital Campaigns, we worked to onboard more than 90 campaigns and parties weeks before election day. As part of this, we also worked with political vendors managing campaign infrastructure to provide insight on emerging threats and how to mitigate. Under Project Galileo, we onboarded more than 60 local media and journalism sites reporting on elections to ensure they can provide timely, accurate information on voting processes, candidate platforms, and election results.
Political and election-related cyber attacks
As we’ve seen several times this year, specific DDoS (Distributed Denial of Service) attacks often target political party or candidate websites around election day. While online attacks are frequent and not always election-related, we saw recent DDoS incidents in France, the Netherlands, and the U.K. focused on political parties during election periods.
In the US, we saw a similar uptick in attacks immediately prior to the election. Cloudflare blocked cyberattacks targeting websites affiliated with both parties, attempting to take the sites offline. Although some attacks had high volumes of traffic, the targeted websites remained online.
DDoS attacks targeting US political or elections-related Internet properties in particular clearly picked up starting in September, with the more than 6 billion HTTP DDoS requests seen during the first six days of November exceeding the volume seen during all of September and October.
Some campaign websites drove most of the malicious HTTP request traffic as part of DDoS attacks, with a clear increase since October 1, compared to minimal DDoS activity earlier in 2024.
Let’s look at a few examples of specific DDoS attacks, as these are easier to track.
High-profile campaign website, October 29 – November 6
Cloudflare blocked a series of DDoS attacks targeting a high-profile campaign website. The attacks began on October 29, with a four-minute spike reaching 345,000 requests per second. On October 31, more intense attacks followed, with the first lasting over an hour, peaking at 213,000 requests per second. Hours later, on November 1, a larger attack reached 700,000 requests per second, followed by two more waves at 311,000 and 205,000 requests per second.
Over 16 hours, Cloudflare blocked more than 6 billion malicious HTTP requests between October 31 and November 1. Additional attacks continued on November 3, with peaks at 200,000 requests per second (rps); on November 4, at 352,000; on Election Day, November 5, at 271,000 around 14:33 ET (11:33 PT); and on November 6, at 108,000.
Our data shows that the attacker(s) randomized user agents, attempted cache-busting techniques (methods to bypass cached content and overload servers with unique requests), and employed a geodiverse approach.
The DDoS attack on November 1 reached peak bandwidth of over 16 Gbps sent to Cloudflare and maintained over 8 Gbps throughout the main attack, which lasted more than two hours.
US campaign infrastructure website, November 3
Attackers also expanded their attacks beyond campaign sites, to political parties and their infrastructure, attempting — unsuccessfully — to disrupt services. For example, on November 3, 2024, a DDoS attack targeted infrastructure associated with a major campaign, lasting two minutes and reaching 260,000 malicious HTTP requests per second.
US state political party, October 29
On October 29, 2024, a high-volume DDoS attack targeted a U.S. political party website from a specific state. The attack lasted over four hours, from 12:00 to 17:29 ET (09:00 to 14:29 PT), and peaked at 206,000 requests per second. In total, over 2 billion malicious HTTP requests were blocked that day as part of this DDoS attack.
The same method used in the November 1 attack on one of the main campaign websites, mentioned above, was also used in this case. Here, the DDoS attack reached a peak of 5.7 Gbps sent to Cloudflare by the attacker, and sustained over 3 Gbps for most of its four-and-a-half-hour duration.
US counties as a target, September 13
Since September, US state and local websites protected by Cloudflare under the Athenian Project have experienced increased DDoS attacks, particularly targeting specific counties. These types of sites have seen over 290 million malicious HTTP requests since September 1, with 4% of all requests blocked as threats. These attacks were less frequent and intense than those on US political campaigns infrastructure.
On September 13, 2024, a DDoS attack targeted a county website from 19:29 UTC to 22:32 UTC (15:29 to 18:32 ET), lasting three hours and peaking at 46,000 of malicious HTTP requests per second.
These rates of DDoS attacks are already significant, even more so when we compare it with the 2020 US presidential election. In 2020, we saw more varied blocked cyberattack HTTP requests, split between WAF (Web Application Firewall) and firewall rules, and DDoS attacks. There were also significantly fewer blocked requests related to DDoS and WAF, with nearly 100 million in the whole month of October 2020 and close to 25 million in November 2020, the month of the election. In contrast, during November 1-6, 2024, alone, we observed over 6 billion malicious HTTP requests in DDoS attacks targeting campaigns.
It’s also important to note that even smaller attacks can be devastating for websites not well-protected against such high levels of traffic. DDoS attacks not only overwhelm systems but also serve, if successful, as a distraction for IT teams while attackers attempt other types of breaches.
Internet traffic in the US grows after polls closed
Generally, election days do not lead to drastic changes in Internet traffic. Traffic usually slightly dips during voting hours, though not as sharply as on national holidays, and rises in the evening as results are announced.
In the US, a similar pattern was observed on November 5, 2024, with increased Internet traffic at night. However, traffic throughout the day was generally 6% higher than the previous week, starting as early as 09:15 ET (06:15 PT). This may also be because, unlike in other countries, Election Day in the US is on a weekday rather than a weekend and is not a national holiday. Internet traffic peaked after the first polls closed, around 21:15 ET (18:15 PT), as TV news stations displayed countdown clocks. At that moment, traffic was 15% higher than the previous week.
Note: The previous 7 days line that appears in the next chart is one hour behind due to the Daylight Saving Time change over the weekend in the US. All growth calculations in this post take that change into account.
The biggest spike in traffic growth (compared to the previous week) of Election Day occurred at around 01:30 am ET (22:30 PT), when projections began to favor Trump for the presidential victory and Fox News called Pennsylvania in his favor, with traffic rising 32% compared to the previous week. Later, during Donald Trump’s speech between 02:30 and 02:45 am ET (23:30 and 23:45 PT), Internet traffic was 31% higher than the previous week.
On Election Day, daily Internet traffic in the US reached its highest level of 2024 in terms of requests, showing a 6% increase compared to the previous week.
As expected for a typical election day, considering what we observed in other countries, the share of traffic from mobile devices was also slightly higher on Election Day at 43%, compared to 42% the previous week.
State-level traffic growth peaks at 21:00 ET (18:00 PT)
State-level traffic shifts on Election Day, compared to the previous week, reveal more detail than country-level data. The map below highlights the biggest traffic changes, peaking at 21:00 ET (18:00 PT) after polling stations began to close. Notably, traffic increased nationwide and at the state level on Election Day, unlike during the two-hour presidential debates, which were broadcast on nationwide TV.
The most significant traffic increases were observed in Maine (44%), South Dakota (44%), and Montana (44%). Interestingly, central states saw higher percentages of Internet traffic growth than coastal ones. More populous states, such as California (8%), Texas (19%), New York (22%), and Florida (23%), also experienced notable traffic increases.
The seven swing states that are considered to have been decisive in the election — Georgia, Michigan, Nevada, North Carolina, Pennsylvania, and Wisconsin (we’re not considering Arizona due to data issues) — each saw traffic growth between 17% and 36%. Here’s a more focused view of those swing states for easier consumption:
State
Growth in traffic
Local time
(in each state)
Georgia
25%
21:15
Michigan
34%
21:15
Nevada
17%
18:15
North Carolina
14%
21:15
Pennsylvania
33%
21:15
Wisconsin
36%
20:15
DNS trends: from news outlets to polling services
Switching our focus to domain trends, our 1.1.1.1 resolver DNS data reveals a clear impact during the US elections when analyzing specific categories.
Analysis of DNS traffic for US news media outlets shows that traffic from the United States rose significantly right after 09:00 ET (06:00 PT), increasing around 15%, compared to the previous week. Traffic continued to climb throughout the day, peaking between 22:00 and 23:00 ET (19:00 and 20:00 PT) with DNS request traffic volume 325% higher than the previous week. There was also a brief spike on Wednesday, November 6, at 05:00 ET (02:00 PT), showing a 117% increase.
We observed significantly higher DNS traffic for polling services websites — websites of platforms or organizations that conduct and publish polls — on Election Day, peaking at 13:00 ET (10:00 PT) with a 206% increase from the previous week, and again at 22:00 ET (19:00 PT), after the polls started to close, with a 756% increase. Daily traffic to this category was up 145% on Election Day, and 36% the day prior.
Election and voting information-related websites also saw a notable rise in DNS traffic around Election Day. Traffic clearly began to increase the day before the election, and peaked on November 5, 2024, at 12:00 ET (09:00 PT), with a 313% increase from the previous week. Daily traffic was 139% higher on Election Day, and 68% higher the day before.
Social media sites/applications, especially microblogging platforms like X and Threads, were also impacted during Election Day. DNS traffic for these microblogging platforms peaked at 22:00 ET (19:00 PT), aligning with spikes for news organizations and polling services, showing a 91% increase compared to the previous week. In this microblogging category, daily DNS traffic on Election Day rose by 12% from the previous week.
Regarding the two main presidential candidates, DNS traffic for their websites and their parties’ websites was much higher the day before the election than on Election Day. On November 4, 2024, daily DNS traffic to Trump and Republican websites was up 59% compared to the previous week, while traffic to Harris and Democrat websites, which had a more significant increase in DNS traffic the previous week, rose by 4%.
Candidate-related email phishing trends
From a cybersecurity perspective, trending events, topics, and individuals often attract more emails, including malicious, phishing, and spam messages. Our earlier analysis covered email trends involving “Joe Biden” and “Donald Trump” since January. We’ve since updated it to include Kamala Harris after the Democratic Convention and the Harris-Trump debate.
From June 1 through November 4, 2024, Cloudflare’s Cloud Email Security service processed over 19 million emails with “Donald Trump” or “Kamala Harris” in the subject line — 13.9 million for Trump and 5.3 million for Harris. Nearly half of these emails (49%) were sent since September. In the last 10 days of the campaign (since October 24), Harris was named in 800,000 email subject lines and Trump in 1.3 million.
Since June 1, 12% of emails mentioning Trump were marked as spam, and 1.3% were flagged as malicious or phishing. This rate has dropped since September 1, with only 3% marked as spam and 0.3% as malicious. For emails mentioning Harris, the rates were lower: 0.6% were marked as spam and 0.2% as malicious since June, increasing slightly to 1.2% spam and 0.2% malicious since September 1. Trump was mentioned more frequently in email subjects than Harris and was found in higher overall percentages of spam and malicious emails.
Conclusion: keeping track of elections
Although Cloudflare observed a notable increase in DDoS attacks on political and election-related sites, blocking billions of malicious requests, these attacks resulted in no significant disruption due to planning and proactive defenses. We share the Cybersecurity and Infrastructure Security Agency’s view that “our election infrastructure has never been more secure” and concur with their conclusion that “We have no evidence of any malicious activity that had a material impact on the security or integrity of our election infrastructure.” Keeping our elections secure and resilient is critical to the functioning of democracy, and Cloudflare is proud to have played our part.
If you want to follow more trends and insights about the Internet and elections in particular, you can check Cloudflare Radar, and more specifically our new 2024 Elections Insights report, which will be updated as elections take place throughout the year.
Cloudflare’s network spans more than 330 cities in over 120 countries, where we interconnect with over 13,000 network providers in order to provide a broad range of services to millions of customers. The breadth of both our network and our customer base provides us with a unique perspective on Internet resilience, enabling us to observe the impact of Internet disruptions. Thanks to Cloudflare Radar functionality released earlier this year, we can explore the impact from a routing perspective, as well as a traffic perspective, at both a network and location level.
As we have noted in the past, this post is intended as a summary overview of observed and confirmed disruptions, and is not an exhaustive or complete list of issues that have occurred during the quarter.
Over the past several years, we have seen multiple governments around the world implement Internet shutdowns in response to protests within their countries. Some shutdowns are more targeted, affecting only (a subset of) mobile Internet providers, while others are more aggressive, effectively cutting off Internet connectivity at a national level. In addition, we all too frequently see governments implement nationwide multi-hour Internet shutdowns in an effort to prevent students from cheating on national exams. Unfortunately, governments were active in both respects during the third quarter, as we observed multiple government directed Internet shutdowns. Several were covered in our August 1 blog post, A recent spate of Internet disruptions.
Bangladesh
Violent student protests in Bangladesh against quotas in government jobs and rising unemployment rates led the government to order the nationwide shutdown of mobile Internet connectivity on July 18, reportedly to “ensure the security of citizens.” This government-directed shutdown ultimately became a near-complete Internet outage for the country, as broadband networks were taken offline as well. At a country level, Internet traffic in Bangladesh dropped to near zero just before 21:00 local time (15:00 UTC). Announced IP address space from the country dropped to near zero at that time as well, meaning that nearly every network in the country was disconnected from the Internet.
Traffic and announced IP address space at a national level began to recover around 18:00 local time (12:00 UTC) on July 23, and continued over the next several days, as fixed broadband connectivity was restored, with mobile connectivity returning on July 28. The initial restoration was characterized as a “trial run”, prioritizing banking, commercial sectors, technology firms, exporters, outsourcing providers and media outlets, according to the state minister for post, telecommunication and information technology.
Ahead of this nationwide shutdown, we observed outages across several Bangladeshi network providers, perhaps foreshadowing what was to come. At AS24389 (Grameenphone), a complete Internet outage started at 01:30 local time on July 18 (19:30 UTC on July 17), with a total loss of both Internet traffic and announced IP address space.
These mobile connectivity outages lasted from July 18 through July 28. Just a few days after connectivity was restored, additional clashes between police and protestors drove the government to order mobile Internet connectivity to be shut down again. As shown in the graphs below, traffic on these mobile network providers dropped between 13:30 and 14:15 local time (07:30 to 08:15 UTC) on Sunday, August 4.
These protests ultimately led the government to order a full Internet shutdown in the country, with both traffic and announced IP address space dropping precipitously around 10:30 local time (04:30 UTC) on Monday, August 5. However, the shutdown appeared to be short-lived, as broadband connectivity began to recover around 13:20 local time (07:20 UTC), with mobile connectivity being restored around 14:00 local time (08:00 UTC).
Iraqi Kurdistan
Both Iraq and Iraqi Kurdistan (the autonomous Kurdistan region in the northern part of the country) regularly implement government directed Internet shutdowns to prevent cheating on secondary and baccalaureate exams. Within Iraqi Kurdistan, we observed two sets of exam-related Internet shutdowns during the third quarter. The impacts of the shutdowns are visible on traffic from networks that operate within the region, as well as on the country-level graphs for Iraq.
The first round of shutdowns occurred in July, impacting AS59625 (KorekTel), AS21277 (Newroz Telecom), AS48492 (IQ Online), and AS206206 (KNET) between 06:00 – 08:00 local time (03:00 – 05:00 UTC) on July 3, 7, 10, and 14. This is consistent with shutdowns observed in the second quarter, as well as in June 2023. None of the impacted networks experienced a drop in announced IP address space during these shutdowns.
The second set of shutdowns in Iraqi Kurdistan took place across multiple days during the back half of August. On August 17, 19, 21, 24, 26, 28, and 31, all four network providers were again impacted, as seen in the graphs below, with traffic dropping between 06:00 – 08:00 local time (03:00 – 05:00 UTC).
Iraq
In Iraq, a second round of exams for 12th graders resulted in over two weeks of regular Internet shutdowns across the country occurring between 06:00 – 08:00 local time (03:00 – 05:00 UTC) on multiple days between August 29 and September 16, intended to prevent cheating on second ministerial exams for secondary education. Both HTTP traffic and announced IP address space from Iraq dropped during these shutdowns, as seen in the graphs below.
(Note that the red annotation bar visible on September 11 & 12 on both the country and network-level graphs below highlights an internal data pipeline issue, and is not associated with an Internet shutdown in Iraq.)
This round of government-directed shutdowns impacted multiple local network providers, including AS58322 (Halasat), AS51684 (AsiaCell), AS203214 (HulumTele), AS199739 (Earthlink), and AS59588 (ZAINAS). In reviewing the distribution of mobile device and desktop traffic at a network level, gaps were observed during the shutdowns on AS58322 and AS199739, and to a lesser extent, AS203214, suggesting that these networks were completely offline, while AS56184 and AS59588 remained at least partially online. (This is also corroborated by complete or partial loss of announced IP address space across these networks during the shutdowns.)
The length of the shutdowns varied by day — they all began at 07:00 local time (04:00 UTC), but the end times ranged between 09:45 -10:30 local time (06:45 – 07:30 UTC). The graphs below show the impact at a country level, as well as to AS29256 (Syrian Telecom), the primary telecommunications provider within the country.
On August 12, a round of baccalaureate exams began in Mauritania, and in an effort to prevent student cheating on the exams, the government instituted multiple Internet shutdowns that impacted several major mobile providers. Two shutdowns were observed on August 12, between 08:00 – 12:00 local time (08:00 – 12:00 UTC) and between 15:00 – 19:00 local time (15:00 – 19:00 UTC), and an additional one was observed on August 13, between 08:00 – 12:30 local time (08:00 – 12:30 UTC). Impacted network providers included AS37508 (Mattel), AS37541 (Chinguitel), and AS29544 (Mauritel). Announced IP address space for these networks remained unchanged during the shutdown periods, suggesting that that mobile subscriber connectivity was disabled, as opposed to the networks effectively being disconnected from the Internet, as we have seen in other countries.
Exam-related Internet shutdowns are, unfortunately, not new to Mauritania, as authorities in the country also implemented them between 2017 and 2020.
Cable cuts
Eswatini (Swaziland)
On July 14, MTN Eswatini (AS327765) informed customers via a post on X that “connection to the internet and data services is currently intermittent, because of fiber cable breaks resulting from wildfires.” This apparent connection disruption was visible in Cloudflare Radar between 19:30 and 20:15 local time (17:30 and 18:15 UTC).
Cameroon
In Cameroon, a fiber cut that occurred on August 4 during sanitation work disrupted mobile connectivity for Cameroon Telecommunications (AS15964 (Camtel)) customers for over half a day. According to a (translated) post on X from Camtel, “We inform you that due to the sanitation work carried out in the city of Yaoundé, at the place called Cradat, our Voice and Data services have been temporarily interrupted on the entire mobile network.” The observed disruption occurred between 03:00 – 16:30 local time (02:00 – 15:30 UTC). Although it initially started during a time when traffic was lower overnight anyway, both request and bytes traffic remained lower than the same time a week prior during the duration of the disruption.
Liberia
The Liberia Telecommunications Authority posted an announcement to their Facebook page on August 21 noting that “We have been informed by the CCL that the ACE Cable is experiencing interruptions.” (The Africa Coast to Europe (ACE) submarine cable connects multiple countries along the West Coast of Africa to Portugal and Europe.) The announcement further noted that the first signs of interruption occurred at 01:00 local time (and UTC), and that Lonestar Cell MTN (AS37410) was among the providers that had been “gravely affected” by the cut.
We observed traffic on Lonestar Cell MTN dropping just after 01:00, in line with the announcement. The network experienced a complete outage lasting over a day and a half, before traffic started to recover at 14:00 local time (and UTC) on August 22. In a Facebook post on August 22, Lonestar Cell MTN confirmed that Internet service had been restored, and that customer accounts would be credited with 500 MB of data for free.
Niger
A September 7 post on X from Airtel Niger alerted customers to Internet service disruptions caused by cuts on international fiber optic cables. As a land-locked country, Niger is dependent on terrestrial connections to networks in neighboring countries, but it isn’t clear which connection or country Airtel Niger’s post was referencing.
Two significant Internet disruptions were observed around the time of Airtel Niger’s post that we believe are related to the referenced fiber cuts. The first occurred between 18:00 – 21:00 local time (17:00 – 20:00 UTC) on September 6, visible at a country level and at a network level as well on AS37531 (Airtel Niger) and AS37233 (Orange Niger / Zamani Telecom). The second disruption occurred between 10:45 – 12:00 local time (09:45 – 11:00 UTC) on September 7, visible at a country level as well as on those two networks.
Haiti
Internet disruptions related to submarine cable failures often take a significant amount of time to resolve because of the challenges repair crews face in getting to, and accessing, the damaged portion of the cable, as it is frequently located deep underwater in the middle of an ocean. A September 14 submarine cable failure that impacted Digicel Haiti (AS27653) lasted for over a week for a similar, but slightly different, reason.
A significant loss of traffic on Digicel Haiti was first observed at 08:00 local time (12:00 UTC) on September 14. On September 16, Digicel Haiti posted a press release confirming that since September 14, a failure had been detected on an international submarine cable belonging to Cable and Wireless, and that the cable damage occurred at Kaliko Beach Club (the property is reportedly used as a cable entry point). Digicel noted that their technicians went to the scene of the damage immediately, but were denied access, apparently because of a business dispute dating back to 2021. The release also explained that technical teams had taken temporary steps to ensure the continuity of essential services, which prevented the incident from resulting in a complete loss of connectivity. On September 22, a subsequent press release posted by Digicel Haiti announced the restoration of Internet services as of 02:00 local time (06:00 UTC), and referenced vandalism as the cause of the cable damage.
The outage lasted for only an hour, between 15:45 and 16:45 local time (09:45 – 10:45 UTC), dropping both traffic and announced IP address space to zero. At a country level, traffic dropped as much as 72% as compared to the previous week. Given the complete loss of both traffic and IP address space, the damage likely occurred on the connection between Megacom and Rostelecom.
Severe weather
An active hurricane season during July, August, and September resulted in infrastructure damage caused by multiple hurricanes disrupting Internet connectivity in multiple places across the Caribbean and Southeastern United States.
Grenada & Saint Vincent and the Grenadines
At the start of the third quarter, Grenada and Saint Vincent and the Grenadines both suffered significant damage from Hurricane Beryl, reportedly causing destruction of infrastructure, buildings, agriculture, and the natural environment.
On July 1, traffic from Grenada dropped significantly at 10:00 local time (14:00 UTC), just ahead of landfall on Grenada’s Carriacou Island. The most significant impacts to traffic were seen for approximately the first 24 hours, though traffic did not return to expected pre-storm levels until around 10:00 local time (14:00 UTC) on July 5.
Internet traffic in Saint Vincent and the Grenadines was also disrupted by Hurricane Beryl, also falling at 10:00 local time (14:00 UTC). Similar to Grenada, the most significant impact was seen in the first 24 hours, with consistent gradual recovery seen after that time. However, traffic did not return to expected pre-storm levels until July 11.
Jamaica
As Hurricane Beryl continued across the Caribbean, it passed Jamaica on July 3. The associated damage that it caused impacted Internet connectivity on the island, with traffic dropping significantly around 14:00 local time (19:00 UTC). As the graph below shows, the disruption was preceded by higher than normal traffic volumes, presumably due to residents looking for information about Beryl. The disruption lasted nearly a week, with traffic returning to expected levels on July 10.
U.S. Virgin Islands
The following month, damage from Tropical Storm Ernesto caused power outages across the U.S. Virgin Islands, resulting in disruptions to Internet connectivity. Traffic from the islands dropped precipitously at 22:00 local time on August 13 (02:00 UTC on August 14) and remained lower for over two days, before returning to expected pre-storm levels around 11:00 local time (15:00 UTC) on August 16.
Bermuda
Over the course of the following few days, Ernesto strengthened from a tropical storm into a hurricane, but had weakened by the time it hit Bermuda on August 16/17. In this case, damage was reportedly limited to power outages, downed trees, and flooding, but even this limited damage disrupted Internet connectivity on the island. As the storm made landfall on the island, traffic levels dropped over 80% at 22:00 local time on August 16 (01:00 UTC on August 17). Traffic levels remained depressed for about two and a half days, recovering to expected levels around 09:00 local time (12:00 UTC) on August 19.
Nepal
Heavy rains in Nepal at the end of September resulted in flooding and landslides across much of the country, which in turn resulted in power outages and Internet disruptions. One such disruption believed to be associated with the impacts of the storm was observed on September 28, when AS23752 (Nepal Telecom), AS45650 (Vianet), AS139922 (Dishhome), and AS17501 (Worldlink) all saw traffic drop 50 – 70% between 14:15 – 16:00 local time (08:30 – 10:15 UTC).
United States
A disruption to traffic from AS11427 (Charter Communications/Spectrum) in Texas that occurred between 12:30 and 19:30 local time on July 9 (17:30 – 00:30 UTC) was caused by “a third-party infrastructure issue caused by the impact of Hurricane Beryl”, according to a July 9 post on X from the provider. Spectrum acknowledged the issue shortly after it began, and followed up again after service had been restored.
Hurricane Helene made landfall in northern Florida as a Category 4 storm late in the evening (local time) on September 26, and over the following hours and days, continued north through Georgia, South Carolina, and North Carolina, and into Tennessee. Even as it weakened, it caused historic flooding and damage to roads, homes, power lines, and telecommunications infrastructure. Below, we review the traffic impacts observed at a state level in three of the most impacted states, as well as exploring the impact at a network level for selected providers. (Doug Madory at Kentik published an excellent blog post exploring the impact of Helene from the perspective of their data, and the networks referenced below were informed by that post.)
Georgia
Helene entered Georgia early morning on Friday, September 27, and by midday (local time), peak traffic was approximately 20% lower than peak levels seen in the days ahead of the storm. (The lower peaks on September 28 & 29 are likely due to it being a weekend.) At a state level, peak traffic remained lower over the following week, with more recovery seen heading into the week of October 6.
One of the most significantly impacted network providers in Georgia was AS11240 (ATC Broadband), which saw traffic start to drop around 22:00 local time on September 26 (02:00 UTC on September 27). Subscribers and customers experienced a near complete outage until around 08:00 local time on September 30 (12:00 UTC), when traffic volumes slowly started to recover. The normal diurnal traffic pattern became more clear in the following days, with peak traffic levels continuing to increase over the next week as well.
The midday traffic peak on September 27 in South Carolina was just 65% of the preceding days, with the peaks remaining lower over the following two weekend days. Traffic remained somewhat lower during the week following Helene, with peak increases becoming more evident the week of October 6.
At AS19212 (Piedmont Rural Telephone) in South Carolina, traffic began to fall rapidly around midnight local time on September 27 (04:00 UTC), reaching a state of near complete outage over the next eight hours. A gradual recovery is visible over the following several days, with a more regular pattern becoming evident on October 1, with rapid growth over the following week, accelerating towards the end of the week.
Although a drop in traffic is visible in the graph for North Carolina on September 27, it occurs after a midday peak in line with previous days, and the magnitude is not as significant as that seen in South Carolina and Georgia. Traffic peaks over the following week are in line with the week preceding Helene’s arrival, with higher peaks seen the week of October 6.
North Carolina providers AS53488 (Morris Broadband) and AS53274 (Skyrunner) both experienced multi-day disruptions, likely related to damage from Helene. However, these disruptions took Morris Broadband completely offline several times over the course of a week — the announced IP address space graph below shows three distinct drops to zero, aligning with outages visible in the traffic graph, when the network was effectively disconnected from the Internet. A similar but less severe pattern was seen at Skyrunner, which lost 75-80% of announced IP address space for a two-day period covering September 27-29, aligning with an outage visible in the associated traffic graph.
A nationwide power outage in Venezuela on August 30 was, according to President Nicolás Maduro, the result of an attack on the Guri Reservoir, Venezuela’s largest hydroelectric project. A published report indicated that all 24 of the country’s states reported a total or partial loss of electricity supply. The loss of power unsurprisingly caused an Internet disruption, with country-level traffic dropping 82%, starting around 04:45 local time (08:45 UTC). Traffic began to increase as electricity returned to various parts of the country throughout the day, and returned to expected levels just after midnight local time on August 31 (04:00 UTC).
Kenya
On August 30, Kenya Power Care posted a Customer Alert on its Facebook page, issued at 21:57 local time (18:57 UTC), stating that “We have lost power supply to various parts of the country except North Rift region and sections of Western region.” Approximately a half hour before that alert, Kenya’s Internet traffic began to drop, falling as much as 61%. Just two hours later, Kenya Power Care posted a follow up, stating “Following the partial outage affecting several parts of the country this evening, we are pleased to report that power supply has now been restored to the entire Western region, as well as parts of Central Rift, South Nyanza, and Nairobi regions.” However, traffic did not return to expected levels for several more hours, taking until 06:00 local time (03:00 UTC).
A week later, on September 6, Kenya Power Care posted another similar Customer Alert, noting that “We are experiencing a power outage affecting several parts of the country, except sections of North Rift and Western regions.” This alert was issued at 09:20 local time (06:20 UTC), and follows a drop in Internet traffic that started around 09:00 local time (06:00 UTC). Traffic dropped approximately 45% during this power outage, and returned to expected levels around 16:00 local time (13:00 UTC). Traffic recovery aligns with a subsequent Customer Alert posted on Facebook, where Kenya Power Care stated “We are glad to report that normal electricity supply was restored across the country as at 3:49pm”.
A statement from Energy and Petroleum Cabinet Secretary Opiyo Wandayi, shared on Facebook by Kenya Power Care, explained the cause of the power outage: “Today, Friday 6th September 2024 at 8.56 am, the 220kV High Voltage Loiyangalani transmission line tripped at Suswa substation while evacuating 288MW from Lake Turkana Wind Power (LTWP) plant. This was followed by a trip on the Ethiopia – Kenya 500kV DC interconnector that was then carrying 200MW, resulting to a total loss of 488MW…”
Ecuador
According to a (translated) September 7 post on X from CENACE, the national electricity operator in Ecuador, “We inform the public that due to a fault in the Molino substation bar, which is connected to the Paute generation, there has been a power outage in some provinces of the country. Cenace’s technical team, in coordination with the distribution companies, is working to gradually restore electrical service. It is estimated that it will take 3 to 4 hours maximum for the supply to return to normal.” The post was published at 09:53 local time (14:53 UTC), approximately an hour after Internet traffic from the country began to drop. Traffic returned to expected levels just under four hours later, at around 12:30 local time (17:30 UTC), in line with CENACE’s predicted time for power to be fully restored.
On September 18/19, the first of several planned nightly power outages to enable needed grid maintenance in Ecuador disrupted Internet connectivity. Traffic dropped by over 60% as compared to the same time the prior week starting around 21:30 local (02:30 UTC), with the power outages reportedly scheduled for 22:00 – 06:00 local time. Internet traffic recovered to expected levels around 06:00 local time (11:00 UTC) as power was restored. Similar power cuts were reportedly planned from September 23 to September 27, but these power outages did not appear to impact traffic levels in Ecuador as compared to the previous week.
Senegal
Senegal’s power company, Senelec, posted a communiqué on X on September 12 that stated (translated) “Senelec informs its valued customers that an incident that occurred this morning at the Hann substation resulted in the loss of the OMVS interconnected network and disruptions to electricity distribution.” This disruption to electricity distribution also resulted in a disruption to Internet traffic, which dropped sharply at 13:00 local time (13:00 UTC), falling as much as 80%. Traffic recovered to expected levels by 20:00 local time (20:00 UTC) around the same time that Senelec posted a followup about the incident that stated (translated) “Effective restoration of electricity supply in all localities.”
Maintenance
Syria
As we discussed above, Internet users in Syria were impacted by an exam-related Internet shutdown from 07:00 – 10:15 local time (04:00 – 07:15 UTC) on July 30. However, just an hour after connectivity was restored, another disruption occurred, as seen in both the traffic and announced IP address space graphs below. According to a (translated) Facebook post from Syrian Telecom, “…during the periodic maintenance of one of the air conditioners in one of the technical halls, an explosion occurred, which caused the internet circuits to be temporarily out of service.” Traffic remained depressed for approximately eight hours, recovering to expected levels around 19:00 local time (16:00 UTC).
Cyberattack
Russia
Roskomnadzor, Russia’s Internet regulate, blamed a brief disruption in traffic observed in Russia and on AS12389 (Rostelecom) on August 21 on a distributed denial-of-service (DDoS) attack that targeted Russian telecommunications operators. The disruption was brief, lasting from around 13:45 until 14:30 Moscow time (10:45 – 11:30 UTC). Roskomnadzor subsequently stated “As of 3 PM Moscow time, the attack has been repelled, and services are operating normally.” The disruption reportedly impacted messaging services Telegram and WhatsApp, as well as Wikipedia, Yandex, VKontakte, telecom support services, and mobile banking apps. Some experts questioned the official explanation, suggesting instead that the disruption was due to centralized interference from Roskomnadzor.
Military action
Palestine
We have covered Internet disruptions related to the ongoing conflict in Gaza multiple times since October 2023, both on Cloudflare Radar’s presence on X, and on the Cloudflare blog (1, 2, 3). In many of these cases, Paltel (AS12975) has posted notices on social media regarding service disruptions and outages. On September 8, Paltel posted a message on its Facebook page, stating (translated) “We regret to announce the suspension of home internet services in the central and southern areas of the Gaza Strip, due to the ongoing aggression.”
Within the Gaza, Rafah, Deir al-Balah Governorates, we observed a sharp drop in traffic at 18:00 local time (16:00 UTC). The impact appeared to be most significant in Rafah and Deir al-Balah. Traffic returned to expected levels around 23:00 local time (21:00 UTC), and Paltel confirmed the service restoration in a subsequent Facebook post, stating (translated) “We would like to announce the return of home Internet services in central and southern Gaza Strip to the way it was before it was interrupted hours ago.”
Lebanon
Israeli airstrikes targeting the Lebanese capital of Beirut on September 28 likely knocked local network provider Solidere (AS42852) offline for several hours. The graph below shows a loss of traffic starting around 12:15 local time (10:15 UTC), at the same time a complete loss of announced IP address space occurred. Most of Solidere’s IP address space started to get announced again at 14:45 local time (12:45 UTC), and a slight increase in traffic was seen at that time as well. Traffic levels fully recovered just after 18:00 local time (16:00 UTC), and announced IP address space had stabilized by that time as well.
Fire
Algeria
A fire near a data center in Blida Province, Algeria disrupted connectivity on AS327931 (Djezzy) at 13:00 and local time (12:00 UTC) on July 24. According to a (translated) X post from Djezzy, “Djezzy announced fluctuations in its services in some areas of the country, as it was a victim of a fire that broke out on Wednesday, July 24, 2024, in a warehouse of one of the companies located near its technical center in the state of Blida.” The post from Djezzy predicted that “97% of the sites will be restored by around 3 am [July 25]”, but traffic did not return to expected levels until the end of the day on July 25.
Unknown
United States
On Monday, September 30, customers on Verizon’s mobile network in multiple cities across the United States reported experiencing a loss of connectivity. Impacted phones showed “SOS” instead of the usual bar-based signal strength indicator, and customers complained of an inability to make or receive calls on their mobile devices. Although initial reports of connectivity problems started around 09:00 ET (13:00 UTC), we didn’t see a noticeable change in request volume at an ASN level until about two hours later. AS6167 (CELLCO) is the autonomous system used by Verizon for its mobile network.
Just before 12:00 ET (16:00 UTC), Verizon published a social media post acknowledging the problem, stating “We are aware of an issue impacting service for some customers. Our engineers are engaged, and we are working quickly to identify and solve the issue.” As the graph below shows, a slight decline (-5%) in HTTP traffic as compared to traffic at the same time a week prior is first visible around 11:00 ET (15:00 UTC), and request volume fell as much as 9% below expected levels at 13:45 ET (17:45 UTC).
Media reports listed cities including Chicago, Indianapolis, New York City, Atlanta, Cincinnati, Omaha, Phoenix, Denver, Minneapolis, Seattle, Los Angeles, and Las Vegas as being most impacted. Traffic graphs illustrating the impacts seen in these cities can be found in our Impact of Verizon’s September 30 outage on Internet traffic blog post.
Traffic appeared to return to expected levels around 17:15 ET (21:15 UTC). At 19:18 ET (23:18 UTC), a social media post from Verizon noted “Verizon engineers have fully restored today’s network disruption that impacted some customers. Service has returned to normal levels.”
Pakistan
On July 31, Pakistan experienced a wide-scale Internet disruption that lasted approximately two hours, between 13:30 – 15:30 local time (08:30 – 10:30 UTC). Traffic only dropped ~45% at a country level, but AS17557 (PTCL) experienced a near complete loss of traffic, while traffic at AS24499 (Telenor Pakistan) dropped nearly 90%. Together, the two network providers serve an estimated nine million users, and are among the top five Internet service providers in the country.
The actual cause of the disruption is disputed. It was reported that the Pakistan Telecommunication Authority (PTA) attributed the disruptions to a technical glitch in the international submarine cable affecting the Pakistan Telecommunication Company Limited (PTCL) network. However, another published report noted “According to our sources, the government’s latest firewall edition to block the content was misconfigured, resulting in Internet connectivity disruption.” Additional details can be found in our August 1 blog post, A recent spate of Internet disruptions.
United Kingdom
On August 14, subscribers of UK service provider Vodafone (AS25135)reported problems accessing both mobile and landline Internet connections. Starting around 11:00 local time (10:00 UTC), we observed traffic starting to drop, ultimately falling 43% below the same time the prior week. The disruption was fairly short-lived, as traffic returned to expected levels by 13:30 local time (12:30 UTC). Vodafone did not acknowledge the issue on social media, nor did it provide a public explanation for what caused the disruption.
Conclusion
Although Internet disruptions observed during the third quarter had a variety of underlying causes, those caused by power outages due to aging or insufficiently maintained electrical infrastructure are worth highlighting. Of course, widespread power outages always create a massive inconvenience for impacted populations, but over the last several years, as communication, entertainment, commerce, and more have become increasingly reliant on the Internet, the impact of these outages has become even more significant, because losing electrical power largely means losing Internet connectivity. Although mobile connectivity may still be available in some cases, it is decidedly not a complete replacement, not to mention that mobile devices will eventually need to be recharged. While addressing the underlying infrastructure issues require non-trivial amounts of time, resources, and money, governments appear to be taking steps towards doing so.
Cloudflare Radar showcases global Internet traffic patterns, attack activity, and technology trends and insights. It is powered by data from Cloudflare’s global network, as well as aggregated and anonymized data from Cloudflare’s 1.1.1.1 public DNS Resolver, and is built on top of a rich, publicly accessible API. This API allows users to explore Radar data beyond the default set of visualizations, for example filtering by protocol, comparing metrics across multiple locations or autonomous systems, or examining trends over two different periods of time. However, not every user has the technical know-how to make a raw API query or process the JSON-formatted response.
Today, we are launching the Cloudflare Radar Data Explorer, which provides a simple Web-based interface to enable users to easily build more complex API queries, including comparisons and filters, and visualize the results. And as a complement to the Data Explorer, we are also launching an AI Assistant, which uses Cloudflare Workers AI to translate a user’s natural language statements or questions into the appropriate Radar API calls, the results of which are visualized in the Data Explorer. Below, we introduce the AI Assistant and Data Explorer, and also dig into how we used Cloudflare Developer Platform tools to build the AI Assistant.
Ask the AI Assistant
Sometimes, a user may know what they are looking for, but aren’t quite sure how to build the relevant API query by selecting from the available options and filters. (The sheer number may appear overwhelming.) In those cases, they can simply pose a question to the AI Assistant, like “Has there been an uptick in malicious email over the last week?” The AI Assistant makes a series of Workers AI and Radar API calls to retrieve the relevant data, which is visualized within seconds:
The AI Assistant pane is found on the right side of the page in desktop browsers, and appears when the user taps the “AI Assistant” button on a mobile browser. To use the AI Assistant, users just need to type their question into the “Ask me something” area at the bottom of the pane and submit it. A few sample queries are also displayed by default to provide examples of how and what to ask, and clicking on one submits it.
The submitted question is evaluated by the AI Assistant (more below on how that happens), and the resulting visualization is displayed in the Results section of the Data Explorer. In addition to the visualization of the results, the appropriate Data, Filter, and Compare options are selected in the Query section above the visualization, allowing the user to further tune or refine the results if necessary. The Keep current filters toggle within the AI Assistant pane allows users to build on the previous question. For example, with that toggle active, a user could ask “Traffic in the United States”, see the resultant graph, and then ask “Compare it with traffic in Mexico” to add Mexico’s data to the graph.
Building a query directly
For users that prefer a more hands-on approach, a wide variety of Radar datasets are available to explore, including traffic metrics, attacks, Internet quality, email security, and more. Once the user selects a dataset, the Breakdown By: dropdown is automatically populated with relevant options (if any), and Filter options are also dynamically populated. As the user selects additional options, the visualization in the Result section is automatically updated.
In addition to building the query of interest, Data Explorer also enables the user to compare the results, both against a specific date range and/or another location or autonomous system (AS). To compare results with the immediately previous period (the last seven days with the seven days before that, for instance), just toggle on the Previous period switch. Otherwise, clicking on the Date Range field brings up a calendar that enables the user to select a starting date — the corresponding date range is intelligently selected, based on the date range selected in the Filter section. To compare results across locations or ASNs, clicking on the “Location or ASN” field brings up a search box in which the user can enter a location (country/region) name, AS name, or AS number, with search results updating as the user types. Note that locations can be compared with other locations or ASes, and ASes can be compared with other ASes or locations. This enables a user, for example, to compare trends for their ISP with trends for their country.
Visualizing the results
Much of the value of Cloudflare Radar comes from its visualizations – the graphs, maps, and tables that illustrate the underlying data, and Data Explorer does not disappoint here. Depending on the dataset and filters selected, and the volume of data returned, results may be visualized in a time series graph, bar chart, treemap, or global choropleth map. The visualization type is determined automatically based on the contents of the API response. For example, the presence of countryalpha2 keys in the response means a choropleth map will be used, the presence of timestamps in the response means a line graph (“xychart”) should be shown, and more than 40 items in the response selects a treemap as the visualization type.
To illustrate the extended visualizations available in Data Explorer, the figure below is an expanded version of one that would normally be found on Radar’s Adoption & Usage page. The “standard” version of the graph plots the shares of the HTTP versions over the last seven days for the United States, as well as the summary share values. In this extended version of the graph generated in the Data Explorer, we compare data for the United States with HTTP version share data for AS701 (Verizon), for both the past seven days and the previous seven-day period. In addition to the comparisons plotted on the time series graph, the associated summary values are also compared in an accompanying bar chart. This comprehensive visualization makes comparisons easy.
For some combinations of datasets/filters/comparisons, time series graphs can get quite busy, with a significant number of lines being plotted. To isolate just a single line on the graph, double-click on the item in the legend. To add/remove additional lines back to/from the graph, single-click on the relevant legend item.
Similar to other visualizations on Radar, the resulting graphs or maps can be downloaded, copied, or embedded into another website or application. Simply click on the “Share” button above the visualization card to bring up the Share modal dialog. We hope to see these graphs shared in articles, blog posts, and presentations, and to see embedded visualizations with real-time data in your portals and operations centers!
Still want to use the API? No problem.
Although Data Explorer was designed to simplify the process of building, and viewing the results of, more complex API queries, we recognize that some users may still want to retrieve data directly from the API. To enable that, Data Explorer’s API section provides copyable API calls as a direct request URL and a cURL command. The raw data returned by the query is also available to copy or download as a JSON blob, for those users that want to save it locally, or paste it into another application for additional manipulation or analysis.
How we built the AI Assistant
Knowing all that AI is capable of these days, we thought that creating a system for an LLM to answer questions didn’t seem like an overly complex task. While there were some challenges, Cloudflare’s developer platform tools thankfully made it fairly straightforward.
LLM-assisted API querying
The main challenge we encountered in building the API Assistant was the large number of combinations of datasets and parameters that can potentially be visualized in the Data Explorer. There are around 100 API endpoints from which the data can be fetched, with most able to take multiple parameters.
There were a few potential approaches to getting started. One was to take a previously trained LLM and further train it with the API endpoint descriptions in order to have it return the output in the required structured format which would then be used to execute the API query. However, for the first version, we decided against this approach of fine-tuning, as we wanted to quickly test a few different models supported by Workers AI, and we wanted the flexibility to easily add or remove parameter combinations, as Data Explorer development was still under way. As such, we decided to start with prompt engineering, where all the endpoint-specific information is placed in the instructions sent to the LLM.
Putting the full detailed description of the API endpoints supported by the Data Explorer into the system prompt would be possible for an LLM with a larger context window (the number of tokens the model takes as input before generating output). Newer models are getting better with the needle in a haystack problem, which refers to the issue whereby LLMs do not retrieve information (the needle) equally well if it is placed in different positions within the long textual input (the haystack). However, it has been empirically shown that the position of information within the large context still matters. Additionally, many of the Radar API endpoints have quite similar descriptions, and putting all the descriptions in a single instruction could be more confusing for the model, and the processing time also increases with larger contexts. Based on this, we adopted the approach of having multiple inference calls to an LLM.
First, when the user enters a question, a Worker sends this question and a short general description of the available datasets to the LLM, asking it to determine the topic of the question. Then, based on the topic returned by the model, a system prompt is generated with the endpoint descriptions, including only those related to the topic. This prompt, along with the original question, is sent to the LLM asking it to select the appropriate endpoint and its specific parameters. At the same time, two parallel inference calls to the model are also made, one with the question and the system prompt related to the description of location parameters, and another with the description of time range parameters. Then, all three model outputs are put together and validated.
If the final output is a valid dataset and parameter combination, it is sent back to the Data Explorer, which executes the API query and displays the resulting visualization for the user. Different LLMs were tested for this task, and at the end, openhermes-2.5-mistral-7b, trained on code datasets, was selected as the best option. To give the model more context, not only is the user’s current question sent to the model, but the previous one and its response are as well, in case the next question asked by the user is related to the previous one. In addition, calls to the model are sent through Cloudflare’s AI Gateway, to allow for caching, rate limiting, and logging.
After the user is shown the result, they can indicate whether what was shown to them was useful or not by clicking the “thumbs up” or “thumbs down” icons in the response. This rating information is saved with the original question in D1, our serverless SQL database, so the results can be analyzed and applied to future AI Assistant improvements.
The full end-to-end data flow for the Cloudflare Radar AI Assistant is illustrated in the diagram below.
When the LLM doesn’t know the answer
In some cases, however, the LLM may not “know” the answer to the question posed by the user. If the model does not generate a valid final response, then the user is shown three alternative questions. The intent here is to guide the user into asking an answerable question — that is, a question that is answerable with data from Radar.
This is achieved using a previously compiled (static) list of various questions related to different Radar datasets. For each of these questions, their embedding is calculated using an embeddings model, and stored in our Vectorizevector database. “Embeddings” are numerical representations of textual data (vectors) capturing their semantic meaning and relationships, with similar text having vectors that are closer. When a user’s question does not generate a valid model response, the embedding of that question is calculated, and its vector is compared against all the stored vectors from the vector database, and the three most similar ones are selected. These three questions, determined to be similar to the user’s original question, are then shown to the user.
There are also cases when the LLM gives answers which do not correspond to what the user asked, as hallucinations are currently inevitable in LLMs, or when time durations are calculated inaccurately, as LLMs sometimes struggle with mathematical calculations. To help guard against this, AI Assistant responses are first validated against the API schema to confirm that the dataset and the parameter combination is valid. Additionally, Data Explorer dropdown options are automatically populated based on the AI Assistant’s response, and the chart titles are also automatically generated, so the user always knows exactly what data is shown in the visualization, even if it might not answer their actual question.
Looking ahead
We’re excited to enable more granular access to the rich datasets that currently power Cloudflare Radar. As we add new datasets in the future, such as DNS metrics, these will be available through Data Explorer and AI Assistant as well.
As noted above, Radar offers a predefined set of visualizations, and these serve as an excellent starting point for further exploration. We are adding links from each Radar visualization into Data Explorer, enabling users to further analyze the associated data to answer more specific questions. Clicking the “pie chart” icon next to a graph’s description brings up a Data Explorer page with the relevant metrics, options, and filters selected.
Correlating observations across two different metrics is another capability that we are also working on adding to Data Explorer. For example, if you are investigating an Internet disruption, you will be able to plot traffic trends and announced IP address space for a given country or autonomous system on the same graph to determine if both dropped concurrently.
But for now, use the Data Explorer and AI Assistant to go beyond what Cloudflare Radar offers, finding answers to your questions about what’s happening on the Internet. If you share Data Explorer visualizations on social media, be sure to tag us: @CloudflareRadar (X), noc.social/@cloudflareradar (Mastodon), and radar.cloudflare.com (Bluesky). You can also reach out on social media, or contact us via email, with suggestions for future Data Explorer and AI Assistant functionality.
Much has changed in the 2024 United States presidential election since the June 27 debate between Donald Trump and Joe Biden, then the presumptive nominees for the November election. Now, over two months later, on September 10, the debate was between Kamala Harris, the Democratic nominee, and Donald Trump, the Republican nominee. In this post, we will explore the event’s impact on Internet traffic in specific states where there was a bigger impact than during the Biden-Trump debate, as well as examine cyberattacks, email phishing trends, and general DNS data on candidates, news, and election-related activity.
Typically, we have observed that election days don’t come with significant changes to Internet traffic, and the same is true for debates. Yet, debates can also draw attention that impacts traffic, especially when there is heightened anticipation. The 2024 debates were not only aired on broadcast and cable television, but also streamed on platforms like YouTube, increasing their reach and impact.
Key takeaways:
The September 10 Harris-Trump debate caused bigger drops in Internet traffic in the US than the Biden-Trump debate on June 27.
There was also a noticeable increase in DNS traffic to both Kamala Harris-related and Donald Trump-related domains, with Trump-related DNS traffic peaking around the start of the debate and Harris-related DNS traffic peaking after the debate ended, around the time Taylor Swift announced she was endorsing Harris.
We also observed increases in DNS traffic to US news media outlets and election-related domains right after the debate ended.
Donald Trump remains the candidate with the most mentions in email subjects and the highest percentages of emails classified as spam (26.7%) and malicious (2.4%). Since mid-August, there has been a slight increase in the percentage of spam and malicious emails mentioning Kamala Harris.
Traffic drop in the US
During the September 10, 2024, debate between Harris and Trump, hosted by ABC News at 21:00 EST (01:00 UTC) in Philadelphia, Pennsylvania, Cloudflare noted a trend similar to the Biden-Trump debate, with a clear drop in nationwide Internet requests, falling as much as 9% below the same time a week prior at 21:15 EST (01:15 UTC). At the end of the debate, around 22:45 EST (02:45 UTC), the drop was less evident, at just 2%. Traffic increased slightly just after the debate.
Note: there were two four-minute breaks during the debate, at around 22:00 and 22:30, and our data here has 15-minute granularity.
There’s a clear difference between this second debate, with a drop of up to 9%, and the first one between Biden and Trump on June 27, when the traffic dropped just 2% below the same time a week prior. Interestingly, the biggest drop occurred at the same time in both debates, right after they started, at 21:15 EST (01:15 UTC).
Internet traffic dips across US states
Traffic shifts at the time of the debate, as compared to the previous week, can reveal more detail at a state-level perspective than at the country level. The map below summarizes traffic changes observed at a state level. A key observation is that traffic declines at a state level were much more pronounced during the Harris-Trump debate, than during the Biden-Trump debate in late June.
(Source: Cloudflare; created with Datawrapper)
The most significant traffic drops were observed in Vermont (-25%), Montana (-22%), and Idaho (-19%). More populous states such as California (-11%), Texas (-10%), and New York (-14%) also experienced notable declines in traffic.
Just for comparison, here’s the state map from that June 27 Biden-Trump debate:
(Source: Cloudflare; created with Datawrapper)
The initial minutes of the Harris-Trump debate triggered the largest traffic declines in most states, at least up until the first break, at around 21:30 ET (01:30 UTC).
In the next table, we provide a detailed breakdown of the same perspective shown on the US map ordered by the magnitude of the drop in traffic. We include the time of the biggest traffic drop compared to the previous week, at a 5-minute granularity, and also the percentage of the drop compared to the previous week. As noted above, the largest declines appeared to occur earlier in the debate.
State
Drop in traffic (%)
Local Time
UTC
Vermont
-25%
21:05 EDT
1:05
Montana
-22%
19:10 MDT
1:10
Idaho
-19%
19:10 MDT
1:10
Wyoming
-19%
19:15 MDT
1:15
North Dakota
-18%
20:15 CDT
1:15
Delaware
-15%
21:20 EDT
1:20
Illinois
-15%
20:20 CDT
1:20
Mississippi
-14%
20:05 CDT
1:05
New York
-14%
21:05 EDT
1:05
Rhode Island
-14%
21:45 EDT
1:45
West Virginia
-14%
21:15 EDT
1:15
Alabama
-13%
20:05 CDT
1:05
Georgia
-13%
21:20 EDT
1:20
South Carolina
-13%
21:15 EDT
1:15
Virginia
-13%
21:15 EDT
1:15
Colorado
-12%
19:45 MDT
1:45
Connecticut
-12%
21:05 EDT
1:05
Nevada
-12%
18:20 PDT
1:20
New Jersey
-12%
21:20 EDT
1:20
Alaska
-11%
17:15 AKDT
1:15
California
-11%
18:15 PDT
1:15
Florida
-11%
21:05 EDT
1:05
North Carolina
-11%
21:05 EDT
1:05
Wisconsin
-11%
20:20 CDT
1:20
Arkansas
-10%
20:05 CDT
1:05
District of Columbia
-10%
21:55 EDT
1:55
Missouri
-10%
20:25 CDT
1:25
Oregon
-10%
18:40 PDT
1:40
Pennsylvania
-10%
21:05 EDT
1:05
South Dakota
-10%
20:20 CDT
1:20
Texas
-10%
20:05 CDT
1:05
Maryland
-9%
21:20 EDT
1:20
Massachusetts
-9%
21:20 EDT
1:20
New Hampshire
-9%
21:05 EDT
1:05
Oklahoma
-9%
20:05 CDT
1:05
Arizona
-8%
18:15 MST
1:15
Indiana
-8%
21:05 EDT
1:05
Iowa
-8%
20:05 CDT
1:05
Kentucky
-8%
21:05 EDT
1:05
Maine
-8%
21:15 EDT
1:15
Nebraska
-8%
19:45 MDT
1:45
Kansas
-7%
20:25 CDT
1:25
Louisiana
-7%
20:20 CDT
1:20
Michigan
-7%
21:20 EDT
1:20
Minnesota
-7%
20:30 CDT
1:30
New Mexico
-7%
19:25 MDT
1:25
Washington
-7%
18:05 PDT
1:05
Hawaii
-6%
15:20 HST
1:20
Ohio
-6%
21:15 EDT
1:15
Tennessee
-6%
20:05 CDT
1:05
Utah
-6%
19:10 MDT
1:10
Swing state drops in traffic higher than first debate
The seven swing states that are said to be decisive in the election — Arizona, Georgia, Michigan, Nevada, North Carolina, Pennsylvania, and Wisconsin — each saw traffic drop between 8% and 13%, which is more than during the Biden-Trump debate (between 5% and 8% at that time). Here’s a more focused view of those swing states for easier visualization:
State
Drop in traffic
Local Time
UTC
Arizona
-8%
18:15 MST
1:15
Georgia
-13%
21:20 EDT
1:20
Michigan
-7%
21:20 EDT
1:20
Nevada
-12%
18:20 PDT
1:20
North Carolina
-11%
21:05 EDT
1:05
Pennsylvania
-10%
21:05 EDT
1:05
Wisconsin
-11%
20:20 CDT
1:20
DNS trends
Shifting our attention to domain trends, our 1.1.1.1 resolver data highlights a more targeted impact during and around the debate. Let’s start with Kamala Harris-related insights.
Harris and the Taylor Swift effect
Since July 21, the date of Biden’s withdrawal and endorsement of Harris, daily DNS traffic to Harris-related domains has significantly increased, with notable peaks on August 30 (the day after the Harris-Walz interview on CNN) and September 10 (the debate with Trump).
From an hourly perspective, the impact of the debate on Kamala Harris-related sites is evident, with increased DNS traffic throughout the day (September 10). The peak occurred at the debate’s start (21:00 ET / 01:00 UTC) with a 54% increase from the previous week, and again after it ended (23:00 ET / 03:00 UTC) with a 56% rise. This spike coincided with Taylor Swift’s endorsement of Kamala Harris.
Trump and the Elon Musk interview effect
Donald Trump, having a longer-standing campaign and websites compared to Kamala Harris, shows different trends. Aggregated daily DNS traffic to Trump-related domains has also increased in recent months. Significant peaks were observed on July 15 (two days after the assassination attempt), then during the Republican National Convention (August 19-22), with the highest spike occurring on August 12, following Elon Musk’s interview with Trump on X.
Hourly data shows the debate’s impact on Trump-related sites with a noticeable increase around the debate’s start (21:00 ET / 01:00 UTC), where DNS traffic was 46% higher than the previous week. This elevated traffic continued for a few hours, after the debate ended.
From news to election-related sites
Like previous US election-related events, the debate generated significant interest in US news organizations, leading to a rise in aggregated DNS traffic to general US news sites. This increase peaked during the debate at 22:00 ET (02:00 UTC), with DNS traffic 62% higher than the previous week. The elevated DNS traffic began before the debate and persisted afterward, with a 19% increase at 20:00 ET (00:00 UTC) and a 25% increase at 00:00 ET (04:00 UTC).
Microblogging social platforms like X or Threads outperformed their previous week’s traffic throughout the debate, peaking at 16% growth around 22:00 ET (02:00 UTC).
Additionally, there was a notable increase in DNS traffic to election-related websites, including official voting registration and election sites. During the morning of September 10 in the US, DNS traffic was 38% higher at 10:00 ET (14:00 UTC), with a significant spike at 23:00 ET (03:00 UTC) right after the debate, where DNS traffic surged by 76% compared to the previous week.
Harris-Trump: spam and malicious emails
From a cybersecurity perspective, trending events, topics, and individuals often attract more emails, including malicious, phishing, and spam messages. Our earlier analysis covered email trends involving “Joe Biden” and “Donald Trump” since January. We’ve since updated it to include Kamala Harris after the Democratic Convention.
From June 1, 2024, through August 21, Cloudflare’s Cloud Email Security service processed over 16 million emails that included the names “Donald Trump”, “Joe Biden”, or “Kamala Harris” in the subject, with 8.7 million referencing Trump, 4.8 million referencing Biden, and 3 million referencing Harris.
The chart below highlights a surge in emails mentioning Trump in mid-July, contrasting with a drop in the number of emails mentioning Biden in the subject and an increase in emails mentioning Harris.
Since July 21, following changes in the presumptive Democratic candidate, over 4.5 million emails mentioned “Donald Trump,” over 1.5 million mentioned “Joe Biden,” and around 2.8 million mentioned “Kamala Harris” in the subject. Of these, 26.7% of emails with Trump’s name were classified as spam, and 2.4% were classified as malicious. For Kamala Harris, 1.1% were classified as spam and 0.2% were classified as malicious, while Biden’s figures were 1.1% for spam and 0.1% for malicious.
Since mid-August, there has been a slight increase in the percentage of spam and malicious emails mentioning Kamala Harris. Trump remains the candidate with the most mentions in email subjects and the highest percentages of emails classified as spam and malicious.
September attacks on political and news sites
In our blog posts about several of the 2024 elections, we have noted that attacks on politically-related websites have remained a significant threat this year. In Europe, we’ve seen political parties and associated websites targeted around elections. We previously reported on DDoS attacks around the Republican National Convention and Democratic National Convention.
In our post about the Democratic National Convention, we showed that during late July and August, Cloudflare blocked DDoS attacks targeting three US politically related organizations, including a site associated with one of the major parties, with attacks occurring just before the Democratic Convention.
The largest DDoS attack recorded in recent days against politically-related websites targeted specifically a US political-party related website on September 4, peaking at 140,000 requests per second (rps) and lasting about 5 minutes.
But it’s not only US politically-related websites that could be the target of cyber attacks. News organizations are often attacked during relevant events, as we saw during the first year of the war in Ukraine, for example. Already in September, we’ve seen an example of a relevant US news organization that covers politics being the target of a DDoS attack on September 3, peaking at 343,000 requests per second (rps) and lasting about 5 minutes.
As highlighted in our Q2 DDoS report, most DDoS attacks are short-lived, as exemplified by the two mentioned attacks. Also, 81% of HTTP DDoS attacks peak at under 50,000 requests per second (rps), and only 7% reach between 100,000 and 250,000 rps. While a 140,000 rps attack might seem minor to Cloudflare, it can be devastating for websites not equipped to handle such high levels of traffic.
Conclusion
In this analysis of the Harris-Trump debate, we’ve observed that the September 10 debate caused bigger drops in traffic in the US than the Biden-Trump debate in late June. There was also a noticeable increase in DNS traffic to both Kamala Harris-related and Donald Trump-related domains, as well as to US news media outlets and election-related domains — in this case, right after the debate ended.
If you’re interested in more trends and insights about the Internet and elections, check out Cloudflare Radar, specifically our 2024 Elections Insights report. It will be updated throughout the year as elections (or election-related events) occur.
The Paris 2024 Summer Olympics wrapped up on August 11, 2024, with the Olympic flag being lowered in the Stade de France after 16 days of competitions. With 329 events across 32 sports, over 10,000 athletes from 204 nations participated in the pursuit of medals and glory, creating some viral online moments along the way. In this post, we turn our attention to the closing ceremony, the impact of various Olympic moments on Internet traffic, and the cyber attacks faced by sponsors. We also examine email trends related to the Olympics, including mentions of Simone Biles, Snoop Dogg, and Imane Khelif.
Cloudflare has a global presence with data centers in over 330 cities, supporting millions of customers with different tools and products, which provides a global view of what’s happening on the Internet. This is helpful for improving security, privacy, efficiency, and speed, but also for observing Internet disruptions and traffic trends.
In our previous blog post about the opening ceremony and the early days of the event, we showed how France was impacted by the Olympics, with clear drops in traffic during the main events. The opening ceremony caused the most significant drop—traffic decreased by as much as 20% compared to the previous week. Other countries were also less online during that time, spending more time on broadcast TV.
Closing ceremony impact in France
The moment that the Golden Voyager (a golden dancing character) descended from the sky during the closing ceremony. Captured in a photo taken by Cloudflare CEO Matthew Prince, who was in attendance.
More than two weeks after the Summer Olympics began, the 3-hour closing ceremony on August 11, 2024, had a similar impact as the opening ceremony did on Internet traffic in France, although less pronounced. Internet traffic dropped by as much as 14% compared to the previous week at the start of the ceremony, around 19:15 UTC. Here is a breakdown of the top three traffic drops compared to the previous week during the ceremony, detailing the events occurring at those times. Our data provides insights with 15-minute granularity.
Moments of the closing ceremony by traffic drop in France
Time of drop (UTC)
Drop %
Events at the time
#1
~19:15
-14%
Léon Marchand, France’s swimming star, carried a lantern from the Cauldron at the Jardins des Tuileries to the Stade de France. Flags of all National Olympic Committees entered the stadium, followed by the athletes.
#2
~20:15
-13%
A Golden Voyager, inspired by French history, descended from the sky, followed by Nike, the Goddess of Victory. In the stands, LED bracelets—similar to those used at Taylor Swift concerts—created images of athletes, doves of peace, and the Olympic Rings.
#3
~21:30
-10%
Californian artist H.E.R. performed the U.S. national anthem and introduced Tom Cruise, who performed Mission Impossible stunts to transport the Olympic flag from Paris to Los Angeles.
During the closing ceremony, from 19:00 to 22:00 UTC, traffic in France was significantly lower than the previous week, down between 3% – 14%. The decreases were less pronounced during the middle and end of the event. Internet requests increased during band performances and the official closing speeches. Traffic also rose during Yseult’s finale, singing a rendition of Frank Sinatra’s “My Way,” contrasting with the significant drop during Celine Dion’s performance at the end of the opening ceremony.
In exploring traffic trends for other countries, we found that the closing ceremony didn’t have as clear an impact as the opening event did.
Taking a broader look at traffic in France during the entire Olympic period, daily traffic dropped by as much as 8% on July 28 but remained fairly stable afterward, with a 3% drop on August 8.
Mobile device use rose in France
Mobile device traffic share continued to grow during the event, with more people using mobile devices to access the Internet. This trend of more mobile use in France aligns not only with more tourists and visitors in the country during the Olympics – visitors more typically use mobile devices to access the Internet – but also with French people taking vacations and working less during this time. Weekly mobile device traffic share in France in mid-June was 49%, and since the Olympics started, it has increased to between 53% and 54%.
In France, mobile device use is higher on weekends. However, looking at daily trends, mobile traffic share on weekdays was clearly higher after July 26, when the Olympics began.
Parisians left, Olympic tourists arrived
We’ve seen before that Parisians appeared to left town (and the region) just before the Olympics. In the Paris region of Île-de-France, with the Olympics, traffic during the first week of the event dropped as much as 6% on July 30, compared to the previous week. Traffic picked up a bit on the second weekend of the Olympics but dropped even more during the second and final week.
The chart below illustrates daily traffic to the Île-de-France region, with a noticeable decline visible during the weekend before the Olympics that was more pronounced during the event.
Weekly traffic dropped 8% the week the Olympics started and remained stable the following week. Even so, by August 4, the last week of the Olympics, traffic was 23% lower in the Île-de-France region than in the week of June 30, when it was at its highest in recent weeks.
Significant moments: from Simone Biles to breakdancing debut
Below, we highlight specific Olympic events affecting Internet traffic that we were able to observe in our data from different locations (ordered by the numbers of medals in the event), starting from the first full competition day on Saturday, July 27, 2024.
Host nation France was clearly the one with more significant impacts to Internet traffic during relevant moments of the Olympics.
United States: The artistic gymnastics competition featuring four-time Olympic gold medalist Simone Biles had a greater impact on U.S. Internet traffic than the opening ceremony. On July 26-28, traffic dipped most significantly during Biles’ events. On the 28th, at 10:00 UTC, during her beam routine, traffic was already 4% lower than the previous week. It dropped by 6% at 10:45 UTC during her floor and vault routines.
On July 29, at 19:30 UTC, traffic dropped 4% during the swimming event where Ryan Murphy won the bronze medal in the men’s 100 m backstroke final.
Another notable drop occurred on August 10, with a 7% decrease around 15:00 UTC during the women’s football gold medal match between Brazil and the USA. Later that day, during the men’s basketball gold medal game between France and the USA, traffic dropped by as much as 6%.
Great Britain: The first weekend of the Olympics saw clear drops in traffic, with a 10% decrease compared to the previous week around 15:00 UTC on July 28, 2024. British athletes participated in several events during those busy days. Traffic the following weekend was slightly higher than in the first Olympic weekend but dropped again on the final day, August 11.
France: As previously noted, French swimmer Léon Marchand’s gold medal and Olympic record in the men’s 400-meter individual medley on July 28 had the most significant impact on French traffic during the Olympics, aside from the 20% drop seen during the opening ceremony. Traffic fell by 17% at 18:30 UTC during his event—the same level of drop seen during the closing ceremony. Similar impacts occurred during other swimming events:
July 29, 19:45 UTC, 14% drop during the Women’s 100 m Backstroke Semifinals featuring Yohann Ndoye-Brouard.
July 30, 19:00 UTC, 12% drop during the Men’s 200 m Butterfly Semifinals with Léon Marchand.
July 31, 18:30-20:30 UTC, 7% to 10% drop during the Men’s 200 m Butterfly final with Léon Marchand.
August 1, 18:45 UTC, 8% drop during swimming semifinals and finals.
Other notable drops include breakdancing:
August 9, 14:30 UTC, 10% drop during the Breaking dance debut with France’s participation.
August 10, 18:45-21:00 UTC, 7% drop during the Breaking B-Boys gold medal battle and the men’s basketball gold medal game, France vs USA.
August 11, 07:00 UTC, 8% drop during the women’s marathon.
Australia: During Mollie O’Callaghan’s victory in the women’s 200 m freestyle on July 29, at around 20:00 UTC, Australian traffic was 5% lower than the previous week, a larger drop than during the opening ceremony, which saw a 2% decrease.
On August 1, at around 18:45 UTC, traffic was 10% lower than the previous week during swimming events that led to Australia’s gold in the women’s 4x200m freestyle relay. And on August 11, at around 07:00 UTC, traffic dropped 7% compared to the previous week during the women’s marathon with Australian participants.
Japan: One of the most significant drops in traffic in Japan during the Olympics occurred on August 6, around the time Fumita Kenichiro from Japan won gold in the men’s Greco-Roman wrestling 60 kg final, followed by artistic swimming and the women’s table tennis competition, with traffic dropping 12% at 18:15 UTC.
On August 10, for several hours after 17:30 UTC, traffic in Japan was also lower than usual, with a drop of as much as 14%. This coincided with Japan’s gold medal win in the women’s javelin throw and the men’s breaking quarterfinals and semifinals.
Italy: During the event that gave Italy its first ever gold medal in artistic gymnastics, won by Alice D’Amato in the women’s balance beam event, traffic dropped 5% at around 10:45 UTC.
Netherlands: On the morning of July 28, the second full day of the Olympics, traffic in the Netherlands dropped by as much as 20% compared to the previous week, with Dutch athletes participating in several competitions.
On August 11, traffic dropped between 06:30 and 09:30 UTC, and by as much as 16% at 08:15 UTC, when Dutch runner Sifan Hassan won the gold medal in the women’s marathon.
South Korea: The Korean women’s archery team’s gold medal win on July 28 at 15:30 UTC led to an 8% drop in traffic, the most significant decrease noted in the country between July 26 and July 29.
On August 7, at 19:45 UTC, traffic was 9% lower during the Taekwondo gold medal event for Park Taejoon in the men’s -58 kg (under 58 kg) competition.
Brazil: Traffic in Brazil was 15% lower than the previous week on July 27 at around 19:30 UTC, surpassing the impact of the opening ceremony. This occurred as Brazilian swimmers Guilherme Costa and Maria Fernanda Costa competed in the men’s and women’s 400 m freestyle events.
On August 2, traffic in Brazil was 5% lower at around 00:30 UTC during the men’s surfing quarterfinals with Gabriel Medina and was 8% lower at around 01:00 UTC during the women’s surfing quarterfinals with Tatiana Weston-Webb.
Cape Verde: David Pina won the first Olympic medal in boxing for this archipelago nation off the western coast of Africa. On August 4, the amateur boxer took the bronze medal, with traffic dropping 12% in the country at around 15:00 UTC during the match.
DNS trends for official Olympic websites by country
On July 22, before the Olympics began, we reported on the heightened interest in official Olympic websites based on request data from our 1.1.1.1 DNS resolver. France initially dominated with 24% of DNS traffic, followed by the UK (20%) and the US (17%). However, when the Olympics started, the US took the lead, maintaining it throughout the event.
The following chart summarizes the highest shares of DNS request traffic by country during the Paris 2024 Summer Olympics. There was a shift in percentages that indicates a broader spread of interest across countries as the Olympics progressed, visible in the dynamic version of the map by day of the event that is available in our Paris 2024 Olympics report.
Here are the top 10 countries that during the event had more DNS traffic for Olympics official websites. The US took the “gold,” France the “silver,” and the UK the “bronze”:
United States: 18%
France: 16%
United Kingdom: 10%
Germany: 7%
Brazil: 6%
Australia: 5%
Canada: 2%
Japan: 2%
India: 2%
Russian Federation: 2%
We observed that the US overtook France for the #1 spot a few days before the event began. France also dropped to third place behind Germany on July 27, the first full day of competitions, and again after August 2, though interestingly, it returned to #2 the day after the Olympics ended.
As shown in the following daily ranking chart, the UK was #3 before the event began but dropped to #4 on August 1. Australia’s highest ranking was #3 on July 29, and #4 on August 10 and 11. Brazil’s best days, ranking #3, were on July 24-25, and on July 30, 31, and August 1.
In terms of volume of DNS traffic to our 1.1.1.1 resolver, the first full week of Olympic events saw the highest volume of requests related to official Olympic websites, with a 637% increase compared to the week before the Olympics began. This trend of peak traffic during the first week was consistent across most countries, except for Germany, Spain, India, Italy, and Russia, where the final week generated more DNS resolver traffic.
On a daily basis, worldwide DNS traffic to official Olympics domains peaked on August 2, followed by August 4 and August 5, marking the start of the second and final week of the event. Below are the top 3 days with the highest DNS traffic to official Olympic websites in the top 3 countries by traffic volume:
United States: July 30 (when the US women’s team won gold in artistic gymnastics and several medals were won in swimming), July 29, and August 5.
France: July 31 (when swimmer Léon Marchand won gold in the men’s 200 m butterfly final), July 29, and August 1.
Germany: July 27 (when swimmer Lukas Maertens won gold in the men’s 400 m freestyle final), August 8, and August 7.
Sports news sites
Looking at DNS traffic for sports news sites across different countries, the two weeks of the Olympics brought more traffic than any other week since June, including during the major football event, UEFA Euro 2024, held between June 14 and July 14. The Olympic weeks saw 17% more traffic than the week before the Olympics and 4% more DNS traffic than the best week of Euro 2024 (June 22-29).
From a daily perspective, the days with the highest traffic to sports news sites were August 10, August 3, July 28, and July 14 (related to the Euro 2024 final).
In the United States, NBC was not only the official broadcaster of the Olympics, but also created a dedicated website. NBC’s sports and NBC Olympics websites saw a significant rise in global DNS traffic, increasing up to 1,640% on July 28 compared to the previous week.
From official streaming services to Olympic sponsors
While the Olympics were still broadcast on several traditional national TV networks, streaming also played a key role, with Peacock TV (in the US and Canada) and Max (from Warner Bros. Discovery) in Europe offering several hours of Olympic content daily. The global traffic growth to these platforms was evident. On a weekly basis, DNS request traffic for streaming platforms featuring Olympic events grew by as much as 65%. Daily traffic peaked on July 30 (68% higher than the previous week), followed by July 29 and August 4. Peacock TV led over Max in terms of traffic.
Breakdancing, or “breaking,” made its first appearance in the 2024 Summer Olympics, leading to a surge in DNS traffic to breaking-related websites, particularly on August 9 and 10. Traffic peaked on August 9, with a 215% increase compared to the previous week, driven by viral moments like Australian Rachael Gunn’s performance.
How about the Paris Olympics sponsors? DNS traffic also increased, particularly in the early days of the event and the days leading up to it, with peak traffic on July 29 (15% higher than the previous week), followed by July 25 and 24 (the two days before the opening ceremony). Samsung saw the most significant impact during the early days of the Olympics, while Airbnb experienced a surge in traffic just before the opening ceremony (July 25).
Next stop: LA 2028
The closing ceremony concluded with a symbolic passing of the torch from Paris 2024 to Los Angeles 2028. Simone Biles handed the Olympic flag to Tom Cruise, who transported it Mission Impossible-style from Paris to a Venice Beach concert in LA featuring acts including the Red Hot Chili Peppers and Billie Eilish. Unsurprisingly, the official LA 2028 Olympics website saw a 1600% surge in DNS traffic on August 11 compared to the previous week.
DDoS attacks targeting Olympic-related and sponsor websites
As we observed during the 2024 elections, including the French elections, political parties are not the only targets of DDoS (Distributed Denial of Service) attacks during significant events. Attackers are aware of large global events. In a previous related blog post, we discussed attacks targeting French transportation and government websites. Below, let’s focus on Olympic-related and sponsor organizations.
In July, Cloudflare blocked a surge in DDoS attacks on Olympic partner websites – higher than in any other month of 2024. Daily DDoS attack requests jumped to 200 million, and in just 11 days of August, more DDoS requests (90 million) were blocked than in any full month in 2024 before the Olympics.
The largest spike in attacks occurred on July 29, targeting three sponsor websites simultaneously, with 84 million DDoS-related requests in a single day. The most intense DDoS attack peaked at 190,000 requests per second at 10:20 UTC.
The most significant specific attack was on the last day of the event, August 11, targeting a French transportation site. It lasted four minutes and peaked at over 500,000 requests per second at 05:09 UTC.
As highlighted in our Q2 DDoS report, most DDoS attacks are short-lived, as seen in the two mentioned attacks. While a 500,000 request per second (rps) attack is not large for Cloudflare, it can be devastating for websites not equipped to handle such traffic levels.
Analyzing the same pool of Olympic partner websites that use Cloudflare, total requests (including legitimate traffic and attacks) rose in July, reaching 4.2 billion—27% more than in May and 11% more than in June.
Rise in “Olympics” and “Paris 2024” emails
Major events often attract attention in the email realm, including spam and malicious emails, and the Olympics were no exception. From January 2024 through August 11, Cloudflare’s Cloud Email Security service processed over 1.7 million emails containing “Olympics” or “Paris 2024” in the subject. More than half of these emails (890,000) were sent during the Olympics (July 26 to August 11), with the highest volume (150,000 messages) on July 26, the day of the opening ceremony.
The week of July 22-28, coinciding with the first few days of the Olympics, saw a 304% increase in such emails compared to the previous week, and an astonishing 3111% increase compared to the busiest week in January.
Although the Olympics period (July 26 – August 11) was busy in terms of related emails, the percentages of spam and malicious messages were lower than before. However, over 6,200 emails were classified as spam (0.7%), and just 248 were identified as malicious or phishing (0.07%).
As noted in a previous blog post, since January 1, 2024, spam accounted for 1.3% of all emails with “Olympics” or “Paris 2024” in the subject, while malicious emails made up 0.1%. In a sample of 1,000 emails, roughly 13 would be spam and 1 would be malicious. The peak for malicious Olympic-related emails occurred during the week of May 6, with 0.6% classified as malicious. Although there was a decline after this peak, rates increased slightly in July, reaching 0.4% on July 8. Despite the surge in volume during the week of July 22, only 0.05% of emails were malicious.
Simone Biles and Snoop Dogg popular via email
Famous individuals are often used by attackers for email phishing. Among the athletes shining at the event, Simone Biles generated the most emails, but very few of them were spam or malicious. Biles led other popular names during the event, including those named below, ordered by number of email messages: Katie Ledecky (US), Imane Khelif (Algeria), Novak Djokovic (Serbia), Steph Curry (US), and Léon Marchand (France).
Since July 1, over 160,000 emails processed by Cloudflare’s Cloud Email Security service have included “Simone Biles” or “Biles” in the subject, with only 0.5% considered spam and 0.01% classified as malicious. (And 97% of those 160,000 emails were sent since the Olympics started on July 26.) The most emails were sent on August 5, followed by August 2 and July 28. Spam percentage peaked on July 24, with 5% of all emails considered spam.
Among famous attendees, Snoop Dogg topped the list ahead of other US team supporters like Martha Stewart, Flava Flav, and Jason Kelce. Since July, there have been over 6,600 emails with “Snoop Dogg” in the subject, with 40 classified as spam (0.6%) and 4 as malicious (0.06%).
Conclusion: from Paris to Los Angeles
The Paris 2024 Summer Olympics not only captivated millions worldwide with thrilling sports competitions, but also had a significant impact on global Internet traffic. Our data shows noticeable drops in Internet activity during key Olympic events, particularly in France, as viewers shifted from online activities to watching the games live. This trend underscores the enduring power of broadcast media during major global events, even in an increasingly digital age.
Additionally, the increase in DNS traffic for official Olympic websites and the surge in DNS traffic for streaming platforms covering the event indicates strong interest in online coverage, especially among certain audiences, complementing traditional TV viewership broadcast by national networks worldwide.
Finally, the heightened cybersecurity threats, including DDoS attacks on sponsor sites and the rise in Olympic-related emails (including spam and malicious ones), emphasize both the marketing impact of this global event and its vulnerabilities.
And after the Paris 2024 Summer Olympics, the 2024 Summer Paralympics are just around the corner (August 28-September 8), and in four years, it will be time for LA 2028.
As we’ve observed throughout the Paris 2024 Olympics, the Olympic spirit continues to capture interest and remains relevant across different media. This spirit, present for 2,800 years since Ancient Greece (dating back to 776 BC), still attracts and inspires humanity.
(Jorge Pacheco from the Cloudflare Radar team contributed to this blog post)
Historically, traffic graphs on Cloudflare Radar have displayed two metrics: total traffic and HTTP traffic. These graphs show normalized traffic volumes measured in bytes, derived from aggregated NetFlow data. (NetFlow is a protocol used to collect metadata about IP traffic flows traversing network devices.) Today, we’re adding another metric that reflects the number of HTTP requests, normalized over the same time period. By comparing bytes with requests, readers can gain additional insights into traffic patterns and user behavior. Below, we review how this new data has been incorporated into Radar, and explore HTTP request traffic in more detail.
Note that while we refer to “HTTP request traffic” in this post and on Radar, the term encompasses requests made in the clear over HTTP and over encrypted connections using HTTPS – the latter accounts for ~95% of all requests to Cloudflare during July 2024.
New and updated graphs
Graphs including HTTP request-based traffic data have been added to the Overview and Traffic sections on Cloudflare Radar. On the Overview page, the “Traffic trends” graph now includes a drop-down selector at the upper right, where you can choose between “Total & HTTP bytes” and “HTTP requests & bytes”. We explore the distinction between these further in the following sections.
The default “Total & HTTP bytes” selection displays a time series graph, showing total bytes and HTTP bytes traffic over time, as Radar has done for several years now.
Selecting “HTTP requests & bytes” from the dropdown switches the view to a time series graph that HTTP requests traffic and HTTP bytes traffic over time. In both graphs, users can click on a metric in the legend to deselect it and remove it from the graph. These (de)selections are maintained when a user chooses to download or save a graph.
In addition, we’ve added a “Protocols” summary next to the graph that shows the share of bytes over the selected time period that HTTP accounts for, and the remaining aggregate share associated with the protocols used by other non-HTTP Cloudflare services (such as DNS, WARP, etc.). For most locations or ASNs, HTTP traffic will comprise the majority share of bytes-based traffic.
On Radar’s Traffic page, we have added the HTTP requests metric to the “Traffic volume” graph at the top of the page, allowing you to see how request volume has changed during the selected time period as compared to the previous period, in addition to the changes in the bytes-based metrics.
A new standalone request-based “HTTP traffic” graph was also added to the Traffic page, just below the bytes-based “Traffic trends” graph. This new graph shows normalized HTTP request traffic volume across the selected time period, and by default, also compares it with the previous time period.
Similar to other Radar graphs, these new HTTP request-based graphs can also be downloaded, copied to the clipboard, or embedded in other websites – just click on the share icon.
As always, the underlying data is also available through the Radar API. The “HTTP requests Time Series” API endpoint returns normalized HTTP request time series data across the specified time period for the requested location or autonomous system (ASN).
What is HTTP request traffic?
An HTTP GET request is a message sent from a client (such as your web browser) to a web server (such as one operated by Cloudflare), asking for a particular resource (file). In addition to returning the requested resource, which could range from a single-pixel GIF accounting for just a few bytes, to an API call that returns a few kilobytes of data, to a multi-gigabyte software package, the Web server also returns a set of headers, which can include information about the content type, the last time the resource was modified, cookie information, cacheability, and more. While GET requests account for the overwhelming majority of HTTP request traffic, such traffic also includes other HTTP request methods including HEAD, POST, PUT, and more.
Cloudflare temporarily logs HTTP requests received by our network, including associated header information and “metadata” about the request, such as the bot score computed for the request and the associated cache status. Request logs for a customer’s web properties are available for them to download, and after processing and analysis, this data is also presented in the Analytics section of the Cloudflare dashboard. The HTTP request data now available on Radar is based on a sample of this log data, aggregated across Cloudflare’s global customer base.
The value of request-based traffic insights
Cloudflare Radar already has HTTP data, so why add more? One key reason for analyzing and including HTTP request traffic is resilience. Having multiple sources of truth with respect to HTTP traffic allows us to better and more quickly distinguish between real events (such as an Internet disruption in a given country or network) and data pipeline issues.
While bytes-based metrics provide a reasonable proxy into human (user) behavior, especially with respect to activity surrounding Internet disruptions, request-based metrics provide an even better perspective. A lot of HTTP traffic involves relatively small responses – especially API traffic, which now accounts for 60% of all traffic. Furthermore, response sizes can vary widely, ranging from a single-pixel GIF accounting for just a few bytes, to an API call that returns a few kilobytes of data, to a multi-gigabyte software package
To that end, the scope of user activity may be insufficiently reflected by a bytes-based metric, or buried in the noise, whereas request activity provides a cleaner signal and a more direct proxy for user activity. This is especially important as we examine the restoration of connectivity after an Internet disruption, attempting to ascertain when activity has returned to “expected” pre-disruption levels.
Finally, incorporating request-based traffic insights into Radar is simply extending the way that the data is already being used on the site. All the graphs, maps, and tables presented on Radar’s Adoption & Usage page, are based on analysis of HTTP request traffic, making use of information contained within request headers (such as HTTP version or user agent) or characteristics of the underlying connection (such as IP version).
Bytes vs requests – what’s the difference?
The current “HTTP traffic” view aggregates the bytes associated with HTTP requests to Cloudflare’s content delivery (CDN) services from the selected location or autonomous system (ASN). “Total traffic” aggregates this HTTP traffic along with the traffic associated with other Cloudflare services, including our 1.1.1.1 DNS resolver, authoritative DNS, WARP, and Spectrum, among others. (While Spectrum, WARP, and 1.1.1.1 also carry HTTP traffic, the share of HTTP traffic carried by these services is opaque to Radar, and isn’t accounted for as part of the HTTP traffic calculations.)
The bytes associated with a given request include the size of the request, the size of the headers associated with the response, and the size of the response itself. As noted above, the size of a file returned in response to a request can vary widely, depending on what was requested. The shape of the HTTP requests and HTTP bytes lines may be quite similar, but the potential variability in response sizes (in aggregate) can cause the lines to diverge, sometimes significantly so. For example, if an application regularly makes background requests to check for updates, the availability and subsequent download of a large file containing a software update would cause a spike in the HTTP bytes line, while the HTTP requests pattern remained consistent.
As another example, consider the graph below, capturing HTTP requests and bytes traffic trends for Portugal during the first week of August. HTTP bytes traffic initially grows each day between 06:00 and 09:00 UTC (07:00 – 10:00 local summer time), increases much more slowly until around 19:00 UTC (20:00 local summer time), and then increases rapidly before peaking around 21:00 UTC (22:00 local time). This suggests that content consumed during the workday is lighter in terms of bytes (such as API traffic, as discussed above), while evening traffic is more byte-heavy (possibly due to increased consumption of media content). In contrast, after starting to increase around 06:00 UTC (07:00 local summer time), request traffic generally sees three successively higher peaks each day – occurring around 10:00, 14:00, and 21:00 UTC respectively (11:00, 15:00, and 22:00 local summer time). These peaks are most pronounced on weekdays, but are still apparent on weekend days as well, suggesting regular patterns of user activity at those times.
It is important to remember that in looking at the “HTTP requests & bytes” graphs on Radar that they are showing two different metrics, and as such, only their shape over time is comparable, not their relative sizes. (As both metrics are normalized on a 0 to 1 (Max) scale, the lines on the graph are scaled relative to the maximum normalized value of each metric, including the previous period.)
Conclusion
The addition of HTTP request metrics to Cloudflare Radar brings additional visibility to traffic trends at a global, location, and network level, complementing the existing bytes-based HTTP traffic metrics. Derived from traffic to customer web properties, these new metrics can be found on Radar’s Overview and Traffic pages. In addition to HTTP traffic trends, visit Cloudflare Radar for additional insights around Internet disruptions, routing issues, attacks, domain popularity, and Internet quality. Follow us on social media at @CloudflareRadar (X), noc.social/@cloudflareradar (Mastodon), and radar.cloudflare.com (Bluesky), or contact us via email.
Cloudflare Radar is constantly monitoring the Internet for widespread disruptions. In mid-July, we published our Q2 2024 Internet Disruption Summary, and here we examine recent several noteworthy disruptions detected in the first month of Q3, including traffic anomalies observed in Bangladesh, Syria, Pakistan, and Venezuela.
Bangladesh
Violent student protests in Bangladesh against quotas in government jobs and rising unemployment rates led the government to order the nationwide shutdown of mobile Internet connectivity on July 18, reportedly to “ensure the security of citizens.” This government-directed shutdown ultimately became a near-complete Internet outage for the country, as broadband networks were taken offline as well. At a country level, Internet traffic in Bangladesh dropped to near zero just before 21:00 local time (15:00 UTC). Announced IP address space from the country dropped to near zero at that time as well, meaning that nearly every network in the country was disconnected from the Internet.
However, ahead of this nationwide shutdown, we observed outages across several Bangladeshi network providers, perhaps foreshadowing what was to come. At AS24389 (Grameenphone), a complete Internet outage started at 01:30 local time on July 18 (19:30 UTC on July 17), with a total loss of both Internet traffic and announced IP address space.
In the days before the shutdown, both median bandwidth and latency at a country level for Bangladesh were fairly stable. However, Cloudflare Radar’s Internet Quality measurements at a country level show a clear increase in median bandwidth and a concurrent drop in median latency, both likely due to the loss of measurements from mobile network providers as they disconnected from the Internet.
Five days after the full Internet shutdown started, broadband Internet services providers in Bangladesh began to restore connectivity on July 23. The initial restoration was characterized as a “trial run”, prioritizing banking, commercial sectors, technology firms, exporters, outsourcing providers and media outlets, according to the state minister for post, telecommunication and information technology. Announced IP address space began to increase around 19:00 local time (13:00 UTC), with traffic volumes beginning to trend upwards at that same time, as selected networks reconnected to the Internet.
Unfortunately, Syria is no stranger to Internet shutdowns, as they occur yearly during nationwide exams, implemented with the intent of preventing cheating on those exams. Our recent blog post titled Exam-ining recent Internet shutdowns in Syria, Iraq, and Algeria examined the first round of 2024 exams, which took place between May 26 and June 13.
A second round of exams, and with them, multi-hour Internet shutdowns, began on July 25, and seen in the schedules below, published by Syrian Telecom on its Facebook page (English translation via Google Lens).
The Internet shutdowns implemented for the first four days of tests are clearly visible in the graph below, occurring on July 25, 28, 29, and 30.
However, you will also note another disruption is visible in both Syria’s Internet traffic and announced IP address space shortly after the planned shutdown on July 30. According to a (translated) Facebook post from Syrian Telecom, “while performing regular maintenance on one of the air conditioners located in one of the technical halls [data centers], an explosion occurred, causing the Internet circuits to temporarily go out of service.” This issue resulted in a disruption lasting approximately eight hours, between 11:00 – 19:00 local time (08:00 – 16:00 UTC) seen in both traffic and announced IP address space graphs for AS29256 (Syrian Telecom).
Pakistan
Closing out the month, on July 31, Pakistan experienced a wide-scale Internet disruption that lasted approximately two hours, between 13:30 – 15:30 local time (08:30 – 10:30 UTC). Traffic only dropped ~45% at a country level, but AS17557 (PTCL) experienced a near complete loss of traffic, while traffic at AS24499 (Telenor Pakistan) dropped nearly 90%. Together, the two network providers serve an estimated nine million users, and are among the top five Internet service providers in the country.
It was reported that the Pakistan Telecommunication Authority (PTA) attributed the disruptions to a technical glitch in the international submarine cable affecting the Pakistan Telecommunication Company Limited (PTCL) network. However, another published report noted “According to our sources, the government’s latest firewall edition to block the content was misconfigured, resulting in Internet connectivity disruption.” (Some additional information about the firewall can be found in this article.) The graphs below are from forthcoming TCP reset/timeout data on Cloudflare Radar, and show increased numbers of connections terminating immediately after the initial synchronization (SYN) packet used to establish new TCP connections (“Post SYN”) between 13:30 – 15:30 local time (08:30 – 10:30 UTC) on PTCL and Telenor Pakistan, coincident with the observed disruption. In other words, the rate of SYN packets arriving at Cloudflare was mostly consistent during the disruption, but there was a drop in other TCP packets, suggesting that the firewall explanation may be plausible.
A Facebook post from the Pakistan Telecommunication Authority (PTA) simply highlighted that the issue had been resolved, and that “The exact issue is being investigated by PTA to avoid such instances in future.”
Regardless of the actual cause, the disruption had a clear impact on the country’s financial markets, with a published report stating “The KSE-100 index suffered a sharp decline on Wednesday, plummeting over 740 points in the final hour of trading amid a nationwide internet outage. Analysts attributed the sudden drop to panic selling as investors struggled with limited market data.”
Venezuela
In the past, some countries have implemented government-directed Internet shutdowns as a means of limiting communication about or organizing of protests and demonstrations associated with contested elections. Although such protests and demonstrations sprang up in the wake of a contested presidential election in Venezuela that took place on July 28, Internet shutdowns did not follow. However, in monitoring Internet traffic in Venezuela during the days around the election, the Cloudflare Radar team did observe several notable drops in traffic, as compared to the same times the week prior.
After surging 35% at 05:00 local time (09:00 UTC) on Sunday, July 28 (election day), traffic dropped after the polls opened, down by as much as 23% at 09:00 local time (13:00 UTC). On July 29, the day following the election, traffic was as much as 28% lower than the same time the previous week at 06:15 local time (10:15 UTC) and 18:45 local time (22:45 UTC).
And while the observed drops in traffic appeared to be organic, and not caused by an Internet shutdown, it is worth noting that multiple websites are being blocked in Venezuela. An Internet Society Pulse blog post, published two days ahead of the election, reports that “Around 60 websites are currently blocked in Venezuela, including eight media sites and three that fact-check news and misinformation.”, citing data from the Open Observatory of Network Interference (OONI).
The Paris 2024 Summer Olympics, themed “Games Wide Open” (“Ouvrons grand les Jeux”), kicked off on Friday, July 26, 2024, and will run until August 11. A total of 10,714 athletes from 204 nations, including individual and refugee teams, will compete in 329 events across 32 sports. This blog post focuses on the opening ceremony and the initial days of the event, examining associated impact on Internet traffic, especially in France, the popularity of Olympic websites by country, and the rise in Olympics-related spam and malicious emails.
Cloudflare has a global presence with data centers in over 320 cities, supporting millions of customers, which provides a global view of what’s happening on the Internet. This is helpful for improving security, privacy, efficiency, and speed, but also for observing Internet disruptions and traffic trends.
We are closely monitoring the event through our 2024 Olympics report on Cloudflare Radar and will provide updates on significant Internet trends as they develop.
An opening ceremony to remember
For the first time in modern Olympic history, the opening ceremony was held outside a stadium, lasting nearly four hours and clearly impacting Internet traffic in France. The nation’s engagement was evident during the TV broadcast, leading to noticeable traffic drops similar to those observed during Euro 2024 – we’ve seen that national TV broadcast events usually come with drops in Internet traffic.
The Olympics are more than just sporting events – they are filled with inspiring moments and stories that capture global attention in real time, and create stories that live on. Significant traffic dips during the ceremony coincided with performances by Celine Dion and Lady Gaga, the lighting of the Olympic cauldron, and John Lennon’s “Imagine” performed by Juliette Armanet. Here is a breakdown of the top five traffic drops compared to the previous week that occurred during the ceremony, detailing the events occurring at those times. Our data provides insights with 15-minute granularity.
Moments of the ceremony by traffic drop
Time of drop (UTC)
Drop %
Events at the time
#1
~21:15
-20%
The Olympic cauldron is lit and floats into the Paris sky via air balloon; Celine Dion serenades Paris from the Eiffel Tower.
#2
~17:45
-17%
Lady Gaga sings the French classic “Mon truc en plumes” by Zizi Jeanmaire.
#3
~19:45
-16.9%
Team USA boat takes to the river, followed by Team France – the last boat en route to the Eiffel Tower.
#4
~20:15
-16.9%
Dionysus performs the song “Naked” (Philippe Katerine); John Lennon’s “Imagine” is sung from the middle of the Seine by Juliette Armanet; a metal horse rides down the river.
#5
~18:00
-16.7%
As the boats continue along the Seine, around 80 artists from the Moulin Rouge perform the famous French cabaret dance, the can-can.
During the opening ceremony on July 26, between 17:30 to 21:20 UTC, traffic in France was noticeably lower than the previous week, with losses between 15% and 20%. However, there were moments with smaller drops. For example, at 19:30 UTC, traffic only fell by 4% during the middle of the boat parade of athletes on the Seine River. Right after the event, at 21:45 UTC, traffic increased by as much as 8% compared to the previous week.
The opening ceremony also resulted in a higher mobile share of traffic than usual in France. At 20:45 UTC, close to the end of the ceremony, the mobile share of Internet traffic was 61%, up from 57% the previous week.
Parisians leaving town before the Olympics
With the Olympics in Paris, many locals left the city, either for vacations or quieter places, while tourists arrived for the games. Our data shows that two French regions, Île-de-France, where Paris is located, and Grand Est, east of Paris, experienced the most significant traffic drops. The chart below illustrates daily traffic to these regions, with a noticeable decline visible during the weekend before the Olympics in Île-de-France.
Analyzing the percentage change in request traffic from the previous week, Île-de-France saw its largest drops in the first week of July (July 1-7), with a 15% decrease, and the week before the Olympics started, with an 8% decrease. Interestingly, there was no percentage change in traffic during the week of the Olympics (July 22-28) – that was also the week when most visitors for the Olympics started to arrive.
The daily share of mobile device traffic from France also reveals shifts in typical patterns, with increases noted especially after the June 30 weekend, indicative of vacation periods and leisure Internet use. Mobile device traffic peaked during the first Olympic weekend, reaching 53% on July 26, the day of the opening ceremony – higher than any previous Friday since June. On Sunday, July 28, mobile device traffic peaked at 58%, the highest since June.
Impact to Internet traffic outside of France
Globally, Internet traffic variations were less pronounced than in France. However, on July 26, the day of the opening ceremony, a noticeable global drop occurred during the event. This was particularly evident during two key moments previously highlighted: during song performances at 20:15 UTC, traffic dropped 3% compared to the previous week, and around the end of the ceremony, at 21:15 UTC, it dropped 2%.
Expanding our view to other countries, moments of significant drops in traffic during the opening ceremony were clearly visible. Below is a summary list of 30 countries selected based on their tally of Summer Olympic medals.
Country
Drop in traffic (%)
Time of drop (UTC)
United States
-4%
20:15
Great Britain
-8%
20:15
France
-20%
21:15
Germany
-4%
20:15
China
-4%
21:00
Italy
-11%
18:15
Australia
-2%
20:00
Hungary
-5%
21:15
Sweden
-4%
21:15
Japan
-12%
21:15
Russia
-7%
19:45
Canada
-3%
20:15
Netherlands
-6%
21:15
Romania
-12%
20:00
Finland
-12%
17:30
Poland
-5%
21:15
South Korea
-4%
20:15
Cuba
-3%
19:00
Bulgaria
-6%
21:15
Switzerland
-10%
18:15
Denmark
-2%
21:15
Spain
-8%
18:15
Norway
-2%
21:15
Belgium
-5%
21:15
Brazil
-3%
18:15
Czech Republic
-10%
18:00
Slovakia
-11%
20:15
Ukraine
-2%
20:45
New Zealand
-9%
21:15
Greece
-11%
18:00
Additionally, the world map below highlights the countries that experienced notable Internet traffic impacts during the opening ceremony.
(Source: Cloudflare; created with Datawrapper)
Outside Europe, the countries with the most substantial drops were New Zealand (-9%), Uzbekistan (-12%), Argentina (-13%), and Mongolia -(20%), all experiencing greater declines than those in Europe.
Significant moments at the games: from Simone Biles to Olympic records
Below, we highlight specific Olympic events affecting Internet traffic, starting from the first full competition day on Saturday, July 27, 2024.
United States: The artistic gymnastics competition featuring four-time Olympic gold medalist Simone Biles notably impacted US Internet traffic more than the opening ceremony. On July 26-28, traffic dipped most significantly during Biles’ events. At 10:00 UTC, concurrent with her beam routine, traffic was already 4% lower than the previous week. It dropped by 6% at 10:45 UTC during her floor and vault routines.
France: French swimmer Léon Marchand’s gold medal and Olympic record-setting performance in the men’s 400-meter individual medley on July 28 had the most significant impact in the host nation. Traffic fell by 17% at 18:30 UTC during his event. However, as we noted above, the opening ceremony drove a bigger drop in traffic.
Australia: During Mollie O’Callaghan’s victory in the women’s 200m freestyle on July 29, at around 20:00 UTC, Australian traffic was 5% lower than the previous week This was larger than during the opening ceremony, which saw a 2% drop.
South Korea: The Korean women’s archery team’s gold medal win on July 28 at 15:30 UTC led to an 8% drop in traffic, the most significant decrease noted in the country from July 26 to July 29.
Brazil: Traffic in Brazil was15% lower than the previous week on July 27 at around 19:30 UTC, surpassing the opening ceremony’s impact. This occurred as Brazilian swimmers Guilherme Costa and Maria Fernanda Costa competed in the men’s and women’s 400 m freestyle events.
DNS trends to official Olympic websites by country
On July 22, before the Olympics started, we reported on the heightened interest in official Olympic websites based on request data from our 1.1.1.1 DNS resolver. We noted France’s dominance with 24% of DNS traffic to official Olympic websites, followed by the UK (20%) and the US (17%). However, the start of the Olympics marked a shift, with the US taking the lead.
On the first full day of competitions, July 27, the US led with 16% of all DNS request traffic to official Olympic sites. This change indicates a broader spread of interest across countries during the Olympics. A dynamic version of the map below is available in our Paris 2024 Olympics report.
Here are the top 10 countries with the highest shares of DNS request traffic for the first full day of competitions, July 27, to Olympic sites (percentages rounded):
United States: 16%
Germany: 12%
France: 9%
Vietnam: 9%
Brazil: 5%
Australia: 5%
United Kingdom: 4%
Netherlands: 4%
Canada: 3%
South Africa: 2%
Growth in interest as the Olympics drew closer
Global daily DNS request traffic to official Olympic websites began climbing to the highest levels seen year to date starting on July 23, showing a steady increase. It peaked on July 28, the second full day of events, with a fivefold (509%) increase from the previous week. On the opening ceremony day, traffic was already 110% higher than the previous week.
Country-specific peaks included the US, where traffic to Olympic sites surged 719% on July 28, coinciding with Simone Biles’ first competition day. In France, traffic peaked on the same day with a 391% increase, and in Germany, it skyrocketed by 2300% on July 27.
The evolving DNS ranking of Olympic site traffic by country reveals that from July 19, the US overtook France. Also, Germany ascended to the #2 spot on July 27, the first full day of competitions, while Australia climbed to #4 on July 28, and Canada’s peak day was also July 28.
Railway attacks on opening ceremony day cause surge in traffic
The opening ceremony day, July 26, was also disrupted by railway arson attacks in France, affecting the 800,000 passengers on the high-speed railway system. At 10:00 UTC, there was a significant surge in DNS traffic to public transportation websites, including high-speed railway services. Traffic spiked by 2000% compared to the previous week as users accessed websites to check updates.
DDoS attacks: always around
As we’ve observed with elections in 2024, including the French elections, political parties are not the only targets of DDoS (Distributed Denial of Service) attacks during significant events. While we haven’t seen any coordinated flow of major DDoS attacks targeting services potentially used during the Olympics in France, we have observed a few incidents.
A generally used French government website was targeted by a DDoS attack on July 29, 2024, lasting nine minutes and peaked at 207,000 requests per second at 20:34 UTC.
Before the Olympics began, a national transportation website was also targeted by a smaller DDoS attack, lasting only a couple of minutes and peaking at 10,000 requests per second on July 21 at 10:20 UTC.
As highlighted in our Q2 DDoS report, most DDoS attacks are short-lived, as exemplified by the two mentioned attacks. Also, 81% of HTTP DDoS attacks peak at under 50,000 requests per second (rps), and only 7% reach between 100,000 and 250,000 rps. While a 10,000 rps attack might seem minor to Cloudflare, it can be devastating for websites not equipped to handle such high levels of traffic.
“Olympics” and “Paris 2024” emails on the rise
From another cybersecurity perspective, major events often attract phishing and spam, and the Olympics are no exception. From January 2024 through late July, Cloudflare’s Cloud Email Security service processed over a million emails containing “Olympics” or “Paris 2024” in the subject. During the week of July 22-28, coinciding with the first few days of the Olympics, there was a 304% increase in such emails compared to the previous week and a staggering 3111% increase compared to the busiest week in January.
Regarding unwanted messages, spam accounted for 1.5% of all emails with “Olympics” or “Paris 2024” in the subject, while malicious emails made up 0.1% since January 2024. This means that in a sample of 1000 emails, roughly 15 would be spam and 1 would be malicious. The peak for malicious Olympic-related emails occurred the week of May 6, with 0.6% classified as malicious. Although there was a decline after this peak, rates increased slightly in July, reaching 0.4% on July 8. Despite the surge in volume during the week of July 22, only 0.05% of emails were malicious.
That same week, when the Olympics started, also saw an increase in spam emails to over 2%, the highest since the 7% peak the week of June 24.
Conclusion
The Paris 2024 Olympics started on July 26, with a clear impact on Internet traffic in different countries, most notably in France, the host nation. The significant traffic drops during key moments of the opening ceremony, and the reactive spikes following major events highlight the ever-present interplay between physical events and the way humans interact with the online world. Not many events take the focus away from the Internet, and in this case, into TV broadcast.
We’ve also observed how the interest in official Olympic websites surged, with clear increases in DNS traffic after the event started, in different countries, with the US ultimately taking the gold.
Regarding the July 29, 2024 sabotage of French fiber optic cables, we did not observe any notable disruptions of Internet traffic in France or its cities during the day.
As the games continue, we will maintain a Paris 2024 Olympics report on Cloudflare Radar, updating it as significant Internet trends related to the event emerge.
The 2024 Summer Olympics, or Paris 2024, is set from July 26 to August 11 in France. The opening ceremony, scheduled for Friday, July 26 at 17:30, will take place for the first time not in a stadium but in the open space of the Jardins du Trocadéro by the Seine River in Paris. We’ll monitor relevant Internet insights throughout the event, but here we analyze some pre-event trends, from the popularity of Olympic websites by country to the increase in Olympics-related spam and malicious emails.
This year’s Olympics will host 329 events across 32 sports, featuring the debut of breakdancing as an Olympic event and the return of skateboarding, sport climbing, and surfing from 2020. Similar to our 2024 elections coverage, we will maintain a Paris 2024 Olympics report on Cloudflare Radar, updating it as significant Internet trends related to the event emerge.
From our 1.1.1.1 resolver, DNS trends show heightened interest in the Olympics, especially from France. 24% of DNS requests for official Olympic-related websites came from the host country, followed by the United Kingdom and the United States, with 20% and 17% respectively.
Here’s the breakdown of countries responsible for at least 1% of 1.1.1.1. traffic for Olympic sites (percentages rounded):
France: 24%
United Kingdom: 20%
United States: 17%
Brazil: 5%
Germany: 4%
Russia: 3%
Australia: 2%
Japan: 2%
India: 2%
Spain: 1%
Ireland: 1%
Canada: 1%
South Africa: 1%
Netherlands: 1%
Italy: 1%
Days with the highest “Olympic” spikes
Analyzing the evolution of DNS traffic to official Olympic websites since January 2024, we’ve noted multiple spikes associated with specific Olympic events or ticket sales. The following ranking offers a global perspective via our 1.1.1.1 resolver, illustrating that as the event draws near and Paris readies itself, more recent dates are emerging prominently in the data.
Top 5 days with higher DNS traffic to Olympic official sites in 2024:
January 31: Eve of the 2024 Winter Youth Olympics closing ceremony in Gangwon, South Korea.
April 17: Over 250,000 new tickets for Olympic Games Paris 2024 went on sale – one of the last opportunities to get tickets to the main events.
January 19: Opening ceremony of the 2024 Winter Youth Olympics (South Korea).
June 26: One month before the opening ceremony; the Paris 2024 Main Operations Center starts full games operation; in Paris, areas like the Champ-de-Mars became full occupied by the Olympics; in the US, tickets for NBC’s Opening Ceremony coverage for the Paris 2024 in IMAX theaters went on sale.
July 1: Preparations in Paris with street and bridges closures and road signs added indicating fast track routes for Olympic related vehicles.
April 10 spikes in Germany, Russia and the US
On April 10, 2024, DNS traffic spikes were observed not just in France but also notably in Germany, Russia, and the US, among others. Despite France leading in overall DNS traffic to Olympic sites since January, as seen on the world map above, this particular day saw the largest spikes originating from other countries. These spikes were most prominent from Germany, Russia, the US, the UK, France, Brazil, and Australia, in that order.
What caused these spikes? Several press conferences related to the Olympics took place that day. One major announcement, covered globally, declared that for the first time, the Olympics would offer prize money, with track and field gold medalists receiving $50,000. The following chart illustrates the spike in DNS traffic in these countries on that day.
France’s trends: interest in tickets comes first
In France, the host nation, ticket sale days significantly influenced DNS traffic to official Olympic websites. The most obvious spike occurred on February 8, 2024, marking the start of the first phase of ticket sales for 2024, called the “Paris 2024 official ticketing website surprise releases.” On that day, daily DNS traffic was double that of the previous week. A significant surge was also observed at 10:00 local time, coinciding with the ticket release, which saw an hourly DNS traffic increase of 398% compared to the previous week.
The week of March 3, 2024, saw the highest DNS traffic to Olympic-related sites in France so far. The most significant increase occurred on March 4, the day the “Athletics Special” ticket sales began for events at the Stade de France, which also coincided with the unveiling of the Olympic poster. On this day, daily DNS traffic rose by 45% compared to the previous week. Other notable periods included the weeks of May 12 and May 19, when the Olympic torch arrived in France and started its journey through various cities. April 14 also marked a critical day, offering one of the last chances to purchase 250,000 tickets for major events.
“Olympics” and “Paris 2024” emails on the rise
From a cybersecurity perspective, as major events often attract phishing and spam, we’ve analyzed email trends related to the Olympics—recently we did the same for the Biden vs Trump US presidential debate. From January 2024 up to late-July, Cloudflare’s Cloud Email Security service processed well over half a million emails containing “Olympics” or “Paris 2024” in the subject. The week of July 15 saw the highest number of such emails, marking a 694% increase compared to the busiest week in January.
Regarding unwanted messages, spam accounted for 1.5% of all emails with “Olympics” or “Paris 2024” in the subject, while malicious emails made up 0.2%. This means that in a sample of 1000 emails, roughly 15 would be spam and about 2 would be malicious. The week with the highest percentage of malicious Olympic-related emails was May 6, with 0.6% classified as malicious. Declining after that peak, it ticked back up in July, to 0.4% on July 8.
Furthermore, the week of June 24 witnessed the highest proportion of spam emails for the year so far, at 7% of all emails.
As the Olympics opening ceremony approaches, we expect the volume of related emails, and the proportion of malicious and spam emails, to increase. We’ll provide an update of the first days of the Olympics next week.
Conclusion: “Citius, Altius, Fortius” *
As the world turns its eyes to Paris for the 2024 Summer Olympics, our latest analysis provides a snapshot of the enthusiasm surrounding the games, with France, the host nation, clearly leading in terms of DNS traffic to official Olympic websites, followed by the UK, the US, and Australia.
With the games about to start, the best is yet to come, with the Olympics bringing over three hundred events in 32 sports to people all around the world.
* “Citius, Altius, Fortius”—Latin for “Faster, Higher, Stronger.” This motto was proposed by Pierre de Coubertin, a French historian and the “father” of the modern Olympic Games, upon the creation of the International Olympic Committee in 1894.
Cloudflare’s network spans more than 320 cities in over 120 countries, where we interconnect with over 13,000 network providers in order to provide a broad range of services to millions of customers. The breadth of both our network and our customer base provides us with a unique perspective on Internet resilience, enabling us to observe the impact of Internet disruptions. Thanks to Cloudflare Radar functionality released earlier this year, we can explore the impact from a routing perspective, as well as a traffic perspective, at both a network and location level.
As we have seen in previous years, nationwide exams take place across several MENA countries in the second quarter, and with them come government directed Internet shutdowns. Cable cuts, both terrestrial and submarine, caused Internet outages across a number of countries, with the ACE submarine cable being a particular source of problems. Maintenance, power outages, and technical problems also disrupted Internet connectivity, as did unknown issues. And as we have frequently seen in the two-plus years since the conflict began, Internet connectivity in Ukraine suffers as a result of Russian attacks.
As we have noted in the past, this post is intended as a summary overview of observed disruptions, and is not an exhaustive or complete list of issues that have occurred during the quarter.
Government directed
Syria, Algeria, Iraq
Each spring, governments in several countries in the Middle East and North Africa (MENA) region order local telecommunications providers to shut down or disrupt Internet connectivity across the country in an effort to prevent students from cheating on national secondary and high school exams. These shutdowns/disruptions generally occur for several hours per day over a multi-week period. We covered such events in 2023, 2022, and 2021, as they occurred in locations including Syria, Sudan, Algeria, and Iraq.
In June, we published Exam-ining recent Internet shutdowns in Syria, Iraq, and Algeria, which examined the daily Internet shutdowns that took place in Iraq and Syria, as well as the two multi-hour daily disruptions in Algeria, which appeared to be pursuing a content blocking strategy, rather than a full nationwide shutdown. The post examined the impact that these shutdowns have on Internet traffic, and also analyzed routing information and traffic from other Cloudflare services in an effort to better understand how these shutdowns are being implemented.
In addition to the shutdowns covered in the previously referenced blog post, Iraq implemented a second round of shutdowns that started on June 23, and ran through at least July 14. Some of these shutdowns impacted the same set of networks seen in the first round, and some impacted networks in the autonomous Kurdistan region in the north.
Both sets of shutdowns reviewed above appeared to have followed the same approach as the first round covered in the earlier blog post.
Kenya, Burundi, Uganda, Rwanda, Tanzania
Concerns over a potential Internet shutdown during planned protests against tax increases proposed in “Finance Bill 2024” by the Kenyan government led to the publication of a joint statement signed by multiple organizations. The statement strongly urged the Kenyan government to refrain from enforcing any
Internet shutdowns or information controls, and highlighted the “disastrous economic effects” such a move could have. In response, the Communications Authority of Kenya issued a press release stating that “For the avoidance of doubt, the Authority has no intention whatsoever to shut down Internet traffic or interfere with the quality of connectivity. Such actions would be a betrayal of the Constitution as a whole, the freedom of expression in particular and our own ethos.”
As protests escalated on June 25, Internet traffic in Kenya dropped at 16:30 local time (13:30 UTC). Initially, this outage was thought to be due to issues with one or more undersea cables that provide international connectivity to the country, with the potential cause supported by social media posts from Safaricom and Airtel.
Similar concurrent drops in Internet traffic were observed in Burundi, Uganda, Rwanda, and Tanzania, as shown below. Issues with submarine cables connected to one country can impact Internet connectivity in other countries if there is a dependency on that country/cable for upstream Internet connectivity. As such, the observed disruptions in those four countries were not that unusual. To that end, a (subsequently deleted) post on X from MTN Uganda noted: “Our esteemed customers, We are experiencing a degraded service on all our internet services due to an outage caused by our connectivity supply through Kenya. Our technical teams and partners are working jointly to resolve the issue in the shortest time possible. In the interim, we kindly advise our customers to use *165# to access Mobile Money and other app based services. Thank you.“
However, other participants in the Internet infrastructure community in Africa called the undersea cable outage explanation into question. Kyle Spencer, Executive Director of the Uganda Internet eXchange Point, posted on X that “I am told the Kenyan government ordered sea cable landing stations to disconnect circuits.” Ben Roberts, Group CTIO at Liquid Intelligent Technologies (a pan-African network infrastructure provider), posted “No cables are damaged this week.” In addition, outages on undersea cables are rarely, if ever, resolved in a matter of hours, as this disruption was – they frequently last for days or weeks.
On June 26, Safaricom’s CEO claimed “This outage was occasioned by reduced bandwidth on some cables that carry Internet traffic”, contradicting the company’s original claim. No additional information was forthcoming from Airtel or the Communications Authority of Kenya, but as noted above, some within the industry believe that the disruption that impacted connectivity in Kenya, Burundi, Uganda, Rwanda, and Tanzania was directed by the government of Kenya, and was not caused by submarine cable outages.
Cable cuts
Haiti
At 17:36 local time (21:36 UTC) on April 28, Digicel Haiti posted an “important note” on X that stated in part (translated) “On April 27, 2024, the company suffered several attacks on its international optical infrastructure in the Drouya area on National Road #1. The optical fiber was damaged by the impact of cartridges after the armed clashes in the area for a few days. It affected several services such as internet (data), SMS, MonCash and international calling. For now, we are happy to inform the population that all services are restored to 100%.” The graph below shows the impact of the fiber damage, with AS27653 (Digicel Haiti) suffering an Internet outage lasting nearly 24 hours, from around 17:30 local time (21:30 UTC) on April 27 through approximately 16:00 local time (20:00 UTC) on April 28, after which traffic quickly recovered.
Then on May 3, The Director General of Digicel Haiti posted on X that (translated) “Digicel is informing the general public that it suffered two more damages to its international fiber infrastructure at 2am this morning. We have restored Moncash services, SMS, and Fiber Optic connections. Our crews are already on their way to address the apparent landslide in the Canaan area.” The disruption caused by this fiber damage lasted for approximately eight hours, between 02:15 – 10:30 local time (06:15 – 14:30 UTC), and as seen in the graph below, appeared to have a nominal impact on traffic.
On Sunday, May 12, issues with the EASSy and Seacom submarine cables again disrupted connectivity to East Africa, impacting a number of countries previously affected by a set of cable cuts that occurred nearly three months earlier. Insight into these earlier cable cuts and the initial impact of May’s cable damage was covered in our East African Internet connectivity again impacted by submarine cable cuts blog post.
Traffic levels across a number of the impacted countries dropped just before 11:00 local time (08:00 UTC). The magnitude of the initial impact varied by country, with traffic initially dropping by 10-25% in Kenya, Uganda, Madagascar, and Mozambique, while traffic in Rwanda, Malawi, and Tanzania dropped by one-third or more than compared to the previous week. The overall impact was most significant in Tanzania, Madagascar, and Rwanda, as seen in the graphs below. Traffic returned to expected levels at various times over the following week, ranging from a day and a half later (May 13) in Kenya to a week later (May 19) in Rwanda.
Repairs to the EASSy and Seacom cables were completed on May 31. Repairs to the cables damaged in February were ongoing as of July 9, as their location in a war zone complicates repair efforts.
Chad
A reported fiber optic cable cut in Cameroon disrupted Internet connectivity for customers of Moov Africa TChad on May 25. The outage lasted three hours, between 15:15 -18:15 local time (14:15 – 17:15 UTC), with the impact visible at a country level as well. Routing was disrupted too, as the number of IPv4 /24 prefixes (256 IPv4 addresses) announced by Moov Africa Tchad fell from eight to three during the disruption.
The event was similar to one that occurred on January 10, when Moov Africa Tchad and country-level traffic was disrupted for over 12 hours “due to a cut in the optical fiber coming from Cameroon through which Chad has access to the Internet”. During that event, significant volatility was also observed from a routing perspective, as the volume of announced IPv4 address space shifted frequently at a network and country level during the disruption. As we noted last quarter, as a landlocked country, Chad is dependent on terrestrial Internet connections to/through neighboring countries, and the AfTerFibre cable map illustrates Chad’s reliance on limited cable paths through Cameroon and Sudan.
Gambia, Mauritania, Senegal
A reported “network interruption” on the Africa Coast to Europe (ACE) submarine cable disrupted traffic across networks in the Gambia, Mauritania, and Senegal on June 5. AS25250 (Gamtel), AS29544 (Mauritel), and AS37649 (Free/Tigo) all saw traffic drop around 23:00 local time (23:00 UTC). As seen in the graphs below, the outage lasted for nearly 11 hours, with traffic recovering just 10:00 local time on June 6 (10:00 UTC). Mauritel saw a near complete outage, while Gamtel and Free/Tigo saw less severe impacts, possibly because they were able to shift traffic to back up links.
Maintenance
Guinea, Gambia, Sierra Leone, Liberia
Above, we discussed an unexpected network interruption on the ACE submarine cable that caused outages across multiple countries on June 5. However, two months earlier, a planned outage for repair work on the cable also disrupted connectivity across multiple African countries. A communiqúe issued by the Ministry of Posts, Telecommunications and the Digital Economy in Guinea noted in part (translated) “…the ACE (Africa Coast to Europe) network will undergo a planned outage on April 8, 2024, between midnight and 2:00 a.m. morning in the following countries: Guinea, Senegal, Gambia, Sierra Leone and Liberia. This total outage of approximately 2 hours will affect Internet traffic and international calls.”
The graphs below show the impact to traffic in the listed countries for the planned two-hour repair window, though it appears that traffic did not return fully to expected levels after the repair window concluded – it is unclear why it remained slightly depressed. In addition, despite being listed as one of the impacted countries, no impact to traffic was observed in Senegal.
Guinea
Rounding out a trifecta of entries about the ACE submarine cable, planned maintenance work on the cable by GUILAB reportedly caused a multi-hour outage at AS37461 (Orange Guinea) and at a country level as well, lasting from 12:15 – 15:45 local time (12:15 – 15:45 UTC). (GUILAB is the company in charge of managing the capacity allocated to Guinea on the ACE submarine cable.) The maintenance work was reported by Orange Guinea in two X posts (1, 2), although these posts were subsequently deleted.
Power outage
Kenya
At 18:30 local time (15:30 UTC) on May 2, Kenya Power posted a “Power Outage Alert” on X that stated “At 5:40 PM (EAT) today, Thursday, 2nd May 2024, we experienced a system disturbance on the grid, resulting in power supply disruption in most parts of the country.” The graph below shows the resultant impact on Internet connectivity in the country, with traffic dropping sharply between 17:30 – 17:45 local time (14:30 – 14:45 UTC). The drop in traffic lasted until approximately 21:30 local time (18:30 UTC), the same time that Kenya Power posted a “Power Supply Restoration” notice on X, highlighting the restoration of power to parts of the country. Although the post-outage spike seen in the graph would suggest pent-up demand for online content, a longer-term view of Kenya’s Internet traffic shows traffic peaks at the same time (22:00 local time, 19:00 UTC) during the preceding two days as well.
Ecuador
A nationwide power outage in Ecuador on June 19 impacted hospitals, homes, and the subway, in addition to causing a major disruption to Internet connectivity. The graph below shows Ecuador’s Internet traffic dropping sharply just after 15:00 local time (20:00 UTC). A post on X from Public Works Minister Roberto Luque explained (translated) “The immediate report that we received from CENACE is that there is a failure in the transmission line that caused a cascade disconnection, so there is no energy service on a national scale.” A subsequent post pointed at a lack of investment in the underlying systems, and noted that as of 18:41 pm local time (23:41 UTC), “95% of the energy has already been restored”. After the initial sharp drop, traffic began to recover fairly quickly, and was effectively back to expected levels by the stated time.
Albania, Bosnia, Montenegro
A sudden increase in power consumption related to increased usage due to high temperatures, as well electrical systems being impacted by the heat, caused a widespread power outage across Montenegro, Bosnia, and Montenegro on June 21. The outage reportedly originated in Montenegro after a 400-kilowatt transmission line exploded. While power outages are generally more localized to a single country, or region within a country, power distribution systems are linked across Balkan countries as part of the Trans-Balkan Electricity Corridor.
Published reports (MSN, Reuters) noted that electrical networks went down 12:00 – 13:00 local time (10:00 – 11:00 UTC), and that electricity suppliers in the impacted countries started restoring power by mid-afternoon, and had it largely restored by the evening. The graphs below show traffic from Albania, Bosnia, and Montenegro starting to drop around 12:00 local time (10:00 UTC), reaching its nadir in Albania and Bosnia at 12:30 local time (10:30 UTC) and at 13:00 local time (11:00 UTC) in Montenegro. Traffic recovered gradually over the next several hours as power was restored, returning to expected levels by 15:30 local time (13:30 UTC).
Croatia was reportedly impacted by the power outage as well, but no adverse impact to traffic at a country level is visible during the timeframe that connectivity in the other countries was disrupted.
Military action
Ukraine
During the two-plus years of the Russia-Ukraine conflict, Ukraine’s power grid has been a frequent target for Russian air attacks. When damage to Ukraine’s electrical power infrastructure occurs as a result of these attacks, Internet connectivity is also disrupted. Attacks on May 21 caused power outages across a number of areas in Ukraine. The most significant impact was in Sumy, where traffic dropped as low as 82% below the previous week at 00:00 on May 22 local time (21:00 UTC). As the graphs below illustrate, traffic was also lower than the previous week for several hours in Kyiv, Kharkiv, and Vinnytsia, with traffic returning to expected levels by around 08:00 local time (05:00 UTC) on May 22.
\
Technical problems
Malaysia
As we’ve covered in previous quarterly posts, Internet outages and disruptions aren’t always due to significant wide-scale events like severe weather, power outages, or cable cuts. Sometimes more mundane technical issues can cause problems when users try to access the Internet. One example of this occurred on April 15 in Malaysia, when customers of Time Internet experienced a network outage for nearly two hours. The company explained the reason for the outage in a contrite post on their Facebook page, stating in part “This Internet service outage was by far the worst in our history – affecting approximately 40% of our customers. … At 5.38pm today, both our primary and secondary Secure DNS servers became unreachable. This means that any browser or service requiring a DNS address resolution was not able to reach its intended site.” Because subscribers could not reach Time Internet’s DNS resolvers, they were unable to resolve hostnames for Internet services, sites, and applications, including those delivered by Cloudflare. This resulted in the drop in traffic seen in the graph below, which started just after 17:00 local time (05:00 UTC), and began to recover approximately an hour later. The company did not provide any additional information on what caused the DNS servers to fail.
Nepal
In Nepal, a number of local Internet service providers including AS45650 (Vianet) and AS139922 (Dishhome) rely on Indian provider Bharti Airtel for upstream connectivity, enabling them to reach the rest of the Internet. A published report underscores the reliance, noting “Nepali ISPs buy 70 percent of their internet from Airtel.”
On April 25, these ISPs warned that their services could be interrupted because the Nepali government had not provided them with foreign exchange services that would enable them to pay bandwidth vendors such as Airtel, whom they reportedly owed USD $30 million to. On May 1, Airtel informed the delinquent Nepali providers that Internet services may be interrupted at any time due to the overdue payment, and on May 2, Airtel took that step. The graphs below show Vianet’s traffic dropping to near zero at 16:15 local time (10:30 UTC), recovering to expected levels six hours later. An hour later, at 17:15 local time (11:30 UTC), Dishhome’s traffic dropped significantly, though not as severely as Vianet’s. Dishhome’s traffic also recovered approximately six hours later.
A month later, on June 3, AS45650 (Vianet) and AS17501 (Worldlink) in Nepal experienced Internet disruptions that were reportedly caused by routing issues on Bharti Airtel’s network. On Worldlink, a drop in traffic occurred between 12:15 – 14:00 local time (06:30 – 08:15 UTC), while on Vianet, the loss of traffic took place between 12:15 – 13:15 local time (06:30 – 07:30 local time).
Unknown
Most of the Internet disruptions covered in this blog post series have a known root cause, whether admitted/stated by the impacted provider(s) or closely associated with a real world event (severe weather, power outage, etc.) However, other disruptions are observed and even publicized by the impacted provider, but no underlying reason for the outage is ever made public.
Malaysia
On May 21, CelcomDigi (AS10030)posted on X that it was experiencing an outage on its network, and that it was working to resolve the issue as soon as possible. However. just 12 minutes later, it published a second post stating that it had fully restored Celcom Internet service. These posts were made at 21:35 and 21:47 local time (13:35 and 13:47) respectively. However, as the graph below shows, traffic volumes had returned to expected levels over an hour earlier, as the observed Internet disruption on Celcom’s network lasted between 18:00 – 20:15 local time (10:00 – 12:15 UTC). (Note that the second disruption shown in the graph below was due to an internal Cloudflare data pipeline issue, and not any sort of problem with Celcom’s network.)
Starlink
SpaceX Starlink’s satellite Internet service is unique in that it has an international subscriber base, so outages on its network have a more wide-reaching impact than issues with an ISP that covers a single country. At 01:59 UTC on May 29, Starlinkshared on X that it was currently experiencing a network outage, and that it was actively implementing a solution. Twenty-eight minutes later, it posted “The network issue has been fully resolved.” This brief outage is visible in the graph below as a slight dip in traffic. However, what is particularly interesting is the spike in traffic to Cloudflare from Starlink’s network following the resolution of the outage. The sharp increase and rapid decline of the traffic curve after service was restored suggests that it may be related to an automated connectivity check of some kind, rather than pent-up user demand for content.
Chad
A near-complete Internet outage was observed in Chad on June 5 between 08:15 – 12:00 local time (07:15 – 11:00 UTC), as seen in the graph below. Routing was also impacted, as the number of IPv4 /24 address blocks (256 IPv4 addresses) announced by network providers in the country dropped by as much as 75% during the outage.
A news item covering the outage noted that only Starlink subscribers retained Internet access during the outage. It also noted that Chad has faced recurring Internet disruptions since 2016, either because of problems with fiber-optic cables, or due to government directed shutdowns in the name of national security. It is unclear what ultimately caused this particular outage.
India
With an estimated subscriber base in excess of over 460 million, any Internet disruption affecting Reliance Jio’s network (AS55836) is going to have a widespread impact across India. On June 18, Reliance Jio experienced two disruptions that occurred between 13:15 – 17:15 local time (07:45 – 11:45 UTC). Each disruption lasted less than an hour, and dropped traffic levels to approximately half of those seen at the same time a week prior. Both mobile and fiber connectivity was affected, and no additional information has been provided by Reliance Jio regarding the root cause of the connectivity issues.
Conclusion
As we become increasingly dependent on reliable Internet connectivity, we must recognize that that connectivity is itself reliant on a complex and interconnected foundation of physical, technical, and political factors. A failure in any one of these foundational components, whether due to a cable cut, power outage, misconfiguration, or government action, can have a significant impact, disrupting Internet connectivity for millions of users, potentially across multiple countries. While the resilience and reliability of the physical and technical components can be improved through redundancy and best practices, political factors have arguably proven to be the hardest to address. However, organizations like AccessNow, through their #KeepItOn campaign, mobilize people, communities, and civil society actors globally to fight against government-directed Internet shutdowns, which can have significant financial consequences.
National team sports unite countries, and football (known as “soccer” in the US) is the world’s most popular sport, boasting approximately 3.5 billion fans globally. The UEFA Euro 2024, running from June 14 to July 14, 2024, significantly impacts Internet traffic across participating European nations. This blog post focuses on the two finalists, Spain and England, and comes after an initial post we published during the first week of the tournament.
Analyzing traffic patterns reveals distinct high-level trends. Spain saw the most significant drops in Internet traffic during games against major teams and former champions such as Italy (the defending champion), Germany, and France. In contrast, England’s games had crucial moments towards the end, leading to the largest traffic reductions in the UK, especially during the knockout stages.
For context, as previously mentioned, football games like the Super Bowl, differ from other events such as elections. When major teams or national squads play, especially in matches that captivate many viewers, Internet traffic often drops. This is particularly true if the game is broadcast on a national TV channel. During such broadcasts, people tend to focus more on their TV sets, relying on the traditional broadcast signal rather than online streaming, especially for games that aren’t behind a paywall. This is a typical scenario when national teams play in Europe.
Semifinals: differences between four countries
Let’s first analyze the impact of the semifinals on the four countries with national teams playing, using UK-related data for England. The following table displays the traffic drop percentages and the times of the largest declines during the Spain vs. France and Netherlands vs. England matches. Note that England is the only one not on Central European Time.
In both Spain and the UK, traffic decreased the most at the end of the game, details of which are provided below. In France and the Netherlands, significant drops of 16% and 27% respectively occurred primarily in the first half.
Country
Drop on traffic
Date / time of biggest drop (local time)
Spain
-19%
Jul 9, 22:45
France
-16%
Jul 9, 21:00
Netherlands
-27%
Jul 10, 21:15
England (UK)
-11%
July 10, 21:45
(Source: Cloudflare; created with Datawrapper)
Traffic in the UK: England’s late goal impact
England’s matches frequently saw crucial moments near the end, leading to the largest dips in UK Internet traffic. This trend was especially pronounced during the knockout phases and after Scotland’s exit from the tournament. England’s tournament opener, a win against Serbia on June 16, experienced the most significant traffic drop at the game’s start – an 8% decrease from the previous week.
UK election debate vs England’s game
The second game, on June 20, against Denmark, ended in a draw and saw a bigger drop in traffic. During the game, traffic in the UK initially dropped 8% compared to the previous week, then fell even further in the second half, by as much as 13%. Following the game, the BBC broadcast a significant live event – the debate between the country’s four major political parties. It started at 20:00 local time, and 15 minutes later, traffic experienced its largest drop of the day: 15%.
The third and final group stage game for England, a draw against Slovenia, saw a 5% drop in Internet traffic during the second half and a 4% drop in the first half. In the round of 16 game against Slovakia on June 30, traffic dipped 9% in the UK towards the end of the second half as Jude Bellingham scored a crucial late goal. During extra time, when Harry Kane scored, traffic decreased further to 10% below the previous week’s level.
Next, during the July 6 quarter-final against Switzerland, traffic in the UK dipped 3% during the game, mostly towards the end of regular time. However, it decreased further by 11% towards the end of extra time and during the penalty shootouts.
The semi-final between England and the Netherlands on July 10, 2024, experienced a noticeable drop in UK traffic – 5% at 20:15, when the first two goals were scored. Traffic decreased further, to 11% below the previous week, at the end of the game as Ollie Watkins scored the winning goal, securing England’s spot in the final.
Spain’s big game traffic impact
Spain was the only team to win all its matches without going to penalties throughout the tournament. The most significant drops in Internet traffic occurred during games against other major teams and previous titleholders like Italy, Germany, and France.
Spain’s first game in the tournament against Croatia on June 15, during dinner time in the country, ended in a decisive 3-0 win. It was accompanied by a significant drop in traffic – 7% in the first half and 9% in the second.
The June 20 match against Italy, featuring two teams with rich histories of European and World titles – and Italy as the defending champion – captured significant attention. Also broadcast on national TV, as the other games were, it led to substantial drops in traffic: a 16% decrease early in the first half, and a 15% drop in the second half, right after halftime, aligning with Calafiori’s goal that secured Spain’s win.
The final group stage game for Spain against Albania on June 24, which was non-decisive with Spain’s advancement already secured, saw a traffic decrease of 6%. Then came the knockout phase. It began with a round of 16 match against Georgia on June 30, where traffic fell by up to 8%, with a more pronounced drop in the first half coinciding with Spain equalizing the game.
The July 5 quarterfinals against host Germany was also a game that matched two football giants, in terms of national team international football titles. The game began with an initial 10% decline in traffic, followed by a 7% drop in the second half, and an 8% drop at the end of extra time, around the time Merino scored the winning goal.
Spain’s semi-final on July 9 saw early goals and a swift turnaround after France’s initial goal. The game started with a 17% drop in traffic compared to the previous week, persisting through the first half. By the end of the second half, as France aggressively sought to score and Spain defended vigorously to avoid extra time, traffic dipped further to a 19% drop. Ultimately, the Spanish squad secured a spot in the final.
Conclusion
The UEFA Euro 2024 has significantly impacted Internet traffic across participating European countries from Cloudflare’s perspective. Games broadcast on national TV drew fans’ attention away from the Internet. Critical moments such as last-minute goals, extra time, or penalty shootouts also led to larger drops in traffic as fans focused more on the game.
Also, distinct patterns have emerged in the finalist countries, Spain and England. For Spain, matches against traditional football powerhouses resulted in noticeable drops in traffic, indicating high viewer engagement during key matches. England’s games also saw significant traffic reductions at critical moments, particularly during the knockout stages.
The 2024 French legislative election runoff on July 7 yielded surprising results compared to the first round on June 30, with the New Popular Front (NPF) gaining the most seats, followed by French President Macron’s Ensemble party, and the National Rally. Coalition negotiations will follow. In this post, we examine the ongoing online attacks against French political parties and how initial election predictions at 20:00 local time led to a noticeable drop in France’s Internet traffic.
Let’s start with the attacks, and then move on to the Internet traffic trends.
Political parties under attack
As we highlighted last week, the first round of the French elections saw specific DDoS (Distributed Denial of Service) attacks targeting French political party websites. While online attacks are common and not always election-related, recent activities in France, the Netherlands, and the UK confirm that DDoS attacks frequently target political parties during election periods.
Two French political parties were attacked shortly before the first round of elections, and a third party was targeted on June 30. This third party, indicated in green on the chart below, faced attacks on the evening of June 29. Several attempts were thwarted by Cloudflare throughout election day, from 10:00 to 23:00 UTC (12:00 to 01:00 local time). The most intense attack occurred at 19:00 UTC (21:00 local time), reaching nearly 40,000 requests per second, with a total of 620 million DDoS requests recorded on that day (June 29).
Our data indicates that the most significant attack Cloudflare intercepted targeted a party shown in yellow on the chart above. The party had already been attacked on June 23, 2024, and this subsequent attack happened on July 3 at 21:36 UTC (23:36 local time), lasting four minutes and peaking at 151,000 requests per second (rps), making it the second-largest attack we’ve observed on political parties recently. This was comparable in intensity and duration to another attack on a UK political party right after their election.
On the runoff election day, July 7, the party represented by the blue line was again a target, having been attacked previously on June 24, 27, and 29. The most severe of these occurred on June 27, with attacks reaching 118,000 rps during a day that totaled 610 million daily DDoS requests. On July 7, the attacks resumed, with the first starting at 09:55 UTC (11:55 local time) and continuing sporadically until 23:18 UTC (01:18 local time on July 8). The peak of these attacks came at 11:40 UTC (13:40 local time), reaching 96,000 rps.
While these rates may seem small to Cloudflare, they can be devastating for websites not well-protected against such high levels of traffic. DDoS attacks not only overwhelm systems but also serve, if successful, as a distraction for IT teams while attackers attempt other types of breaches.
Exit polls came with a 20:00 Internet traffic dip
Each election brings its own unique circumstances. For instance, the UK’s snap election took place on Thursday, July 4, 2024, aligning with Britain’s tradition of weekday elections. In contrast, France and many other countries hold elections on weekends, typically Sundays.
During the first round of the French elections on June 30, morning traffic was lower than the previous week and rose in the afternoon. The runoff, a week later, displayed a different pattern. Morning traffic remained stable compared to June 30, but it saw a significant decrease in the afternoon, especially after 17:30 local time. Polling stations in major cities closed at 20:00. At this time, TV media began broadcasting the first results, causing a 16% drop in traffic compared to the previous week. This trend, where traffic dips as initial results are announced, is also seen in other elections, like the UK’s.
Traffic shifts during voting day, compared to the previous week, are more revealing when viewed in detail. The map and table below summarize the traffic changes observed at the state level within France, when voting closed and initial results predictions were revealed on TV at around 20:00 local time. This was the moment when, from Cloudflare’s data perspective, attention was diverted from online use.
(Source: Cloudflare; created with Datawrapper)
The table below shows the drops in traffic on July 7, at 20:00 local time, compared to the previous week.
State
Drop in traffic (%)
Bourgogne-Franche-Comté
-19%
Grand Est
-19%
Brittany
-15%
Auvergne-Rhône-Alpes
-15%
Corsica
-14%
Occitanie
-11%
Nouvelle-Aquitaine
-11%
Normandy
-10%
Île-de-France
-10%
Hauts-de-France
-9%
Pays de la Loire
-8%
Provence-Alpes-Côte d’Azur
-7%
Centre-Val de Loire
-6%
On election day in France, Internet traffic decreased most significantly in the regions of Bourgogne-Franche-Comté and Grand Est, both in the eastern part of the country and both experiencing a 19% drop. When comparing these regions to the Île-de-France region, where Paris is located, we see a smaller traffic decrease, at 10%. In the south, in regions like Provence-Alpes-Côte d’Azur, the drop was even less pronounced, at 7%.
Mobile device usage
Also notable was the increase in mobile device request traffic share during both election days, driving the share to levels higher than usual. Over the past month, mobile device traffic share on Sundays typically ranged from 53% to 54%. However, it rose to 57% on the first election day, June 30, and increased further to 58% on the runoff day, July 7, 2024. Mobile device traffic share was especially elevated from 11:00 to 22:00 local time on these days.
DNS trends: news outlets bring results
Switching focus to domain trends, our 1.1.1.1 resolver DNS data reveals a targeted impact from the French elections, allowing for a comparison between the two election days. Analyzing French news media outlets, DNS traffic in France was significantly higher on the first election day, June 30, with a 250% increase at 20:00 local time compared to the previous week. This was 6% higher than on the runoff day, July 7.
For French TV domains, the situation reversed during the runoff on July 7, showing 31% more DNS traffic at 20:00 local time than in the first round. On June 30, DNS traffic at that time was already 274% higher than the previous week, but the increase on July 7 was even more significant, at 391% compared to June 23, 2024—the Sunday before the two election days.
For microblogging social media in France, traffic was higher during the two election days, peaking on the first round. At the close of voting polls at 20:00 local time on June 30, traffic surged 38% compared to June 23, 2024. On July 7, runoff day, traffic increased by 32% at 20:00 local time compared to June 23, but was 4% lower than on June 30.
Conclusion: keeping track of elections
In France, more attention was diverted from the Internet during the decisive runoff election day than in the first round, with a noticeable dip in traffic when TV stations announced predicted results at 20:00 local time.
If you want to follow more trends and insights about the Internet and elections in particular, you can check Cloudflare Radar, and more specifically our new 2024 Elections Insights report, which will be updated as elections take place throughout the year.
To provide the best experiences, we use technologies like cookies to store and/or access device information. Consenting to these technologies will allow us to process data such as browsing behavior or unique IDs on this site. Not consenting or withdrawing consent, may adversely affect certain features and functions.
Functional
Always active
The technical storage or access is strictly necessary for the legitimate purpose of enabling the use of a specific service explicitly requested by the subscriber or user, or for the sole purpose of carrying out the transmission of a communication over an electronic communications network.
Preferences
The technical storage or access is necessary for the legitimate purpose of storing preferences that are not requested by the subscriber or user.
Statistics
The technical storage or access that is used exclusively for statistical purposes.The technical storage or access that is used exclusively for anonymous statistical purposes. Without a subpoena, voluntary compliance on the part of your Internet Service Provider, or additional records from a third party, information stored or retrieved for this purpose alone cannot usually be used to identify you.
Marketing
The technical storage or access is required to create user profiles to send advertising, or to track the user on a website or across several websites for similar marketing purposes.