Tag Archives: resilience

Continually assessing application resilience with AWS Resilience Hub and AWS CodePipeline

Post Syndicated from Scott Bryen original https://aws.amazon.com/blogs/architecture/continually-assessing-application-resilience-with-aws-resilience-hub-and-aws-codepipeline/

As customers commit to a DevOps mindset and embrace a nearly continuous integration/continuous delivery model to implement change with a higher velocity, assessing every change impact on an application resilience is key. This blog shows an architecture pattern for automating resiliency assessments as part of your CI/CD pipeline. Automatically running a resiliency assessment within CI/CD pipelines, development teams can fail fast and understand quickly if a change negatively impacts an applications resilience. The pipeline can stop the deployment into further environments, such as QA/UAT and Production, until the resilience issues have been improved.

AWS Resilience Hub is a managed service that gives you a central place to define, validate and track the resiliency of your AWS applications. It is integrated with AWS Fault Injection Simulator (FIS), a chaos engineering service, to provide fault-injection simulations of real-world failures. Using AWS Resilience Hub, you can assess your applications to uncover potential resilience enhancements. This will allow you to validate your applications recovery time (RTO), recovery point (RPO) objectives and optimize business continuity while reducing recovery costs. Resilience Hub also provides APIs for you to integrate its assessment and testing into your CI/CD pipelines for ongoing resilience validation.

AWS CodePipeline is a fully managed continuous delivery service for fast and reliable application and infrastructure updates. You can use AWS CodePipeline to model and automate your software release processes. This enables you to increase the speed and quality of your software updates by running all new changes through a consistent set of quality checks.

Continuous resilience assessments

Figure 1 shows the resilience assessments automation architecture in a multi-account setup. AWS CodePipeline, AWS Step Functions, and AWS Resilience Hub are defined in your deployment account while the application AWS CloudFormation stacks are imported from your workload account. This pattern relies on AWS Resilience Hub ability to import CloudFormation stacks from a different accounts, regions, or both, when discovering an application structure.

High-level architecture pattern for automating resilience assessments

Figure 1. High-level architecture pattern for automating resilience assessments

Add application to AWS Resilience Hub

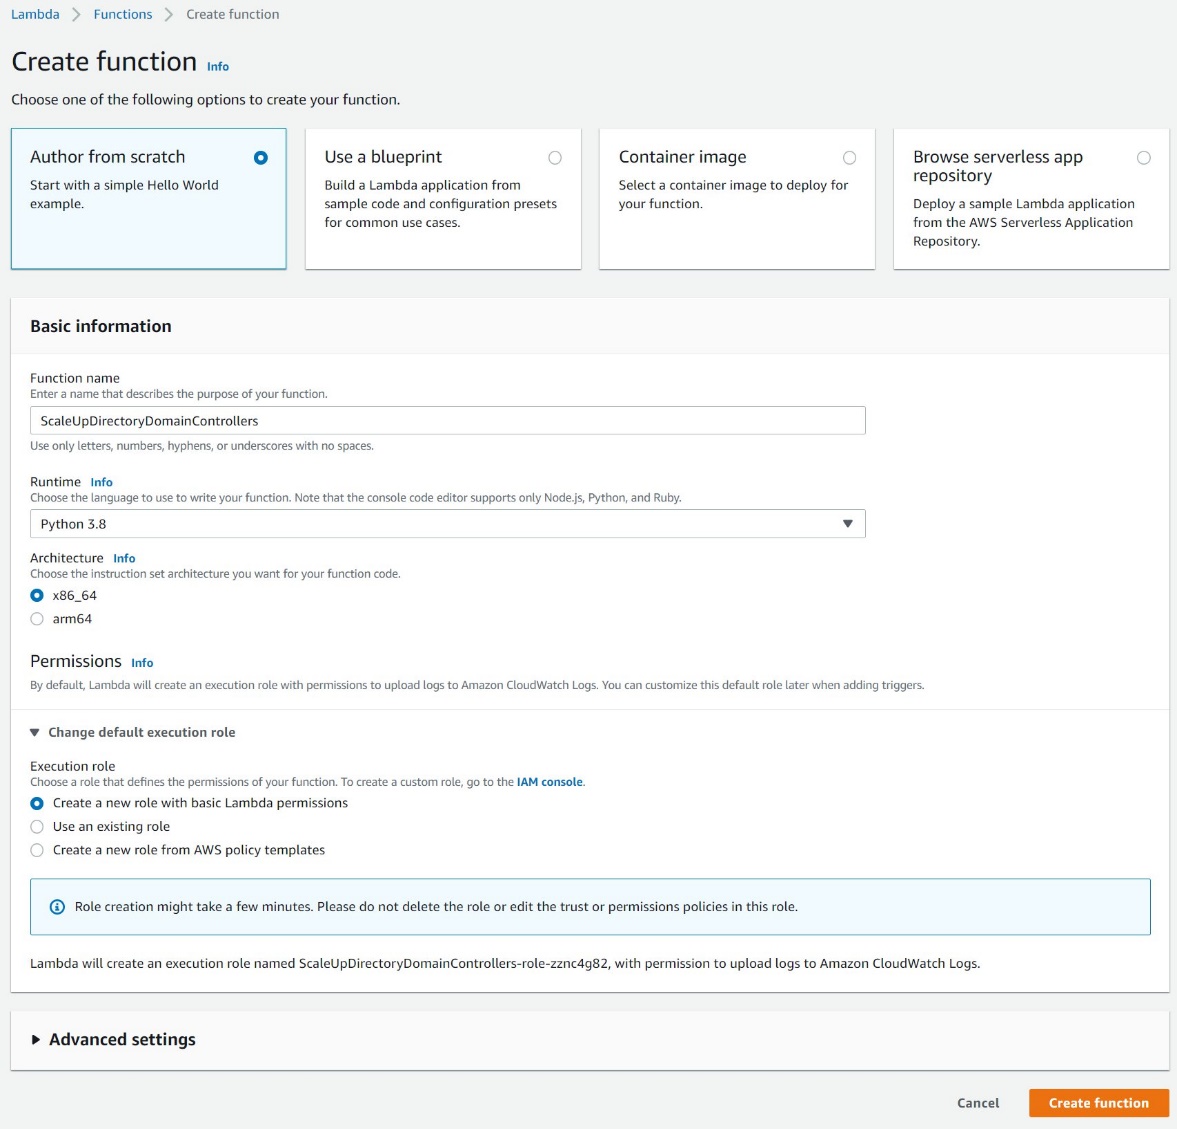
Begin by adding your application to AWS Resilience Hub and assigning a resilience policy. This can be done via the AWS Management Console or using CloudFormation. In this instance, the application has been created through the AWS Management Console. Sebastien Stormacq’s post, Measure and Improve Your Application Resilience with AWS Resilience Hub, walks you through how to add your application to AWS Resilience Hub.

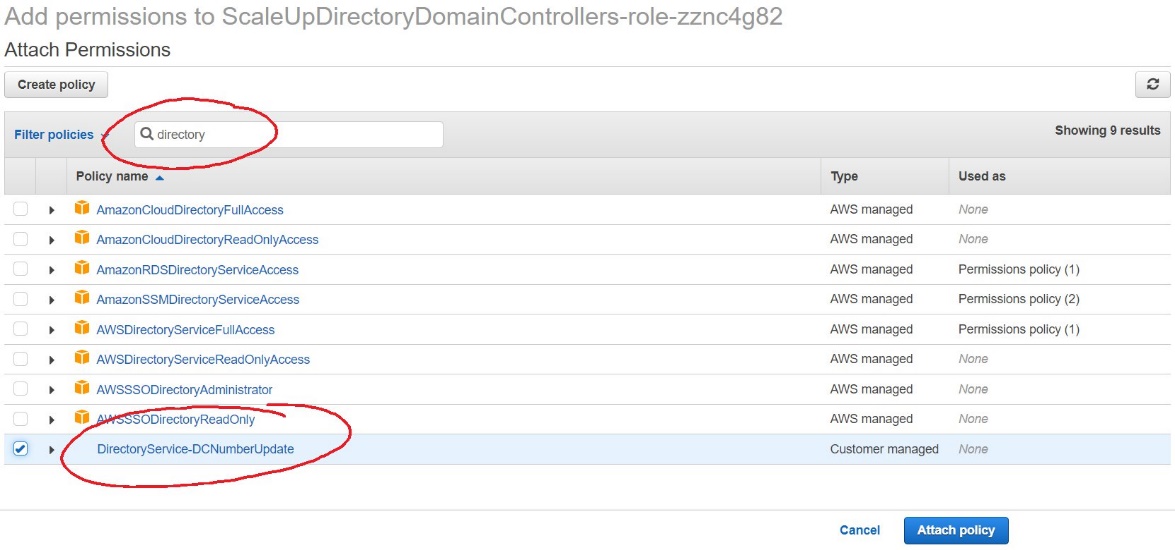
In a multi-account environment, customers typically have dedicated AWS workload account per environment and we recommend you separate CI/CD capabilities into another account. In this post, the AWS Resilience Hub application has been created in the deployment account and the resources have been discovered using an CloudFormation stack from the workload account. Proper permissions are required to use AWS Resilience Hub to manage application in multiple accounts.

Adding application to AWS Resilience Hub

Figure 2. Adding application to AWS Resilience Hub

Create AWS Step Function to run resilience assessment

Whenever you make a change to your application CloudFormation, you need to update and publish the latest version in AWS Resilience Hub to ensure you are assessing the latest changes. Now that AWS Step Functions SDK integrations support AWS Resilience Hub, you can build a state machine to coordinate the process, which will be triggered from AWS Code Pipeline.

AWS Step Functions is a low-code, visual workflow service that developers use to build distributed applications, automate IT and business processes, and build data and machine learning pipelines using AWS services. Workflows manage failures, retries, parallelization, service integrations, and observability so developers can focus on higher-value business logic.

AWS Step Function for orchestrating AWS SDK calls

Figure 3. AWS Step Function for orchestrating AWS SDK calls

  1. The first step in the workflow is to update the resources associated with the application defined in AWS Resilience Hub by calling ImportResourcesToDraftApplication.
  2. Check for the import process to complete using a wait state, a call to DescribeDraftAppVersionResourcesImportStatus and then a choice state to decide whether to progress or continue waiting.
  3. Once complete, publish the draft application by calling PublishAppVersion to ensure we are assessing the latest version.
  4. Once published, call StartAppAssessment to kick-off a resilience assessment.
  5. Check for the assessment to complete using a wait state, a call to DescribeAppAssessment and then a choice state to decide whether to progress or continue waiting.
  6. In the choice state, use assessment status from the response to determine if the assessment is pending, in progress or successful.
  7. If successful, use the compliance status from the response to determine whether to progress to success or fail.
    • Compliance status will be either “PolicyMet” or “PolicyBreached”.
  8. If policy breached, publish onto SNS to alert the development team before moving to fail.

Create stage within code pipeline

Now that we have the AWS Step Function created, we need to integrate it into our pipeline. The post Fine-grained Continuous Delivery With CodePipeline and AWS Step Functions demonstrates how you can trigger a step function from AWS Code Pipeline.

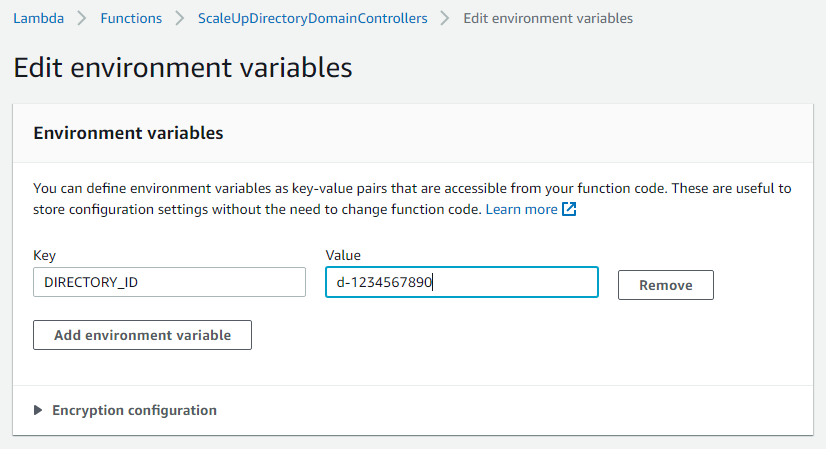
When adding the stage, you need to pass the ARN of the stack which was deployed in the previous stage as well as the ARN of the application in AWS Resilience Hub. These will be required on the AWS SDK calls and you can pass this in as a literal.

AWS CodePipeline stage step function input

Figure 4. AWS CodePipeline stage step function input

Example state using the input from AWS CodePipeline stage

Figure 5. Example state using the input from AWS CodePipeline stage

For more information about these AWS SDK calls, please refer to the AWS Resilience Hub API Reference documents.

Customers often run their workloads in lower environments in a less resilient way to save on cost. It’s important to add the assessment stage at the appropriate point of your pipeline. We recommend adding this to your pipeline after the deployment to a test environment which mirrors production but before deploying to production. By doing this you can fail fast and halt changes which will lower resilience in production.

A note on service quotas: AWS Resilience Hub allows you to run 20 assessments per month per application. If you need to increase this quota, please raise a ticket with AWS Support.

Conclusion

In this post, we have seen an approach to continuously assessing resilience as part of your CI/CD pipeline using AWS Resilience Hub, AWS CodePipeline and AWS Step Functions. This approach will enable you to understand fast if a change will weaken resilience.

AWS Resilience Hub also generates recommended AWS FIS Experiments that you can deploy and use to test the resilience of your application. As well as assessing the resilience, we also recommend you integrate running these tests into your pipeline. The post Chaos Testing with AWS Fault Injection Simulator and AWS CodePipeline demonstrates how you can active this.

Understand resiliency patterns and trade-offs to architect efficiently in the cloud

Post Syndicated from Haresh Nandwani original https://aws.amazon.com/blogs/architecture/understand-resiliency-patterns-and-trade-offs-to-architect-efficiently-in-the-cloud/

This post was originally published in June 2022 and is now updated with more information on efficiently architecting resilient patterns in the cloud.


Architecting workloads for resilience on the cloud often need to evaluate multiple factors before they can decide the most optimal architecture for their workloads.

Example Corp has multiple applications with varying criticality, and each of their applications have different needs in terms of resiliency, complexity, and cost. They have many choices to architect their workloads for resiliency and cost, but which option suits their needs best? What should they consider when choosing the patterns most appropriate for the needs of their applications?

To help answer these questions, we’ll discuss the five resilience patterns in Figure 1 and the trade-offs to consider when implementing them: 1) design complexity, 2) cost to implement, 3) operational effort, 4) effort to secure, and 5) environmental impact. This will help you achieve varying levels of resiliency and make decisions about the most appropriate architecture for your needs. Our intent is to provide a high-level approach to structure conversations on trade-offs associated with each of these patterns. For a deeper dive on each pattern, please navigate to the Further reading section at the end of this post.

Note: these patterns are not mutually exclusive; you may decide to implement a combination of one of more patterns.

Resilience patterns and trade-offs

Figure 1. Resilience patterns and trade-offs

What is resiliency? Why does it matter?

The AWS Well-Architected Framework defines resilience as having “the capability to recover when stressed by load (more requests for service), attacks (either accidental through a bug, or deliberate through intention), and failure of any component in the workload’s components.”

To meet your business’ resilience requirements, consider the following core factors as you design your workloads:

  • Design complexity – An increase in system complexity typically increases the emergent behaviors of that system. Each individual workload component has to be resilient, and you’ll need to eliminate single points of failure across people, process, and technology elements. Customers should consider their resilience requirements and decide if increasing system complexity is an effective approach, or if keeping the system simple and using a disaster recovery (DR) plan is be more appropriate.
  • Cost to implement – Costs often significantly increase when you implement higher resilience because there are new software and infrastructure components to operate. It’s important for such costs to be offset by the potential costs of future loss.
  • Operational effort – Deploying and supporting highly resilient systems requires complex operational processes and advanced technical skills. For example, customers might need to improve their operational processes using the Operational Readiness Review (ORR) approach. Before you decide to implement higher resilience, evaluate your operational competency to confirm you have the required level of process maturity and skillsets.
  • Effort to secure – Security complexity is less directly correlated with resilience. However, there are generally more components to secure for highly resilient systems. Using security best practices for cloud deployments can achieve security objectives without adding significant complexity even with a higher deployment footprint.
  • Environmental impact – An increased deployment footprint for resilient systems may increase your consumption of cloud resources. However, you can use trade-offs, like approximate computing and deliberately implementing slower response times to reduce resource consumption. The AWS Well-Architected Sustainability Pillar describes these patterns and provides guidance on sustainability best practices.

Pattern 1 (P1): Multi-AZ

P1 is a cloud-based architecture pattern (Figure 2) that introduces Availability Zones (AZs) into your architecture to increase your system’s resilience. The P1 pattern uses a Multi-AZ architecture where applications operate in multiple AZs within a single AWS Region. This allows your application to withstand AZ-level impacts.

As shown in Figure 2, Example Corp deploys their internal employee applications using the P1 pattern. These applications are low business impact and therefore have lower requirements for resiliency.

Example Corp deploys their low-business-impact applications as a single Amazon Elastic Compute Cloud (Amazon EC2) instance managed by an Auto Scaling group. Amazon EC2 uses health checks to automatically detect faults. If an AZ fails, Amazon EC2 prompts an Amazon EC2 Auto Scaling group to recreate their application in another unaffected AZ.

Multi-AZ deployment pattern (P1)

Figure 2. Multi-AZ deployment pattern (P1)

Trade-offs

P1 is low in several categories and mitigates a disruption to the AZ hosting the application, but this comes at the expense of application recovery. If an AZ is down, it will disrupt end users’ access to the application while the new resources are being re-provisioned in a new AZ. This is known as bi-modal behavior.

Pattern 2 (P2): Multi-AZ with static stability

P2 uses multiple instances across multiple AZs within a Region to increase resilience. The pattern uses static stability to prevent bimodal behavior. Statically stable systems remain stable and operate in one mode, irrespective of changes to their operating environment. A key benefit of a statically stable system on AWS is it reduces complexity of recovery during a disruption thanks to pre-provisioned resource capacity. Any resources needed to maintain operations during a disruption, such as the loss of resources in an AZ, already exist and AWS service control planes do not need to be available for recovery to be successful. To learn more about static stability, data planes and control planes read the builder’s library article Static stability using Availability Zones.

As shown in Figure 3, Example Corp has a customer-facing website that has a lower tolerance for downtime. Any time the website is down, it could result in lost revenue. Because of this, the website requires two EC2 instances that are provisioned within two AZs. Using health checks, when the AZ becomes impaired, the website continues to operate as the Elastic Load Balancer diverts traffic away from the impacted AZ. For more on using health checks, see the Implementing health checks article in The Amazon Builder’s Library.

Multi-AZ with static stability pattern (P2)

Figure 3. Multi-AZ with static stability pattern (P2)

Trade-offs

P2 mitigates an AZ disruption without downtime to application clients but must be weighed against cost concerns. P1 is less expensive from an infrastructure cost perspective, as it provisions less compute capacity and relies on launching new instances in case of a failure. However, P1’s bimodal behavior can affect your customers during large-scale events.

Implementing P2 requires your application to support distributed operation across multiple instances. If your application can support this pattern, you can deploy your workload to all available AZs (usually 3 or more) across the Region. This will reduce costs associated with over-provisioning because you only have to provision 150% of your capacity across three AZs compared with the 200% in two AZs (as mentioned in our earlier example).

Pattern 3 (P3): Application portfolio distribution

P3 uses a Multi-Region pattern to increase functional resilience, as demonstrated in Figure 4. It distributes different critical applications in multiple Regions.

Example Corp provides banking services, like credit balance checks, to consumers on multiple digital channels. These services are available to consumers via a mobile application, contact center, and web-based applications. Each digital channel is deployed to a separate Region, which mitigates against a regional service disruption.

For example, a Region with the customers’ mobile application may have a disruption that causes the mobile app to be unavailable, but customers can still access banking services via online banking deployed in an alternate Region. Regional service disruptions are rare, but implementing a pattern like this ensures your users retain access to business-critical services during disruptions.

Application portfolio distribution pattern (P3)

Figure 4. Application portfolio distribution pattern (P3)

Trade-offs

P3 mitigates the possibility of a regional service disruption impacting a multitude of systems at the same time. Operating an application portfolio that spans multiple Regions requires significant operational planning and management. Isolated functional elements may depend on common downstream systems and data sources that are deployed in a single Region. Therefore, Region-wide events may still cause disruption, but the impact surface area should be reduced.

Pattern 4 (P4): Multi-AZ deployment (multi-Region DR)

Example Corp operates several business-critical services that have a very low tolerance for disruption, such as the ability for consumers to make bank payments. Example Corp reviewed the four common patterns for DR (as defined in Disaster Recovery of Workloads on AWS: Recovery in the Cloud) and decided to use the following sub-patterns for their multi-Region applications:

  • Pilot Light – This pattern works for applications that require RTO/RPO of 10s of minutes. Data is actively replicated and application infrastructure is pre-provisioned in the DR Region. Cost optimization is a key driver here, as the application infrastructure is kept switched-off and only switched-on during the restore event.
  • Warm Standby – This pattern improves restore times significantly compared with pilot light by keeping your applications running in the DR Region but with a reduced capacity. Application infrastructure will be scaled up during a DR event, but this can typically be automated with minimal manual effort. This pattern can achieve RTO/RPO of minutes if implemented correctly.

Trade-offs

P4 mitigates a disruption to a regional service while reducing mitigation costs. Regional DR patterns increase deployment complexity as infrastructure changes need to be synchronized across Regions. Testing resilience is also significantly more complex and include simulating regional disruptions. Using Infrastructure as Code to automate deployments can help alleviate these issues.

Pattern 5 (P5): Multi-Region active-active

Example Corp’s core banking and Customer Relationship Management applications have zero tolerance for disruption. They use the P5 pattern for deploying these applications because it has an RTO of real-time and an RPO of near-zero data loss. They run their workload simultaneously in multiple Regions, allowing them to serve traffic from all Regions simultaneously. This pattern not only mitigates against regional disruptions but also addresses their zero tolerance requirements (Figure 5).

Multi-Region active-active pattern (P5)

Figure 5. Multi-Region active-active pattern (P5)

Trade-offs

P5 mitigates the disruption of a regional service, and invests additional costs and complexity to deliver a RTO of near zero. Multi-active deployments are generally complex, as they include multiple applications that collaborate to deliver required business services. If you implement this pattern, you’ll need to consider the fact that you’re introducing asynchronous replication for data across Regions and the impact that has on data consistency.

Operating this pattern requires a very high level of process maturity, so we recommend customers gradually build towards this pattern by starting with the deployment patterns described earlier.

Conclusion

In this blog post, we introduced five resilience patterns and trade-offs to consider when implementing them. In an effort to help you find the most efficient architecture for your use case, we demonstrated how Example Corp evaluated these options and how they applied them to their business needs.

Further reading

Looking for more architecture content?

AWS Architecture Center provides reference architecture diagrams, vetted architecture solutions, Well-Architected best practices, patterns, icons, and more!

How to use regional SAML endpoints for failover

Post Syndicated from Jonathan VanKim original https://aws.amazon.com/blogs/security/how-to-use-regional-saml-endpoints-for-failover/

Many Amazon Web Services (AWS) customers choose to use federation with SAML 2.0 in order to use their existing identity provider (IdP) and avoid managing multiple sources of identities. Some customers have previously configured federation by using AWS Identity and Access Management (IAM) with the endpoint signin.aws.amazon.com. Although this endpoint is highly available, it is hosted in a single AWS Region, us-east-1. This blog post provides recommendations that can improve resiliency for customers that use IAM federation, in the unlikely event of disrupted availability of one of the regional endpoints. We will show you how to use multiple SAML sign-in endpoints in your configuration and how to switch between these endpoints for failover.

How to configure federation with multi-Region SAML endpoints

AWS Sign-In allows users to log in into the AWS Management Console. With SAML 2.0 federation, your IdP portal generates a SAML assertion and redirects the client browser to an AWS sign-in endpoint, by default signin.aws.amazon.com/saml. To improve federation resiliency, we recommend that you configure your IdP and AWS federation to support multiple SAML sign-in endpoints, which requires configuration changes for both your IdP and AWS. If you have only one endpoint configured, you won’t be able to log in to AWS by using federation in the unlikely event that the endpoint becomes unavailable.

Let’s take a look at the Region code SAML sign-in endpoints in the AWS General Reference. The table in the documentation shows AWS regional endpoints globally. The format of the endpoint URL is as follows, where <region-code> is the AWS Region of the endpoint: https://<region-code>.signin.aws.amazon.com/saml

All regional endpoints have a region-code value in the DNS name, except for us-east-1. The endpoint for us-east-1 is signin.aws.amazon.com—this endpoint does not contain a Region code and is not a global endpoint. AWS documentation has been updated to reference SAML sign-in endpoints.

In the next two sections of this post, Configure your IdP and Configure IAM roles, I’ll walk through the steps that are required to configure additional resilience for your federation setup.

Important: You must do these steps before an unexpected unavailability of a SAML sign-in endpoint.

Configure your IdP

You will need to configure your IdP and specify which AWS SAML sign-in endpoint to connect to.

To configure your IdP

  1. If you are setting up a new configuration for AWS federation, your IdP will generate a metadata XML configuration file. Keep track of this file, because you will need it when you configure the AWS portion later.
  2. Register the AWS service provider (SP) with your IdP by using a regional SAML sign-in endpoint. If your IdP allows you to import the AWS metadata XML configuration file, you can find these files available for the public, GovCloud, and China Regions.
  3. If you are manually setting the Assertion Consumer Service (ACS) URL, we recommend that you pick the endpoint in the same Region where you have AWS operations.
  4. In SAML 2.0, RelayState is an optional parameter that identifies a specified destination URL that your users will access after signing in. When you set the ACS value, configure the corresponding RelayState to be in the same Region as the ACS. This keeps the Region configurations consistent for both ACS and RelayState. Following is the format of a Region-specific console URL.

    https://<region-code>.console.aws.amazon.com/

    For more information, refer to your IdP’s documentation on setting up the ACS and RelayState.

Configure IAM roles

Next, you will need to configure IAM roles’ trust policies for all federated human access roles with a list of all the regional AWS Sign-In endpoints that are necessary for federation resiliency. We recommend that your trust policy contains all Regions where you operate. If you operate in only one Region, you can get the same resiliency benefits by configuring an additional endpoint. For example, if you operate only in us-east-1, configure a second endpoint, such as us-west-2. Even if you have no workloads in that Region, you can switch your IdP to us-west-2 for failover. You can log in through AWS federation by using the us-west-2 SAML sign-in endpoint and access your us-east-1 AWS resources.

To configure IAM roles

  1. Log in to the AWS Management Console with credentials to administer IAM. If this is your first time creating the identity provider trust in AWS, follow the steps in Creating IAM SAML identity providers to create the identity providers.
  2. Next, create or update IAM roles for federated access. For each IAM role, update the trust policy that lists the regional SAML sign-in endpoints. Include at least two for increased resiliency.

    The following example is a role trust policy that allows the role to be assumed by a SAML provider coming from any of the four US Regions.

    {
        "Version": "2012-10-17",
        "Statement": [
            {
                "Effect": "Allow",
                "Principal": {
                    "Federated": "arn:aws:iam:::saml-provider/IdP"
                },
                "Action": "sts:AssumeRoleWithSAML",
                "Condition": {
                    "StringEquals": {
                        "SAML:aud": [
                            "https://us-east-2.signin.aws.amazon.com/saml",
                            "https://us-west-1.signin.aws.amazon.com/saml",
                            "https://us-west-2.signin.aws.amazon.com/saml",
                            "https://signin.aws.amazon.com/saml"
                        ]
                    }
                }
            }
        ]
    }

  3. When you use a regional SAML sign-in endpoint, the corresponding regional AWS Security Token Service (AWS STS) endpoint is also used when you assume an IAM role. If you are using service control policies (SCP) in AWS Organizations, check that there are no SCPs denying the regional AWS STS service. This will prevent the federated principal from being able to obtain an AWS STS token.

Switch regional SAML sign-in endpoints

In the event that the regional SAML sign-in endpoint your ACS is configured to use becomes unavailable, you can reconfigure your IdP to point to another regional SAML sign-in endpoint. After you’ve configured your IdP and IAM role trust policies as described in the previous two sections, you’re ready to change to a different regional SAML sign-in endpoint. The following high-level steps provide guidance on switching the regional SAML sign-in endpoint.

To switch regional SAML sign-in endpoints

  1. Change the configuration in the IdP to point to a different endpoint by changing the value for the ACS.
  2. Change the configuration for the RelayState value to match the Region of the ACS.
  3. Log in with your federated identity. In the browser, you should see the new ACS URL when you are prompted to choose an IAM role.
    Figure 1: New ACS URL

    Figure 1: New ACS URL

The steps to reconfigure the ACS and RelayState will be different for each IdP. Refer to the vendor’s IdP documentation for more information.

Conclusion

In this post, you learned how to configure multiple regional SAML sign-in endpoints as a best practice to further increase resiliency for federated access into your AWS environment. Check out the updates to the documentation for AWS Sign-In endpoints to help you choose the right configuration for your use case. Additionally, AWS has updated the metadata XML configuration for the public, GovCloud, and China AWS Regions to include all sign-in endpoints.

The simplest way to get started with SAML federation is to use AWS Single Sign-On (AWS SSO). AWS SSO helps manage your permissions across all of your AWS accounts in AWS Organizations.

If you have any questions, please post them in the Security Identity and Compliance re:Post topic or reach out to AWS Support.

Want more AWS Security news? Follow us on Twitter.

Jonathan VanKim

Jonathan VanKim

Jonathan VanKim is a Sr. Solutions Architect who specializes in Security and Identity for AWS. In 2014, he started working AWS Proserve and transitioned to SA 4 years later. His AWS career has been focused on helping customers of all sizes build secure AWS architectures. He enjoys snowboarding, wakesurfing, travelling, and experimental cooking.

Arynn Crow

Arynn Crow

Arynn Crow is a Manager of Product Management for AWS Identity. Arynn started at Amazon in 2012, trying out many different roles over the years before finding her happy place in security and identity in 2017. Arynn now leads the product team responsible for developing user authentication services at AWS.

How to automate AWS Managed Microsoft AD scaling based on utilization metrics

Post Syndicated from Dennis Rothmel original https://aws.amazon.com/blogs/security/how-to-automate-aws-managed-microsoft-ad-scaling-based-on-utilization-metrics/

AWS Directory Service for Microsoft Active Directory (AWS Managed Microsoft AD), provides a fully managed service for Microsoft Active Directory (AD) in the AWS cloud. When you create your directory, AWS deploys two domain controllers in separate Availability Zones that are exclusively yours for high availability. For use cases requiring even higher resilience and performance, in a specific Region or during specific hours, AWS Managed Microsoft AD allows you to scale by deploying additional domain controllers to meet your needs. These domain controllers can help load-balance, increase overall performance, or simply provide additional nodes to protect against temporary availability issues. AWS Managed Microsoft AD allows you to define the correct number of domain controllers for your directory based on your individual use case.

This post will walk you through how to automate scaling in AWS Managed Microsoft AD using utilization metrics from your directory. You’ll do this using Amazon CloudWatch Alarms, SNS notifications, and a Lambda function to increase the number of domain controllers in your directory based on utilization peaks.

Simplified directory scaling

AWS Managed Microsoft AD has now simplified this directory scaling process by integrating with Amazon CloudWatch metrics. This new integration enables you to:

  1. Analyze your directory to identify expected average and peak directory utilization
  2. Scale your directory based on utilization data to adequately address the expected load
  3. Automate the addition of domain controllers to handle unexpected load.

Integration is available for both domain controller utilization metrics such as CPU, Memory, Disk and Network, and for AD-specific metrics, such as LDAP searches, binds, DNS queries, and Directory reads/writes. Analyzing this data over time to identify expected average and peak utilization on your directory can help you deploy additional domain controllers in Regions that need them. Once you’ve established this utilization baseline, you can deploy additional domain controllers to service this load, and configure alarms for anything exceeding this baseline.

Solution overview

In this example, our AWS Managed Microsoft AD has the default two domain controllers; once your utilization threshold is reached, you’ll add one additional domain controller (domain controller 3 in the diagram) to cover this additional load. 

Figure 1: Solution overview

Figure 1: Solution overview

To create a CloudWatch Alarm with SNS topic notifications

  1. In the AWS Console, navigate to CloudWatch
  2. Choose Metrics to see the Browse Metrics panel
  3. Choose the Directory Service namespace, then choose AWS Managed Microsoft AD.
  4. In the Directory ID column, select your directory and check search for this only.
  5. From the Metric Category column, select Processor from Metric Category and check add to search. This view will show the processor utilization for your directory.
  6.  

    Figure 2. Processor utilization metrics

    Figure 2. Processor utilization metrics

  7. To see the average utilization across all domain controllers, choose Add Math, then All Functions, then AVG to create a metric math expression for average CPU utilization across all domain controllers.
  8.  

    Figure 3. Adding a math function to compute average

    Figure 3. Adding a math function to compute average

  9. Next, choose the Graphed Metrics tab in the CloudWatch metrics console, select the newly created expression, then select the bell icon from the Actions column to create a CloudWatch alarm based on this metric.
  10. Figure 4. Create a CloudWatch Alarm using Metric Math Expression

    Figure 4. Create a CloudWatch Alarm using Metric Math Expression

  11. Configure the threshold alarm to trigger when CPU utilization exceeds 70%.
  12.  In the Metrics section, under Period, choose 1 Hour.
     In the Conditions section, under Threshold Type, choose Static. Under Define the alarm condition, choose Greater than threshold. Under Define the threshold value, enter 70. See Figure 5 for an image of how alarm parameters should look on your screen. Choose Next to Configure actions

    Figure 5. Configure the alarm parameters

    Figure 5. Configure the alarm parameters

  13. On the Configure actions screen, configure the actions using the parameters listed below to send an email notification when the alarm state is triggered. See Figure 6 for an image of how email notifications are configured.
  14.   In the Notification section, set Alarm state trigger to In alarm.   Set Select an SNS topic to Create topic.  Fill in the name of the alarm in the Create a new topic field, and add the email where notifications should be sent to the Email endpoints that will receive notification field. An email address is required to create the SNS topic and you should use an email address that’s accessible by your operations team. This SNS topic will be used to trigger the Lambda automation described in a later section. Note: make a note of the SNS topic name you chose; you will use it later when creating the Lambda function in the To create an AWS Lambda function to automate scale out procedure below. 

    Figure 6. Create SNS topic and email notification

    Figure 6. Create SNS topic and email notification

  15. In the Alarm name field, provide a name for the alarm. You can optionally also add an Alarm description. Choose Next.
  16. Review your configuration, and choose Create alarm to create the alarm.

Once you’ve completed these steps, you will now have an alarm implemented for when domain controller CPU utilization exceeds an average of 70% across both domain controllers. This will trigger an SNS topic when your directory is experiencing a heavy load, which will be used to start the Lambda automation and will send an informational email notification. In the next section, we’ll configure an AWS Lambda function to automate the addition of a domain controller based on this SNS topic.

For additional details on CloudWatch Alarms, please see the Amazon CloudWatch documentation.

To create an AWS Lambda function to automate scale out

The sample Lambda function shown below checks the number of domain controllers in this Region, and increases that by adding one additional domain controller. This procedure describes how to configure the IAM role required for this Lambda function, then how to deploy the Lambda function to execute when the alarm is triggered to automatically add a domain controller when your load exceeds your typical usage baseline.

Note: For additional details on Lambda creation, please see the AWS Lambda documentation.

To automate scale-out using AWS Lambda

  1. In the AWS Console, navigate to IAM and choose Policies, then choose Create Policy.
  2. Choose the JSON tab, and create a new IAM role using the policy provided in JSON below.
  3. For more details on this configuration, see the AWS Directory Service documentation.

    Sample policy


    {
    	"Version":"2012-10-17",
    	"Statement":[
    	{
    		"Effect":"Allow",
    		"Action":[
    			"ds:DescribeDomainControllers",
    			"ds:UpdateNumberOfDomainControllers",
    			"ec2:DescribeSubnets",
    			"ec2:DescribeVpcs",
    			"ec2:CreateNetworkInterface",
    			"ec2:DescribeNetworkInterfaces",
    			"ec2:DeleteNetworkInterface"
    		],
    		"Resource":"*"
    	}
    	]
    }
    

  4. Choose Next:Tags to add tags (optional) before choosing Next:Review.
  5. On the Create Policy screen, provide a name in the Name field. You can optionally also add a description. Choose Create policy to complete creating the new policy.
  6.  
    Note: make a note of the policy name you chose; you will use it later when updating the execution role for the Lambda function.  

    Figure 7. Provide a name to create the IAM policy

    Figure 7. Provide a name to create the IAM policy

  7. In the AWS Console, navigate to Lambda and choose Create Function
  8. On the Create Function screen, select Author from Scratch and provide a Name, then choose Create Function.
  9. Figure 8. Create a Lambda function

    Figure 8. Create a Lambda function

  10. Once created, on the Lambda function’s page, choose the Configuration tab, then choose Permissions from the sidebar and choose the execution role name linked under Role name. This will open the IAM console in another tab, preloaded to your Lambda execution role.
  11.  

    Figure 9: Select the Execution Role

    Figure 9: Select the Execution Role

  12. On the execution role screen, choose Attach policies and select the IAM policy you’ve just created (e.g. DirectoryService-DCNumber Update). On the Attach Permissions screen, choose Attach policy to complete updating the execution role. Once completed this step, you may close this tab and return the previous browser tab.
  13.  

    Figure 10. Select and attach the IAM policy

    Figure 10. Select and attach the IAM policy

  14. On the Lambda function screen, choose the Configuration tab, then choose Triggers from the sidebar.
  15. On the Add Trigger screen, choose the pulldown under Trigger configuration and select SNS. On the SNS topic box, select the SNS topic you created in Step 9 of the To create a CloudWatch Alarm with SNS topic notifications procedure above. Then choose Add to complete the trigger configuration.
  16. On the Lambda function screen, choose the Configuration tab, then choose Environment variables from the sidebar.
  17. On the Environment variables card, click Edit.
  18. On the Edit environment variables screen, choose Add environment variables and use the Key “DIRECTORY_ID” and the Value will be the directory ID for you AWS Managed Microsoft AD.
  19.  

    Figure 11. The "Edit environment variables" screen

    Figure 11. The “Edit environment variables” screen

  20. On the Lambda function screen, choose the Code tab to open the in-browser code editor experience inside the Code source card. Paste in the sample Lambda function code given below to complete the implementation.
  21.  

    Figure 12. Paste sample code to complete the Lambda function setup

    Figure 12. Paste sample code to complete the Lambda function setup

Sample Lambda function code

The sample Lambda function given below automates adding another domain controller to your directory. When your CloudWatch alarm triggers, you will receive a notification email, and an additional domain controller will be deployed to provide the added capacity to support the increase in directory usage.

Note: The example code contains a variable for the maximum number of domain controllers (maxDcNum), to prevent you from over provisioning in the event of a missed configuration. This value is set to 3 for this blog post’s example and can be increased to suit your use case. 

import json
import boto3

maxDcNum = 10
minDcNum = 2
region   = "us-east-1"
dsId = "d-906752246f"

ds = boto3.client('ds', region_name=region)

def lambda_handler(event, context):
    
    ## get the current number of domain controllers
    dcs = ds.describe_domain_controllers(DirectoryId = dsId)

    DomainControllers = dcs["DomainControllers"]
    
    DCcount = len(DomainControllers)
    print(">>> Current number of DCs:" + str(DCcount))

    #increase the number of DCs
    if DCcount < maxDcNum:
        NewDCnumber = DCcount + 1 
        response = ds.update_number_of_domain_controllers(DirectoryId = dsId, DesiredNumber =  NewDCnumber);    

        return {
            'statusCode': 200,
            'body': json.dumps("New DC number will be " + str(NewDCnumber))
        }
    else:
        return {
            'statusCode': 200,
            'body': json.dumps("Max number of DCs reached. The number of DCs is" + str(DCcount))
        }

Note: When testing this Lambda function, remember that this will increase the number of domain controllers for your directory in that Region. If the additional domain controller is not needed, please reduce the count after the test to avoid costs for an additional domain controller. The same principles used in this article to automate the addition of domain controllers can be applied to automate the reduction of domain controllers and you should consider automating the reduction to optimize for resilience, performance and cost.

Conclusion

In this post, you’ve implemented alarms based on thresholds in Domain Controller utilization using AWS CloudWatch and automation to increase the number of domain controllers using AWS Lambda functions. This solution helps to cost-effectively improve resilience and performance of your directory, by scaling your directory based on historical load patterns.

To learn more about using AWS Managed Microsoft AD, visit the AWS Directory Service documentation. For general information and pricing, see the AWS Directory Service home page. If you have comments about this blog post, submit a comment in the Comments section below. If you have implementation or troubleshooting questions, start a new thread on the Directory Service forum or contact AWS Support.

Want more AWS Security news? Follow us on Twitter.

Author

Dennis Rothmel

Dennis is a Sr. Product Manager from AWS Identity with a passion for modernization and automation. He has worked globally across Asia Pacific, Europe, and America, and enjoys the travel, languages, cultures and foods that come with global working.

Author

Vladimir Provorov

Vladimir is a Product Solutions Architect from AWS Identity focused on Workforce Identity and Directory Service. He works on developing new features to make Enterprise Identity simpler and more scalable. He is excited to travel and explore the world with his family.

Keeping Netflix Reliable Using Prioritized Load Shedding

Post Syndicated from Netflix Technology Blog original https://netflixtechblog.com/keeping-netflix-reliable-using-prioritized-load-shedding-6cc827b02f94

How viewers are able to watch their favorite show on Netflix while the infrastructure self-recovers from a system failure

By Manuel Correa, Arthur Gonigberg, and Daniel West

Getting stuck in traffic is one of the most frustrating experiences for drivers around the world. Everyone slows to a crawl, sometimes for a minor issue or sometimes for no reason at all. As engineers at Netflix, we are constantly reevaluating how to redesign traffic management. What if we knew the urgency of each traveler and could selectively route cars through, rather than making everyone wait?

In Netflix engineering, we’re driven by ensuring Netflix is there when you need it to be. Yet, as recent as last year, our systems were susceptible to metaphorical traffic jams; we had on/off circuit breakers, but no progressive way to shed load. Motivated by improving the lives of our members, we’ve introduced priority-based progressive load shedding.

The animation below shows the behavior of the Netflix viewer experience when the backend is throttling traffic based on priority. While the lower priority requests are throttled, the playback experience remains uninterrupted and the viewer is able to enjoy their title. Let’s dig into how we accomplished this.

Failure can occur due to a myriad of reasons: misbehaving clients that trigger a retry storm, an under-scaled service in the backend, a bad deployment, a network blip, or issues with the cloud provider. All such failures can put a system under unexpected load, and at some point in the past, every single one of these examples has prevented our members’ ability to play. With these incidents in mind, we set out to make Netflix more resilient with these goals:

  1. Consistently prioritize requests across device types (Mobile, Browser, and TV)
  2. Progressively throttle requests based on priority
  3. Validate assumptions by using Chaos Testing (deliberate fault injection) for requests of specific priorities

The resulting architecture that we envisioned with priority throttling and chaos testing included is captured below.

High level playback architecture with priority throttling and chaos testing

Building a request taxonomy

We decided to focus on three dimensions in order to categorize request traffic: throughput, functionality, and criticality. Based on these characteristics, traffic was classified into the following:

  • NON_CRITICAL: This traffic does not affect playback or members’ experience. Logs and background requests are examples of this type of traffic. These requests are usually high throughput which contributes to a large percentage of load in the system.
  • DEGRADED_EXPERIENCE: This traffic affects members’ experience, but not the ability to play. The traffic in this bucket is used for features like: stop and pause markers, language selection in the player, viewing history, and others.
  • CRITICAL: This traffic affects the ability to play. Members will see an error message when they hit play if the request fails.

Using attributes of the request, the API gateway service (Zuul) categorizes the requests into NON_CRITICAL, DEGRADED_EXPERIENCE and CRITICAL buckets, and computes a priority score between 1 to 100 for each request given its individual characteristics. The computation is done as a first step so that it is available for the rest of the request lifecycle.

Most of the time, the request workflow proceeds normally without taking the request priority into account. However, as with any service, sometimes we reach a point when either one of our backends is in trouble or Zuul itself is in trouble. When that happens requests with higher priority get preferential treatment. The higher priority requests will get served, while the lower priority ones will not. The implementation is analogous to a priority queue with a dynamic priority threshold. This allows Zuul to drop requests with a priority lower than the current threshold.

Finding the best place to throttle traffic

Zuul can apply load shedding in two moments during the request lifecycle: when it routes requests to a specific back-end service (service throttling) or at the time of initial request processing, which affects all back-end services (global throttling).

Service throttling

Zuul can sense when a back-end service is in trouble by monitoring the error rates and concurrent requests to that service. Those two metrics are approximate indicators of failures and latency. When the threshold percentage for one of these two metrics is crossed, we reduce load on the service by throttling traffic.

Global throttling

Another case is when Zuul itself is in trouble. As opposed to the scenario above, global throttling will affect all back-end services behind Zuul, rather than a single back-end service. The impact of this global throttling can cause much bigger problems for members. The key metrics used to trigger global throttling are CPU utilization, concurrent requests, and connection count. When any of the thresholds for those metrics are crossed, Zuul will aggressively throttle traffic to keep itself up and healthy while the system recovers. This functionality is critical: if Zuul goes down, no traffic can get through to our backend services, resulting in a total outage.

Introducing priority-based progressive load shedding

Once we had the prioritization piece in place, we were able to combine it with our load shedding mechanism to dramatically improve streaming reliability. When we’re in a bad situation (i.e. any of the thresholds above are exceeded), we progressively drop traffic, starting with the lowest priority. A cubic function is used to manage the level of throttling. If things get really, really bad the level will hit the sharp side of the curve, throttling everything.

The graph above is an example of how the cubic function is applied. As the overload percentage increases (i.e. the range between the throttling threshold and the max capacity), the priority threshold trails it very slowly: at 35%, it’s still in the mid-90s. If the system continues to degrade, we hit priority 50 at 80% exceeded and then eventually 10 at 95%, and so on.

Given that a relatively small amount of requests impact streaming availability, throttling low priority traffic may affect certain product features but will not prevent members pressing “play” and watching their favorite show. By adding progressive priority-based load shedding, Zuul can shed enough traffic to stabilize services without members noticing.

Handling retry storms

When Zuul decides to drop traffic, it sends a signal to devices to let them know that we need them to back off. It does this by indicating how many retries they can perform and what kind of time window they can perform them in. For example:

{ “maxRetries” : <max-retries>, “retryAfterSeconds”: <seconds> }

Using this backpressure mechanism, we can stop retry storms much faster than we could in the past. We automatically adjust these two dials based on the priority of the request. Requests with higher priority will retry more aggressively than lower ones, also increasing streaming availability.

Validating which requests are right for the job

To validate our request taxonomy assumptions on whether a specific request fell into the NON_CRITICAL, DEGRADED, or CRITICAL bucket, we needed a way to test the user’s experience when that request was shed. To accomplish this, we leveraged our internal failure injection tool (FIT) and created a failure injection point in Zuul that allowed us to shed any request based on a supplied priority. This enabled us to manually simulate a load shedded experience by blocking ranges of priorities for a specific device or member, giving us an idea of which requests could be safely shed without impacting the user.

Continually ensuring those requests are still right for the job

One of the goals here is to reduce members’ pain by shedding requests that are not expected to affect the user’s streaming experience. However, Netflix changes quickly and requests that were thought to be noncritical can unexpectedly become critical. In addition, Netflix has a wide variety of client devices, client versions, and ways to interact with the system. To make sure we weren’t causing members pain when throttling NON_CRITICAL requests in any of these scenarios, we leveraged our infrastructure experimentation platform ChAP.

This platform allows us to stage an A/B experiment that will allocate a small number of production users to either a control or treatment group for 45 minutes while throttling a range of priorities for the treatment group. This lets us capture a variety of live use cases and measure the impact to their playback experience. ChAP analyzes the members’ KPIs per device to determine if there is a deviation between the control and the treatment groups.

In our first experiment, we detected a race condition in both Android and iOS devices for a low priority request that caused sporadic playback errors. Since we practice continuous experimentation, once the initial experiments were run and the bugs were fixed, we scheduled them to run on a periodic basis. This allows us to detect regressions early and keep users streaming.

Experiment regression detection before and after fix (SPS indicates streaming availability)

Reaping the benefits

In 2019, before progressive load shedding was in place, the Netflix streaming services experienced an outage that resulted in a sizable percentage of members who were not able to play for a period of time. In 2020, days after the implementation was deployed, the team started seeing the benefit of the solution. Netflix experienced a similar issue with the same potential impact as the outage seen in 2019. Unlike then, Zuul’s progressive load shedding kicked in and started shedding traffic until the service was in a healthy state without impacting members’ ability to play at all.

The graph below shows a stable streaming availability metric stream per second (SPS) while Zuul is performing progressive load shedding based on request priority during the incident. The different colors in the graph represent requests with different priority being throttled.

Members were happily watching their favorite show on Netflix while the infrastructure was self-recovering from a system failure.

We are not done yet

For future work, the team is looking into expanding the use of request priority for other use cases like better retry policies between devices and back-ends, dynamically changing load shedding thresholds, tuning the request priorities using Chaos Testing as a guiding principle, and other areas that will make Netflix even more resilient.

If you’re interested in helping Netflix stay up in the face of shifting systems and unexpected failures, reach out to us. We’re hiring!


Keeping Netflix Reliable Using Prioritized Load Shedding was originally published in Netflix TechBlog on Medium, where people are continuing the conversation by highlighting and responding to this story.