Mandiant is reporting on a trojaned Windows installer that targets Ukrainian users. The installer was left on various torrent sites, presumably ensnaring people downloading pirated copies of the operating system:
Mandiant uncovered a socially engineered supply chain operation focused on Ukrainian government entities that leveraged trojanized ISO files masquerading as legitimate Windows 10 Operating System installers. The trojanized ISOs were hosted on Ukrainian- and Russian-language torrent file sharing sites. Upon installation of the compromised software, the malware gathers information on the compromised system and exfiltrates it. At a subset of victims, additional tools are deployed to enable further intelligence gathering. In some instances, we discovered additional payloads that were likely deployed following initial reconnaissance including the STOWAWAY, BEACON, and SPAREPART backdoors.
One obvious solution would be for Microsoft to give the Ukrainians Windows licenses, so they don’t have to get their software from sketchy torrent sites.
The Ukrainian army has released an instructional video explaining how Russian soldiers should surrender to a drone:
“Seeing the drone in the field of view, make eye contact with it,” the video instructs. Soldiers should then raise their arms and signal they’re ready to follow.
After that the drone will move up and down a few meters, before heading off at walking pace in the direction of the nearest representatives of Ukraine’s army, it says.
The video also warns that the drone’s battery may run low, in which case it will head back to base and the soldiers should stay put and await a fresh one.
That one, too, should be met with eye contact and arms raised, it says.
Kaspersky is reporting on a data wiper masquerading as ransomware that is targeting local Russian government networks.
The Trojan corrupts any data that’s not vital for the functioning of the operating system. It doesn’t affect files with extensions .exe, .dll, .lnk, .sys or .msi, and ignores several system folders in the C:\Windows directory. The malware focuses on databases, archives, and user documents.
So far, our experts have seen only pinpoint attacks on targets in the Russian Federation. However, as usual, no one can guarantee that the same code won’t be used against other targets.
Computer code developed by a company called Pushwoosh is in about 8,000 Apple and Google smartphone apps. The company pretends to be American when it is actually Russian.
According to company documents publicly filed in Russia and reviewed by Reuters, Pushwoosh is headquartered in the Siberian town of Novosibirsk, where it is registered as a software company that also carries out data processing. It employs around 40 people and reported revenue of 143,270,000 rubles ($2.4 mln) last year. Pushwoosh is registered with the Russian government to pay taxes in Russia.
On social media and in US regulatory filings, however, it presents itself as a US company, based at various times in California, Maryland, and Washington, DC, Reuters found.
What does the code do? Spy on people:
Pushwoosh provides code and data processing support for software developers, enabling them to profile the online activity of smartphone app users and send tailor-made push notifications from Pushwoosh servers.
On its website, Pushwoosh says it does not collect sensitive information, and Reuters found no evidence Pushwoosh mishandled user data. Russian authorities, however, have compelled local companies to hand over user data to domestic security agencies.
I have called supply chain security “an insurmountably hard problem,” and this is just another example of that.
Found documents in Poland detail US spying operations against the former Soviet Union.
The file details a number of bugs found at Soviet diplomatic facilities in Washington, D.C., New York, and San Francisco, as well as in a Russian government-owned vacation compound, apartments used by Russia personnel, and even Russian diplomats’ cars. And the bugs were everywhere: encased in plaster in an apartment closet; behind electrical and television outlets; bored into concrete bricks and threaded into window frames; inside wooden beams and baseboards and stashed within a building’s foundation itself; surreptitiously attached to security cameras; wired into ceiling panels and walls; and secretly implanted into the backseat of cars and in their window panels, instrument panels, and dashboards. It’s an impressive— and impressively thorough— effort by U.S. counterspies.
We have long read about sophisticated Russian spying operations—bugging the Moscow embassy, bugging Selectric typewriters in the Moscow embassy, bugging the new Moscow embassy. These are the first details I’ve read about the US bugging the Russians’ embassy.
The Russian hacking group Turla released an Android app that seems to aid Ukrainian hackers in their attacks against Russian networks. It’s actually malware, and provides information back to the Russians:
The hackers pretended to be a “community of free people around the world who are fighting russia’s aggression”—much like the IT Army. But the app they developed was actually malware. The hackers called it CyberAzov, in reference to the Azov Regiment or Battalion, a far-right group that has become part of Ukraine’s national guard. To add more credibility to the ruse they hosted the app on a domain “spoofing” the Azov Regiment: cyberazov[.]com.
[…]
The app actually didn’t DDoS anything, but was designed to map out and figure out who would want to use such an app to attack Russian websites, according to Huntely.
[…]
Google said the fake app wasn’t hosted on the Play Store, and that the number of installs “was miniscule.”
Welcome to our 2022 Q2 DDoS report. This report includes insights and trends about the DDoS threat landscape — as observed across the global Cloudflare network. An interactive version of this report is also available on Radar.
In Q2, we’ve seen some of the largest attacks the world has ever seen including a 26 million request per second HTTPS DDoS attacks that Cloudflare automatically detected and mitigated. Furthermore, attacks against Ukraine and Russia continue, whilst a new Ransom DDoS attack campaign emerged.
The Highlights
Ukrainian and Russian Internet
The war on the ground is accompanied by attacks targeting the spread of information.
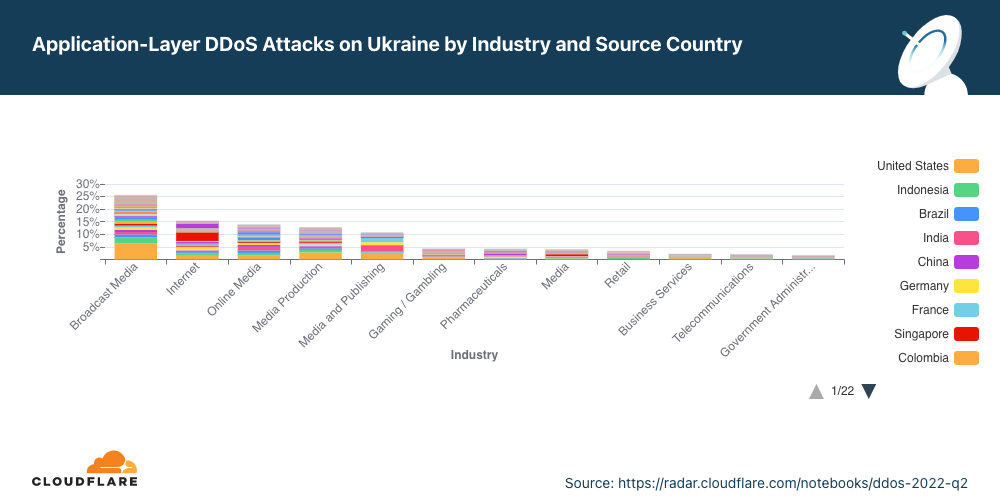
Broadcast Media companies in the Ukraine were the most targeted in Q2 by DDoS attacks. In fact, all the top five most attacked industries are all in online/Internet media, publishing, and broadcasting.
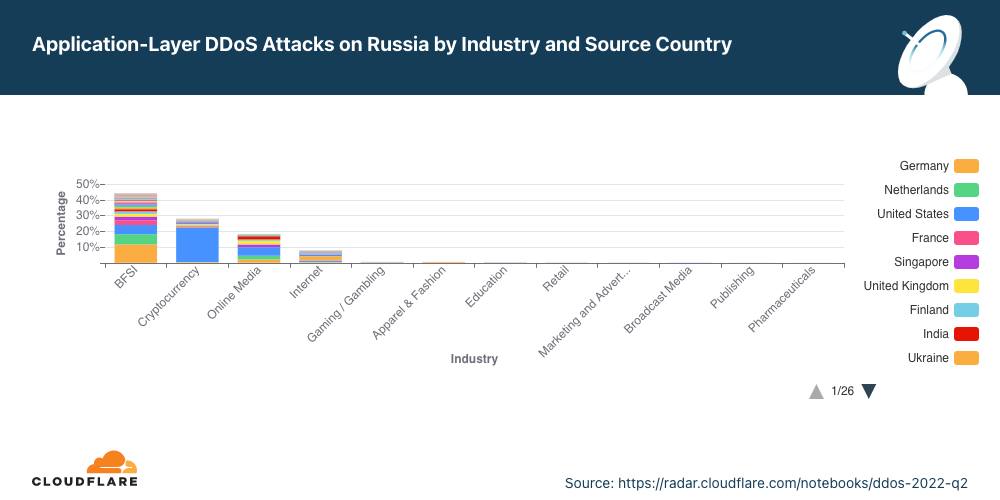
In Russia on the other hand, Online Media drops as the most attacked industry to the third place. Making their way to the top, Banking, Financial Services and Insurance (BFSI) companies in Russia were the most targeted in Q2; almost 45% of all application-layer DDoS attacks targeted the BFSI sector. Cryptocurrency companies in Russia were the second most attacked.
We’ve seen a new wave of Ransom DDoS attacks by entities claiming to be the Fancy Lazarus.
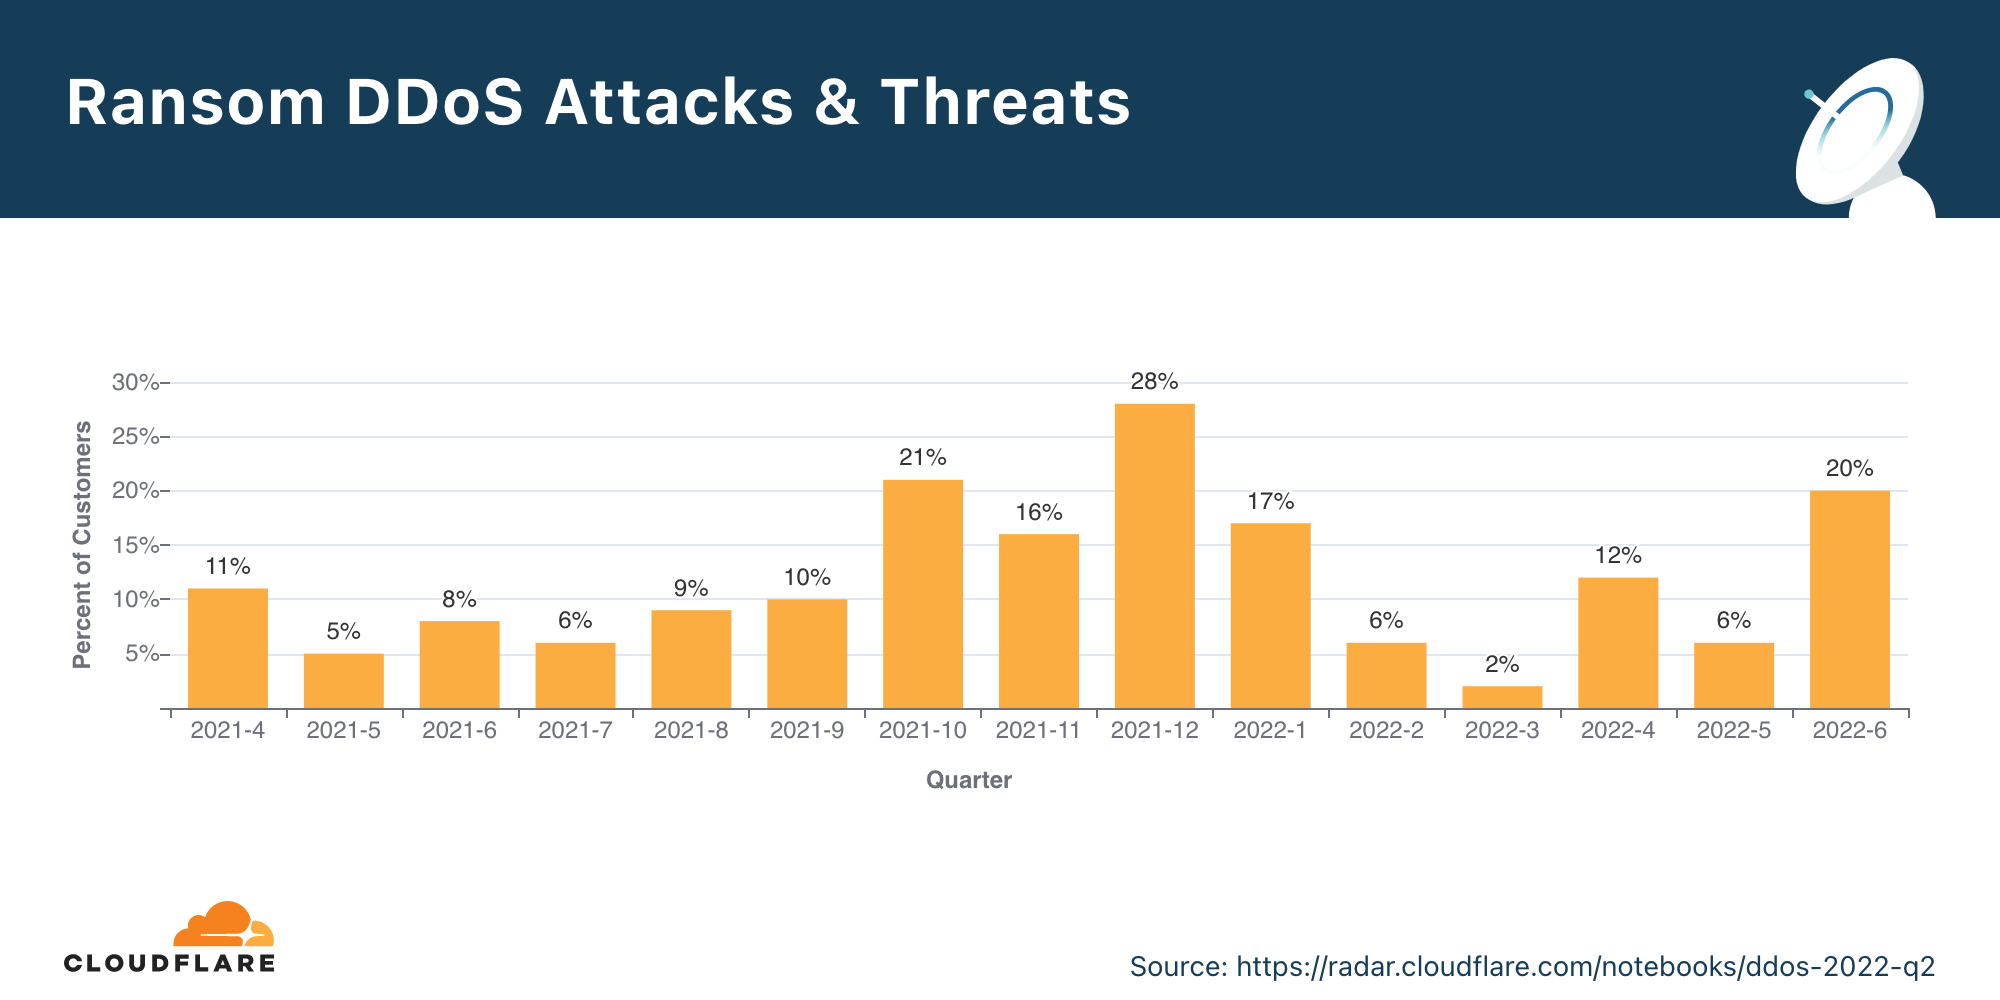
In June 2022, ransom attacks peaked to the highest of the year so far: one out of every five survey respondents who experienced a DDoS attack reported being subject to a Ransom DDoS attack or other threats.
Overall in Q2, the percent of Ransom DDoS attacks increased by 11% QoQ.
Application-layer DDoS attacks
In 2022 Q2, application-layer DDoS attacks increased by 72% YoY.
Organizations in the US were the most targeted, followed by Cyprus, Hong Kong, and China. Attacks on organizations in Cyprus increased by 166% QoQ.
The Aviation & Aerospace industry was the most targeted in Q2, followed by the Internet industry, Banking, Financial Services and Insurance, and Gaming / Gambling in fourth place.
Network-layer DDoS attacks
In 2022 Q2, network-layer DDoS attacks increased by 109% YoY. Attacks of 100 Gbps and larger increased by 8% QoQ, and attacks lasting more than 3 hours increased by 12% QoQ.
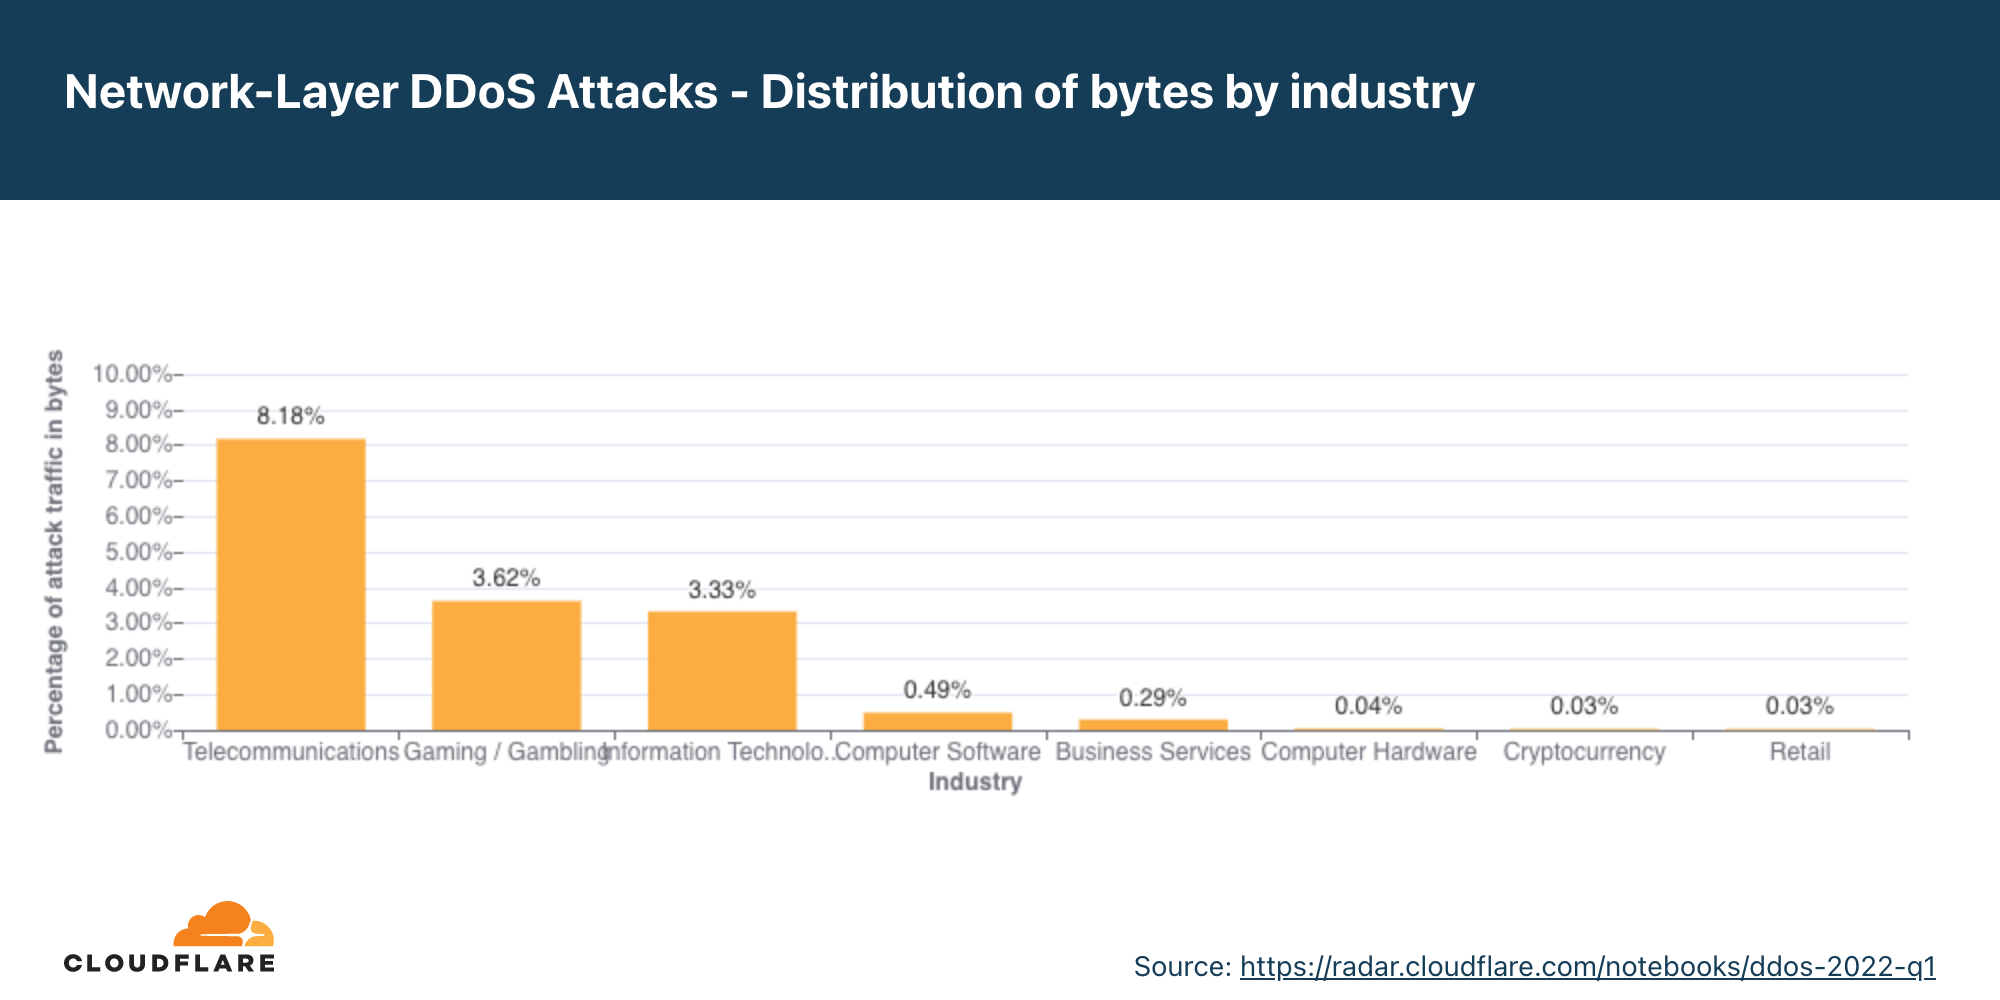
The top attacked industries were Telecommunications, Gaming / Gambling and the Information Technology and Services industry.
Organizations in the US were the most targeted, followed by China, Singapore, and Germany.
This report is based on DDoS attacks that were automatically detected and mitigated by Cloudflare’s DDoS Protection systems. To learn more about how it works, check out this deep-dive blog post.
A note on how we measure DDoS attacks observed over our network
To analyze attack trends, we calculate the “DDoS activity” rate, which is either the percentage of attack traffic out of the total traffic (attack + clean) observed over our global network, or in a specific location, or in a specific category (e.g., industry or billing country). Measuring the percentages allows us to normalize data points and avoid biases reflected in absolute numbers towards, for example, a Cloudflare data center that receives more total traffic and likely, also more attacks.
Ransom Attacks
Our systems constantly analyze traffic and automatically apply mitigation when DDoS attacks are detected. Each DDoS’d customer is prompted with an automated survey to help us better understand the nature of the attack and the success of the mitigation.
For over two years now, Cloudflare has been surveying attacked customers — one question on the survey being if they received a threat or a ransom note demanding payment in exchange to stop the DDoS attack.
The number of respondents reporting threats or ransom notes in Q2 increased by 11% QoQ and YoY. During this quarter, we’ve been mitigating Ransom DDoS attacks that have been launched by entities claiming to be the Advanced Persistent Threat (APT) group “Fancy Lazarus”. The campaign has been focusing on financial institutions and cryptocurrency companies.
The percentage of respondents reported being targeted by a ransom DDoS attack or that have received threats in advance of the attack.
Drilling down into Q2, we can see that in June one out of every five respondents reported receiving a ransom DDoS attack or threat — the highest month in 2022, and the highest since December 2021.
Application-layer DDoS attacks
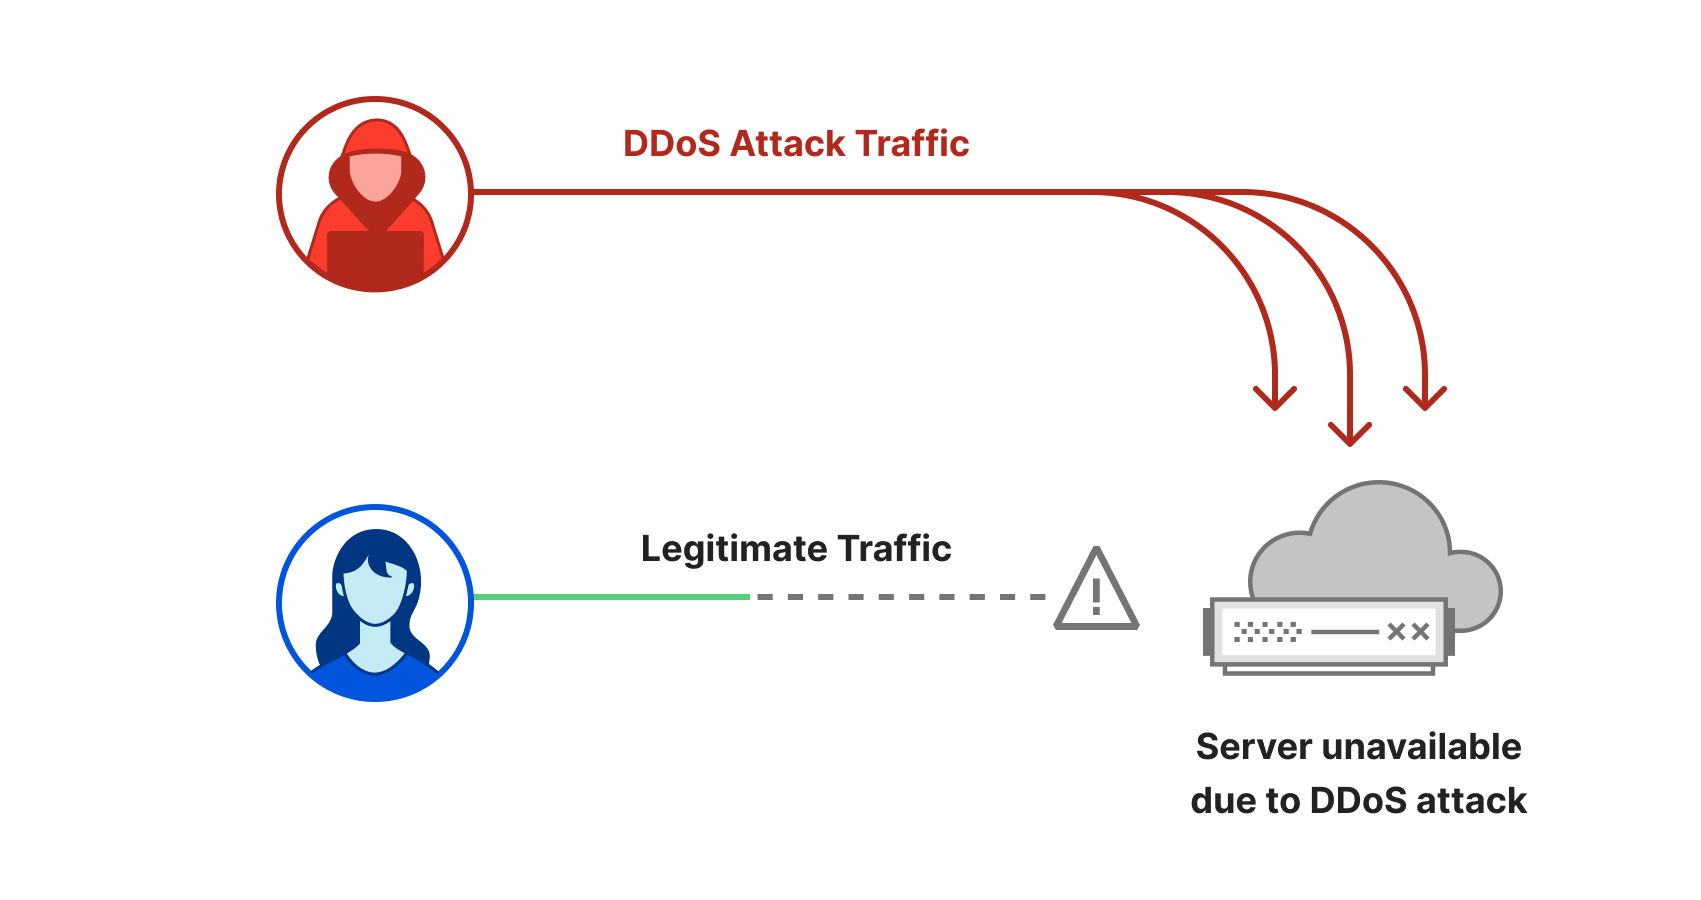
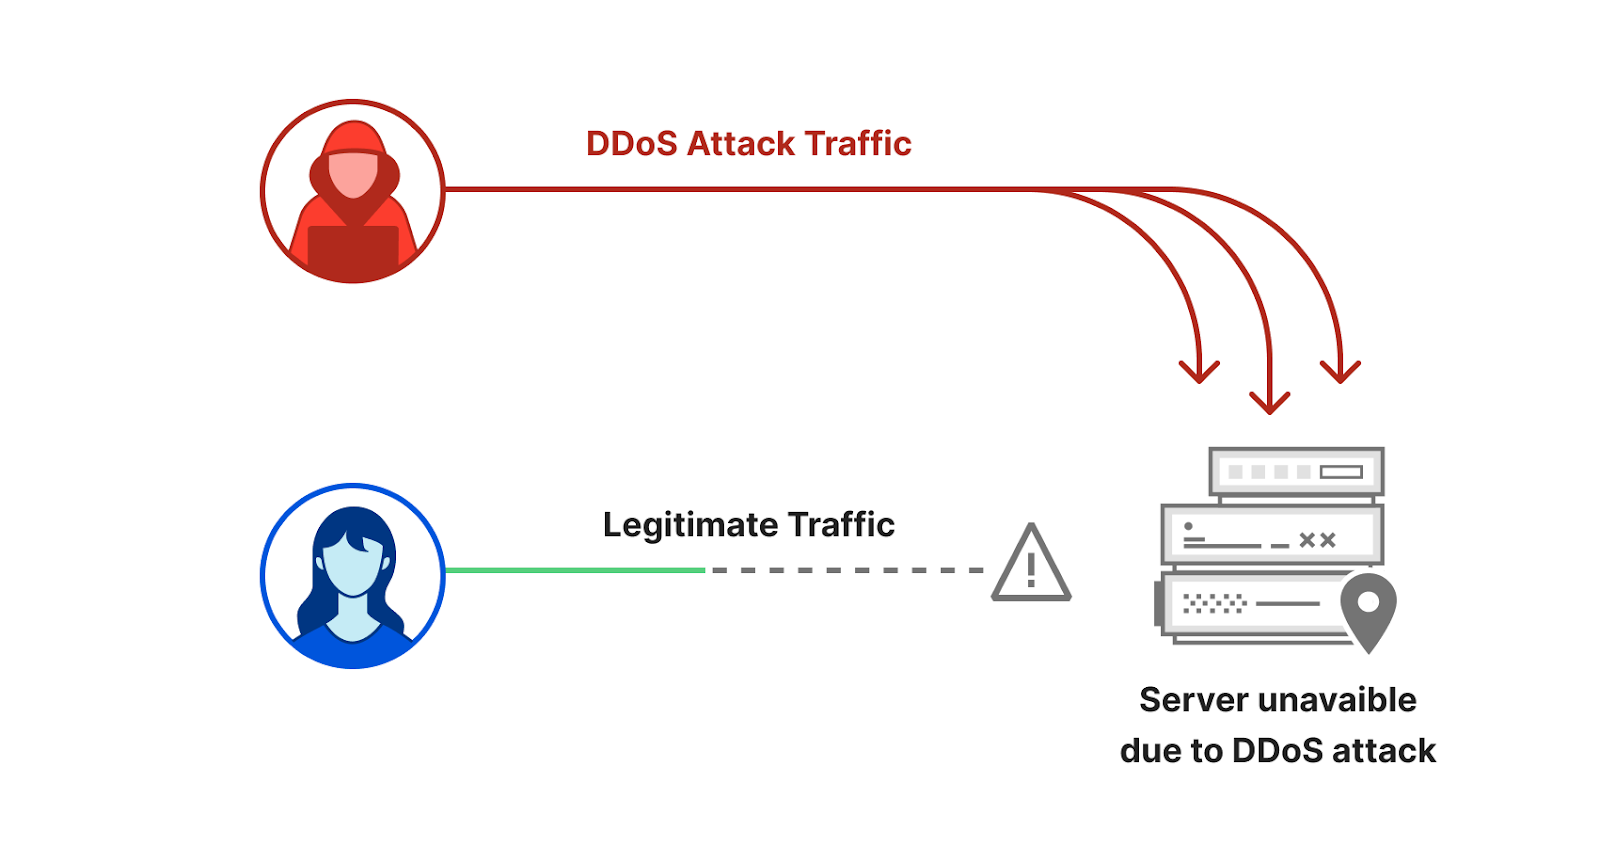
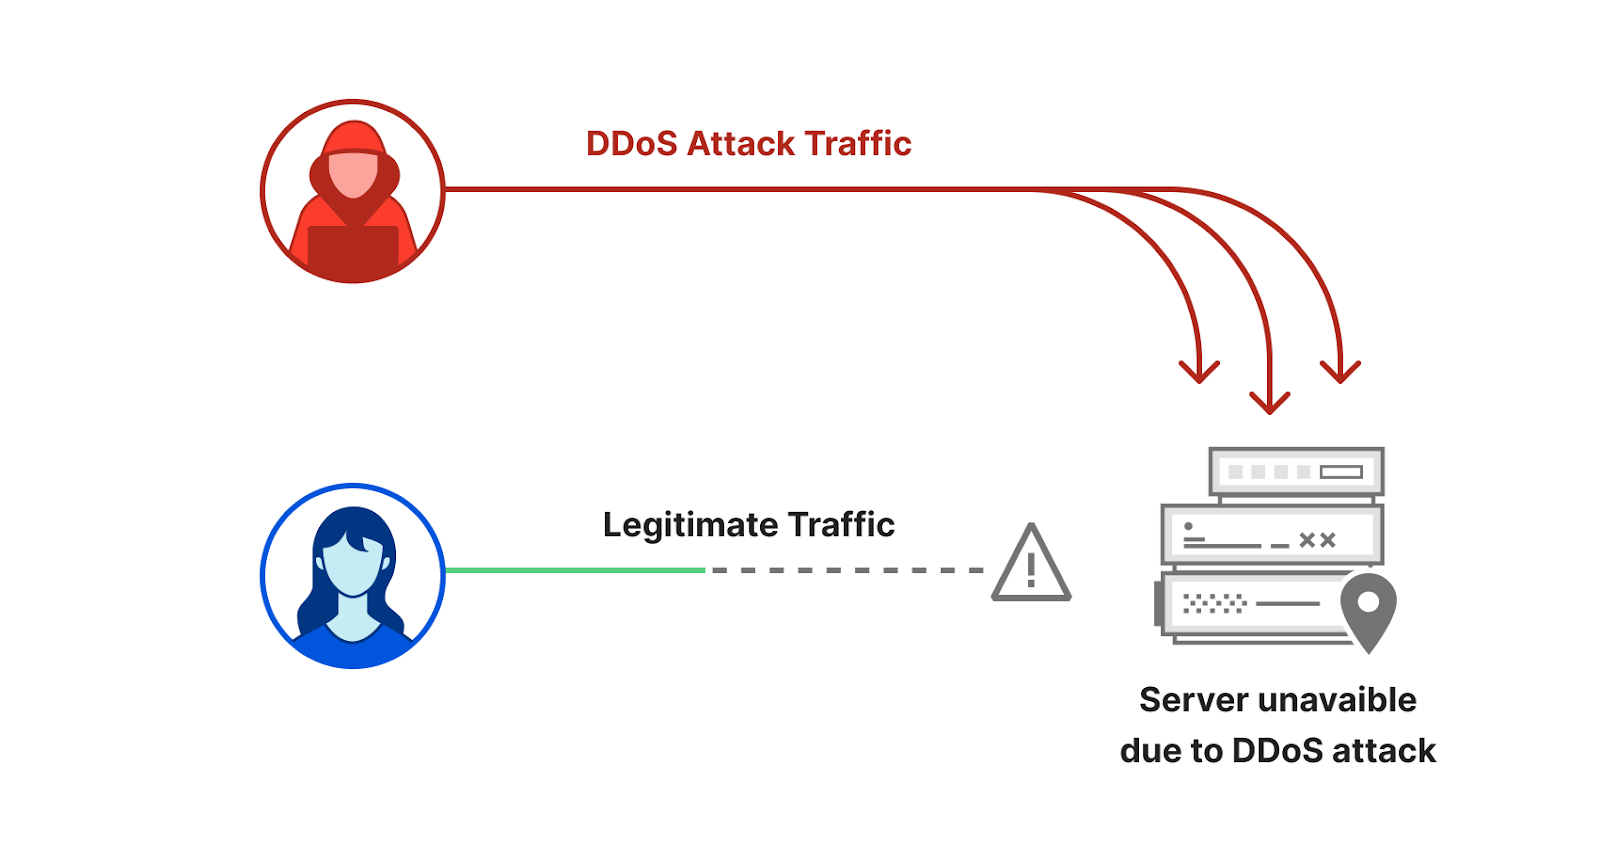
Application-layer DDoS attacks, specifically HTTP DDoS attacks, are attacks that usually aim to disrupt a web server by making it unable to process legitimate user requests. If a server is bombarded with more requests than it can process, the server will drop legitimate requests and — in some cases — crash, resulting in degraded performance or an outage for legitimate users.
Application-layer DDoS attacks by month
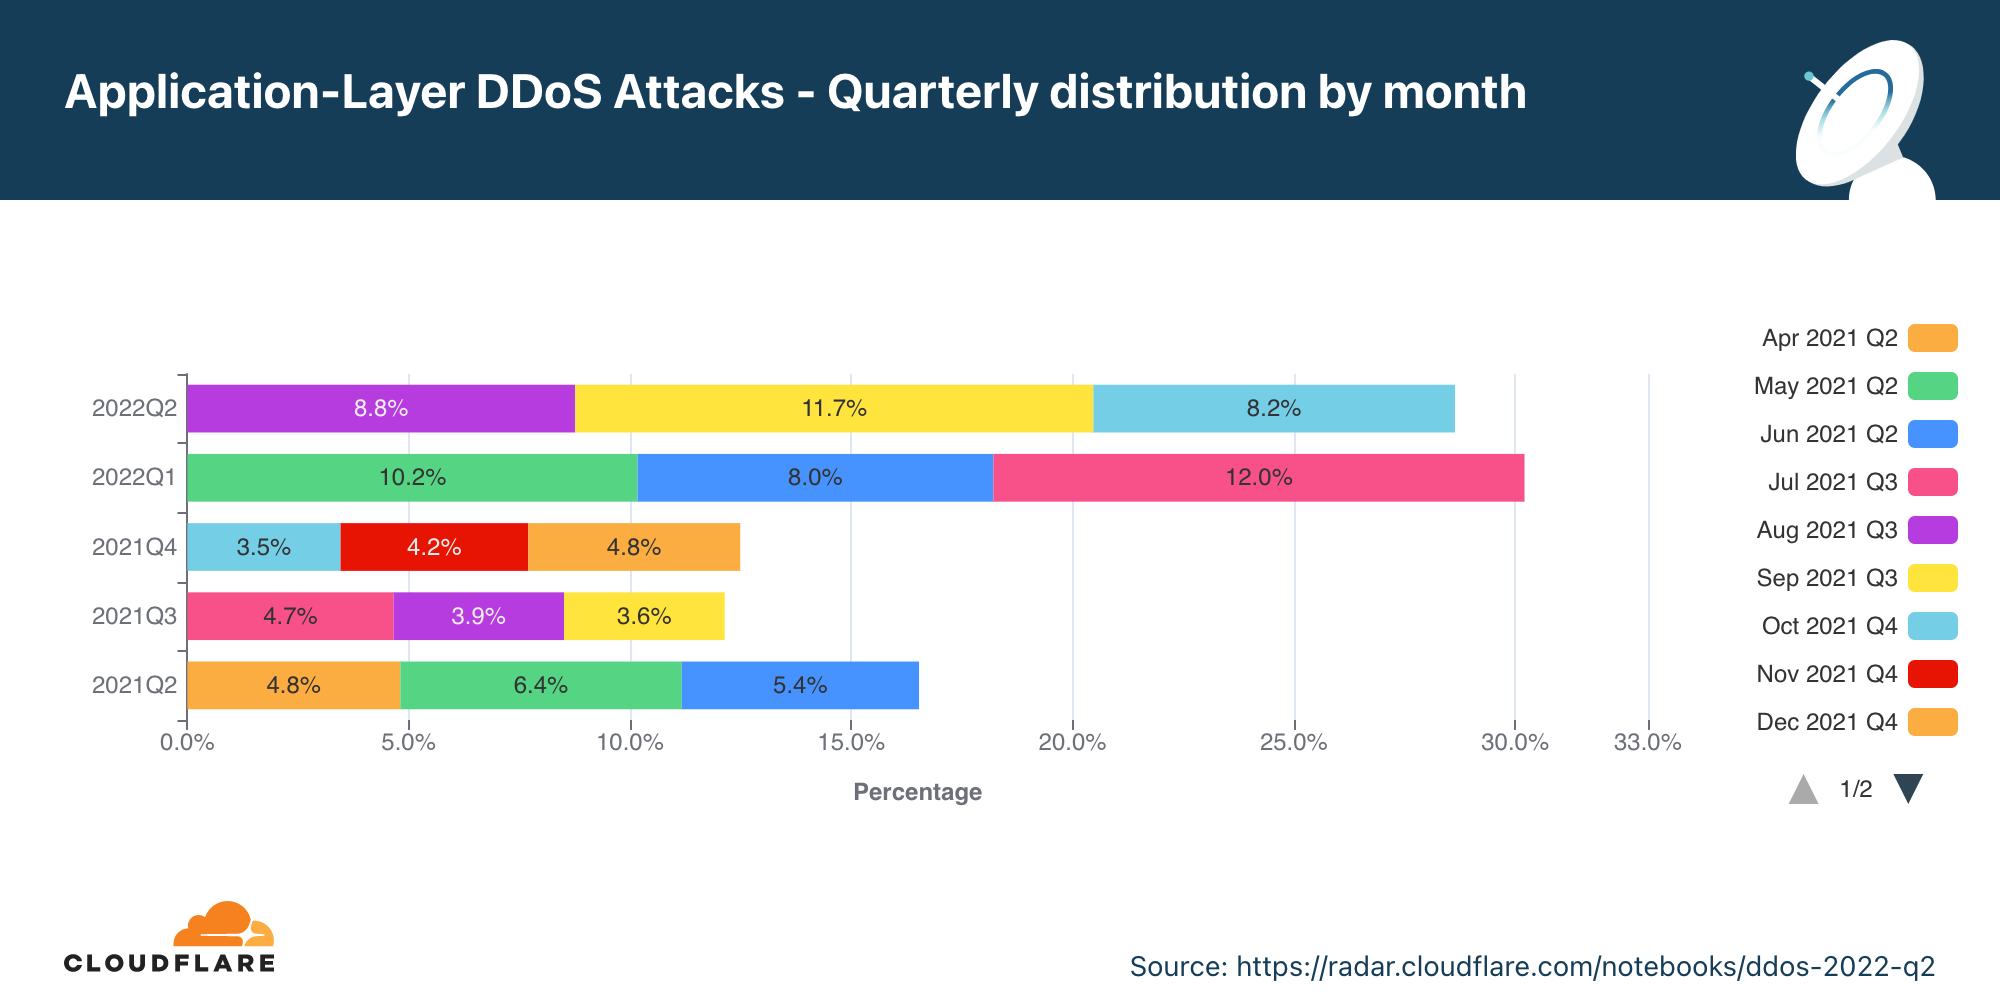
In Q2, application-layer DDoS attacks increased by 72% YoY.
Overall, in Q2, the volume of application-layer DDoS attacks increased by 72% YoY, but decreased 5% QoQ. May was the busiest month in the quarter. Almost 41% of all application-layer DDoS attacks took place in May, whereas the least number of attacks took place in June (28%).
Application-layer DDoS attacks by industry
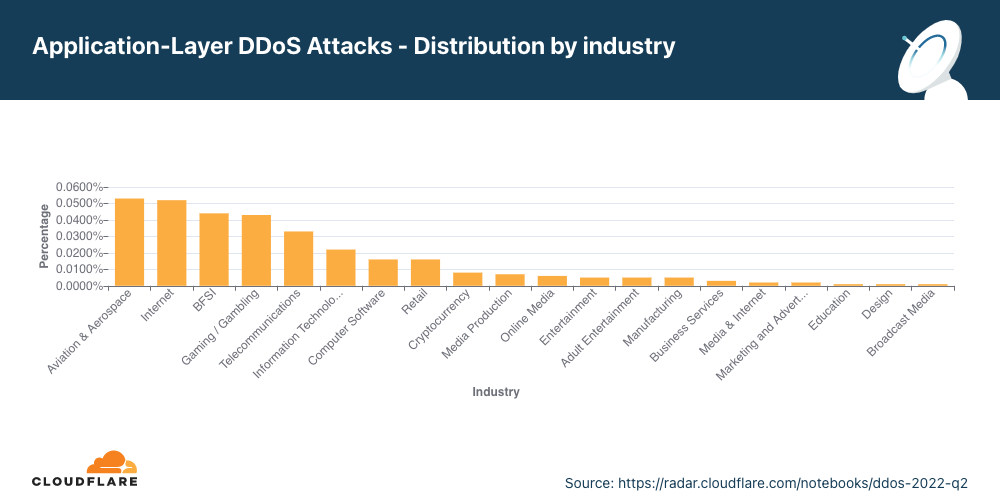
Attacks on the Aviation and Aerospace industry increased by 493% QoQ.
In Q2, Aviation and Aerospace was the most targeted industry by application-layer DDoS attacks. After it, was the Internet industry, Banking, Financial Institutions and Insurance (BFSI) industry, and in fourth place the Gaming / Gambling industry.
Ukraine and Russia cyberspace
Media and publishing companies are the most targeted in Ukraine.
As the war in Ukraine continues on the ground, in the air and on the water, so does it continue in cyberspace. Entities targeting Ukrainian companies appear to be trying to silence information. The top five most attacked industries in the Ukraine are all in broadcasting, Internet, online media, and publishing — that’s almost 80% of all DDoS Attacks targeting Ukraine.
On the other side of the war, the Russian Banks, Financial Institutions and Insurance (BFSI) companies came under the most attacks. Almost 45% of all DDoS attacks targeted the BFSI sector. The second most targeted was the Cryptocurrency industry, followed by Online media.
In both sides of the war, we can see that the attacks are highly distributed, indicating the use of globally distributed botnets.
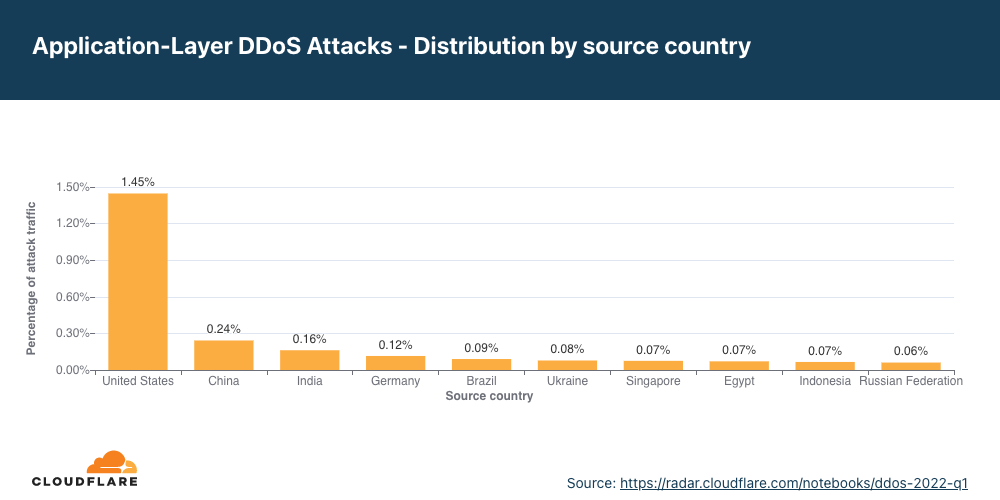
Application-layer DDoS attacks by source country
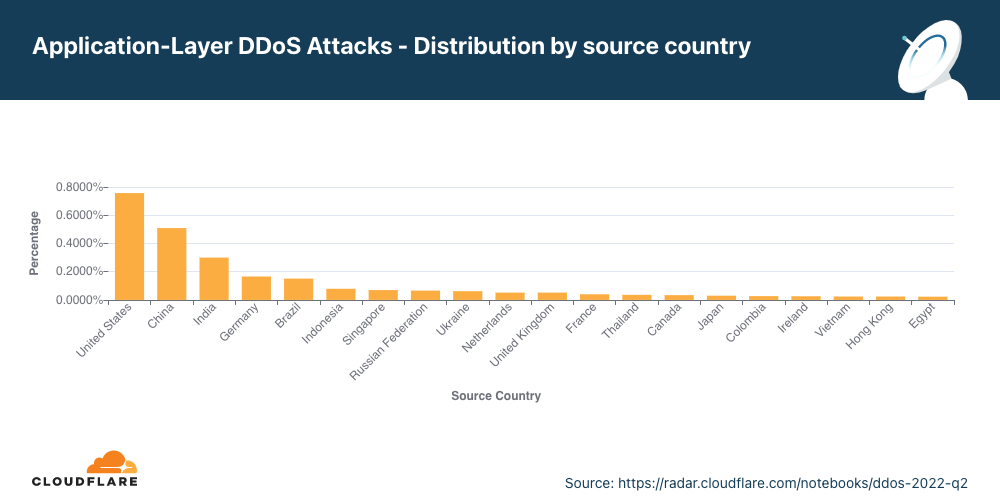
In Q2, attacks from China shrank by 78%, and attacks from the US shrank by 43%.
To understand the origin of the HTTP attacks, we look at the geolocation of the source IP address belonging to the client that generated the attack HTTP requests. Unlike network-layer attacks, source IP addresses cannot be spoofed in HTTP attacks. A high percentage of DDoS activity in a given country doesn’t mean that that specific country is launching the attacks but rather indicates the presence of botnets operating from within the country’s borders.
For the second quarter in a row, the United States tops the charts as the main source of HTTP DDoS attacks. Following the US is China in second place, and India and Germany in the third and fourth. Even though the US remained in the first place, attacks originating from the US shrank by 48% QoQ while attacks from other regions grew; attacks from India grew by 87%, from Germany by 33%, and attacks from Brazil grew by 67%.
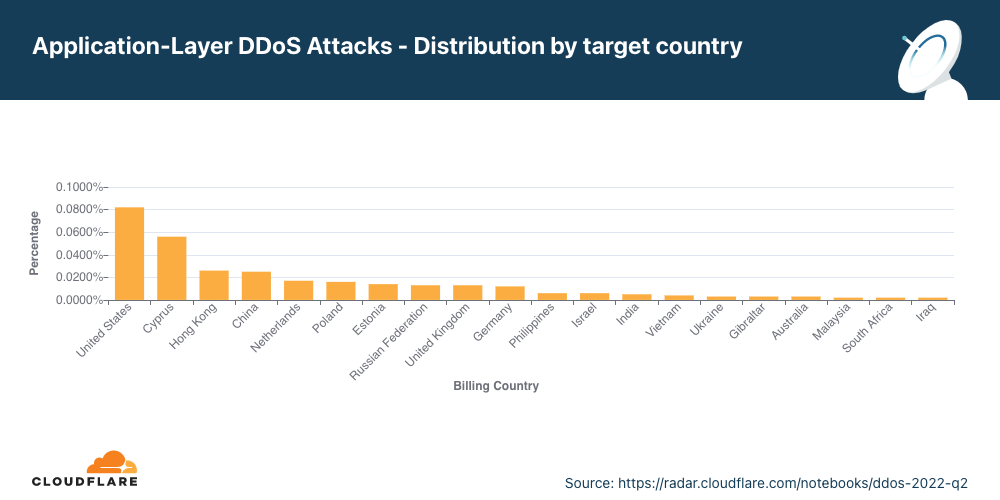
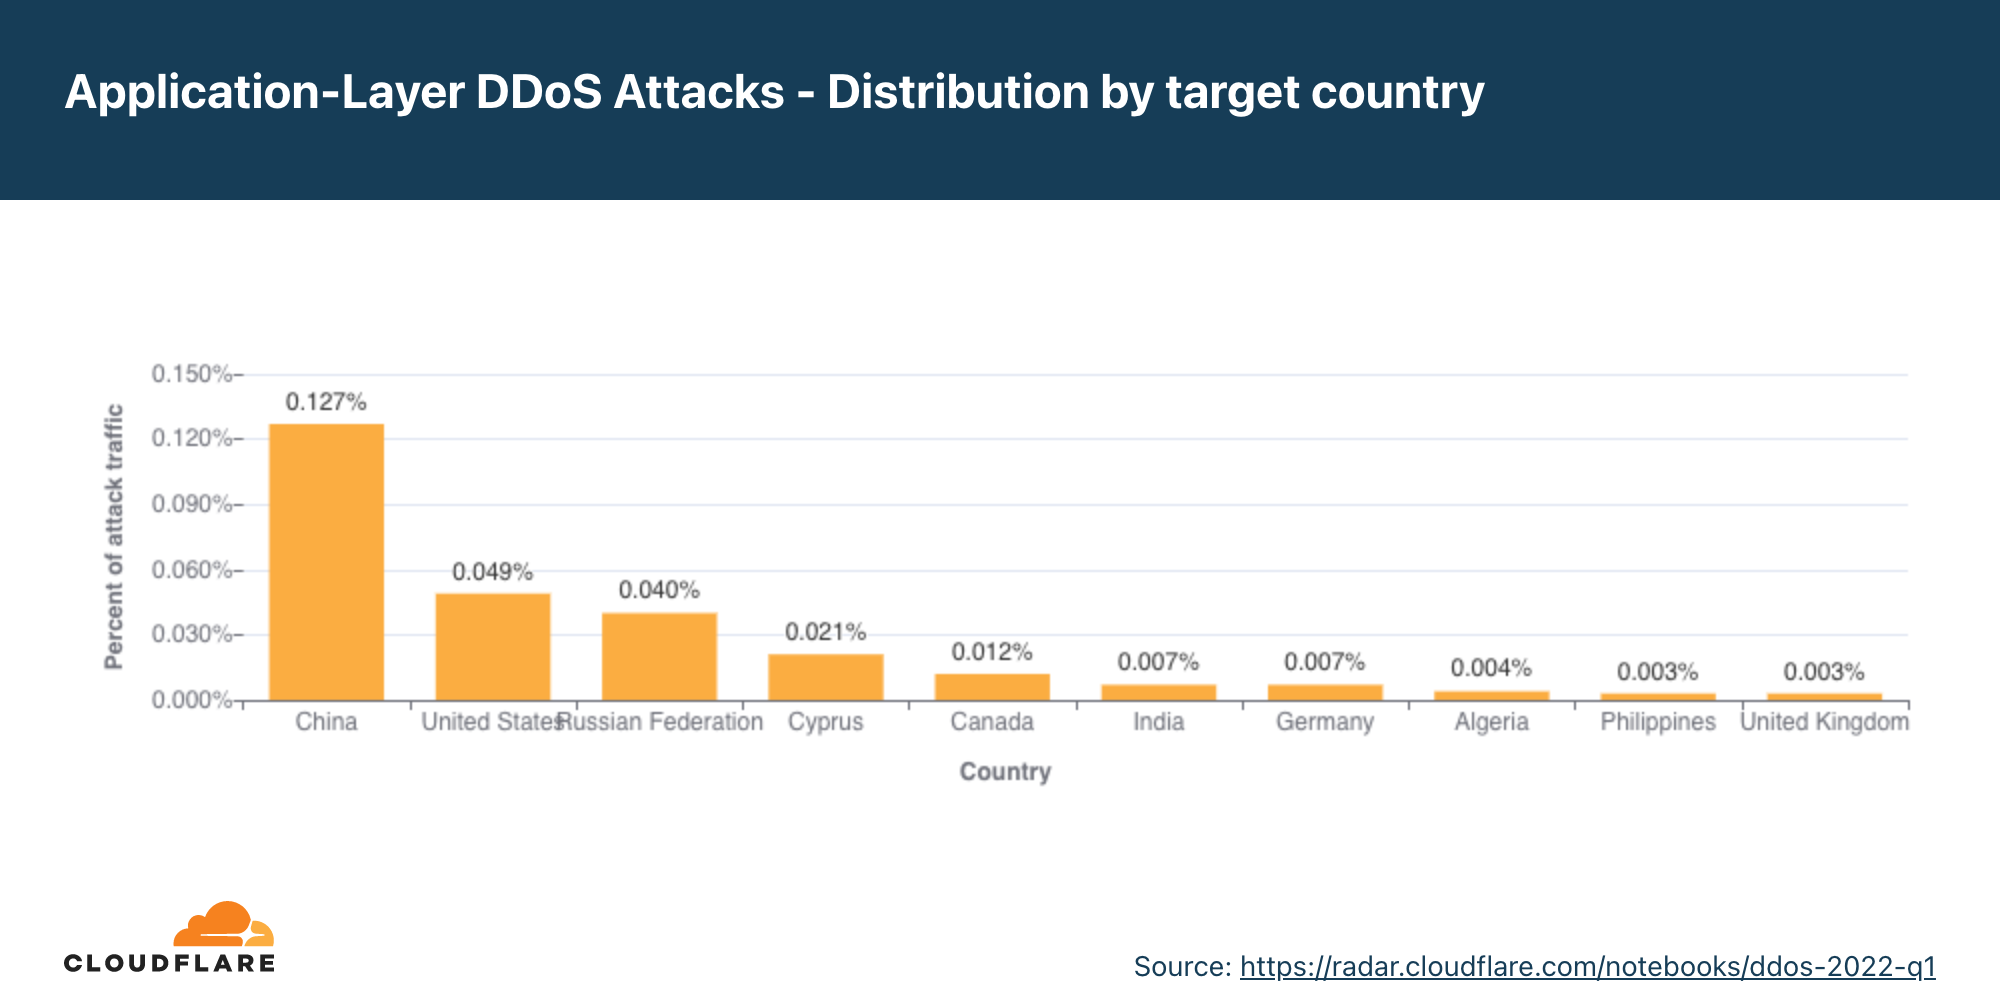
Application-layer DDoS attacks by target country
In order to identify which countries are targeted by the most HTTP DDoS attacks, we bucket the DDoS attacks by our customers’ billing countries and represent it as a percentage out of all DDoS attacks.
HTTP DDoS attacks on US-based countries increased by 67% QoQ pushing the US back to the first place as the main target of application-layer DDoS attacks. Attacks on Chinese companies plunged by 80% QoQ dropping it from the first place to the fourth. Attacks on Cyprus increase by 167% making it the second most attacked country in Q2. Following Cyprus is Hong Kong, China, and the Netherlands.
Network-layer DDoS attacks
While application-layer attacks target the application (Layer 7 of the OSI model) running the service that end users are trying to access (HTTP/S in our case), network-layer attacks aim to overwhelm network infrastructure (such as in-line routers and servers) and the Internet link itself.
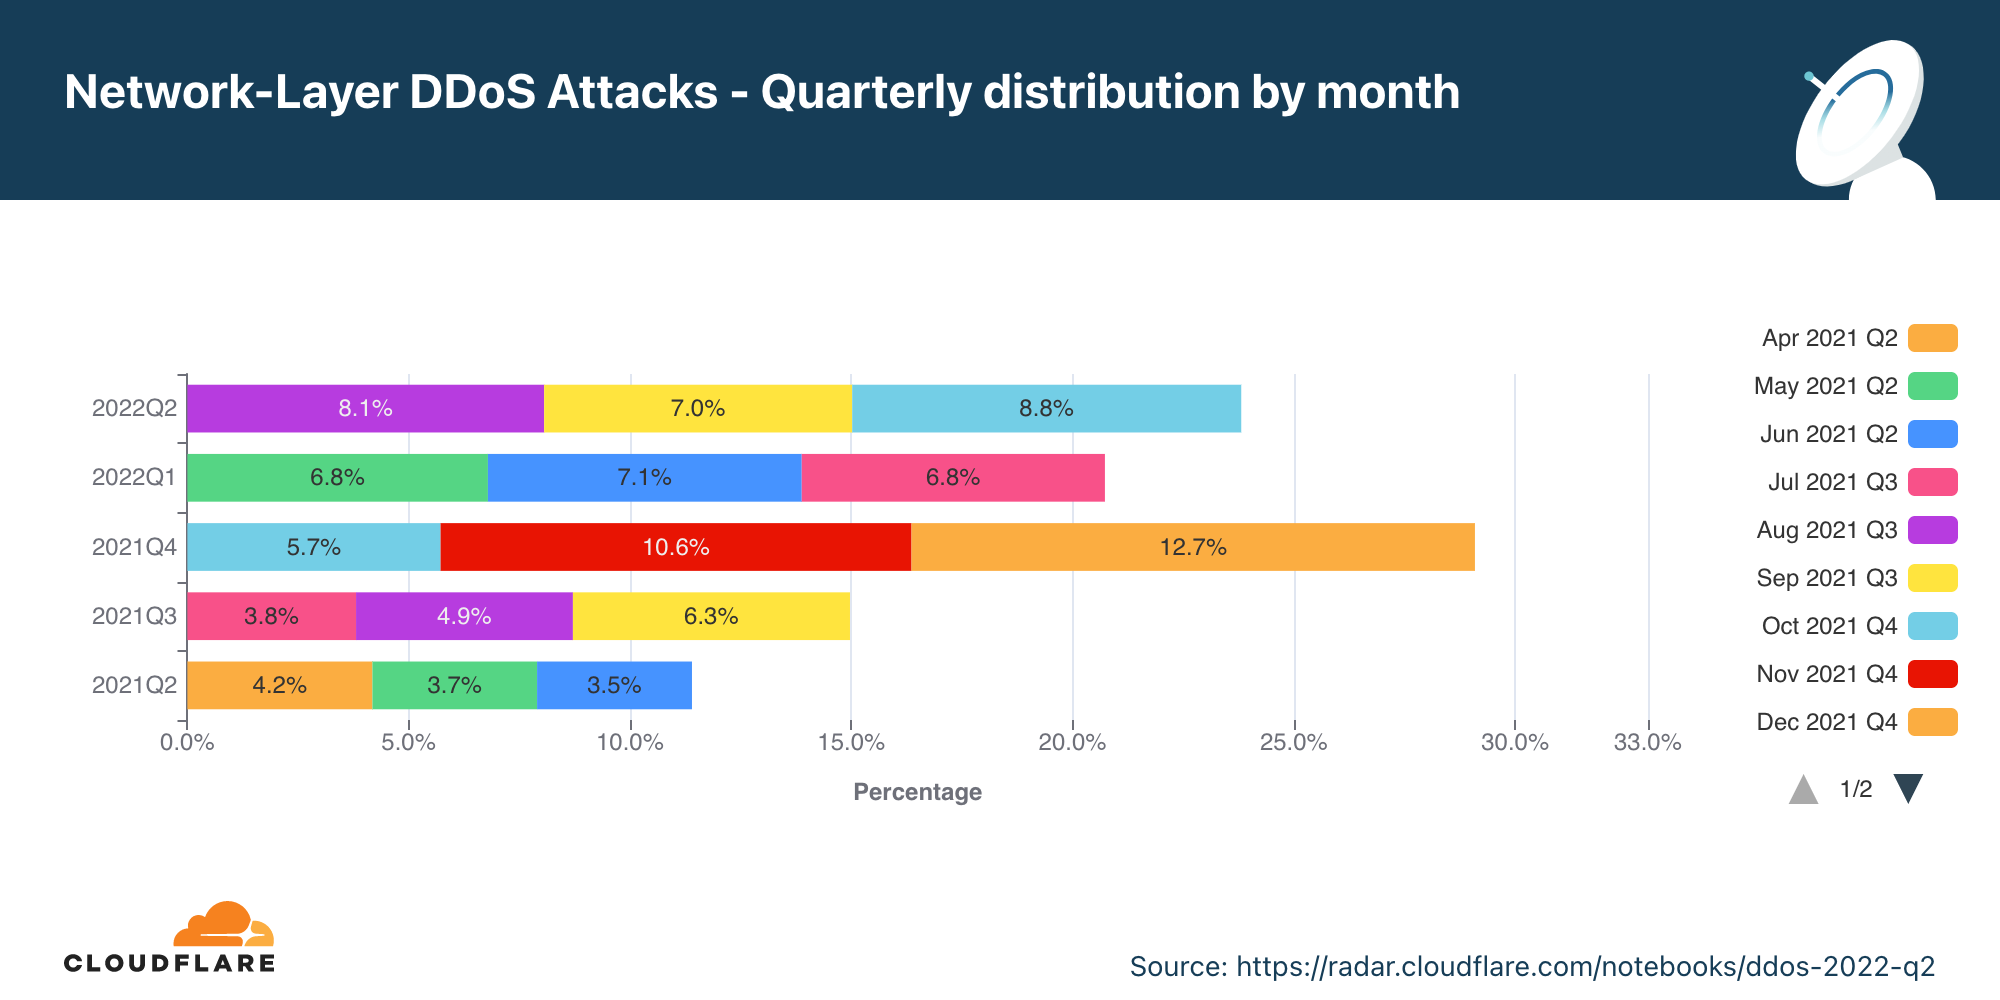
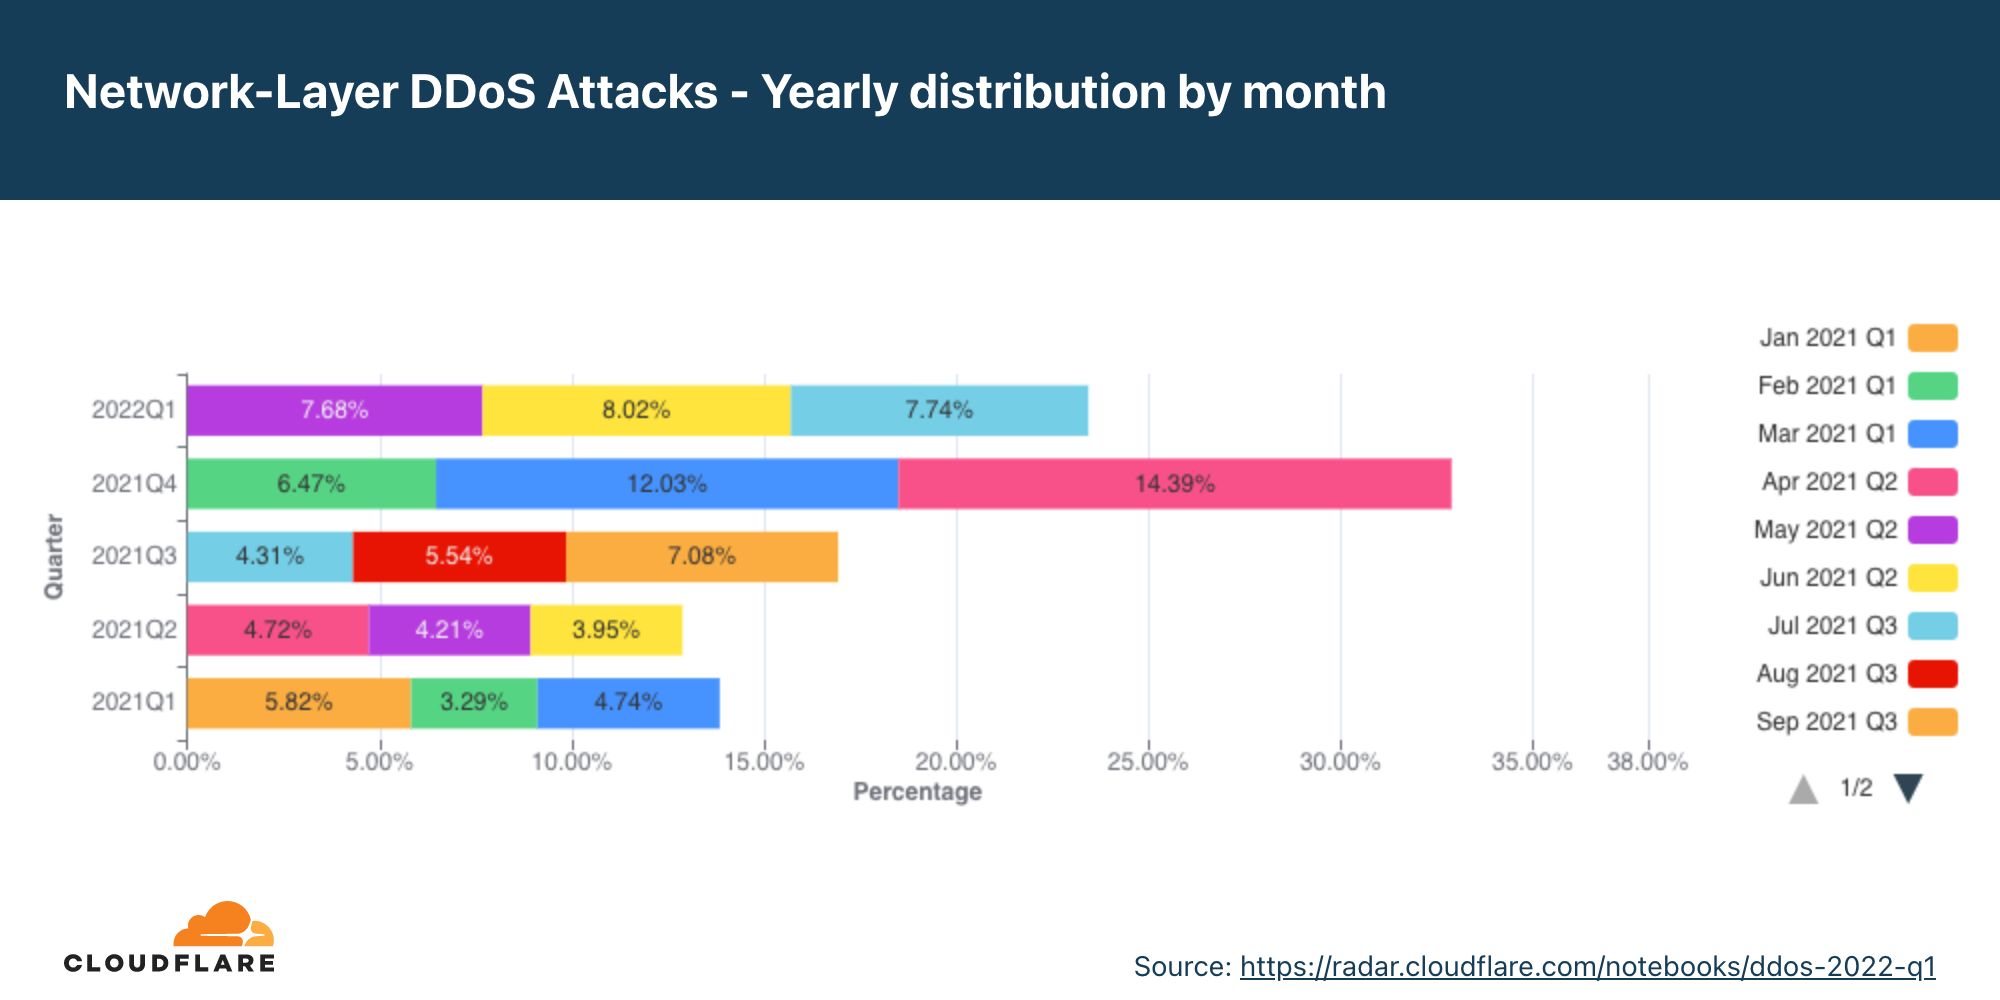
Network-layer DDoS attacks by month
In Q2, network-layer DDoS attacks increased by 109% YoY, and volumetric attacks of 100 Gbps and larger increased by 8% QoQ.
In Q2, the total amount of network-layer DDoS attacks increased by 109% YoY and 15% QoQ. June was the busiest month of the quarter with almost 36% of the attacks occurring in June.
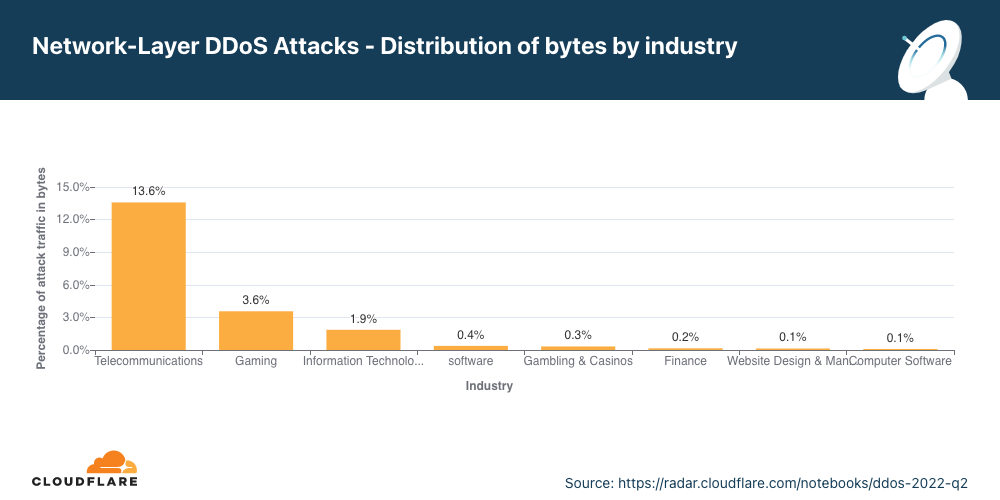
Network-layer DDoS attacks by industry
In Q2, attacks on Telecommunication companies grew by 66% QoQ.
For the second consecutive quarter, the Telecommunications industry was the most targeted by network-layer DDoS attacks. Even more so, attacks on Telecommunication companies grew by 66% QoQ. The Gaming industry came in second place, followed by Information Technology and Services companies.
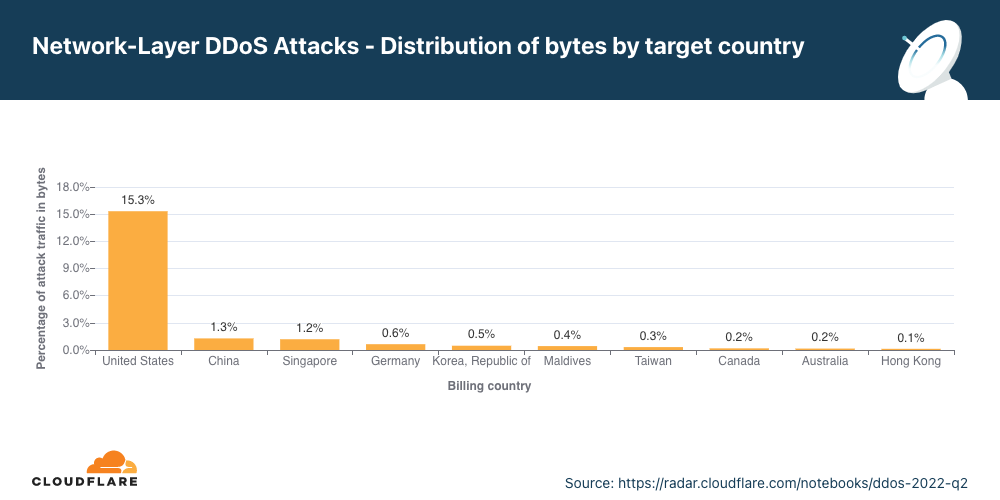
Network-layer DDoS attacks by target country
Attacks on US networks grew by 95% QoQ.
In Q2, the US remains the most attacked country. After the US came China, Singapore and Germany.
Network-layer DDoS attacks by ingress country
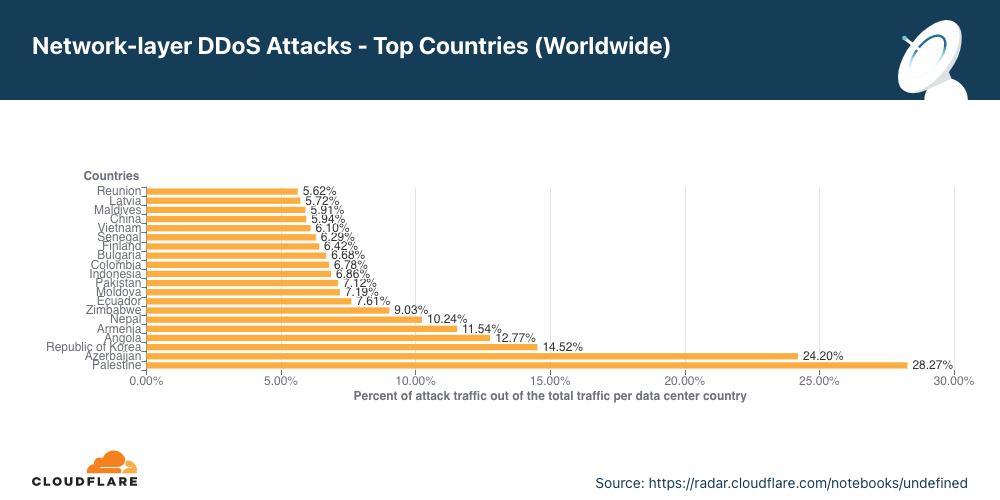
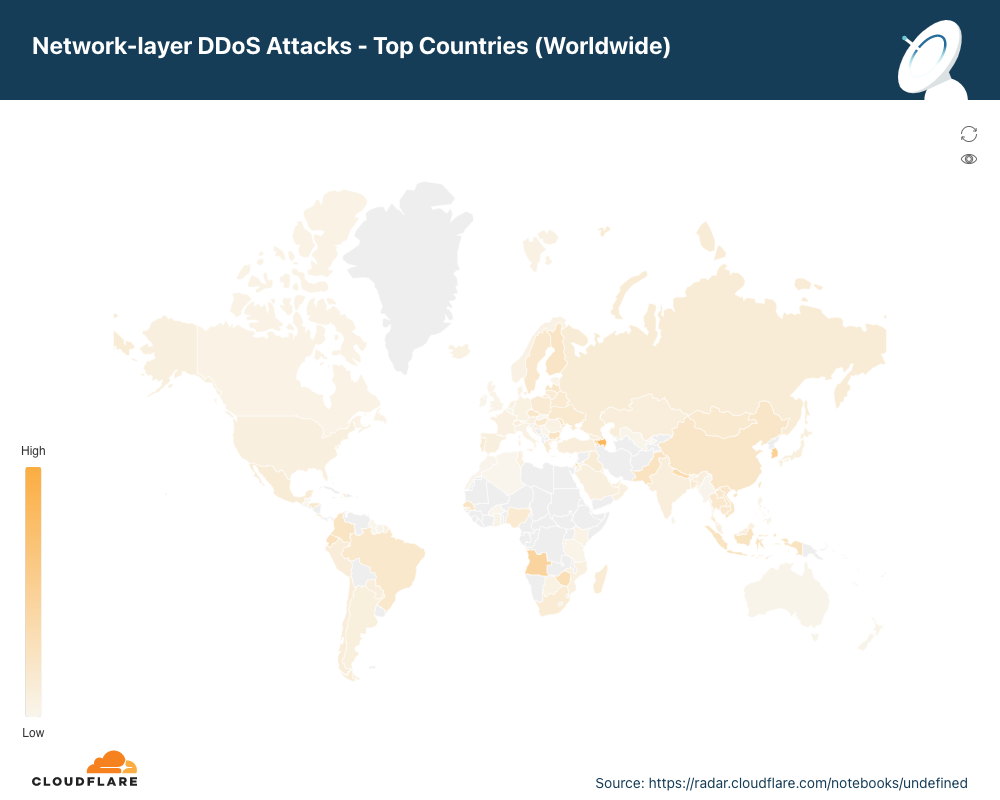
In Q2, almost a third of the traffic Cloudflare observed in Palestine and a fourth in Azerbaijan was part of a network-layer DDoS attack.
When trying to understand where network-layer DDoS attacks originate, we cannot use the same method as we use for the application-layer attack analysis. To launch an application-layer DDoS attack, successful handshakes must occur between the client and the server in order to establish an HTTP/S connection. For a successful handshake to occur, the attacks cannot spoof their source IP address. While the attacker may use botnets, proxies, and other methods to obfuscate their identity, the attacking client’s source IP location does sufficiently represent the attack source of application-layer DDoS attacks.
On the other hand, to launch network-layer DDoS attacks, in most cases, no handshake is needed. Attackers can spoof the source IP address in order to obfuscate the attack source and introduce randomness into the attack properties, which can make it harder for simple DDoS protection systems to block the attack. So if we were to derive the source country based on a spoofed source IP, we would get a ‘spoofed country’.
For this reason, when analyzing network-layer DDoS attack sources, we bucket the traffic by the Cloudflare data center locations where the traffic was ingested, and not by the (potentially) spoofed source IP to get an understanding of where the attacks originate from. We are able to achieve geographical accuracy in our report because we have data centers in over 270 cities around the world. However, even this method is not 100% accurate, as traffic may be back hauled and routed via various Internet Service Providers and countries for reasons that vary from cost reduction to congestion and failure management.
Palestine jumps from the second to the first place as the Cloudflare location with the highest percentage of network-layer DDoS attacks. Following Palestine is Azerbaijan, South Korea, and Angola.
To view all regions and countries, check out the interactive map.
Attack vectors
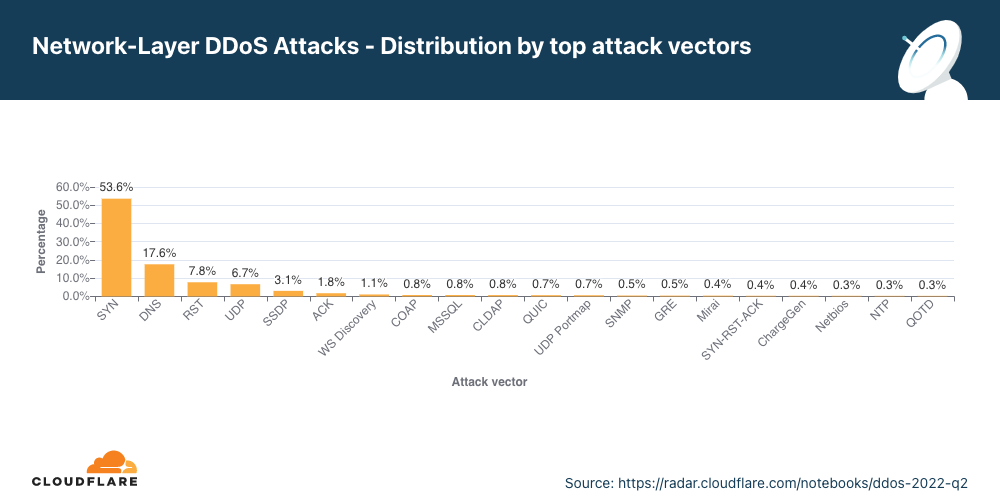
In Q2, DNS attacks increased making it the second most frequent attack vector.
An attack vector is a term used to describe the method that the attacker uses to launch their DDoS attack, i.e., the IP protocol, packet attributes such as TCP flags, flooding method, and other criteria.
In Q2, 53% of all network-layer attacks were SYN floods. SYN floods remain the most popular attack vector. They abuse the initial connection request of the stateful TCP handshake. During this initial connection request, servers don’t have any context about the TCP connection as it is new and without the proper protection may find it hard to mitigate a flood of initial connection requests. This makes it easier for the attacker to consume an unprotected server’s resources.
After the SYN floods are attacks targeting DNS infrastructure, RST floods again abusing TCP connection flow, and generic attacks over UDP.
Emerging threats
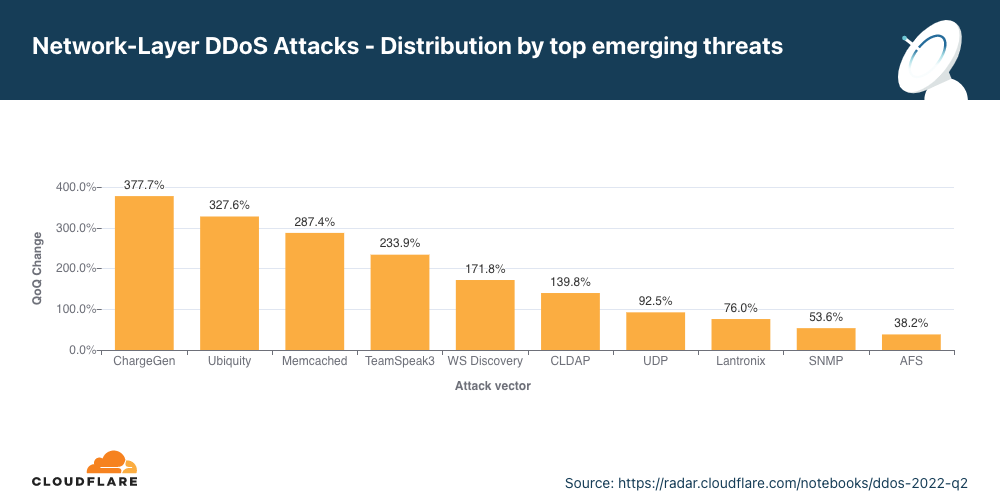
In Q2, the top emerging threats included attacks over CHARGEN, Ubiquiti and Memcached.
Identifying the top attack vectors helps organizations understand the threat landscape. In turn, this may help them improve their security posture to protect against those threats. Similarly, learning about new emerging threats that may not yet account for a significant portion of attacks, can help mitigate them before they become a significant force.
In Q2, the top emerging threats were amplification attacks abusing the Character Generator Protocol (CHARGEN), amplification attacks reflecting traffic off of exposed Ubiquiti devices, and the notorious Memcached attack.
Abusing the CHARGEN protocol to launch amplification attacks
In Q2, attacks abusing the CHARGEN protocol increased by 378% QoQ.
Initially defined in RFC 864 (1983), the Character Generator (CHARGEN) protocol is a service of the Internet Protocol Suite that does exactly what it says it does – it generates characters arbitrarily, and it doesn’t stop sending them to the client until the client closes the connection. Its original intent was for testing and debugging. However, it’s rarely used because it can so easily be abused to generate amplification/reflection attacks.
An attacker can spoof the source IP of their victim and fool supporting servers around the world to direct a stream of arbitrary characters “back” to the victim’s servers. This type of attack is amplification/reflection. Given enough simultaneous CHARGEN streams, the victim’s servers, if unprotected, would be flooded and unable to cope with legitimate traffic — resulting in a denial of service event.
Amplification attacks exploiting the Ubiquiti Discovery Protocol
In Q2, attacks over Ubiquity increased by 327% QoQ.
Ubiquiti is a US-based company that provides networking and Internet of Things (IoT) devices for consumers and businesses. Ubiquiti devices can be discovered on a network using the Ubiquiti Discovery protocol over UDP/TCP port 10001.
Similarly to the CHARGEN attack vector, here too, attackers can spoof the source IP to be the victim’s IP address and spray IP addresses that have port 10001 open. Those would then respond to the victim and essentially flood it if the volume is sufficient.
Memcached DDoS attacks
In Q2, Memcached DDoS attacks increased by 287% QoQ.
Memcached is a database caching system for speeding up websites and networks. Similarly to CHARGEN and Ubiquiti, Memcached servers that support UDP can be abused to launch amplification/reflection DDoS attacks. In this case, the attacker would request content from the caching system and spoof the victim’s IP address as the source IP in the UDP packets. The victim will be flooded with the Memcache responses which can be amplified by a factor of up to 51,200x.
Network-layer DDoS attacks by attack rate
Volumetric attacks of over 100 Gbps increase by 8% QoQ.
There are different ways of measuring the size of an L3/4 DDoS attack. One is the volume of traffic it delivers, measured as the bit rate (specifically, terabits per second or gigabits per second). Another is the number of packets it delivers, measured as the packet rate (specifically, millions of packets per second).
Attacks with high bit rates attempt to cause a denial-of-service event by clogging the Internet link, while attacks with high packet rates attempt to overwhelm the servers, routers, or other in-line hardware appliances. These devices dedicate a certain amount of memory and computation power to process each packet. Therefore, by bombarding it with many packets, the appliance can be left with no further processing resources. In such a case, packets are “dropped,” i.e., the appliance is unable to process them. For users, this results in service disruptions and denial of service.
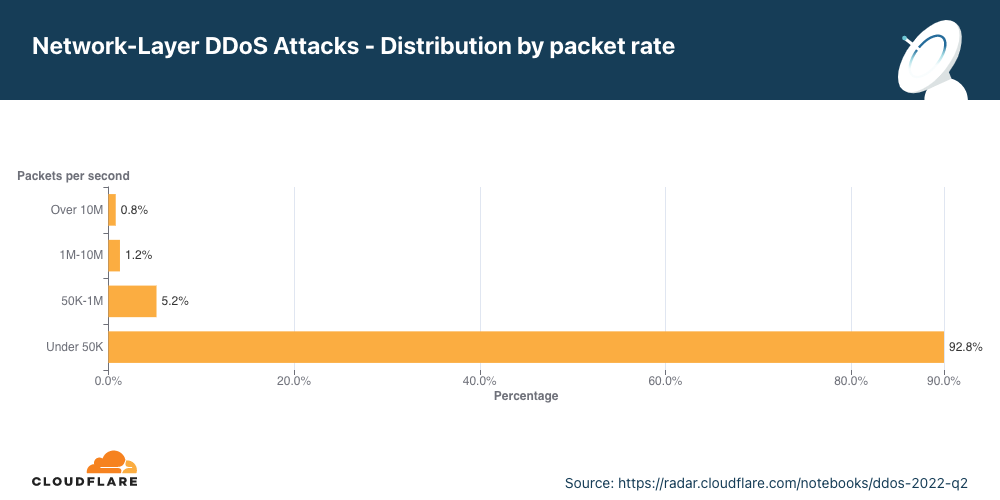
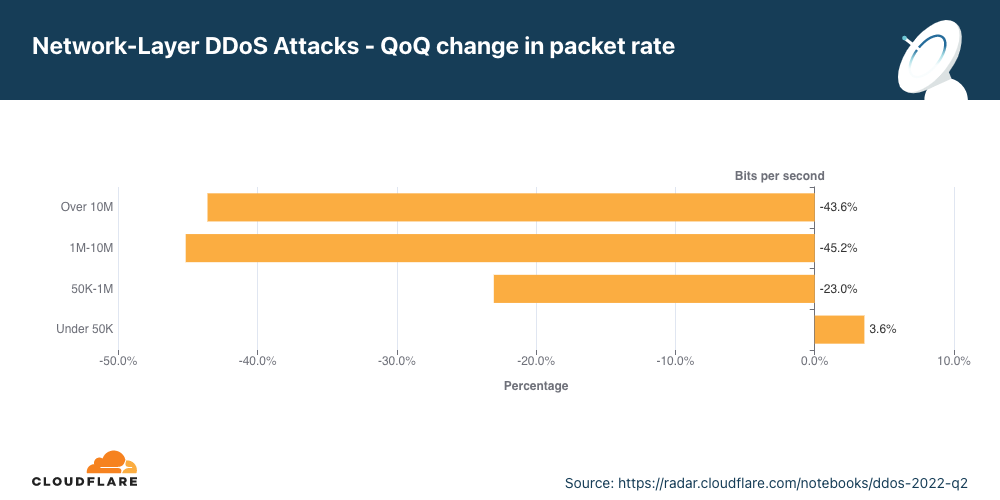
Distribution by packet rate
The majority of network-layer DDoS attacks remain below 50,000 packets per second. While 50 kpps is on the lower side of the spectrum at Cloudflare scale, it can still easily take down unprotected Internet properties and congest even a standard Gigabit Ethernet connection.
When we look at the changes in the attack sizes, we can see that packet-intensive attacks above 50 kpps decreased in Q2, resulting in an increase of 4% in small attacks.
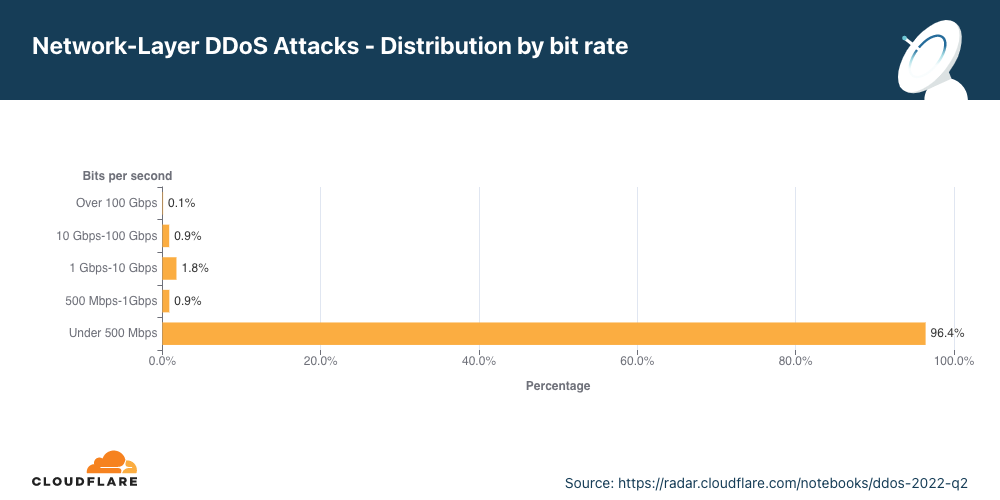
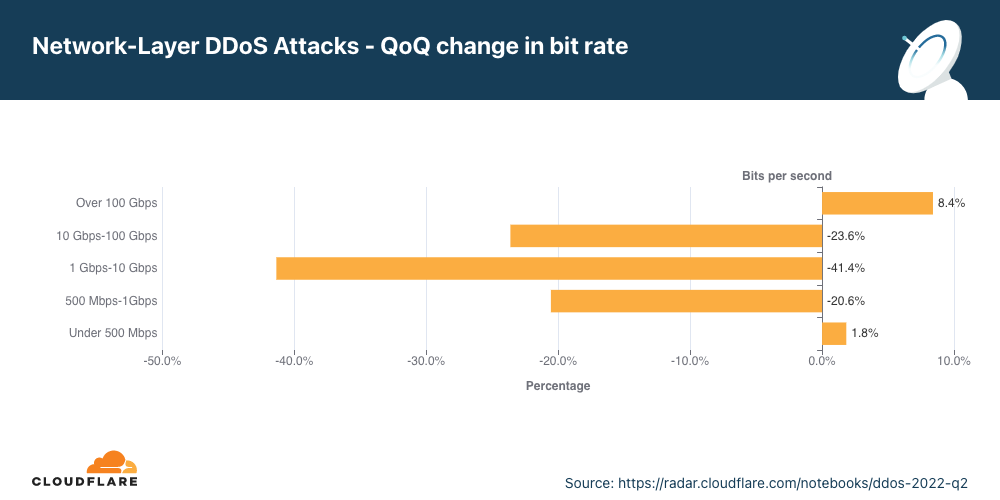
Distribution by bitrate
In Q2, most of the network-layer DDoS attacks remain below 500 Mbps. This too is a tiny drop in the water at Cloudflare scale, but can very quickly shut down unprotected Internet properties with less capacity or at the very least cause congestion for even a standard Gigabit Ethernet connection.
Interestingly enough, large attacks between 500 Mbps and 100 Gbps decreased by 20-40% QoQ, but volumetric attacks above 100 Gbps increased by 8%.
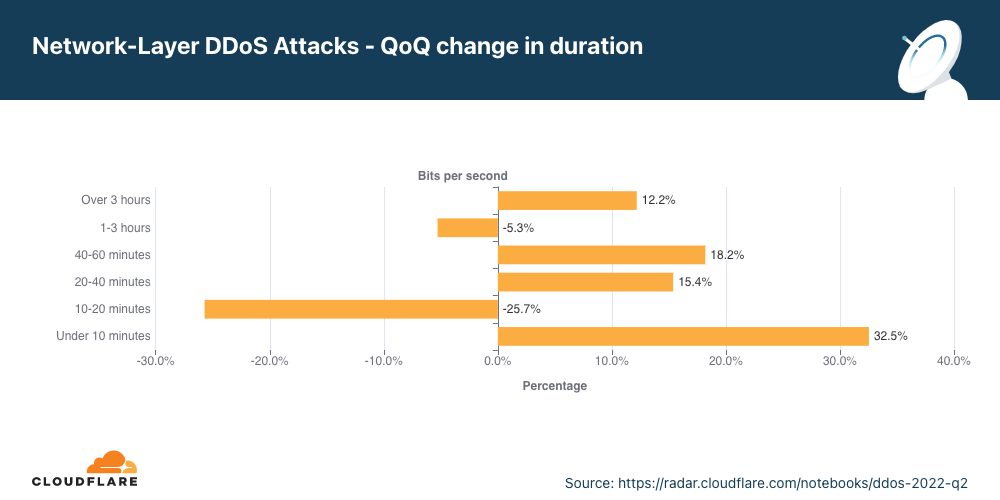
Network-layer DDoS attacks by duration
In Q2, attacks lasting over three hours increased by 9%.
We measure the duration of an attack by recording the difference between when it is first detected by our systems as an attack and the last packet we see with that attack signature towards that specific target.
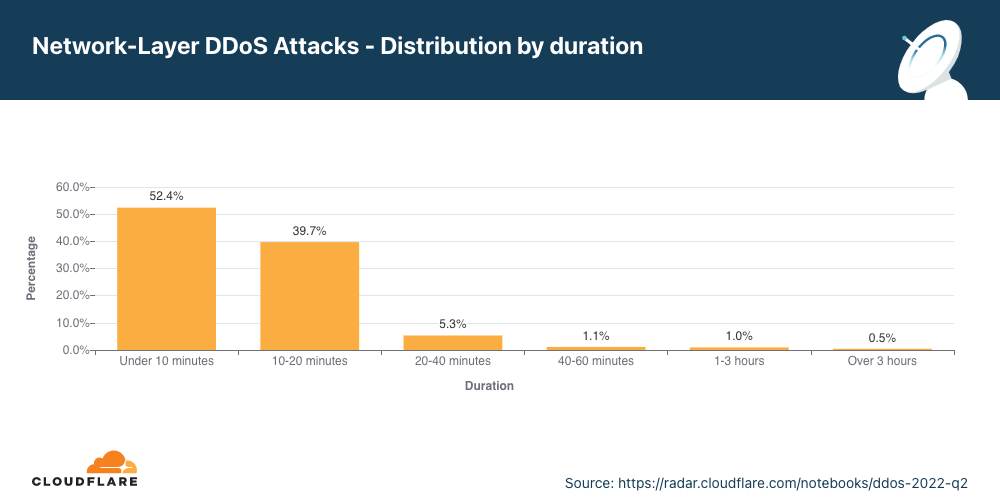
In Q2, 52% of network-layer DDoS attacks lasted less than 10 minutes. Another 40% lasted 10-20 minutes. The remaining 8% include attacks ranging from 20 minutes to over three hours.
One important thing to keep in mind is that even if an attack lasts only a few minutes, if it is successful, the repercussions could last well beyond the initial attack duration. IT personnel responding to a successful attack may spend hours and even days restoring their services.
While most of the attacks are indeed short, we can see an increase of over 15% in attacks ranging between 20-60 minutes, and a 12% increase of attacks lasting more than three hours.
Short attacks can easily go undetected, especially burst attacks that, within seconds, bombard a target with a significant number of packets, bytes, or requests. In this case, DDoS protection services that rely on manual mitigation by security analysis have no chance in mitigating the attack in time. They can only learn from it in their post-attack analysis, then deploy a new rule that filters the attack fingerprint and hope to catch it next time. Similarly, using an “on-demand” service, where the security team will redirect traffic to a DDoS provider during the attack, is also inefficient because the attack will already be over before the traffic routes to the on-demand DDoS provider.
It’s recommended that companies use automated, always-on DDoS protection services that analyze traffic and apply real-time fingerprinting fast enough to block short-lived attacks.
Summary
Cloudflare’s mission is to help build a better Internet. A better Internet is one that is more secure, faster, and reliable for everyone — even in the face of DDoS attacks. As part of our mission, since 2017, we’ve been providing unmetered and unlimited DDoS protection for free to all of our customers. Over the years, it has become increasingly easier for attackers to launch DDoS attacks. But as easy as it has become, we want to make sure that it is even easier — and free — for organizations of all sizes to protect themselves against DDoS attacks of all types.
Not using Cloudflare yet? Start now with our Free and Pro plans to protect your websites, or contact us for comprehensive DDoS protection for your entire network using Magic Transit.
Bem-vindo ao nosso relatório de DDoS do segundo trimestre de 2022. Este relatório inclui informações e tendências sobre o cenário de ameaças DDoS — conforme observado em toda a Rede global da Cloudflare. Uma versão interativa deste relatório também está disponível no Radar.
A guerra no terreno é acompanhada por ataques direcionados à distribuição de informações.
Empresas de mídia de radiodifusão na Ucrânia foram as mais visadas por ataques DDoS no segundo trimestre. Na verdade, todos os seis principais setores vitimados estão na mídia on-line/internet, publicações e radiodifusão.
Por outro lado, na Rússia, a mídia on-line deixou de ser o setor mais atacado e caiu para o terceiro lugar. No topo, estão empresas como bancos, serviços financeiros e seguros (BFSI, na sigla em inglês) do país, que foram as mais visadas no segundo trimestre; sendo vítimas de quase 50% de todos os ataques DDoS na camada de aplicativos. O segundo lugar é das empresas de criptomoedas.
Em junho de 2022, houve o maior pico do ano nos ataques DDoS com pedido de resgate até agora: um em cada cinco participantes na pesquisa que passaram por um ataque DDoS relataram ter recebido um pedido de resgate ou outras ameaças.
No T2 em geral, o percentual de ataques DDoS com pedido de resgate aumentou 11% na comparação com o trimestre anterior.
Ataques DDoS na camada de aplicativos
No segundo trimestre de 2022, houve um aumento de 44% em termos anuais nos ataques DDoS na camada de aplicativos.
Empresas nos EUA foram as maiores vítimas, seguidas por outras no Chipre, em Hong Kong e na China. Os ataques à empresas do Chipre aumentaram 171% na comparação trimestral.
O setor de aviação e aeronáutica foi o mais visado no segundo trimestre, seguido por: internet, bancos, serviços financeiros, seguros, jogos e apostas.
Ataques DDoS na camada de rede
No segundo trimestre de 2022, houve um aumento de 75% em termos anuais nos ataques DDoS na camada de rede. Ataques de 100 Gbps e mais cresceram 19% em termos trimestrais; e ataques com mais de três horas aumentaram em 9% no mesmo período.
Os setores mais atacados foram: telecomunicações, jogos/apostas e tecnologia e serviços de informação.
Empresas nos EUA foram as maiores vítimas, seguidas por outras em Singapura, na Alemanha e na China.
Este relatório é baseado nos ataques DDoS detectados e mitigados automaticamente pelos sistemas de proteção contra DDoS da Cloudflare. Para saber mais sobre como isso funciona, confira este post no blog com mais detalhes.
Uma observação sobre como medimos os ataques DDoS observados em nossa Rede
Para analisar tendências de ataques, calculamos a taxa de “atividade DDoS”, que é o percentual do tráfego de ataque com relação ao tráfego total (ataque + limpo) observado em nossa Rede global, em um local específico ou em uma determinada categoria (por exemplo, setor ou país de faturamento). Medir os percentuais nos permite normalizar os pontos de dados e evitar uma abordagem tendenciosa em números absolutos, envolvendo, por exemplo, um data center da Cloudflare que recebe mais tráfego total e, provavelmente, mais ataques.
Ataques com pedido de resgate
Nossos sistemas estão constantemente analisando o tráfego e ao detectar ataques DDoS, automaticamente aplicam a mitigação. Cada cliente que sofre um ataque DDoS recebe uma pesquisa automatizada a fim de nos ajudar a entender melhor a natureza do ataque e o êxito da mitigação.
Há mais de dois anos a Cloudflare realiza pesquisas junto a clientes que foram atacados — uma das perguntas da pesquisa destina-se a saber se eles receberam ameaças ou pedidos de resgate exigindo pagamento em troca de parar o ataque DDoS.
O número de participantes que relatou ameaças ou pedidos de resgate no segundo trimestre aumentou 11% em termos trimestrais e anuais. Durante este trimestre, mitigamos ataques DDoS com pedido de resgate realizados por entidades que alegavam ser o grupo de ameaças avançadas permanentes (APT, na sigla em inglês) conhecido como “Fancy Lazarus”. A iniciativa se concentrou em instituições financeiras e empresas de criptomoedas.
O percentual de entrevistados que relatou ter sido alvo de um ataque DDoS com resgate ou ter recebido ameaças antes do ataque.
Analisando o segundo trimestre em mais detalhes, é possível ver que em junho um em cada cinco participantes relataram ataques DDoS com pedido de resgate ou ameaças — o mês com maior volume em 2022, o mais alto desde dezembro de 2021.
Ataques DDoS na camada de aplicativos
Ataques DDoS na camada de aplicativos, especificamente ataques DDoS por HTTP, são ataques que normalmente buscam interromper um servidor web tornando-o incapaz de processar solicitações legítimas dos usuários. Se um servidor é bombardeado com mais solicitações do que consegue processar, ele descartará solicitações legítimas e — em alguns casos — irá travar, resultando na deterioração da performance ou em uma interrupção para os usuários legítimos.
Ataques DDoS na camada de aplicativos por mês
No segundo trimestre, houve um aumento de 44% em termos anuais nos ataques DDoS na camada de aplicativos.
No T2 em geral, o volume de ataques DDoS na camada de aplicativos aumentou 44% na comparação anual, mas caiu 16% em termos trimestrais. Maio foi o mês mais movimentado no trimestre. Quase 47% de todos os ataques DDoS na camada de aplicativos ocorreu em maio, ao passo que o mês de junho foi o que teve o menor número de ataques (18%).
Ataques DDoS na camada de aplicativos por setor
Ataques ao setor de aviação e aeronáutica cresceram 256% em termos trimestrais
No segundo trimestre, o setor de aviação e aeronáutica foi o mais visado com ataques DDoS na camada de aplicativos. Depois, estão os setores de bancos, instituições financeiras e seguros (BFSI), e em terceiro lugar o setor de jogos/apostas.
Espaços cibernéticos da Ucrânia e da Rússia
Empresas de mídia e publicação são as mais visadas na Ucrânia.
Enquanto a guerra na Ucrânia continua em campo, no ar e na água, outra guerra é travada no espaço cibernético. Entidades que visam empresas ucranianas parecem estar tentando silenciar informações. Os seis setores mais atacados na Ucrânia estão todos em radiodifusão, internet, mídia on-line e publicação — quase 80% de todos os ataques DDoS ao país.
No outro lado da guerra, bancos, instituições financeiras e empresas de seguro (BFSI) da Rússia são os que sofreram mais ataques. Quase 50% de todos os ataques DDoS foram contra o setor de BFSI. O segundo setor mais visado é o de criptomoedas, seguido por mídia on-line.
Em ambos os lados da guerra, é possível ver que os ataques são altamente distribuídos, o que indica o uso de botnets distribuídas globalmente.
Ataques DDoS na camada de aplicativos por país de origem
No segundo trimestre, os ataques da China aumentaram 112, enquanto dos EUA diminuíram 43%.
Para entender a origem dos ataques HTTP, analisamos a geolocalização do endereço de IP de origem do cliente que gerou as solicitações HTTP de ataque. Ao contrário dos ataques na camada de rede, os IPs de origem não podem ser falsificados em ataques HTTP. Uma alta porcentagem de atividade DDoS em um determinado país não indica que os ataques estão vindo desse local, mas significa que há botnets funcionando dentro das fronteiras da nação em questão.
Pelo segundo trimestre consecutivo, os Estados Unidos estão no topo da lista como principal origem de ataques DDoS por HTTP. Logo depois estão China, Índia e Alemanha. Mesmo que os EUA tenham permanecido em primeiro lugar, os ataques com origem no país tiveram uma queda de 43% em termos trimestrais, ao passo que os originados em outras regiões aumentaram (China em 112%, Índia em 89% e Alemanha em 80%).
Ataques DDoS na camada de aplicativos por país-alvo
A fim de identificar quais países eram visados pela maioria dos ataques DDoS por HTTP, agrupamos os ataques DDoS pelos países de faturamento de nossos clientes e os representamos como porcentagem em relação ao total de ataques DDoS.
Ataques DDoS por HTTP em países baseados nos EUA aumentaram 45% na comparação trimestral, levando os EUA ao primeiro lugar como principal alvo de ataques DDoS na camada de aplicativos. Ataques a empresas chinesas diminuíram 79% em termos trimestrais, aindo do primeiro para o quarto lugar. Ataques no Chipre aumentaram 171%, o que tornou o país o segundo mais atacado no segundo trimestre, seguido por Hong Kong, China e Polônia.
Ataques DDoS na camada de rede
Enquanto os ataques na camada de aplicativo visam o aplicativo (Camada 7 do Modelo OSI) que executa o serviço que os usuários finais estão tentando acessar (HTTP/S em nosso caso), os ataques na camada de rede visam sobrecarregar a infraestrutura de rede (como roteadores e servidores internos) e a próprio link com da internet.
Ataques DDoS na camada de rede por mês
No segundo trimestre, houve um aumento de 75% em termos anuais nos ataques DDoS na camada de rede; e uma alta de 19% na comparação trimestral em ataques volumétricos de 100 Gbps e mais.
No segundo trimestre, o número total de ataques DDoS à camada de rede aumentou 75% em termos anuais, mas não mudou muito em comparação com o trimestre anterior. Abril foi o mês mais movimentado do trimestre, com quase 40% dos ataques.
Ataques DDoS na camada de rede por setor
No segundo trimestre, ataques a empresas de telecomunicações cresceram 45% em termos trimestrais.
Pelo segundo trimestre consecutivo, o setor de telecomunicações foi o mais visado por ataques DDoS na camada de rede. Além disso, os ataques a empresas de telecomunicações cresceram 45% em termos trimestrais. O setor de jogos ficou em segundo lugar, seguido por empresas de tecnologia e serviços de informação.
Ataques DDoS na camada de rede por país-alvo
Aumento de 70% em termos trimestrais nos ataques a redes dos EUA
No segundo trimestre, os EUA continuaram sendo o país mais atacado, seguido por Singapura, que saltou para o segundo lugar em relação ao quarto no trimestre anterior. Logo depois, em terceiro, está a Alemanha, seguida por China, Maldivas e Coreia do Sul.
Ataques DDoS na camada de rede por país de entrada
No segundo trimestre, quase um terço do tráfego observado pela Cloudflare na Palestina e no Azerbaijão foi parte de um ataque DDoS à camada de rede.
Ao tentar entender onde fica a origem de ataques DDoS na camada de rede, não podemos seguir o mesmo método usado para a análise de ataques na camada de aplicativos. Para que um ataque DDoS na camada de aplicativos aconteça, é preciso ocorrer handshakes bem-sucedidos entre o cliente e o servidor, a fim de estabelecer uma conexão HTTP/S. E para um handshake bem-sucedido acontecer, os ataques não podem falsificar o endereço de IP da origem. Embora o invasor possa usar botnets, proxies e outros métodos para ofuscar a identidade, o local do IP de origem do cliente, que faz o ataque, representa adequadamente a origem de ataques DDoS na camada de aplicativos.
Por outro lado, para lançar ataques DDoS na camada de rede, na maioria dos casos, não é necessário nenhum handshake. Os invasores podem falsificar o endereço de IP de origem para ofuscar a origem do ataque e introduzir aleatoriedade nas propriedades do ataque, o que pode dificultar que sistemas simples de proteção contra DDoS bloqueiem o ataque. Dessa forma, se formos tentar descobrir o país de origem com base em um endereço de IP falsificado, obteríamos um “país falsificado”.
Por esse motivo, ao analisar origens de ataques DDoS na camada de rede, dividimos o tráfego pelos locais de data centers da Cloudflare em que o tráfego foi ingerido, e não pelo IP de origem (possivelmente) falsificado, para entender melhor de onde os ataques vêm. Conseguimos ter precisão geográfica em nosso relatório porque temos data centers em mais de 270 cidades em todo o mundo. No entanto, até esse método não é 100% preciso, pois o tráfego pode passar por backhaul e ser direcionado por meio de diversos provedores de internet e países, por motivos que variam da redução de custos até à gestão de falhas e congestionamentos.
A Palestina saiu do segundo para o primeiro lugar como local da Cloudflare com maior percentual de ataques DDoS à camada de rede, seguida por Azerbaijão, Coreia do Sul e Angola.
Para visualizar todas as regiões e países, confira o mapa interativo.
Vetores de ataque
No segundo trimestre, houve um aumento dos ataques de DNS, e essa modalidade se tornou o segundo vetor de ataque mais frequente.
Vetor de ataque é o termo usado para descrever o método usado pelo invasor para lançar um ataque DDoS. Por exemplo, o protocolo IP, atributos de pacote, como sinalizadores TCP, método de inundação e outros critérios.
No segundo trimestre, 56% de todos os ataques na camada de rede foram inundações SYN, que ainda são o vetor de ataque mais popular e exploram a solicitação de conexão inicial do handshake TCP com estado. Durante essa solicitação de conexão inicial, os servidores não têm nenhum contexto sobre a conexão TCP, pois ela é nova; e sem a proteção adequada, pode ser difícil mitigar uma inundação de solicitações de conexão inicial. Assim fica mais fácil para o invasor consumir os recursos de um servidor desprotegido.
Após as inundações SYN, estão os ataques direcionados à infraestrutura DNS, inundações RST que exploram o fluxo de conexão TCP e ataques genéricos por UDP.
Ameaças emergentes
No segundo trimestre, as principais ameaças emergentes incluíram ataques por CHARGEN, Ubiquiti e Memcached.
Identificar os principais vetores de ataques ajuda as empresas a entender o cenário de ameaças. Por sua vez, isso as ajuda a melhorar a postura de segurança para se protegerem contra essas ameaças. Da mesma forma, aprender sobre novas ameaças emergentes, que ainda não representam uma parte significativa dos ataques, pode ajudar a mitigá-los antes que se tornem uma força expressiva.
No segundo trimestre, as principais ameaças emergentes foram ataques de amplificação que exploram o protocolo gerador de caracteres (CHARGEN), que desviam o tráfego de dispositivos Ubiquiti expostos e o conhecido ataque Memcached.
Abuso do protocolo CHARGEN para realizar ataques de amplificação
No segundo trimestre, ataques ao protocolo CHARGEN aumentaram 378% em termos trimestrais.
Definido inicialmente em RFC 864 (1983), o protocolo gerador de caracteres (CHARGEN) é um serviço da pilha de protocolos de internet que faz exatamente isso: gera caracteres de forma aleatória e não para de enviá-los ao cliente até ele encerrar a conexão. A intenção original era fazer teste e depuração. No entanto, é raramente usado, porque é muito fácil de explorar para gerar ataques de reflexão/amplificação.
Um invasor pode falsificar o IP de origem da vítima e enganar os servidores de apoio em todo o mundo para direcionar um fluxo de caracteres aleatórios “de volta” os servidores da vítima. Esse tipo de ataque é de reflexão/amplificação. Dependendo do número de fluxos CHARGEN simultâneos, se os servidores da vítima estiverem desprotegidos, serão inundados e não conseguirão processar o tráfego legítimo — resultando em um evento de negação de serviço.
Ataques de amplificação que exploram o protocolo de descoberta Ubiquiti
No segundo trimestre, ataques por Ubiquiti aumentaram 313% em termos trimestrais.
Ubiquiti é uma empresa americana que oferece dispositivos de Internet of Things (IoT) a consumidores e empresas. Os dispositivos da Ubiquiti podem ser descobertos em uma rede pelo protocolo de descoberta Ubiquiti na porta UDP/TCP 10001.
Semelhante ao vetor de ataque CHARGEN, os invasores podem falsificar o IP de origem para o endereço de IP da vítima e pulverizar os endereços de IP que estão com a porta 10001 aberta. Esses então responderiam à vítima e inundariam se o volume for suficiente.
Ataque DDoS ao Memcached
No segundo trimestre, ataques DDoS ao Memcached cresceram 281% em termos trimestrais.
Memcached é um sistema de caching de banco de dados para acelerar sites e redes. Semelhante ao CHARGEN e Ubiquiti, os servidores Memcached compatíveis com UDP podem ser aproveitados para iniciar ataques DDoS de amplificação/reflexão. Nesse caso, o invasor solicita conteúdo do sistema de caching e falsificam o endereço de IP da vítima como IP de origem nos pacotes UDP. A vítima será inundada com as respostas Memcache, que podem ser amplificadas por um fator de até 51.200x.
Ataques DDoS na camada de rede por taxa de ataque
Ataques volumétricos de mais de 100 Gbps aumentaram 19% em termos trimestrais. Ataques com mais de três horas cresceram 9%.
Existem diferentes maneiras de medir o tamanho de um ataque DDoS nas camadas 3 e 4. Uma é o volume de tráfego que ele fornece, medido como taxa de bits (especificamente, terabits por segundo ou gigabits por segundo). Outra é o número de pacotes que ele entrega, medido como taxa de pacotes (especificamente, milhões de pacotes por segundo).
Os ataques com altas taxas de bits tentam causar um evento de negação de serviço saturando a conexão com a internet, enquanto os ataques com altas taxas de pacotes tentam sobrecarregar os servidores, roteadores ou outros dispositivos de hardware em linha. Os dispositivos dedicam uma certa quantidade de memória e capacidade de computação para processar cada pacote. Portanto, ao bombardeá-los com muitos pacotes, os dispositivos podem ficar sem recursos de processamento. Nesse caso, os pacotes são “descartados,” ou seja, o dispositivo não consegue processá-los. Para os usuários, isso resulta em interrupções e em negação de serviço.
Distribuição por taxa de pacotes
A maioria dos ataques DDoS na camada de rede permanecem abaixo de 50 mil pacotes por segundo. Embora 50 kpps esteja no lado inferior do espectro na escala da Cloudflare, isto ainda pode derrubar facilmente ativos da internet desprotegidos e congestionar até mesmo uma conexão Ethernet Gigabit padrão.
Ao analisar as mudanças nos tamanhos dos ataques, vemos que houve uma queda em ataques com uso intenso de pacotes acima de 50 kpps no segundo trimestre, resultando em um aumento de 4% nos ataques menores.
Distribuição por taxa de bits
No segundo trimestre, a maioria dos ataques DDoS na camada de rede ficaram abaixo de 500 Mbps. Também é uma gota no oceano se pensarmos na escala da Cloudflare, mas que pode desconectar rapidamente ativos da internet desprotegidos com menos capacidade ou até congestionar uma conexão Ethernet Gigabit padrão.
É interessante ver que ataques grandes entre 500 Mbps e 100 Gbps diminuíram de 20% a 40% em termos trimestrais, mas ataques volumétricos acima de 100 Gbps cresceram 8%.
Ataques DDoS na camada de rede por duração
No segundo trimestre, ataques com mais de três horas aumentaram 9%.
Medimos a duração de um ataque registrando a diferença entre quando ele foi detectado pela primeira vez por nossos sistemas como um ataque e o último pacote que vimos com a assinatura desse ataque no alvo específico.
No segundo trimestre, 51% dos ataques DDoS à camada de rede duraram menos de 10 minutos, e 41% duraram de 10 a 20 minutos. Os 8% restantes incluem ataques que vão de 20 minutos até mais de 3 horas.
Vale lembrar que mesmo quando um ataque tem apenas alguns minutos, se ele for bem-sucedido, as consequências podem durar mais do que o próprio ataque. Os profissionais de TI que lidam com ataques bem-sucedidos podem passar horas e até dias restaurando serviços.
Embora a maioria dos ataques realmente sejam curtos, é possível ver um aumento de mais de 15% em ataques de 20 a 60 minutos, bem como um crescimento de 12% em ataques com mais de 3 horas.
Ataques curtos podem facilmente passar despercebidos, especialmente ataques burst que, em segundos, bombardeiam um alvo com um número significativo de pacotes, bytes ou solicitações. Nesse caso, os serviços de proteção contra DDoS, que contam com mitigação manual por meio de análise de segurança, não conseguem mitigar o ataque a tempo. Eles podem apenas aprender com esse ataque durante a análise pós-ataque e, em seguida, implantar uma nova regra que filtre o identificador do ataque, esperando capturá-lo na próxima vez. Da mesma forma, também é ineficiente usar um serviço “sob demanda”, em que a equipe de segurança redireciona o tráfego para um provedor de DDoS durante o ataque, uma vez que o ataque já terá terminado antes que o tráfego seja encaminhado para o provedor de DDoS sob demanda.
É recomendável que as empresas utilizem serviços de proteção contra DDoS automatizados sempre ativos, que analisem o tráfego e apliquem a identificação em tempo real com rapidez suficiente para bloquear ataques de curta duração.
Resumo
A missão da Cloudflare é ajudar a construir uma internet melhor, ou seja, mais segura, mais rápida e mais confiável para todos, até mesmo ao enfrentar ataques DDoS. Como parte de nossa missão, desde 2017 oferecemos proteção contra DDoS ilimitada e sem restrições, além de gratuita, para todos os nossos clientes. Ao longo dos anos, tornou-se cada vez mais fácil para os invasores lançar ataques DDoS. Para combater a vantagem do invasor, queremos garantir que também seja fácil e gratuito para organizações de todos os tamanhos se protegerem contra ataques DDoS de todos os tipos. Ainda não usa a Cloudflare? Comece agora com os planos Free e Pro para proteger sites ou fale conosco para ter uma proteção contra DDoS mais abrangente para toda a rede usando o Magic Transit.
Three Bulgarian companies have been importing phosphates from the Syrian Arab Republic, whose president Bashar Assad and his ministry of oil have been under US sanctions since 2011 and under…
Abstract: Although cyber conflict has existed for thirty years, the strategic utility of cyber operations remains unclear. Many expect cyber operations to provide independent utility in both warfare and low-intensity competition. Underlying these expectations are broadly shared assumptions that information technology increases operational effectiveness. But a growing body of research shows how cyber operations tend to fall short of their promise. The reason for this shortfall is their subversive mechanism of action. In theory, subversion provides a way to exert influence at lower risks than force because it is secret and indirect, exploiting systems to use them against adversaries. The mismatch between promise and practice is the consequence of the subversive trilemma of cyber operations, whereby speed, intensity, and control are negatively correlated. These constraints pose a trilemma for actors because a gain in one variable tends to produce losses across the other two variables. A case study of the Russo-Ukrainian conflict provides empirical support for the argument. Qualitative analysis leverages original data from field interviews, leaked documents, forensic evidence, and local media. Findings show that the subversive trilemma limited the strategic utility of all five major disruptive cyber operations in this conflict.
Microsoft has a comprehensive report on the dozens of cyberattacks — and even more espionage operations — Russia has conducted against Ukraine as part of this war:
At least six Russian Advanced Persistent Threat (APT) actors and other unattributed threats, have conducted destructive attacks, espionage operations, or both, while Russian military forces attack the country by land, air, and sea. It is unclear whether computer network operators and physical forces are just independently pursuing a common set of priorities or actively coordinating. However, collectively, the cyber and kinetic actions work to disrupt or degrade Ukrainian government and military functions and undermine the public’s trust in those same institutions.
[…]
Threat groups with known or suspected ties to the GRU have continuously developed and used destructive wiper malware or similarly destructive tools on targeted Ukrainian networks at a pace of two to three incidents a week since the eve of invasion. From February 23 to April 8, we saw evidence of nearly 40 discrete destructive attacks that permanently destroyed files in hundreds of systems across dozens of organizations in Ukraine.
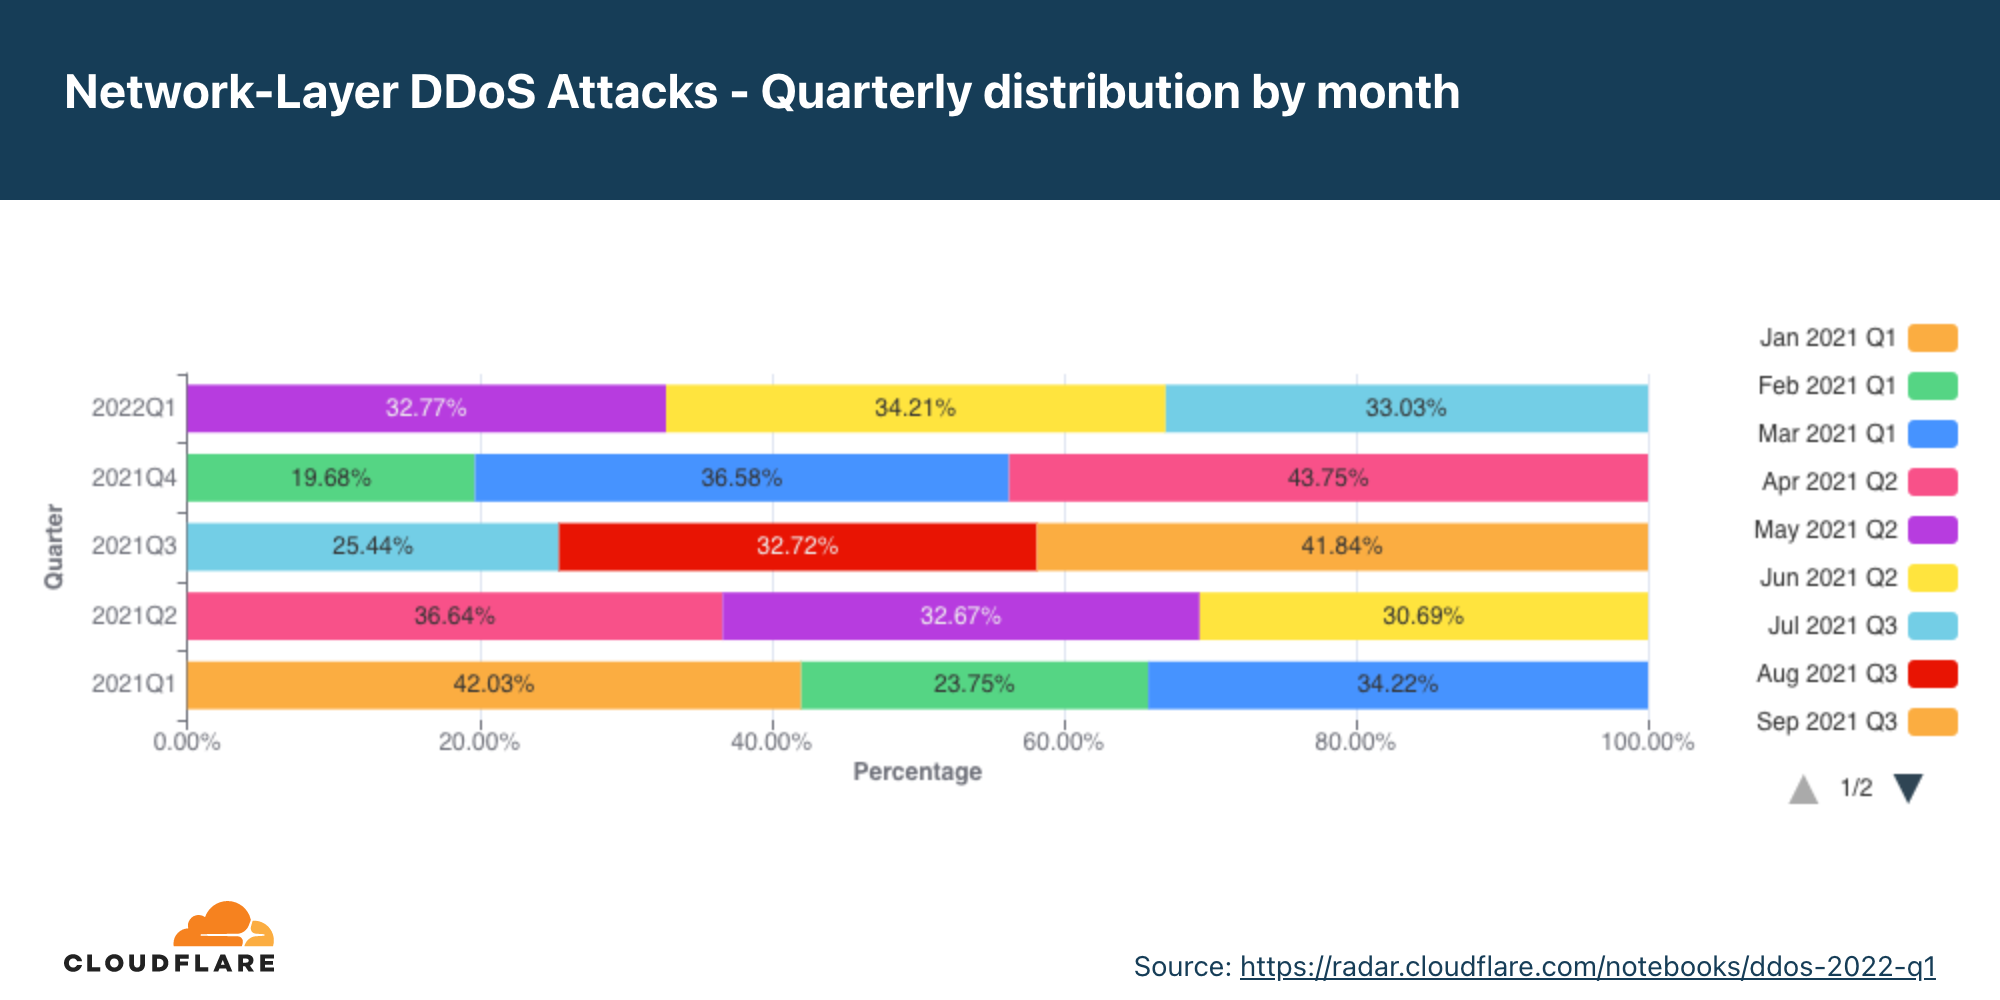
Welcome to our first DDoS report of 2022, and the ninth in total so far. This report includes new data points and insights both in the application-layer and network-layer sections — as observed across the global Cloudflare network between January and March 2022.
The first quarter of 2022 saw a massive spike in application-layer DDoS attacks, but a decrease in the total number of network-layer DDoS attacks. Despite the decrease, we’ve seen volumetric DDoS attacks surge by up to 645% QoQ, and we mitigated a new zero-day reflection attack with an amplification factor of 220 billion percent.
In the Russian and Ukrainian cyberspace, the most targeted industries were Online Media and Broadcast Media. In our Azerbaijan and Palestinian Cloudflare data centers, we’ve seen enormous spikes in DDoS activity — indicating the presence of botnets operating from within.
The Highlights
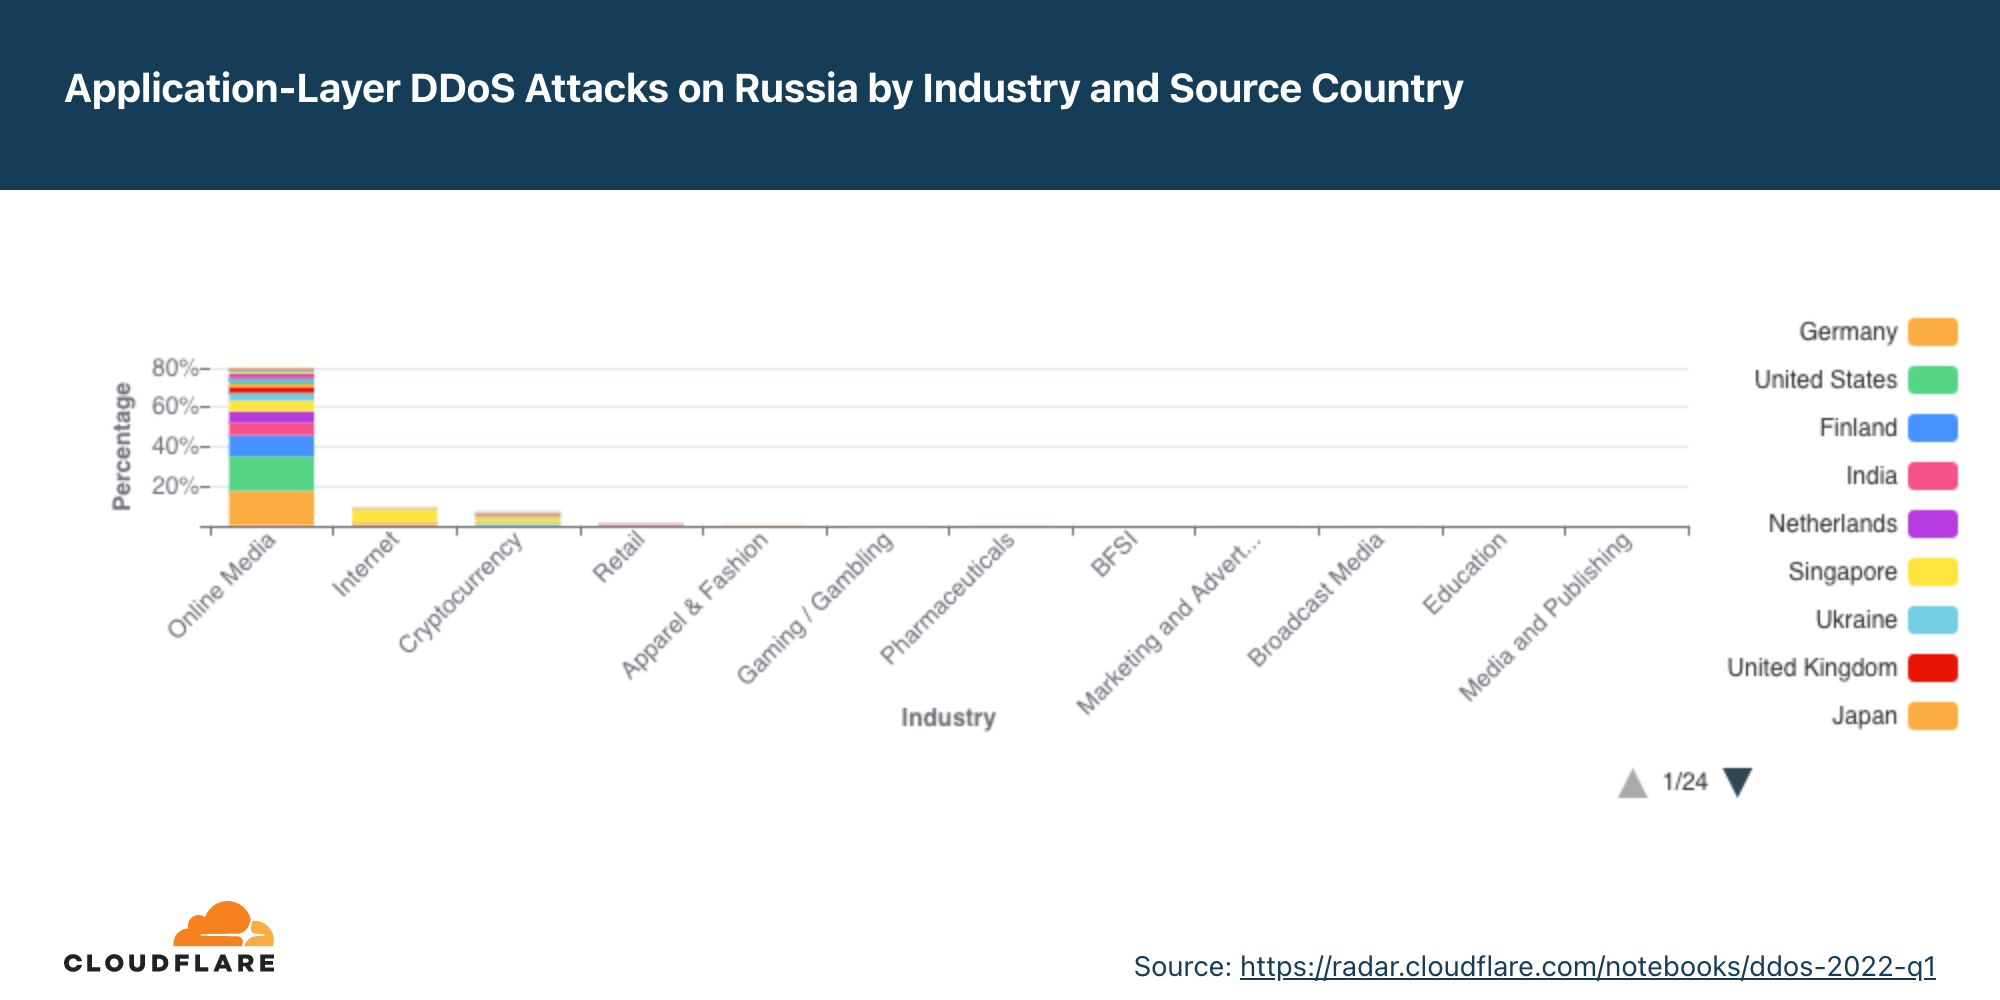
The Russian and Ukrainian cyberspace
Russian Online Media companies were the most targeted industries within Russia in Q1. The next most targeted was the Internet industry, then Cryptocurrency, and then Retail. While many attacks that targeted Russian Cryptocurrency companies originated in Ukraine or the US, another major source of attacks was from within Russia itself.
The majority of HTTP DDoS attacks that targeted Russian companies originated from Germany, the US, Singapore, Finland, India, the Netherlands, and Ukraine. It’s important to note that being able to identify where cyber attack traffic originates is not the same as being able to attribute where the attacker is located.
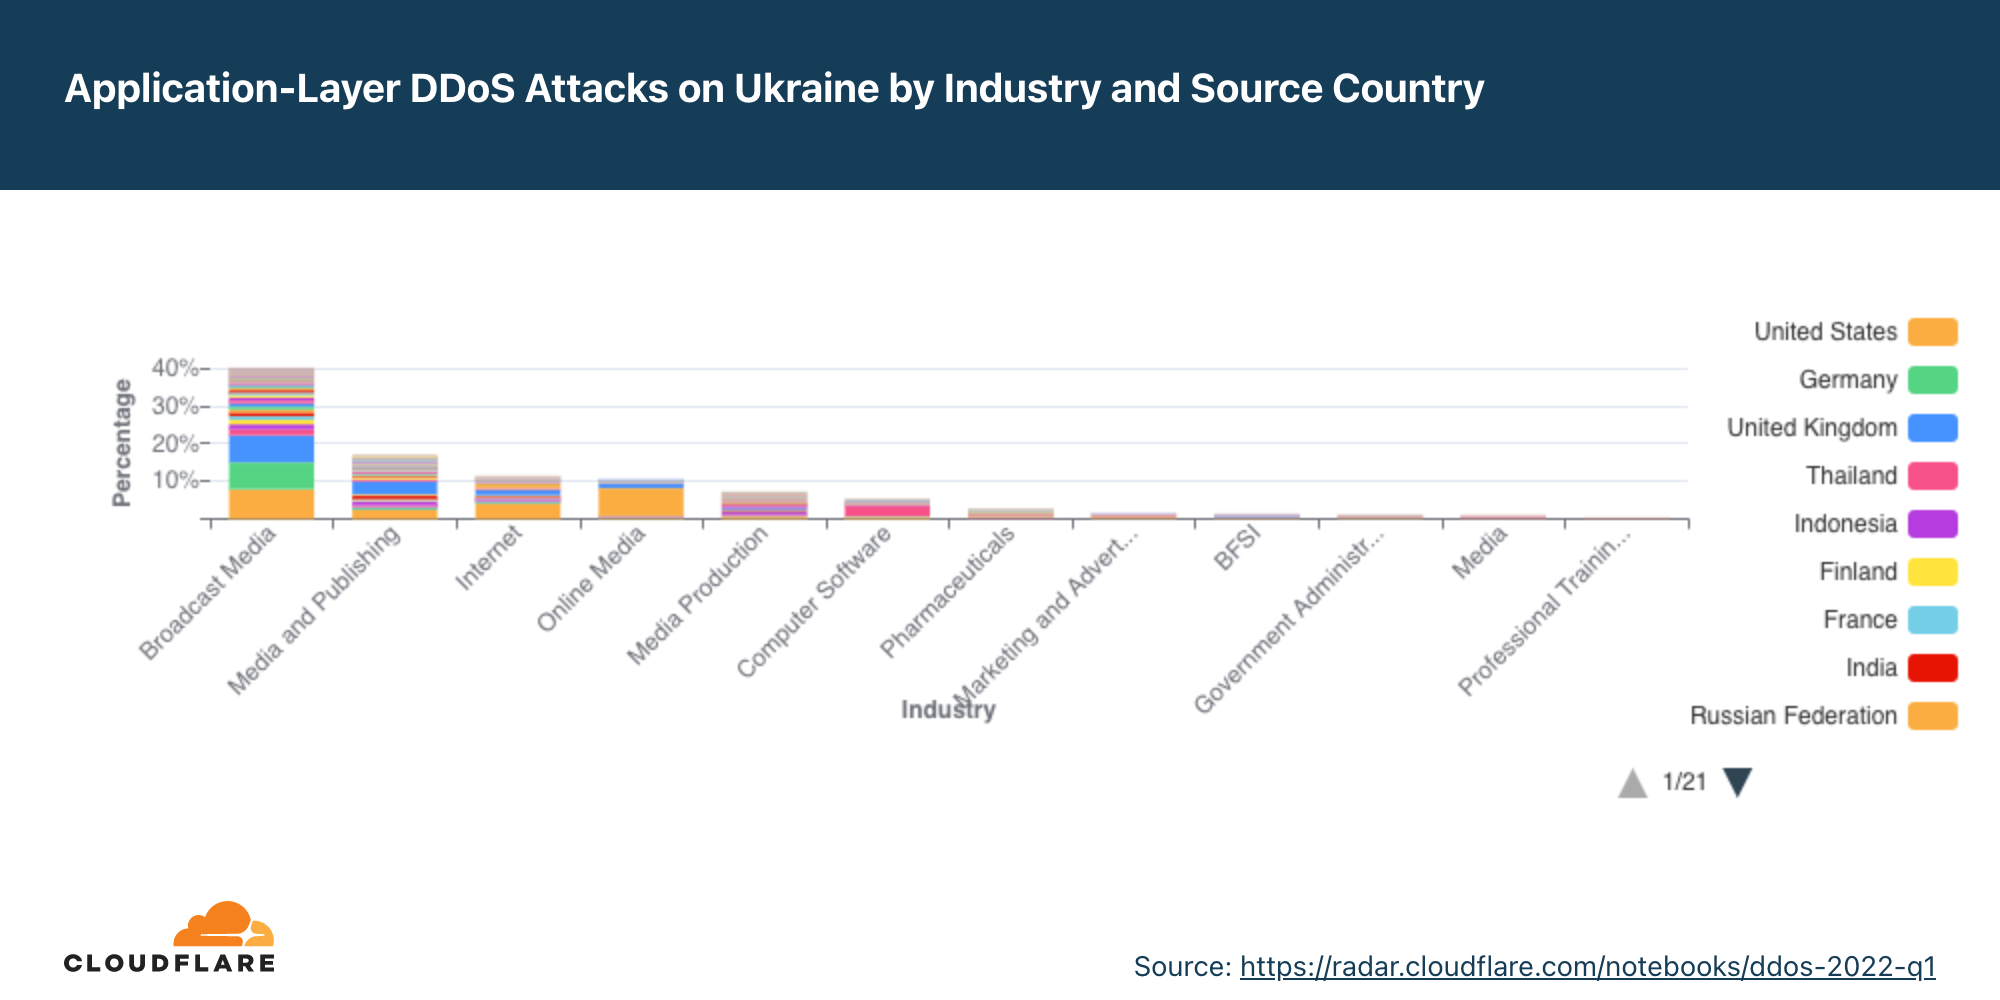
Attacks on Ukraine targeted Broadcast Media and Publishing websites and seem to have been more distributed, originating from more countries — which may indicate the use of global botnets. Still, most of the attack traffic originated from the US, Russia, Germany, China, the UK, and Thailand.
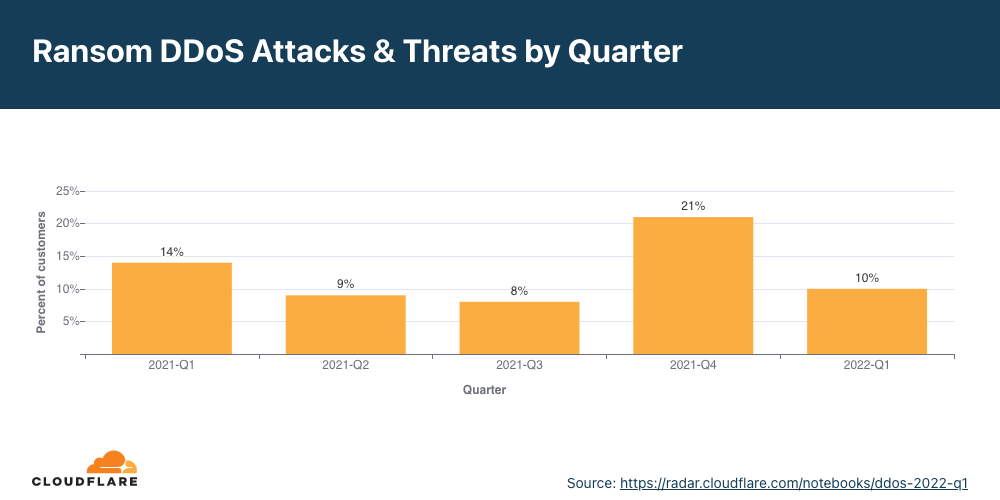
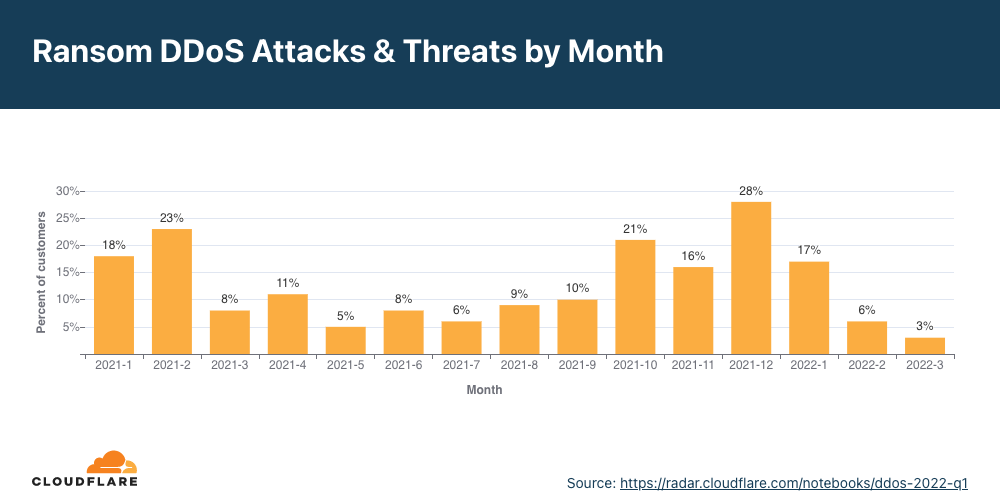
In January 2022, over 17% of under-attack respondents reported being targeted by ransom DDoS attacks or receiving a threat in advance.
That figure drastically dropped to 6% in February, and then to 3% in March.
When compared to previous quarters, we can see that in total, in Q1, only 10% of respondents reported a ransom DDoS attack; a 28% decrease YoY and 52% decrease QoQ.
Application-layer DDoS attacks
2022 Q1 was the busiest quarter in the past 12 months for application-layer attacks. HTTP-layer DDoS attacks increased by 164% YoY and 135% QoQ.
Diving deeper into the quarter, in March 2022 there were more HTTP DDoS attacks than in all of Q4 combined (and Q3, and Q1).
After four consecutive quarters in a row with China as the top source of HTTP DDoS attacks, the US stepped into the lead this quarter. HTTP DDoS attacks originating from the US increased by a staggering 6,777% QoQ and 2,225% YoY.
Network-layer DDoS attacks
Network-layer attacks in Q1 increased by 71% YoY but decreased 58% QoQ.
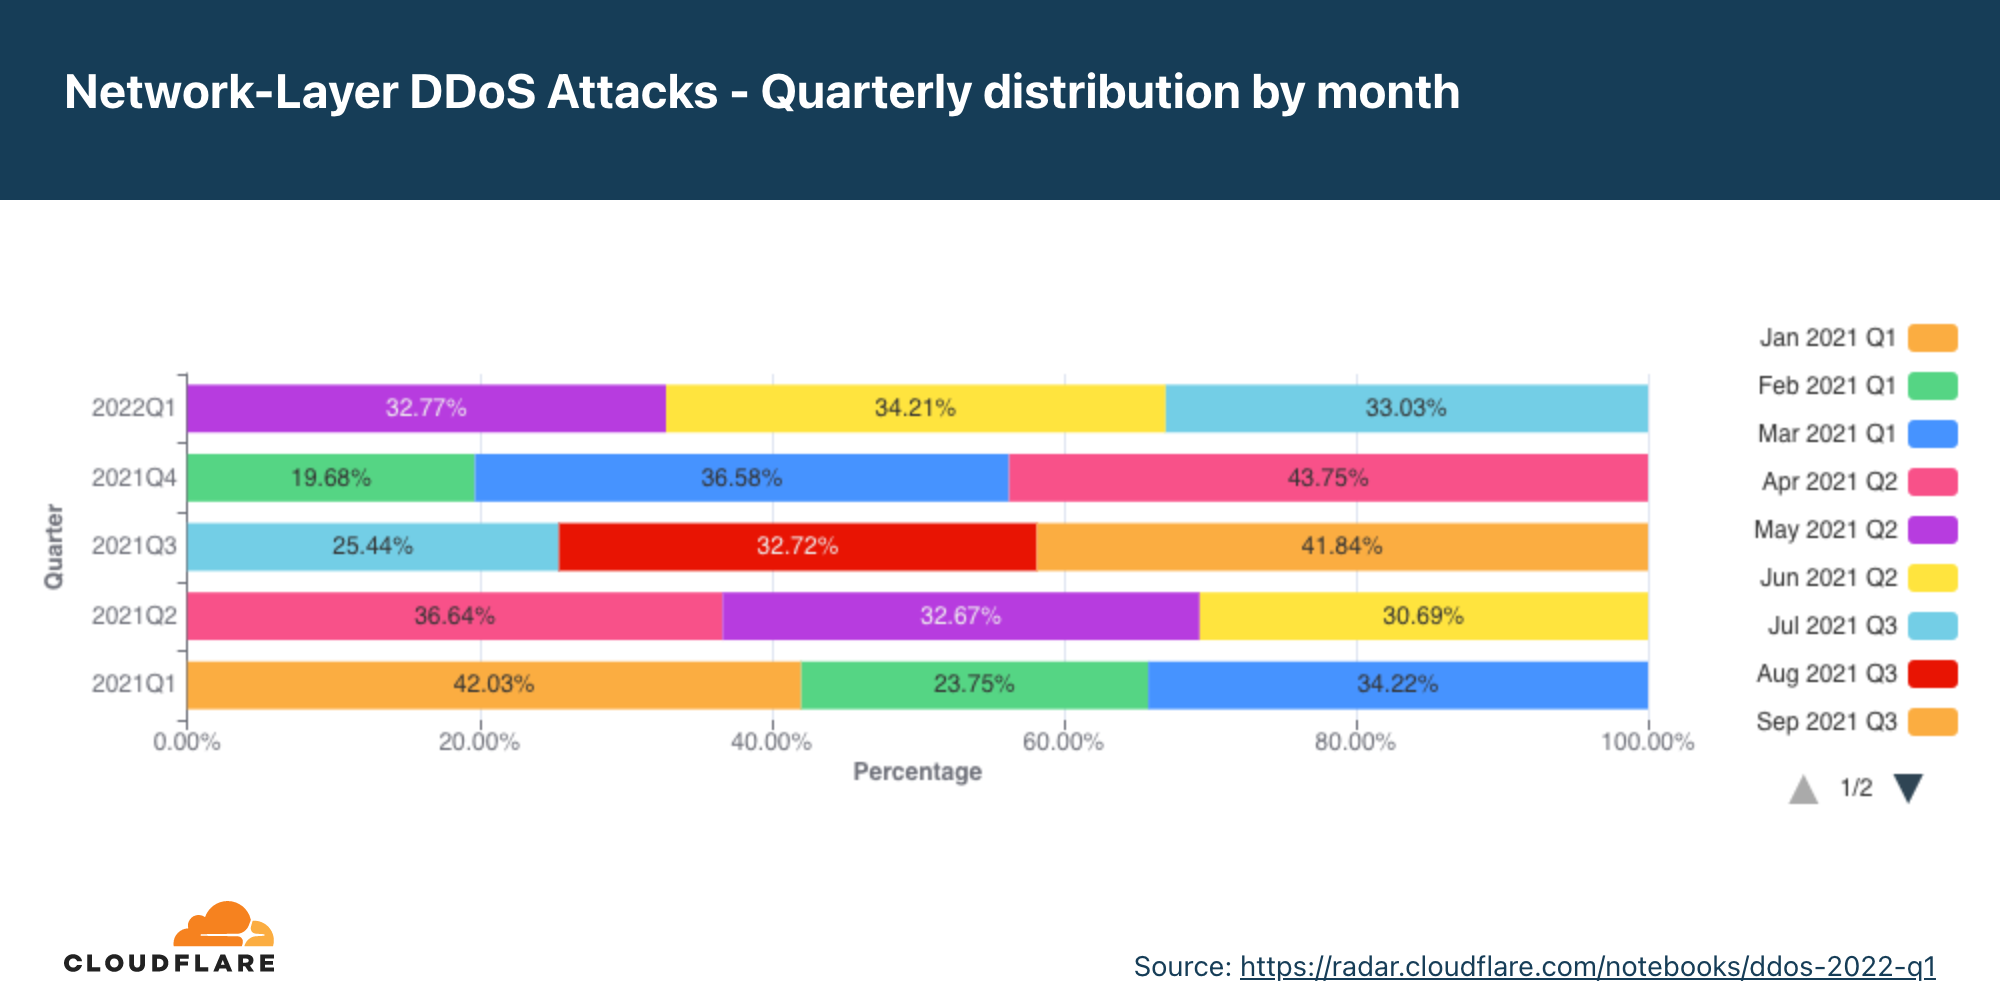
The Telecommunications industry was the most targeted by network-layer DDoS attacks, followed by Gaming and Gambling companies, and the Information Technology and Services industry.
Volumetric attacks increased in Q1. Attacks above 10 Mpps (million packets per second) grew by over 300% QoQ, and attacks over 100 Gbps grew by 645% QoQ.
This report is based on DDoS attacks that were automatically detected and mitigated by Cloudflare’s DDoS Protection systems. To learn more about how it works, check out this deep-dive blog post.
A note on how we measure DDoS attacks observed over our network To analyze attack trends, we calculate the “DDoS activity” rate, which is either the percentage of attack traffic out of the total traffic (attack + clean) observed over our global network, or in a specific location, or in a specific category (e.g., industry or billing country). Measuring the percentages allows us to normalize data points and avoid biases reflected in absolute numbers towards, for example, a Cloudflare data center that receives more total traffic and likely, also more attacks.
To view an interactive version of this report view it on Cloudflare Radar.
Ransom Attacks
Our systems constantly analyze traffic and automatically apply mitigation when DDoS attacks are detected. Each DDoS’d customer is prompted with an automated survey to help us better understand the nature of the attack and the success of the mitigation.
For over two years now, Cloudflare has been surveying attacked customers — one question on the survey being if they received a threat or a ransom note demanding payment in exchange to stop the DDoS attack. In the last quarter, 2021 Q4, we observed a record-breaking level of reported ransom DDoS attacks (one out of every five customers). This quarter, we’ve witnessed a drop in ransom DDoS attacks with only one out of 10 respondents reporting a ransom DDoS attack; a 28% decrease YoY and 52% decrease QoQ.
When we break it down by month, we can see that January 2022 saw the largest number of respondents reporting receiving a ransom letter in Q1. Almost one out of every five customers (17%).
Application-layer DDoS attacks
Application-layer DDoS attacks, specifically HTTP DDoS attacks, are attacks that usually aim to disrupt a web server by making it unable to process legitimate user requests. If a server is bombarded with more requests than it can process, the server will drop legitimate requests and — in some cases — crash, resulting in degraded performance or an outage for legitimate users.
Application-layer DDoS attacks by month
In Q1, application-layer DDoS attacks soared by 164% YoY and 135% QoQ – the busiest quarter within the past year.
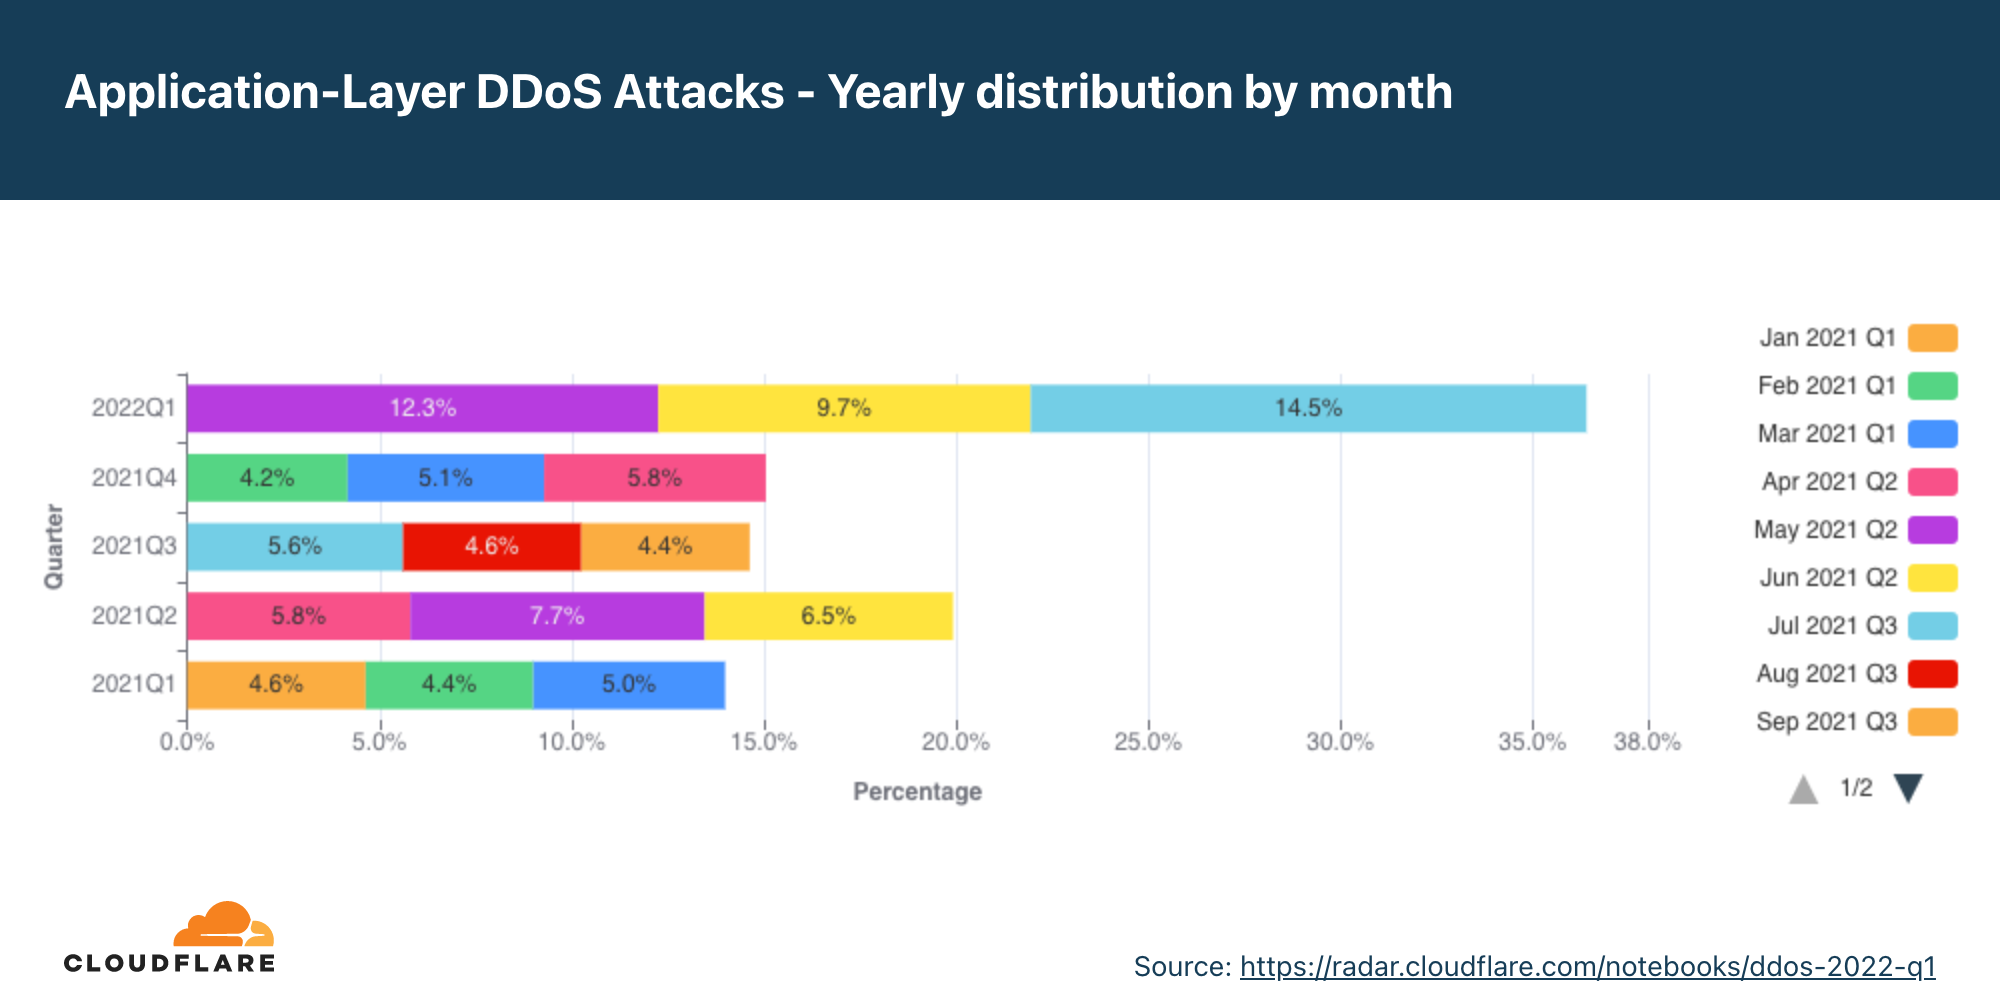
Application-layer DDoS attacks increased to new heights in the first quarter of 2022. In March alone, there were more HTTP DDoS attacks than in all of 2021 Q4 combined (and Q3, and Q1).
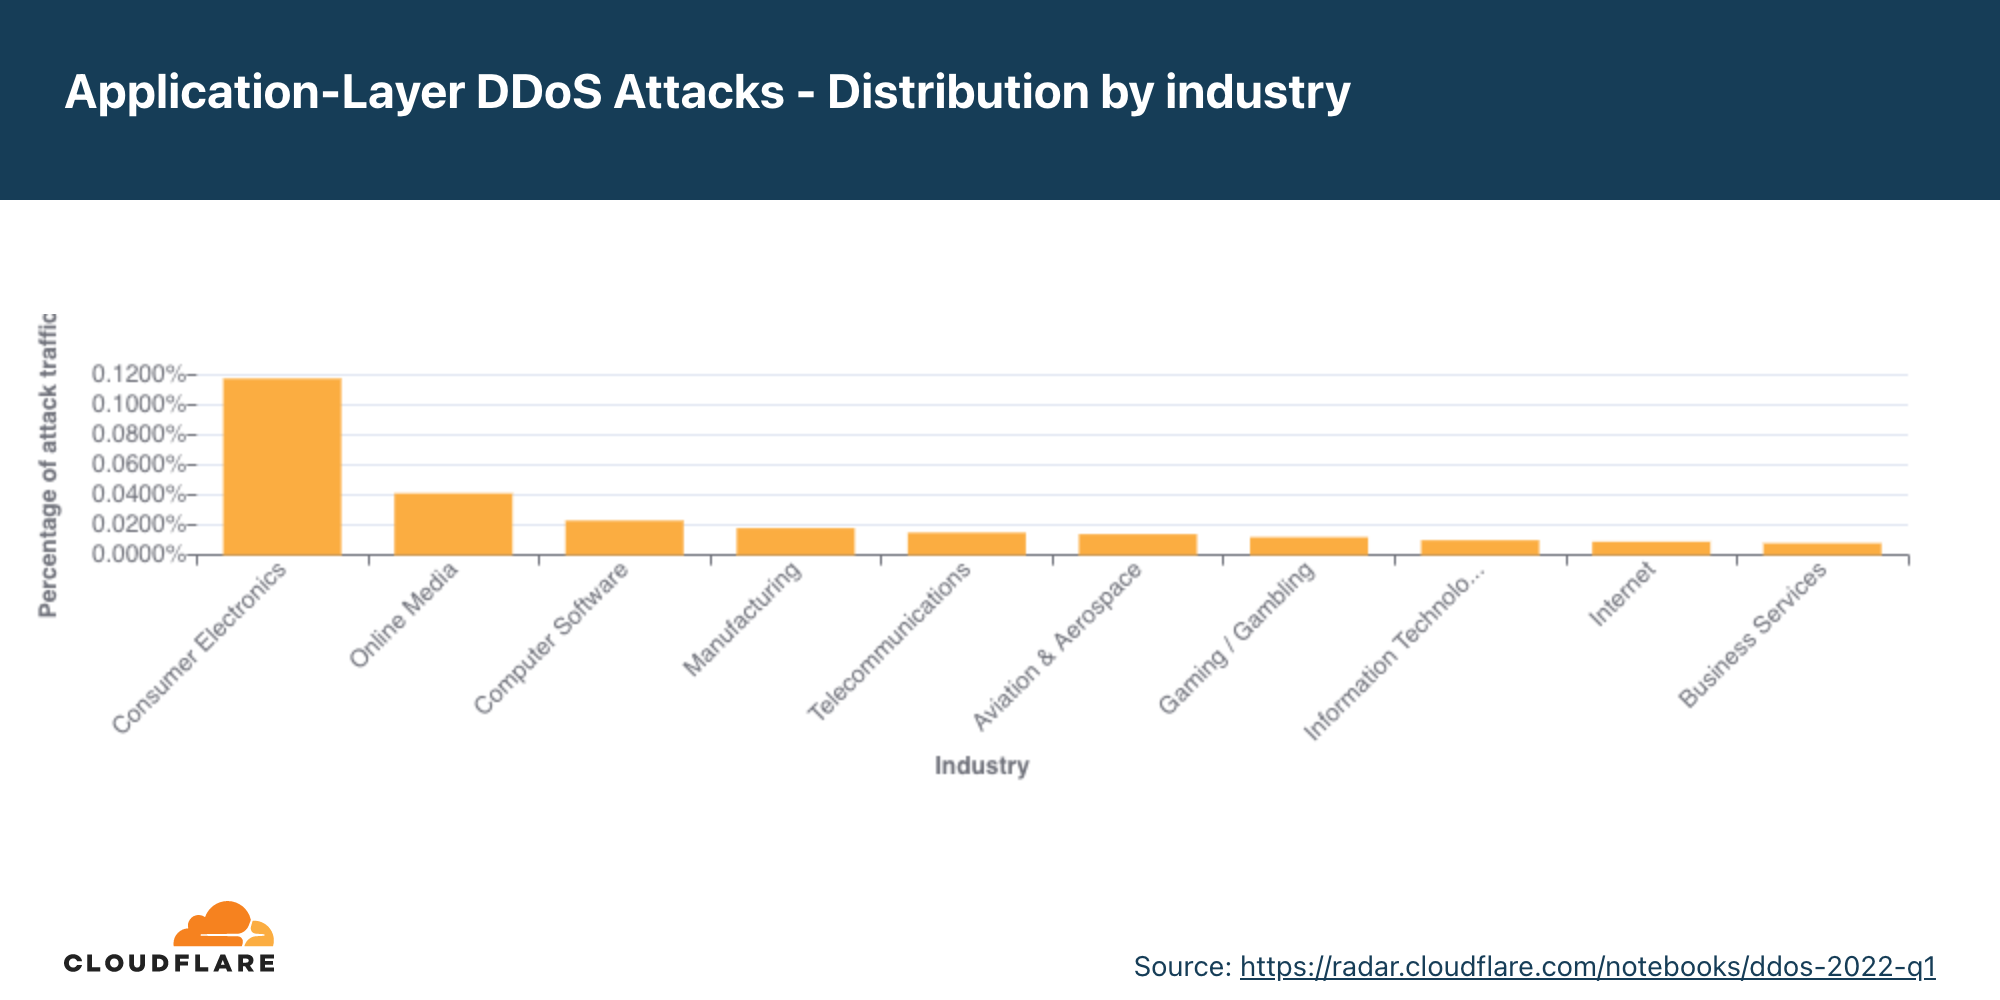
Application-layer DDoS attacks by industry
Consumer Electronics was the most targeted industry in Q1.
Globally, the Consumer Electronics industry was the most attacked with an increase of 5,086% QoQ. Second was the Online Media industry with a 2,131% increase in attacks QoQ. Third were Computer Software companies, with an increase of 76% QoQ and 1,472 YoY.
To understand the origin of the HTTP attacks, we look at the geolocation of the source IP address belonging to the client that generated the attack HTTP requests. Unlike network-layer attacks, source IP addresses cannot be spoofed in HTTP attacks. A high percentage of DDoS activity in a given country usually indicates the presence of botnets operating from within the country’s borders.
After four consecutive quarters in a row with China as the top source of HTTP DDoS attacks, the US stepped into the lead this quarter. HTTP DDoS attacks originating from the US increased by a staggering 6,777% QoQ and 2,225% YoY. Following China in second place are India, Germany, Brazil, and Ukraine.
Application-layer DDoS attacks by target country
In order to identify which countries are targeted by the most HTTP DDoS attacks, we bucket the DDoS attacks by our customers’ billing countries and represent it as a percentage out of all DDoS attacks.
The US drops to second place, after being first for three consecutive quarters. Organizations in China were targeted the most by HTTP DDoS attacks, followed by the US, Russia, and Cyprus.
Network-layer DDoS attacks
While application-layer attacks target the application (Layer 7 of the OSI model) running the service that end users are trying to access (HTTP/S in our case), network-layer attacks aim to overwhelm network infrastructure (such as in-line routers and servers) and the Internet link itself.
Network-layer DDoS attacks by month
While HTTP DDoS attacks soared in Q1, network-layer DDoS attacks actually decreased by 58% QoQ, but still increased by 71% YoY.
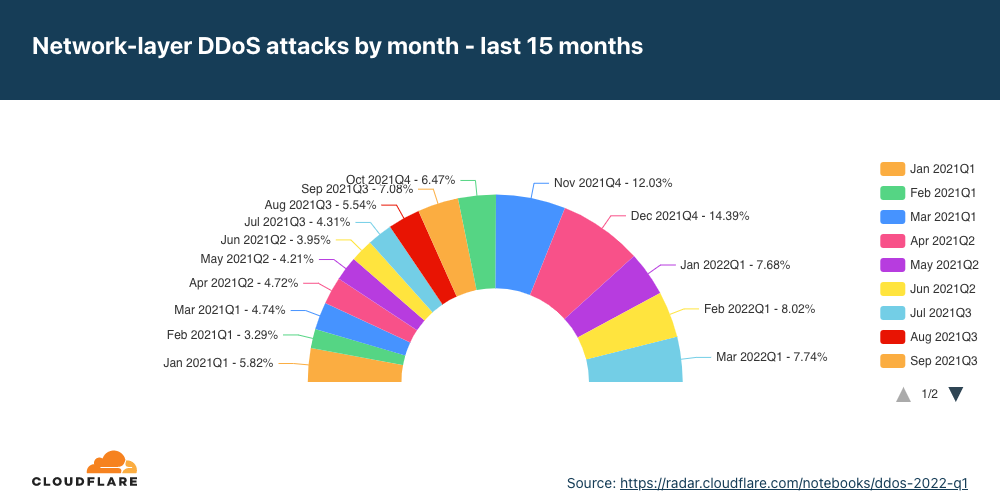
Diving deeper into Q1, we can see that the amount of network-layer DDoS attacks remained mostly consistent throughout the quarter with about a third of attacks occurring every month.
Amongst these network-layer DDoS attacks are also zero-day DDoS attacks that Cloudflare automatically detected and mitigated.
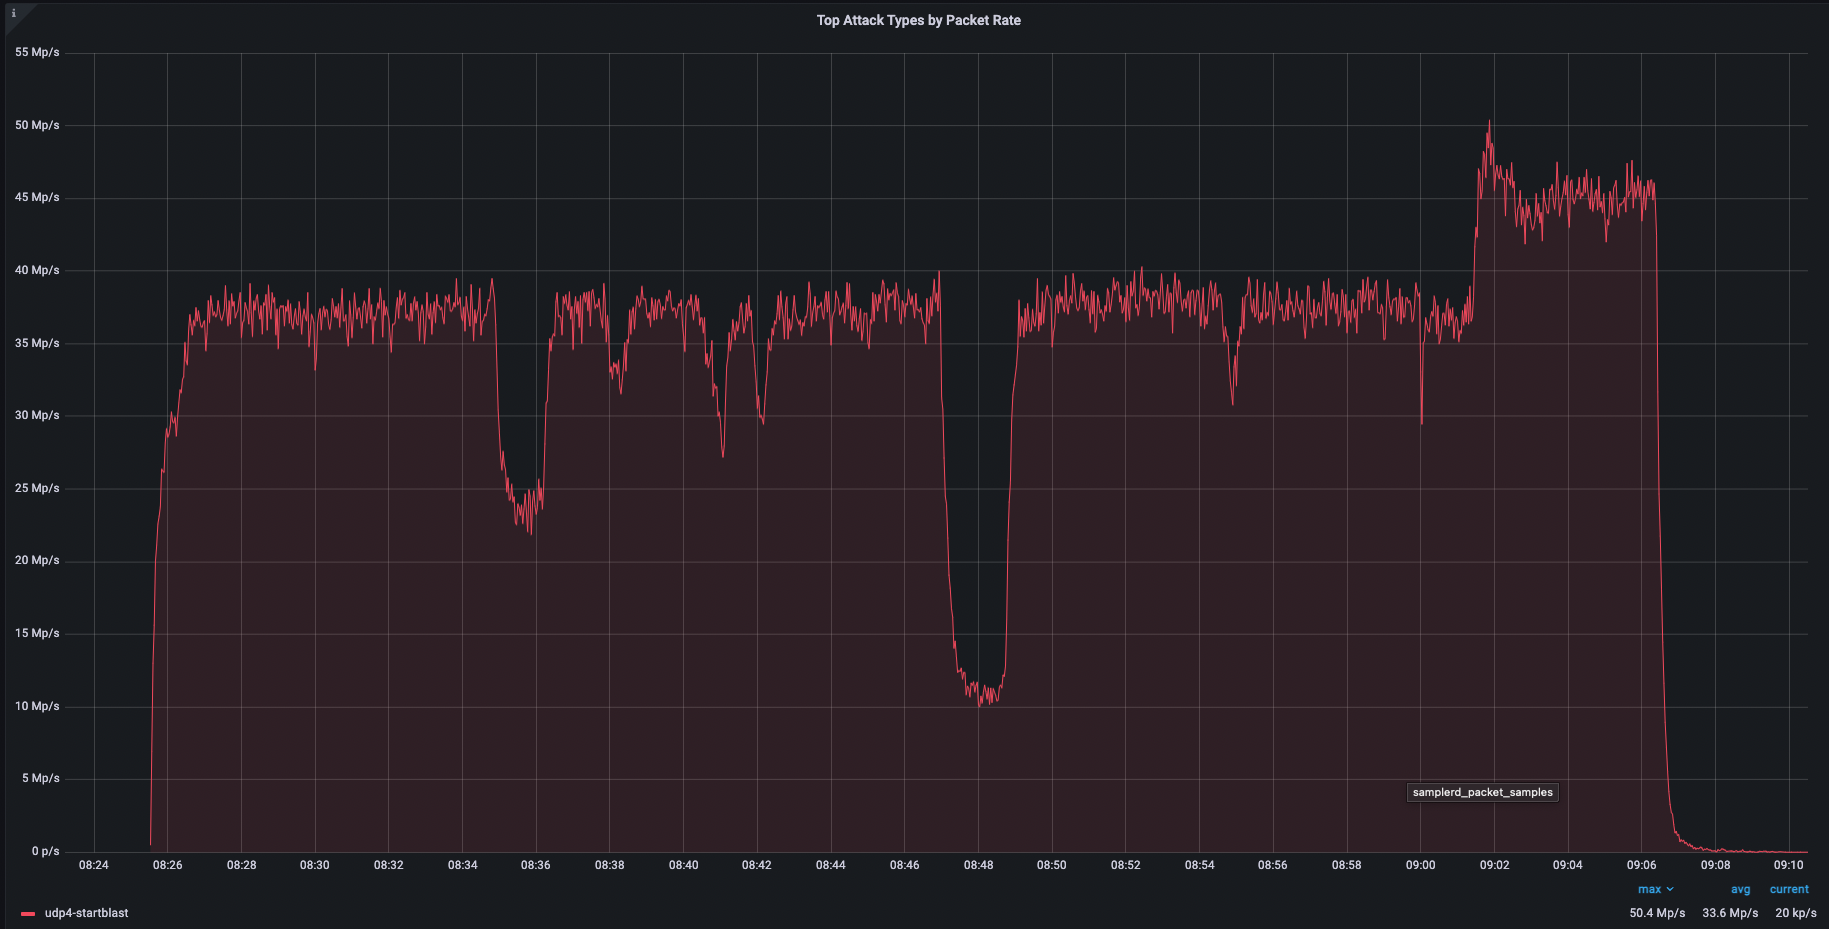
In the beginning of March, Cloudflare researchers helped investigate and expose a zero-day vulnerability in Mitel business phone systems that amongst other possible exploitations, also enables attackers to launch an amplification DDoS attack. This type of attack reflects traffic off vulnerable Mitel servers to victims, amplifying the amount of traffic sent in the process by an amplification factor of 220 billion percent in this specific case. You can read more about it in our recent blog post.
We observed several of these attacks across our network. One of them targeted a North American cloud provider using the Cloudflare Magic Transit service. The attack originated from 100 source IPs mainly from the US, UK, Canada, Netherlands, Australia, and approximately 20 other countries. It peaked above 50 Mpps (~22 Gbps) and was automatically detected and mitigated by Cloudflare systems.
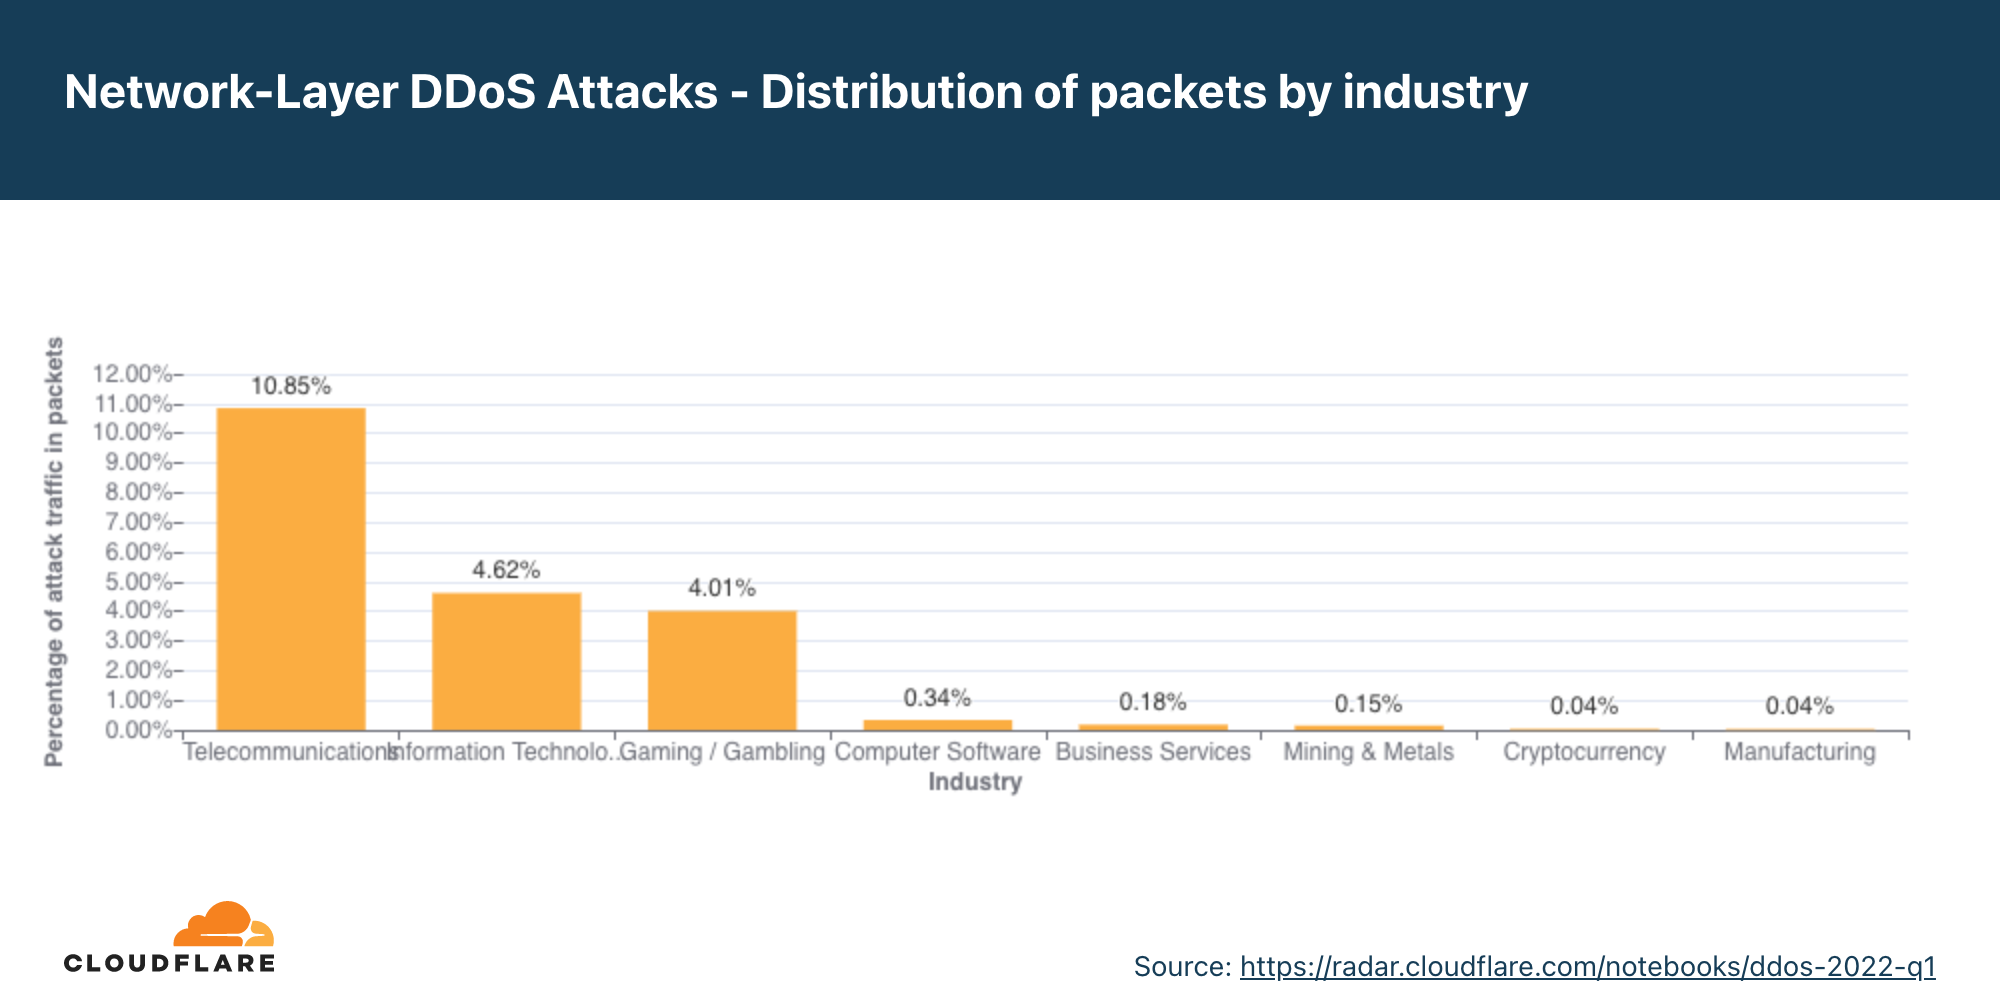
In this report, for the first time, we’ve begun classifying network-layer DDoS attacks according to the industries of our customers using the Spectrum and Magic products. This classification allows us to understand which industries are targeted the most by network-layer DDoS attacks.
When we look at Q1 statistics, we can see that in terms of attack packets and attack bytes launched towards Cloudflare customers, the Telecommunications industry was targeted the most. More than 8% of all attack bytes and 10% of all attack packets that Cloudflare mitigated targeted Telecommunications companies.
Following not too far behind, in second and third place were the Gaming / Gambling and Information Technology and Services industries.
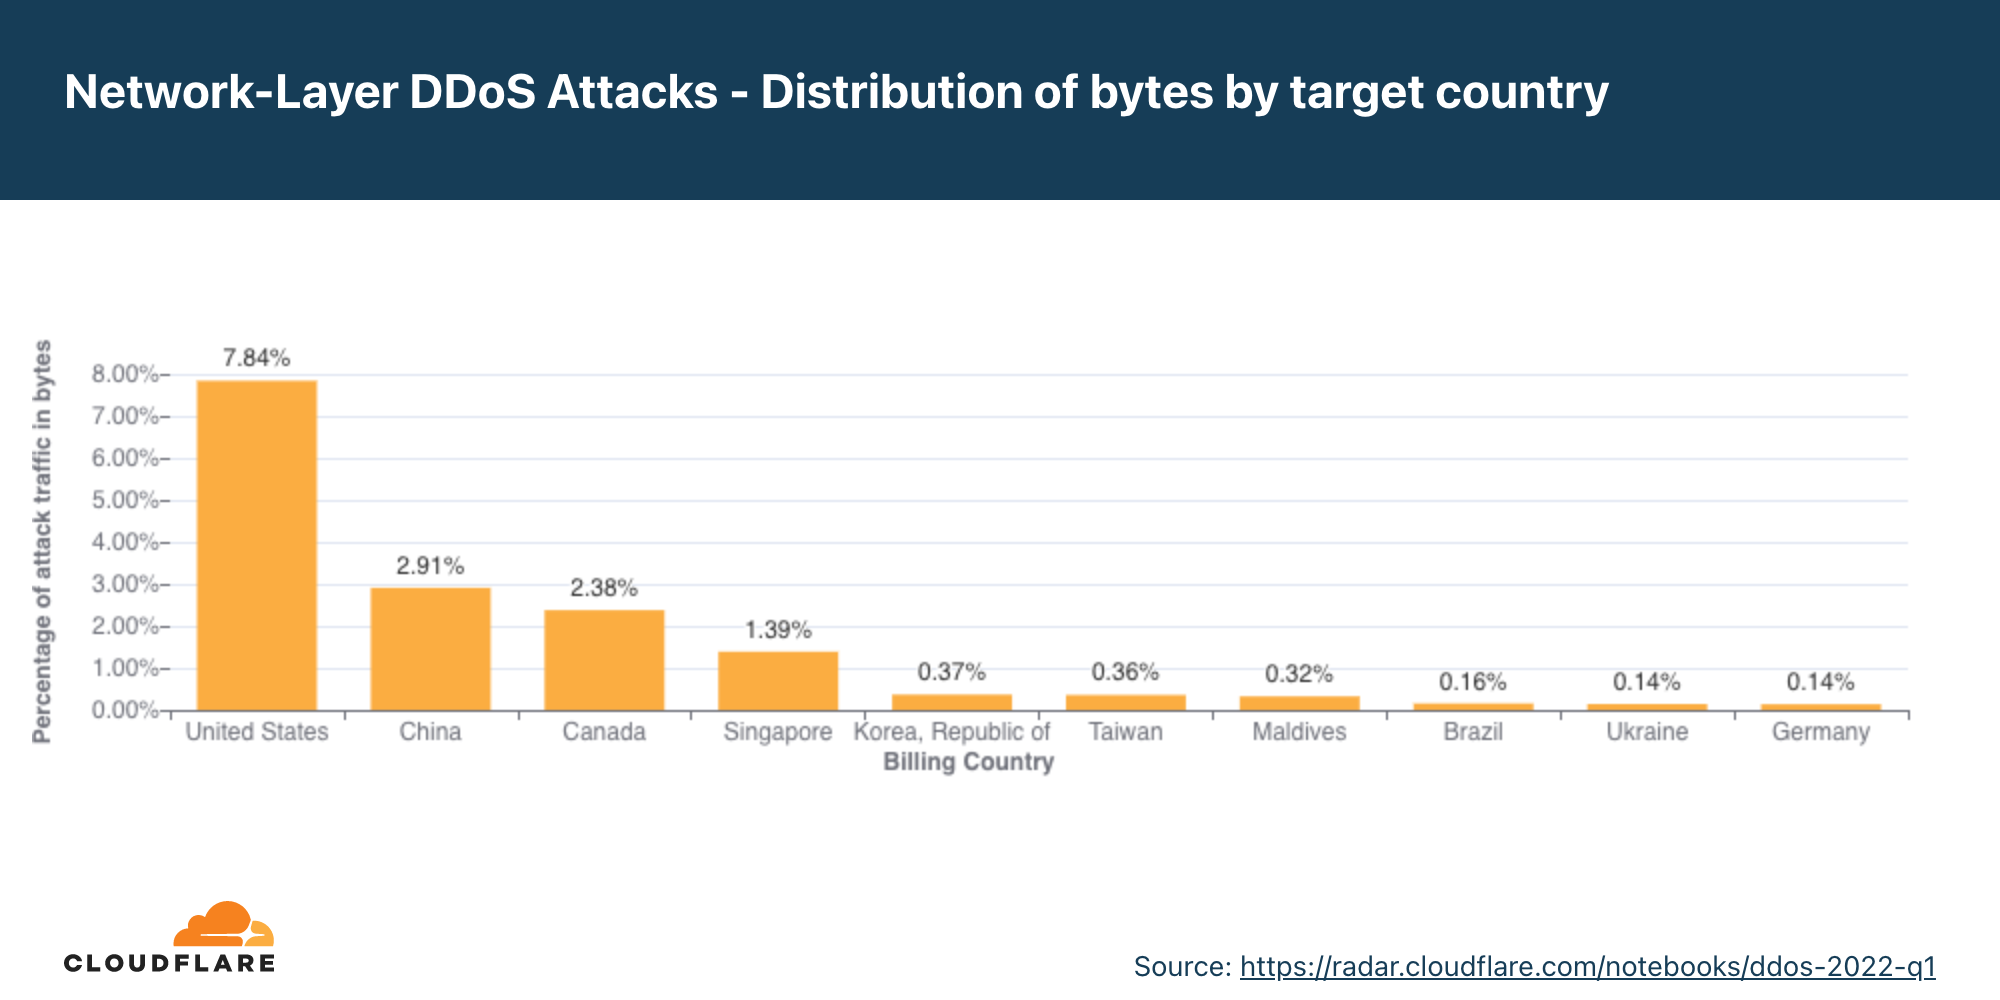
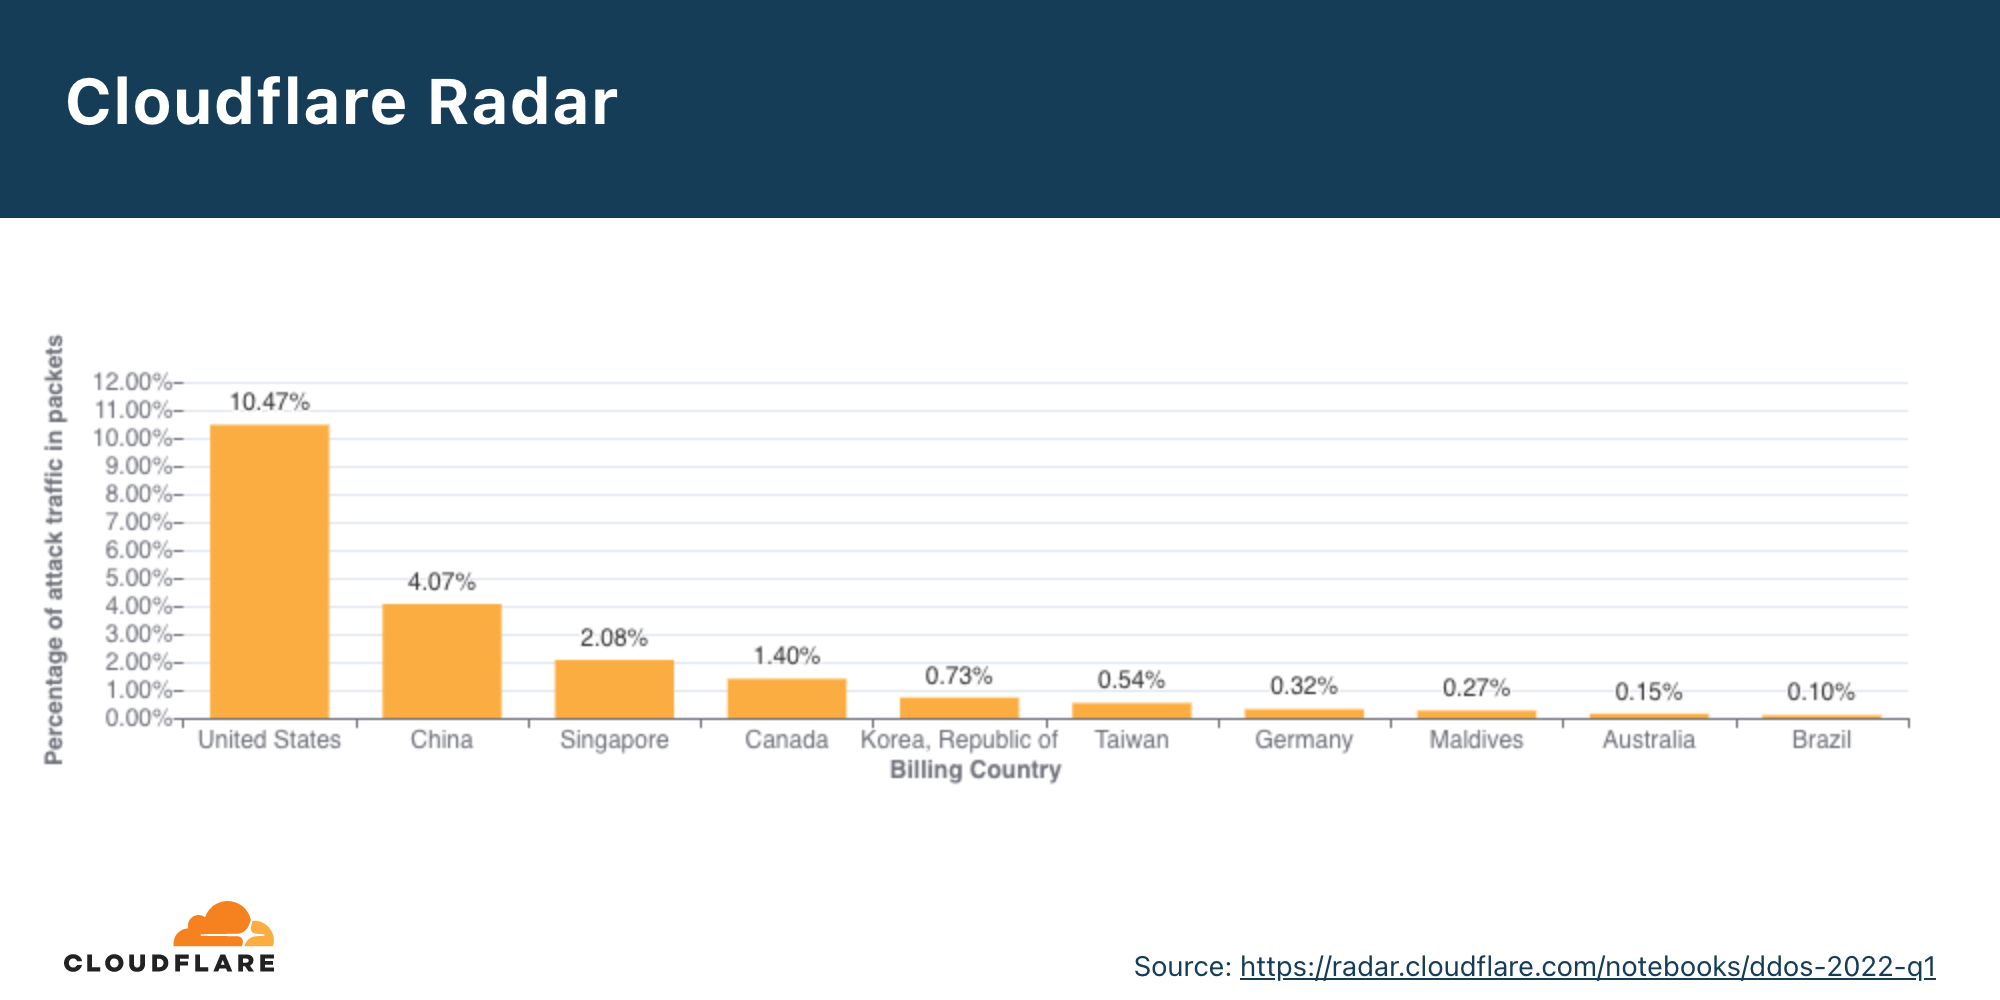
Network-layer DDoS attacks by target country
Similarly to the classification by our customers’ industry, we can also bucket attacks by our customers’ billing country as we do for application-layer DDoS attacks, to identify the top attacked countries.
Looking at Q1 numbers, we can see that the US was targeted by the highest percentage of DDoS attacks traffic — over 10% of all attack packets and almost 8% of all attack bytes. Following the US is China, Canada, and Singapore.
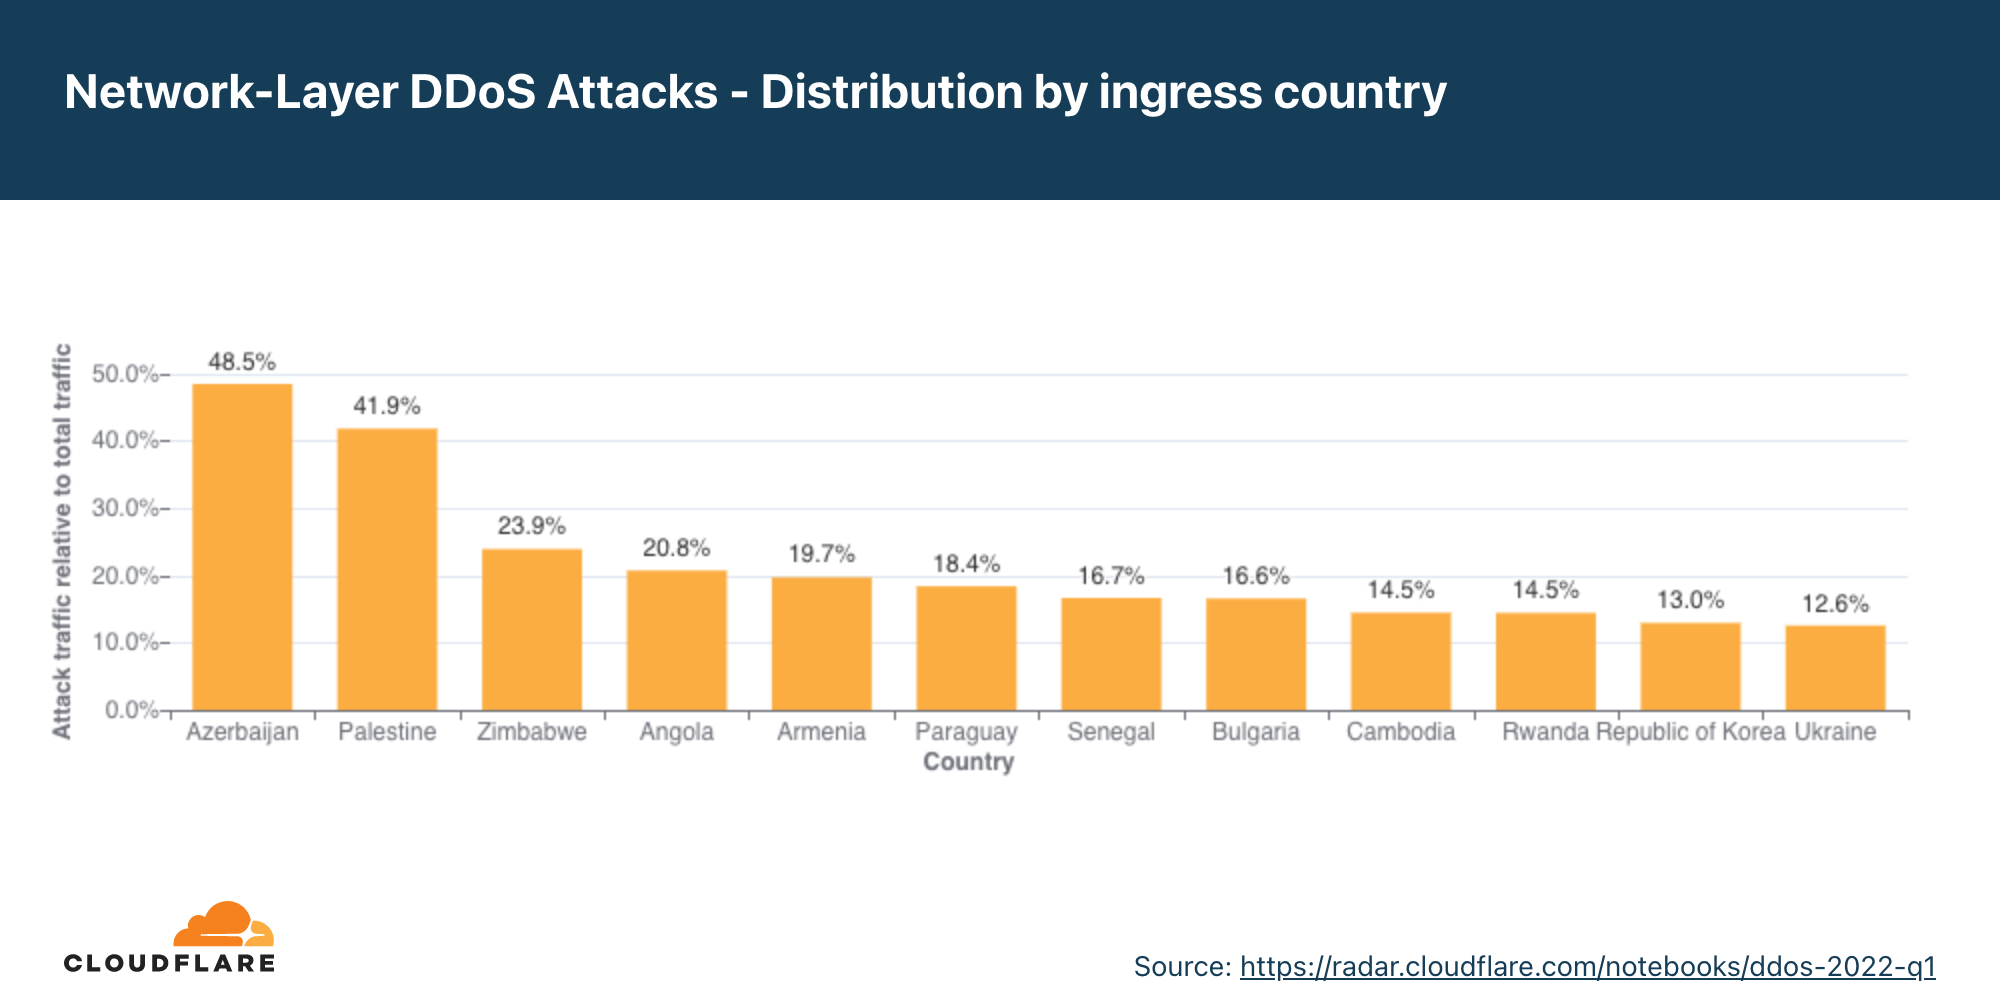
Network-layer DDoS attacks by ingress country
When trying to understand where network-layer DDoS attacks originate, we cannot use the same method as we use for the application-layer attack analysis. To launch an application-layer DDoS attack, successful handshakes must occur between the client and the server in order to establish an HTTP/S connection. For a successful handshake to occur, the attacker cannot spoof their source IP address. While the attacker may use botnets, proxies, and other methods to obfuscate their identity, the attacking client’s source IP location does sufficiently represent the attack source of application-layer DDoS attacks.
On the other hand, to launch network-layer DDoS attacks, in most cases, no handshake is needed. Attackers can spoof the source IP address in order to obfuscate the attack source and introduce randomness into the attack properties, which can make it harder for simple DDoS protection systems to block the attack. So if we were to derive the source country based on a spoofed source IP, we would get a ‘spoofed country’.
For this reason, when analyzing network-layer DDoS attack sources, we bucket the traffic by the Cloudflare edge data center locations where the traffic was ingested, and not by the (potentially) spoofed source IP to get an understanding of where the attacks originate from. We are able to achieve geographical accuracy in our report because we have data centers in over 270 cities around the world. However, even this method is not 100% accurate, as traffic may be back hauled and routed via various Internet Service Providers and countries for reasons that vary from cost reduction to congestion and failure management.
In Q1, the percentage of attacks detected in Cloudflare’s data centers in Azerbaijan increased by 16,624% QoQ and 96,900% YoY, making it the country with the highest percentage of network-layer DDoS activity (48.5%).
Following our Azerbaijanian data center is our Palestinian data center where a staggering 41.9% of all traffic was DDoS traffic. This represents a 10,120% increase QoQ and 46,456% YoY.
To view all regions and countries, check out the interactive map.
Attack vectors
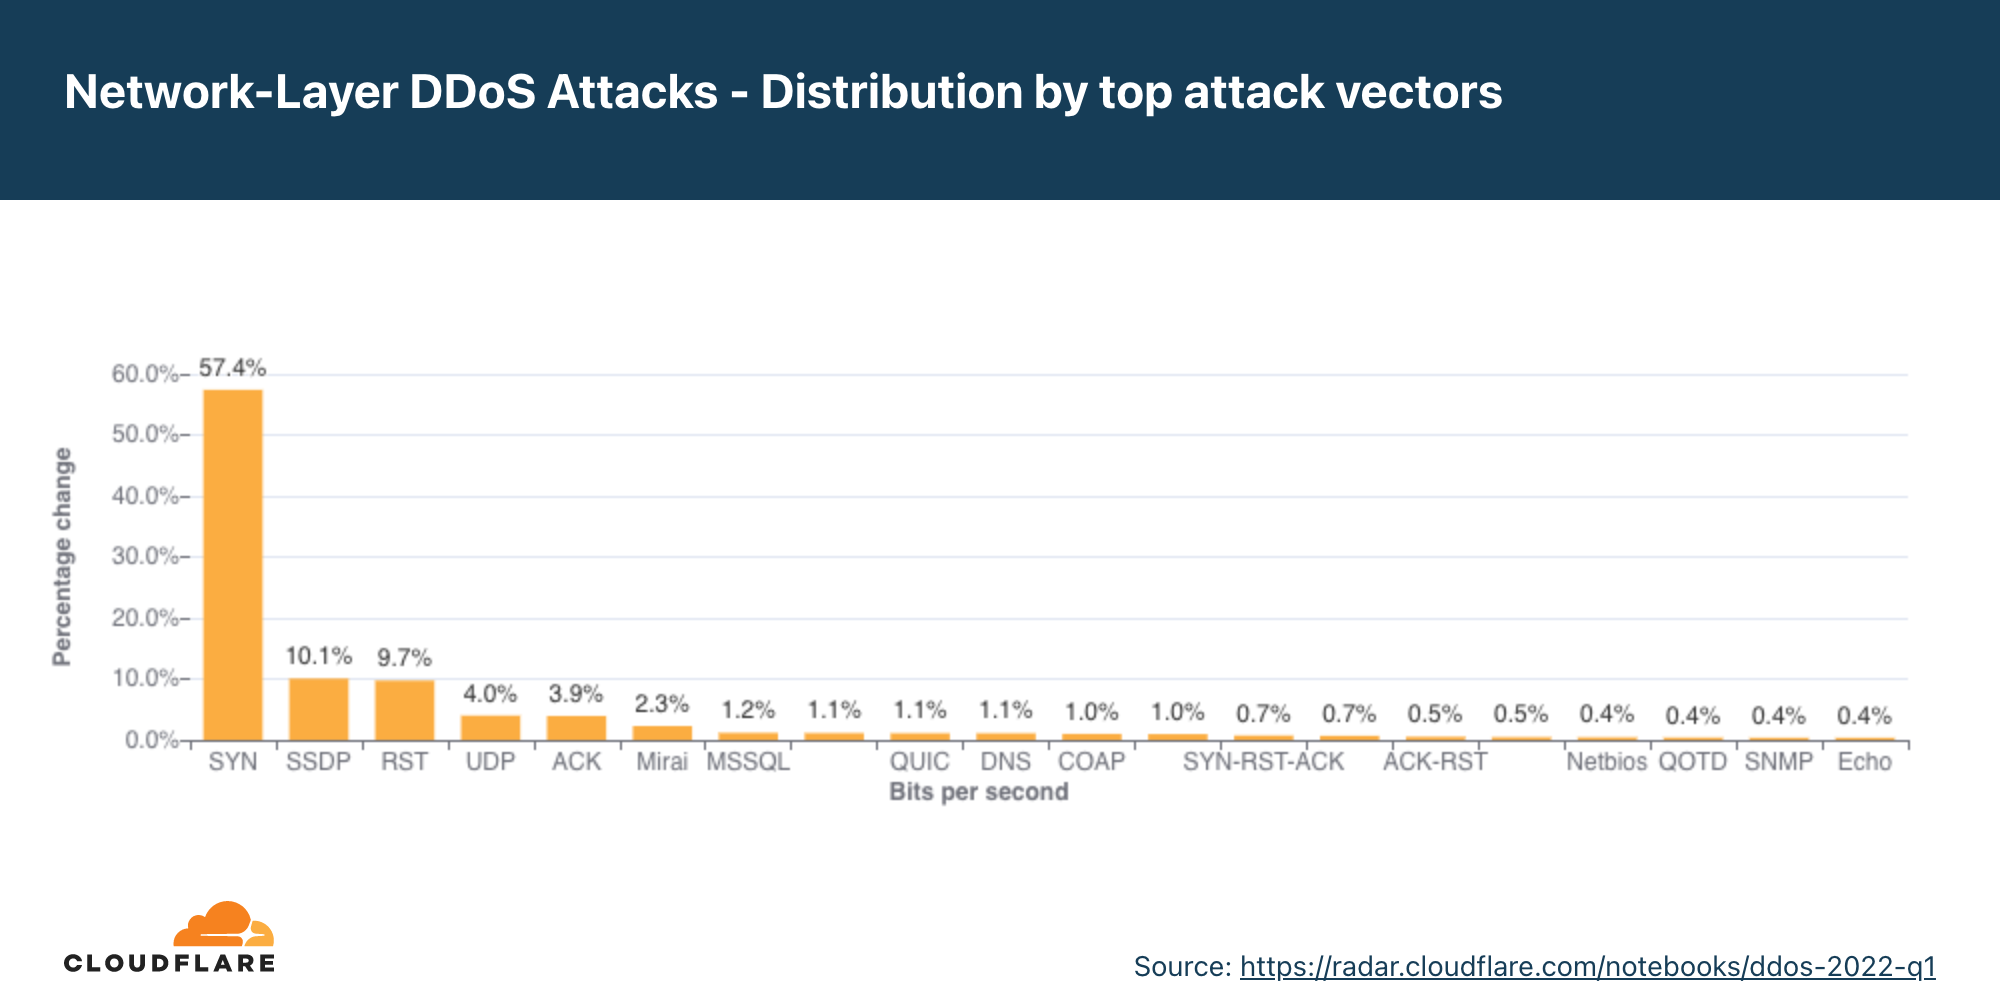
SYN Floods remain the most popular DDoS attack vector, while use of generic UDP floods drops significantly in Q1.
An attack vector is a term used to describe the method that the attacker uses to launch their DDoS attack, i.e., the IP protocol, packet attributes such as TCP flags, flooding method, and other criteria.
In Q1, SYN floods accounted for 57% of all network-layer DDoS attacks, representing a 69% increase QoQ and a 13% increase YoY. In second place, attacks over SSDP surged by over 1,100% QoQ. Following were RST floods and attacks over UDP. Last quarter, generic UDP floods took the second place, but this time, generic UDP DDoS attacks plummeted by 87% QoQ from 32% to a mere 3.9%.
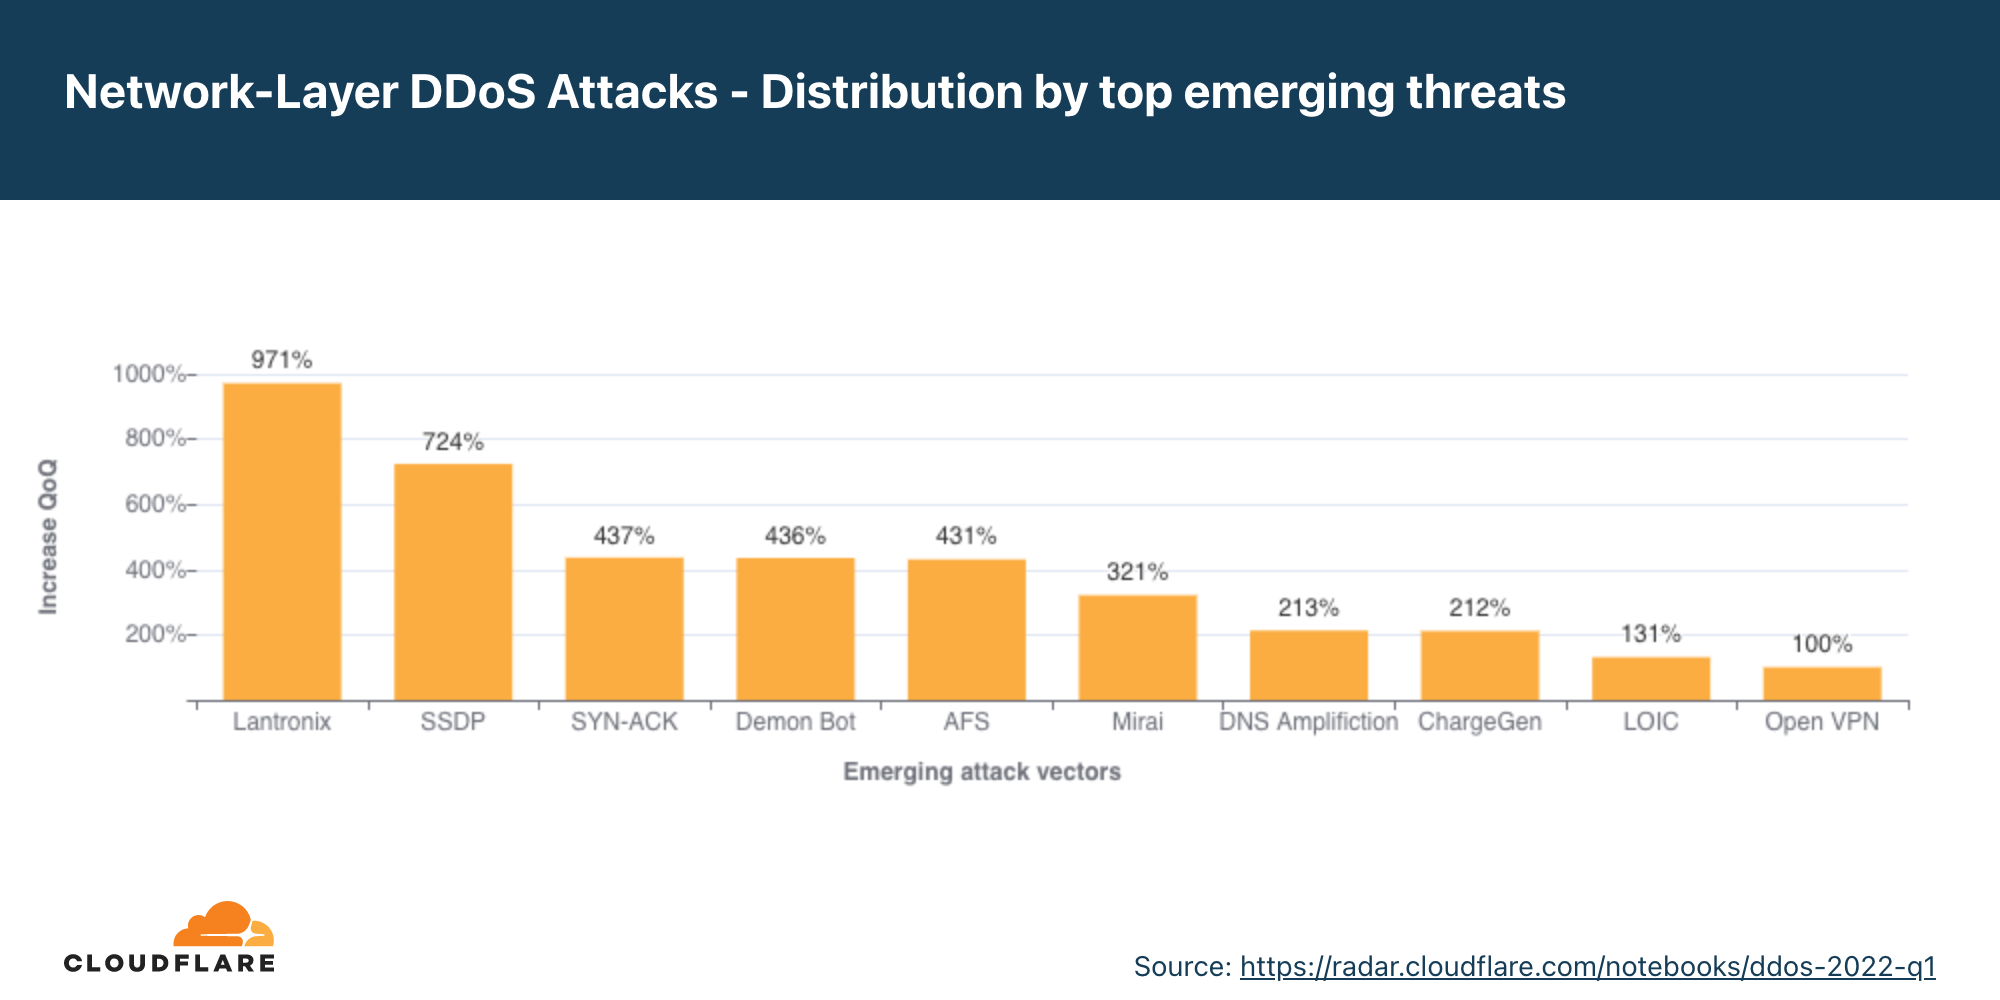
Emerging threats
Identifying the top attack vectors helps organizations understand the threat landscape. In turn, this may help them improve their security posture to protect against those threats. Similarly, learning about new emerging threats that may not yet account for a significant portion of attacks, can help mitigate them before they become a significant force.
When we look at new emerging attack vectors in Q1, we can see increases in DDoS attacks reflecting off of Lantronix services (+971% QoQ) and SSDP reflection attacks (+724% QoQ). Additionally, SYN-ACK attacks increased by 437% and attacks by Mirai botnets by 321% QoQ.
Attacker reflecting traffic off of Lantronix Discovery Service
Lantronix is a US-based software and hardware company that provides solutions for Internet of Things (IoT) management amongst their vast offering. One of the tools that they provide to manage their IoT components is the Lantronix Discovery Protocol. It is a command-line tool that helps to search and find Lantronix devices. The discovery tool is UDP-based, meaning that no handshake is required. The source IP can be spoofed. So an attacker can use the tool to search for publicly exposed Lantronix devices using a 4 byte request, which will then in turn respond with a 30 byte response from port 30718. By spoofing the source IP of the victim, all Lantronix devices will target their responses to the victim — resulting in a reflection/amplification attack.
Simple Service Discovery Protocol used for reflection DDoS attacks
The Simple Service Discovery Protocol (SSDP) protocol works similarly to the Lantronix Discovery protocol, but for Universal Plug and Play (UPnP) devices such as network-connected printers. By abusing the SSDP protocol, attackers can generate a reflection-based DDoS attack overwhelming the target’s infrastructure and taking their Internet properties offline. You can read more about SSDP-based DDoS attacks here.
Network-layer DDoS attacks by attack rate
In Q1, we observed a massive uptick in volumetric DDoS attacks — both from the packet rate and bitrate perspective. Attacks over 10 Mpps grew by over 300% QoQ, and attacks over 100 Gbps grew by 645% QoQ.
There are different ways of measuring the size of an L3/4 DDoS attack. One is the volume of traffic it delivers, measured as the bit rate (specifically, terabits per second or gigabits per second). Another is the number of packets it delivers, measured as the packet rate (specifically, millions of packets per second).
Attacks with high bit rates attempt to cause a denial-of-service event by clogging the Internet link, while attacks with high packet rates attempt to overwhelm the servers, routers, or other in-line hardware appliances. These devices dedicate a certain amount of memory and computation power to process each packet. Therefore, by bombarding it with many packets, the appliance can be left with no further processing resources. In such a case, packets are “dropped,” i.e., the appliance is unable to process them. For users, this results in service disruptions and denial of service.
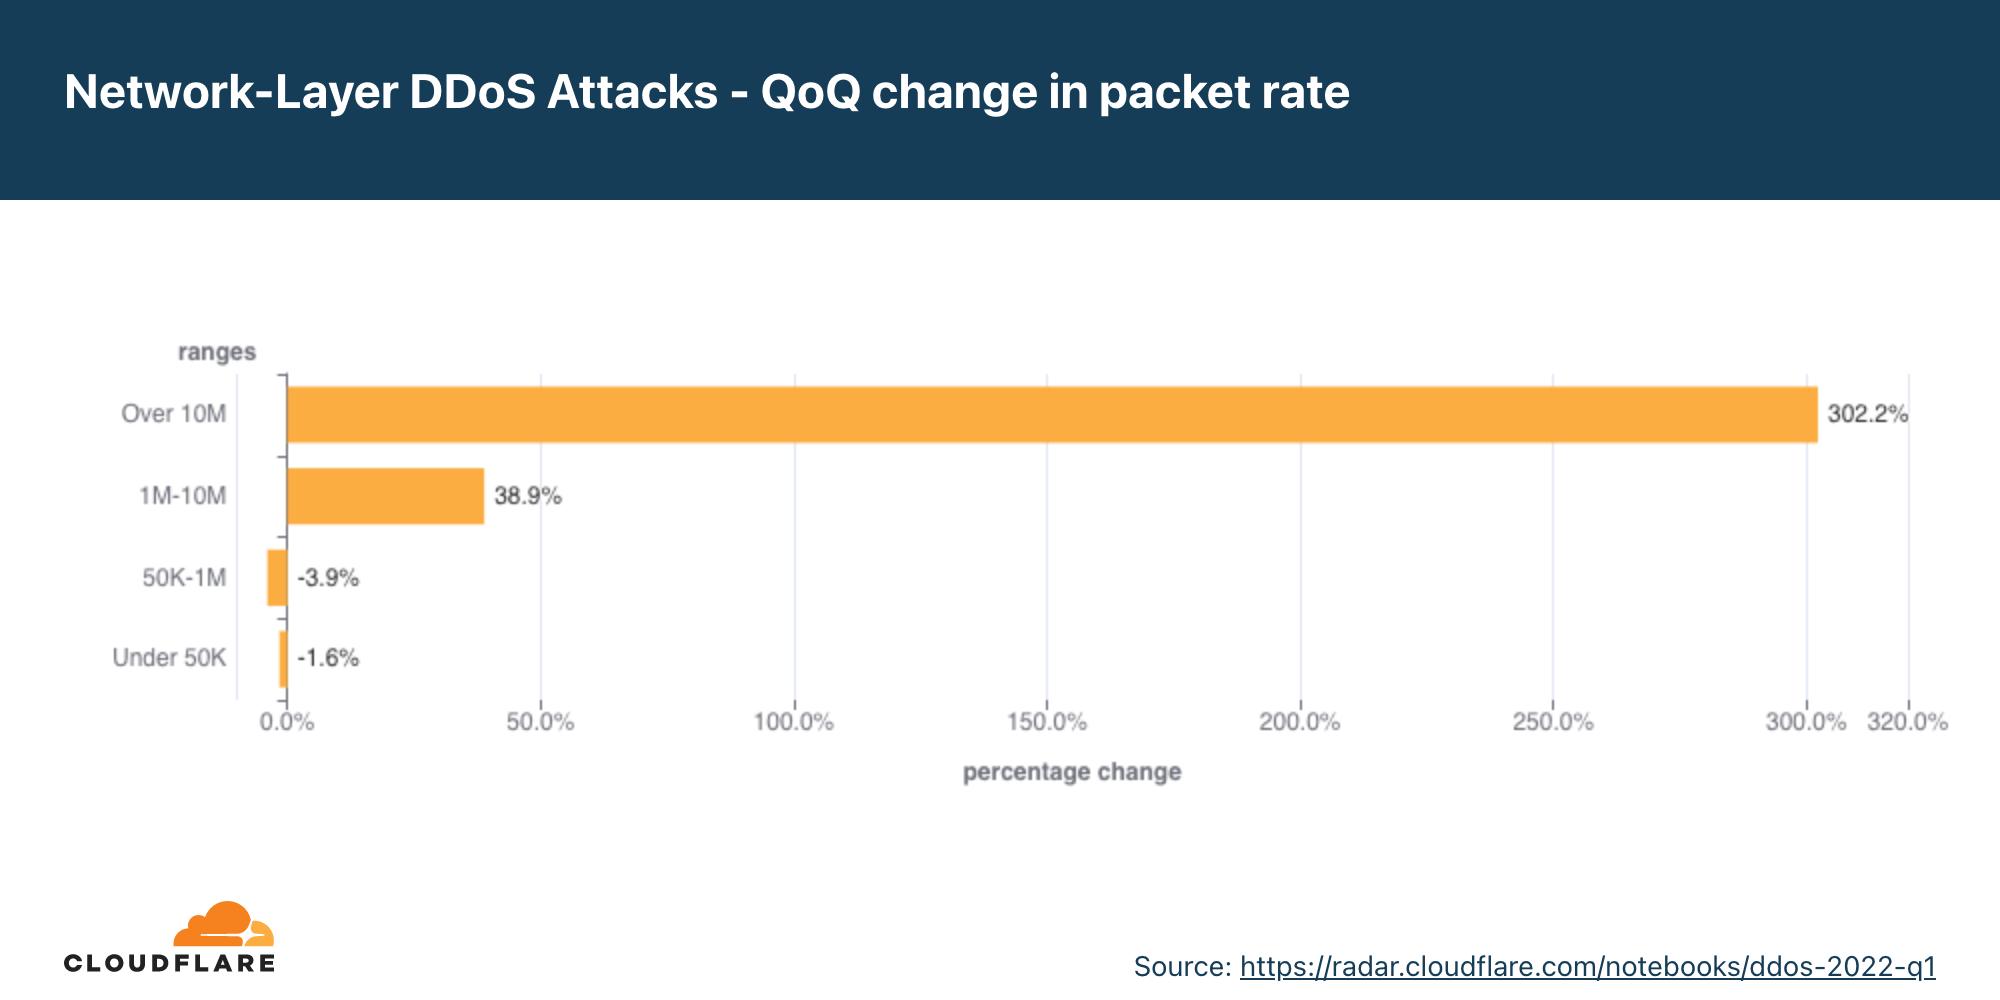
Distribution by packet rate
The majority of network-layer DDoS attacks remain below 50,000 packets per second. While 50 kpps is on the lower side of the spectrum at Cloudflare scale, it can still easily take down unprotected Internet properties and congest even a standard Gigabit Ethernet connection.
When we look at the changes in the attack sizes, we can see that attacks of over 10 Mpps grew by over 300% QoQ. Similarly, attacks of 1-10 Mpps grew by almost 40% QoQ.
Distribution by bitrate
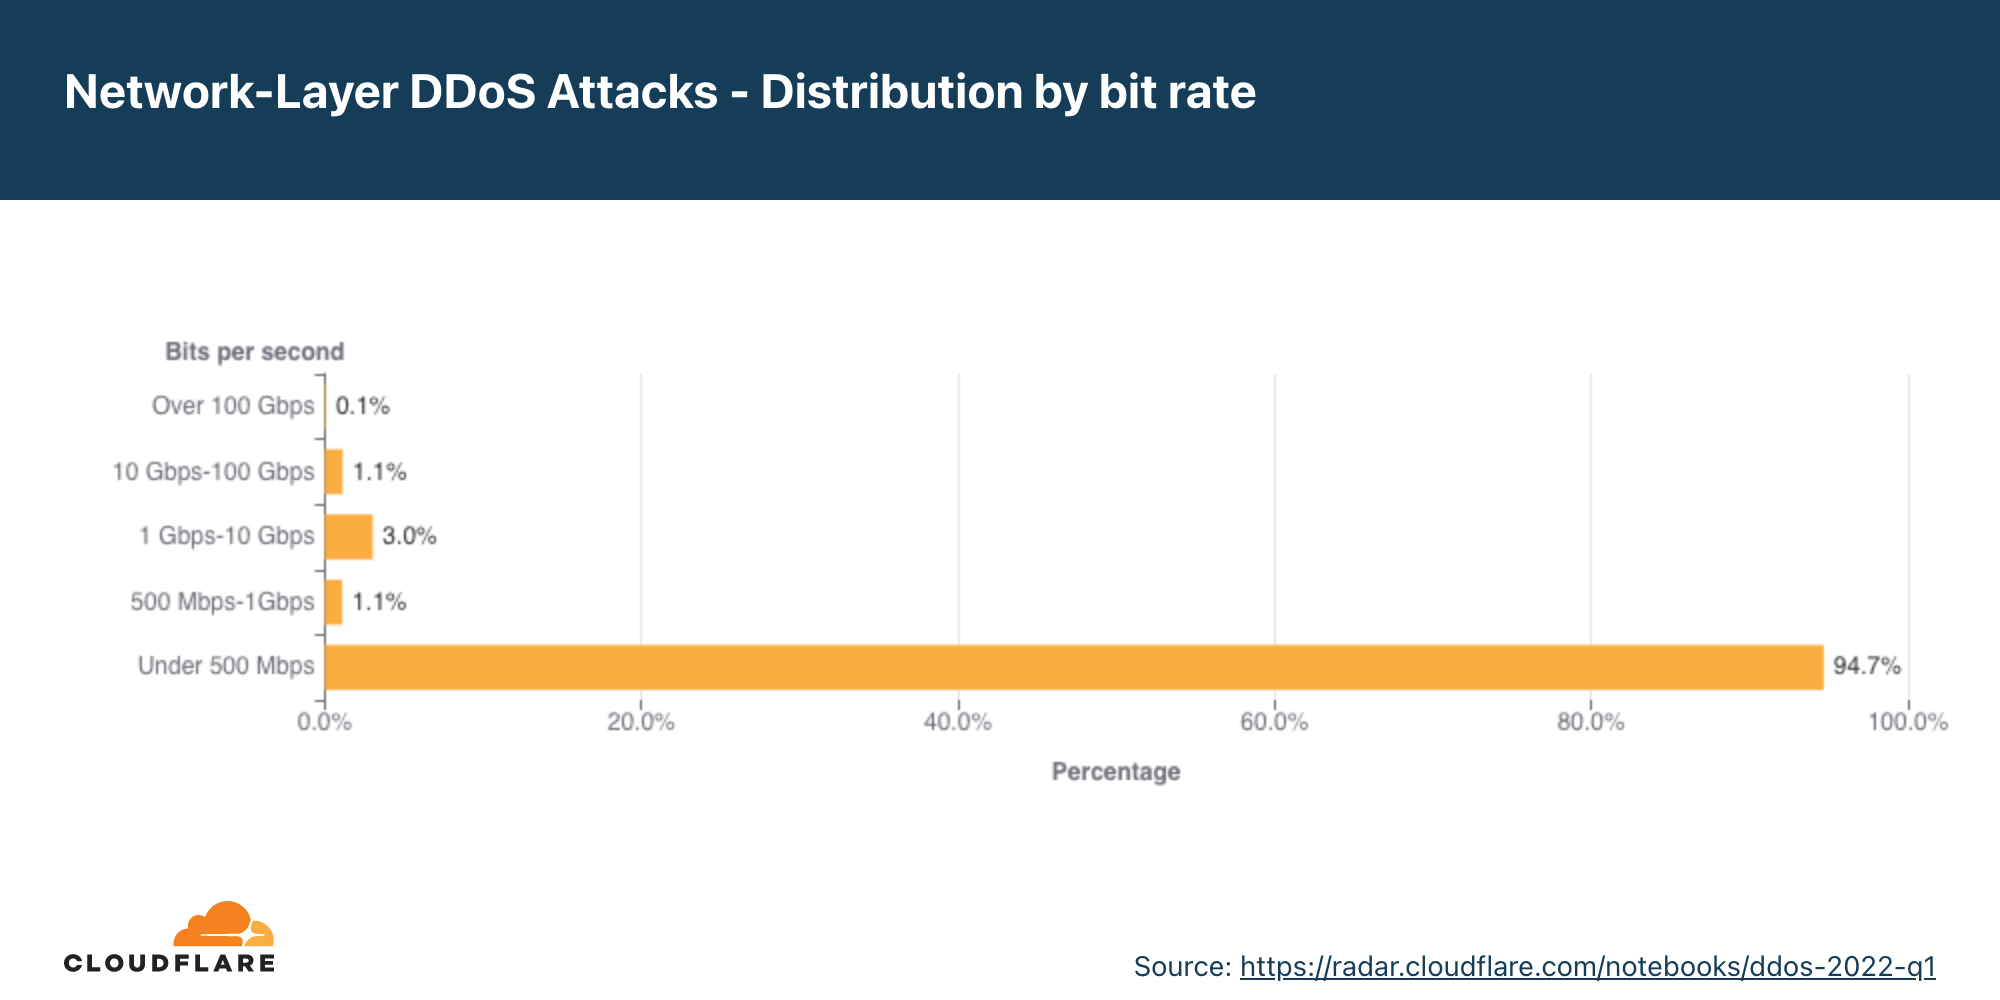
In Q1, most of the network-layer DDoS attacks remain below 500 Mbps. This too is a tiny drop in the water at Cloudflare scale, but can very quickly shut down unprotected Internet properties with less capacity or at the very least congest, even a standard Gigabit Ethernet connection.
Graph of the distribution of network-layer DDoS attacks by bit rate in 2022 Q1
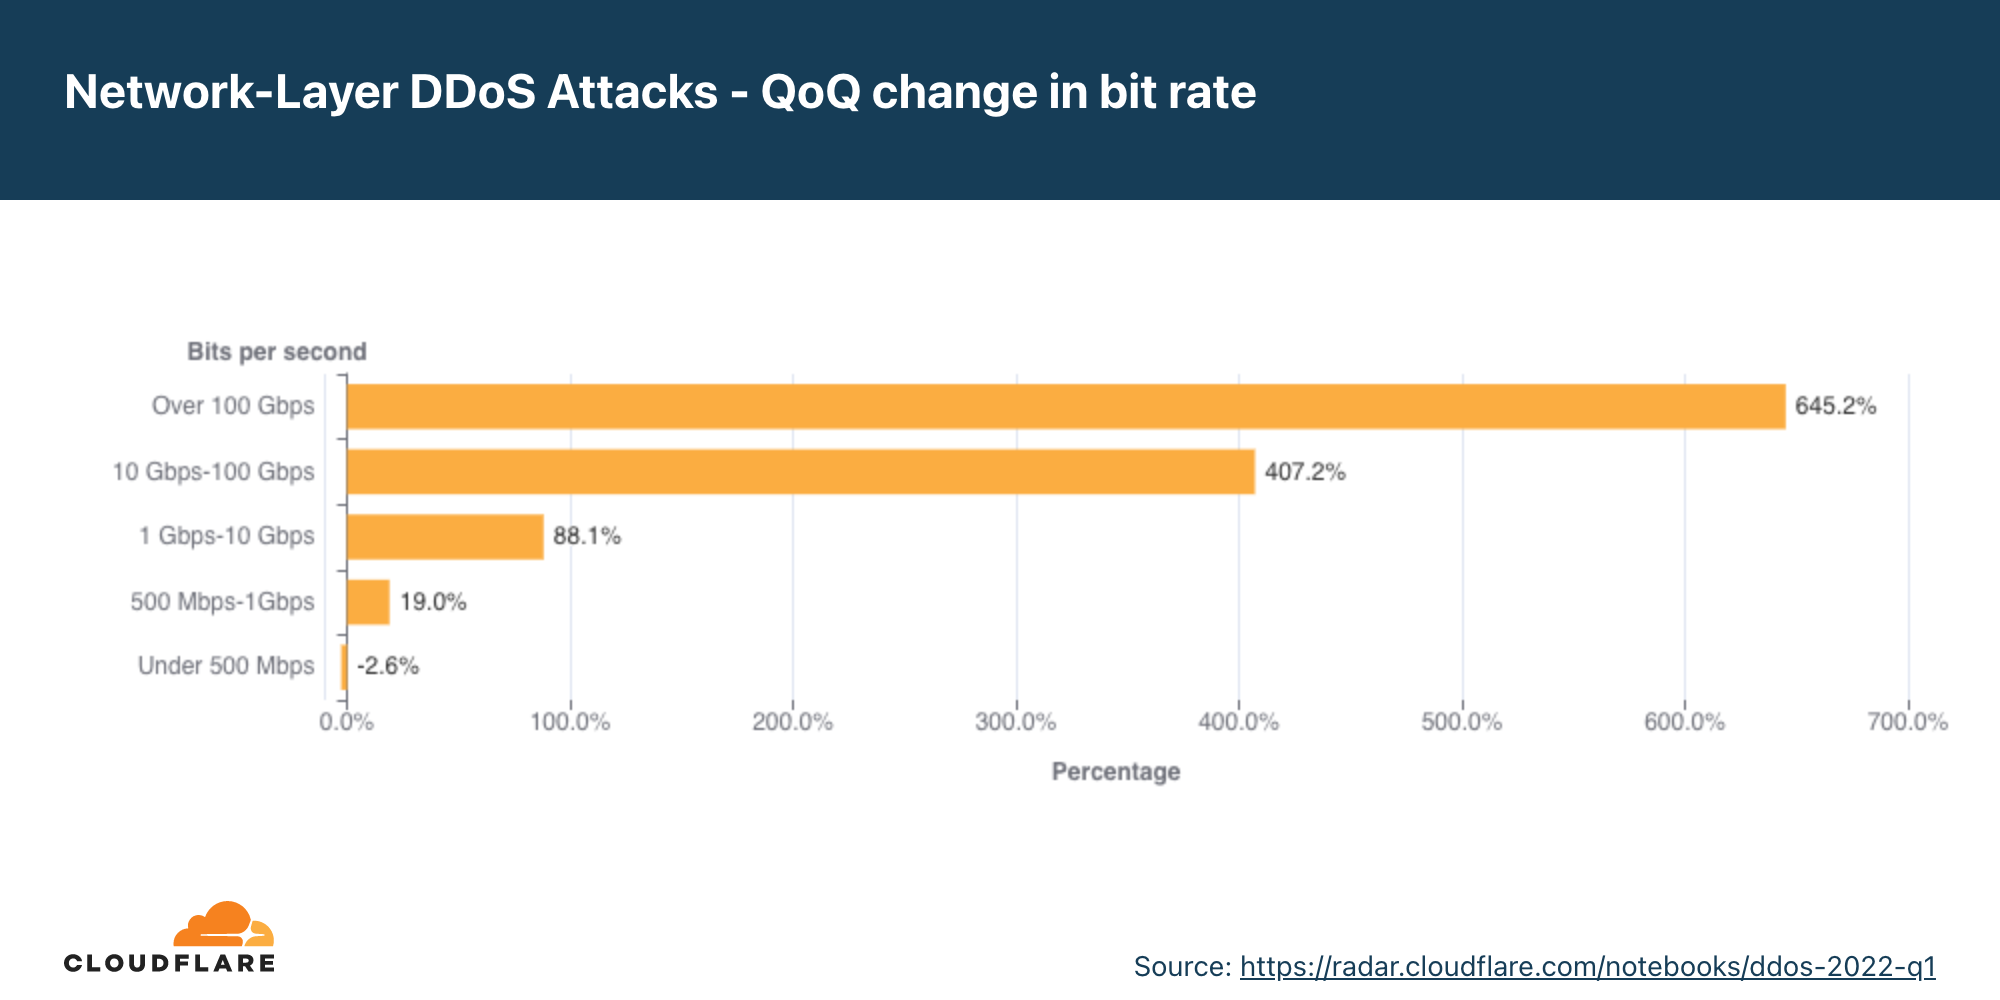
Similarly to the trends observed in the packet-per-second realm, here we can also see large increases. The amount of DDoS attacks that peaked over 100 Gbps increased by 645% QoQ; attacks peaking between 10 Gbps to 100 Gbps increased by 407%; attacks peaking between 1 Gbps to 10 Gbps increased by 88%; and even attacks peaking between 500 Mbps to 1 Gbps increased by almost 20% QoQ.
Network-layer DDoS attacks by duration
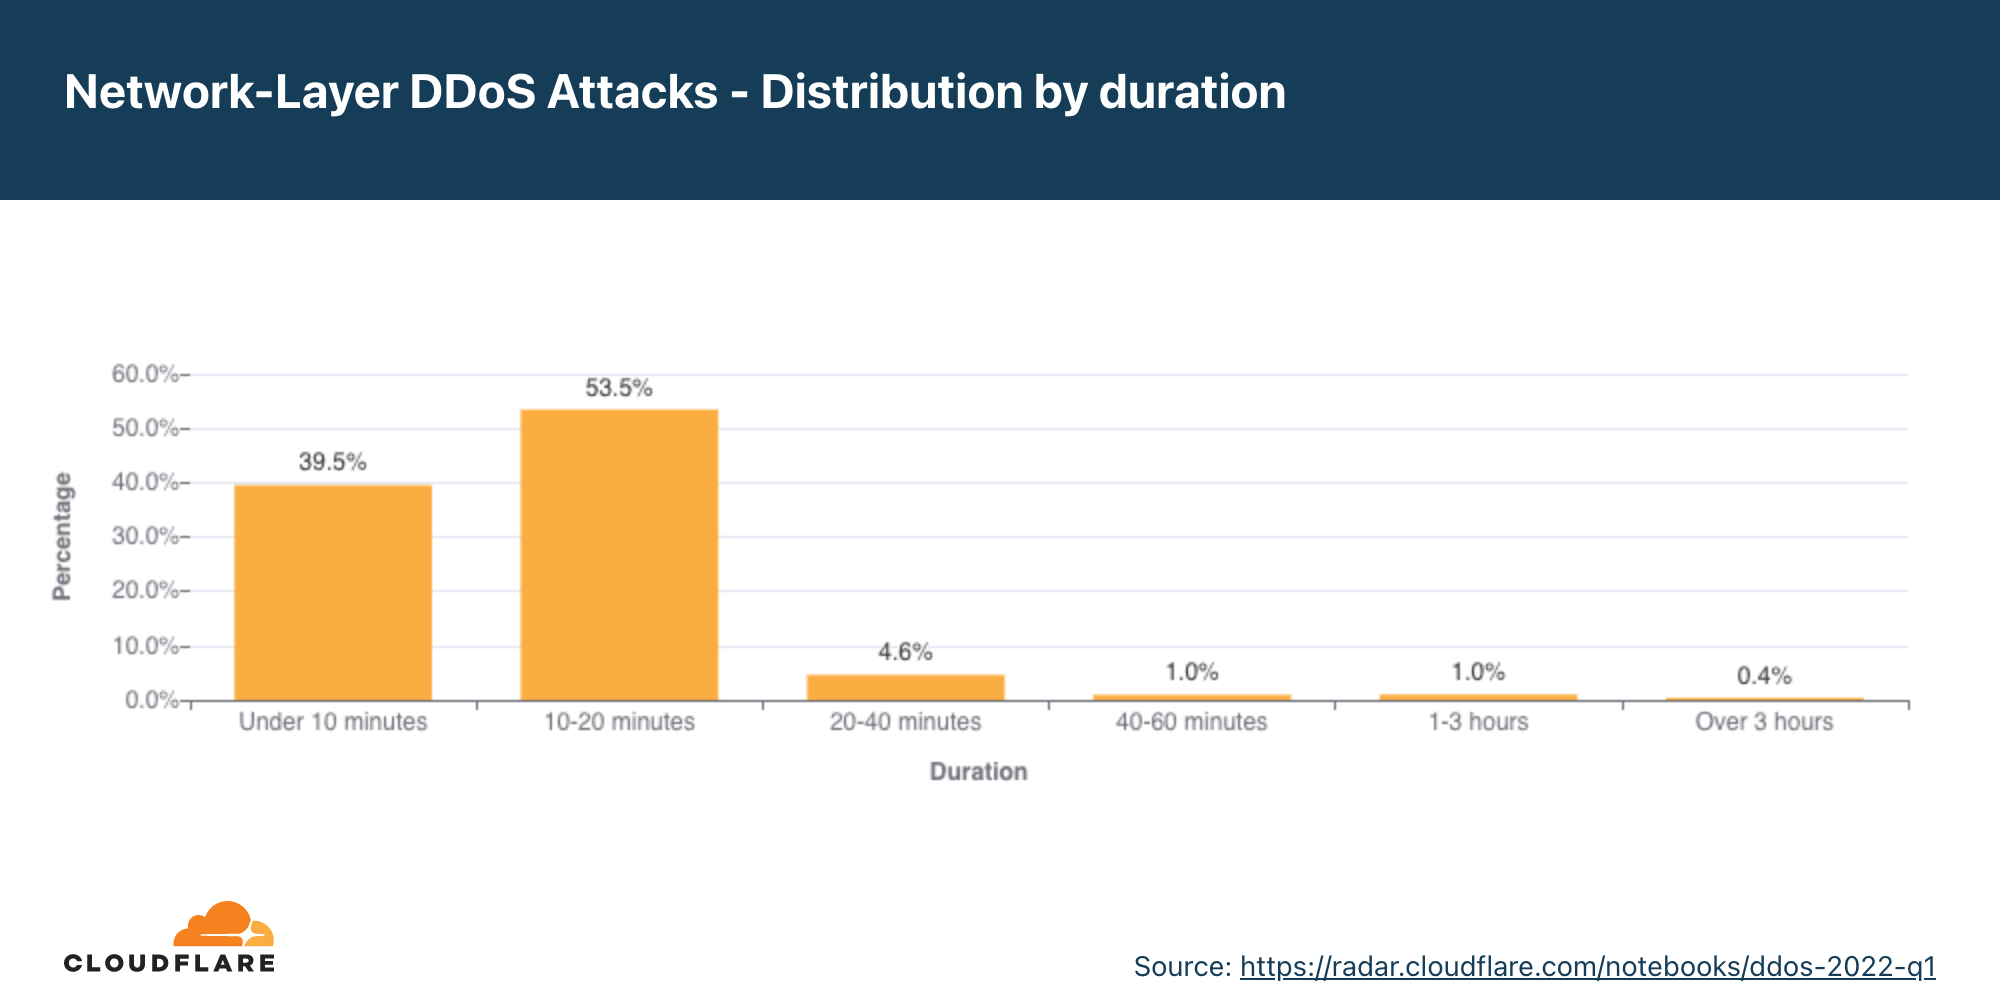
Most attacks remain under one hour in duration, reiterating the need for automated always-on DDoS mitigation solutions.
We measure the duration of an attack by recording the difference between when it is first detected by our systems as an attack and the last packet we see with that attack signature towards that specific target.
In previous reports, we provided a breakdown of ‘attacks under an hour’, and larger time ranges. However, in most cases over 90 percent of attacks last less than an hour. So starting from this report, we broke down the short attacks and grouped them by shorter time ranges to provide better granularity.
One important thing to keep in mind is that even if an attack lasts only a few minutes, if it is successful, the repercussions could last well beyond the initial attack duration. IT personnel responding to a successful attack may spend hours and even days restoring their services.
In the first quarter of 2022, more than half of the attacks lasted 10-20 minutes, approximately 40% ended within 10 minutes, another ~5% lasted 20-40 minutes, and the remaining lasted longer than 40 minutes.
Short attacks can easily go undetected, especially burst attacks that, within seconds, bombard a target with a significant number of packets, bytes, or requests. In this case, DDoS protection services that rely on manual mitigation by security analysis have no chance in mitigating the attack in time. They can only learn from it in their post-attack analysis, then deploy a new rule that filters the attack fingerprint and hope to catch it next time. Similarly, using an “on-demand” service, where the security team will redirect traffic to a DDoS provider during the attack, is also inefficient because the attack will already be over before the traffic routes to the on-demand DDoS provider.
It’s recommended that companies use automated, always-on DDoS protection services that analyze traffic and apply real-time fingerprinting fast enough to block short-lived attacks.
Summary
Cloudflare’s mission is to help build a better Internet. A better Internet is one that is more secure, faster, and reliable for everyone — even in the face of DDoS attacks. As part of our mission, since 2017, we’ve been providing unmetered and unlimited DDoS protection for free to all of our customers. Over the years, it has become increasingly easier for attackers to launch DDoS attacks. But as easy as it has become, we want to make sure that it is even easier — and free — for organizations of all sizes to protect themselves against DDoS attacks of all types.
Not using Cloudflare yet? Start now with our Free and Pro plans to protect your websites, or contact us for comprehensive DDoS protection for your entire network using Magic Transit.
The Justice Department announced the disruption of a Russian GRU-controlled botnet:
The Justice Department today announced a court-authorized operation, conducted in March 2022, to disrupt a two-tiered global botnet of thousands of infected network hardware devices under the control of a threat actor known to security researchers as Sandworm, which the U.S. government has previously attributed to the Main Intelligence Directorate of the General Staff of the Armed Forces of the Russian Federation (the GRU). The operation copied and removed malware from vulnerable internet-connected firewall devices that Sandworm used for command and control (C2) of the underlying botnet. Although the operation did not involve access to the Sandworm malware on the thousands of underlying victim devices worldwide, referred to as “bots,” the disabling of the C2 mechanism severed those bots from the Sandworm C2 devices’ control.
The botnet “targets network devices manufactured by WatchGuard Technologies Inc. (WatchGuard) and ASUSTek Computer Inc. (ASUS).” And note that only the command-and-control mechanism was disrupted. Those devices are still vulnerable.
The Justice Department made a point that they did this before the botnet was used for anything offensive.
Following Russia’s unjustified and tragic invasion of Ukraine in late February, the world has watched closely as Russian troops attempted to advance across Ukraine, only to be resisted and repelled by the Ukrainian people. Similarly, we’ve seen a significant amount of cyber attack activity in the region. We continue to work to protect an increasing number of Ukrainian government, media, financial, and nonprofit websites, and we protected the Ukrainian top level domain (.ua) to help keep Ukraine’s presence on the Internet operational.
At the same time, we’ve closely watched significant and unprecedented activity on the Internet in Russia. The Russian government has taken steps to tighten its control over both the technical components and the content of the Russian Internet. For their part, the people in Russia are doing something very different. They have been adopting tools to maintain access to the global Internet, and they have been seeking out non-Russian media sources. This blog post outlines what we’ve observed.
The Russian Government asserts control over the Internet
Over the last five years, the Russian government has taken steps to tighten its control of a sovereign Internet within Russia’s borders, including laws requiring Russian ISPs to install equipment allowing the government to monitor and block Internet activity, and requiring the establishment of an exclusively Russian DNS (outside ICANN). And it created mechanisms for the Russian government to control how Russia was connected to the global Internet, so they could pull the plug if they wanted.
Since the Russian invasion of Ukraine, the Russian government has made a series of announcements related to implementation of its sovereign Internet laws. Russian government agencies were instructed to switch to Russian DNS servers, move public resources to Russian hosting services, and take a number of other steps designed to reduce reliance on non-Russian providers. Although some took these initiatives as an announcement that Russia intended to disconnect from the global Internet, so far Russia does not appear to have leveraged the tools it has to disconnect itself entirely from the global Internet. We continue to see connections processing successfully in Russia through non-Russia infrastructure.
In the meantime, authorities in Russia have implemented a series of targeted blocking actions against websites and operators that they find objectionable. Initially, officials targeted popular social media sites like Facebook, Instagram, Twitter, and YouTube, as well as Russian language outlets based outside of the country.
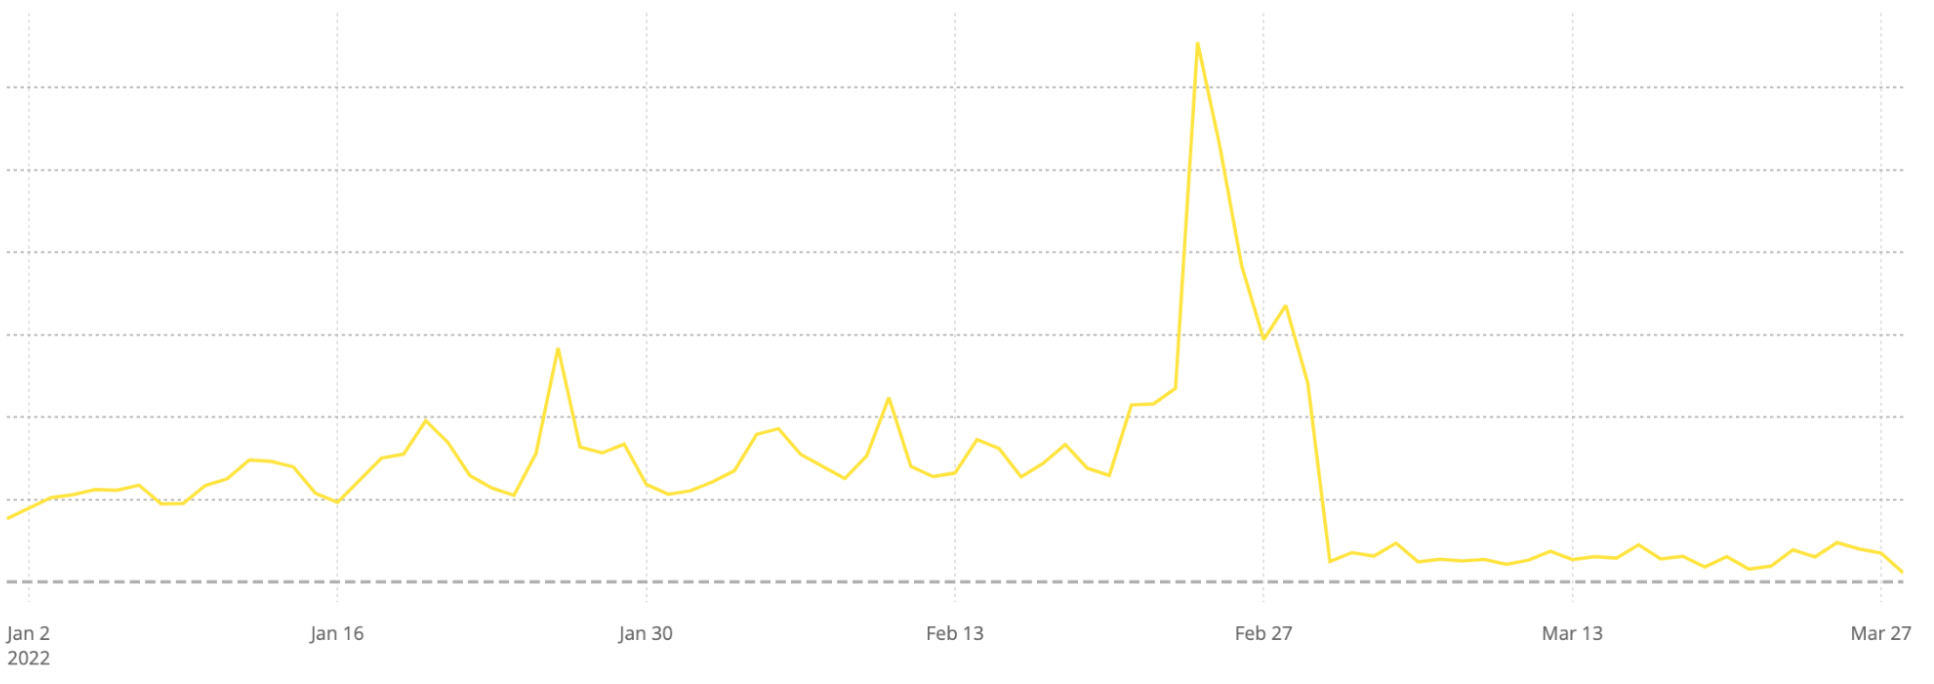
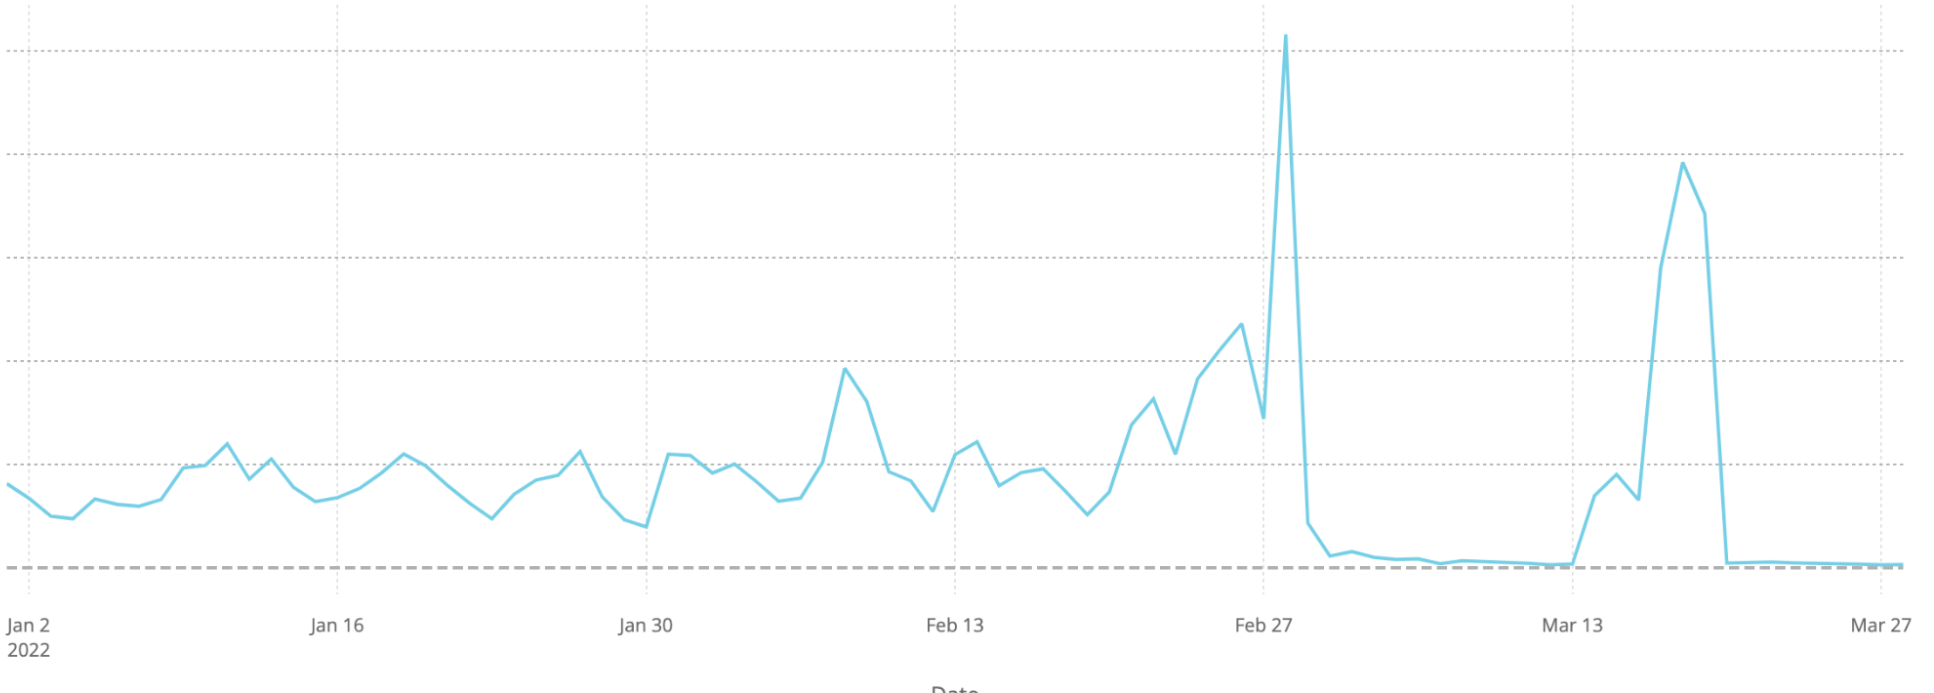
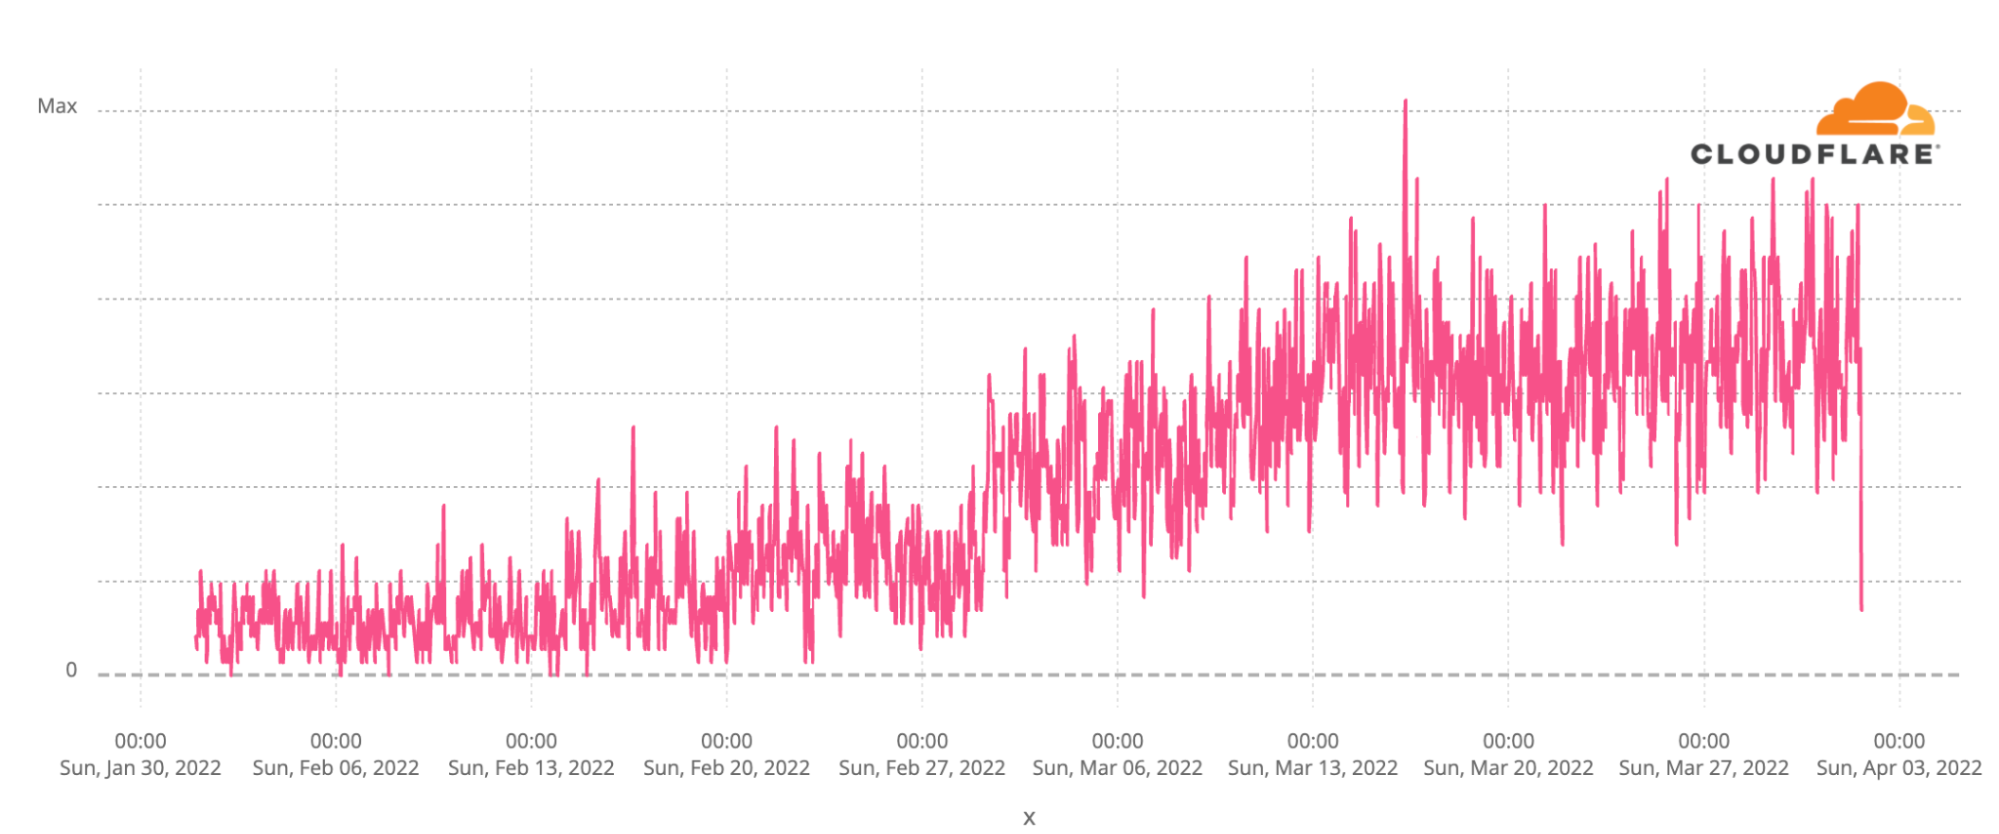
We can see the effect of some of those blocks on traffic from Russian users to different news websites in Russia and Ukraine before and after blocks were implemented.
In each case, these news sites saw exponential growth in their traffic in the days around the February 24th invasion of Ukraine. But that increase was met within a matter of days by actions to block traffic to those sites. The blocks had varying degrees of success over the first few weeks, though each of them seem to have been eventually successful in denying access to those sources of news through traditional Internet channels.
But that is only half the story. As the Russian government took steps to control traditional channels for Internet access, there were shifts in the ways many Russians used the Internet.
Russian citizens turning to tools to gain access to the open Internet
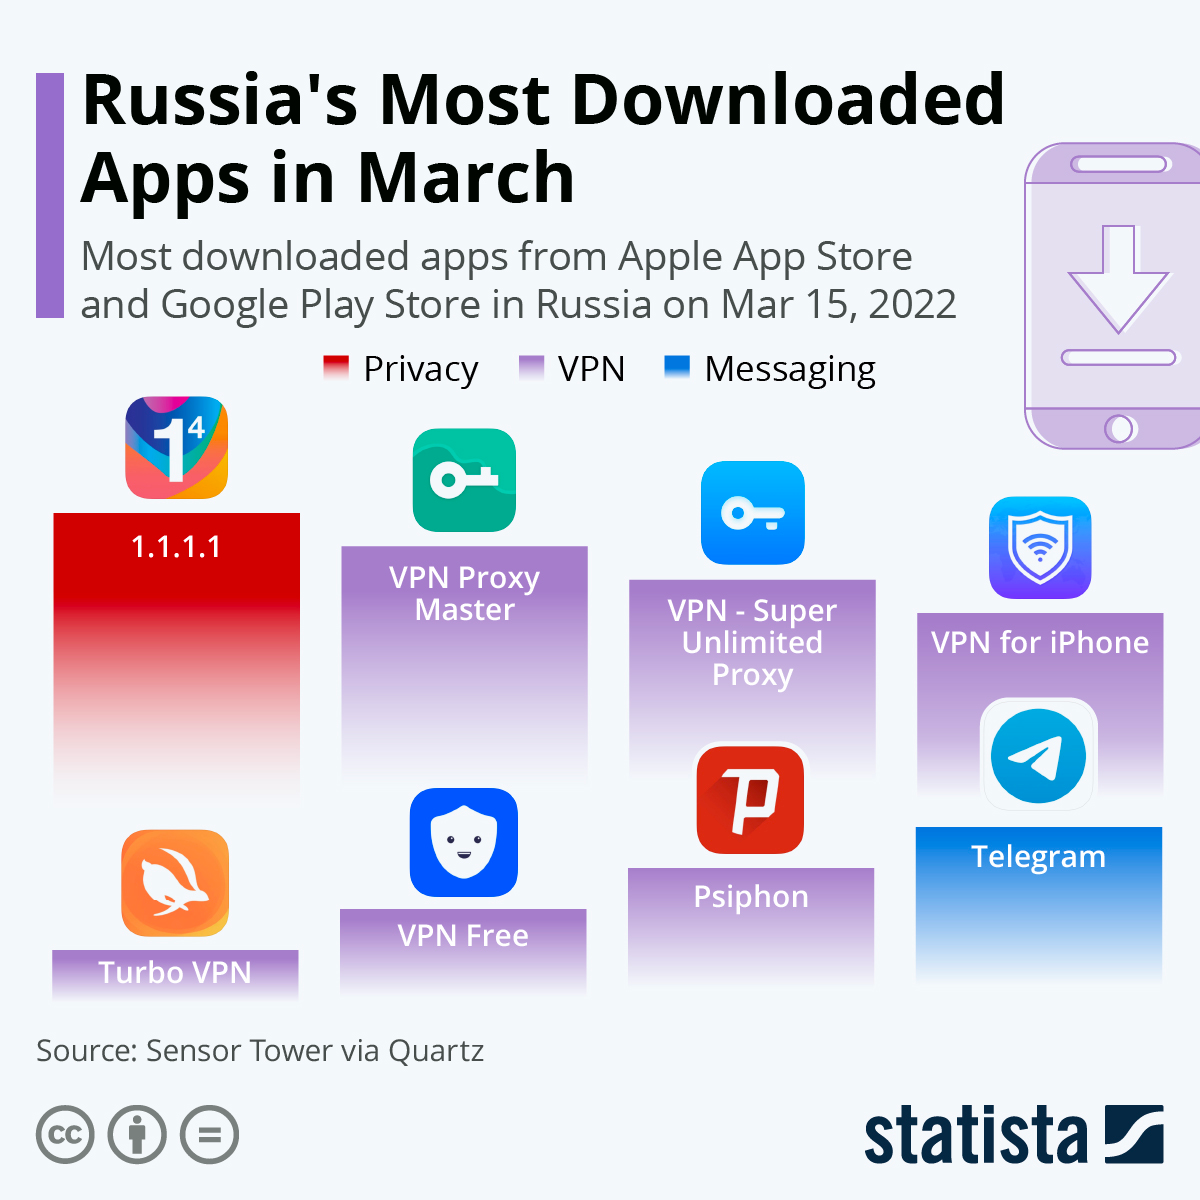
Russians have been adopting applications and tools that allow them to engage with the Internet privately and avoid some of the mechanisms that the Russian government is using to control and monitor access to the Internet. Whereas the most popular applications in the Apple App Store in most of the world in March continue to relate to social media and games, the leaderboard in Russia looked very different:
All of the top apps in Russia in March were for private and secure Internet access or encrypted messaging apps, including the most downloaded app – Cloudflare’s own WARP / 1.1.1.1 (a privacy-based recursive DNS resolver). This list of popular apps is a stunning contrast with every other country in the world.
Because of the significant and important popularity of WARP (1.1.1.1), we’ve had some detailed insight into exactly how this has played out. If we look back to the beginning of February we see that Cloudflare’s WARP tool was little used in Russia. Its use took off from the first weekend of the war, and peaked two weeks ago. Later, after this virtual migration to such secure tools became apparent, we saw attempts to block access to the tools used to access the Internet securely.
While levels have receded from their peak, a large number of Russians continue to use Cloudflare WARP in Russia at massively higher levels than pre-war.
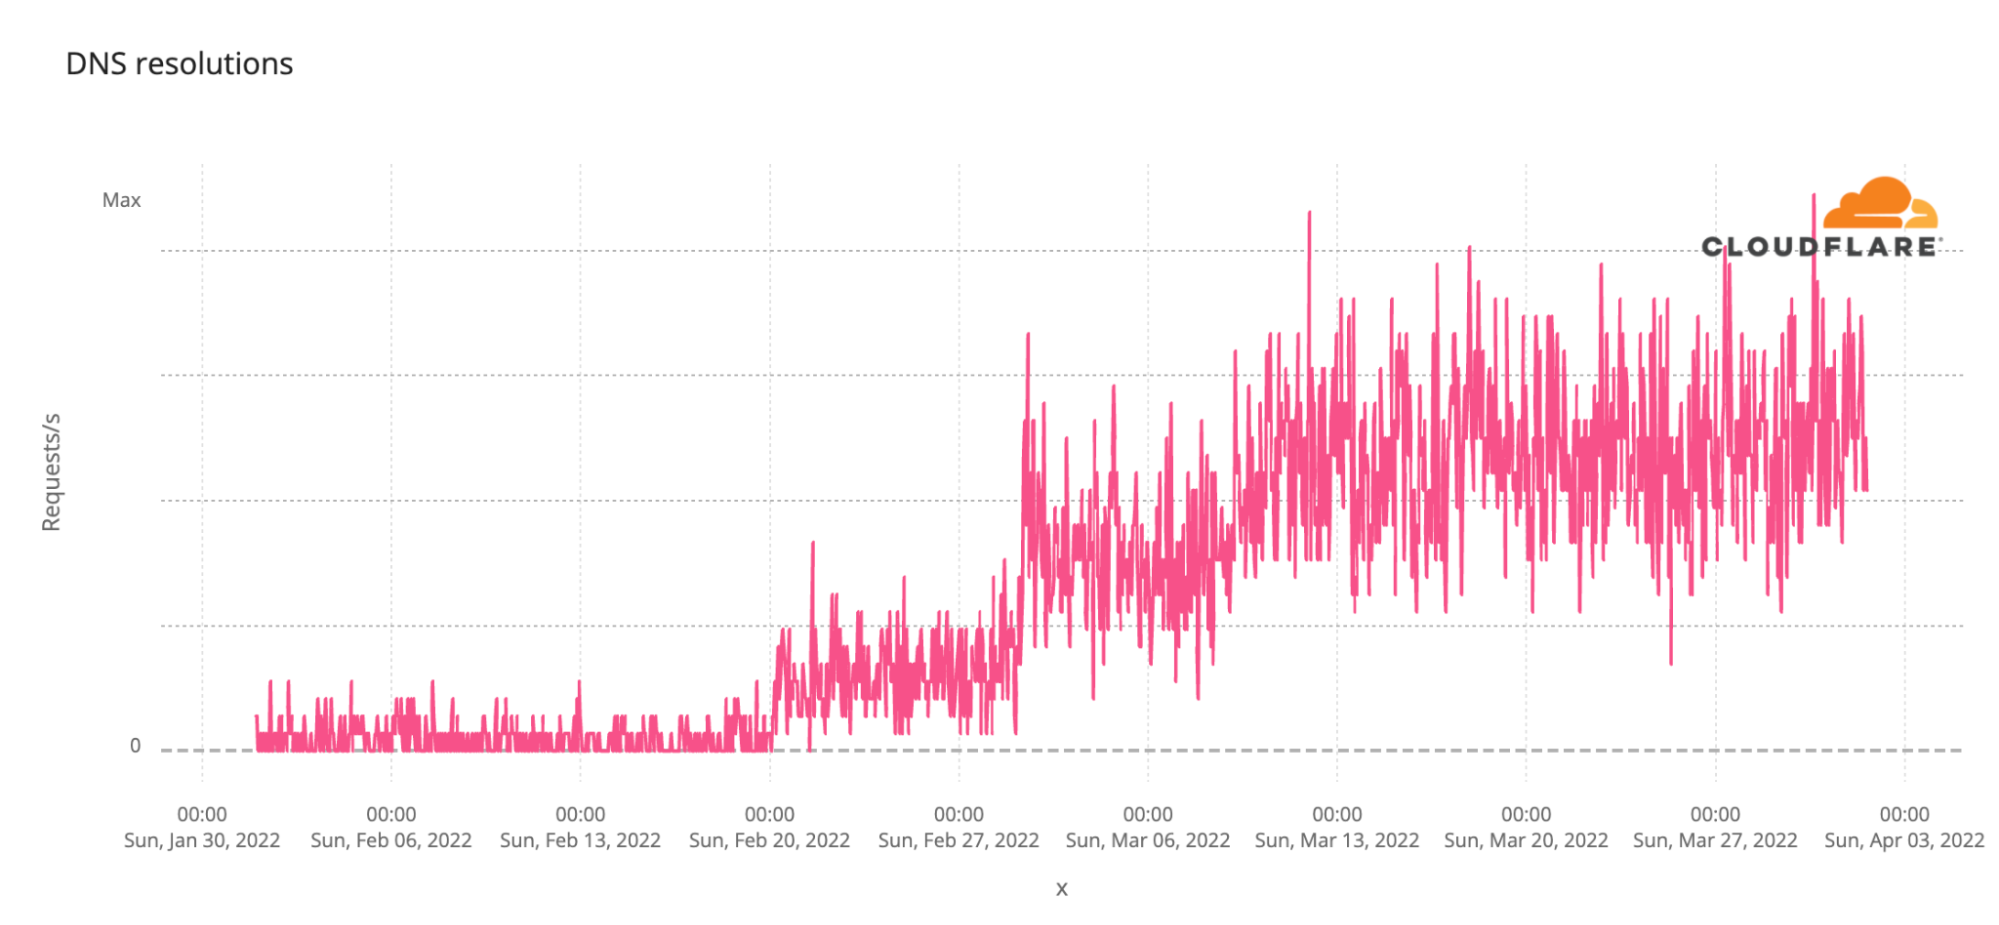
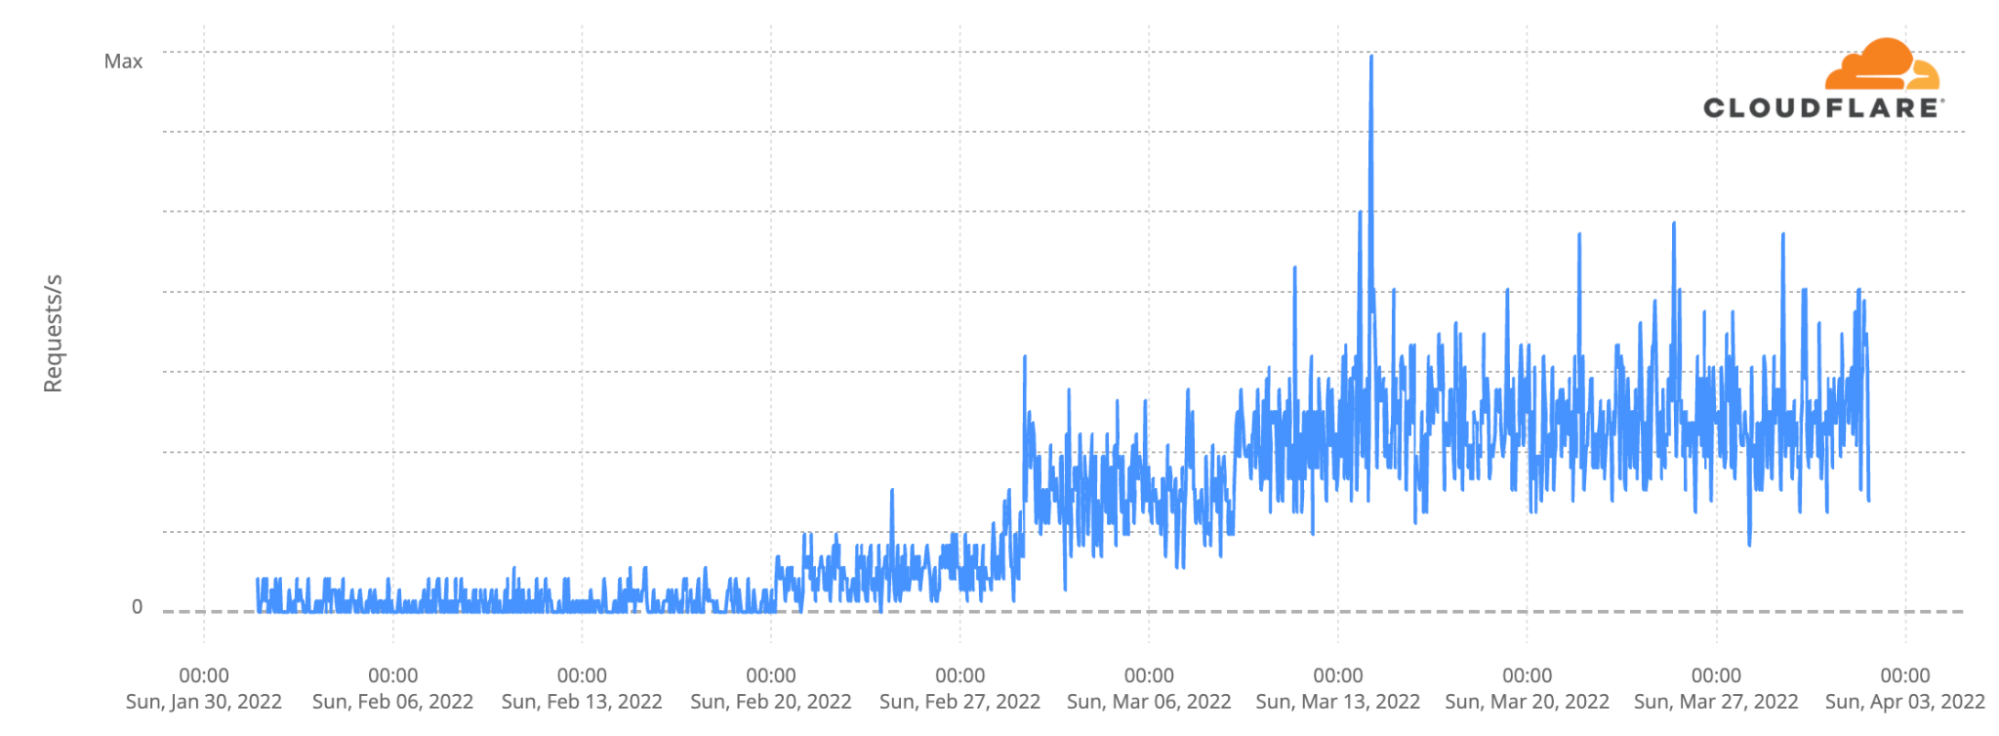
In addition to the ways Russians are using the Internet increasingly relying on private and encrypted communications, we’ve also seen a shift in what they are trying to access. Here’s a chart of DNS requests from Russian users for a well known US newspaper. Recent DNS traffic for the site has quintupled compared to pre-war levels, indicating Russians are trying to access that news source.
And here’s DNS traffic for a large French news source. Again, DNS lookups have grown enormously as Russians try to access it.
And here’s a British newspaper.
The picture is clear from these three charts. Russians want access to non-Russian news sources and based on the popularity of private Internet access tools and VPNs, they are willing to work to get it.
A front line against cyberattack
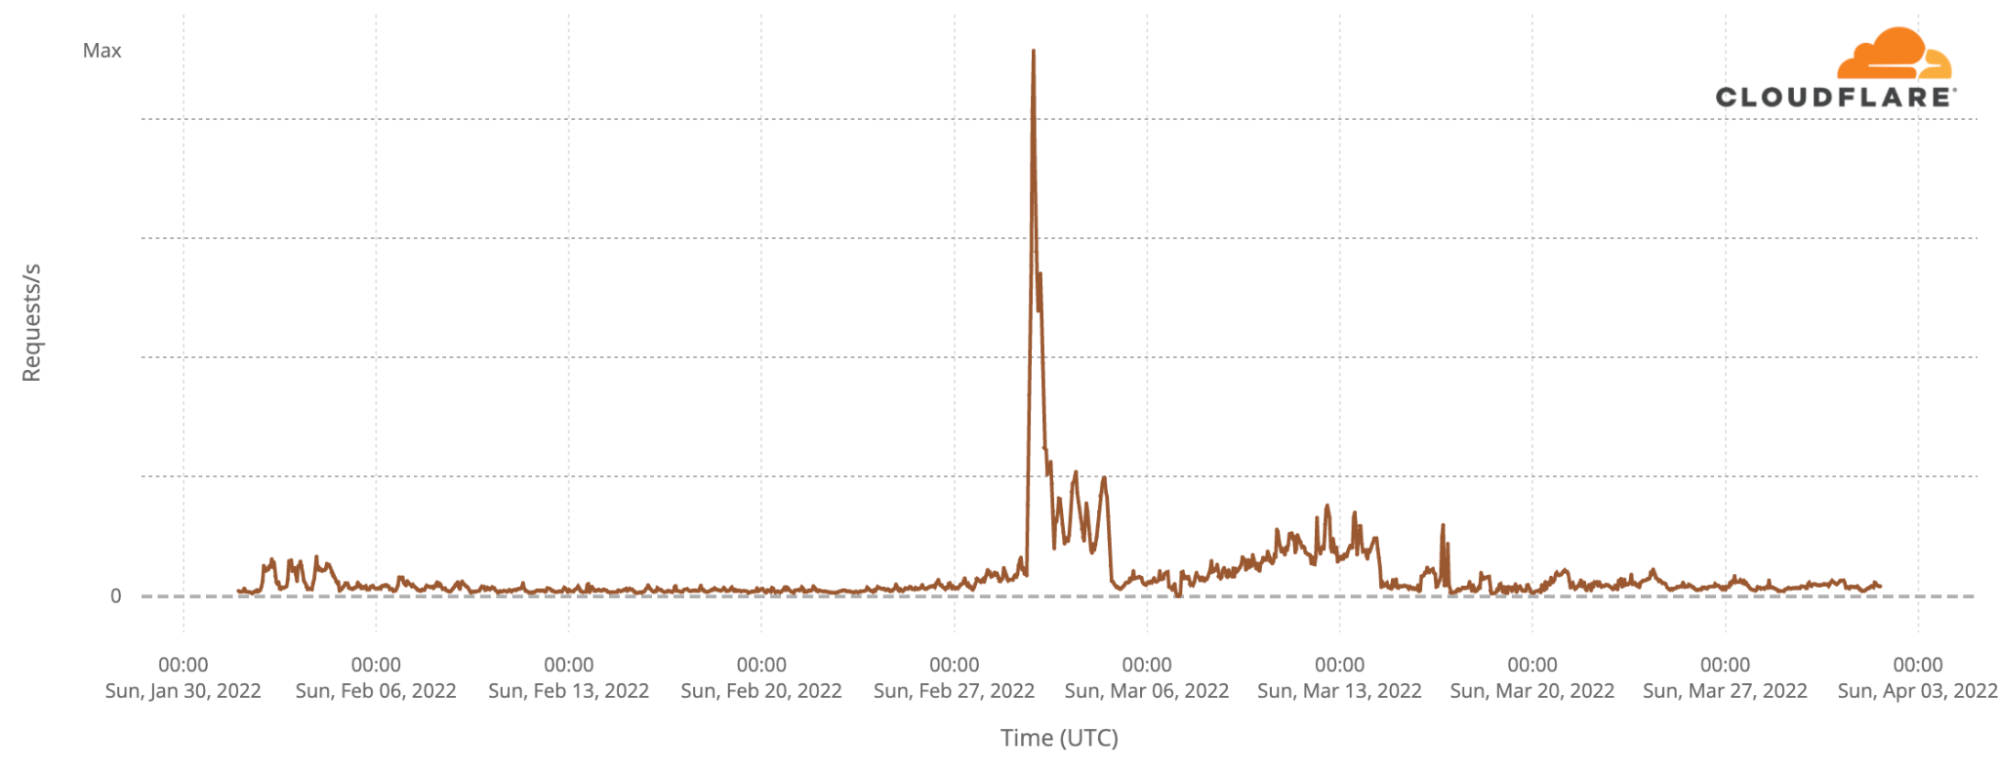
In addition to the services we’ve been able to provide average citizens in Russia, our servers at the edge of the Internet in-country have also permitted us to detect and block attacks originating there. When attacks are mitigated inside Russia, they never travel outside Russian borders. That’s always been part of the proposition of Cloudflare’s distributed network – to identify and block cyber attacks (especially DDoS attacks) locally and before they can ever get off the ground.
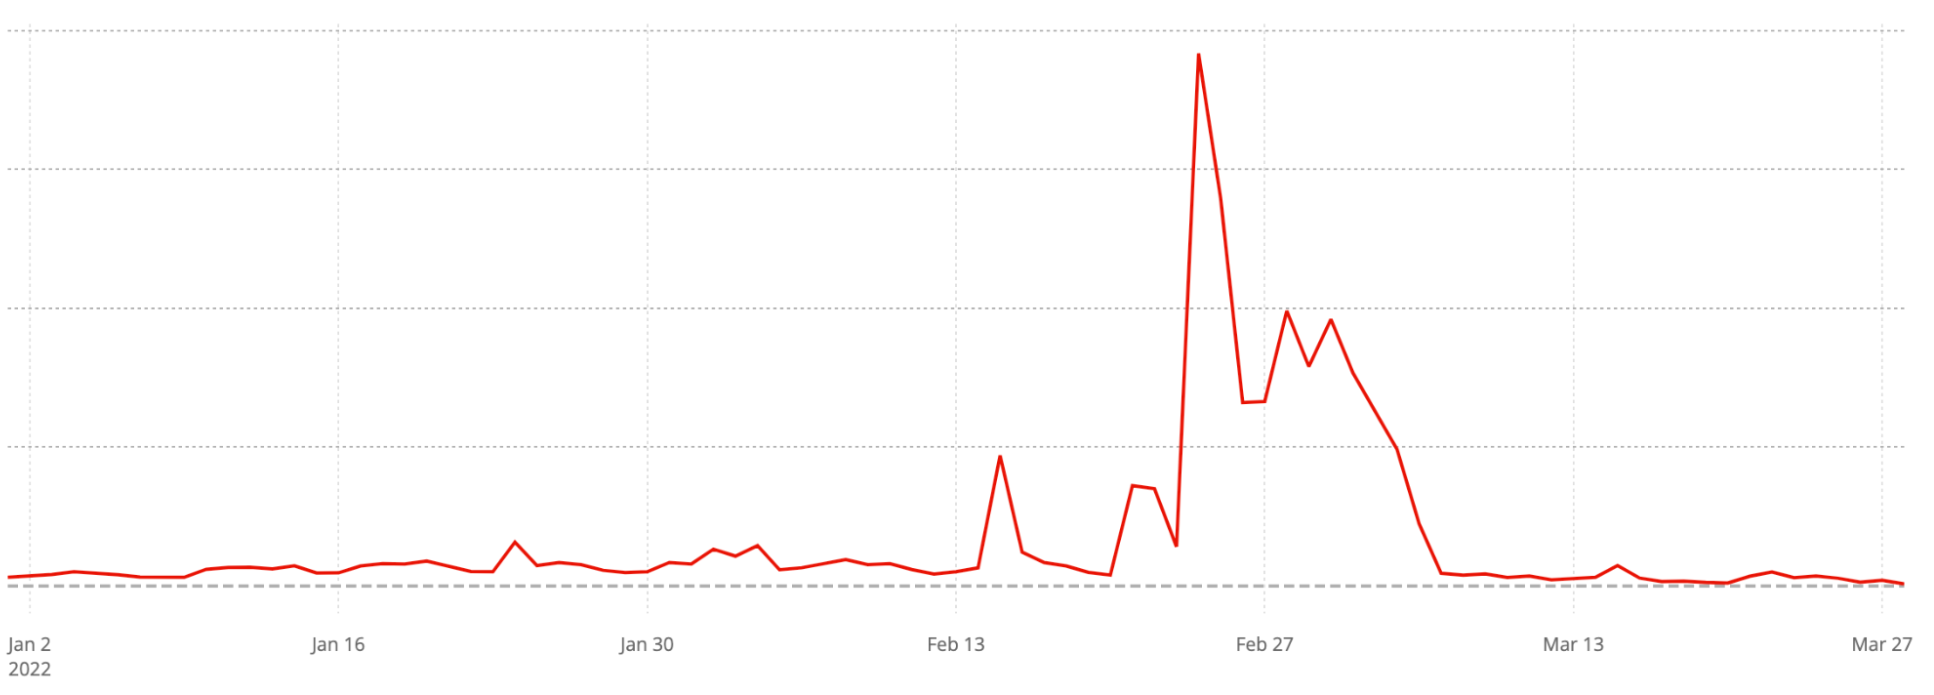
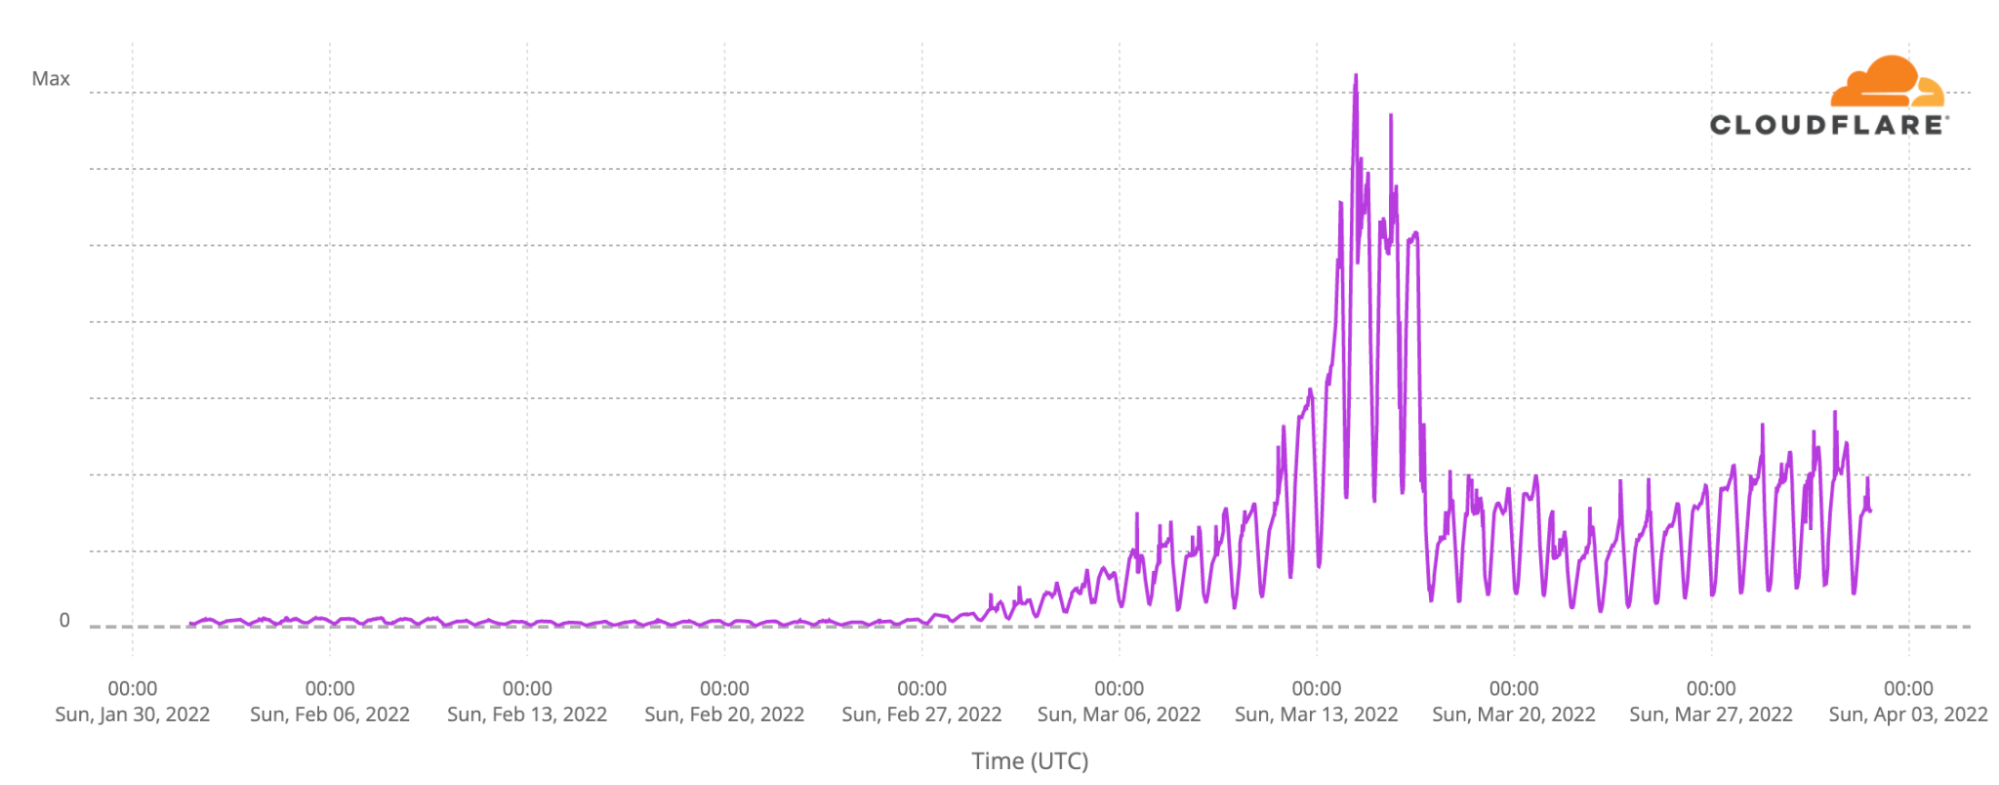
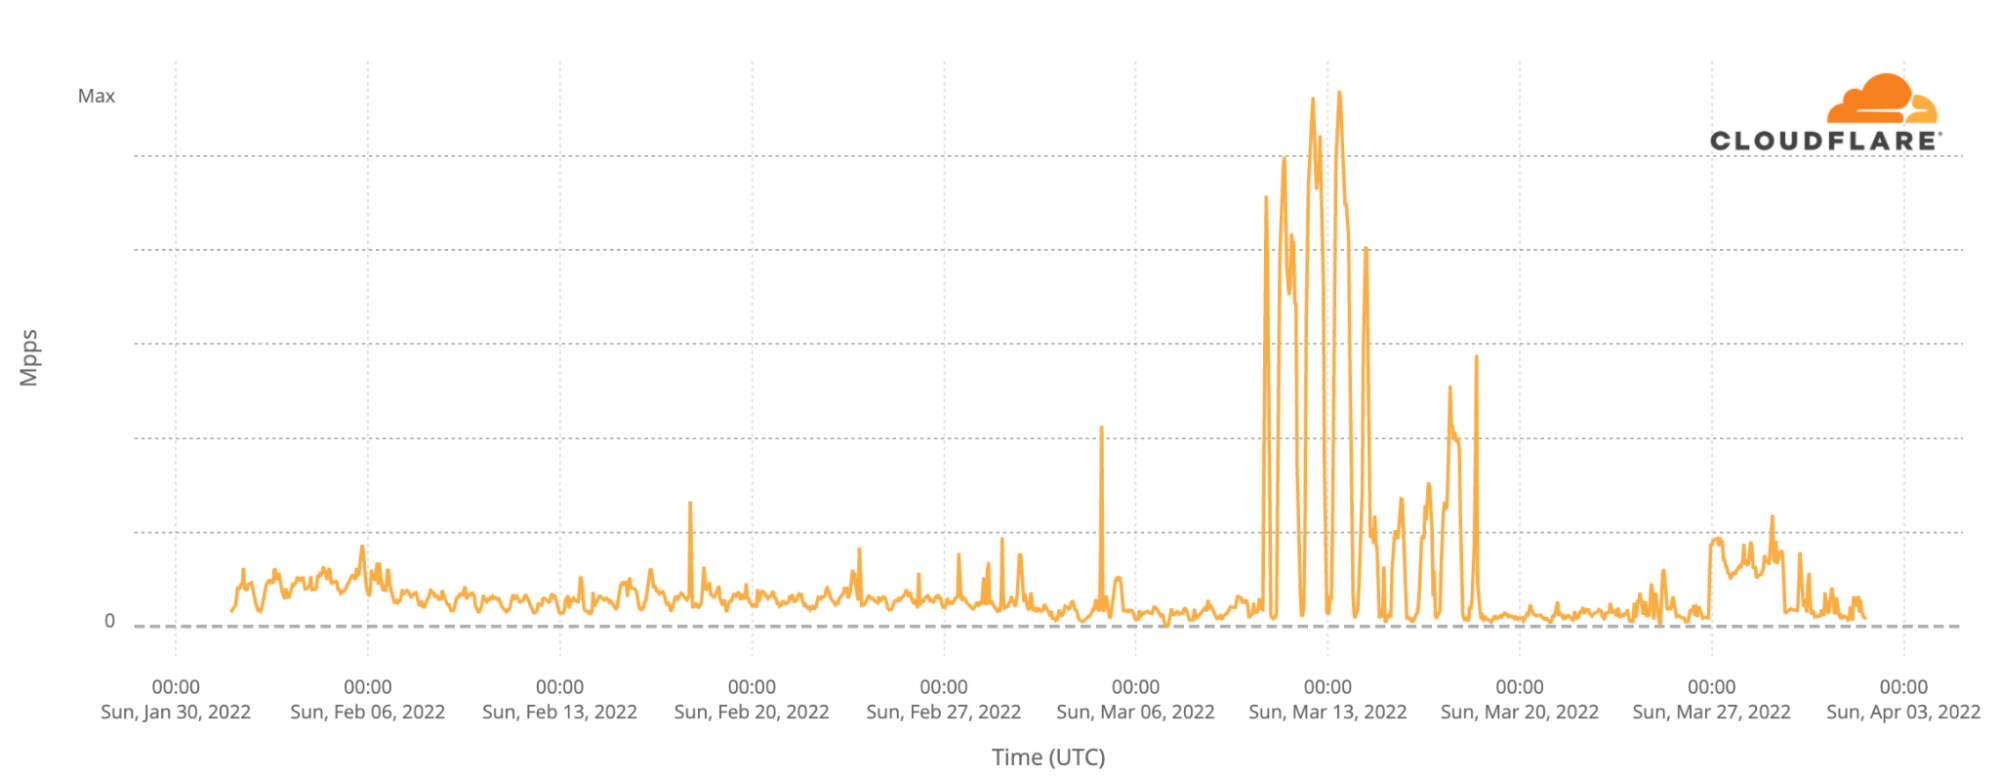
Here’s what DDoS activity originating inside Russia and blocked there by Cloudflare has looked like since the beginning of February. Normal DDoS activity originating from Russian networks and blocked by Cloudflare’s servers there is relatively low throughout February but then grows massively in the middle of March.
To be clear, being able to identify where cyber attack traffic originates is not the same as being able to attribute where the attacker is located. Attributing cyber attacks is difficult, and now is a time to be particularly careful with attribution. It is relatively common for cyber attackers to launch attacks from remote locations around the world. This often happens when they are able to hijack devices in other countries through things like IoT (Internet of Things) corruptions.
But even with such subterfuge, we’ve still seen a significant increase in the number of blocked attacks that are hitting our servers inside Russia.
A few weeks ago, as the invasion of Ukraine was in its early stages, I noted that “Russia needs more Internet, not less.” At a time of unprecedented economic sanctions by the United States and Europe, there have been calls for all foreign companies to go further and exit Russia completely, including calls for Internet providers to disconnect Russia. To be clear, Cloudflare has minimal sales and commercial activity in Russia – we’ve never had a corporate entity, an office, or employees there – and we’ve taken steps to ensure that we’re not paying taxes or fees to the Russian government. But given the significant impact of our services on the availability and security of the Internet, we believe removing our services from Russia altogether would do more harm than good.
While we deeply appreciate the motivation of the calls for companies to exit Russia, this withdrawal by Internet companies can have the unintended effect of advancing and entrenching the interests of the Russian government to control the Internet in Russia. Efforts to have Russia cut off from the global Internet through ICANN and RIPE will only cut off the Russian people from information about the war in Ukraine that the Russian government doesn’t want them to access. After a number of U.S.-based certificate authorities stopped issuing SSL certificates for Russian websites, Russia responded in early March by encouraging Russian citizens to download a Russian Root Certificate Authority instead. As observed by EFF, “the Russian state’s stopgap measure to keep its services running also enables spying on Russians, now and in the future.”
This is why there has been near universal agreement by experts that it is imperative the Russian Internet stay as open as possible for the Russian people. Dozens of civil society groups have urged governments to work to counteract authoritarian actions “and ensure that sanctions and other steps meant to repudiate the Russian government’s illegal actions do not backfire, by reinforcing Putin’s efforts to assert information control.” Russian digital rights activists have pleaded with service providers to offer Russians free VPN access so they are not left isolated from global news sources. Even the U.S. State Department has made clear, “It is critical to maintain the flow of information to the people of Russia to the fullest extent possible.”
Supporting our mission to help build a better Internet, it’s been a busy six weeks for our team monitoring these developments and working around the clock to make sure Ukrainian web properties are defended and that ordinary Russians can access the global Internet. We remain in awe of the brave Ukrainians standing up in defense of their homeland, and continue to hope that peace will prevail.
The Conti ransomware gang runs like any number of businesses around the world. It has multiple departments, from HR and administrators to coders and researchers. It has policies on how its hackers should process their code, and shares best practices to keep the group’s members hidden from law enforcement.
The White House has issued its starkest warning that Russia may be planning cyberattacks against critical-sector U.S. companies amid the Ukraine invasion.
[…]
Context: The alert comes after Russia has lobbed a series of digital attacks at the Ukrainian government and critical industry sectors. But there’s been no sign so far of major disruptive hacks against U.S. targets even as the government has imposed increasingly harsh sanctions that have battered the Russian economy.
The public alert followed classified briefings government officials conducted last week for more than 100 companies in sectors at the highest risk of Russian hacks, Neuberger said. The briefing was prompted by “preparatory activity” by Russian hackers, she said.
U.S. analysts have detected scanning of some critical sectors’ computers by Russian government actors and other preparatory work, one U.S. official told my colleague Ellen Nakashima on the condition of anonymity because of the matter’s sensitivity. But whether that is a signal that there will be a cyberattack on a critical system is not clear, Neuberger said.
Neuberger declined to name specific industry sectors under threat but said they’re part of critical infrastructure – a government designation that includes industries deemed vital to the economy and national security, including energy, finance, transportation and pipelines.
President Biden’s statement. White House fact sheet. And here’s a video of the extended Q&A with deputy national security adviser Anne Neuberger.
EDITED TO ADD (3/23): Long — three hour — conference call with CISA.
A developer has been caught adding malicious code to a popular open-source package that wiped files on computers located in Russia and Belarus as part of a protest that has enraged many users and raised concerns about the safety of free and open source software.
The application, node-ipc, adds remote interprocess communication and neural networking capabilities to other open source code libraries. As a dependency, node-ipc is automatically downloaded and incorporated into other libraries, including ones like Vue.js CLI, which has more than 1 million weekly downloads.
[…]
The node-ipc update is just one example of what some researchers are calling protestware. Experts have begun tracking other open source projects that are also releasing updates calling out the brutality of Russia’s war. This spreadsheet lists 21 separate packages that are affected.
One such package is es5-ext, which provides code for the ECMAScript 6 scripting language specification. A new dependency named postinstall.js, which the developer added on March 7, checks to see if the user’s computer has a Russian IP address, in which case the code broadcasts a “call for peace.”
It constantly surprises non-computer people how much critical software is dependent on the whims of random programmers who inconsistently maintain software libraries. Between log4j and this new protestware, it’s becoming a serious vulnerability. The White House tried to start addressing this problem last year, requiring a “software bill of materials” for government software:
…the term “Software Bill of Materials” or “SBOM” means a formal record containing the details and supply chain relationships of various components used in building software. Software developers and vendors often create products by assembling existing open source and commercial software components. The SBOM enumerates these components in a product. It is analogous to a list of ingredients on food packaging. An SBOM is useful to those who develop or manufacture software, those who select or purchase software, and those who operate software. Developers often use available open source and third-party software components to create a product; an SBOM allows the builder to make sure those components are up to date and to respond quickly to new vulnerabilities. Buyers can use an SBOM to perform vulnerability or license analysis, both of which can be used to evaluate risk in a product. Those who operate software can use SBOMs to quickly and easily determine whether they are at potential risk of a newly discovered vulnerability. A widely used, machine-readable SBOM format allows for greater benefits through automation and tool integration. The SBOMs gain greater value when collectively stored in a repository that can be easily queried by other applications and systems. Understanding the supply chain of software, obtaining an SBOM, and using it to analyze known vulnerabilities are crucial in managing risk.
The transparency organization Distributed Denial of Secrets has released 800GB of data from Roskomnadzor, the Russian government censorship organization.
Specifically, Distributed Denial of Secrets says the data comes from the Roskomnadzor of the Republic of Bashkortostan. The Republic of Bashkortostan is in the west of the country.
[…]
The data is split into two main categories: a series of over 360,000 files totalling in at 526.9GB and which date up to as recently as March 5, and then two databases that are 290.6GB in size, according to Distributed Denial of Secrets’ website.
It has been interesting to notice how unimportant and ineffective cyber operations have been in the Russia-Ukraine war. Russia launched a wiper against Ukraine at the beginning, but it was foundandneutered. Near as I can tell, the only thing that worked was the disabling of regional KA-SAT SATCOM terminals.
It’s probably too early to reach any conclusions, but people are starting to writeabout this, with varying theories.
I want to write about this, too, but I’m waiting for things to progress more.
To provide the best experiences, we use technologies like cookies to store and/or access device information. Consenting to these technologies will allow us to process data such as browsing behavior or unique IDs on this site. Not consenting or withdrawing consent, may adversely affect certain features and functions.
Functional
Always active
The technical storage or access is strictly necessary for the legitimate purpose of enabling the use of a specific service explicitly requested by the subscriber or user, or for the sole purpose of carrying out the transmission of a communication over an electronic communications network.
Preferences
The technical storage or access is necessary for the legitimate purpose of storing preferences that are not requested by the subscriber or user.
Statistics
The technical storage or access that is used exclusively for statistical purposes.The technical storage or access that is used exclusively for anonymous statistical purposes. Without a subpoena, voluntary compliance on the part of your Internet Service Provider, or additional records from a third party, information stored or retrieved for this purpose alone cannot usually be used to identify you.
Marketing
The technical storage or access is required to create user profiles to send advertising, or to track the user on a website or across several websites for similar marketing purposes.