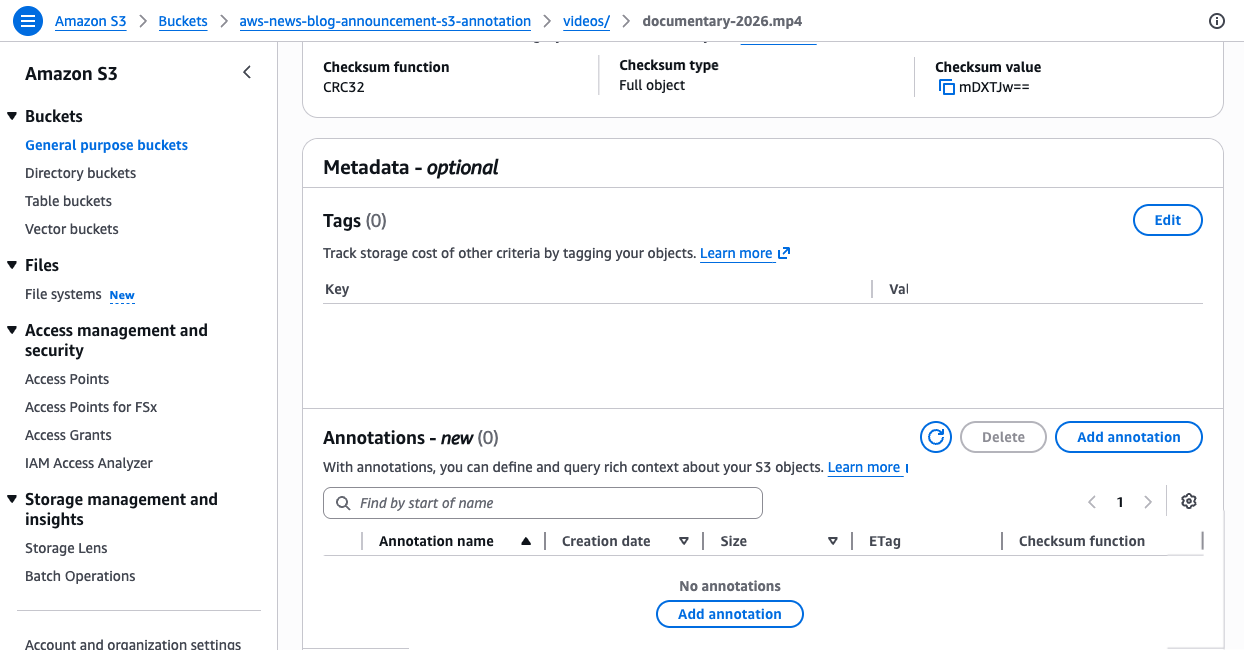
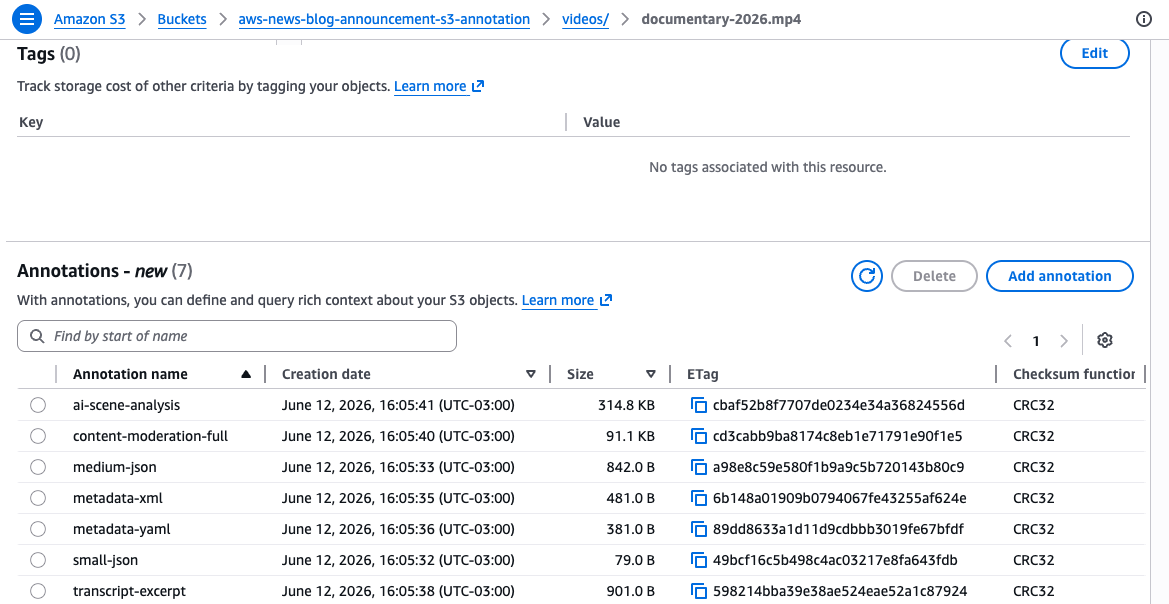
Today, we’re announcing a new metadata capability for Amazon Simple Storage Service (Amazon S3) called annotations, enabling you to attach rich, large-scale business context directly to your objects. You can store up to 1,000 named annotations per object, each up to 1 MB in size, totaling up to 1 GB per object, in flexible formats like JSON, XML, YAML, or plain text. You can modify or delete an annotation at any time, without re-writing your objects, making it easy to keep your object context current.
Organizations are building AI agents and autonomous workflows that need to find, understand, and act on data without human intervention. To support these agentic workflows, you need metadata that can evolve alongside the data, scale to petabytes of objects, and remain queryable without expensive retrieval.
With S3 annotations, you can store context such as AI-generated transcripts, content ratings, or technical specifications directly alongside your objects. Your context moves automatically with the object during copy, replication, and cross-region transfers, and S3 removes it when you delete the object. When you enable S3 Metadata, annotations automatically flow into fully managed annotation tables that you can query with Amazon Athena and other analytics engines.
Common use cases Annotations solve complex metadata challenges across industries:
Media & Entertainment: Track transcripts, content moderation results, subtitle files, and licensing metadata as separate annotations on video assets, eliminating the need to synchronize metadata across multiple media asset management systems.
Financial Services: Attach AI-generated investment summaries and sentiment analysis to research documents, enabling autonomous research agents to discover relevant datasets through natural-language queries without maintaining separate metadata databases.
Life Sciences: Annotate clinical trial data with regulatory status, patient cohort details, and approval chains, making compliance audits faster while keeping full context accessible for archived data in Amazon S3 Glacier storage classes without retrieval charges.
How annotations address metadata challenges Amazon S3 already supports several ways to describe your objects. System-defined metadata captures properties like size and storage class. Object tags support operational tasks like access control and lifecycle management. User-defined metadata lets you add small amounts of custom information at upload time.
While these capabilities work well for their intended purposes, they have limitations when you need to attach much richer context without building and maintaining separate metadata systems. Annotations address these needs by providing metadata capabilities at a fundamentally different scale and flexibility, offering mutable, queryable context per object compared to 10 immutable tags or 2 KB of headers.
Rich business context (JSON, XML, YAML, plain text)
Today, metadata describing S3 objects often lives in separate databases or sidecar files, requiring complex synchronization workflows that can exceed data storage costs. When you enable S3 Metadata annotation tables, this context becomes queryable at scale through Amazon Athena. AI agents can discover your data through natural language with the S3 Tables MCP server, which provides a standardized interface for AI models to query your annotations. You can query annotations for objects in any storage class, without restoring the objects or paying retrieval charges.
Getting started with annotations To start using annotations, make sure your AWS Identity and Access Management (IAM) policy or bucket policy grants permissions for the s3:PutObjectAnnotation and s3:GetObjectAnnotation actions. You can then add annotations to any existing or new S3 object using the PutObjectAnnotation API.
For example, a media company can attach technical specifications and AI-produced summaries to a video asset using the AWS Command Line Interface (AWS CLI):
# Create a JSON file with technical metadata
cat > mediainfo.json << 'EOF'
{"codec":"H.265","resolution":"3840x2160","audio_tracks":8,"frame_rate":29.97}
EOF

# Attach it as an annotation
aws s3api put-object-annotation \
  --bucket my-media-bucket \
  --key videos/documentary-2026.mp4 \
  --annotation-name mediainfo \
  --annotation-payload ./mediainfo.json
# Attach a plain-text AI-generated summary as a separate annotation
echo "A 90-minute nature documentary covering wildlife migration patterns across three continents, featuring aerial footage and underwater sequences. Languages: English, Spanish, Portuguese." > ai_summary.txt

aws s3api put-object-annotation \
  --bucket my-media-bucket \
  --key videos/documentary-2026.mp4 \
  --annotation-name ai_summary \
  --annotation-payload ./ai_summary.txt
These commands attach two separate annotations to the same video object. The mediainfo annotation stores structured technical specifications as JSON, while the ai_summary annotation stores a text description. Each annotation is identified by a unique name, and you can read and modify each one independently. With unique names for each annotation, you can use different annotations to support multiple concurrent enrichment workflows, for example, one team adding technical metadata while another team adds content classifications, without interfering with each other.
Retrieve a specific annotation using the GetObjectAnnotation API:
You can update an existing annotation at any time by calling PutObjectAnnotation again with the same annotation name. For large objects uploaded using multipart upload, attach annotations after completing the multipart upload using the PutObjectAnnotation API.
Querying annotations at scale with S3 Metadata tables Attaching annotations to individual objects is useful, but the real power comes when you query across all your annotations at scale. When you enable S3 Metadata annotation tables on your bucket, S3 automatically indexes your annotations into a fully managed Apache Iceberg table, called an annotation table. You can query annotation tables with Amazon Athena or any Iceberg-compatible engine.
To enable annotation tables, use the S3 console or the CreateBucketMetadataConfiguration API. The following example creates a new metadata configuration with annotation tables enabled while keeping journal tables for change tracking and disabling the live inventory table:
This configuration tells S3 to automatically capture all your annotations in a queryable table. Once applied, any annotation you attach to objects in this bucket will appear in the table within approximately one hour.
If the bucket already has a metadata configuration, use the UpdateBucketMetadataAnnotationTableConfiguration API:
Once enabled, your annotations automatically flow into the annotation table. Journal tables update in near real time, while annotation tables refresh within an hour. Unlike traditional metadata tables that require predefined schemas, annotation tables automatically adapt to any JSON, XML, or YAML structure you write. Each annotation becomes a row in the table with its content stored in a text_value column, letting you query across all annotations without schema migrations.
If you enable annotation tables on a bucket that already has annotated objects, S3 automatically backfills existing annotations into the table. The backfill process runs in the background and can take several hours to days depending on the number of objects.
For example, to find all video assets with more than 8 audio tracks across your entire bucket using Amazon Athena:
SELECT DISTINCT bucket, object_key
FROM "s3tablescatalog/aws-s3"."b_my_media_bucket"."annotation"
WHERE name = 'mediainfo'
AND CAST(json_extract_scalar(text_value, '$.audio_tracks') AS INTEGER) > 8
This query scans the annotation table for all annotations named mediainfo, extracts the audio_tracks field from the JSON content, and returns objects where the count exceeds 8.
Or to find all objects that received new annotations in the last 24 hours through the journal table:
SELECT bucket, key, version_id, record_timestamp, annotation.name
FROM "s3tablescatalog/aws-s3"."b_my_media_bucket"."journal"
WHERE record_timestamp >= (current_date - interval '1' day)
AND annotation.name IS NOT NULL
AND record_type IN ('CREATE_ANNOTATION', 'DELETE_ANNOTATION')
This query uses the journal table to track annotation changes in near real time, which is ideal for building event-driven workflows that respond to new or deleted annotations.
You can also use natural language to search objects by their annotations using agents in Amazon SageMaker Unified Studio or any IDE with the S3 Tables MCP server. For example, asking “find all PG-rated movies with Spanish subtitles from 2023” returns results in seconds instead of the hours it would take querying multiple disconnected systems.
Get started today You can start using Amazon S3 annotations today in all AWS Regions, including the AWS China Regions. Annotation tables are available in all AWS Regions where S3 Metadata is available.
Whether you’re building AI agents that need to discover data autonomously, managing petabytes of media assets with complex metadata, or tracking compliance context for archived datasets, annotations give you the scale and flexibility to attach rich metadata directly to your objects without managing separate systems.
Annotation storage is always billed at S3 Standard rates, even if the parent object is in S3 Glacier or another storage class. For full pricing details, visit the Amazon S3 pricing page.
At Computex 2026 Minisforum was showing off their upcoming S5 NAS, a mid-range all-flash NAS. With 5 M.2 SSD slots and 10GbE networking, the fanless NAS punches up
Oracle databases power mission-critical enterprise applications, making their continuous availability essential for business operations. Traditional Oracle high availability (HA) solutions require complex clustering software, expensive shared storage arrays, and specialized database administration teams. These conventional approaches often introduce single points of failure while demanding significant operational overhead.
Modern cloud architectures offer a transformative approach that combines Amazon FSx for NetApp ONTAP (FSxN) with Amazon EC2 Auto Scaling groups, automated AMI creation, AWS Lambda-driven orchestration, and AWS Systems Manager Parameter Store (SSM Parameter). This solution removes traditional Oracle HA complexities while delivering enterprise-grade availability, automated recovery, and makes sure new instances launch with the latest Oracle configuration.
This post shows how to build a highly available Oracle database architecture using FSxN shared storage, Auto Scaling groups with dynamic AMI updates, and serverless orchestration to help reduce recovery times with current configurations.
Solution overview
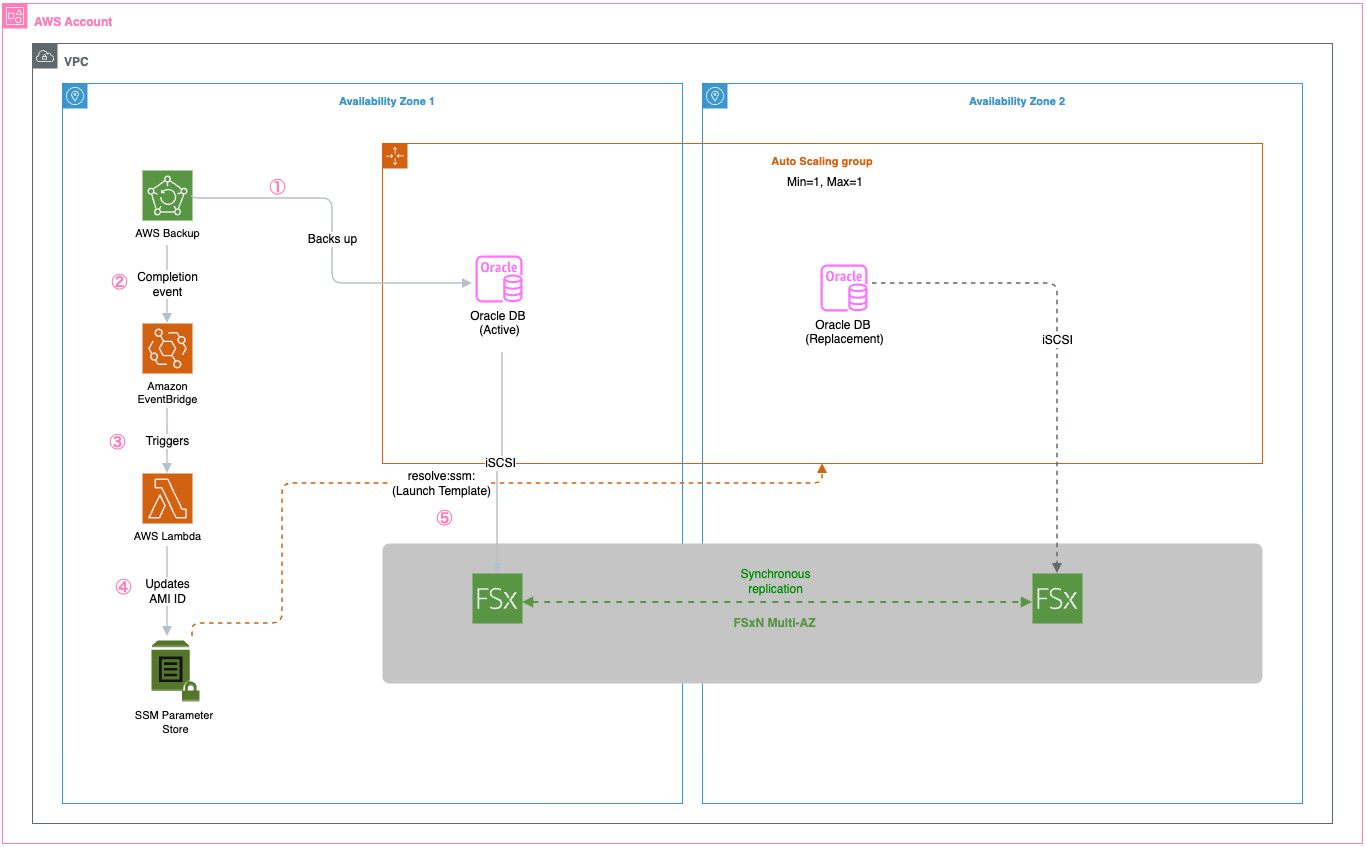
The solution uses multiple AWS services working together to create a comprehensive high availability architecture. FSxN Multi-AZ provides persistent shared storage spanning availability zones for Oracle database files, software, and configurations, so that data remains accessible when EC2 instances are replaced. Auto Scaling groups deliver automated instance lifecycle management with the latest AMI configurations, so failed instances are quickly replaced with identical configurations that can immediately access the existing Oracle database files on FSxN. AWS Backup creates AMIs that capture the latest Oracle host configurations including patches and settings, preserving the complete server state for consistent deployments. AWS Lambda extracts the AMI ID from backup recovery points and updates the SSM Parameter, orchestrating the entire configuration management workflow. Systems Manager Parameter Store stores the current AMI ID for Auto Scaling group launch templates, so new instances always launch with the most recent configuration and can immediately connect to the Oracle database on shared storage.
The following diagram shows the complete architecture with all AWS services and their interactions:
Key benefits include:
Recovery Time Objective (RTO): Can help achieve 2–5 minutes with latest Oracle configuration
Recovery Point Objective (RPO): Near-zero through synchronous Multi-AZ replication
Configuration consistency: New instances launch with identical Oracle host setup
Automated AMI management: Scheduled AMI creation with Parameter Store updates
Walkthrough
This walkthrough demonstrates implementing Oracle HA using Amazon FSx for NetApp ONTAP shared storage, AWS Backup-driven AMI creation, Lambda orchestration, and Auto Scaling groups with Parameter Store integration for configuration consistency and automated failover.
Prerequisites
For this walkthrough, you should have the following prerequisites:
An AWS account with appropriate permissions for Amazon FSx, Auto Scaling, EC2, Lambda, and Systems Manager
A VPC with subnets in at least two Availability Zones
Keep in mind that customers are responsible for their own Oracle licensing compliance.
An EC2 instance with Oracle database installed and configured
AWS Identity and Access Management (IAM) roles for AMI creation and cross-service communication
Basic knowledge of Oracle database administration and AWS automation
Assumptions
This post is a conceptual illustration of the architecture. Your specific implementation will vary based on your VPC layout, Oracle version, storage requirements, and organizational security policies.
We assume the reader is familiar with:
Creating and configuring Amazon FSx for NetApp ONTAP file systems through the AWS console
iSCSI concepts including initiators, targets, and multipath I/O
Oracle database startup and shutdown procedures
AWS Backup, Lambda, and Auto Scaling group fundamentals
For detailed step-by-step instructions on specific AWS services, refer to the additional resources section.
Step 1: Create an Amazon FSx for NetApp ONTAP file system
FSxN Multi-AZ provides the persistent shared storage foundation for this architecture. Unlike Amazon Elastic Block Store (Amazon EBS) volumes, which are bound to a single AZ, FSxN Multi-AZ replicates data synchronously across two AZs with automatic failover. This means that when an EC2 instance is replaced (whether in the same AZ or a different one), the new instance can immediately access the existing Oracle database files without restoring from backup.
To create the file system, navigate to the Amazon FSx console and select Amazon FSx for NetApp ONTAP as the file system type.
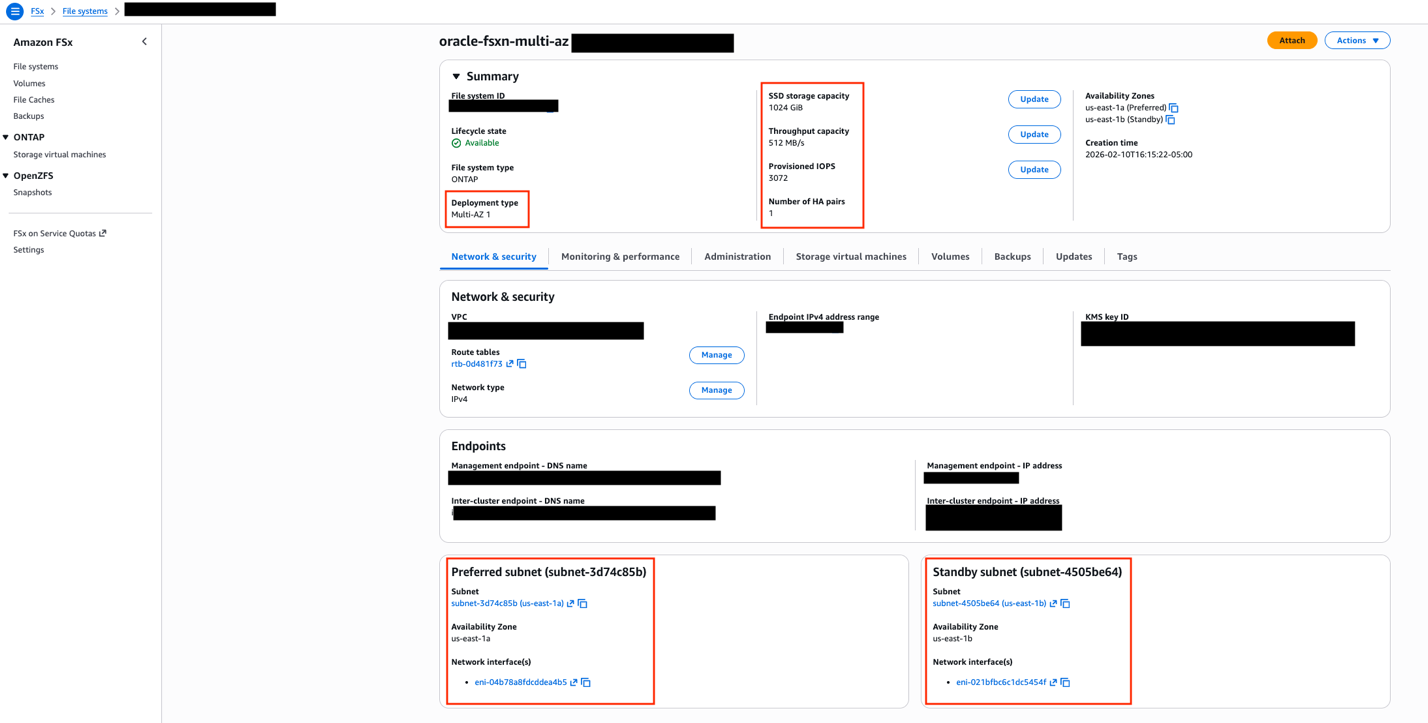
The critical configuration choice is selecting Multi-AZ deployment, which places an active file server in one AZ and a standby in another.
FSxN console showing Multi-AZ deployment type selection with preferred and standby subnets in separate availability zones.
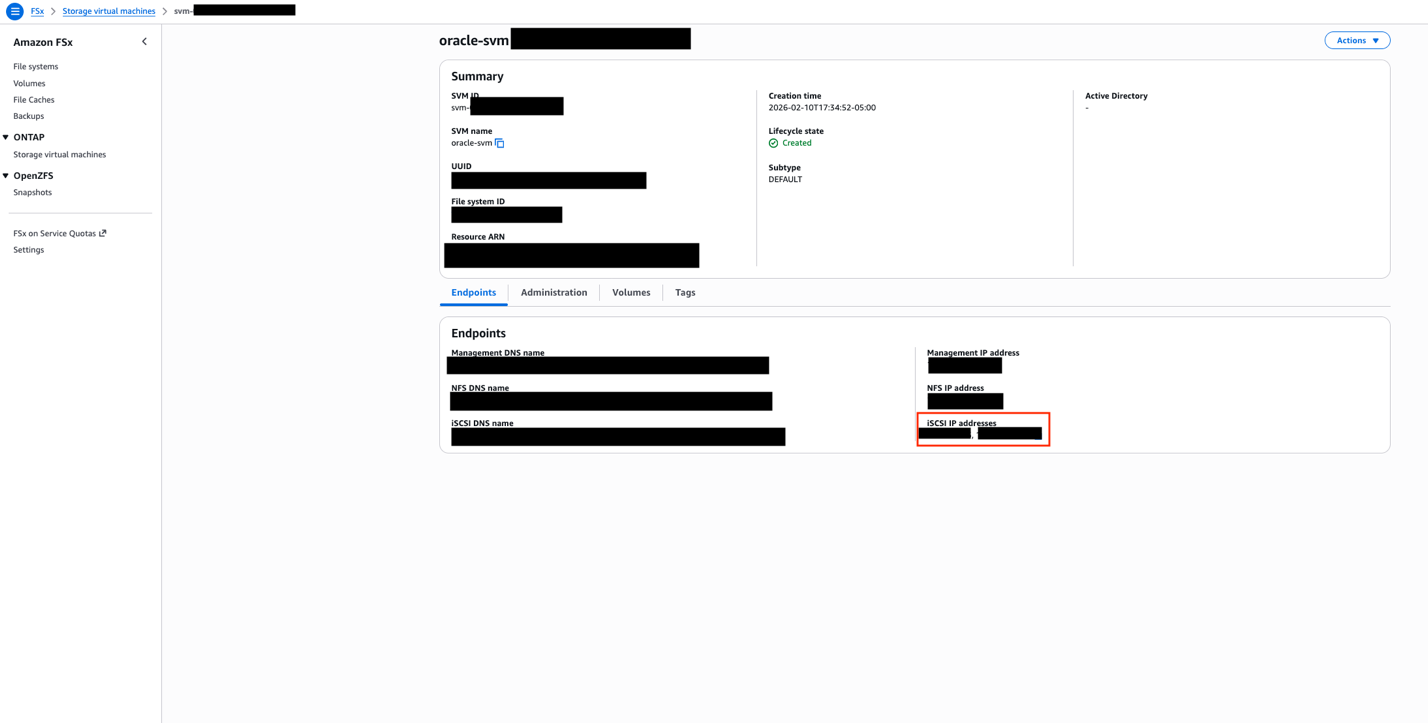
After the file system is created, you need to set up a Storage Virtual Machine (SVM), which acts as a logical storage container providing data access to your Oracle instances. The SVM creation is done from the FSx console under your file system’s details.With the SVM in place, the next step is configuring iSCSI access. FSxN exposes iSCSI endpoints—these are IP addresses (one per AZ) that your EC2 instances use to connect to the storage over the iSCSI protocol. You can find these endpoint addresses in the FSx console under your SVM’s Endpoints tab.
SVM Endpoints tab showing iSCSI endpoint IP addresses for each availability zone. These addresses are used in the EC2 instance’s iSCSI discovery configuration.
The iSCSI setup involves creating iGroups (which define which EC2 instances can access the storage) and LUNs (logical storage units mapped to those groups) through the NetApp ONTAP CLI. On the EC2 side, you configure the iSCSI initiator to discover and connect to the FSxN endpoints, then mount the resulting block devices. Using multipath I/O with both endpoints makes sure that Oracle data remains accessible even during an AZ failover. For detailed iSCSI configuration steps, see mounting iSCSI LUNs on Linux clients.
A dedicated security group is required for FSxN access. At minimum, the security group must allow inbound traffic on ports 111 (NFS portmapper), 635 (NFS mountd), 2049 (NFS), 3260 (iSCSI), 4045–4046 (NFS lock), 443 (HTTPS for management), and 22 (SSH for ONTAP CLI). Restrict the source to only your Oracle EC2 instances’ security group.
Step 2: Set up AWS Backup for EC2 instance protection
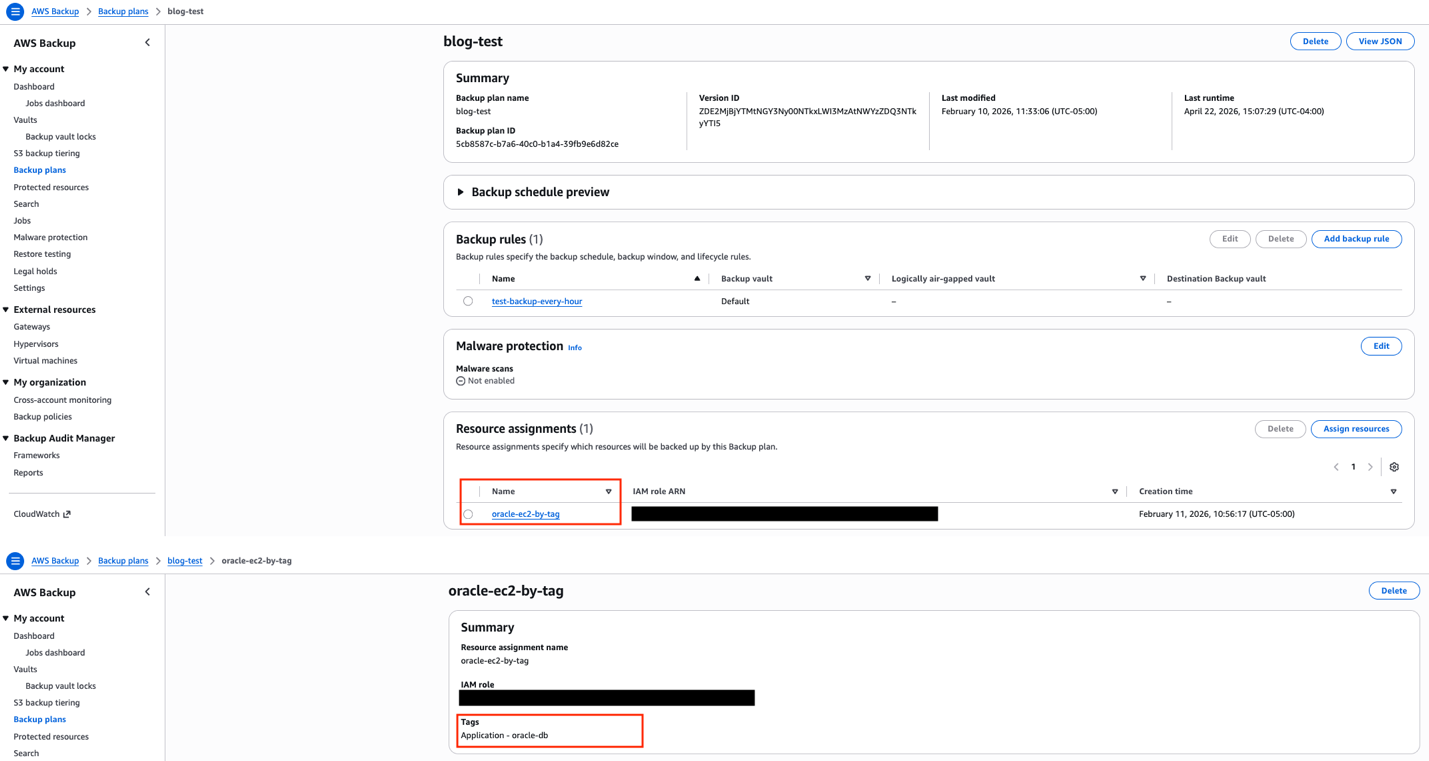
AWS Backup captures the complete state of your Oracle EC2 instance. The key design choice here is using tag-based resource selection rather than specifying instance IDs directly. Because Auto Scaling groups replace instances (and generate new instance IDs), tag-based selection makes sure that any new instance with the correct tags are automatically included in the backup plan.Configure a backup plan with a frequency appropriate for your environment and set the resource assignment to select EC2 instances matching your application tag (for example, ‘Application: Oracle’).
AWS Backup resource assignment configured with tag-based selection. Any EC2 instances tagged with the application tag are automatically included in the backup plan.
Step 3: Configure Lambda for AMI management
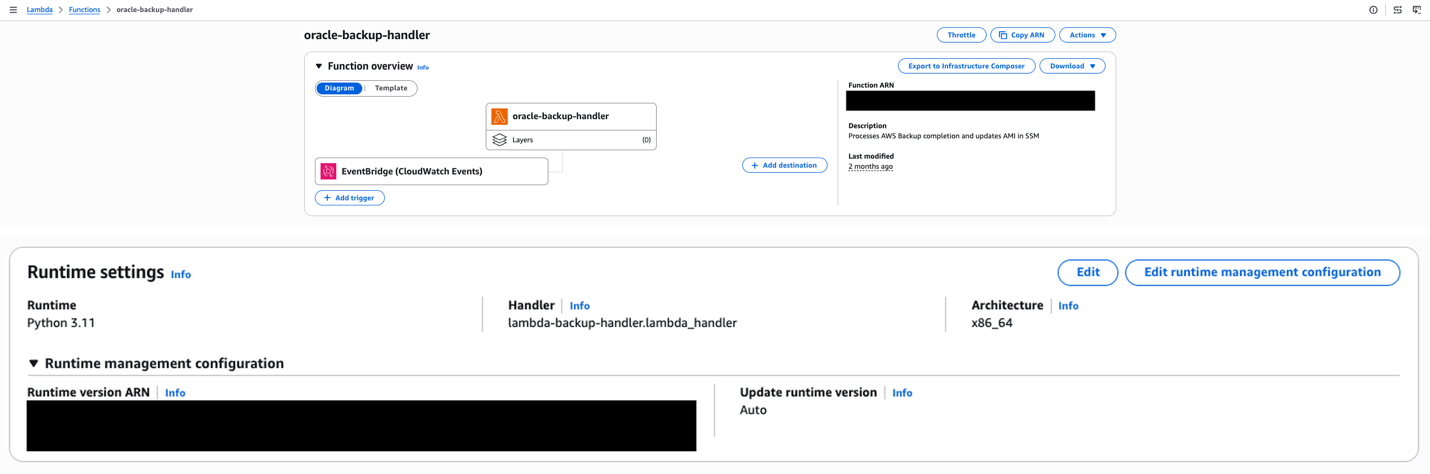
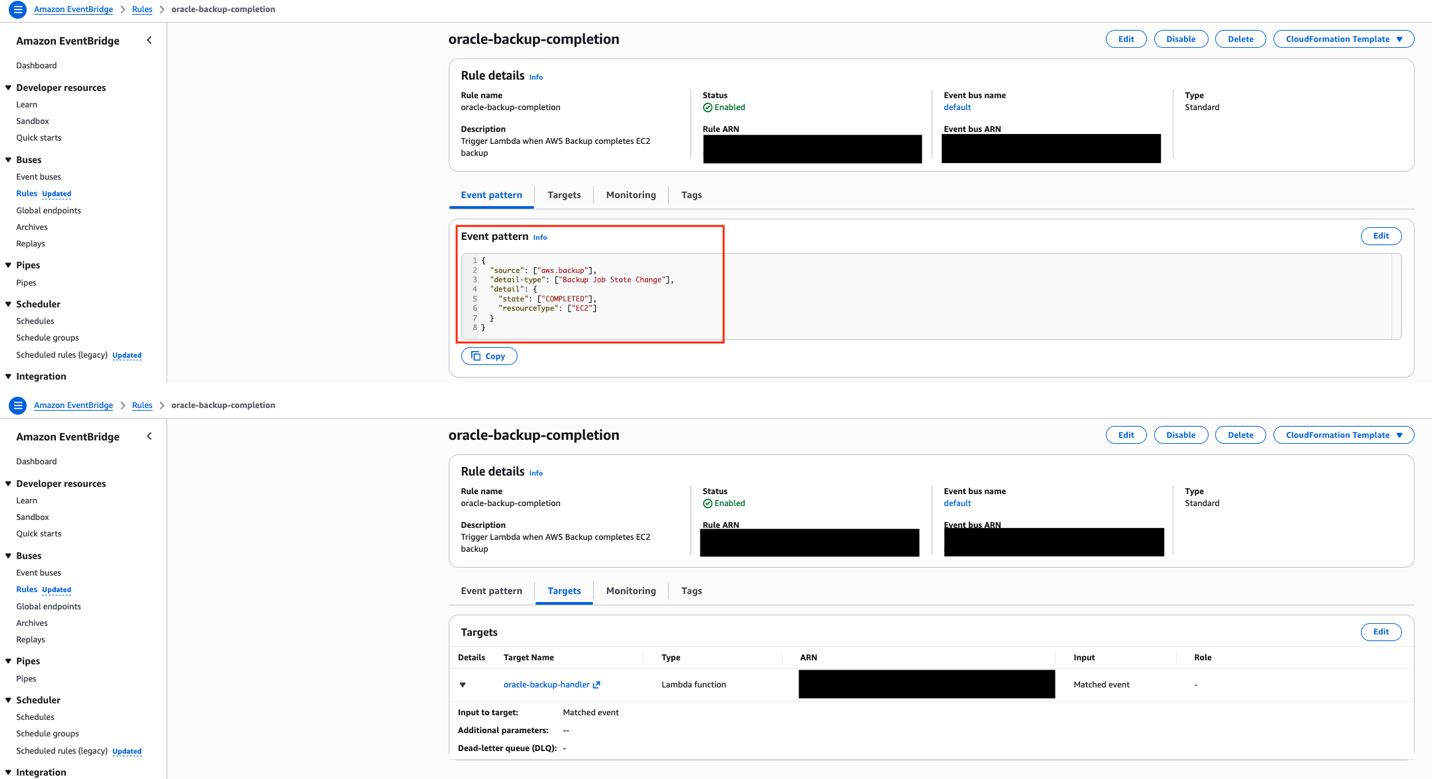
When AWS Backup completes an EC2 backup, it creates an AMI as the recovery point. An Amazon EventBridge rule detects this completion event and triggers a Lambda function. The function extracts the AMI ID from the backup recovery point, updates the SSM Parameter Store parameter with the new AMI ID, and cleans up older AMIs to control storage costs.
Lambda function overview showing the EventBridge trigger, Python 3.11 runtime, and function description indicating its role in processing backup completions and updating AMI references in SSM.
This event-driven approach means the latest AMI is available without manual intervention. The Lambda function needs IAM permissions for EC2 (to manage AMIs), SSM (to update the parameter), and Backup (to read recovery point metadata).
EventBridge rule configured to match AWS Backup job completion events for EC2 resources, with the Lambda function as the target.
Step 4: Configure the Systems Manager Parameter Store
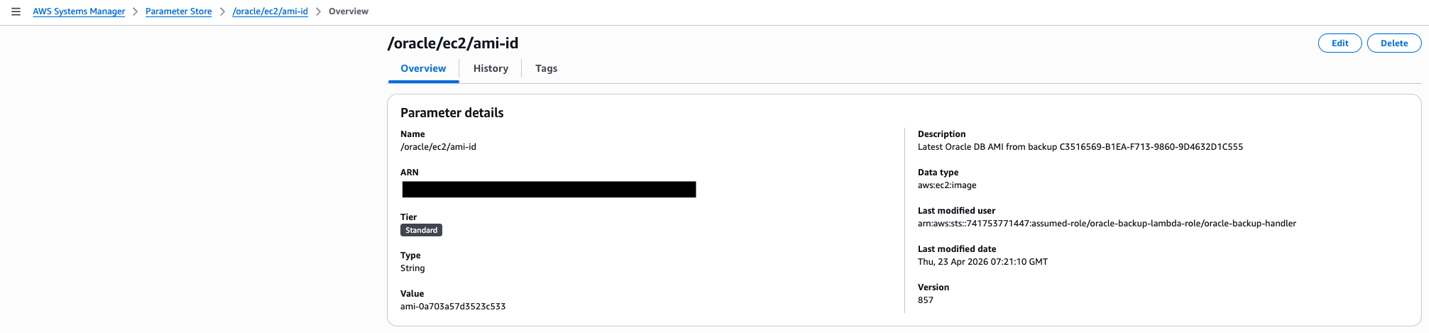
The SSM Parameter Store holds the current AMI ID that the Auto Scaling group’s launch template references. The parameter is created with the aws:ec2:image data type, which enables the launch template’s resolve:ssm: functionality, a feature that allows the launch template to dynamically resolve the AMI ID at instance launch time without requiring a template version update.
SSM Parameter Store showing the /oracle/ec2/ami-id parameter with aws:ec2:image data type. The “Last modified user” confirms the Lambda function is automatically updating this parameter after each backup cycle.
When Lambda updates this parameter after each backup cycle, the next instance launched by the Auto Scaling group will automatically use the latest AMI. This removes the operational burden of manually updating launch template versions.
Step 5: Set up an Auto Scaling Group with dynamic AMI
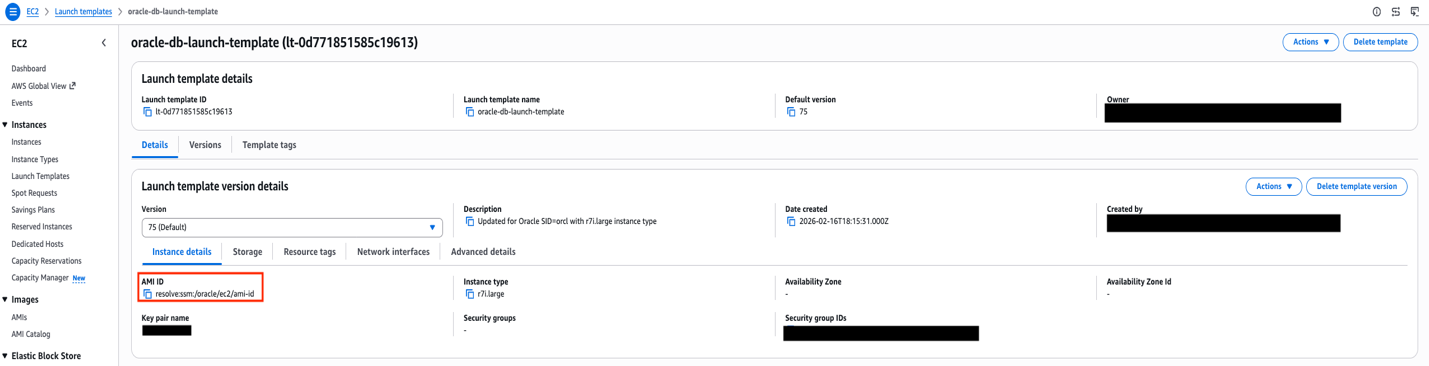
The launch template references the SSM parameter using the resolve:ssm: prefix for the AMI ID field. This is the mechanism that ties the entire automation pipeline together. The mechanism backups trigger AMI creation, AMI IDs flow into Parameter Store, and the launch template resolves the latest AMI at launch time.
Launch template AMI configuration showing the ‘resolve:ssm:’ prefix, which dynamically retrieves the latest AMI ID from Parameter Store at instance launch time.
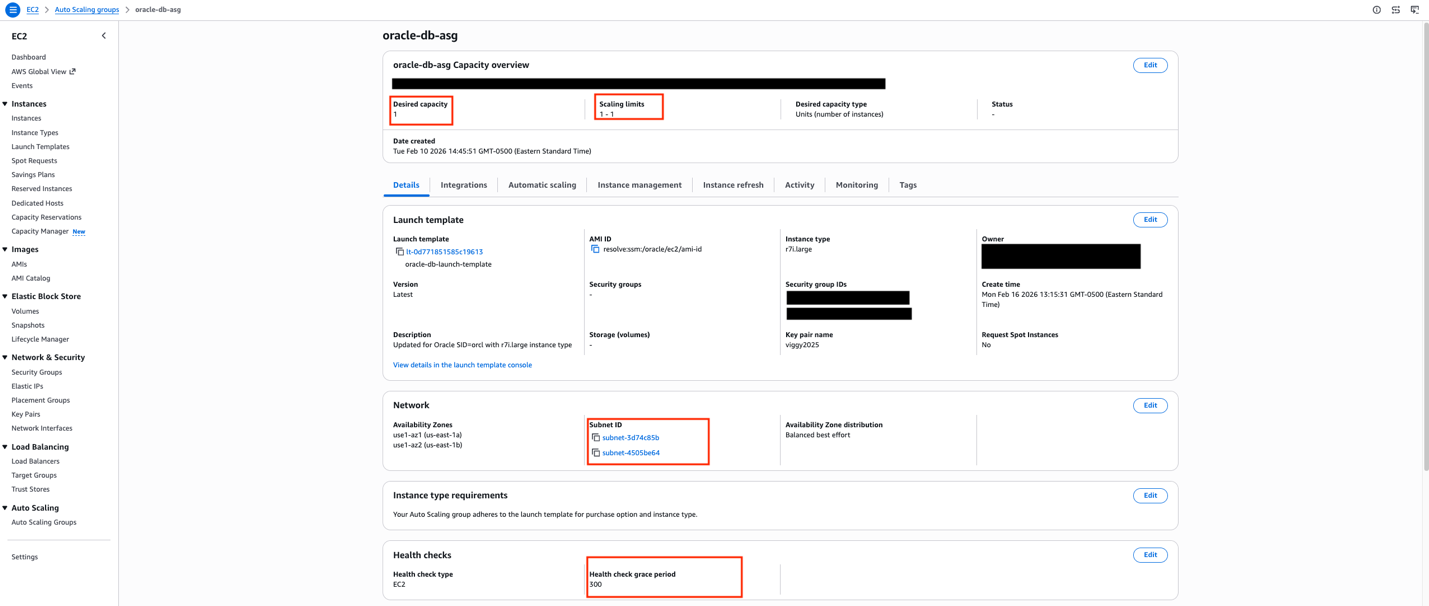
The Auto Scaling group is configured with minimum, maximum, and desired capacity all set to 1. This is not traditional auto-scaling, it’s a self-healing pattern. The sole purpose is to detect when the Oracle instance becomes unhealthy and automatically launch a replacement. The health check grace period should be set to at least 300 seconds (5 minutes) to allow Oracle sufficient time to start before health checks begin evaluating the new instance.
The launch template also includes a User Data script that runs on each new instance. This script configures the iSCSI initiator, discovers and connects to the FSxN endpoints, mounts the Oracle data volumes, and starts the Oracle database through a systemd service. This automation makes sure that a replacement instance is fully operational without manual intervention.
Auto Scaling group configured with min=max=desired=1 across two availability zones, providing self-healing capability.
Test the complete workflow
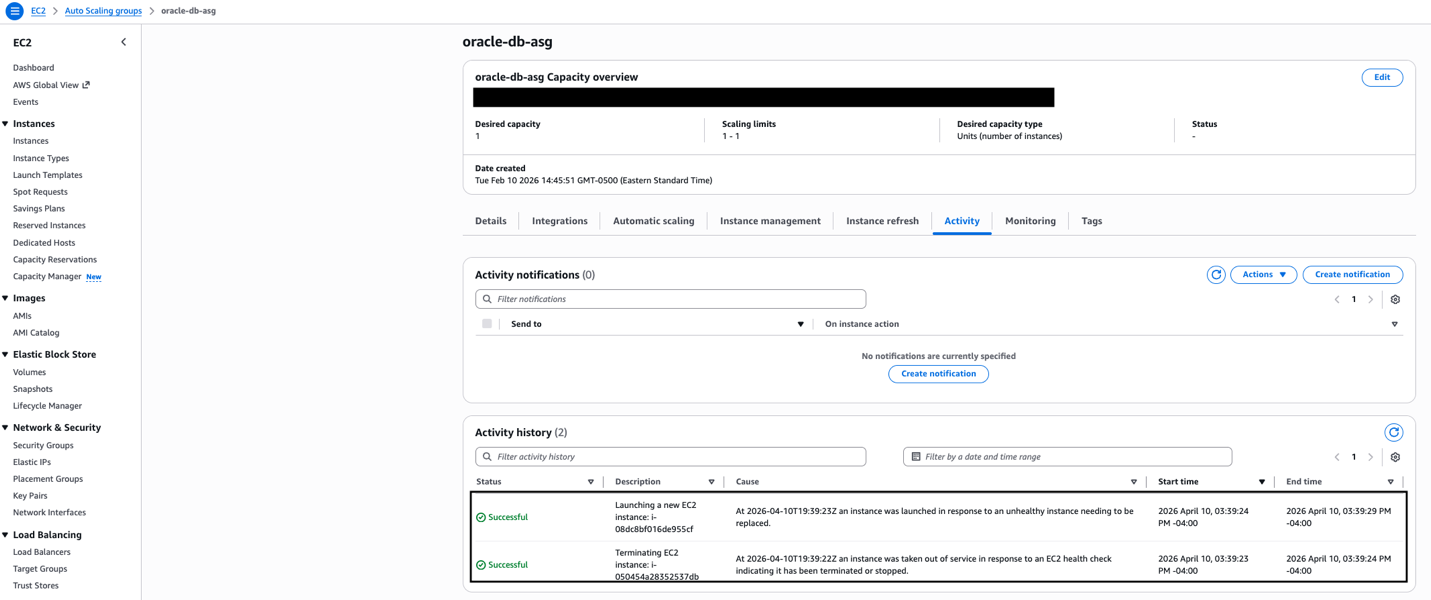
To validate the architecture, simulate an instance failure by terminating the current Oracle EC2 instance.
The expected sequence is:
The Auto Scaling group detects the instance is unhealthy (within approximately 30 seconds)
A new instance launches from the latest AMI resolved from Parameter Store (approximately 2 minutes)
The User Data script connects to FSxN using iSCSI and starts Oracle (approximately 2–3 minutes)
The Oracle database is available and accepting connections (total elapsed: approximately 5 minutes)
Auto Scaling group Activity History showing the self-healing sequence — the unhealthy instance is terminated, and a replacement is launched automatically within seconds.
The new instance automatically inherits the application tags from the Auto Scaling group, which means AWS Backup includes it in the next backup cycle without manual configuration.
Cleaning up
To avoid incurring future charges, delete the resources:
Delete Lambda functions and EventBridge rules
Remove Parameters from Systems Manager Parameter Store
Delete AWS Backup plans and backup vault
Deregister created AMIs
Terminate Auto Scaling group instances
Delete the Amazon FSx for NetApp ONTAP file system
Conclusion
This architecture facilitates Oracle high availability with configuration consistency by combining FSxN persistent shared storage with automated AMI management and AWS Backup protection. The Lambda-driven AMI management from backup recovery points and Parameter Store integration helps make sure that replacement instances launched by Auto Scaling groups always use the latest Oracle host configuration and can immediately connect to the existing Oracle database files stored on FSxN. Replacements occur only when health checks fail. Organizations can target high availability while maintaining configuration consistency across instance replacements. The automated AMI management alleviates configuration drift and makes sure that disaster recovery scenarios restore Oracle instances with identical host-level configurations that can immediately access the persistent Oracle database on shared storage. Healthy instances continue running unchanged, with replacements occurring only, when necessary, because of health check failures.Next steps include implementing cross-Region AMI replication, adding AMI validation testing, and developing custom health checks that verify both Oracle database and host configuration consistency.
Extracting actionable insights from thousands of contracts and legal documents remains a challenge. For organizations, critical business information is locked in unstructured documents such as contracts, legal agreements, provider arrangements, and vendor invoices. Extracting and operationalizing this information has traditionally been a manual, error-prone, and resource-intensive process. This leads to missed savings opportunities, costly delays, and significant inefficiencies across the enterprise.
AArete, a global management and technology consulting firm specializing in healthcare, recognized this challenge and developed Doczy.ai, an intelligent contract interpretation solution powered by generative AI on Amazon Web Services (AWS).
In this post, we show you how Doczy.ai uses generative AI on AWS to automate contract intelligence at scale, transforming unstructured documents into structured, actionable insights, so organizations can automate critical business processes and unlock the full value of their data.
The challenge: Data trapped in documents
For healthcare organizations, managing and interpreting contracts and documents represents a major operational bottleneck. Manual review processes require deploying teams to extract data from thousands of documents. This is an approach that is neither scalable nor sustainable, highly prone to error, and costly. Organizations relying on institutional knowledge face additional risks: critical information resides with a few key individuals, creating knowledge silos and succession planning challenges. Existing Contract Lifecycle Management (CLM) systems often prove inadequate for capturing the nuanced and complex terms unique to each agreement. These legacy systems can only configure predefined fields, missing the rich detail and contextual information that distinguishes contracts. The downstream impact is substantial: in healthcare, reimbursement terms must be manually translated into claims systems—a slow, error-prone process. Similarly, verifying vendor invoices against contract terms often requires manual effort, leading to payment processing delays and missed contractual savings opportunities. These inefficiencies ultimately leave significant value on the table.
This is where Doczy.ai provides significant value.
Doczy.ai: An intelligent contract interpretation solution
Doczy.ai directly addresses these challenges using advanced AI and scalability on AWS. Developed by AArete, Doczy.ai pushes the boundaries of document intelligence. The solution automatically interprets complex documents and converts them into a structured, queryable information repository that allows organizations to unlock the full value of their data and drive smarter decisions.The evolution of Doczy.ai reflects rapid AI advancement. Prior to 2020, document processing required manual effort, with individuals processing approximately 100 documents per week. Between 2020–2023, the firm implemented rules-based contract processing, achieving approximately 55% accuracy. The breakthrough came in 2024 with an AI-based processing built on AWS achieved 99% accuracy—a dramatic improvement over the 55% accuracy of traditional rules-based systems.
Doczy.ai architecture
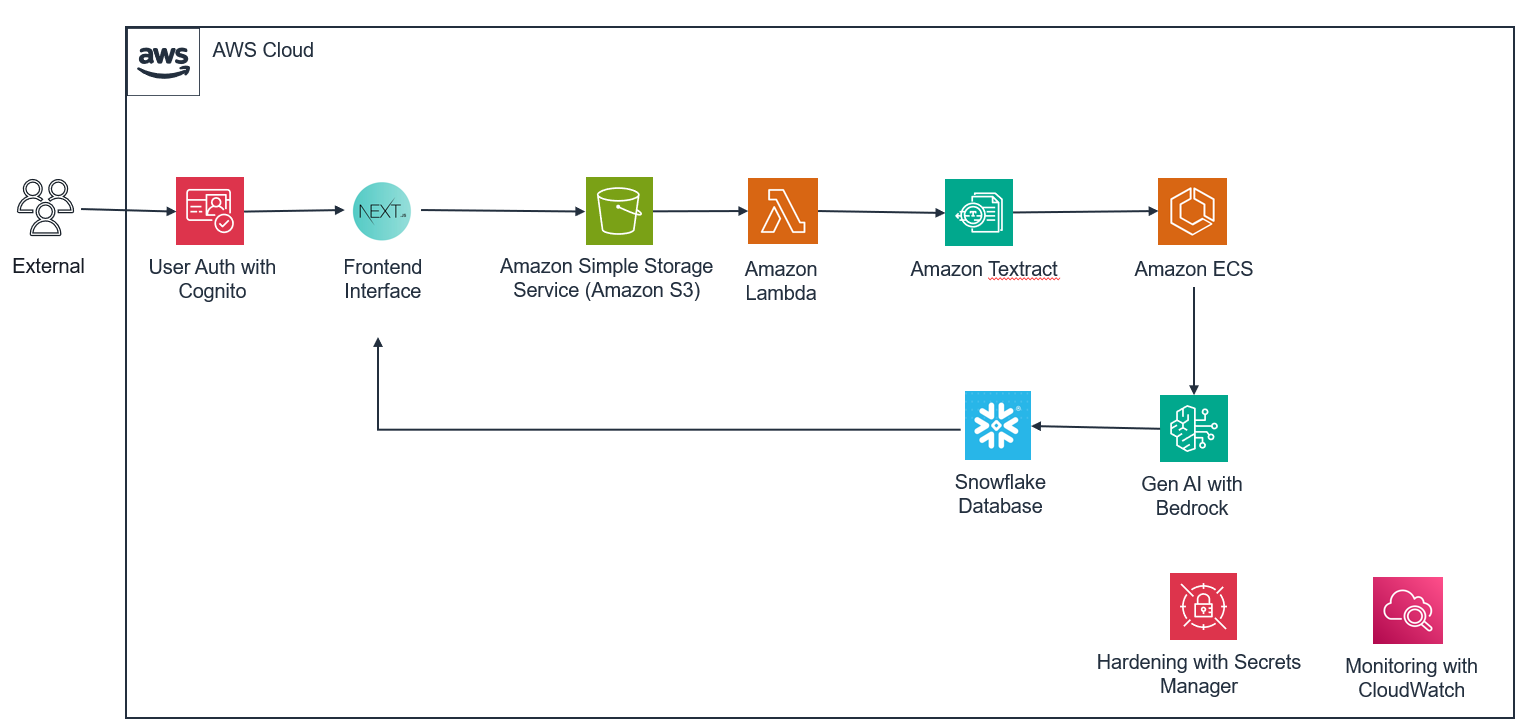
Doczy.ai is built on a comprehensive AWS architecture designed to handle the entire document processing lifecycle: from the moment a file enters the system to the moment it generates actionable business intelligence.
Architecture of Doczy.ai
External users access the platform through a secure Next.js frontend, with Amazon Cognito managing authentication and authorization behind the scenes. After authentication, users upload documents directly to Amazon Simple Storage Service (Amazon S3), where durable, scalable object storage ensures nothing is lost and everything is accessible at scale. From there, the real intelligence begins.
An AWS Lambda function triggers Amazon Textract to extract text and metadata from documents in various formats. What sets Doczy.ai apart at this stage is its patented “smart chunking” algorithm, a proprietary approach that goes far beyond pulling words off a page. Rather than treating a document as a flat sequence of text, smart chunking preserves hierarchical structure and one-to-many relationships within documents. It uses a combination of semantic and keyword search to decompose text into meaningful, context-aware chunks, applying dynamic parameters to maintain logical relationships throughout. Sequential identifiers and metadata-driven grouping organize these chunks into field groups, detecting overlaps and removing duplications while keeping the document’s natural flow intact.
After chunking, the document enters the dual clustering engine of Doczy.ai. This two-lens methodology analyzes every contract simultaneously from both a semantic and a structural perspective. On the semantic side, extracted text is converted into embeddings, numerical representations of meaning, and similar ideas are grouped together even when they’re expressed in different words. On the structural side, pattern-recognition algorithms identify clause types, formatting conventions, table layouts, and hierarchical organization, understanding. For example, that a three-nested-level exhibit carries fundamentally different implications than a straightforward attached schedule.These two analyses don’t operate in isolation. Projection algorithms compare the semantic and structural clusters side by side, synthesizing them into a unified, enriched document model that captures both meaning and context. It’s this convergence that drives the 99% accuracy rate of Doczy.ai. The system doesn’t just read the words, it understands the contract. Advanced large language models (LLMs) then generate structured output grounded in this dual-clustered intelligence.Before output is finalized, the system determines each document’s file class and generates prompts tailored to the extracted text, cluster classification, and domain context. Through few-shot and multi-shot prompting, the platform continuously edits the prompt on domain-specific examples and based on real outputs, creating a feedback loop that compounds accuracy improvements over time.
The resulting structured data flows into Snowflake, forming a centralized repository that powers intelligent dashboards with actionable insights and visualizations. Throughout the entire pipeline, Amazon CloudWatch monitors performance in real time and proactively surfaces issues before they escalate, while AWS Secrets Manager safeguards sensitive information, ensuring that security is not an afterthought, but a foundational layer woven into every stage of the system.
The transformative impact of Doczy.ai
The results of this AI-powered approach are transformative and measurable. By automating contract interpretation and document processing, Doczy.ai has demonstrated significant impact at scale for multiple organizations across healthcare and financial services. The scale of operations over the last 22 months demonstrates the maturity and production readiness of Doczy.ai. This solution has processed 2.5 million contract documents (50 million pages) with 137 million API calls to Amazon Bedrock and 442 billion tokens—a level of automation and accuracy previously unattainable through manual or traditional document processing approaches. Over this same period, Doczy.ai has helped clients achieve approximately 330 million dollars in cumulative direct and indirect savings.The 99% accuracy rate represents significant improvement over the approximately 55% accuracy of rules-based systems and far exceeds manual processing, which is typically affected by fatigue and human error. The 97% reduction in manual processing time translates directly to cost savings and enables organizations to reallocate human resources to higher-value activities that require judgment and strategic thinking.
A use case in action: Business process automation for health plans
For health plans, Doczy.ai provides a powerful solution to automate and improve contract management across the entire lifecycle. It ingests existing contracts in both paper and digital formats, integrates with contract management systems such as Coupa and Icertis, and processes new contracts and amendments as they’re executed. It then creates a centralized metadata repository that feeds directly into downstream systems, enabling end-to-end business process automation.This automation unlocks critical capabilities: Organizations can continuously analyze and improve contract terms, identifying opportunities to improve financial performance and operational efficiency. The architecture feeds accurate, up-to-date contract data directly into claims systems, automating the configuration process that previously required manual translation of reimbursement terms and removing manual data entry, configuration errors, and delays. Additionally, the platform helps maintain claim payment accuracy by assessing payments against contract terms, identifying discrepancies, and flagging potential overpayments or underpayments before they occur.By automating manual processes, health plans can adapt quickly to new contract terms and regulatory requirements. The intelligent dashboards and actionable insights provided by Doczy.ai enable decision-makers to understand contract performance, identify trends, and take proactive action to optimize financial outcomes.
Getting started with Doczy.ai
Organizations interested in using Doczy.ai to transform document processing and contract management can engage with AArete to discuss their specific use cases and requirements. AArete offers the platform as a Software as a Service (SaaS) solution, enabling rapid deployment without significant infrastructure investment. AArete’s team of experts will configure this solution for your specific document types, domain terminology, and business processes, supporting maximum value from day one.
Conclusion
The challenge of unlocking data from unstructured documents is a major hurdle for many businesses, particularly in healthcare and financial services where contracts and agreements govern critical operational and financial relationships. By embracing intelligent document intelligence on AWS, organizations can solve this long-standing operational challenge and unlock a new frontier of strategic advantage, turning their data into their most valuable asset.
Built on a sophisticated architecture that orchestrates Amazon Cognito, Amazon S3, AWS Lambda, Amazon Textract, Amazon Elastic Container Service (Amazon ECS), Amazon Bedrock, Amazon CloudWatch, and AWS Secrets Manager, Doczy.ai demonstrates how modern cloud services can solve complex document-heavy business problems. Its advanced hybrid smart chunking, dual clustering, and prompt optimization techniques form the core of a patented contract intelligence engine.
Doczy.ai delivers tangible impact, processing up to 250,000 contract documents per week with 99% accuracy, reducing manual processing time by 97%, and helping clients unlock roughly 330 million dollars in cumulative savings over 22 months. By embracing this intelligent document processing, organizations can turn contracts into a strategic data asset, improving efficiency, accuracy, and profitability while freeing teams to focus on higher-value work.
To learn more about how AArete and Doczy.ai can help your organization transform document processing and unlock the value of your unstructured data, visit the AArete website.
Outlining their hardware plans for the modern data center, Dell has announced their EPYC and Xeon-based 18th generation PowerEdge servers, as well as a next-gen storage server, the PowerStore Elite
As developers build increasingly sophisticated agents on Cloudflare, one of the biggest challenges they face is getting the right information into context at the right time. The quality of results produced by models is directly tied to the quality of context they operate with, but even as context window sizes grow past one million (1M) tokens, context rot remains an unsolved problem. A natural tension emerges between two bad options: keep everything in context and watch quality degrade, or aggressively prune and risk losing information the agent needs later.
Today we’re announcing the private beta of Agent Memory, a managed service that extracts information from agent conversations and makes it available when it’s needed, without filling up the context window.
It gives AI agents persistent memory, allowing them to recall what matters, forget what doesn’t, and get smarter over time. In this post, we’ll explain how it works — and what it can help you build.
The state of agentic memory
Agentic memory is one of the fastest-moving spaces in AI infrastructure, with new open-source libraries, managed services, and research prototypes launching on a near-weekly basis. These offerings vary widely in what they store, how they retrieve, and what kinds of agents they’re designed for. Benchmarks like LongMemEval, LoCoMo, and BEAM provide useful apples-to-apples comparisons, but they also make it easy to build systems that overfit for a specific evaluation and break down in production.
Existing offerings also differ in architecture. Some are managed services that handle extraction and retrieval in the background, others are self-hosted frameworks where you run the memory pipeline yourself. Some expose constrained, purpose-built APIs that keep memory logic out of the agent’s main context; others give the model raw access to a database or filesystem and let it design its own queries, burning tokens on storage and retrieval strategy instead of the actual task. Some try to fit everything into the context window, partitioning across multiple agents if needed, while others use retrieval to surface only what’s relevant.
Agent Memory is a managed service with an opinionated API and retrieval-based architecture. We’ve carefully considered the alternatives, and we believe this combination is the right default for most production workloads. Tighter ingestion and retrieval pipelines are superior to giving agents raw filesystem access. In addition to improved cost and performance, they provide a better foundation for complex reasoning tasks required in production, like temporal logic, supersession, and instruction following. We’ll likely expose data for programmatic querying down the road, but we expect that to be useful for edge cases, not common cases.
We built Agent Memory because the workloads we see on our platform exposed gaps that existing approaches don’t fully address. Agents running for weeks or months against real codebases and production systems need memory that stays useful as it grows — not just memory that performs well on a clean benchmark dataset that may fit entirely into a newer model’s context window.
They need fast ingestion. They need retrieval that doesn’t block the conversation. And they need to run on models that keep the per-query cost reasonable.
How you use it
Agent Memory stores memories in a profile, which is addressed by name. A profile gives you several operations: ingest a conversation, remember something specific, recall what you need, list memories, or forget a specific memory. Ingest is the bulk path that is typically called when the harness compacts context. Remember is for the model to store something important on the spot. Recall runs the full retrieval pipeline and returns a synthesized answer.
export default {
  async fetch(request: Request, env: Env): Promise<Response> {
    // Get a profile -- an isolated memory store shared across sessions, agents, and users
    const profile = await env.MEMORY.getProfile("my-project");
    // Ingest -- extract memories from a conversation (typically called at compaction)
    await profile.ingest([
      { role: "user", content: "Set up the project with React and TypeScript." },
      { role: "assistant", content: "Done. Scaffolded a React + TS project targeting Workers." },
      { role: "user", content: "Use pnpm, not npm. And dark mode by default." },
      { role: "assistant", content: "Got it -- pnpm and dark mode as default." },
    ], { sessionId: "session-001" });
    // Remember -- store a single memory explicitly (direct tool use by the model)
    const memory = await profile.remember({
      content: "API rate limit was increased to 10,000 req/s per zone after the April 10 incident.",
      sessionId: "session-001",
    });
    // Recall -- retrieve memories and get a synthesized answer
    const results = await profile.recall("What package manager does the user prefer?");
    console.log(results.result); // "The user prefers pnpm over npm."
    return Response.json({ ok: true });
  },
};
Agent Memory is accessed via a binding from any Cloudflare Worker. It can also be accessed via a REST API for agents running outside of Workers, following the same pattern as other Cloudflare developer platform APIs. If you’re building with the Cloudflare Agents SDK, the Agent Memory service integrates neatly as the reference implementation for handling compaction, remembering, and searching over memories in the memory portion of the Sessions API.
What you can build with it
Agent Memory is designed to work across a range of agent architectures:
Memory for individual agents. Regardless of whether you’re building with coding agents like Claude Code or OpenCode with a human in the loop, using self-hosted agent frameworks like OpenClaw or Hermes to act on your behalf, or wiring up managed services like Anthropic’s Managed Agents, Agent Memory can serve as the persistent memory layer without any changes to the agent’s core loop.
Memory for custom agent harnesses. Many teams are building their own agent infrastructure, including background agents that run autonomously without a human in the loop. Ramp Inspect is one public example; Stripe and Spotify have described similar systems. These harnesses can also benefit from giving their agents memory that persists across sessions and survives restarts.
Shared memory across agents, people, and tools. A memory profile doesn’t have to belong to a single agent. A team of engineers can share a memory profile so that knowledge learned by one person’s coding agent is available to everyone: coding conventions, architectural decisions, tribal knowledge that currently lives in people’s heads or gets lost when context is pruned. A code review bot and a coding agent can share memory so that review feedback shapes future code generation. The knowledge your agents accumulate stops being ephemeral and starts becoming a durable team asset.
While search is a component of memory, agent search and agent memory solve distinct problems. AI Search is our primitive for finding results across unstructured and structured files; Agent Memory is for context recall. The data in Agent Memory doesn’t exist as files; it’s derived from sessions. An agent can use both, and they are designed to work together.
Your memories are yours
As agents become more capable and more deeply embedded in business processes, the memory they accumulate becomes genuinely valuable — not just as an operational state, but as institutional knowledge that took real work to build. We’re hearing growing concern from customers about what it means to tie that asset to a single vendor, which is reasonable. The more an agent learns, the higher the switching cost if that memory can’t move with it.
Agent Memory is a managed service, but your data is yours. Every memory is exportable, and we’re committed to making sure the knowledge your agents accumulate on Cloudflare can leave with you if your needs change. We think the right way to earn long-term trust is to make leaving easy and to keep building something good enough that you don’t want to.
How Agent Memory works
To understand what happens behind the API shown above, it helps to break down how agents manage context. An agent has three components:
A harness that drives repeated calls to a model, facilitates tool calls, and manages state.
A model that takes context and returns completions.
State that includes both the current context window and additional information outside context: conversation history, files, databases, memory.
The critical moment in an agent’s context lifecycle is compaction, when the harness decides to shorten context to stay within a model’s limits or to avoid context rot. Today, most agents discard information permanently. Agent Memory preserves knowledge on compaction instead of losing it.
Agent Memory integrates into this lifecycle in two ways:
Bulk ingestion at compaction. When the harness compacts context, it ships the conversation to Agent Memory for ingestion. Ingestion extracts facts, events, instructions, and tasks from the message history, deduplicates them against existing memories, and stores them as memories for future retrieval.
Direct tool use by the model. The model gets tools to interact directly with memories, including the ability to recall (search memories for specific information). The model can also remember (explicitly store memories based on something important), forget (mark a memory as no longer important or true), and list (see what memories are stored). These are lightweight operations that don’t require the model to design queries or manage storage. The primary agent should never burn context on storage strategy. The tool surface it sees is deliberately constrained so that memory stays out of the way of the actual task.
The ingestion pipeline
When a conversation arrives for ingestion, it passes through a multi-stage pipeline that extracts, verifies, classifies, and stores memories.
The first step is deterministic ID generation. Each message gets a content-addressed ID — a SHA-256 hash of session ID, role, and content, truncated to 128 bits. If the same conversation is ingested twice, every message resolves to the same ID, making re-ingestion idempotent.
Next, the extractor runs two passes in parallel. A full pass chunks messages at roughly 10K characters with two-message overlap and processes up to four chunks concurrently. Each chunk gets a structured transcript with role labels, relative dates resolved to absolutes (“yesterday” becomes “2026-04-14”), and line indices for source provenance. For longer conversations (9+ messages), a detail pass runs alongside the full pass, using overlapping windows that focus specifically on extracting concrete values like names, prices, version numbers, and entity attributes that broad extraction tends to miss. The two result sets are then merged.
The next step is to verify each extracted memory against the source transcript. The verifier runs eight checks covering entity identity, object identity, location context, temporal accuracy, organizational context, completeness, relational context, and whether inferred facts are actually supported by the conversation. Each item is passed, corrected, or dropped accordingly.
The pipeline then classifies each verified memory into one of four types.
Facts represent what is true right now, atomic, stable knowledge like “the project uses GraphQL” or “the user prefers dark mode.”
Events capture what happened at a specific time, like a deployment or a decision.
Instructions describe how to do something, such as procedures, workflows, runbooks.
Tasks track what is being worked on right now and are ephemeral by design.
Facts and instructions are keyed. Each gets a normalized topic key, and when a new memory has the same key as an existing one, the old memory is superseded rather than deleted. This creates a version chain with a forward pointer from the old memory to the new memory. Tasks are excluded from the vector index entirely to keep it lean but remain discoverable via full-text search.
Finally, everything is written to storage using INSERT OR IGNORE so that content-addressed duplicates are silently skipped. After returning a response to the harness, background vectorization runs asynchronously. The embedding text prepends the 3-5 search queries generated during classification to the memory content itself, bridging the gap between how memories are written (declaratively: “user prefers dark mode”) and how they’re searched (interrogatively: “what theme does the user want?”). Vectors for superseded memories are deleted in parallel with new upserts.
The retrieval pipeline
When an agent searches for a memory, the query goes through a separate retrieval pipeline. During development, we discovered that no single retrieval method works best for all queries, so we run several methods in parallel and fuse the results.
The first stage runs query analysis and embedding concurrently. The query analyzer produces ranked topic keys, full-text search terms with synonyms, and a HyDE (Hypothetical Document Embedding), a declarative statement phrased as if it were the answer to the question. This stage embeds the raw query directly, and both embeddings are used downstream.
In the next stage, five retrieval channels run in parallel. Full-text search with Porter stemming handles keyword precision for queries where you know the exact term but not the surrounding context. Exact fact-key lookup returns results where the query maps directly to a known topic key. Raw message search queries the stored conversation messages directly via full-text search for unclassified conversation fragments that act as a safety net, catching verbatim details that the extraction pipeline may have generalized away. Direct vector search finds semantically similar memories using the embedded query. And HyDE vector search finds memories that are similar to what the answer would look like, which often surfaces results that direct embedding misses — particularly for abstract or multi-hop queries where the question and the answer use different vocabulary.
In the third and final stage, results from all five retrieval channels are merged using Reciprocal Rank Fusion (RRF), where each result receives a weighted score based on where it ranked within a given channel. Fact-key matches get the highest weight because an exact topic match is the strongest signal. Full-text search, HyDE vectors, and direct vectors are each weighted based on strength of signal. Finally, raw message matches are also included with low weight as a safety net to identify candidate results the extraction pipeline may have missed. Ties are broken by recency, with newer results ranked higher.
The pipeline then passes the top candidates to the synthesis model, which generates a natural-language answer to the original search query. Some specific query types get special treatment. As an example, temporal computation is handled deterministically via regex and arithmetic, not by the LLM. The results are injected into the synthesis prompt as pre-computed facts. Models are unreliable at things like date math, so we don’t ask them to do it.
How we built it
Our initial prototype of Agent Memory was lightweight, with a basic extraction pipeline, vector storage, and simple retrieval. It worked well enough to demonstrate the concept, but not well enough to ship.
So we put it into an agent-driven loop and iterated. The cycle looked like this: run benchmarks, analyze where we had gaps, propose solutions, have a human review the proposals to select strategies that generalize rather than overfit, let the agent make the changes, repeat.
This worked well, but came with one specific challenge. LLMs are stochastic, even with temperature set to zero. This caused results to vary across runs, which meant we had to average multiple runs (time-consuming for large benchmarks) and rely on trend analysis alongside raw scores to understand what was actually working. Along the way we had to guard carefully against overfitting the benchmarks in ways that didn’t genuinely make the product better for the general case.
Over time, this got us to a place where benchmark scores improved consistently with each iteration and we had a generalized architecture that would work in the real world. We intentionally tested against multiple benchmarks (including LoCoMo, LongMemEval, and BEAM) to push the system in different ways.
Why Cloudflare
We build Cloudflare on Cloudflare, and Agent Memory is no different. Existing primitives that are powerful and easily composable allowed us to ship the first prototype in a weekend and a fully functioning, productionized internal version of Agent Memory in less than a month. In addition to speed of delivery, Cloudflare turned out to be the ideal place to build this kind of service for a few other reasons.
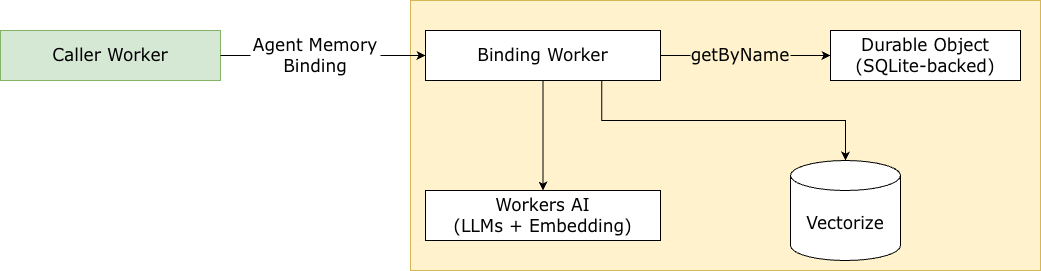
Under the hood, Agent Memory is a Cloudflare Worker that coordinates several systems:
Durable Object: stores the raw messages and classified memories
Vectorize: provides vector search over embedded memories
Workers AI: runs the LLMs and embedding models
Each memory context maps to its own Durable Object instance and Vectorize index, keeping data fully isolated between contexts. It also allows us to scale easily with higher demands.
Compute isolation via Durable Objects. Each memory profile gets its own Durable Object (DO) with a SQLite-backed store, providing strong isolation between tenants without any infrastructure overhead. The DO handles FTS indexing, supersession chains, and transactional writes. DO’s getByName() addressing means any request, from anywhere, can reach the right memory profile by name, and ensures that sensitive memories are strongly isolated from other tenants.
Storage across the stack. Memory content lives in SQLite-backed DOs. Vectors live in Vectorize. In the future, snapshots and exports will go to R2 for cost-efficient long-term storage. Each primitive is purpose-built for its workload, we don’t need to force everything into a single shape or database.
Local model inference with Workers AI. The entire extraction, classification, and synthesis pipeline runs on Workers AI models deployed on Cloudflare’s network. All AI calls pass a session affinity header routed to the memory profile name, so repeated requests hit the same backend for prompt caching benefits.
One interesting finding from our model selection: a bigger, more powerful model isn’t always better. We currently default to Llama 4 Scout (17B, 16-expert MoE) for extraction, verification, classification, and query analysis, and Nemotron 3 (120B MoE, 12B active parameters) for synthesis. Scout handles the structured classification tasks efficiently, while Nemotron’s larger reasoning capacity improves the quality of natural-language answers. The synthesizer is the only stage where throwing more parameters at the problem consistently helped. For everything else, the smaller model hit a better sweet spot of cost, quality, and latency.
How we’ve been using it
We run Agent Memory internally for our own workflows at Cloudflare, as both a proving ground and a source of ideas for what to build next.
Coding agent memory. We use an internal OpenCode plugin that wires Agent Memory into the development loop. Agent Memory provides memory of past compaction within sessions and across them. The less obvious benefit has been shared memory across a team: with a shared profile, the agent knows what other members of your team have already learned, which means it can stop asking questions that have already been answered and stop making mistakes that have already been corrected.
Agentic code review. We’ve connected Agent Memory to our internal agentic code reviewer. Arguably the most useful thing it learned to do was stay quiet. The reviewer now remembers that a particular comment wasn’t relevant in a past review, that a specific pattern was flagged, and the author chose to keep it for a good reason. Reviews get less noisy over time, not just smarter.
Chat bots. We’ve also wired memory into an internal chat bot that ingests message history and then lurks and remembers new messages that are sent. Then, when someone asks a question, the bot can answer based on previous conversations.
We also have a number of additional use cases that we plan to roll out internally in the near future as we refine and improve the service.
What’s next
We’re continuing to test and refine Agent Memory internally, improving the extraction pipeline, tuning retrieval quality, and expanding the background processing capabilities. Similar to how the human brain consolidates memories by replaying and strengthening connections during sleep, we see opportunities for memory storage to improve asynchronously and are currently implementing and testing various strategies to make this work.
We plan to make Agent Memory publicly available soon. If you’re building agents on Cloudflare and want early access, contact us to join the waitlist.
If you want to dig into the architecture, share what you’re building, or follow along as we develop this further, join us on theCloudflare Discord or start a thread in theCloudflare Community. We’re actively watching both, and are interested in what production agent workloads actually look like in the wild.
Agents have changed how we think about source control, file systems, and persisting state. Developers and agents are generating more code than ever — more code will be written over the next 5 years than in all of programming history — and it’s driven an order-of-magnitude change in the scale of the systems needed to meet this demand. Source control platforms are especially struggling here: they were built to meet the needs of humans, not a 10x change in volume driven by agents who never sleep, can work on several issues at once, and never tire.
We think there’s a need for a new primitive: a distributed, versioned filesystem that’s built for agents first and foremost, and that can serve the types of applications that are being built today.
We’re calling this Artifacts: a versioned file system that speaks Git. You can create repositories programmatically, alongside your agents, sandboxes, Workers, or any other compute paradigm, and connect to it from any regular Git client.
Want to give every agent session a repo? Artifacts can do it. Every sandbox instance? Also Artifacts. Want to create 10,000 forks from a known-good starting point? You guessed it: Artifacts again. Artifacts exposes a REST API and native Workers API for creating repositories, generating credentials, and commits for environments where a Git client isn’t the right fit (i.e. in any serverless function).
Artifacts is available in private beta for any developers on the paid Workers plan, and we’re aiming to open this up as a public beta by early May.
// Create a repo
const repo = await env.AGENT_REPOS.create(name)
// Pass back the token & remote to your agent
return { repo.remote, repo.token }
# Clone it and use it like any regular git remote
$ git clone https://x:${TOKEN}@123def456abc.artifacts.cloudflare.net/git/repo-13194.git
That’s it. A bare repo, ready to go, created on the fly, that any git client can operate it against.
And if you want to bootstrap an Artifacts repo from an existing git repository so that your agent can work on it independently and push independent changes, you can do that too with .import():
Check out the documentation to get started, or if you want to understand how Artifacts is being used, how it was built, and how it works under the hood: read on.
Why Git? What’s a versioned file system?
Agents know Git. It’s deep in the training data of most models. The happy path and the edge cases are well known to agents, and code-optimized models (and/or harnesses) are particularly good at using git.
Further, Git’s data model is not only good for source control, but for anything where you need to track state, time travel, and persist large amounts of small data. Code, config, session prompts and agent history: all of these are things (“objects”) that you often want to store in small chunks (“commits”) and be able to revert or otherwise roll back to (“history”).
We could have invented an entirely new, bespoke protocol… but then you have the bootstrap problem. AI models don’t know it, so you have to distribute skills, or a CLI, or hope that users are plugged into your docs MCP… all of that adds friction.
If we can just give agents an authenticated, secure HTTPS Git remote URL and have them operate as if it were a Git repo, though? That turns out to work pretty well. And for non-Git-speaking clients — such as a Cloudflare Worker, a Lambda function, or a Node.js app — we’ve exposed a REST API and (soon) language-specific SDKs. Those clients can also use isomorphic-git, but in many cases a simpler TypeScript API can reduce the API surface needed.
Not just for source control
Artifacts’ Git API might make you think it’s just for source control, but it turns out that the Git API and data model is a powerful way to persist state in a way that allows you to fork, time-travel and diff state for any data.
Inside Cloudflare, we’re using Artifacts for our internal agents: automatically persisting the current state of the filesystem and the session history in a per-session Artifacts repo. This enables us to:
Persist sandbox state without having to provision (and keep) block storage around.
Share sessions with others and allow them to time-travel back through both session (prompt) state and file state, irrespective of whether there were commits to the “actual” repository (source control).
And the best: fork a session from any point, allowing our team to share sessions with a co-worker and have them pick it up from them. Debugging something and want another set of eyes? Send a URL and fork it. Want to riff on an API? Have a co-worker fork it and pick up from where you left off.
We’ve also spoken to teams who want to use Artifacts in cases where the Git protocol isn’t a requirement at all, but the semantics (reverting, cloning, diffing) are. Storing per-customer config as part of your product, and want the ability to roll back? Artifacts can be a good representation of this.
We’re excited to see teams explore the non-Git use-cases around Artifacts just as much as the Git-focused ones.
Under the hood
Artifacts are built on top of Durable Objects. The ability to create millions (or tens of millions+) of instances of stateful, isolated compute is inherent to how Durable Objects work today, and that’s exactly what we needed for supporting millions of Git repos per namespace.
Major League Baseball (for live game fan-out), Confluence Whiteboards, and our own Agents SDK use Durable Objects under the hood at significant scale, and so we’re building this on a primitive that we’ve had in production for some time.
What we did need, however, was a Git implementation that could run on Cloudflare Workers. It needed to be small, as complete as possible, extensible (notes, LFS), and efficient. So we built one in Zig, and compiled it to Wasm.
Why did we use Zig? Three reasons:
The entire git protocol engine is written in pure Zig (no libc), compiled to a ~100KB WASM binary (with room for optimization!). It implements SHA-1, zlib inflate/deflate, delta encoding/decoding, pack parsing, and the full git smart HTTP protocol — all from scratch, with zero external dependencies other than the standard library.
Zig gives us manual control over memory allocation which is important in constrained environments like Durable Objects. The Zig Build System lets us easily share code between the WASM runtime (production) and native builds (testing against libgit2 for correctness verification).
The WASM module communicates with the JS host via a thin callback interface: 11 host-imported functions for storage operations (host_get_object, host_put_object, etc.) and one for streaming output (host_emit_bytes). The WASM side is fully testable in isolation.
Under the hood, Artifacts also uses R2 (for snapshots) and KV (for tracking auth tokens):
How Artifacts works (Workers, Durable Objects, and WebAssembly)
A Worker acts as the front-end, handling authentication & authorization, key metrics (errors, latency) and looking up each Artifacts repository (Durable Object) on the fly.
Specifically:
Files are stored in the underlying Durable Object’s SQLite database.
Durable Object storage has a 2MB max row size, so large Git objects are chunked and stored across multiple rows.
We make use of the sync KV API (state.storage.kv) which is backed by SQLite under the hood.
DOs have ~128MB memory limits: this means we can spawn tens of millions of them (they’re fast and light) but have to work within those limits.
We make heavy use of streaming in both the fetch and push paths, directly returning a `ReadableStream<Uint8Array>` built from the raw WASM output chunks.
We avoid calculating our own git deltas, instead, the raw deltas and base hashes are persisted alongside the resolved object. On fetch, if the requesting client already has the base object, Zig emits the delta instead of the full object, which saves bandwidth and memory.
Support for both v1 and v2 of the git protocol.
We support capabilities including ls-refs, shallow clones (deepen, deepen-since, deepen-relative), and incremental fetch with have/want negotiation.
We have an extensive test suite with conformance tests against git clients and verification tests against a libgit2 server designed to validate protocol support.
On top of this, we have native support for git-notes. Artifacts is designed to be agent-first, and notes enable agents to add notes (metadata) to Git objects. This includes prompts, agent attribution and other metadata that can be read/written from the repo without mutating the objects themselves.
Big repos, big problems? Meet ArtifactFS.
Most repos aren’t that big, and Git is designed to be extremely efficient in terms of storage: most repositories take only a few seconds to clone at most, and that’s dominated by network setup time, auth, and checksumming. In most agent or sandbox scenarios, that’s workable: just clone the repo as the sandbox starts and get to work.
But what about a multi-GB repository and/or repos with millions of objects? How can we clone that repo quickly, without blocking the agent’s ability to get to work for minutes and consuming compute?
A popular web framework (at 2.4GB and with a long history!) takes close to 2 minutes to clone. A shallow clone is faster, but not enough to get down to single digit seconds, and we don’t always want to omit history (agents find it useful).
Can we get large repos down to ~10-15 seconds so that our agent can get to work? Well, yes: with a few tricks.
As part of our launch of Artifacts, we’re open-sourcing ArtifactFS, a filesystem driver designed to mount large Git repos as quickly as possible, hydrating file contents on the fly instead of blocking on the initial clone. It’s ideal for agents, sandboxes, containers and other use cases where startup time is critical. If you can shave ~90-100 seconds off your sandbox startup time for every large repo, and you’re running 10,000 of those sandbox jobs per month: that’s 2,778 sandbox hours saved.
You can think of ArtifactFS as “Git clone but async”:
ArtifactFS runs a blobless clone of a git repository: it fetches the file tree and refs, but not the file contents. It can do that during sandbox startup, which then allows your agent harness to get to work.
In the background, it starts to hydrate (download) file contents concurrently via a lightweight daemon.
It prioritizes files that agents typically want to operate on first: package manifests (package.json, go.mod), configuration files, and code, deprioritizing binary blobs (images, executables and other non-text-files) where possible so that agents can scan the file tree as the files themselves are hydrated.
If a file isn’t fully hydrated when the agent tries to read it, the read will block until it has.
The filesystem does not attempt to “sync” files back to the remote repository: with thousands or millions of objects, that’s typically very slow, and since we’re speaking git, we don’t need to. Your agent just needs to commit and push, as it would with any repository. No new APIs to learn.
Importantly, ArtifactFS works with any Git remote, not just our own Artifacts. If you’re cloning large repos from GitHub, GitLab, or self-hosted Git infrastructure: you can still use ArtifactFS.
What’s coming?
Our release today is just the beta, and we’re already working on a number of features that you’ll see land over the next few weeks:
Expanding the available metrics we expose. Today we’re shipping metrics for key operations counts per namespace, repo and stored bytes per repo, so that managing millions of Artifacts isn’t toilsome.
Support for Event Subscriptions for repo-level events so that we can emit events on pushes, pulls, clones, and forks to any repository within a namespace. This will also allow you to consume events, write webhooks, and use those events to notify end-users, drive lifecycle events within your products, and/or run post-push jobs (like CI/CD).
Native TypeScript, Go and Python client SDKs for interacting with the Artifacts API
Repo-level search APIs and namespace-wide search APIs, e.g. “find all the repos with a package.json file”.
We’re also planning an API for Workers Builds, allowing you to run CI/CD jobs on any agent-driven workflow.
What will it cost me?
We’re still early with Artifacts, but want our pricing to work at agent-scale: it needs to be cost effective to have millions of repos, unused (or rarely used) repos shouldn’t be a drag, and our pricing should match the massively-single-tenant nature of agents.
You also shouldn’t have to think about whether a repo is going to be used or not, whether it’s hot or cold, and/or whether an agent is going to wake it up. We’ll charge you for the storage you consume and the operations (e.g. clones, forks, pushes & pulls) against each repo.
$/unit
Included
Operations
$0.15 per 1,000 operations
First 10k included (per month)
Storage
$0.50/GB-mo
First 1GB included.
Big, busy repos will cost more than smaller, less-often-used repos, whether you have 1,000, 100,000, or 10 million of them.
We’ll also be bringing Artifacts to the Workers Free plan (with some fair limits) as the beta progresses, and we’ll provide updates throughout the beta should this pricing change and ahead of billing any usage.
Where do I start?
Artifacts is launching in private beta, and we expect public beta to be ready in early May (2026, to be clear!). We’ll be allowing customers in progressively over the next few weeks, and you can register interest for the private beta directly.
In the meantime, you can learn more about Artifacts by:
Cloudflare announced our PlanetScale partnership last September to give Cloudflare Workers direct access to Postgres and MySQL databases for fast, full-stack applications.
Soon, we’re bringing our technologies even closer: you’ll be able to create PlanetScale Postgres and MySQL databases directly from the Cloudflare dashboard and API, and have them billed to your Cloudflare account.
You choose the data storage that fits your Worker application needs and keep a single system for billing as a Cloudflare self-serve or enterprise customer. Cloudflare credits like those given in our startup program or Cloudflare committed spend can be used towards PlanetScale databases.
Postgres & MySQL for Workers
SQL relational databases like Postgres and MySQL are a foundation of modern applications. In particular, Postgres has risen in developer popularity with its rich tooling ecosystem (ORMs, GUIs, etc) and extensions like pgvector for building vector search in AI-driven applications. Postgres is the default choice for most developers who need a powerful, flexible, and scalable database to power their applications.
You can already connect your PlanetScale account and create Postgres databases directly from the Cloudflare dashboard for your Workers. Starting next month, a new Cloudflare subscription will bill for new PlanetScale databases direct to your Cloudflare account as a self-serve or enterprise user.
How to create PlanetScale databases via Cloudflare dashboard after your PlanetScale account is connected. Cloudflare billing is coming next month.
With our built-in integration, PlanetScale databases automatically work with Workers using Hyperdrive, our database connectivity service. Hyperdrive service manages database connection pools and query caching to make database queries fast and reliable. You just add a binding to your Worker’s config file:
And start running SQL queries via your Worker with your Postgres client of choice:
import { Client } from "pg";

export default {
  async fetch(request, env, ctx) {

    const client = new Client({ connectionString: env.DATABASE.connectionString });
    await client.connect();

    const result = await client.query("SELECT * FROM pg_tables");
    ...
}
PlanetScale developer experience
PlanetScale was the obvious choice to provide to the Workers community due to it’s unrivaled performance and reliability. Developers can choose from two of the most popular relational databases with Postgres or Vitess MySQL. PlanetScale matches how Cloudflare treats performance and reliability as key features of a developer platform. And with features like query insights and agent driven workflows for improving SQL query performance and branching for deploying code safely, including database changes, the PlanetScale database developer experience is first-class.
Cloudflare users get the exact same PlanetScale database developer experience. Your PlanetScale databases can be deployed directly from Cloudflare with connections managed via Hyperdrive, which already makes your existing regional databases fast with global Workers. This means access to the same PlanetScale database clusters at standard PlanetScale pricing with all features included like query insights and detailed breakdown of usage and costs.
A single node on PlanetScale Postgres starts at $5/month.
Workers placement
With centralized databases, Workers can run right next to your primary database to reduce latency with an explicit placement hint. By default, Workers execute closest to a user request, which adds network latency when querying a central database especially for multiple queries. Instead, you can configure your Worker to execute in the closest Cloudflare data center to your PlanetScale database. In the future, Cloudflare can automatically set a placement hint based on the location of your PlanetScale database and reduce network latency to single digit milliseconds.
{
  "placement": {
    "region": "aws:us-east-1"
  }
}
Coming soon
You can deploy a PlanetScale Postgres database or connect an existing PlanetScale database to Workers today via the Cloudflare dashboard. Everything today is still billed via PlanetScale.
Launching next month, new PlanetScale databases can be billed to your Cloudflare account.
We are building more with our PlanetScale partners, such as Cloudflare API integration, so tell us what you’d like to see next.
Today, we’re introducing Project Think: the next generation of the Agents SDK. Project Think is a set of new primitives for building long-running agents (durable execution, sub-agents, sandboxed code execution, persistent sessions) and an opinionated base class that wires them all together. Use the primitives to build exactly what you need, or use the base class to get started fast.
Something happened earlier this year that changed how we think about AI. Tools like Pi, OpenClaw, Claude Code, and Codex proved a simple but powerful idea: give an LLM the ability to read files, write code, execute it, and remember what it learned, and you get something that looks less like a developer tool and more like a general-purpose assistant.
These coding agents aren’t just writing code anymore. People are using them to manage calendars, analyze datasets, negotiate purchases, file taxes, and automate entire business workflows. The pattern is always the same: the agent reads context, reasons about it, writes code to take action, observes the result, and iterates. Code is the universal medium of action.
Our team has been using these coding agents every day. And we kept running into the same walls:
They only run on your laptop or an expensive VPS: there’s no sharing, no collaboration, no handoff between devices.
They’re expensive when idle: a fixed monthly cost whether the agent is working or not. Scale that to a team, or a company, and it adds up fast.
They require management and manual setup: installing dependencies, managing updates, configuring identity and secrets.
And there’s a deeper structural issue. Traditional applications serve many users from one instance. As mentioned in our Welcome to Agents Week post, agents are one-to-one. Each agent is a unique instance, serving one user, running one task. A restaurant has a menu and a kitchen optimized to churn out dishes at volume. An agent is more like a personal chef: different ingredients, different techniques, different tools every time.
That fundamentally changes the scaling math. If a hundred million knowledge workers each use an agentic assistant at even modest concurrency, you need capacity for tens of millions of simultaneous sessions. At current per-container costs, that’s unsustainable. We need a different foundation.
That’s what we’ve been building.
Introducing Project Think
Project Think ships a set of new primitives for the Agents SDK:
Durable execution with fibers: crash recovery, checkpointing, automatic keepalive
Sub-agents: isolated child agents with their own SQLite and typed RPC
The execution ladder: workspace, isolate, npm, browser, sandbox
Self-authored extensions: agents that write their own tools at runtime
Each of these is usable directly with the Agent base class. Build exactly what you need with the primitives, or use the Think base class to get started fast. Let’s look at what each one does.
Long-running agents
Agents, as they exist today, are ephemeral. They run for a session, tied to a single process or device, and then they are gone. A coding agent that dies when your laptop sleeps, that’s a tool. An agent that persists — that can wake up on demand, continue work after interruptions, and carry forward the state without depending on your local runtime — that starts to look like infrastructure. And it changes the scaling model for agents completely.
The Agents SDK builds on Durable Objects to give every agent an identity, persistent state, and the ability to wake on message. This is the actor model: each agent is an addressable entity with its own SQLite database. It consumes zero compute when hibernated. When something happens (an HTTP request, a WebSocket message, a scheduled alarm, an inbound email) the platform wakes the agent, loads its state, and hands it the event. The agent does its work, then goes back to sleep.
VMs / Containers
Durable Objects
Idle cost
Full compute cost, always
Zero (hibernated)
Scaling
Provision and manage capacity
Automatic, per-agent
State
External database required
Built-in SQLite
Recovery
You build it (process managers, health checks)
Platform restarts, state survives
Identity / routing
You build it (load balancers, sticky sessions)
Built-in (name → agent)
10,000 agents, each active 1% of the time
10,000 always-on instances
~100 active at any moment
This changes the economics of running agents at scale. Instead of “one expensive agent per power user,” you can build “one agent per customer” or “one agent per task” or “one agent per email thread.” The marginal cost of spawning a new agent is effectively zero.
Surviving crashes: durable execution with fibers
An LLM call takes 30 seconds. A multi-turn agent loop can run for much longer. At any point during that window, the execution environment can vanish: a deploy, a platform restart, hitting resource limits. The upstream connection to the model provider is severed permanently, in-memory state is lost, and connected clients see the stream stop with no explanation.
runFiber() solves this. A fiber is a durable function invocation: registered in SQLite before execution begins, checkpointable at any point via stash(), and recoverable on restart via onFiberRecovered.
import { Agent } from "agents";

export class ResearchAgent extends Agent {
  async startResearch(topic: string) {
    void this.runFiber("research", async (ctx) => {
      const findings = [];

      for (let i = 0; i < 10; i++) {
        const result = await this.callLLM(`Research step ${i}: ${topic}`);
        findings.push(result);

        // Checkpoint: if evicted, we resume from here
        ctx.stash({ findings, step: i, topic });

        this.broadcast({ type: "progress", step: i });
      }

      return { findings };
    });
  }

  async onFiberRecovered(ctx) {
    if (ctx.name === "research" && ctx.snapshot) {
      const { topic } = ctx.snapshot;
      await this.startResearch(topic);
    }
  }
}
The SDK keeps the agent alive automatically during fiber execution, no special configuration needed. For work measured in minutes, keepAlive() / keepAliveWhile() prevents eviction during active work. For longer operations (CI pipelines, design reviews, video generation) the agent starts the work, persists the job ID, hibernates, and wakes on callback.
Delegating work: sub-agents via Facets
A single agent shouldn’t do everything itself. Sub-agents are child Durable Objects colocated with the parent via Facets, each with their own isolated SQLite and execution context:
Sub-agents are isolated at the storage level. Each one gets its own SQLite database, and there’s no implicit sharing of data between them. This is enforced by the runtime where sub-agent RPC latency is a function call. TypeScript catches misuse at compile time.
Conversations that persist: the Session API
Agents that run for days or weeks need more than the typical flat list of messages. The experimental Session API models this explicitly. Available on the Agent base class, conversations are stored as trees, where each message has a parent_id. This enables forking (explore an alternative without losing the original path), non-destructive compaction (summarize older messages rather than deleting them), and full-text search across conversation history via FTS5.
Session is usable directly with Agent, and it’s the storage layer that the Think base class builds on.
From tool calls to code execution
Conventional tool-calling has an awkward shape. The model calls a tool, pulls the result back through the context window, calls another tool, pulls that back, and so on. As the tool surface grows, this gets both expensive and clumsy. A hundred files means a hundred round-trips through the model.
// The LLM writes this. It runs in a sandboxed Dynamic Worker.
const files = await tools.find({ pattern: "**/*.ts" });
const results = [];
for (const file of files) {
  const content = await tools.read({ path: file });
  if (content.includes("TODO")) {
    results.push({ file, todos: content.match(/\/\/ TODO:.*/g) });
  }
}
return results;
Instead of 100 round-trips to the model, you just run a single program. This leads to fewer tokens used, faster execution, and better results. The Cloudflare API MCP server demonstrates this at scale. We expose only two tools (search() and execute()), which consume ~1,000 tokens, vs. ~1.17 million tokens for the naive tool-per-endpoint equivalent. This is a 99.9% reduction.
The missing primitive: safe sandboxes
Once you accept that models should write code on behalf of users, the question becomes: where does that code run? Not eventually, not after a product team turns it into a roadmap item. Right now, for this user, against this system, with tightly defined permissions.
Dynamic Workers are that sandbox. A fresh V8 isolate spun up at runtime, in milliseconds, with a few megabytes of memory. That’s roughly 100x faster and up to 100x more memory-efficient than a container. You can start a new one for every single request, run a snippet of code, and throw it away.
The critical design choice is the capability model. Instead of starting with a general-purpose machine and trying to constrain it, Dynamic Workers begin with almost no ambient authority (globalOutbound: null, no network access) and the developer grants capabilities explicitly, resource by resource, through bindings. We go from asking “how do we stop this thing from doing too much?” to “what exactly do we want this thing to be able to do?”
This is the right question for agent infrastructure.
The execution ladder
This capability model leads naturally to a spectrum of compute environments, an execution ladder that the agent escalates through as needed:
Tier 0 is the Workspace, a durable virtual filesystem backed by SQLite and R2. Read, write, edit, search, grep, diff. Powered by @cloudflare/shell.
Tier 1 is a Dynamic Worker: LLM-generated JavaScript running in a sandboxed isolate with no network access. Powered by @cloudflare/codemode.
Tier 2 adds npm. @cloudflare/worker-bundler fetches packages from the registry, bundles them with esbuild, and loads the result into the Dynamic Worker. The agent writes import { z } from "zod" and it just works.
Tier 3 is a headless browser via Cloudflare Browser Run. Navigate, click, extract, screenshot. Useful when the service doesn’t support agents yet via MCP or APIs.
Tier 4 is a Cloudflare Sandbox configured with your toolchains, repos, and dependencies: git clone, npm test, cargo build, synced bidirectionally with the Workspace.
The key design principle: the agent should be useful at Tier 0 alone, where each tier is additive. The user can add capabilities as they go.
Building blocks, not a framework
All of these primitives are available as standalone packages. Dynamic Workers, @cloudflare/codemode, @cloudflare/worker-bundler, and @cloudflare/shell (a durable filesystem with tools) are all usable directly with the Agent base class. You can combine them to give any agent a workspace, code execution, and runtime package resolution without adopting an opinionated framework.
The platform
Here’s the complete stack for building agents on Cloudflare:
Each of these is a building block. Together, they form something new: a platform where anyone can build, deploy, and run AI agents as capable as the ones running on your local machine today, but serverless, durable, and safe by construction.
The Think base class
Now that you’ve seen the primitives, here’s what happens when you wire them all together.
Think is an opinionated harness that handles the full chat lifecycle: agentic loop, message persistence, streaming, tool execution, stream resumption, and extensions. You focus on what makes your agent unique.
The minimal subclass looks like this:
import { Think } from "@cloudflare/think";
import { createWorkersAI } from "workers-ai-provider";

export class MyAgent extends Think<Env> {
  getModel() {
    return createWorkersAI({ binding: this.env.AI })(
      "@cf/moonshotai/kimi-k2.5"
    );
  }
}
That’s effectively all you need to have a working chat agent with streaming, persistence, abort/cancel, error handling, resumable streams, and a built-in workspace filesystem. Deploy with npx wrangler deploy.
Think makes decisions for you. When you need more control, you can override the ones you care about:
Override
Purpose
getModel()
Return the LanguageModel to use
getSystemPrompt()
System prompt
getTools()
AI SDK compatible ToolSet for the agentic loop
maxSteps
Max tool-call rounds per turn
configureSession()
Context blocks, compaction, search, skills
Under the hood, Think runs the complete agentic loop on every turn: it assembles the context (base instructions + tool descriptions + skills + memory + conversation history), calls streamText, executes tool calls (with output truncation to prevent context blowup), appends results, loops until the model is done or the step limit is reached. All messages are persisted after each turn.
Lifecycle hooks
Think gives you hooks at every stage of the chat turn, without requiring you to own the whole pipeline:
Switch to a lower cost model for follow-up turns, limit the tools it can use, and pass in client-side context on each turn. Also log every tool call to analytics and automatically trigger one more follow-up turn after the model completes, all without replacing onChatMessage.
Persistent memory and long conversations
Think builds on Session API as its storage layer, giving you tree-structured messages with branching built in.
On top of that, it adds persistent memory through context blocks. These are structured sections of the system prompt that the model can read and update over time, and they persist across hibernation.The model sees “MEMORY (Important facts, use set_context to update) [42%, 462/1100 tokens]” and can proactively remember things.
Sessions are flexible. You can run multiple conversations per agent and fork them to try a different direction without losing the original.
As context grows, Think handles limits with non-destructive compaction. Older messages are summarized instead of removed, while the full history remains stored in SQLite.
Search is built in as well. Using FTS5, you can query conversation history within a session or across all the sessions. The agent is also able to search its own past usingsearch_context tool.
The full execution ladder, wired in
Think integrates the entire execution ladder into a single getTools() return:
Think takes code execution one step further. An agent can write its own extensions: TypeScript programs that run in Dynamic Workers, declaring permissions for network access and workspace operations.
Think’s ExtensionManager bundles the extension (optionally with npm deps via @cloudflare/worker-bundler), loads it into a Dynamic Worker, and registers the new tools. The extension persists in DO storage and survives hibernation. The next time the user asks about pull requests, the agent has a github_create_pr tool that didn’t exist 30 seconds ago.
This is the kind of self-improvement loop that makes agents genuinely more useful over time. Not through fine-tuning or RLHF, but through code. The agent is able to write new capabilities for itself, all in sandboxed, auditable, and revocable TypeScript.
Sub-agent RPC
Think also works as a sub-agent, called via chat() over RPC from a parent, with streaming events via callback:
Each child gets its own conversation tree, memory, tools, and model. The parent doesn’t need to know the details.
Getting started
Project Think is experimental. The API surface is stable but will continue to evolve in the coming days and weeks. We’re already using it internally to build our own background agent infrastructure, and we’re sharing it early so you can build alongside us.
npm install @cloudflare/think agents ai @cloudflare/shell zod workers-ai-provider
// src/client.tsx
import { useAgent } from "agents/react";
import { useAgentChat } from "@cloudflare/ai-chat/react";

function Chat() {
  const agent = useAgent({ agent: "MyAgent" });
  const { messages, sendMessage, status } = useAgentChat({ agent });
  // Render your chat UI
}
Think speaks the same WebSocket protocol as @cloudflare/ai-chat, so existing UI components work out of the box. If you’ve built on AIChatAgent, your client code doesn’t change.
The third wave
We see three waves of AI agents:
The first wave was chatbots. They were stateless, reactive, and fragile. Every conversation started from scratch with no memory, no tools, and no ability to act. This made them useful for answering questions, but limited them to only answering questions.
The second wave was coding agents. These are stateful, tool-using and far more capable tools like Pi, Claude Code, OpenClaw, and Codex. These agents can read codebases, write code, execute it, and iterate. These proved that an LLM with the right tools is a general-purpose machine, but they run on your laptop, for one user, with no durability guarantees.
Now we are entering the third wave: agents as infrastructure. Durable, distributed, structurally safe, and serverless. These are agents that run on the Internet, survive failures, cost nothing when idle, and enforce security through architecture rather than behavior. Agents that any developer can build and deploy for any number of users.
This is the direction we’re betting on.
The Agents SDK is already powering thousands of production agents. With Project Think and the the primitives it introduces, we’re adding the missing pieces to make those agents dramatically more capable: persistent workspaces, sandboxed code execution, durable long-running tasks, structural security, sub-agent coordination, and self-authored extensions.
It’s available today in preview. We’re building alongside you, and we’d genuinely love to see what you (and your coding agent) create with it.
Think is part of the Cloudflare Agents SDK, available as @cloudflare/think. The features described in this post are in preview. APIs may change as we incorporate feedback. Check the documentation and example to get started.
A few weeks ago, we announced Dynamic Workers, a new feature of the Workers platform which lets you load Worker code on-the-fly into a secure sandbox. The Dynamic Worker Loader API essentially provides direct access to the basic compute isolation primitive that Workers has been based on all along: isolates, not containers. Isolates are much lighter-weight than containers, and as such, can load 100x faster using 1/10 the memory. They are so efficient, they can be treated as “disposable”: start one up to run a few lines of code, then throw it away. Like a secure version of eval().
Dynamic Workers have many uses. In the original announcement, we focused on how to use them to run AI-agent-generated code as an alternative to tool calls. In this use case, an AI agent performs actions at the request of a user by writing a few lines of code and executing them. The code is single-use, intended to perform one task one time, and is thrown away immediately after it executes.
But what if you want an AI to generate more persistent code? What if you want your AI to build a small application with a custom UI the user can interact with? What if you want that application to have long-lived state? But of course, you still want it to run in a secure sandbox.
One way to do this would be to use Dynamic Workers, and simply provide the Worker with an RPC API that gives it access to storage. Using bindings, you could give the Dynamic Worker an API that points back to your remote SQL database (perhaps backed by Cloudflare D1, or a Postgres database you access through Hyperdrive — it’s up to you).
But Workers also has a unique and extremely fast type of storage that may be a perfect fit for this use case: Durable Objects. A Durable Object is a special kind of Worker that has a unique name, with one instance globally per name. That instance has a SQLite database attached, which lives on local disk on the machine where the Durable Object runs. This makes storage access ridiculously fast: there is effectively zero latency.
Perhaps, then, what you really want is for your AI to write code for a Durable Object, and then you want to run that code in a Dynamic Worker.
But how?
This presents a weird problem. Normally, to use Durable Objects you have to:
Write a class extending DurableObject.
Export it from your Worker’s main module.
Specify in your Wrangler config that storage should be provision for this class. This creates a Durable Object namespace that points at your class for handling incoming requests.
This doesn’t extend naturally to Dynamic Workers. First, there is the obvious problem: The code is dynamic. You run it without invoking the Cloudflare API at all. But Durable Object storage has to be provisioned through the API, and the namespace has to point at an implementing class. It can’t point at your Dynamic Worker.
But there is a deeper problem: Even if you could somehow configure a Durable Object namespace to point directly at a Dynamic Worker, would you want to? Do you want your agent (or user) to be able to create a whole namespace full of Durable Objects? To use unlimited storage spread around the world?
You probably don’t. You probably want some control. You may want to limit, or at least track, how many objects they create. Maybe you want to limit them to just one object (probably good enough for vibe-coded personal apps). You may want to add logging and other observability. Metrics. Billing. Etc.
To do all this, what you really want is for requests to these Durable Objects to go to your code first, where you can then do all the “logistics”, and then forward the request into the agent’s code. You want to write a supervisor that runs as part of every Durable Object.
Solution: Durable Object Facets
Today we are releasing, in open beta, a feature that solves this problem.
Durable Object Facets allow you to load and instantiate a Durable Object class dynamically, while providing it with a SQLite database to use for storage. With Facets:
First you create a normal Durable Object namespace, pointing to a class you write.
In that class, you load the agent’s code as a Dynamic Worker, and call into it.
The Dynamic Worker’s code can implement a Durable Object class directly. That is, it literally exports a class declared as extends DurableObject.
You are instantiating that class as a “facet” of your own Durable Object.
The facet gets its own SQLite database, which it can use via the normal Durable Object storage APIs. This database is separate from the supervisor’s database, but the two are stored together as part of the same overall Durable Object.
How it works
Here is a simple, complete implementation of an app platform that dynamically loads and runs a Durable Object class:
import { DurableObject } from "cloudflare:workers";

// For the purpose of this example, we'll use this static
// application code, but in the real world this might be generated
// by AI (or even, perhaps, a human user).
const AGENT_CODE = `
  import { DurableObject } from "cloudflare:workers";

  // Simple app that remembers how many times it has been invoked
  // and returns it.
  export class App extends DurableObject {
    fetch(request) {
      // We use storage.kv here for simplicity, but storage.sql is
      // also available. Both are backed by SQLite.
      let counter = this.ctx.storage.kv.get("counter") || 0;
      ++counter;
      this.ctx.storage.kv.put("counter", counter);

      return new Response("You've made " + counter + " requests.\\n");
    }
  }
`;

// AppRunner is a Durable Object you write that is responsible for
// dynamically loading applications and delivering requests to them.
// Each instance of AppRunner contains a different app.
export class AppRunner extends DurableObject {
  async fetch(request) {
    // We've received an HTTP request, which we want to forward into
    // the app.

    // The app itself runs as a child facet named "app". One Durable
    // Object can have any number of facets (subject to storage limits)
    // with different names, but in this case we have only one. Call
    // this.ctx.facets.get() to get a stub pointing to it.
    let facet = this.ctx.facets.get("app", async () => {
      // If this callback is called, it means the facet hasn't
      // started yet (or has hibernated). In this callback, we can
      // tell the system what code we want it to load.

      // Load the Dynamic Worker.
      let worker = this.#loadDynamicWorker();

      // Get the exported class we're interested in.
      let appClass = worker.getDurableObjectClass("App");

      return { class: appClass };
    });

    // Forward request to the facet.
    // (Alternatively, you could call RPC methods here.)
    return await facet.fetch(request);
  }

  // RPC method that a client can call to set the dynamic code
  // for this app.
  setCode(code) {
    // Store the code in the AppRunner's SQLite storage.
    // Each unique code must have a unique ID to pass to the
    // Dynamic Worker Loader API, so we generate one randomly.
    this.ctx.storage.kv.put("codeId", crypto.randomUUID());
    this.ctx.storage.kv.put("code", code);
  }

  #loadDynamicWorker() {
    // Use the Dynamic Worker Loader API like normal. Use get()
    // rather than load() since we may load the same Worker many
    // times.
    let codeId = this.ctx.storage.kv.get("codeId");
    return this.env.LOADER.get(codeId, async () => {
      // This Worker hasn't been loaded yet. Load its code from
      // our own storage.
      let code = this.ctx.storage.kv.get("code");

      return {
        compatibilityDate: "2026-04-01",
        mainModule: "worker.js",
        modules: { "worker.js": code },
        globalOutbound: null,  // block network access
      }
    });
  }
}

// This is a simple Workers HTTP handler that uses AppRunner.
export default {
  async fetch(req, env, ctx) {
    // Get the instance of AppRunner named "my-app".
    // (Each name has exactly one Durable Object instance in the
    // world.)
    let obj = ctx.exports.AppRunner.getByName("my-app");

    // Initialize it with code. (In a real use case, you'd only
    // want to call this once, not on every request.)
    await obj.setCode(AGENT_CODE);

    // Forward the request to it.
    return await obj.fetch(req);
  }
}
In this example:
AppRunner is a “normal” Durable Object written by the platform developer (you).
Each instance of AppRunner manages one application. It stores the app code and loads it on demand.
The application itself implements and exports a Durable Object class, which the platform expects is named App.
AppRunner loads the application code using Dynamic Workers, and then executes the code as a Durable Object Facet.
Each instance of AppRunner is one Durable Object composed of two SQLite databases: one belonging to the parent (AppRunner itself) and one belonging to the facet (App). These databases are isolated: the application cannot read AppRunner‘s database, only its own.
To run the example, copy the code above into a file worker.js, pair it with the following wrangler.jsonc, and run it locally with npx wrangler dev.
To provide the best experiences, we use technologies like cookies to store and/or access device information. Consenting to these technologies will allow us to process data such as browsing behavior or unique IDs on this site. Not consenting or withdrawing consent, may adversely affect certain features and functions.
Functional
Always active
The technical storage or access is strictly necessary for the legitimate purpose of enabling the use of a specific service explicitly requested by the subscriber or user, or for the sole purpose of carrying out the transmission of a communication over an electronic communications network.
Preferences
The technical storage or access is necessary for the legitimate purpose of storing preferences that are not requested by the subscriber or user.
Statistics
The technical storage or access that is used exclusively for statistical purposes.The technical storage or access that is used exclusively for anonymous statistical purposes. Without a subpoena, voluntary compliance on the part of your Internet Service Provider, or additional records from a third party, information stored or retrieved for this purpose alone cannot usually be used to identify you.
Marketing
The technical storage or access is required to create user profiles to send advertising, or to track the user on a website or across several websites for similar marketing purposes.