What Is Hybrid Cloud?

Post Syndicated from Molly Clancy original https://www.backblaze.com/blog/confused-about-the-hybrid-cloud-youre-not-alone/

An illustration of clouds computers and servers.
Editor’s note: This post has been updated since it was originally published in 2017.

The term hybrid cloud has been around for a while—we originally published this explainer in 2017. But time hasn’t necessarily made things clearer. Maybe you hear folks talk about your company’s hybrid cloud approach, but what does that really mean? If you’re confused about the hybrid cloud, you’re not alone. 

Hybrid cloud is a computing approach that uses both private and public cloud resources with some kind of orchestration between them. The term has been applied to a wide variety of IT solutions, so it’s no wonder the concept breeds confusion. 

In this post, we’ll explain what a hybrid cloud is, how it can benefit your business, and how to choose a cloud storage provider for your hybrid cloud strategy.

What Is the Hybrid Cloud?

A hybrid cloud is an infrastructure approach that uses both private and public resources. Let’s first break down those key terms:

  • Public cloud: When you use a public cloud, you are storing your data in another company’s internet-accessible data center. A public cloud service allows anybody to sign up for an account, and share data center resources with other customers or tenants. Instead of worrying about the costs and complexity of operating an on-premises data center, a cloud storage user only needs to pay for the cloud storage they need.
  • Private cloud: In contrast, a private cloud is specifically designed for a single tenant. Think of a private cloud as a permanently reserved private dining room at a restaurant—no other customer can use that space. As a result, private cloud services can be more expensive than public clouds. Traditionally, private clouds typically lived on on-premises infrastructure, meaning they were built and maintained on company property. Now, private clouds can be maintained and managed on-premises by an organization or by a third party in a data center. The key defining factor is that the cloud is dedicated to a single tenant or organization.

Those terms are important to know to understand the hybrid cloud architecture approach. Hybrid clouds are defined by a combined management approach, which means there is some type of orchestration between the private and public environments that allows workloads and data to move between them in a flexible way as demands, needs, and costs change. This gives you flexibility when it comes to data deployment and usage.  

In other words, if you have some IT resources on-premises that you are replicating or sharing with an external vendor—congratulations, you have a hybrid cloud!
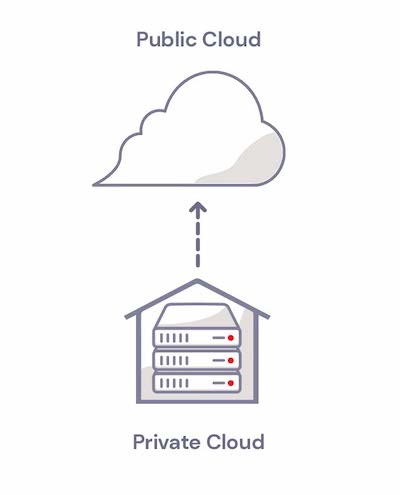
Hybrid cloud refers to a computing architecture that is made up of both private cloud resources and public cloud resources with some kind of orchestration between them.

Hybrid Cloud Examples

Here are a few examples of how a hybrid cloud can be used:

  1. As an active archive: You might establish a protocol that says all accounting files that have not been changed in the last year, for example, are automatically moved off-premises to cloud storage archive to save cost and reduce the amount of storage needed on-site. You can still access the files; they are just no longer stored on your local systems. 
  2. To meet compliance requirements: Let’s say some of your data is subject to strict data privacy requirements, but other data you manage isn’t as closely protected. You could keep highly regulated data on premises in a private cloud and the rest of your data in a public cloud. 
  3. To scale capacity: If you’re in an industry that experiences seasonal or frequent spikes like retail or ecommerce, these spikes can be handled by a public cloud which provides the elasticity to deal with times when your data needs exceed your on-premises capacity.
  4. For digital transformation: A hybrid cloud lets you adopt cloud resources in a phased approach as you expand your cloud presence.

Hybrid Cloud vs. Multi-cloud: What’s the Diff?

You wouldn’t be the first person to think that the terms multi-cloud and hybrid cloud appear similar. Both of these approaches involve using multiple clouds. However, multi-cloud uses two clouds of the same type in combination (i.e., two or more public clouds) and hybrid cloud approaches combine a private cloud with a public cloud. One cloud approach is not necessarily better than the other—they simply serve different use cases. 

For example, let’s say you’ve already invested in significant on-premises IT infrastructure, but you want to take advantage of the scalability of the cloud. A hybrid cloud solution may be a good fit for you. 

Alternatively, a multi-cloud approach may work best for you if you are already in the cloud and want to mitigate the risk of a single cloud provider having outages or issues. 

Hybrid Cloud Benefits

A hybrid cloud approach allows you to take advantage of the best elements of both private and public clouds. The primary benefits are flexibility, scalability, and cost savings.

Benefit 1: Flexibility and Scalability

One of the top benefits of the hybrid cloud is its flexibility. Managing IT infrastructure on-premises can be time consuming and expensive, and adding capacity requires advance planning, procurement, and upfront investment. 

The public cloud is readily accessible and able to provide IT resources whenever needed on short notice. For example, the term “cloud bursting” refers to the on-demand and temporary use of the public cloud when demand exceeds resources available in the private cloud. A private cloud, on the other hand, provides the absolute fastest access speeds since it is generally located on-premises. (But cloud providers are catching up fast, for what it’s worth.) For data that is needed with the absolute lowest levels of latency, it may make sense for the organization to use a private cloud for current projects and store an active archive in a less expensive, public cloud.

Benefit 2: Cost Savings

Within the hybrid cloud framework, the public cloud segment offers cost-effective IT resources, eliminating the need for upfront capital expenses and associated labor costs. IT professionals gain the flexibility to optimize configurations, choose the most suitable service provider, and determine the optimal location for each workload. This strategic approach reduces costs by aligning resources with specific tasks. Furthermore, the ability to easily scale, redeploy, or downsize services enhances efficiency, curbing unnecessary expenses and contributing to overall cost savings.

Comparing Private vs. Hybrid Cloud Storage Costs

To understand the difference in storage costs between a purely on-premises solution and a hybrid cloud solution, we’ll present two scenarios. For each scenario, we’ll use data storage amounts of 100TB, 1PB, and 2PB. Each table is the same format, all we’ve done is change how the data is distributed: private (on-premises) or public (off-premises). We are using the costs for our own Backblaze B2 Cloud Storage in this example. The math can be adapted for any set of numbers you wish to use.

Scenario 1    100% of data on-premises storage

    Data Stored
  Data Stored On-premises: 100%   100TB 1,000TB 2,000TB
On-premises cost range   Monthly Cost
  Low — $12/TB/Month   $1,200 $12,000 $24,000
  High — $20/TB/Month   $2,000 $20,000 $40,000

Scenario 2    20% of data on-premises with 80% public cloud storage (Backblaze B2)

    Data Stored
  Data Stored On-premises: 20%   20TB 200TB 400TB
  Data Stored in the Cloud: 80%   80TB 800TB 1,600TB
On-premises cost range   Monthly Cost
  Low — $12/TB/Month   $240 $2,400 $4,800
  High — $20/TB/Month   $400 $4,000 $8,000
Public cloud cost range   Monthly Cost
  Low — $6/TB/Month (Backblaze B2)   $480 $4,800 $9,600
  High — $20/TB/Month   $1,600 $16,000 $32,000
On-premises + public cloud cost range   Monthly Cost
  Low   $720 $7,200 $14,400
  High   $2,000 $20,000 $40,000

As you can see, using a hybrid cloud solution and storing 80% of the data in the cloud with a provider like Backblaze B2 can result in significant savings over storing only on-premises.

Choosing a Cloud Storage Provider for Your Hybrid Cloud

Okay, so you understand the benefits of using a hybrid cloud approach, what next? Determining the right mix of cloud services may be intimidating because there are so many public cloud options available. Fortunately, there are a few decision factors you can use to simplify setting up your hybrid cloud solution. Here’s what to think about when choosing a public cloud storage provider:

  • Ease of use: Avoiding a steep learning curve can save you hours of work effort in managing your cloud deployments. By contrast, overly complicated pricing tiers or bells and whistles you don’t need can slow you down.
  • Data security controls: Compare how each cloud provider facilitates proper data controls. For example, take a look at features like authentication, Object Lock, and encryption.
  • Data egress fees: Some cloud providers charge additional fees for data egress (i.e., removing data from the cloud). These fees can make it more expensive to switch between providers. In addition to fees, check the data speeds offered by the provider.
  • Interoperability: Flexibility and interoperability are key reasons to use cloud services. Before signing up for a service, understand the provider’s integration ecosystem. A lack of needed integrations may place a greater burden on your team to keep the service running effectively.
  • Storage tiers: Some providers offer different storage tiers where you sacrifice access for lower costs. While the promise of inexpensive cold storage can be attractive, evaluate whether you can afford to wait hours or days to retrieve your data.
  • Pricing transparency: Pay careful attention to the cloud provider’s pricing model and tier options. Consider building a spreadsheet to compare a shortlist of cloud providers’ pricing models.

When Hybrid Cloud Might Not Always Be the Right Fit

The hybrid cloud may not always be the optimal solution, particularly for smaller organizations with limited IT budgets that might find a purely public cloud approach more cost-effective. The substantial setup and operational costs of private servers could be prohibitive.

A thorough understanding of workloads is crucial to effectively tailor the hybrid cloud, ensuring the right blend of private, public, and traditional IT resources for each application and maximizing the benefits of the hybrid cloud architecture.

So, Should You Go Hybrid?

Big picture, anything that helps you respond to IT demands quickly, easily, and affordably is a win. With a hybrid cloud, you can avoid some big up-front capital expenses for in-house IT infrastructure, making your CFO happy. Being able to quickly spin up IT resources as they’re needed will appeal to the CTO and VP of operations.

So, given all that, we’ve arrived at the bottom line and the question is, should you or your organization embrace hybrid cloud infrastructure?According to Flexera’s 2023 State of the Cloud report, 72% of enterprises utilize a hybrid cloud strategy. That indicates that the benefits of the hybrid cloud appeal to a broad range of companies.

If an organization approaches implementing a hybrid cloud solution with thoughtful planning and a structured approach, a hybrid cloud can deliver on-demand flexibility, empower legacy systems, and applications with new capabilities, and become a catalyst for digital transformation. The result can be an elastic and responsive infrastructure that has the ability to quickly adapt to changing demands of the business.

As data management professionals increasingly recognize the advantages of the hybrid cloud, we can expect more and more of them to embrace it as an essential part of their IT strategy.

Tell Us What You’re Doing With the Hybrid Cloud

Are you currently embracing the hybrid cloud, or are you still uncertain or hanging back because you’re satisfied with how things are currently? We’d love to hear your comments below on how you’re approaching your cloud architecture decisions.

FAQs About Hybrid Cloud

What exactly is a hybrid cloud?

Hybrid cloud is a computing approach that uses both private and public cloud resources with some kind of orchestration between them.

What is the difference between hybrid and multi-cloud?

Multi-cloud uses two clouds of the same type in combination (i.e., two or more public clouds) and hybrid cloud approaches combine a private cloud with a public cloud. One cloud approach is not necessarily better than the other—they simply serve different use cases.

What is a hybrid cloud architecture?

Hybrid cloud architecture is any kind of IT architecture that combines both the public and private clouds. Many organizations use this term to describe specific software products that provide solutions which combine the two types of clouds.

What are hybrid clouds used for?

Organizations will often use hybrid clouds to create redundancy and scalability for their computing workload. A hybrid cloud is a great way for a company to have extra fallback options to continue offering services even when they have higher than usual levels of traffic, and it can also help companies scale up their services over time as they need to offer more options.

The post What Is Hybrid Cloud? appeared first on Backblaze Blog | Cloud Storage & Cloud Backup.

RFC 9498: The GNU Name System

Post Syndicated from corbet original https://lwn.net/Articles/952122/

The GNU Name System has now been formalized as RFC 9498.

GNS addresses long-standing security and privacy issues in the
ubiquitous Domain Name System (DNS). Previous attempts to secure
DNS (DNSSEC) fail to address critical security issues such as
end-to-end security, query privacy, censorship, and centralization
of root zone governance. After 40 years of patching, it is time for
a new beginning.

MikroTik CRS310-8G+2S+IN Review 8-port 2.5GbE and 2-port 10GbE Switch

Post Syndicated from Rohit Kumar original https://www.servethehome.com/mikrotik-crs310-8g-2s-in-review-8-port-2-5gbe-and-2-port-10gbe-switch/

We have longed for the MikroTik CRS310-8G+2S+IN switch for years, now we review this Marvell-powered 2.5GbE switch with MikroTik management

The post MikroTik CRS310-8G+2S+IN Review 8-port 2.5GbE and 2-port 10GbE Switch appeared first on ServeTheHome.

AWS Security Profile: Chris Betz, CISO of AWS

Post Syndicated from Chris Betz original https://aws.amazon.com/blogs/security/aws-security-profile-chris-betz-ciso-of-aws/

In the AWS Security Profile series, we feature the people who work in Amazon Web Services (AWS) Security and help keep our customers safe and secure. This interview is with Chris Betz, Chief Information Security Officer (CISO), who began his role as CISO of AWS in August of 2023.


How did you get started in security? What prompted you to pursue this field?

I’ve always had a passion for technology, and for keeping people out of harm’s way. When I found computer science and security in the Air Force, this world opened up to me that let me help others, be a part of building amazing solutions, and engage my competitive spirit. Security has the challenges of the ultimate chess game, though with real and impactful consequences. I want to build reliable, massively scaled systems that protect people from malicious actors. This is really hard to do and a huge challenge I undertake every day. It’s an amazing team effort that brings together the smartest folks that I know, competing with threat actors.

What are you most excited about in your new role?

One of the most exciting things about my role is that I get to work with some of the smartest people in the field of security, people who inspire, challenge, and teach me something new every day. It’s exhilarating to work together to make a significant difference in the lives of people all around the world, who trust us at AWS to keep their information secure. Security is constantly changing, we get to learn, adapt, and get better every single day. I get to spend my time helping to build a team and culture that customers can depend on, and I’m constantly impressed and amazed at the caliber of the folks I get work with here.

How does being a former customer influence your role as AWS CISO?

I was previously the CISO at Capital One and was an AWS customer. As a former customer, I know exactly what it’s like to be a customer who relies on a partner for significant parts of their security. There needs to be a lot of trust, a lot of partnership across the shared responsibility model, and consistent focus on what’s being done to keep sensitive data secure. Every moment that I’m here at AWS, I’m reminded about things from the customer perspective and how I can minimize complexity, and help customers leverage the “super powers” that the cloud provides for CISOs who need to defend the breadth of their digital estate. I know how important it is to earn and keep customer trust, just like the trust I needed when I was in their shoes. This mindset influences me to learn as much as I can, never be satisfied with ”good enough,” and grab every opportunity I can to meet and talk with customers about their security.

What’s been the most dramatic change you’ve seen in the security industry recently?

This is pretty easy to answer: artificial intelligence (AI). This is a really exciting time. AI is dominating the news and is on the mind of every security professional, everywhere. We’re witnessing something very big happening, much like when the internet came into existence and we saw how the world dramatically changed because of it. Every single sector was impacted, and AI has the same potential. Many customers use AWS machine learning (ML) and AI services to help improve signal-to-noise ratio, take over common tasks to free up valuable time to dig deeper into complex cases, and analyze massive amounts of threat intelligence to determine the right action in less time. The combination of Data + Compute power + AI is a huge advantage for cloud companies.

AI and ML have been a focus for Amazon for more than 25 years, and we get to build on an amazing foundation. And it’s exciting to take advantage of and adapt to the recent big changes and the impact this is having on the world. At AWS, we’re focused on choice and broadening access to generative AI and foundation models at every layer of the ML stack, including infrastructure (chips), developer tools, and AI services. What a great time to be in security!

What’s the most challenging part of being a CISO?

Maintaining a culture of security involves each person, each team, and each leader. That’s easy to say, but the challenge is making it tangible—making sure that each person sees that, even though their title doesn’t have “security” in it, they are still an integral part of security. We often say, “If you have access, you have responsibility.” We work hard to limit that access. And CISOs must constantly work to build and maintain a culture of security and help every single person who has access to data understand that security is an important part of their job.

What’s your short- and long-term vision for AWS Security?

Customers trust AWS to protect their data so they can innovate and grow quickly, so in that sense, our vision is for security to be a growth lever for our customers, not added friction. Cybersecurity is key to unlocking innovation, so managing risk and aligning the security posture of AWS with our business objectives will continue for the immediate future and long term. For our customers, my vision is to continue helping them understand that investing in security helps them move faster and take the right risks—the kind of risks they need to remain competitive and innovative. When customers view security as a business accelerator, they achieve new technical capabilities and operational excellence. Strong security is the ultimate business enabler.

If you could give one piece of advice to all CISOs, what would it be?

Nail Zero Trust. Zero Trust is the path to the strongest, most effective security, and getting back to the core concepts is important. While Zero Trust is a different journey for every organization, it’s a natural evolution of cybersecurity and defense in depth in particular. No matter what’s driving organizations toward Zero Trust—policy considerations or the growing patchwork of data protection and privacy regulations—Zero Trust meaningfully improves security outcomes through an iterative process. When companies get this right, they can quickly identify and investigate threats and take action to contain or disrupt unwanted activity.

What are you most proud of in your career?

I’m proud to have worked—and still be working with—such talented, capable, and intelligent security professionals who care deeply about security and are passionate about making the world a safer place. Being among the world’s top security experts really makes me grateful and humble for all the amazing opportunities I’ve had to work alongside them, working together to solve problems and being part of creating a legacy to make security better.

 
If you have feedback about this post, submit comments in the Comments section below. If you have questions about this post, contact AWS Support.

Want more AWS Security news? Follow us on Twitter.

Chris Betz

Chris Betz

Chris is CISO at AWS. He oversees security teams and leads the development and implementation of security policies, with the aim of managing risk and aligning the company’s security posture with business objectives. Chris joined Amazon in August 2023, after holding CISO and security leadership roles at leading companies. He lives in Northern Virginia with his family.

Lisa Maher

Lisa Maher

Lisa Maher joined AWS in February 2022 and leads AWS Security Thought Leadership PR. Before joining AWS, she led crisis communications for clients experiencing data security incidents at two global PR firms. Lisa, a former journalist, is a graduate of Texas A&M School of Law, where she specialized in Cybersecurity Law & Policy, Risk Management & Compliance.

When Maximum Effort Doesn’t Equate to Maximum Results

Post Syndicated from Rapid7 original https://blog.rapid7.com/2023/11/21/when-maximum-effort-doesnt-equate-to-maximum-results/

When Maximum Effort Doesn't Equate to Maximum Results

It’s no secret that security teams are feeling beleaguered as a result of the barrage of data, events, and alerts generated by their security tools, to say nothing of the increased budget scrutiny and constrained staff resources that continue to plague cybersecurity practitioners.

The trick is finding the right balance between how much internal teams have to accomplish themselves versus how much they can cede to managed security service providers (MSSPs).

Historically, success in security operations (SecOps) was measured by how quickly teams could react to incoming threats; but the sheer number of alerts that require humans-in-the-loop to determine the accuracy and severity of security events make it nearly impossible for teams to keep up. Additionally, the number of tools deployed in a given organization today – to say nothing of the complexity required to make those tools work in concert – means reacting alone won’t get the job done anyway.

Unfortunately, many MSSPs don’t do enough to relieve customers of noisy alerts without expensive consulting agreements, which puts the burden to evaluate and remediate incidents back on already strapped in-house teams.

Traditional approaches have the added disadvantages of being too siloed, too slow, too antiquated for cloud environments, and too convoluted to demonstrate their value. Analysts at a leading research firm predict that within the next 12-18 months, 33% of organizations that currently have internal security functions will attempt and fail to build an effective internal SecOps because of resource constraints such as lack of budget, expertise, and staffing. Analysts further expect that within the next 12-18 months, 90% of internal SecOps will outsource at least 50% of their operational workloads – which makes choosing an MSSP you trust of paramount importance.

MSSPs enable organizations to maximize resilience while minimizing complexity and optimizing staff resources. The best solutions in the market will drive greater efficiency and consolidation by unifying vulnerability management and managed detection and response (MDR) into a single, cohesive security service built by practitioners for practitioners. They will offer 24x7x365 services that “follow the sun” (meaning no one service center is responsible for 100% of support calls; the work is distributed in certified centers of excellence around the world) so that top-notch support is readily available where and when you need it. Complete coverage and end-to-end detection and response services means you can feel confident that your teams are always ready for what comes next.

But it’s important to choose an MSSP that eschews a one-size-fits-all approach. Rather, look for a partner that is dynamic and flexible enough to meet the particular risk profile and business priorities of your organization, one adaptable enough to conform to changes in evolving threats and attack vectors.

Partnering with the right MSSP also allows you to optimize your SecOps for today’s distributed environments, built for the speed and scale of the cloud. Operating in the cloud means you can integrate hundreds of services with the thousands of devices connecting to them seamlessly and in real time; it also means you must protect and secure a sprawling surface with a multitude of potential entry points that threat actors can exploit.

To meet the challenge, choose an MSSP that offers complete coverage from a single, end-to-end solution so that you’re not left responding to an overabundance of events, alerts, and false positives or trying to protect an attack surface too big to contain.

Look for providers that deliver unlimited data, unlimited incident response, and unlimited intelligence so that when a forensic analysis is performed, their detailed remediation and mitigation recommendations make sure you can improve your resilience against future threats. And in the unfortunate event that a breach becomes a full-scope incident-response engagement, you want a partner that will work with you round-the-clock on the forensic investigation and deliver answers that will remove attackers from your environment as quickly as possible – without charging additional consulting fees.

Partnering with a proven MSSP will also boost your visibility across all services and devices to anticipate the most imminent risks, prevent attacks earlier, and respond to events faster. Additionally, an engagement that includes threat exposure manageability at scale through unified endpoint-to-cloud coverage can identify and respond to threats anywhere while breaking down functional and geographic silos that stall efficiency and reduce collaboration.

Critical functions like threat hunting and patch management can be automated across many tools and processes to reduce reliance on manual work. Machine learning and artificial intelligence models can be paired with internal threat telemetry data and chatbots to triage events, increase staff productivity, or produce threat reports that support more targeted and prioritized threat management across the enterprise.

Best of all, the successful use of AI and automation can help reduce the number of tools operating in your environment, which in turn decreases the complexity and cost of security operations.

It’s time to gain the edge over attackers and keep up with the fluid, ever-expanding threat landscape by eliminating threats wherever they emerge and proactively preventing breaches earlier in the kill chain. Partnering with a trusted MSSP will enable you to manage your threat exposure precisely and comprehensively, improve your signal-to-noise ratio, demonstrate tangible ROI from your security investments, and continually advance your security posture.

Learn more about the best criteria to use when reviewing the capabilities of potential MSSP partners.

[$] Trust in and maintenance of filesystems

Post Syndicated from corbet original https://lwn.net/Articles/951846/

The Linux kernel supports a wide variety of filesystems, many of which are
no longer in heavy use — or, perhaps, any use at all. The kernel code
implementing the less-popular filesystems tends to be relatively unpopular
as well, receiving little in the way of maintenance. Keeping old
filesystems alive does place a burden on kernel developers, though, so it
is not surprising that there is pressure to remove the least popular ones.
At the 2023 Kernel Maintainers Summit, the developers talked about these
filesystems and what can be done about them.

Ekstrand: NVK reaches Vulkan 1.0 conformance

Post Syndicated from corbet original https://lwn.net/Articles/952089/

Faith Ekstrand has announced
that the NVK Vulkan driver for NVIDIA “Turing” GPUs has been certified as
being fully compliant with the Vulkan 1.0 API.

Practically, it means that we can pass the entire Vulkan
conformance test suite. From the Khronos perspective, it means that
NVK now meets the bar required to claim to support the Vulkan API
officially. (There are some legal implications to this which matter
to the Mesa project, but most users don’t care about them.) From
the perspective of users, it means the driver should pretty much
work on Turing and later GPUs.

Security updates for Tuesday

Post Syndicated from corbet original https://lwn.net/Articles/952088/

Security updates have been issued by Debian (activemq, strongswan, and wordpress), Mageia (u-boot), SUSE (avahi, frr, libreoffice, nghttp2, openssl, openssl1, postgresql, postgresql15, postgresql16, python-Twisted, ucode-intel, and xen), and Ubuntu (avahi, hibagent, nodejs, strongswan, tang, and webkit2gtk).

Workers AI Update: Hello Mistral 7B

Post Syndicated from Jesse Kipp original http://blog.cloudflare.com/workers-ai-update-hello-mistral-7b/


Workers AI Update: Hello Mistral 7B

Today we’re excited to announce that we’ve added the Mistral-7B-v0.1-instruct to Workers AI. Mistral 7B is a 7.3 billion parameter language model with a number of unique advantages. With some help from the founders of Mistral AI, we’ll look at some of the highlights of the Mistral 7B model, and use the opportunity to dive deeper into “attention” and its variations such as multi-query attention and grouped-query attention.

Mistral 7B tl;dr:

Mistral 7B is a 7.3 billion parameter model that puts up impressive numbers on benchmarks. The model:

  • Outperforms Llama 2 13B on all benchmarks
  • Outperforms Llama 1 34B on many benchmarks,
  • Approaches CodeLlama 7B performance on code, while remaining good at English tasks, and
  • The chat fine-tuned version we’ve deployed outperforms Llama 2 13B chat in the benchmarks provided by Mistral.

Here’s an example of using streaming with the REST API:

curl -X POST \
“https://api.cloudflare.com/client/v4/accounts/{account-id}/ai/run/@cf/mistral/mistral-7b-instruct-v0.1” \
-H “Authorization: Bearer {api-token}” \
-H “Content-Type:application/json” \
-d '{ “prompt”: “What is grouped query attention”, “stream”: true }'

API Response: { response: “Grouped query attention is a technique used in natural language processing  (NLP) and machine learning to improve the performance of models…” }

And here’s an example using a Worker script:

import { Ai } from ‘@cloudflare/ai’;
export default {
    async fetch(request, env) {
        const ai = new Ai(env.AI);
        const stream = await ai.run(‘@cf/mistral/mistral-7b-instruct-v0.1’, {
            prompt: ‘What is grouped query attention’,
            stream: true
        });
        return Response.json(stream, { headers: { “content-type”: “text/event-stream” } });
    }
}

Mistral takes advantage of grouped-query attention for faster inference. This recently-developed technique improves the speed of inference without compromising output quality. For 7 billion parameter models, we can generate close to 4x as many tokens per second with Mistral as we can with Llama, thanks to Grouped-Query attention.

You don’t need any information beyond this to start using Mistral-7B, you can test it out today ai.cloudflare.com. To learn more about attention and Grouped-Query attention, read on!

So what is “attention” anyway?

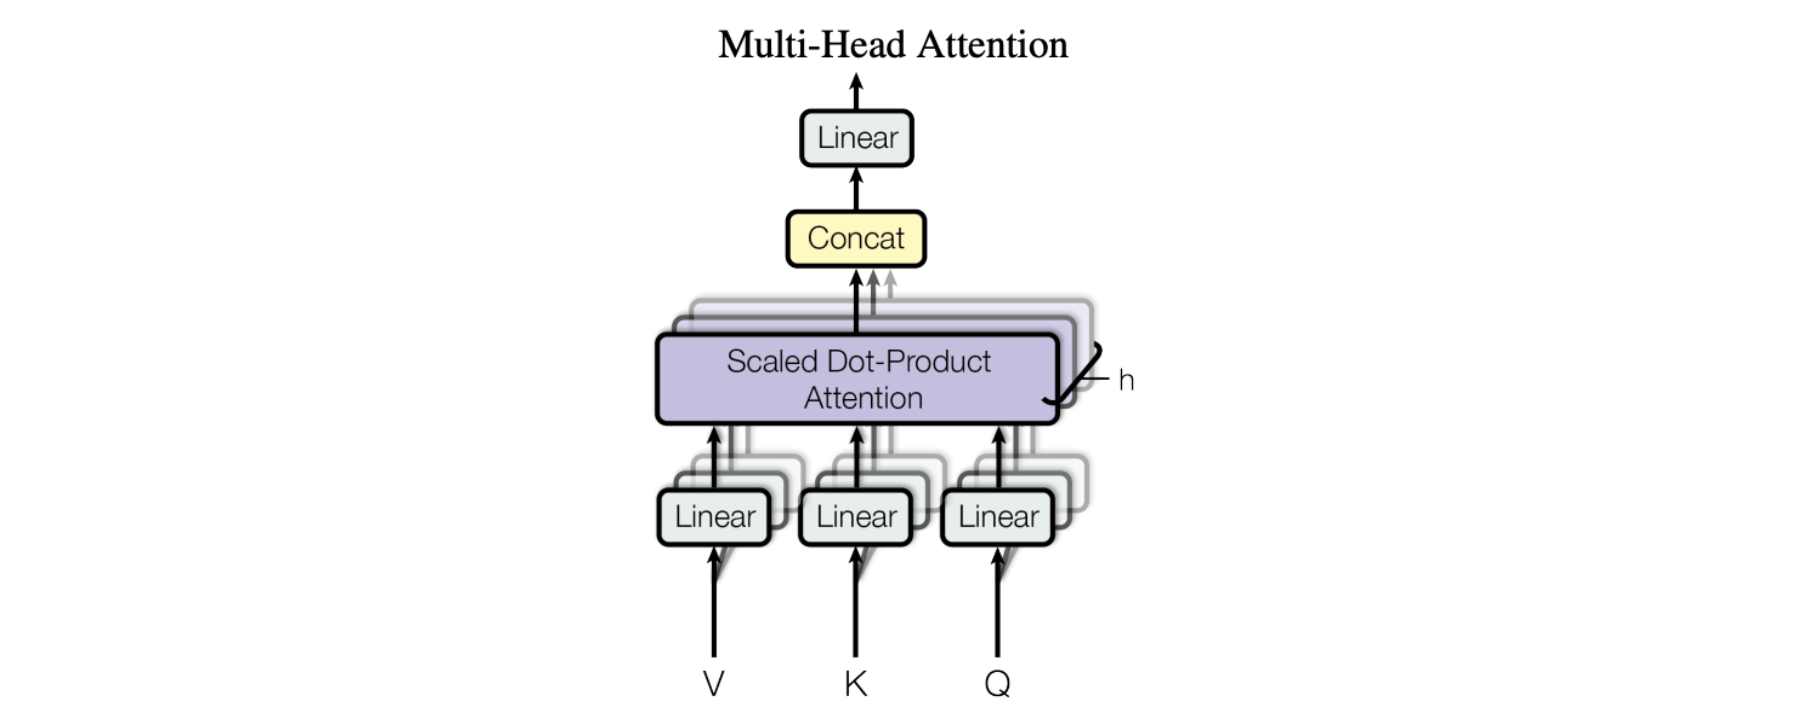
The basic mechanism of attention, specifically “Scaled Dot-Product Attention” as introduced in the landmark paper Attention Is All You Need, is fairly simple:

We call our particular attention “Scale Dot-Product Attention”. The input consists of query and keys of dimension d_k, and values of dimension d_v. We compute the dot products of the query with all the keys, divide each by sqrt(d_k) and apply a softmax function to obtain the weights on the values.

More concretely, this looks like this:

source

In simpler terms, this allows models to focus on important parts of the input. Imagine you are reading a sentence and trying to understand it. Scaled dot product attention enables you to pay more attention to certain words based on their relevance. It works by calculating the similarity between each word (K) in the sentence and a query (Q). Then, it scales the similarity scores by dividing them by the square root of the dimension of the query. This scaling helps to avoid very small or very large values. Finally, using these scaled similarity scores, we can determine how much attention or importance each word should receive. This attention mechanism helps models identify crucial information (V) and improve their understanding and translation capabilities.

Easy, right? To get from this simple mechanism to an AI that can write a “Seinfeld episode in which Jerry learns the bubble sort algorithm,” we’ll need to make it more complex. In fact, everything we’ve just covered doesn’t even have any learned parameters — constant values learned during model training that customize the output of the attention block!
Attention blocks in the style of Attention is All You Need add mainly three types of complexity:

Learned parameters

Learned parameters refer to values or weights that are adjusted during the training process of a model to improve its performance. These parameters are used to control the flow of information or attention within the model, allowing it to focus on the most relevant parts of the input data. In simpler terms, learned parameters are like adjustable knobs on a machine that can be turned to optimize its operation.

Vertical stacking – layered attention blocks

Vertical layered stacking is a way to stack multiple attention mechanisms on top of each other, with each layer building on the output of the previous layer. This allows the model to focus on different parts of the input data at different levels of abstraction, which can lead to better performance on certain tasks.

Horizontal stacking – aka Multi-Head Attention

The figure from the paper displays the full multi-head attention module. Multiple attention operations are carried out in parallel, with the Q-K-V input for each generated by a unique linear projection of the same input data (defined by a unique set of learned parameters). These parallel attention blocks are referred to as “attention heads”. The weighted-sum outputs of all attention heads are concatenated into a single vector and passed through another parameterized linear transformation to get the final output.

source

This mechanism allows a model to focus on different parts of the input data concurrently. Imagine you are trying to understand a complex piece of information, like a sentence or a paragraph. In order to understand it, you need to pay attention to different parts of it at the same time. For example, you might need to pay attention to the subject of the sentence, the verb, and the object, all simultaneously, in order to understand the meaning of the sentence. Multi-headed attention works similarly. It allows a model to pay attention to different parts of the input data at the same time, by using multiple “heads” of attention. Each head of attention focuses on a different aspect of the input data, and the outputs of all the heads are combined to produce the final output of the model.

Styles of attention

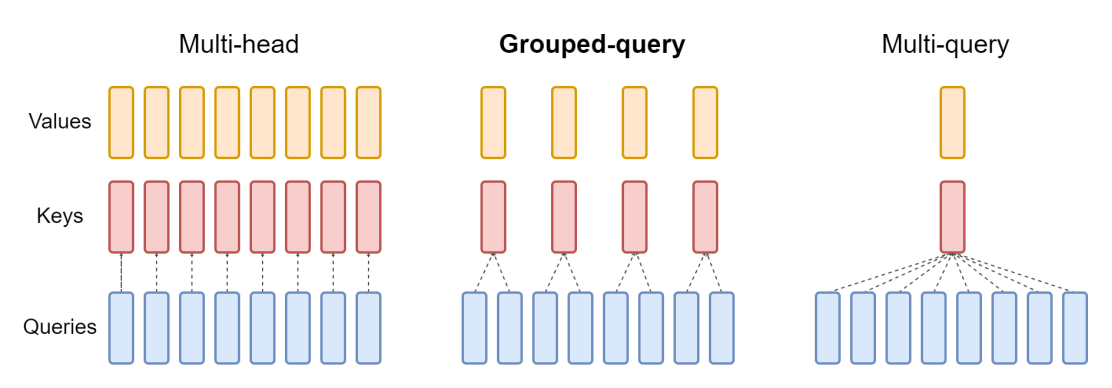
There are three common arrangements of attention blocks used by large language models developed in recent years: multi-head attention, grouped-query attention and multi-query attention. They differ in the number of K and V vectors relative to the number of query vectors. Multi-head attention uses the same number of K and V vectors as Q vectors, denoted by “N” in the table below. Multi-query attention uses only a single K and V vector. Grouped-query attention, the type used in the Mistral 7B model, divides the Q vectors evenly into groups containing “G” vectors each, then uses a single K and V vector for each group for a total of N divided by G sets of K and V vectors. This summarizes the differences, and we’ll dive into the implications of these below.


Number of Key/Value Blocks

Quality

Memory Usage

Multi-head attention (MHA)

N

Best

Most

Grouped-query attention (GQA)

N / G

Better

Less

Multi-query attention (MQA)

1

Good

Least

Summary of attention styles

And this diagram helps illustrate the difference between the three styles:

source

Multi-Query Attention

Multi-query attention was described in 2019 in the paper from Google: Fast Transformer Decoding: One Write-Head is All You Need. The idea is that instead of creating separate K and V entries for every Q vector in the attention mechanism, as in multi-head attention above, only a single K and V vector is used for the entire set of Q vectors. Thus the name, multiple queries combined into a single attention mechanism. In the paper, this was benchmarked on a translation task and showed performance equal to multi-head attention on the benchmark task.

Originally the idea was to reduce the total size of memory that is accessed when performing inference for the model. Since then, as generalized models have emerged and grown in number of parameters, the GPU memory needed is often the bottleneck which is the strength of multi-query attention, as it requires the least accelerator memory of the three types of attention. However, as models grew in size and generality, performance of multi-query attention fell relative to multi-head attention.

Grouped-Query Attention

The newest of the bunch — and the one used by Mistral — is grouped-query attention, as described in the paper GQA: Training Generalized Multi-Query Transformer Models from Multi-Head Checkpoints that was published on arxiv.org in May 2023. Grouped-query attention combines the best of both worlds: the quality of multi-headed attention with the speed and low memory usage of multi-query attention. Instead of either a single set of K and V vectors or one set for every Q vector, a fixed ratio of 1 set of K and V vectors for every Q vector is used, reducing memory usage but retaining high performance on many tasks.

Often choosing a model for a production task is not just about picking the best model available because we must consider tradeoffs between performance, memory usage, batch size, and available hardware (or cloud costs). Understanding these three styles of attention can help guide those decisions and understand when we might choose a particular model given our circumstances.

Enter Mistral — try it today

Being one of the first large language models to leverage grouped-query attention and combining it with sliding window attention, Mistral seems to have hit the goldilocks zone — it’s low latency, high-throughput, and it performs really well on benchmarks even when compared to bigger models (13B). All this to say is that it packs a punch for its size, and we couldn’t be more excited to make it available to all developers today, via Workers AI.

Head over to our developer docs to get started, and if you need help, want to give feedback, or want to share what you’re building just pop into our Developer Discord!

The Workers AI team is also expanding and hiring; check our jobs page for open roles if you’re passionate about AI engineering and want to help us build and evolve our global, serverless GPU-powered inference platform.

Email Security Flaw Found in the Wild

Post Syndicated from Bruce Schneier original https://www.schneier.com/blog/archives/2023/11/email-security-flaw-found-in-the-wild.html

Google’s Threat Analysis Group announced a zero-day against the Zimbra Collaboration email server that has been used against governments around the world.

TAG has observed four different groups exploiting the same bug to steal email data, user credentials, and authentication tokens. Most of this activity occurred after the initial fix became public on Github. To ensure protection against these types of exploits, TAG urges users and organizations to keep software fully up-to-date and apply security updates as soon as they become available.

The vulnerability was discovered in June. It has been patched.

Evolving our online courses to help more people be computing educators

Post Syndicated from Sway Grantham original https://www.raspberrypi.org/blog/free-online-courses-computing-education-updates-2023/

Since launching our free online courses about computing on the edX platform back in August, we’ve been training course facilitators and analysing the needs of educators around the world. We want every course participant to have a great experience learning with us — read on to find out what we’re doing right now and into 2024 to ensure this.

Workshop attendees at a table.

Online courses for all adults who support young people

Educators of all kinds are key for supporting children and young people to engage with computing technology and develop digital skills. You might be a professional teacher, or a parent, volunteer, youth worker, librarian… there are so many roles in which people share knowledge with young learners.

Young people and an adult mentor at a computer at Coolest Projects Ireland 2023.

That’s why our online courses are designed to support any kind of educator to:

  • Understand the full breadth of topics within computing
  • Discover how to introduce computing to young people in clear and exciting ways that are grounded in the latest research

We are constantly improving our online courses based on your feedback, the latest education research, and the insights our team members gain through supporting you on your course learning journeys. Three principles guide these improvements: accessibility, scalability, and sustainability. 

Making our courses more relevant and accessible

Our online courses are used by people who live around the world and bring various knowledge and experiences. Some participants are classroom teachers, others have computing experience from their job and want to volunteer at a kids’ coding club, and some may be parents who want to support their children. It’s important to us that our courses are relevant and accessible to all kinds of adult learners. 

A parent and child work together at a Raspberry Pi computer.

We’re currently working to: 

  • Simplify the English in the courses for participants who speak it as a second language
  • Adapt the course activities for specific settings where participants help young people learn so that e.g. teachers see how the activities work in the classroom, and volunteers who run coding clubs see how they work in club sessions
  • Ensure our course facilitators have experience in a range of different settings including coding clubs, and in a variety of different contexts around the world

Making our courses useful for more groups of people

When we think about the scalability of our courses, we think about how to best support as many educators around the world as possible. If we can make the jobs of all educators easier, whatever their setting is like, then we are making the right choices.

An educator helps two young people at a computer.

We’re currently working to: 

  • Talk with the global network of educators we’re a part of to better understand what works for them so we can reflect that in the courses
  • Include a wider range of examples for settings beyond the classroom in the courses
  • Adapt our courses so they are relevant to participants with various needs while sustaining the high quality of the overall learning experience

Making the learning from our courses sustainable

The educators who take our courses work to achieve amazing things, and this means they are often busy. That they take the time to complete one of our courses to learn new things is a commitment we want to make sure is rewarded. The learning you get from participating in our online courses should continue to benefit you far beyond the time you spend completing it. This is what we mean by sustainability.

Kenyan educators work on a physical computing project.

We’re currently working to: 

  • Lay out clear learning pathways so you can build on the knowledge you gain in one course in the next course
  • Offer course resources that are easy to access after you’ve completed the course
  • Explore ways to build communities around our courses where you can share successes and learning outcomes with your fellow participants

Learn with us, and help us design better courses for you

Our work to improve the accessibility, scalability, and sustainability of our courses will continue into 2024, and these three principles will likely be part of our online training strategy for the following year too. 

If you’d like to support young people in your life to learn about computing and digital technologies, take one of our free courses now and learn something new. We have twenty courses available right now and they are totally free.

We are also looking for adult testers for new course content. So if you’re any kind of educator and would like to test upcoming online course content and share your feedback and experiences, please send us a message with the subject ‘Educator training’. 

The post Evolving our online courses to help more people be computing educators appeared first on Raspberry Pi Foundation.

Incremental Processing using Netflix Maestro and Apache Iceberg

Post Syndicated from Netflix Technology Blog original https://netflixtechblog.com/incremental-processing-using-netflix-maestro-and-apache-iceberg-b8ba072ddeeb

by Jun He, Yingyi Zhang, and Pawan Dixit

Incremental processing is an approach to process new or changed data in workflows. The key advantage is that it only incrementally processes data that are newly added or updated to a dataset, instead of re-processing the complete dataset. This not only reduces the cost of compute resources but also reduces the execution time in a significant manner. When workflow execution has a shorter duration, chances of failure and manual intervention reduce. It also improves the engineering productivity by simplifying the existing pipelines and unlocking the new patterns.

In this blog post, we talk about the landscape and the challenges in workflows at Netflix. We will show how we are building a clean and efficient incremental processing solution (IPS) by using Netflix Maestro and Apache Iceberg. IPS provides the incremental processing support with data accuracy, data freshness, and backfill for users and addresses many of the challenges in workflows. IPS enables users to continue to use the data processing patterns with minimal changes.

Introduction

Netflix relies on data to power its business in all phases. Whether in analyzing A/B tests, optimizing studio production, training algorithms, investing in content acquisition, detecting security breaches, or optimizing payments, well structured and accurate data is foundational. As our business scales globally, the demand for data is growing and the needs for scalable low latency incremental processing begin to emerge. There are three common issues that the dataset owners usually face.

  • Data Freshness: Large datasets from Iceberg tables needed to be processed quickly and accurately to generate insights to enable faster product decisions. The hourly processing semantics along with valid–through-timestamp watermark or data signals provided by the Data Platform toolset today satisfies many use cases, but is not the best for low-latency batch processing. Before IPS, the Data Platform did not have a solution for tracking the state and progression of data sets as a single easy to use offering. This has led to a few internal solutions such as Psyberg. These internal libraries process data by capturing the changed partitions, which works only on specific use cases. Additionally, the libraries have tight coupling to the user business logic, which often incurs higher migration costs, maintenance costs, and requires heavy coordination with the Data Platform team.
  • Data Accuracy: Late arriving data causes datasets processed in the past to become incomplete and as a result inaccurate. To compensate for that, ETL workflows often use a lookback window, based on which they reprocess the data in that certain time window. For example, a job would reprocess aggregates for the past 3 days because it assumes that there would be late arriving data, but data prior to 3 days isn’t worth the cost of reprocessing.
  • Backfill: Backfilling datasets is a common operation in big data processing. This requires repopulating data for a historical time period which is before the scheduled processing. The need for backfilling could be due to a variety of factors, e.g. (1) upstream data sets got repopulated due to changes in business logic of its data pipeline, (2) business logic was changed in a data pipeline, (3) anew metric was created that needs to be populated for historical time ranges, (4) historical data was found missing, etc.

These challenges are currently addressed in suboptimal and less cost efficient ways by individual local teams to fulfill the needs, such as

  • Lookback: This is a generic and simple approach that data engineers use to solve the data accuracy problem. Users configure the workflow to read the data in a window (e.g. past 3 hours or 10 days). The window is set based on users’ domain knowledge so that users have a high confidence that the late arriving data will be included or will not matter (i.e. data arrives too late to be useful). It ensures the correctness with a high cost in terms of time and compute resources.
  • Foreach pattern: Users build backfill workflows using Maestro foreach support. It works well to backfill data produced by a single workflow. If the pipeline has multiple stages or many downstream workflows, users have to manually create backfill workflows for each of them and that requires significant manual work.

The incremental processing solution (IPS) described here has been designed to address the above problems. The design goal is to provide a clean and easy to adopt solution for the Incremental processing to ensure data freshness, data accuracy, and to provide easy backfill support.

  • Data Freshness: provide the support for scheduling workflows in a micro batch fashion (e.g. 15 min interval) with state tracking functionality
  • Data Accuracy: provide the support to process all late arriving data to achieve data accuracy needed by the business with significantly improved performance in terms of multifold time and cost efficiency
  • Backfill: provide managed backfill support to build, monitor, and validate the backfill, including automatically propagating changes from upstream to downstream workflows, to greatly improve engineering productivity (i.e. a few days or weeks of engineering work to build backfill workflows vs one click for managed backfill)

Approach Overview

General Concept

Incremental processing is an approach to process data in batch — but only on new or changed data. To support incremental processing, we need an approach for not only capturing incremental data changes but also tracking their states (i.e. whether a change is processed by a workflow or not). It must be aware of the change and can capture the changes from the source table(s) and then keep tracking those changes. Here, changes mean more than just new data itself. For example, a row in an aggregation target table needs all the rows from the source table associated with the aggregation row. Also, if there are multiple source tables, usually the union of the changed data ranges from all input tables gives the full change data set. Thus, change information captured must include all related data including those unchanged rows in the source table as well. Due to previously mentioned complexities, change tracking cannot be simply achieved by using a single watermark. IPS has to track those captured changes in finer granularity.

The changes from the source tables might affect the transformed result in the target table in various ways.

  • If one row in the target table is derived from one row in the source table, newly captured data change will be the complete input dataset for the workflow pipeline.
  • If one row in the target table is derived from multiple rows in the source table, capturing new data will only tell us the rows have to be re-processed. But the dataset needed for ETL is beyond the change data itself. For example, an aggregation based on account id requires all rows from the source table about an account id. The change dataset will tell us which account ids are changed and then the user business logic needs to load all data associated with those account ids found in the change data.
  • If one row in the target table is derived based on the data beyond the changed data set, e.g. joining source table with other tables, newly captured data is still useful and can indicate a range of data to be affected. Then the workflow will re-process the data based on the range. For example, assuming we have a table that keeps the accumulated view time for a given account partitioned by the day. If the view time 3-days ago is updated right now due to late arriving data, then the view time for the following two days has to be re-calculated for this account. In this case, the captured late arriving data will tell us the start of the re-calculation, which is much more accurate than recomputing everything for the past X days by guesstimate, where X is a cutoff lookback window decided by business domain knowledge.

Once the change information (data or range) is captured, a workflow has to write the data to the target table in a slightly more complicated way because the simple INSERT OVERWRITE mechanism won’t work well. There are two alternatives:

  • Merge pattern: In some compute frameworks, e.g. Spark 3, it supports MERGE INTO to allow new data to be merged into the existing data set. That solves the write problem for incremental processing. Note that the workflow/step can be safely restarted without worrying about duplicate data being inserted when using MERGE INTO.
  • Append pattern: Users can also use append only write (e.g. INSERT INTO) to add the new data to the existing data set. Once the processing is completed, the append data is committed to the table. If users want to re-run or re-build the data set, they will run a backfill workflow to completely overwrite the target data set (e.g. INSERT OVERWRITE).

Additionally, the IPS will naturally support the backfill in many cases. Downstream workflows (if there is no business logic change) will be triggered by the data change due to backfill. This enables auto propagation of backfill data in multi-stage pipelines. Note that the backfill support is skipped in this blog. We will talk about IPS backfill support in another following blog post.

Netflix Maestro

Maestro is the Netflix data workflow orchestration platform built to meet the current and future needs of Netflix. It is a general-purpose workflow orchestrator that provides a fully managed workflow-as-a-service (WAAS) to the data platform users at Netflix. It serves thousands of users, including data scientists, data engineers, machine learning engineers, software engineers, content producers, and business analysts, in various use cases. Maestro is highly scalable and extensible to support existing and new use cases and offers enhanced usability to end users.

Since the last blog on Maestro, we have migrated all the workflows to it on behalf of users with minimal interruption. Maestro has been fully deployed in production with 100% workload running on it.

IPS is built upon Maestro as an extension by adding two building blocks, i.e. a new trigger mechanism and step job type, to enable incremental processing for all workflows. It is seamlessly integrated into the whole Maestro ecosystem with minimal onboarding cost.

Apache Iceberg

Iceberg is a high-performance format for huge analytic tables. Iceberg brings the reliability and simplicity of SQL tables to big data, while making it possible for engines like Spark, Trino, Flink, Presto, Hive and Impala to safely work with the same tables, at the same time. It supports expressive SQL, full schema evolution, hidden partitioning, data compaction, and time travel & rollback. In the IPS, we leverage the rich features provided by Apache Iceberg to develop a lightweight approach to capture the table changes.

Incremental Change Capture Design

Using Netflix Maestro and Apache Iceberg, we created a novel solution for incremental processing, which provides the incremental change (data and range) capture in a super lightweight way without copying any data. During our exploration, we see a huge opportunity to improve cost efficiency and engineering productivity using incremental processing.

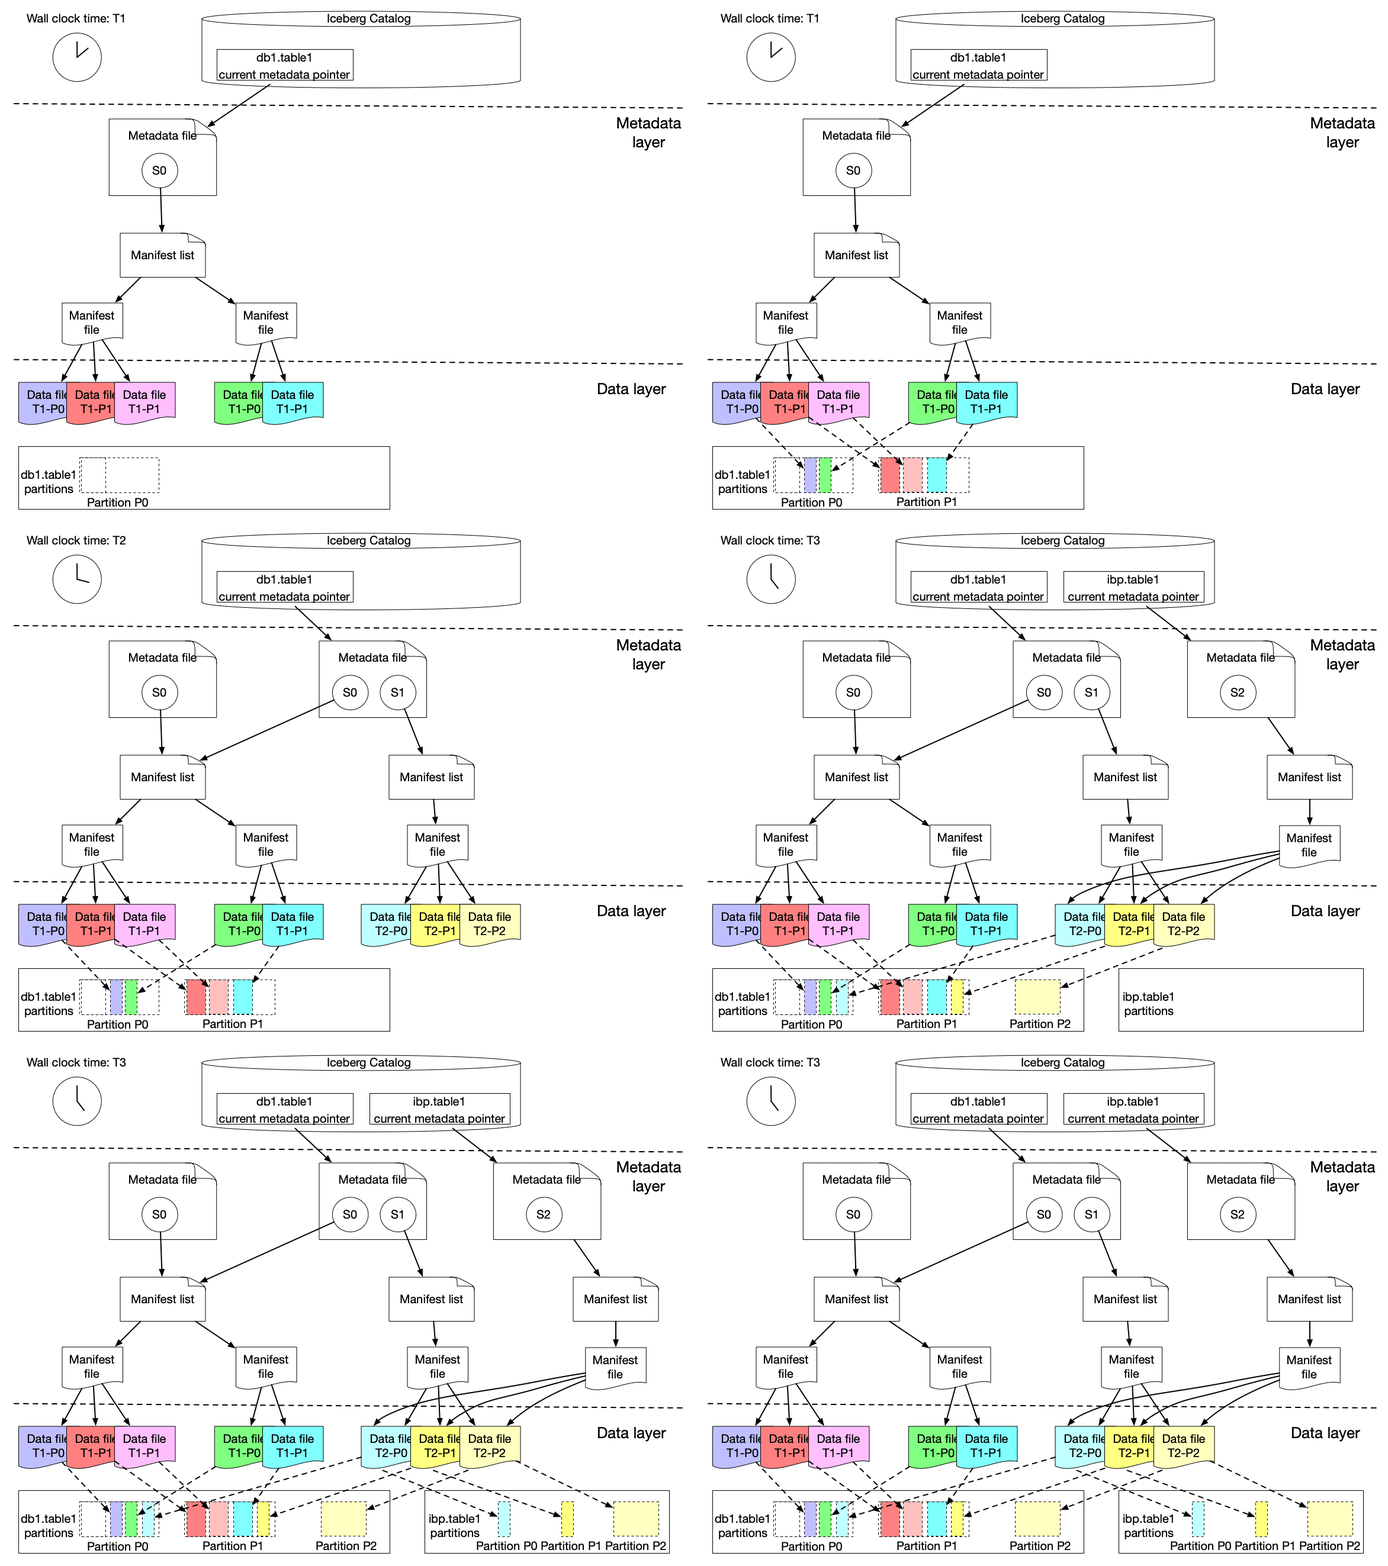
Here is our solution to achieve incremental change capture built upon Apache Iceberg features. As we know, an iceberg table contains a list of snapshots with a set of metadata data. Snapshots include references to the actual immutable data files. A snapshot can contain data files from different partitions.

Design to achieve incremental change capture built upon Apache Iceberg features

The graph above shows that s0 contains data for Partition P0 and P1 at T1. Then at T2, a new snapshot s1 is committed to the table with a list of new data files, which includes late arriving data for partition P0 and P1 and data for P2.

We implemented a lightweight approach to create an iceberg table (called ICDC table), which has its own snapshot but only includes the new data file references from the original table without copying the data files. It is highly efficient with a low cost. Then workflow pipelines can just load the ICDC table to process only the change data from partition P0, P1, P2 without reprocessing the unchanged data in P0 and P1. Meanwhile, the change range is also captured for the specified data field as the Iceberg table metadata contains the upper and lower bound information of each data field for each data file. Moreover, IPS will track the changes in data file granularity for each workflow.

This lightweight approach is seamlessly integrated with Maestro to allow all (thousands) scheduler users to use this new building block (i.e. incremental processing) in their tens of thousands of workflows. Each workflow using IPS will be injected with a table parameter, which is the table name of the lightweight ICDC table. The ICDC table contains only the change data. Additionally, if the workflow needs the change range, a list of parameters will be injected to the user workflow to include the change range information. The incremental processing can be enabled by a new step job type (ICDC) and/or a new incremental trigger mechanism. Users can use them together with all existing Maestro features, e.g. foreach patterns, step dependencies based on valid–through-timestamp watermark, write-audit-publish templatized pattern, etc.

Main Advantages

With this design, user workflows can adopt incremental processing with very low efforts. The user business logic is also decoupled from the IPS implementation. Multi-stage pipelines can also mix the incremental processing workflows with existing normal workflows. We also found that user workflows can be simplified after using IPS by removing additional steps to handle the complexity of the lookback window or calling some internal libraries.

Adding incremental processing features into Netflix Maestro as new features/building blocks for users will enable users to build their workflows in a much more efficient way and bridge the gaps to solve many challenging problems (e.g. dealing with late arriving data) in a much simpler way.

Emerging Incremental Processing Patterns

While onboarding user pipelines to IPS, we have discovered a few incremental processing patterns:

Incrementally process the captured incremental change data and directly append them to the target table

Incrementally process the captured incremental change data and directly append them to the target table

This is the straightforward incremental processing use case, where the change data carries all the information needed for the data processing. Upstream changes (usually from a single source table) are propagated to the downstream (usually another target table) and the workflow pipeline only needs to process the change data (might join with other dimension tables) and then merge into (usually append) to the target table. This pattern will replace lookback window patterns to take care of late arriving data. Instead of overwriting past X days of data completely by using a lookback window pattern, user workflows just need to MERGE the change data (including late arriving data) into the target table by processing the ICDC table.

Use captured incremental change data as the row level filter list to remove unnecessary transformation

Use captured incremental change data as the row level filter list to remove unnecessary transformation

ETL jobs usually need to aggregate data based on certain group-by keys. Change data will disclose all the group-by keys that require a re-aggregation due to the new landing data from the source table(s). Then ETL jobs can join the original source table with the ICDC table on those group-by keys by using ICDC as a filter to speed up the processing to enable calculations of a much smaller set of data. There is no change to business transform logic and no re-design of ETL workflow. ETL pipelines keep all the benefits of batch workflows.

Use the captured range parameters in the business logic

Use the captured range parameters in the business logic

This pattern is usually used in complicated use cases, such as joining multiple tables and doing complex processings. In this case, the change data do not give the full picture of the input needed by the ETL workflow. Instead, the change data indicates a range of changed data sets for a specific set of fields (might be partition keys) in a given input table or usually multiple input tables. Then, the union of the change ranges from all input tables gives the full change data set needed by the workflow. Additionally, the whole range of data usually has to be overwritten because the transformation is not stateless and depends on the outcome result from the previous ranges. Another example is that the aggregated record in the target table or window function in the query has to be updated based on the whole data set in the partition (e.g. calculating a medium across the whole partition). Basically, the range derived from the change data indicates the dataset to be re-processed.

Use cases

Data workflows at Netflix usually have to deal with late arriving data which is commonly solved by using lookback window pattern due to its simplicity and ease of implementation. In the lookback pattern, the ETL pipeline will always consume the past X number of partition data from the source table and then overwrite the target table in every run. Here, X is a number decided by the pipeline owners based on their domain expertise. The drawback is the cost of computation and execution time. It usually costs almost X times more than the pipeline without considering late arriving data. Given the fact that the late arriving data is sparse, the majority of the processing is done on the data that have been already processed, which is unnecessary. Also, note that this approach is based on domain knowledge and sometimes is subject to changes of the business environment or the domain expertise of data engineers. In certain cases, it is challenging to come up with a good constant number.

Below, we will use a two-stage data pipeline to illustrate how to rebuild it using IPS to improve the cost efficiency. We will observe a significant cost reduction (> 80%) with little changes in the business logic. In this use case, we will set the lookback window size X to be 14 days, which varies in different real pipelines.

Original Data Pipeline with Lookback Window

Original data pipeline with lookback window
  • playback_table: an iceberg table holding playback events from user devices ingested by streaming pipelines with late arriving data, which is sparse, only about few percents of the data is late arriving.
  • playback_daily_workflow: a daily scheduled workflow to process the past X days playback_table data and write the transformed data to the target table for the past X days
  • playback_daily_table: the target table of the playback_daily_workflow and get overwritten every day for the past X days
  • playback_daily_agg_workflow: a daily scheduled workflow to process the past X days’ playback_daily_table data and write the aggregated data to the target table for the past X days
  • playback_daily_agg_table: the target table of the playback_daily_agg_workflow and get overwritten every day for the past 14 days.

We ran this pipeline in a sample dataset using the real business logic and here is the average execution result of sample runs

  • The first stage workflow takes about 7 hours to process playback_table data
  • The second stage workflow takes about 3.5 hours to process playback_daily_table data

New Data Pipeline with Incremental Processing

Using IPS, we rewrite the pipeline to avoid re-processing data as much as possible. The new pipeline is shown below.

New data pipeline with incremental processing

Stage 1:

  • ips_playback_daily_workflow: it is the updated version of playback_daily_workflow.
  • The workflow spark sql job then reads an incremental change data capture (ICDC) iceberg table (i.e. playback_icdc_table), which only includes the new data added into the playback_table. It includes the late arriving data but does not include any unchanged data from playback_table.
  • The business logic will replace INSERT OVERWRITE by MERGE INTO SQL query and then the new data will be merged into the playback_daily_table.

Stage 2:

  • IPS captures the changed data of playback_daily_table and also keeps the change data in an ICDC source table (playback_daily_icdc_table). So we don’t need to hard code the lookback window in the business logic. If there are only Y days having changed data in playback_daily_table, then it only needs to load data for Y days.
  • In ips_playback_daily_agg_workflow, the business logic will be the same for the current day’s partition. We then need to update business logic to take care of late arriving data by
  • JOIN the playback_daily table with playback_daily_icdc_table on the aggregation group-by keys for the past 2 to X days, excluding the current day (i.e. day 1)
  • Because late arriving data is sparse, JOIN will narrow down the playback_daily_table data set so as to only process a very small portion of it.
  • The business logic will use MERGE INTO SQL query then the change will be propagated to the downstream target table
  • For the current day, the business logic will be the same and consume the data from playback_daily_table and then write the outcome to the target table playback_daily_agg_table using INSERT OVERWRITE because there is no need to join with the ICDC table.

With these small changes, the data pipeline efficiency is greatly improved. In our sample run,

  • The first stage workflow takes just about 30 minutes to process X day change data from playback_table.
  • The second stage workflow takes about 15 minutes to process change data between day 2 to day X from playback_daily_table by joining with playback_daily_cdc_table data and takes another 15 minutes to process the current day (i.e. day 1) playback_daily_table change data.

Here the spark job settings are the same in original and new pipelines. So in total, the new IPS based pipeline overall needs around 10% of resources (measured by the execution time) to finish.

Looking Forward

We will improve IPS to support more complicated cases beyond append-only cases. IPS will be able to keep track of the progress of the table changes and support multiple Iceberg table change types (e.g. append, overwrite, etc.). We will also add managed backfill support into IPS to help users to build, monitor, and validate the backfill.

We are taking Big Data Orchestration to the next level and constantly solving new problems and challenges, please stay tuned. If you are motivated to solve large scale orchestration problems, please join us.

Acknowledgements

Thanks to our Product Manager Ashim Pokharel for driving the strategy and requirements. We’d also like to thank Andy Chu, Kyoko Shimada, Abhinaya Shetty, Bharath Mummadisetty, John Zhuge, Rakesh Veeramacheneni, and other stunning colleagues at Netflix for their suggestions and feedback while developing IPS. We’d also like to thank Prashanth Ramdas, Eva Tse, Charles Smith, and other leaders of Netflix engineering organizations for their constructive feedback and suggestions on the IPS architecture and design.


Incremental Processing using Netflix Maestro and Apache Iceberg was originally published in Netflix TechBlog on Medium, where people are continuing the conversation by highlighting and responding to this story.

Enhance monitoring and debugging for AWS Glue jobs using new job observability metrics

Post Syndicated from Noritaka Sekiyama original https://aws.amazon.com/blogs/big-data/enhance-monitoring-and-debugging-for-aws-glue-jobs-using-new-job-observability-metrics/

For any modern data-driven company, having smooth data integration pipelines is crucial. These pipelines pull data from various sources, transform it, and load it into destination systems for analytics and reporting. When running properly, it provides timely and trustworthy information. However, without vigilance, the varying data volumes, characteristics, and application behavior can cause data pipelines to become inefficient and problematic. Performance can slow down or pipelines can become unreliable. Undetected errors result in bad data and impact downstream analysis. That’s why robust monitoring and troubleshooting for data pipelines is essential across the following four areas:

  • Reliability
  • Performance
  • Throughput
  • Resource utilization

Together, these four aspects of monitoring provide end-to-end visibility and control over a data pipeline and its operations.

Today we are pleased to announce a new class of Amazon CloudWatch metrics reported with your pipelines built on top of AWS Glue for Apache Spark jobs. The new metrics provide aggregate and fine-grained insights into the health and operations of your job runs and the data being processed. In addition to providing insightful dashboards, the metrics provide classification of errors, which helps with root cause analysis of performance bottlenecks and error diagnosis. With this analysis, you can evaluate and apply the recommended fixes and best practices for architecting your jobs and pipelines. As a result, you gain the benefit of higher availability, better performance, and lower cost for your AWS Glue for Apache Spark workload.

This post demonstrates how the new enhanced metrics help you monitor and debug AWS Glue jobs.

Enable the new metrics

The new metrics can be configured through the job parameter enable-observability-metrics.

The new metrics are enabled by default on the AWS Glue Studio console. To configure the metrics on the AWS Glue Studio console, complete the following steps:

  1. On the AWS Glue console, choose ETL jobs in the navigation pane.
  2. Under Your jobs, choose your job.
  3. On the Job details tab, expand Advanced properties.
  4. Under Job observability metrics, select Enable the creation of additional observability CloudWatch metrics when this job runs.

To enable the new metrics in the AWS Glue CreateJob and StartJobRun APIs, set the following parameters in the DefaultArguments property:

  • Key – --enable-observability-metrics
  • Value – true

To enable the new metrics in the AWS Command Line Interface (AWS CLI), set the same job parameters in the --default-arguments argument.

Use case

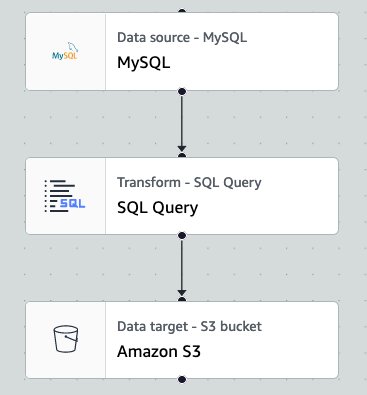
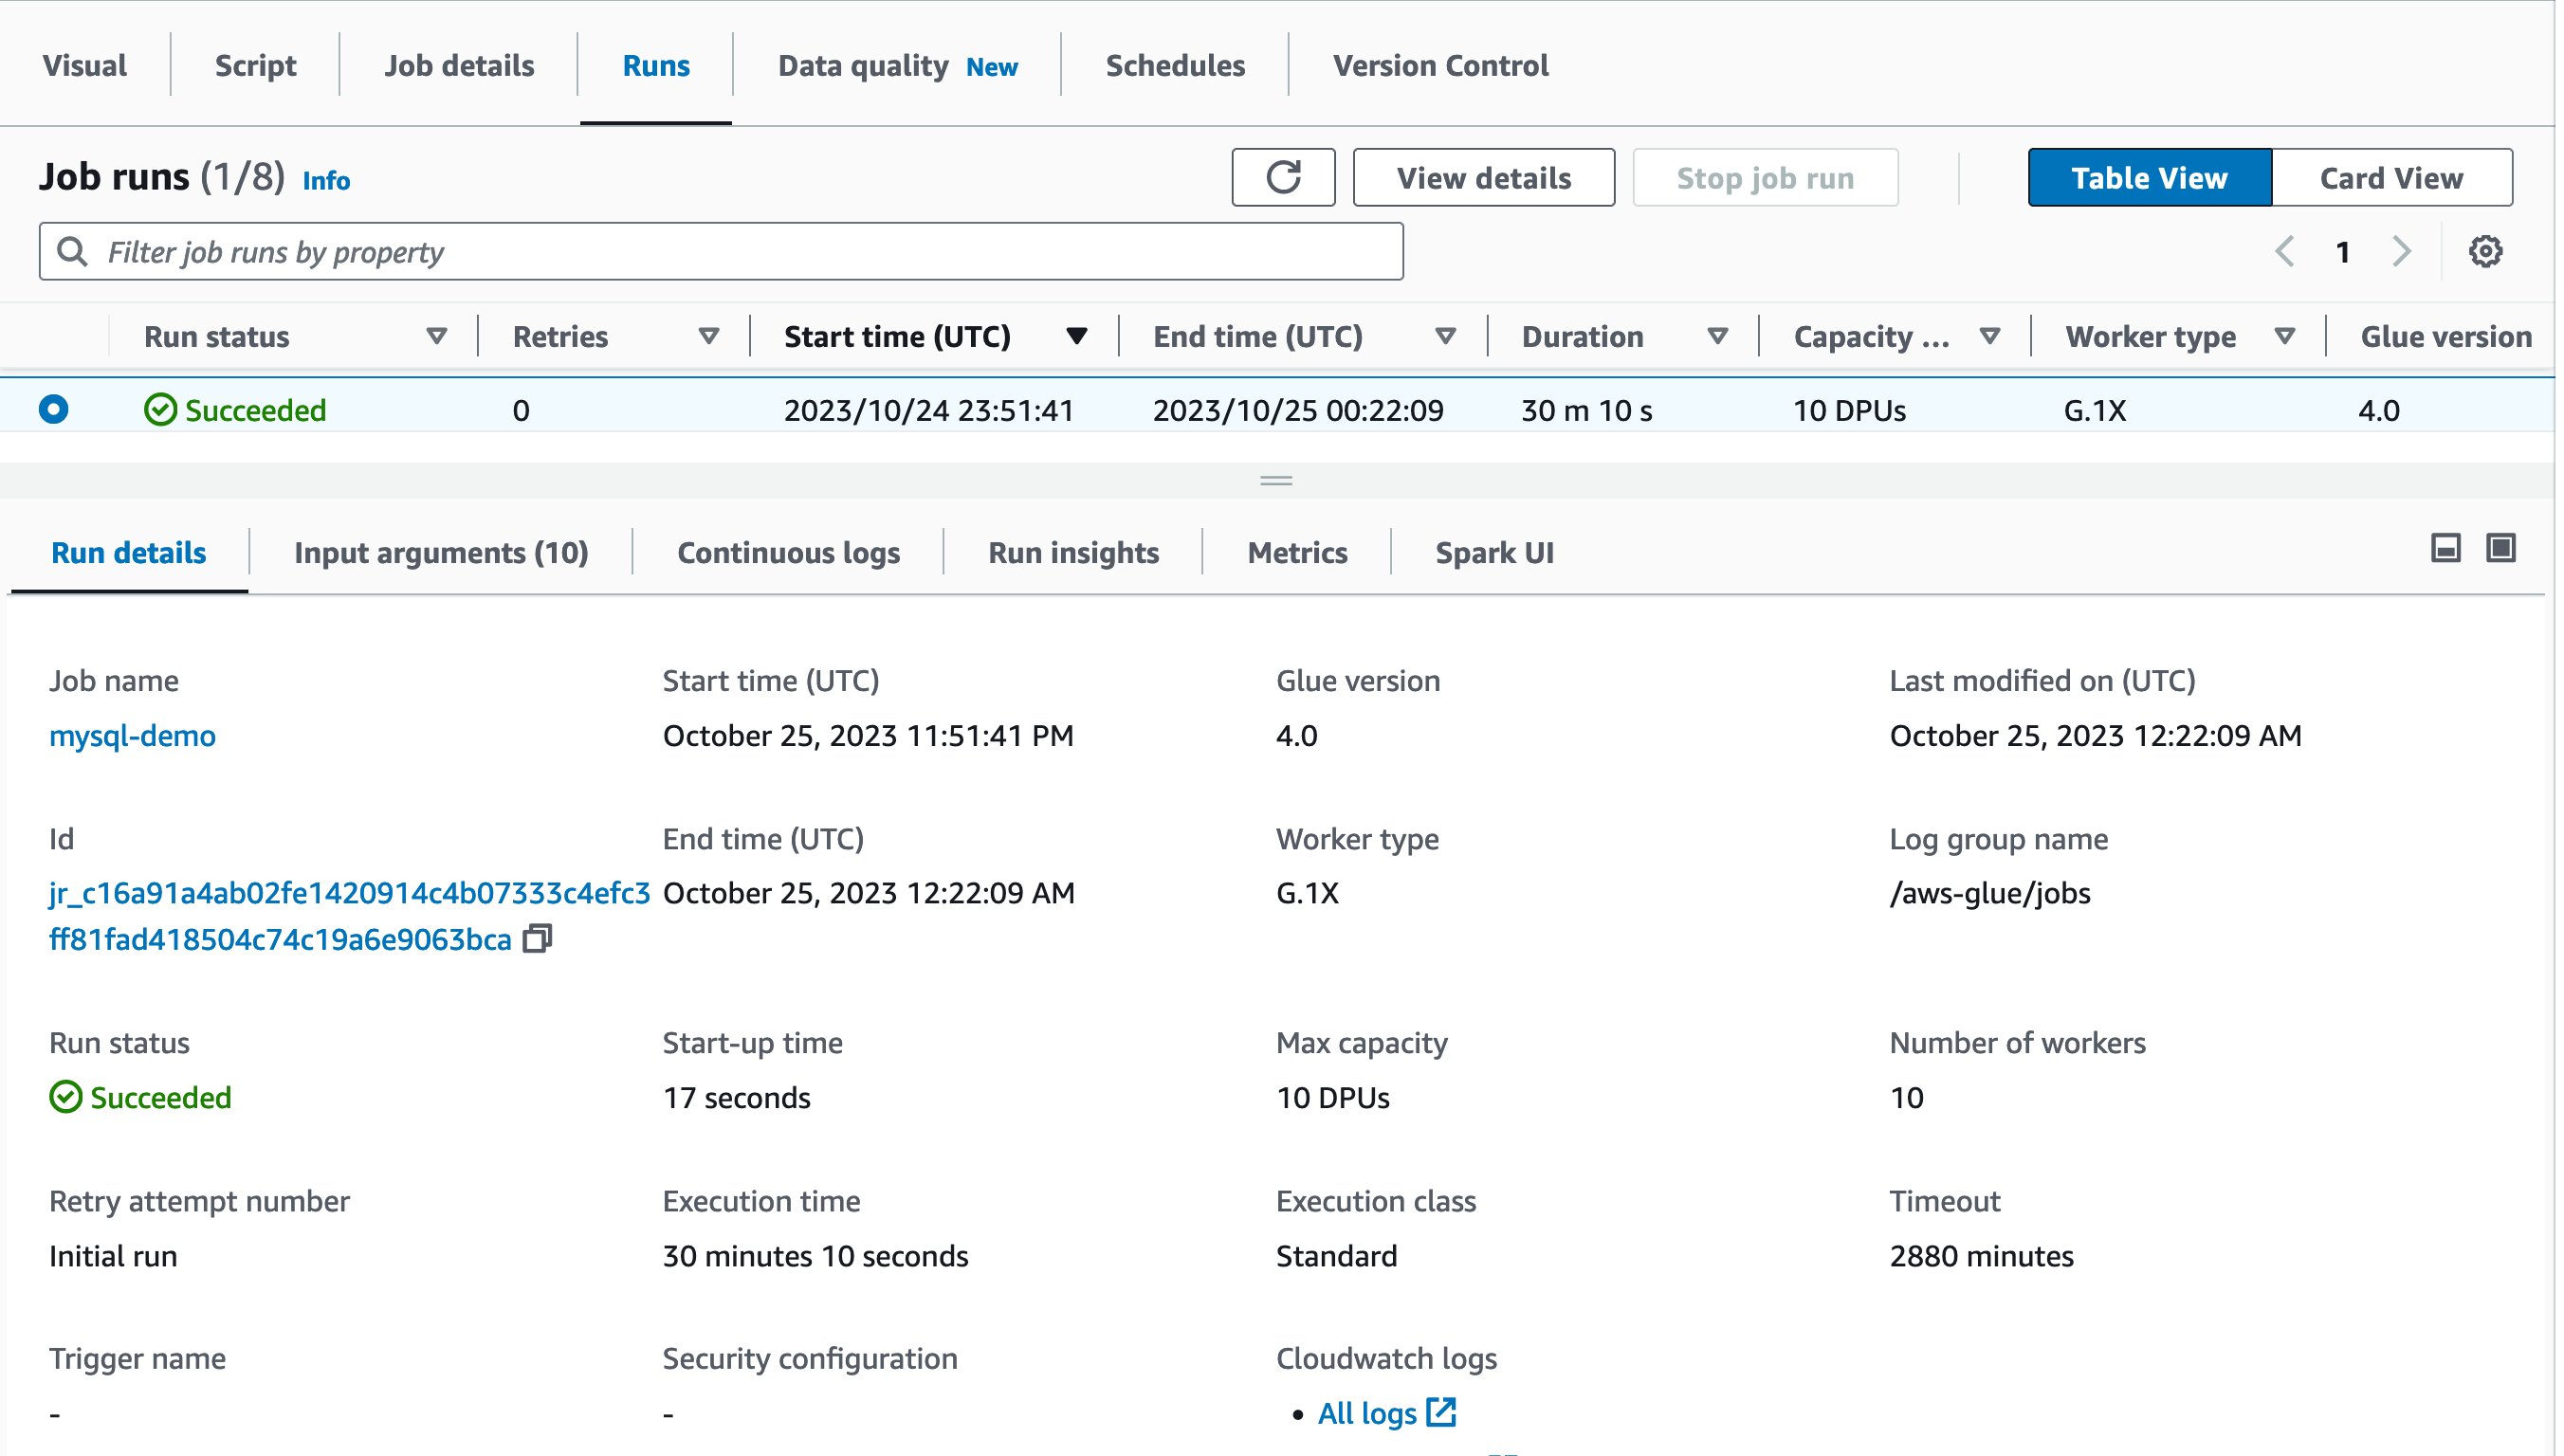
A typical workload for AWS Glue for Apache Spark jobs is to load data from a relational database to a data lake with SQL-based transformations. The following is a visual representation of an example job where the number of workers is 10.

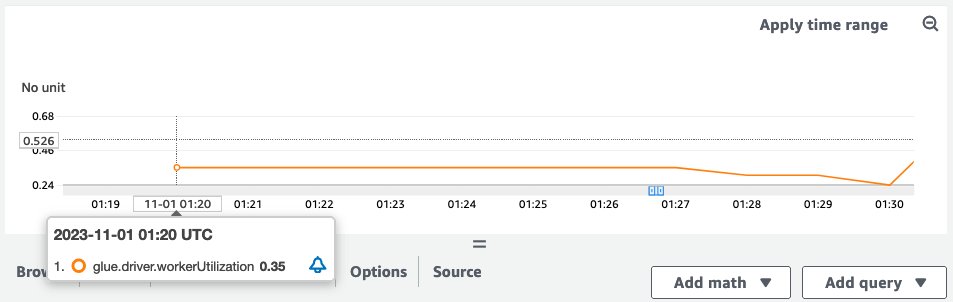
When the example job ran, the workerUtilization metrics showed the following trend.

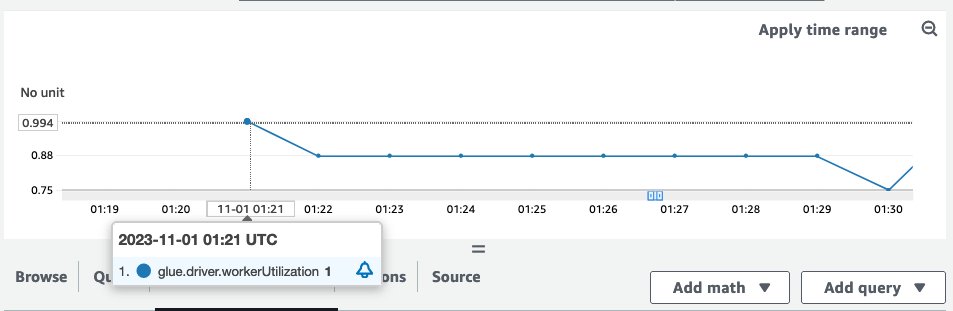
Note that workerUtilization showed values between 0.20 (20%) and 0.40 (40%) for the entire duration. This typically happens when the job capacity is over-provisioned and many Spark executors were idle, resulting in unnecessary cost. To improve resource utilization efficiency, it’s a good idea to enable AWS Glue Auto Scaling. The following screenshot shows the same workerUtilization metrics graph when AWS Glue Auto Scaling is enabled for the same job.

workerUtilization showed 1.0 in the beginning because of AWS Glue Auto Scaling and it trended between 0.75 (75%) and 1.0 (100%) based on the workload requirements.

Query and visualize metrics in CloudWatch

Complete the following steps to query and visualize metrics on the CloudWatch console:

  1. On the CloudWatch console, choose All metrics in the navigation pane.
  2. Under Custom namespaces, choose Glue.
  3. Choose Observability Metrics (or Observability Metrics Per Source, or Observability Metrics Per Sink).
  4. Search for and select the specific metric name, job name, job run ID, and observability group.
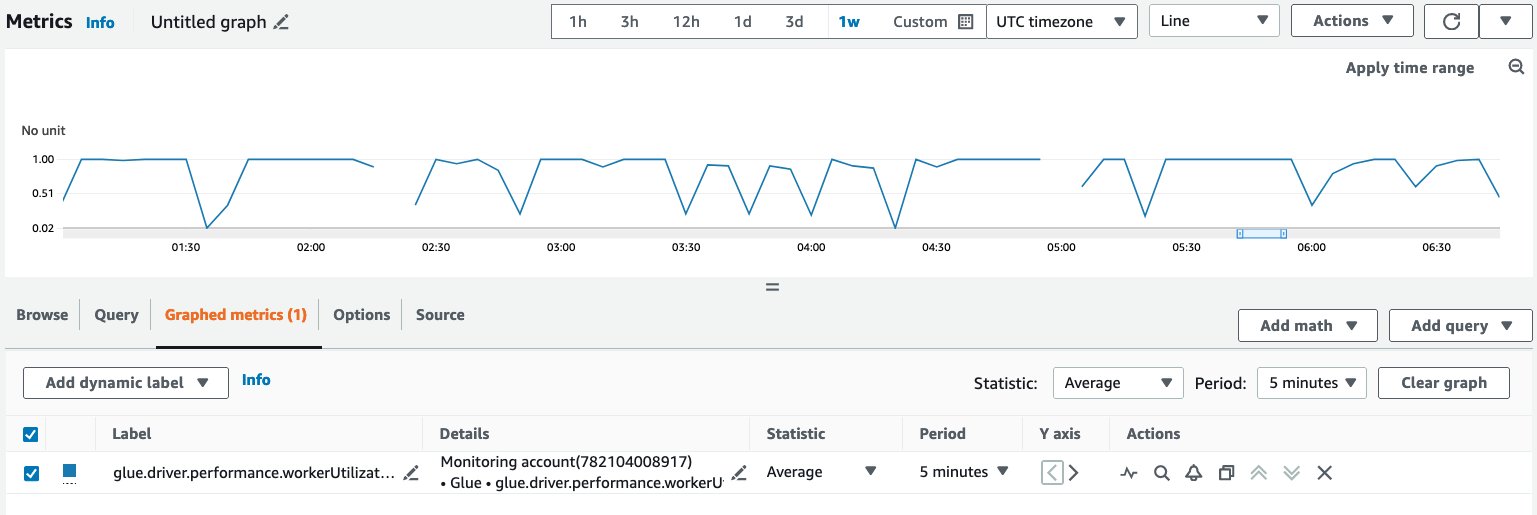
  5. On the Graphed metrics tab, configure your preferred statistic, period, and so on.

Query metrics using the AWS CLI

Complete the following steps for querying using the AWS CLI (for this example, we query the worker utilization metric):

  1. Create a metric definition JSON file (provide your AWS Glue job name and job run ID):
    $ cat multiplequeries.json
    [
      {
        "Id": "avgWorkerUtil_0",
        "MetricStat" : {
          "Metric" : {
            "Namespace": "Glue",
            "MetricName": "glue.driver.workerUtilization",
            "Dimensions": [
              {
                  "Name": "JobName",
                  "Value": "<your-Glue-job-name-A>"
              },
              {
                "Name": "JobRunId",
                "Value": "<your-Glue-job-run-id-A>"
              },
              {
                "Name": "Type",
                "Value": "gauge"
              },
              {
                "Name": "ObservabilityGroup",
                "Value": "resource_utilization"
              }
            ]
          },
          "Period": 1800,
          "Stat": "Minimum",
          "Unit": "None"
        }
      },
      {
          "Id": "avgWorkerUtil_1",
          "MetricStat" : {
          "Metric" : {
            "Namespace": "Glue",
            "MetricName": "glue.driver.workerUtilization",
            "Dimensions": [
               {
                 "Name": "JobName",
                 "Value": "<your-Glue-job-name-B>"
               },
               {
                 "Name": "JobRunId",
                 "Value": "<your-Glue-job-run-id-B>"
               },
               {
                 "Name": "Type",
                 "Value": "gauge"
               },
               {
                 "Name": "ObservabilityGroup",
                 "Value": "resource_utilization"
               }
            ]
          },
          "Period": 1800,
          "Stat": "Minimum",
          "Unit": "None"
        }
      }
    ]

  2. Run the get-metric-data command:
    $ aws cloudwatch get-metric-data --metric-data-queries file://multiplequeries.json \
         --start-time '2023-10-28T18:20' \
         --end-time '2023-10-28T19:10'  \
         --region us-east-1
    {
        "MetricDataResults": [
          {
             "Id": "avgWorkerUtil_0",
             "Label": "<your label A>",
             "Timestamps": [
                   "2023-10-28T18:20:00+00:00"
             ], 
             "Values": [
                   0.06718750000000001
             ],
             "StatusCode": "Complete"
          },
          {
             "Id": "avgWorkerUtil_1",
             "Label": "<your label B>",
             "Timestamps": [
                  "2023-10-28T18:20:00+00:00"
              ],
              "Values": [
                  0.5959183673469387
              ],
              "StatusCode": "Complete"
           }
        ],
        "Messages": []
    }

Create a CloudWatch alarm

You can create static threshold-based alarms for the different metrics. For instructions, refer to Create a CloudWatch alarm based on a static threshold.

For example, for skewness, you can set an alarm for skewness.stage with a threshold of 1.0, and skewness.job with a threshold of 0.5. This threshold is just a recommendation; you can adjust the threshold based on your specific use case (for example, some jobs are expected to be skewed and it’s not an issue to be alarmed for). Our recommendation is to evaluate the metric values of your job runs for some time before qualifying the anomalous values and configuring the thresholds to alarm.

Other enhanced metrics

For a full list of other enhanced metrics available with AWS Glue jobs, refer to Monitoring with AWS Glue Observability metrics. These metrics allow you to capture the operational insights of your jobs, such as resource utilization (memory and disk), normalized error classes such as compilation and syntax, user or service errors, and throughput for each source or sink (records, files, partitions, and bytes read or written).

Job observability dashboards

You can further simplify observability for your AWS Glue jobs using dashboards for the insight metrics that enable real-time monitoring using Amazon Managed Grafana, and enable visualization and analysis of trends with Amazon QuickSight.

Conclusion

This post demonstrated how the new enhanced CloudWatch metrics help you monitor and debug AWS Glue jobs. With these enhanced metrics, you can more easily identify and troubleshoot issues in real time. This results in AWS Glue jobs that experience higher uptime, faster processing, and reduced expenditures. The end benefit for you is more effective and optimized AWS Glue for Apache Spark workloads. The metrics are available in all AWS Glue supported Regions. Check it out!


About the Authors

Noritaka Sekiyama is a Principal Big Data Architect on the AWS Glue team. He is responsible for building software artifacts to help customers. In his spare time, he enjoys cycling with his new road bike.

Shenoda Guirguis is a Senior Software Development Engineer on the AWS Glue team. His passion is in building scalable and distributed Data Infrastructure/Processing Systems. When he gets a chance, Shenoda enjoys reading and playing soccer.

Sean Ma is a Principal Product Manager on the AWS Glue team. He has an 18+ year track record of innovating and delivering enterprise products that unlock the power of data for users. Outside of work, Sean enjoys scuba diving and college football.

Mohit Saxena is a Senior Software Development Manager on the AWS Glue team. His team focuses on building distributed systems to enable customers with interactive and simple to use interfaces to efficiently manage and transform petabytes of data seamlessly across data lakes on Amazon S3, databases and data-warehouses on cloud.
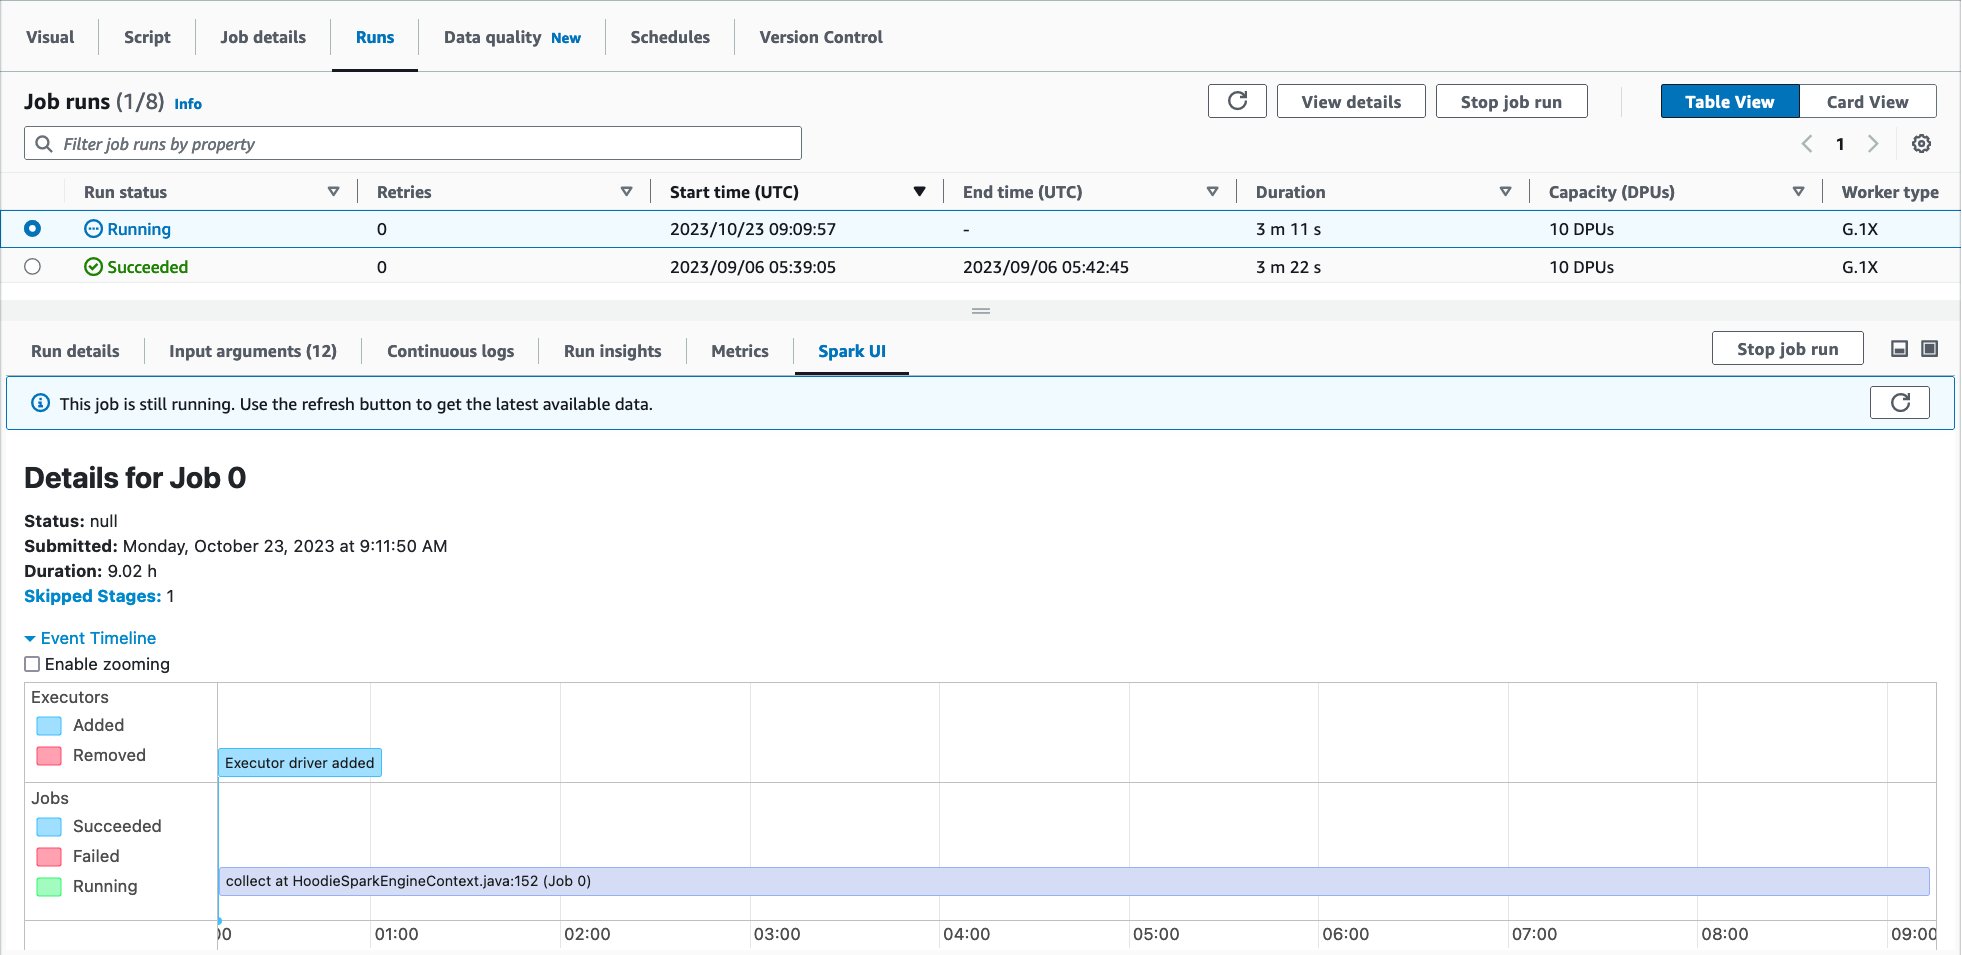
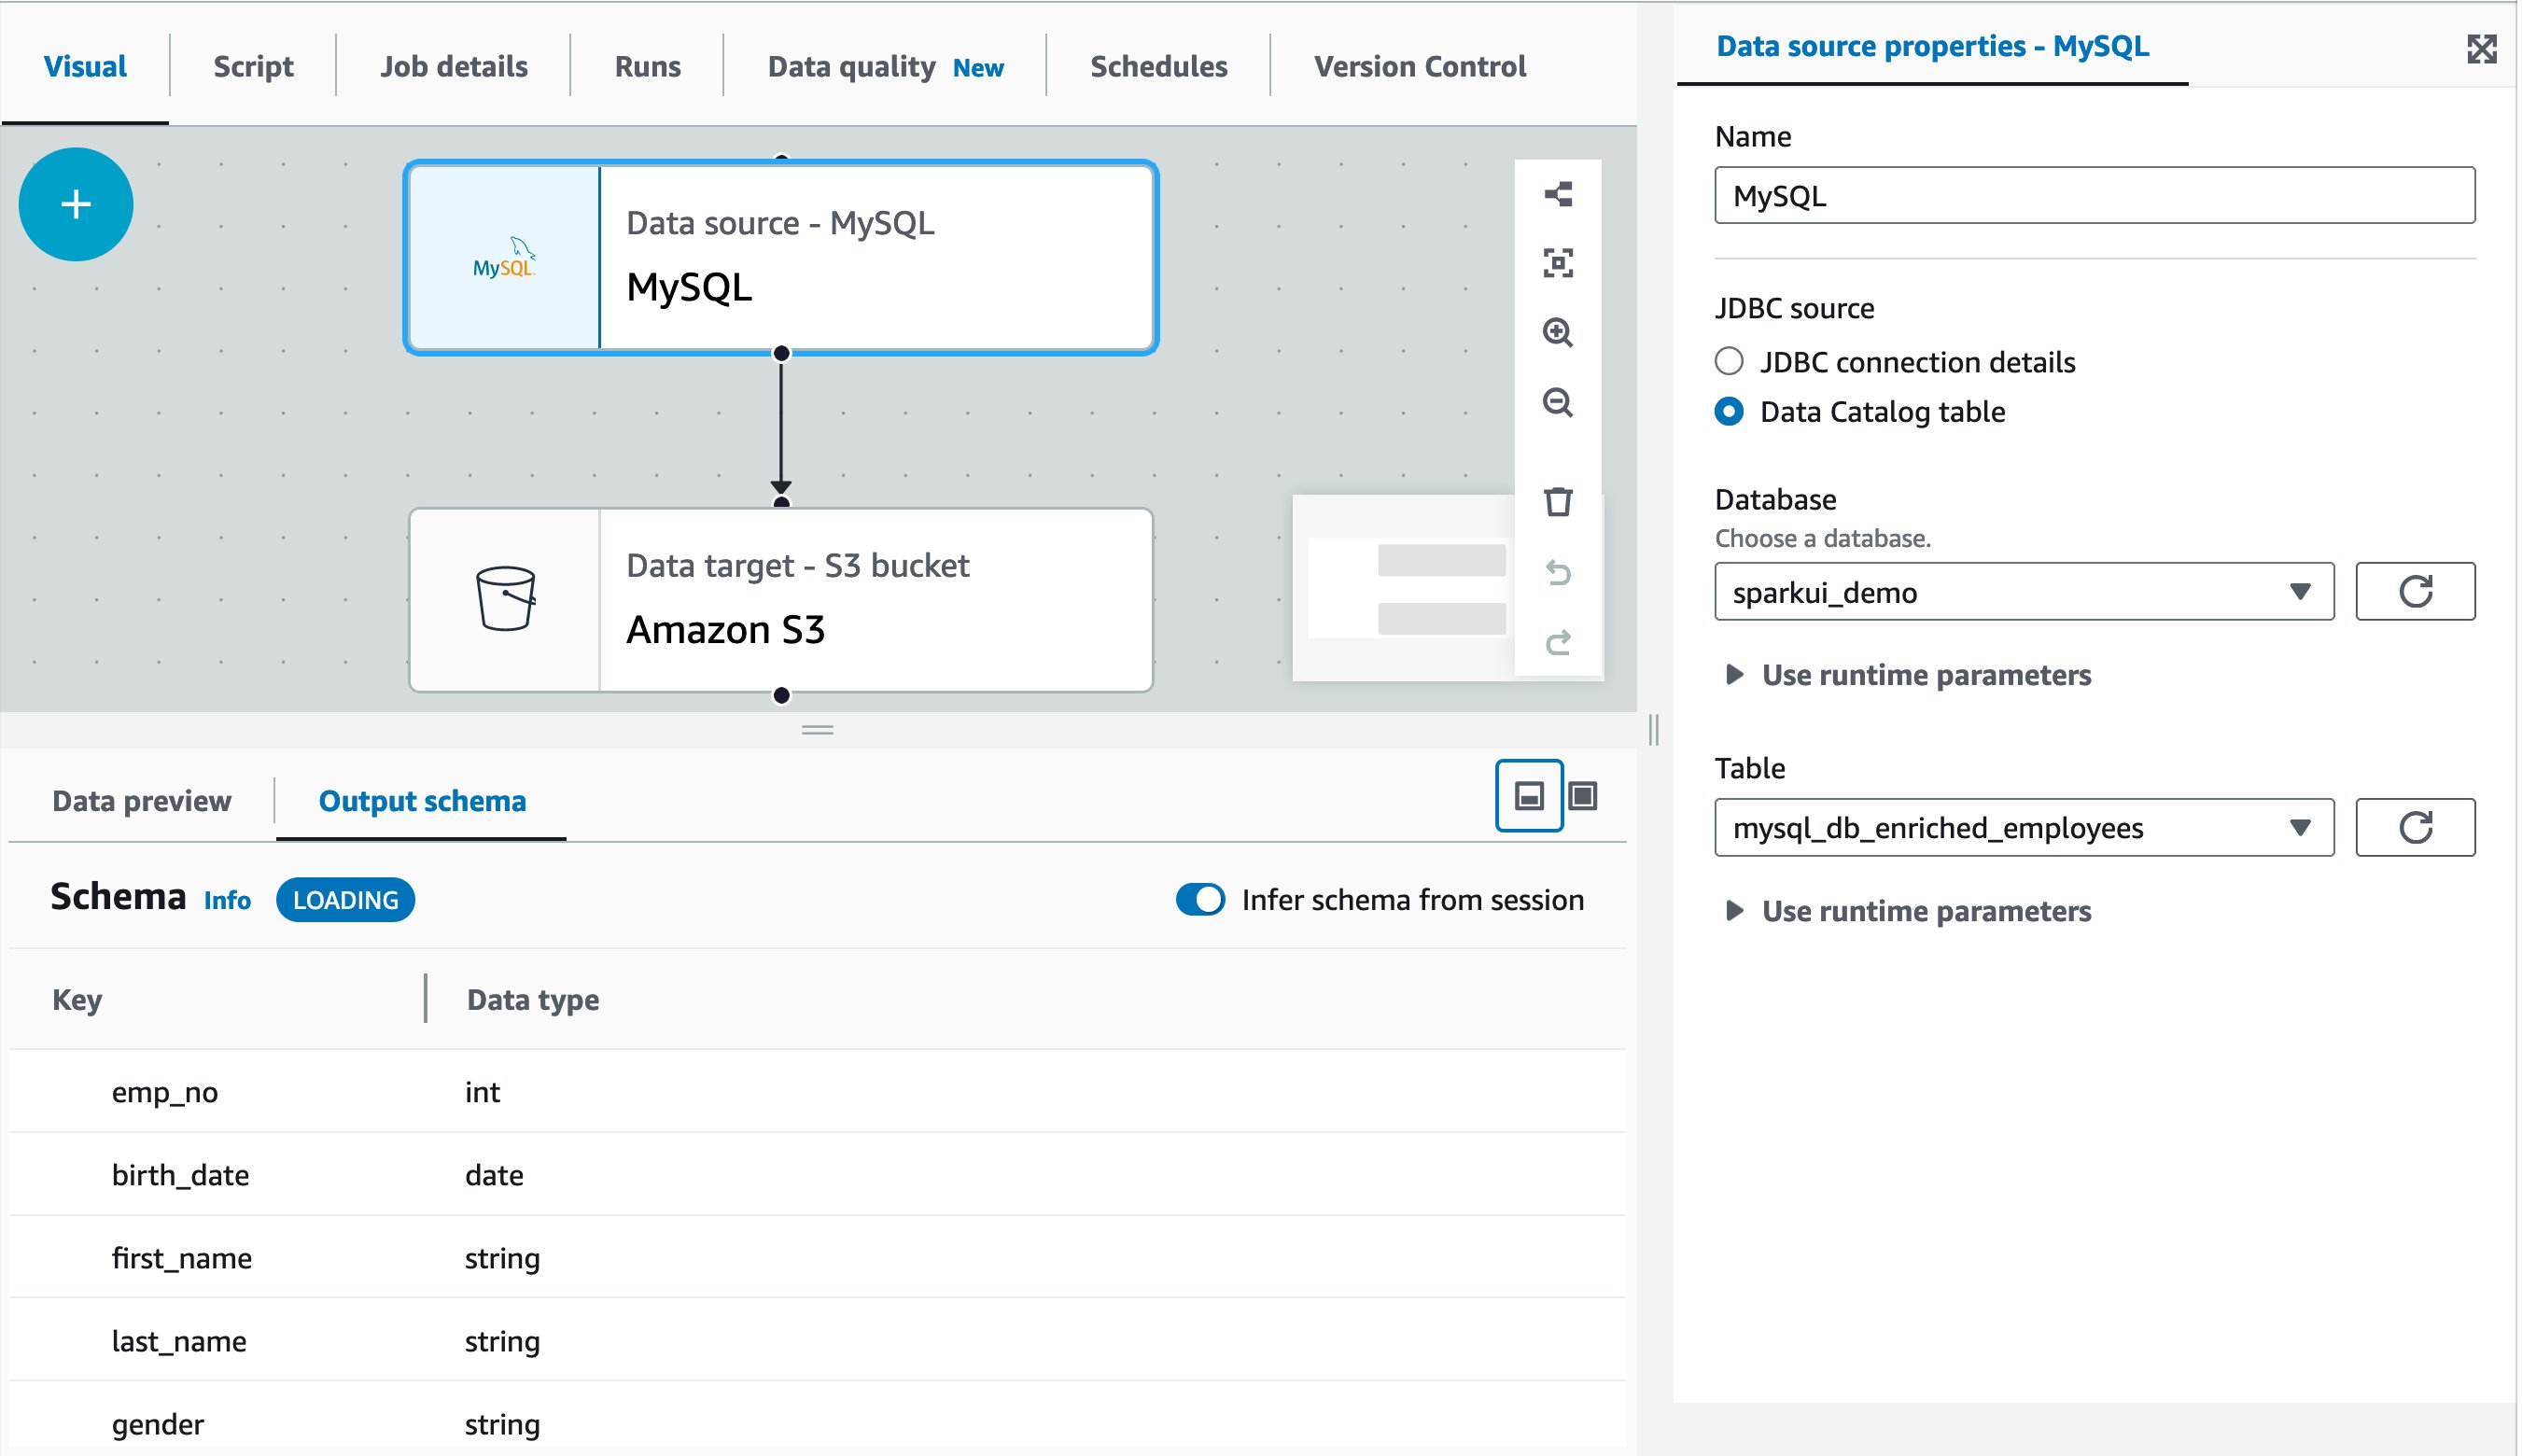
Introducing AWS Glue serverless Spark UI for better monitoring and troubleshooting

Post Syndicated from Noritaka Sekiyama original https://aws.amazon.com/blogs/big-data/introducing-aws-glue-studio-serverless-spark-ui-for-better-monitoring-and-troubleshooting/

In AWS, hundreds of thousands of customers use AWS Glue, a serverless data integration service, to discover, combine, and prepare data for analytics and machine learning. When you have complex datasets and demanding Apache Spark workloads, you may experience performance bottlenecks or errors during Spark job runs. Troubleshooting these issues can be difficult and delay getting jobs working in production. Customers often use Apache Spark Web UI, a popular debugging tool that is part of open source Apache Spark, to help fix problems and optimize job performance. AWS Glue supports Spark UI in two different ways, but you need to set it up yourself. This requires time and effort spent managing networking and EC2 instances, or through trial-and error with Docker containers.

Today, we are pleased to announce serverless Spark UI built into the AWS Glue console. You can now use Spark UI easily as it’s a built-in component of the AWS Glue console, enabling you to access it with a single click when examining the details of any given job run. There’s no infrastructure setup or teardown required. AWS Glue serverless Spark UI is a fully-managed serverless offering and generally starts up in a matter of seconds. Serverless Spark UI makes it significantly faster and easier to get jobs working in production because you have ready access to low level details for your job runs.

This post describes how the AWS Glue serverless Spark UI helps you to monitor and troubleshoot your AWS Glue job runs.

Getting started with serverless Spark UI

You can access the serverless Spark UI for a given AWS Glue job run by navigating from your Job’s page in AWS Glue console.

  1. On the AWS Glue console, choose ETL jobs.
  2. Choose your job.
  3. Choose the Runs tab.
  4. Select the job run you want to investigate, then choose Spark UI.

The Spark UI will display in the lower pane, as shown in the following screen capture:

Alternatively, you can get to the serverless Spark UI for a specific job run by navigating from Job run monitoring in AWS Glue.

  1. On the AWS Glue console, choose job run monitoring under ETL jobs.
  2. Select your job run, and choose View run details.

Scroll down to the bottom to view the Spark UI for the job run.

Prerequisites

Complete the following prerequisite steps:

  1. Enable Spark UI event logs for your job runs. It is enabled by default on Glue console and once enabled, Spark event log files will be created during the job run, and stored in your S3 bucket. The serverless Spark UI parses a Spark event log file generated in your S3 bucket to visualize detailed information for both running and completed job runs. A progress bar shows the percentage to completion, with a typical parsing time of less than a minute. Once logs are parsed, you can
  2. When logs are parsed, you can use the built-in Spark UI to debug, troubleshoot, and optimize your jobs.

For more information about Apache Spark UI, refer to Web UI in Apache Spark.

Monitor and Troubleshoot with Serverless Spark UI

A typical workload for AWS Glue for Apache Spark jobs is loading data from relational databases to S3-based data lakes. This section demonstrates how to monitor and troubleshoot an example job run for the above workload with serverless Spark UI. The sample job reads data from MySQL database and writes to S3 in Parquet format. The source table has approximately 70 million records.

The following screen capture shows a sample visual job authored in AWS Glue Studio visual editor. In this example, the source MySQL table has already been registered in the AWS Glue Data Catalog in advance. It can be registered through AWS Glue crawler or AWS Glue catalog API. For more information, refer to Data Catalog and crawlers in AWS Glue.

Now it’s time to run the job! The first job run finished in 30 minutes and 10 seconds as shown:

Let’s use Spark UI to optimize the performance of this job run. Open Spark UI tab in the Job runs page. When you drill down to Stages and view the Duration column, you will notice that Stage Id=0 spent 27.41 minutes to run the job, and the stage had only one Spark task in the Tasks:Succeeded/Total column. That means there was no parallelism to load data from the source MySQL database.

To optimize the data load, introduce parameters called hashfield and hashpartitions to the source table definition. For more information, refer to Reading from JDBC tables in parallel. Continuing to the Glue Catalog table, add two properties: hashfield=emp_no, and hashpartitions=18 in Table properties.

This means the new job runs reading parallelize data load from the source MySQL table.

Let’s try running the same job again! This time, the job run finished in 9 minutes and 9 seconds. It saved 21 minutes from the previous job run.

As a best practice, view the Spark UI and compare them before and after the optimization. Drilling down to Completed stages, you will notice that there was one stage and 18 tasks instead of one task.

In the first job run, AWS Glue automatically shuffled data across multiple executors before writing to destination because there were too few tasks. On the other hand, in the second job run, there was only one stage because there was no need to do extra shuffling, and there were 18 tasks for loading data in parallel from source MySQL database.

Considerations

Keep in mind the following considerations:

  • Serverless Spark UI is supported in AWS Glue 3.0 and later
  • Serverless Spark UI will be available for jobs that ran after November 20, 2023, due to a change in how AWS Glue emits and stores Spark logs
  • Serverless Spark UI can visualize Spark event logs which is up to 1 GB in size
  • There is no limit in retention because serverless Spark UI scans the Spark event log files on your S3 bucket
  • Serverless Spark UI is not available for Spark event logs stored in S3 bucket that can only be accessed by your VPC

Conclusion

This post described how the AWS Glue serverless Spark UI helps you monitor and troubleshoot your AWS Glue jobs. By providing instant access to the Spark UI directly within the AWS Management Console, you can now inspect the low-level details of job runs to identify and resolve issues. With the serverless Spark UI, there is no infrastructure to manage—the UI spins up automatically for each job run and tears down when no longer needed. This streamlined experience saves you time and effort compared to manually launching Spark UIs yourself.

Give the serverless Spark UI a try today. We think you’ll find it invaluable for optimizing performance and quickly troubleshooting errors. We look forward to hearing your feedback as we continue improving the AWS Glue console experience.


About the authors

Noritaka Sekiyama is a Principal Big Data Architect on the AWS Glue team. He works based in Tokyo, Japan. He is responsible for building software artifacts to help customers. In his spare time, he enjoys cycling on his road bike.

Alexandra Tello is a Senior Front End Engineer with the AWS Glue team in New York City. She is a passionate advocate for usability and accessibility. In her free time, she’s an espresso enthusiast and enjoys building mechanical keyboards.

Matt Sampson is a Software Development Manager on the AWS Glue team. He loves working with his other Glue team members to make services that our customers benefit from. Outside of work, he can be found fishing and maybe singing karaoke.

Matt Su is a Senior Product Manager on the AWS Glue team. He enjoys helping customers uncover insights and make better decisions using their data with AWS Analytic services. In his spare time, he enjoys skiing and gardening.

The collective thoughts of the interwebz