Security updates for Thursday

Post Syndicated from original https://lwn.net/Articles/928476/

Security updates have been issued by Debian (cairosvg, ghostscript, grunt, tomcat9, and trafficserver), Fedora (golang, podman, xen, and zchunk), Red Hat (kpatch-patch), SUSE (systemd), and Ubuntu (apache-log4j1.2, liblouis, linux-aws, and linux-bluefield).

Право на отговор на МТСП: Позиция на МТСП по разследването за злоупотреби с европроекти и забележките на Биволъ

Post Syndicated from Екип на Биволъ original https://bivol.bg/pravo-na-otgovor-mtsp.html

четвъртък 6 април 2023


Сайтът за разследваща журналистика “Биволъ” публикува позицията на МТСП по разследването ни в рубриката “Право на отговор” и без редакционна намеса. Забележките на “Биволъ” са след тире.  След като се…

Clubs Conference 2023: Ideas and tools for CoderDojos and Code Clubs

Post Syndicated from Sarah Roberts original https://www.raspberrypi.org/blog/clubs-conference-2023-talks/

On 24 and 25 March, more than 140 members of the Code Club and CoderDojo communities joined us in Cambridge for our first-ever Clubs Conference.

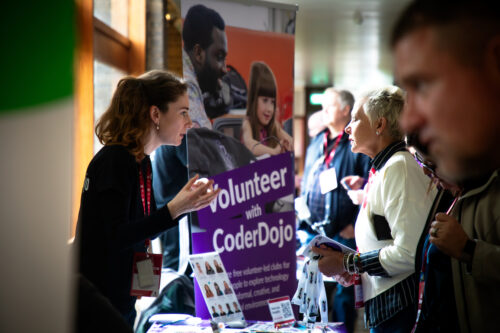
At the Clubs Conference, volunteers and educators came together to celebrate their achievements and explore new ways to support young people to create with technology. The event included community display tables, interactive workshops, discussions, poster sessions, and talks.

For everyone who couldn’t join us in person, we recorded all of the talks that community members gave on the main stage. Here’s what you can learn from the speakers.

Running your club

  • Jane Waite from our team offered a taste of the research we do and how you can get insights from it to help you run your own coding club. Watch Jane’s talk to learn about the research that informs our projects for your club.
  • Rhodri Smith, who runs a Code Club, shared how you can use assistive technologies to open your club experience to more young people. Watch Rhodri’s talk for some fantastic tips on how assistive technology can make Code Club accessible to children of all ages and abilities.
Participants at the Clubs Conference.
  • Dave Morley, who volunteers at the CoderDojo at Royal Museums Greenwich, presented his way of using Scratch projects to keep engaging Dojo participants. Watch Dave’s talk for tips on how to create your own coding projects for young people.
  • Tim Duffey, who is part of the West Sound CoderDojo, shared how his Dojo ran successful online sessions during the coronavirus pandemic. Watch Tim’s talk for great advice on how to run successful coding clubs for young people online.
  • Steph Burton from our team presented new resources we’re working on to help clubs recruit and train volunteers. Watch Steph’s talk for tips on how to recruit new volunteers for your coding club.

Engaging young people in your club

  • Sophie Hudson, who runs a Code Club in rural Yorkshire, told us how her school’s Code Club turned taking part in Astro Pi Mission Zero into a cross-curricular activity, and how she partnered older learners with younger ones for peer mentoring that engaged new learners in coding. Watch Sophie’s talk to learn how you can get your school involved in Astro Pi, especially if you don’t have much adult support available.
Participants at the Clubs Conference.
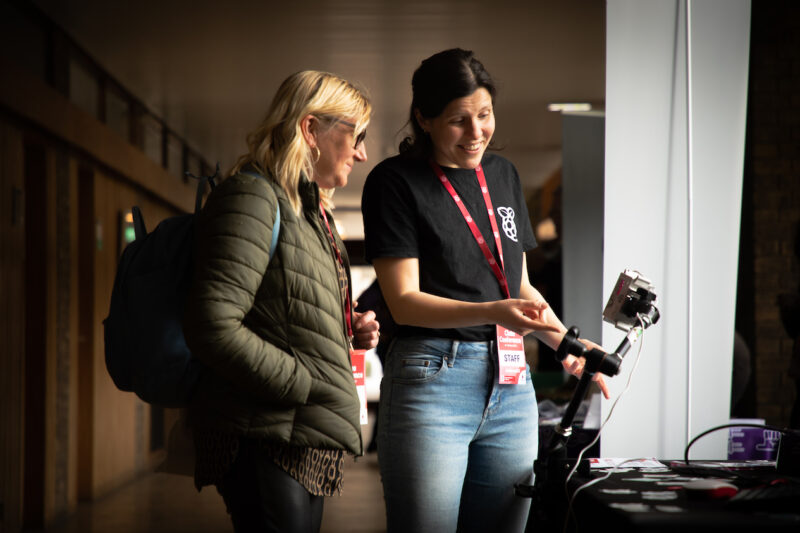
We brought a replica of the Astro Pi computers to the Clubs Conference.
  • Helen Gardner from our team shared how you can motivate and inspire your coders by supporting them to share their projects in the Coolest Projects showcase — even their very first Scratch animation. Watch Helen’s talk if you’re looking for something new for your club.

The benefits of Code Club and CoderDojo for your community

  • Fiona Lindsay, who leads a Code Club, presented her insights into the skills beyond coding that young people learn at Code Club, and she shared some wonderful videos of her coders talking about their experience. Watch Fiona’s talk to hear young girls talk about how to get more girls into coding, and for evidence of why every school should have a Code Club.
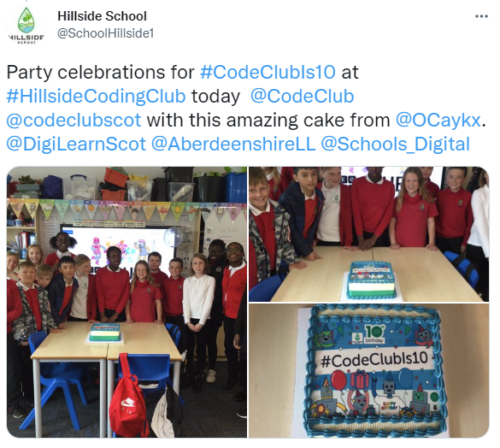
Hillside School's cake to celebrate ten years of Code Club.
Last year, Fiona’s Code Club held a special event to celebrate the tenth birthday of Code Club.
  • Bruce Harms, who is involved in AruCoderDojo, shared how he and his team are making the CoderDojo model part of their wider work to bring digital skills and infrastructure to Aruba. Watch Bruce’s talk to learn how his team has tailored their coding clubs for their local community.

What is volunteering for CoderDojo and Code Club like?

  • Marcus Davage, who volunteers at a Code Club, shared his journey as a volunteer translator of our resources, and how he engaged colleagues at his workplace in also supporting translations to make coding skills available to more young people across the world. Watch Marcus’s talk if you speak more than one language.
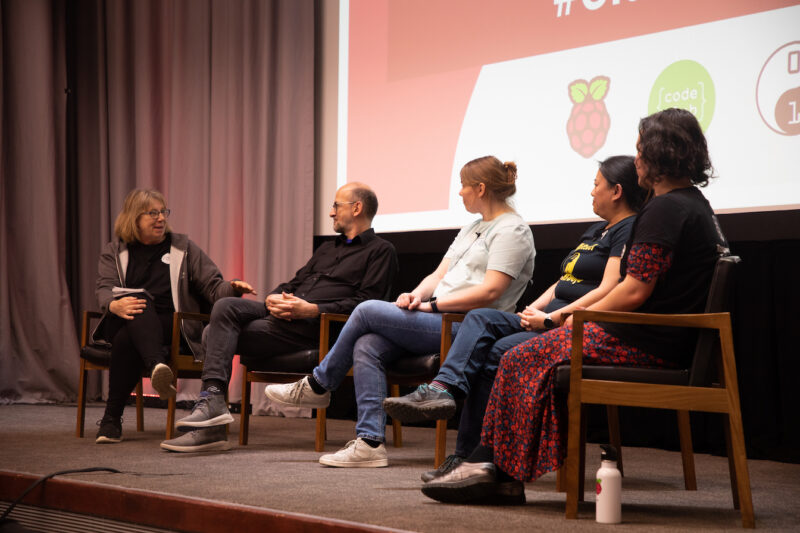
  • To end the day, we hosted a group of community members onstage to have a chat about their journeys with CoderDojo and Code Club, what they’ve learned, and how they see the future of their clubs. Watch the panel conversation if you want inspiration and advice for getting involved in helping kids create with tech.
A panel discussion on stage at the Clubs Conference.

Thank you to everyone who gave talks, ran workshops, presented posters, and had conversations to share their questions and insights. It was wonderful to meet all of you, and we came away from the Clubs Conference feeling super inspired by the amazing work Code Club and CoderDojo volunteers all over the world do to help young people learn to create with digital technologies.

We learned so much from listening to you, and we will take the lessons into our work to support you and your clubs in the best way we can.

The post Clubs Conference 2023: Ideas and tools for CoderDojos and Code Clubs appeared first on Raspberry Pi Foundation.

Research on AI in Adversarial Settings

Post Syndicated from Bruce Schneier original https://www.schneier.com/blog/archives/2023/04/research-on-ai-in-adversarial-settings.html

New research: “Achilles Heels for AGI/ASI via Decision Theoretic Adversaries”:

As progress in AI continues to advance, it is important to know how advanced systems will make choices and in what ways they may fail. Machines can already outsmart humans in some domains, and understanding how to safely build ones which may have capabilities at or above the human level is of particular concern. One might suspect that artificially generally intelligent (AGI) and artificially superintelligent (ASI) will be systems that humans cannot reliably outsmart. As a challenge to this assumption, this paper presents the Achilles Heel hypothesis which states that even a potentially superintelligent system may nonetheless have stable decision-theoretic delusions which cause them to make irrational decisions in adversarial settings. In a survey of key dilemmas and paradoxes from the decision theory literature, a number of these potential Achilles Heels are discussed in context of this hypothesis. Several novel contributions are made toward understanding the ways in which these weaknesses might be implanted into a system.

Изображенията на Пророка Мохамед: Случаят в „Хамлин“ (продължение)

Post Syndicated from Атанас Шиников original https://www.toest.bg/izobrazheniata-na-proroka-mohamed-sluchayat-v-hamlin-produlzhenie/

Изображенията на Пророка Мохамед: Случаят в „Хамлин“ (продължение)

Една външна на дадена религия гледна точка, особено зачената в предмодерността, без твърди обязаности към оценностяването на свободата на словото и толерантността, съдържа в себе си взривен потенциал. И ако тя се формира по ръба на конкуриращи се идеологически и религиозни системи, е много възможно да произведе обидни за отсрещната страна изказвания или изображения.

<< Към първа част

Оттук и третата ни уговорка.

И при „Шарли Ебдо“, и при „Юландс Постен“ трябва да отчетем, че акцентът не пада толкова върху изображението или самия акт на изобразяване. Онова, което предизвиква ярост, е по-скоро оскърбителното отношение. В традиционното мюсюлманско право може да бъде наречено „клевета, набеждаване“ (ар. казф), „обида“ (ар. сабб), „злословене“ (ар. рамйи), „проклинане, псувня“ (ар. шатм) на Пророка. Свещеният закон (шариат) може и да не е толкова ясен във връзка с изображенията. Но всяка ислямска регулация е недвусмислена относно санкцията при обида към основната религиозна фигура.

Смятат се за грях – оттук и престъпление (доколкото в религиозното право тези категории често съвпадат) от ранга на богохулството – обидата срещу Аллах, Корана, отстъпничеството от исляма (ар. ридда, иртидад) и неверието (ар. куфр). Най-често наказанието е смърт според твърде дълга верига от религиозни авторитети. Нормативно се разглежда и като едно от „углавните престъпления“ (ар. худуд), за които се полага определено възмездие. Смърт за богохулство и отстъпничество. Бой с камшик за пиене на вино. Отрязване на ръката на крадеца. Първоначално – камшик за прелюбодейците, а по-късно – пребиване с камъни (ар. раджм). Затова и външните на мюсюлманската историческа традиция изображения, обидни за мюсюлманите, са по-скоро сходни по въздействие със „Сатанински строфи“ на наскоро намушкания многократно с нож Салман Рушди. Да изобразиш пророка с тяло на куче или чалма с бомба е толкова скандално, колкото да се подиграваш на фикционалния му образ. Че и да го наричаш Махунд, по името на идола демон, за който в Европейското средновековие се твърди, че бива обожествяван от мюсюлманите.

Но в случая с „Хамлин“ имаме нещо по-смущаващо, което не бива да се смесва с предните скандали.

Защото не става въпрос за изображения извън мюсюлманската традиция. Тяхната основна функция е преднамерено да осмеят, да уязвят, да обговорят „самоцензурата“ или „да привлекат внимание към политкоректността“, както обясняваше Ларс Вилкс. Там е леснообяснимо защо са обидни. Обясним е и трагичният развой, подобно на атентата срещу Салман Рушди от миналата година. За хора като нас реакциите не са изненада.

Тук обаче говорим за исторически артефакт, произведен и припознат като ключов вътре в общността, колкото и обтекаеми да са нейните граници. Преписът от историята на Рашид ад-Дин в момента се съхранява в ръкописната колекция на Единбургския университет, Шотландия (Or.Ms.20). Хрониката притежава свой собствен исторически контекст. Основна нейна задача е да възхвалява възхода на династията на Чингис хан. Пълна е с изображения на монголоидни фигури с копия върху коне, но не всички те са на монголи. Според типичния мюсюлмански предмодерен подход наративът започва от сътворението и продължава през пророците, чак до съвремието на хрониста. Илюстрациите днес са се превърнали в част от всеки стандартен наръчник по мюсюлманско изкуство. Хрониката се смята за един от най-важните стари писмени паметници на историописта въобще.

Ето го и скандалния Мохамед.

Изображенията на Пророка Мохамед: Случаят в „Хамлин“ (продължение)

Не знам защо, но мен лично ме скандализира монголоидното женствено лице на архангела. Представял съм си го по-мургав, семитски и мъжествен. Може би подозирам подмазване, насочено към потомците на Чингис хан. Откровено не ми се нрави лекото му шкембенце. Скандализират ме и крилата му, които изглеждат като костюм от „Джъмбо“, закрепен за ръцете и гърба. И броят на крилата не ми харесва. Та нали според Сунната Мохамед разказва, че Джибрил има шестстотин крила. Но така или иначе, аз съм изцяло външен наблюдател.

И това не е единственото изображение на Мохамед в ръкописа. Има го нарисуван при раждането му. На друго място решава спор между мюсюлманите кой да повдигне Черния камък в Каабата. Стои като момче пред монаха Бахира, който го признава за пророк. Извършва нощното си пътуване (ар. исра’) към небето и престола на Аллах върху гърба на фантастичното същество Бурак, тук изобразено с женствено лице. Мохамед го е прихванал с ръце, заобиколен от въоръжени ангели. Бяга с верния съратник Абу Бакр от Мека към Медина (преселението, хиджра, поставило началото на мюсюлманския календар), докато край тях жена дои кози. Все събития, съставляващи всяка негова стандартна биография в исляма.

Да, Мохамед може да бъде открит из мюсюлманските ръкописи. Не е от най-разпространените сюжети, но присъства. И то в различни исторически периоди – на Тимуридите, на Моголската империя, на османците, на персийските Сефавиди. Много често го изобразяват с було на лицето, деперсонифициран, с ореол като огън. Понякога лицето му е обрамчено с брада, например тук, пак яхнал Бурак (Ръкопис от колекцията на университета „Макгил“ в Канада, MSP фолио 38). Също така бива стилизиран в калиграфски антропоморфен силует, изписан с арабски букви, като символ на „съвършения човек“ (ар. ал-инсан ал-камил). Особен тип „изображение“ е и калиграфското изпълнение на описанието му в строго определена форма и съдържание, т.нар. хилйа, популярна в Османската империя като хилйе. Там имаме само текст в стандартна композиция. И на фона на тази съществуваща изобразителна традиция студентката от „Хамлин“ казва:

Никога не съм виждала изображения на пророк. Като мюсюлманка и чернокожа нямам чувство за принадлежност – както и не смятам, че някога съм принадлежала – към общност, която не ме цени като неин член.

В отговор на това университетската администрация светкавично изпраща имейл до студентите, в който заклеймява инцидента като „ислямофобски“, и твърде прибързано прекратява договора на преподавателката, с което скандалът лавинообразно набира скорост. Докато не се озовава и на страниците на „Ню Йорк Таймс“.

По време на изслушването на Ведаталла тя твърди през сълзи, че никога не е съзирала изображение на пророк през живота си, а вече е получила множество заплахи. Според Джайлани Хусейн, изпълнителен директор на Съвета за американо-ислямски отношения (CAIR),

ислямофобията може да намери множество изражения.

Курсът не може да бъде смятан за инклузивен, след като поставя условие на някои мюсюлмански студенти да напуснат лекцията.

От отсрещната страна Кристиане Грубер, преподавателка в Университета в Мичиган и експерт по ислямско изкуство, е един от най-гласовитите защитници на уволнената преподавателка. Администрацията на университета, твърди тя, квалифицира целия корпус от изображения на Мохамед като изпълнен с омраза, нетолерантност и ислямофобия.

Но всъщност визуалният доказателствен материал показва обратното: изображенията са създадени, почти без изключения, от мюсюлмански художници за мюсюлмански покровители от уважение и преклонение през Мохамед и Корана.

По този начин, разгръща аргумента си тя, университетската институция излишно привилегирова една ултраконсервативна мюсюлманска гледна точка, която някак иронично съвпада с европейското клише за пълното отричане на изображенията в исляма.

В защита на преподавателката се обявяват и ПЕН клубът, Асоциацията за близкоизточни изследвания (MESA), Мюсюлманският съвет по обществени дела (MPAC), Алиансът за академична свобода.

Междувременно Прейтър завежда дело за тормоз, религиозна дискриминация и нарушаване на договора от страна на университета. Надигат се гласове в подкрепа на нейното възстановяване на преподавателското място.

Грубер впрочем е автор на една от любимите ми статии за мюсюлманско изкуство. Казва се „Знаците за Часа: есхатологичната образност в ислямските изкуства на книгата“. Занимава се и с изображенията на ада. Там също виждаме Мохамед, яхнал Бурак, да наблюдава мъченията на лъжесвидетелите. А за нас вратите на ада в академията зейват след изказвания като това:

Уважението към религиозните студенти мюсюлмани би следвало да замени академичната свобода.

Твърди го Фейниз С. Милър, президент на университета „Хамлин“. Стои обаче въпросът на кои точно измежду религиозните студенти мюсюлмани? Сунитите или шиитите? „Либералните“ или „консервативните“ (каквото и да значат тези дефиниции сред мюсюлманите)? Привържениците на школите на ханбалитите, ханифитите, шафиитите или маликитите? А какво ще кажем за религиозните студенти християни? За православните, католиците, традиционните или новите протестанти? Или за изповядващите юдаизма, но за кои по-точно – за ортодоксалните, реформираните или либералните? За студентите атеисти? За представителите на останалите религиозни общности?

Ами ако се окаже, че каноничното за едни е оскърбително за други,

какъвто често е случаят? Дори и основните текстове на религиите, вдъхновяващи сюжети във визуалните изкуства, може да бъдат обидни за външни страни. Коранът, Сунната, Петокнижието, Талмудът, Старият и Новият завет. Ако следваме логиката на CAIR, възприеманото като обидно съдържание не просто трябва да бъде поставяно в контекст и споделяно след подходящи предупреждения. За да не се накърни принципът на инклузията на всяка цена, би следвало то да бъде изхвърлено от учебната програма.

Междувременно мнозинството от преподавателите в същия университет наскоро гласуваха в подкрепа на оставката на президента Милър.

Скандалът вероятно ще отшуми. И няма да бъде последният. Но остана поне едно дългосрочно последствие от него.

През 2008 г. мюсюлмани организираха масова подписка под надслов „Махнете изображенията на Мохамед от Уикипедия“. Тя събра около 100 000 подписа за по-малко от два месеца, без да постигне целта си. Но от 6 януари тази година изображението на Мохамед в Уикипедия от хрониката на Рашид ад-Дин вече е маркирано със следния етикет:

Изображението на Мохамед може да засегне религиозните чувства на мюсюлманите.

Съответно има препоръка, когато въпросното изображение се добавя в статии, да се включи определен код, така че мюсюлманите да могат да го скрият. Вярвам, че това няма да бъде съдбата на всяко изображение на Мохамед в дигитализираните колекции на западните университети. Силно се надявам също, че преподавателското тяло няма да възприеме инцидента като размахан пръст, че учебните програми и планове трябва да бъдат постоянно ревизирани и преподавани след множество уговорки. От страх, че предметът им ще се окаже обиден ту за една, ту за друга страна в учебния процес.

И накрая – мой спомен от докторантските години в Софийския университет.

По време на курса ми при професор по философия на религиите, бивш посланик във Ватикана, въпросният преподавател реши да ни покаже фотографията на Андрес Серано „Потапяне: Христос в пикня“ (Immersion: Piss Christ) от 1987 г. Не в урина даже. Английското piss не звучи неутрално. Пък и заглавието на фотографията може да значи „препикай Христа“. Нямаше дълго предупредително предисловие, нито поставяне в контекст. Християните, участващи в семинара, би следвало да се обидят, нали така? Обидно, че и богохулно, заявява възмутената публика в САЩ. За разлика от самия фотограф, който твърди, че е католик. Миналата година беше в София с изложба, посветена на изтезанията.

По същата логика и графитът, от който тръгнах, е несъмнено ислямофобски. Но дали е „ислямофобско“ снимането му, публичното показване и обсъждане на един противоречиво представен Мохамед? В тази дискусия академичната свобода пада лесна жертва. А човекът, както знаем от добрия стар Аристотел, „по природа“ се стреми към знание. Особено в академията. Иначе тя рискува да изгуби природата си. А макар и по парадоксален начин, подобни случаи ни показват, че изследванията на предмодерната мюсюлманска история продължават да са релевантни на нашето съвремие.


В рубриката „Ориент кафе“ Атанас Шиников поднася любопитни теми, свързани не толкова с горещата политика, колкото с историята и културата на Близкия изток. А той, древен и днешен, е по-близко до нас и съвремието ни, отколкото си представяме.

Optimizing fleet utilization with Amazon Location Service and HERE Technologies

Post Syndicated from Mahesh Geeniga original https://aws.amazon.com/blogs/architecture/optimizing-fleet-utilization-with-amazon-location-service-and-here-technologies/

The fleet management market is expected to grow at a Compound Annual Growth Rate (CAGR) of 15.5 percent—from 25.5 billion US dollars in 2022 to USD 52.4 billion in 2027. Optimizing how your organization uses its vehicle fleet is important for logistics and service providers such as last mile, middle mile, and field services.

In this post, we demonstrate how to build and run a solution for many-to-many vehicle routing using HERE Tour Planning and Amazon Location Service. HERE Technologies is a data provider for Amazon Location Service and provides it with map rendering, geocoding, search, and routing. HERE Tour Planning expands on functionality such as geocoding, basic routing, and matrix routing to consider parameters such as time windows, job requirements or priorities, vehicle capabilities, range, and traffic information. They also support immediate re-planning when conditions change.

The architecture described in this post can help you optimize your fleets for delivering shipments, such as perishable items on pallets, from a central distribution center to multiple retail locations. The architecture uses the AWS Cloud Development Kit (AWS CDK) to help you provision and version control your infrastructure. The architecture also uses Event Driven Architecture (EDA) based on AWS Lambda and Amazon DynamoDB. It uses Amazon Simple Storage Service (Amazon S3) and DynamoDB to store the artifacts generated and integrates with Amazon Location Service to plot the routes visually on a map for each delivery driver.

Solution overview

This post will help you:

  • Configure the many-to-many vehicle routing architecture using HERE Tour Planning and Amazon Location Service
  • Submit a HERE Tour Planning problem
  • Generate an optimized solution file
  • Run a React app that:
    • Generates a list of routes for each vehicle in the fleet
    • Allows drivers to select and view routes in detail

The following diagram outlines how the architecture works.

Many-to-many vehicle routing architecture

Figure 1. Many-to-many vehicle routing architecture using HERE Tour Planning and Amazon Location Service

Let’s explore the steps in the diagram.

  1. The fleet operator uploads the tour requirements file to an Amazon S3 bucket.
  2. The upload invokes a Lambda function to process the new Tour Request. If the HERE API key is present, it calls the HERE Tour Planning API.
  3. The HERE Tour Planning API calculates the solution to the routing problem.
  4. The driver uses the React app to select a vehicle, which requests a route.
  5. The invoked Lambda function uses Amazon Location Service to calculate the route and render it in the React app.

Prerequisites

This walkthrough requires the following installations and resources:

  • Have an AWS account
  • Install the AWS Amplify CLI (command-line interface)
  • Install the AWS CDK CLI
  • Install the AWS CLI
    • Configure and authenticate the AWS CLI to interact with your AWS account.
  • Have your preferred integrated development environment (IDE), such as Visual Studio Code
  • Have GitHub repository access
    • git clone https://github.com/aws-samples/aws-here-optimize-fleet-utilization
  • Have a HERE API Key (optional)
    • This is needed to invoke the HERE Tour Planning API for generating solutions to new routing problems.
    • The GitHub sample repository includes a problem and pre-solved solution file, so you don’t need to acquire a HERE API key to learn about these offerings.
    • To acquire an API key, create a free account on the HERE Platform, then follow the instructions in the HERE Tour Planning documentation to create your API key.
    • There can be additional charges based on API key use. For more details, see the HERE Tour Planning section within HERE service rates.

Walkthrough

Provision the infrastructure

  1. The architecture uses NPM node modules. Run the following commands to install the dependencies:
    • # AWS Lambda function dependencies
      cd lib/lambda/calculate-route
      npm install
    • # Sample Frontend application dependencies
      cd frontend/here-driver-app
      npm install
  2. If you have never used AWS CDK in your AWS account, you must first bootstrap the solution, which creates Amazon S3 buckets and metadata to support AWS CDK operations. Note: Architectural components described in this article are covered under AWS Free Tier and HERE Free monthly usage, but additional charges can occur based on usage beyond the Free Tier limits. We recommend following the Cleanup instructions after completing the walkthrough.
      • From the root of the repository, run the following command to generate the needed infrastructure:
        • cdk bootstrap
      • Output similar to the following indicates that you successfully bootstrapped the AWS account with what AWS CDK requires.

        Successful bootstrap of AWS account with AWS CDK requirements

        Figure 2. Successful bootstrap of AWS account with AWS CDK requirements

  3. Deploy the infrastructure for this solution by running the following command. This provisions much of the infrastructure required for this solution such as DynamoDB, Lambda functions, and Amazon S3 buckets:
    • cdk deploy
  4. Next, Amplify provisions the remaining resources to complete the architecture. Navigate to the folder for the frontend by running the following command:
    • cd frontend/here-driver-app
  5. Run the following series of Amplify commands to create the remaining resources, Amazon API Gateway, Amazon Cognito, and Amazon Location Service. For additional details, see Clone sample Amplify project.
  6. To accept the defaults, run the following command:
    • amplify init
  7. To push the infrastructure out to the AWS account, run the following command:
    • amplify push
  8. To publish the environment, run the following command:
    • amplify publish

Create problem and generate architecture files

The next step is to create the HERE Tour Planning problem file and submit it to the HERE Tour Planning API to solve. Note: You can either sign up for the HERE Developer program to receive an API key to test this solution live or use the problem and pre-solved solution provided in the /data folder of the repository.

  1. Open the Amazon S3 bucket that the previous step created.
  2. Upload a problem file (in JSON format) to the bucket.
  3. An Amazon S3 event notification invokes a Lambda function that performs a synchronous call to the HERE Tour Planning API and generates vehicle routing problem solution file in JSON format.
  4. The Lambda function saves the solution file to the Amazon S3 bucket and additional details about the solution to a DynamoDB table.
  5. The delivery drivers can use the example React app to view the list of vehicles and the routes.
Creating a problem file and submitting it to HERE Tour Planning API

Figure 3. Creating a problem file and submitting it to HERE Tour Planning API

Frontend

The next step is to run the React Frontend app to see the results. Access to the app and the API Gateway is secured with Amazon Cognito.

  1. To run the web application, run the following command:
    • npm start
  2. A local web server runs on http://localhost:3000.
  3. To use the system, the user must authenticate. Amazon Cognito allows users to sign in or create a new account.
  4. After you authenticate, the Home screen displays a list of available vehicles and routes.

    Available vehicles and routes

    Figure 4. Available vehicles and routes

Choose a vehicle to see the detail of the route. Each red marker is a stop.

Vehicle route details

Figure 5. Vehicle route details

Cleanup

To avoid incurring future charges, delete all resources created.

  1. Run the following commands to delete the application in AWS Amplify. As an alternative, you can use the Amplify console to delete Amplify resources:
    • cd frontend/here-driver-app
      amplify pull
      amplify delete
  2. With AWS CDK, run the following command to delete the AWS CloudFormation stack that was used to provision the resources. Note: You can leave the AWS CLI, Amplify CLI, and CDK CLI installed on your computer for future development:
    • cdk destroy

Conclusion

In this post, using shipment delivery from a central distribution center use case, we’ve demonstrated how you can build your own serverless solution for optimizing middle and last mile operations. The solution uses multi-vehicle and multi-stop optimization services provided by HERE Tour Planning and Amazon Location Service to visualize the generated routes for each delivery vehicle driver. For additional details about HERE’s offerings on AWS Marketplace, see AWS Marketplace: HERE Technologies.

[$] DCC-EX: open-source model railroading

Post Syndicated from original https://lwn.net/Articles/928244/

There’s just something about trains—model trains in particular. At Everything Open 2023, Paul
Antoine spoke about his experiences with the DCC-EX project, which has a variety
model-railroad automation hardware designs and software tools, all of which
are freely
available. There is a long legacy of sharing within the model
railroading hobby, which continues today in the form of free and open-source
software for it.

Reduce triage time for security investigations with Amazon Detective visualizations and export data

Post Syndicated from Alex Waddell original https://aws.amazon.com/blogs/security/reduce-triage-time-for-security-investigations-with-detective-visualizations-and-export-data/

To respond to emerging threats, you will often need to sort through large datasets rapidly to prioritize security findings. Amazon Detective recently released two new features to help you do this. New visualizations in Detective show the connections between entities related to multiple Amazon GuardDuty findings, and a new export data feature helps you use the data from Detective in your other tools and automated workflows.

By using these new features, you can quickly analyze, correlate, and visualize the large amounts of data generated by sources like Amazon Virtual Private Cloud (Amazon VPC) Flow Logs, AWS CloudTrail, Amazon GuardDuty findings, and Amazon Elastic Kubernetes Service (Amazon EKS) audit logs.

In this post, we’ll show you how you can use these new features to help reduce the time it takes to assess, investigate, and prioritize a security incident.

A security finding is raised

The workflow starts with GuardDuty. GuardDuty continuously monitors AWS accounts, Amazon Elastic Compute Cloud (Amazon EC2) instances, EKS clusters, and data stored in Amazon Simple Storage Service (Amazon S3) for malicious activity without the use of security software or agents.

If GuardDuty detects potential malicious activity, such as anomalous behavior, credential exfiltration, or command and control (C2) infrastructure communication, it generates detailed security incidents called findings.

Depending on the severity and complexity of the GuardDuty finding, the resolution might require deep investigation. Consider an example that involves cryptocurrency mining. If you frequently see a cryptocurrency finding on your EC2 instances, you might have a recurring malware issue that has enabled a backdoor. If a threat actor is attempting to compromise your AWS environment, they typically perform a sequence of actions that lead to multiple findings and unusual behavior. When security findings are investigated in isolation, it can lead to a misinterpretation of their significance and difficulty in finding the root cause. When you need more context around a finding, Detective can help.

Detective automatically collects log data and events from sources like CloudTrail logs, Amazon VPC Flow Logs, GuardDuty findings, and Amazon EKS audit logs and maintains up to a year of aggregated data for analysis. Detective uses machine learning to create a behavioral graph for these data sources that helps show how security issues have evolved. It highlights what AWS resources might be compromised and flags unusual activity like new API calls, new user agents, and new AWS Regions.

The search capabilities work across AWS workloads, providing the information required to show the potential impact of an incident. Detective helps you answer questions like: How did this security incident happen? What AWS resources were affected? How can we prevent this from happening again?

Finding groups help connect the dots of an incident

You can use finding groups, a recent feature of Detective, to help with your investigations. A finding group is a collection of entities related to a single potential security incident that should be investigated together. An entity can be an AWS resource like an EC2 instance, IAM role, or GuardDuty finding, but it can also be an IP address or user agent. For a full list of entities collected, see Searching for a finding or entity in the Detective User Guide.

Grouping these entities together helps provide context and a more complete understanding of the threat landscape. This makes it simpler for you to identify relationships between different events and to assess the overall impact of a potential threat.

In the cryptocurrency mining example described previously, finding groups could show the relationship between the cryptocurrency mining finding and a C2 finding so that you know the two are related and the AWS resources affected. To learn more about working with Detective finding groups, see How to improve security incident investigations using Amazon Detective finding groups.

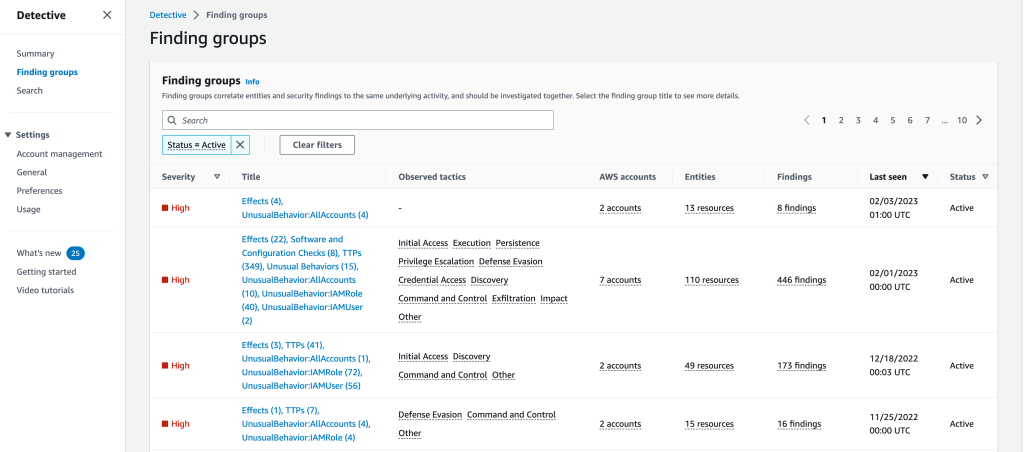
Figure 1 shows the finding groups overview page on the Detective console, with a list of finding groups filtered by status. The dashboard also shows the severity, title, observed tactics, accounts, entities, and the total number of findings for each finding group. For more information about the attributes of finding groups, see Analyzing finding groups.

Figure 1: Finding groups overview

Figure 1: Finding groups overview

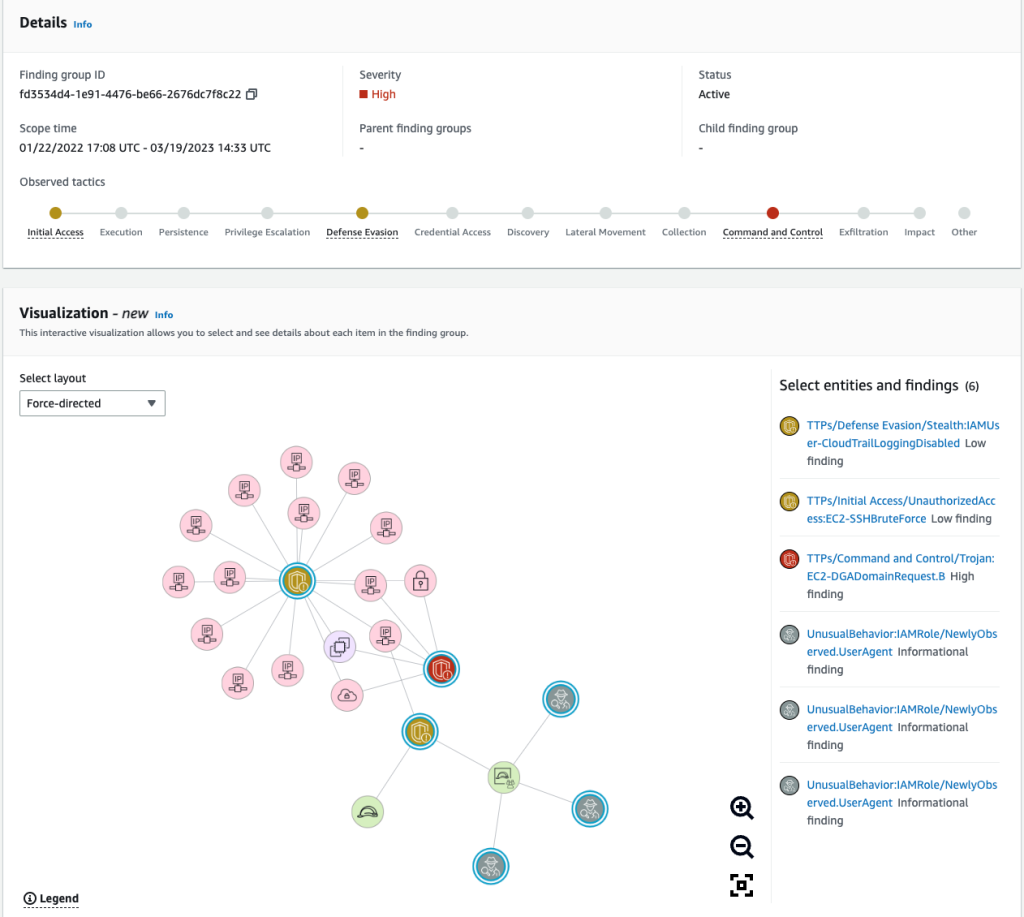
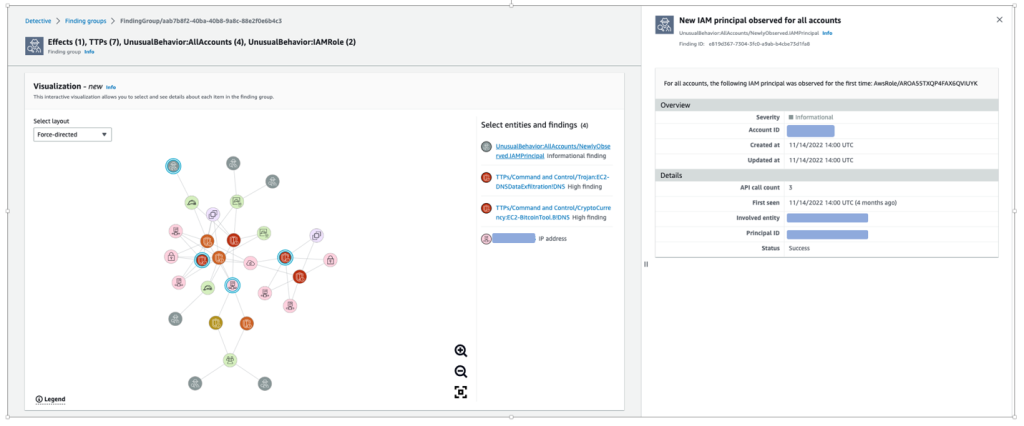
To see details about the finding group, select the title of the finding group to access the details page, which includes Details, Visualization, Involved entities, and Involved findings. On this panel, you can view entities and findings included in a finding group and interact with them. The information presented is the same in the Visualization panel, the Involved entities panel, and the Involved findings panel. The different views allow you to view the information in the way that is helpful for you. Figure 2 shows an example of the Details and Visualization for a specific finding group.

Figure 2: Details and Visualization

Figure 2: Details and Visualization

Note: Finding groups with over 100 nodes (findings and entities) do not include a graph visualization.

Visualizations to show you the situation

The new visualizations in Detective provide three layouts that display the same information from finding groups, but allow you to choose and arrange the different entities so that you can focus on the highest priority finding or resources.

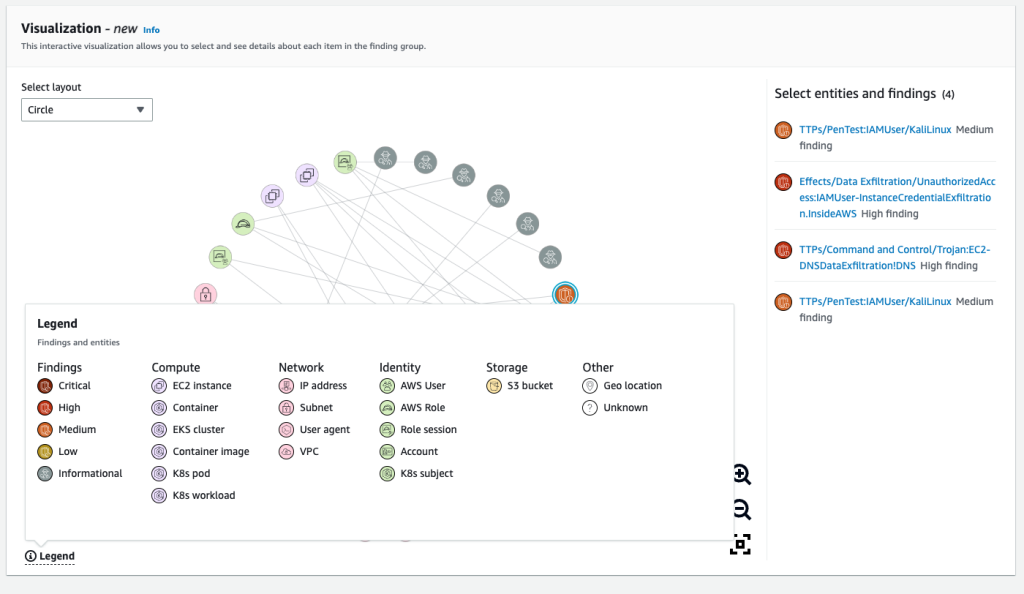
To determine what each visual element represents, choose the Legend in the bottom left corner of the panel. You can change the placement of findings in the Visualization panel by selecting a different layout from the Select layout dropdown menu. Figure 2 in the preceding section shows the Force-directed layout, where the positioning of entities and findings presents an even distribution of links with minimal overlap, while maintaining consistent distance between items.

Figure 3 shows the Visualization panel with the Circle layout, where nodes are displayed in a circular layout. You can use the Legend to understand the different categories of Findings, Compute, Network, Identity, Storage, or Other.

If you’re unfamiliar with these terms, see Amazon Detective terms and concepts to learn more.

Figure 3: Visualization panel with Circle layout and Legend

Figure 3: Visualization panel with Circle layout and Legend

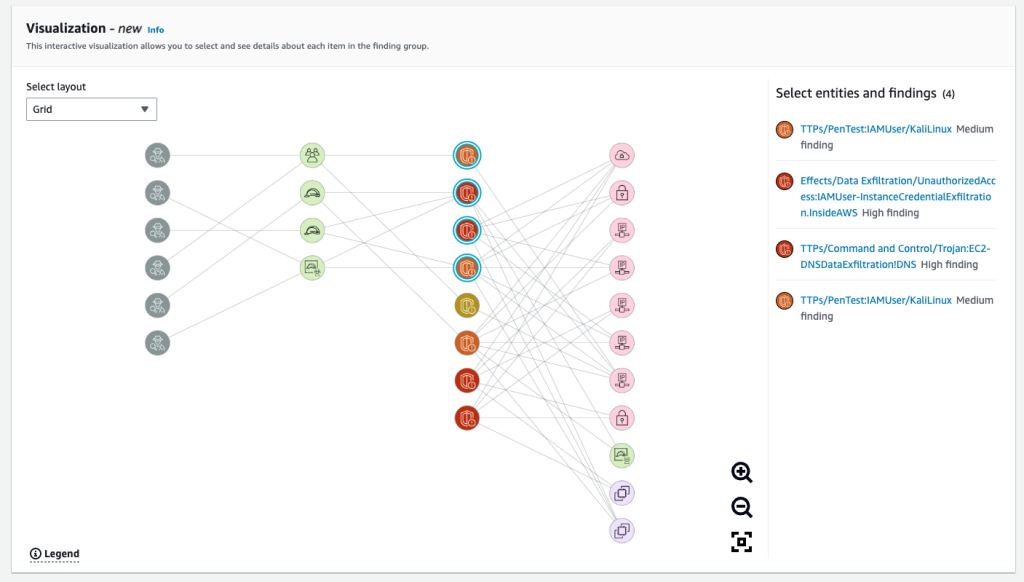
Figure 4 shows the Visualization panel with the Grid layout, where nodes are divided into four different columns: evidence, identity entities, GuardDuty findings, and other entities (compute, network, and storage).

Figure 4: Visualization panel with Grid layout

Figure 4: Visualization panel with Grid layout

In the Visualization panel, you can select one or more (using ctrl/cmd+click) nodes. Selected nodes are listed next to the graph, and you can select each node’s title for more information. Selecting an entity’s title opens a new page that displays detailed information about that entity, whereas selecting a finding or evidence expands the right sidebar to show details on the selected finding or evidence.

You can rearrange chosen entities and findings as needed to help improve your understanding of their connections. This can help speed up your assessment of findings. Figure 5 shows the Visualization panel with four nodes selected and the sidebar displaying information relevant to the selected finding.

Figure 5: Visualization panel with evidence selected

Figure 5: Visualization panel with evidence selected

Finding groups and visualizations provide an overview of the entities and resources related to a security activity. Presenting the information in this way highlights the interconnections between various activities. This means that you no longer have to use multiple tools or query different services to collect information or investigate entities and resources. This can help you reduce triage and scoping times and make your investigations faster and more comprehensive.

Increased flexibility for investigation with simpler data access

To expand the scope of your investigation or confirm if a security incident has taken place, you might want to combine data from Detective with your own tools or different services. This is where export data comes into play.

Detective has several Summary page panels that you can use as a starting point for your investigations because they highlight potentially suspicious activity. The panels include roles and users with the most API call volume, EC2 instances with the most traffic volume, and EKS clusters with the most Kubernetes pods created.

With export data, you can now export these panels as common-separated values (CSV) files and import the data into other AWS services or third-party applications, or manipulate the data with spreadsheet programs.

Export from the Detective console Summary screen

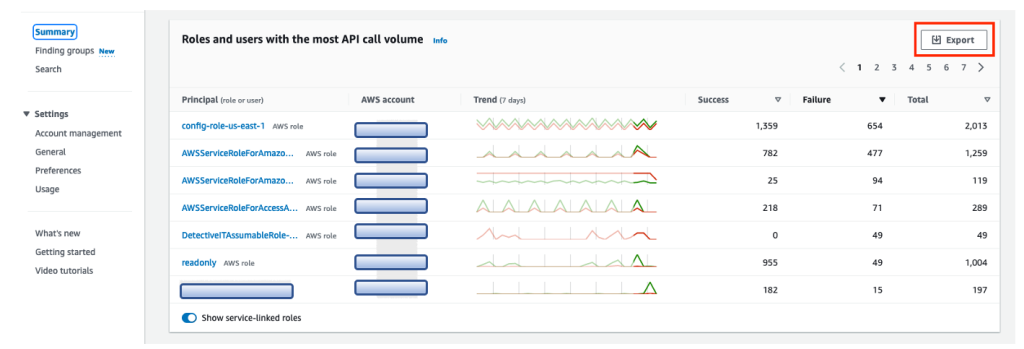
In the Detective console, on the Summary page, you will see an Export option on several summary panes. This is enabled and available for anyone with access to Detective. Figure 6 shows summary information for the roles and users with the most API call volume.

Figure 6: Detective console Summary screen

Figure 6: Detective console Summary screen

Choose Export to download a CSV file containing the data for the summary information. The file is downloaded to your browser’s default download folder on your local device. When you view the data, it will look something like the spreadsheet in Figure 7:

Figure 7: Example CSV data export from Detective console Summary

Figure 7: Example CSV data export from Detective console Summary

Export from the Detective console Search screen

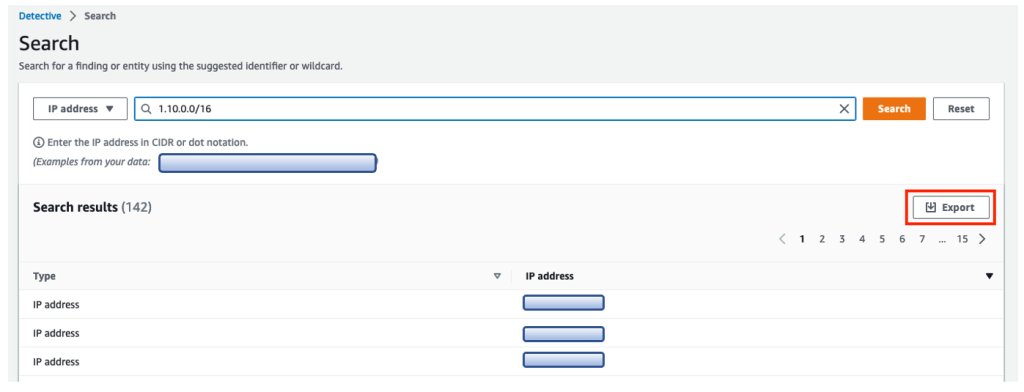
You can also export data using the Search capability of Detective. After you apply specific filters to search for findings or entities based on your use case, an Export button appears at the top of the search results in Detective. Figure 8 shows an example of filtering for a particular CIDR range. Choose Export to download the CSV file containing the filtered data.

Figure 8: Detective search results filtering for a CIDR range

Figure 8: Detective search results filtering for a CIDR range

Conclusion

In this blog post, you learned how to use the two new features of Detective to visualize findings and export data. By using these new features, you and your teams can investigate an incident in the way that best fits your workflow. New visualizations show the entities involved in an issue and surface nuanced connections that can be difficult to find when you’re faced with line after line of log data. The new data export feature makes it simpler to integrate the insights discovered in Detective with the tools and automations that your team is already using.

These features are automatically enabled for both existing and new customers in AWS Regions that support Detective. There is no additional charge for finding groups. If you don’t currently use Detective, you can start a free 30-day trial. For more information on finding groups, see Analyzing finding groups in the Amazon Detective User Guide.

If you have feedback about this post, submit comments in the Comments section below. You can also start a new thread on Amazon Detective re:Post or contact AWS Support.

Want more AWS Security news? Follow us on Twitter.

Alex Waddell

Alex Waddell

Alex is a Senior Security Specialist Solutions Architect at AWS based in Scotland. Alex provides security architectural guidance and operational best practices to customers of all sizes, helping them to implement AWS security services in the best way possible to keep their AWS workloads secure. Alex has been working in the security domain since 1999 and joined AWS in 2021. When he is not working, Alex enjoys spending time sampling rum from around the world (Alex is one of those rarely found Scottish people that doesn’t like whisky), walking his dogs in the local forest trails and traveling.

Nima Fotouhi

Nima Fotouhi

Nima is a Security Consultant. He’s a builder with passion for infrastructure as code (IaC) and policy as code (PaC), helping customer building secure infrastructure on AWS. In my spare time I love to hit the slopes and go snowboarding.

Rich Vorwaller

Rich Vorwaller

Rich is a Principal Product Manager of Amazon Detective. He boomerang to AWS with a passion for walking backwards from customer security problems. AWS is a great place for innovation and Rich is excited to dive deep on how customers are using AWS to strengthen their security posture in the cloud. In his spare time, Rich loves to read, travel, and perform a little bit of amateur stand up comedy.

Implement column-level encryption to protect sensitive data in Amazon Redshift with AWS Glue and AWS Lambda user-defined functions

Post Syndicated from Aaron Chong original https://aws.amazon.com/blogs/big-data/implement-column-level-encryption-to-protect-sensitive-data-in-amazon-redshift-with-aws-glue-and-aws-lambda-user-defined-functions/

Amazon Redshift is a massively parallel processing (MPP), fully managed petabyte-scale data warehouse that makes it simple and cost-effective to analyze all your data using existing business intelligence tools.

When businesses are modernizing their data warehousing solutions to Amazon Redshift, implementing additional data protection mechanisms for sensitive data, such as personally identifiable information (PII) or protected health information (PHI), is a common requirement, especially for those in highly regulated industries with strict data security and privacy mandates. Amazon Redshift provides role-based access control, row-level security, column-level security, and dynamic data masking, along with other database security features to enable organizations to enforce fine-grained data security.

Security-sensitive applications often require column-level (or field-level) encryption to enforce fine-grained protection of sensitive data on top of the default server-side encryption (namely data encryption at rest). In other words, sensitive data should be always encrypted on disk and remain encrypted in memory, until users with proper permissions request to decrypt the data. Column-level encryption provides an additional layer of security to protect your sensitive data throughout system processing so that only certain users or applications can access it. This encryption ensures that only authorized principals that need the data, and have the required credentials to decrypt it, are able to do so.

In this post, we demonstrate how you can implement your own column-level encryption mechanism in Amazon Redshift using AWS Glue to encrypt sensitive data before loading data into Amazon Redshift, and using AWS Lambda as a user-defined function (UDF) in Amazon Redshift to decrypt the data using standard SQL statements. Lambda UDFs can be written in any of the programming languages supported by Lambda, such as Java, Go, PowerShell, Node.js, C#, Python, Ruby, or a custom runtime. You can use Lambda UDFs in any SQL statement such as SELECT, UPDATE, INSERT, or DELETE, and in any clause of the SQL statements where scalar functions are allowed.

Solution overview

The following diagram describes the solution architecture.

Architecture Diagram

To illustrate how to set up this architecture, we walk you through the following steps:

  1. We upload a sample data file containing synthetic PII data to an Amazon Simple Storage Service (Amazon S3) bucket.
  2. A sample 256-bit data encryption key is generated and securely stored using AWS Secrets Manager.
  3. An AWS Glue job reads the data file from the S3 bucket, retrieves the data encryption key from Secrets Manager, performs data encryption for the PII columns, and loads the processed dataset into an Amazon Redshift table.
  4. We create a Lambda function to reference the same data encryption key from Secrets Manager, and implement data decryption logic for the received payload data.
  5. The Lambda function is registered as a Lambda UDF with a proper AWS Identity and Access Management (IAM) role that the Amazon Redshift cluster is authorized to assume.
  6. We can validate the data decryption functionality by issuing sample queries using Amazon Redshift Query Editor v2.0. You may optionally choose to test it with your own SQL client or business intelligence tools.

Prerequisites

To deploy the solution, make sure to complete the following prerequisites:

  • Have an AWS account. For this post, you configure the required AWS resources using AWS CloudFormation in the us-east-2 Region.
  • Have an IAM user with permissions to manage AWS resources including Amazon S3, AWS Glue, Amazon Redshift, Secrets Manager, Lambda, and AWS Cloud9.

Deploy the solution using AWS CloudFormation

Provision the required AWS resources using a CloudFormation template by completing the following steps:

  1. Sign in to your AWS account.
  2. Choose Launch Stack:
    Launch Button
  3. Navigate to an AWS Region (for example, us-east-2).
  4. For Stack name, enter a name for the stack or leave as default (aws-blog-redshift-column-level-encryption).
  5. For RedshiftMasterUsername, enter a user name for the admin user account of the Amazon Redshift cluster or leave as default (master).
  6. For RedshiftMasterUserPassword, enter a strong password for the admin user account of the Amazon Redshift cluster.
  7. Select I acknowledge that AWS CloudFormation might create IAM resources.
  8. Choose Create stack.
    Create CloudFormation stack

The CloudFormation stack creation process takes around 5–10 minutes to complete.

  1. When the stack creation is complete, on the stack Outputs tab, record the values of the following:
    1. AWSCloud9IDE
    2. AmazonS3BucketForDataUpload
    3. IAMRoleForRedshiftLambdaUDF
    4. LambdaFunctionName

CloudFormation stack output

Upload the sample data file to Amazon S3

To test the column-level encryption capability, you can download the sample synthetic data generated by Mockaroo. The sample dataset contains synthetic PII and sensitive fields such as phone number, email address, and credit card number. In this post, we demonstrate how to encrypt the credit card number field, but you can apply the same method to other PII fields according to your own requirements.

Sample synthetic data

An AWS Cloud9 instance is provisioned for you during the CloudFormation stack setup. You may access the instance from the AWS Cloud9 console, or by visiting the URL obtained from the CloudFormation stack output with the key AWSCloud9IDE.

CloudFormation stack output for AWSCloud9IDE

On the AWS Cloud9 terminal, copy the sample dataset to your S3 bucket by running the following command:

S3_BUCKET=$(aws s3 ls| awk '{print $3}'| grep awsblog-pii-data-input-)
aws s3 cp s3://aws-blogs-artifacts-public/artifacts/BDB-2274/pii-sample-dataset.csv s3://$S3_BUCKET/

Upload sample dataset to S3

Generate a secret and secure it using Secrets Manager

We generate a 256-bit secret to be used as the data encryption key. Complete the following steps:

  1. Create a new file in the AWS Cloud9 environment.
    Create new file in Cloud9
  2. Enter the following code snippet. We use the cryptography package to create a secret, and use the AWS SDK for Python (Boto3) to securely store the secret value with Secrets Manager:
    from cryptography.fernet import Fernet
    import boto3
    import base64
    
    key = Fernet.generate_key()
    client = boto3.client('secretsmanager')
    
    response = client.create_secret(
        Name='data-encryption-key',
        SecretBinary=base64.urlsafe_b64decode(key)
    )
    
    print(response['ARN'])

  3. Save the file with the file name generate_secret.py (or any desired name ending with .py).
    Save file in Cloud9
  4. Install the required packages by running the following pip install command in the terminal:
    pip install --user boto3
    pip install --user cryptography

  5. Run the Python script via the following command to generate the secret:
    python generate_secret.py

    Run Python script

Create a target table in Amazon Redshift

A single-node Amazon Redshift cluster is provisioned for you during the CloudFormation stack setup. To create the target table for storing the dataset with encrypted PII columns, complete the following steps:

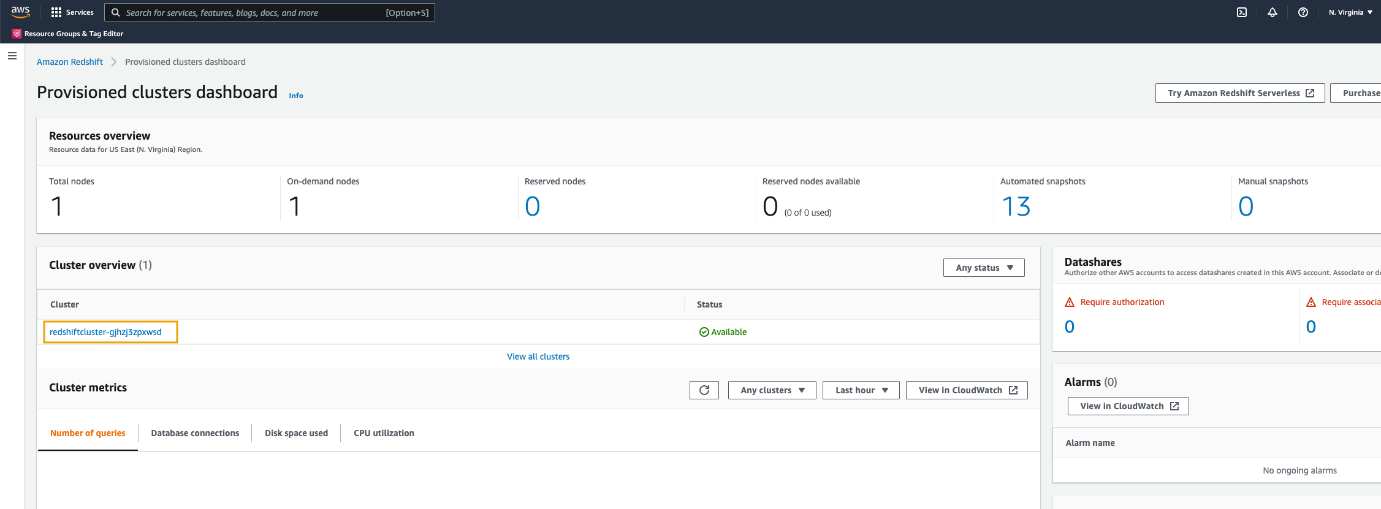
  1. On the Amazon Redshift console, navigate to the list of provisioned clusters, and choose your cluster.
    Amazon Redshift console
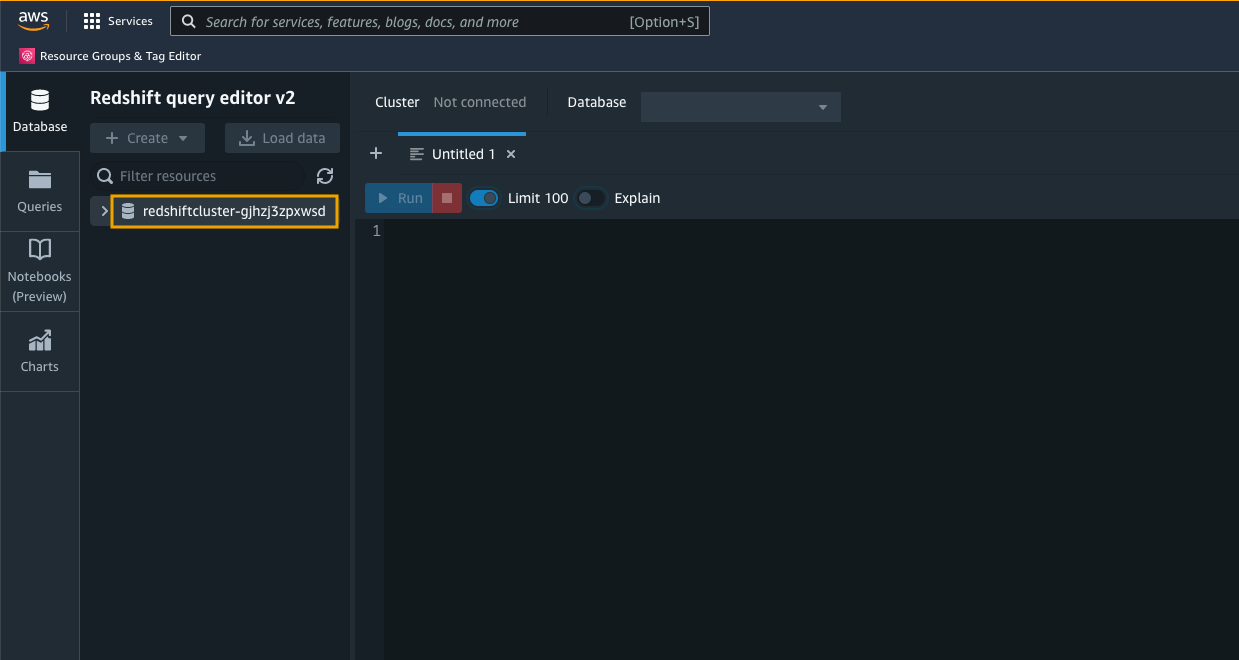
  2. To connect to the cluster, on the Query data drop-down menu, choose Query in query editor v2.
    Connect with Query Editor v2
  3. If this is the first time you’re using the Amazon Redshift Query Editor V2, accept the default setting by choosing Configure account.
    Configure account
  4. To connect to the cluster, choose the cluster name.
    Connect to Amazon Redshift cluster
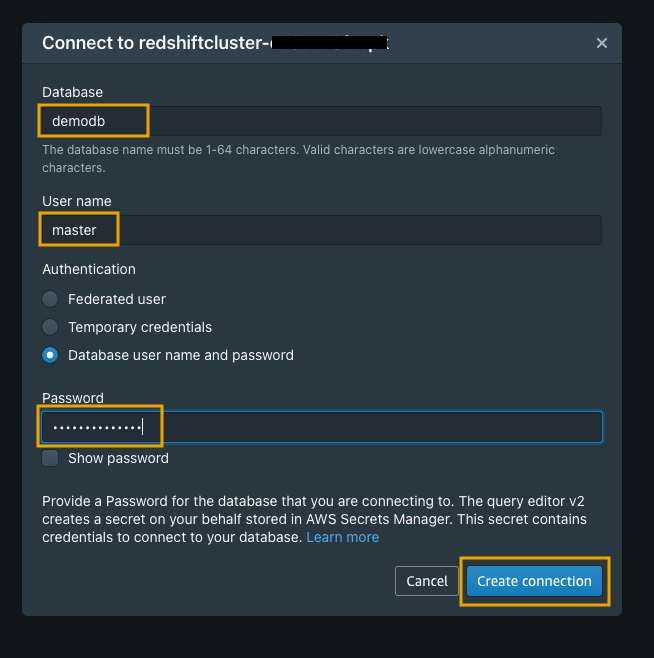
  5. For Database, enter demodb.
  6. For User name, enter master.
  7. For Password, enter your password.

You may need to change the user name and password according to your CloudFormation settings.

  1. Choose Create connection.
    Create Amazon Redshift connection
  2. In the query editor, run the following DDL command to create a table named pii_table:
    CREATE TABLE pii_table(
      id BIGINT,
      full_name VARCHAR(50),
      gender VARCHAR(10),
      job_title VARCHAR(50),
      spoken_language VARCHAR(50),
      contact_phone_number VARCHAR(20),
      email_address VARCHAR(50),
      registered_credit_card VARCHAR(50)
    );

We recommend using the smallest possible column size as a best practice, and you may need to modify these table definitions per your specific use case. Creating columns much larger than necessary will have an impact on the size of data tables and affect query performance.

Create Amazon Redshift table

Create the source and destination Data Catalog tables in AWS Glue

The CloudFormation stack provisioned two AWS Glue data crawlers: one for the Amazon S3 data source and one for the Amazon Redshift data source. To run the crawlers, complete the following steps:

  1. On the AWS Glue console, choose Crawlers in the navigation pane.
    AWS Glue Crawlers
  2. Select the crawler named glue-s3-crawler, then choose Run crawler to trigger the crawler job.
    Run Amazon S3 crawler job
  3. Select the crawler named glue-redshift-crawler, then choose Run crawler.
    Run Amazon Redshift crawler job

When the crawlers are complete, navigate to the Tables page to verify your results. You should see two tables registered under the demodb database.

AWS Glue database tables

Author an AWS Glue ETL job to perform data encryption

An AWS Glue job is provisioned for you as part of the CloudFormation stack setup, but the extract, transform, and load (ETL) script has not been created. We create and upload the ETL script to the /glue-script folder under the provisioned S3 bucket in order to run the AWS Glue job.

  1. Return to your AWS Cloud9 environment either via the AWS Cloud9 console, or by visiting the URL obtained from the CloudFormation stack output with the key AWSCloud9IDE.
    CloudFormation stack output for AWSCloud9IDE

We use the Miscreant package for implementing a deterministic encryption using the AES-SIV encryption algorithm, which means that for any given plain text value, the generated encrypted value will be always the same. The benefit of using this encryption approach is to allow for point lookups, equality joins, grouping, and indexing on encrypted columns. However, you should also be aware of the potential security implication when applying deterministic encryption to low-cardinality data, such as gender, boolean values, and status flags.

  1. Create a new file in the AWS Cloud9 environment and enter the following code snippet:
    import sys
    from awsglue.transforms import *
    from awsglue.utils import getResolvedOptions
    from pyspark.context import SparkContext
    from awsglue.context import GlueContext
    from awsglue.job import Job
    from awsglue.dynamicframe import DynamicFrameCollection
    from awsglue.dynamicframe import DynamicFrame
    
    import boto3
    import base64
    from miscreant.aes.siv import SIV
    from pyspark.sql.functions import udf, col
    from pyspark.sql.types import StringType
    
    args = getResolvedOptions(sys.argv, ["JOB_NAME", "SecretName", "InputTable"])
    sc = SparkContext()
    glueContext = GlueContext(sc)
    spark = glueContext.spark_session
    job = Job(glueContext)
    job.init(args["JOB_NAME"], args)
    
    # retrieve the data encryption key from Secrets Manager
    secret_name = args["SecretName"]
    
    sm_client = boto3.client('secretsmanager')
    get_secret_value_response = sm_client.get_secret_value(SecretId = secret_name)
    data_encryption_key = get_secret_value_response['SecretBinary']
    siv = SIV(data_encryption_key)  # Without nonce, the encryption becomes deterministic
    
    # define the data encryption function
    def pii_encrypt(value):
        if value is None:
            value = ""
        ciphertext = siv.seal(value.encode())
        return base64.b64encode(ciphertext).decode('utf-8')
    
    # register the data encryption function as Spark SQL UDF   
    udf_pii_encrypt = udf(lambda z: pii_encrypt(z), StringType())
    
    # define the Glue Custom Transform function
    def Encrypt_PII (glueContext, dfc) -> DynamicFrameCollection:
        newdf = dfc.select(list(dfc.keys())[0]).toDF()
        
        # PII fields to be encrypted
        pii_col_list = ["registered_credit_card"]
    
        for pii_col_name in pii_col_list:
            newdf = newdf.withColumn(pii_col_name, udf_pii_encrypt(col(pii_col_name)))
    
        encrypteddyc = DynamicFrame.fromDF(newdf, glueContext, "encrypted_data")
        return (DynamicFrameCollection({"CustomTransform0": encrypteddyc}, glueContext))
    
    # Script generated for node S3 bucket
    S3bucket_node1 = glueContext.create_dynamic_frame.from_catalog(
        database="demodb",
        table_name=args["InputTable"],
        transformation_ctx="S3bucket_node1",
    )
    
    # Script generated for node ApplyMapping
    ApplyMapping_node2 = ApplyMapping.apply(
        frame=S3bucket_node1,
        mappings=[
            ("id", "long", "id", "long"),
            ("full_name", "string", "full_name", "string"),
            ("gender", "string", "gender", "string"),
            ("job_title", "string", "job_title", "string"),
            ("spoken_language", "string", "spoken_language", "string"),
            ("contact_phone_number", "string", "contact_phone_number", "string"),
            ("email_address", "string", "email_address", "string"),
            ("registered_credit_card", "long", "registered_credit_card", "string"),
        ],
        transformation_ctx="ApplyMapping_node2",
    )
    
    # Custom Transform
    Customtransform_node = Encrypt_PII(glueContext, DynamicFrameCollection({"ApplyMapping_node2": ApplyMapping_node2}, glueContext))
    
    # Script generated for node Redshift Cluster
    RedshiftCluster_node3 = glueContext.write_dynamic_frame.from_catalog(
        frame=Customtransform_node,
        database="demodb",
        table_name="demodb_public_pii_table",
        redshift_tmp_dir=args["TempDir"],
        transformation_ctx="RedshiftCluster_node3",
    )
    
    job.commit()

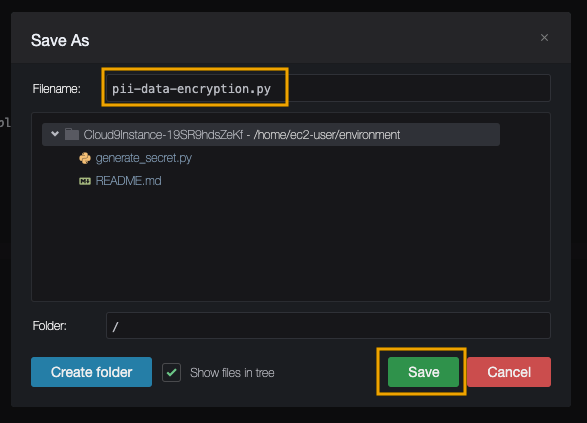
  2. Save the script with the file name pii-data-encryption.py.
    Save file in Cloud9
  3. Copy the script to the desired S3 bucket location by running the following command:
    S3_BUCKET=$(aws s3 ls| awk '{print $3}'| grep awsblog-pii-data-input-)
    aws s3 cp pii-data-encryption.py s3://$S3_BUCKET/glue-script/pii-data-encryption.py

    Upload AWS Glue script to S3

  4. To verify the script is uploaded successfully, navigate to the Jobs page on the AWS Glue console.You should be able to find a job named pii-data-encryption-job.
    AWS Glue console
  5. Choose Run to trigger the AWS Glue job.It will first read the source data from the S3 bucket registered in the AWS Glue Data Catalog, then apply column mappings to transform data into the expected data types, followed by performing PII fields encryption, and finally loading the encrypted data into the target Redshift table. The whole process should be completed within 5 minutes for this sample dataset.AWS Glue job scriptYou can switch to the Runs tab to monitor the job status.
    Monitor AWS Glue job

Configure a Lambda function to perform data decryption

A Lambda function with the data decryption logic is deployed for you during the CloudFormation stack setup. You can find the function on the Lambda console.

AWS Lambda console

The following is the Python code used in the Lambda function:

import boto3
import os
import json
import base64
import logging
from miscreant.aes.siv import SIV

logger = logging.getLogger()
logger.setLevel(logging.INFO)

secret_name = os.environ['DATA_ENCRYPT_KEY']

sm_client = boto3.client('secretsmanager')
get_secret_value_response = sm_client.get_secret_value(SecretId = secret_name)
data_encryption_key = get_secret_value_response['SecretBinary']

siv = SIV(data_encryption_key)  # Without nonce, the encryption becomes deterministic

# define lambda function logic
def lambda_handler(event, context):
    ret = dict()
    res = []
    for argument in event['arguments']:
        encrypted_value = argument[0]
        try:
            de_val = siv.open(base64.b64decode(encrypted_value)) # perform decryption
        except:
            de_val = encrypted_value
            logger.warning('Decryption for value failed: ' + str(encrypted_value)) 
        res.append(json.dumps(de_val.decode('utf-8')))

    ret['success'] = True
    ret['results'] = res

    return json.dumps(ret) # return decrypted results

If you want to deploy the Lambda function on your own, make sure to include the Miscreant package in your deployment package.

Register a Lambda UDF in Amazon Redshift

You can create Lambda UDFs that use custom functions defined in Lambda as part of your SQL queries. Lambda UDFs are managed in Lambda, and you can control the access privileges to invoke these UDFs in Amazon Redshift.

  1. Navigate back to the Amazon Redshift Query Editor V2 to register the Lambda UDF.
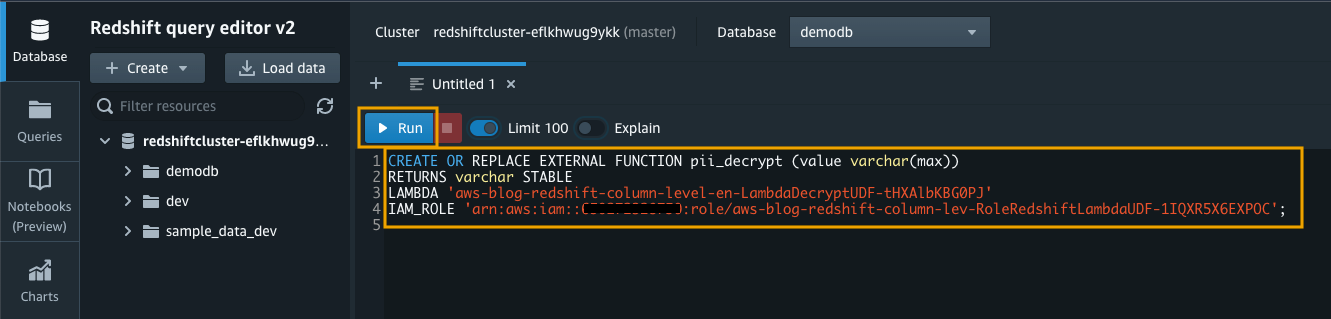
  2. Use the CREATE EXTERNAL FUNCTION command and provide an IAM role that the Amazon Redshift cluster is authorized to assume and make calls to Lambda:
    CREATE OR REPLACE EXTERNAL FUNCTION pii_decrypt (value varchar(max))
    RETURNS varchar STABLE
    LAMBDA '<--Replace-with-your-lambda-function-name-->'
    IAM_ROLE '<--Replace-with-your-redshift-lambda-iam-role-arn-->';

You can find the Lambda name and Amazon Redshift IAM role on the CloudFormation stack Outputs tab:

  • LambdaFunctionName
  • IAMRoleForRedshiftLambdaUDF

CloudFormation stack output
Create External Function in Amazon Redshift

Validate the column-level encryption functionality in Amazon Redshift

By default, permission to run new Lambda UDFs is granted to PUBLIC. To restrict usage of the newly created UDF, revoke the permission from PUBLIC and then grant the privilege to specific users or groups. To learn more about Lambda UDF security and privileges, see Managing Lambda UDF security and privileges.

You must be a superuser or have the sys:secadmin role to run the following SQL statements:

GRANT SELECT ON "demodb"."public"."pii_table" TO PUBLIC;
CREATE USER regular_user WITH PASSWORD '1234Test!';
CREATE USER privileged_user WITH PASSWORD '1234Test!';
REVOKE EXECUTE ON FUNCTION pii_decrypt(varchar) FROM PUBLIC;
GRANT EXECUTE ON FUNCTION pii_decrypt(varchar) TO privileged_user;

First, we run a SELECT statement to verify that our highly sensitive data field, in this case the registered_credit_card column, is now encrypted in the Amazon Redshift table:

SELECT * FROM "demodb"."public"."pii_table";

Select statement

For regular database users who have not been granted the permission to use the Lambda UDF, they will see a permission denied error when they try to use the pii_decrypt() function:

SET SESSION AUTHORIZATION regular_user;
SELECT *, pii_decrypt(registered_credit_card) AS decrypted_credit_card FROM "demodb"."public"."pii_table";

Permission denied

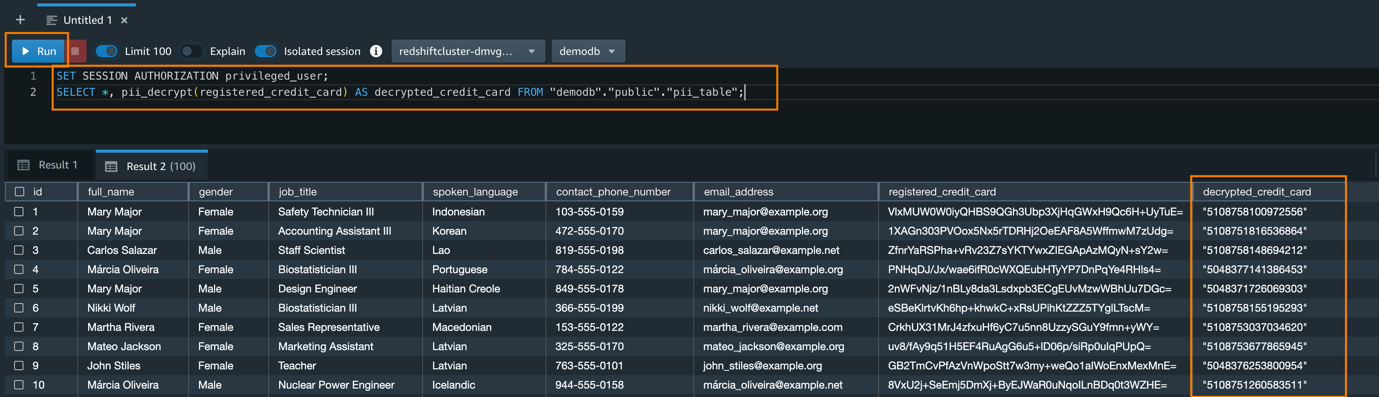
For privileged database users who have been granted the permission to use the Lambda UDF for decrypting the data, they can issue a SQL statement using the pii_decrypt() function:

SET SESSION AUTHORIZATION privileged_user;
SELECT *, pii_decrypt(registered_credit_card) AS decrypted_credit_card FROM "demodb"."public"."pii_table";

The original registered_credit_card values can be successfully retrieved, as shown in the decrypted_credit_card column.

Decrypted results

Cleaning up

To avoid incurring future charges, make sure to clean up all the AWS resources that you created as part of this post.

You can delete the CloudFormation stack on the AWS CloudFormation console or via the AWS Command Line Interface (AWS CLI). The default stack name is aws-blog-redshift-column-level-encryption.

Conclusion

In this post, we demonstrated how to implement a custom column-level encryption solution for Amazon Redshift, which provides an additional layer of protection for sensitive data stored on the cloud data warehouse. The CloudFormation template gives you an easy way to set up the data pipeline, which you can further customize for your specific business scenarios. You can also modify the AWS Glue ETL code to encrypt multiple data fields at the same time, and to use different data encryption keys for different columns for enhanced data security. With this solution, you can limit the occasions where human actors can access sensitive data stored in plain text on the data warehouse.

You can learn more about this solution and the source code by visiting the GitHub repository. To learn more about how to use Amazon Redshift UDFs to solve different business problems, refer to Example uses of user-defined functions (UDFs) and Amazon Redshift UDFs.


About the Author

Aaron ChongAaron Chong is an Enterprise Solutions Architect at Amazon Web Services Hong Kong. He specializes in the data analytics domain, and works with a wide range of customers to build big data analytics platforms, modernize data engineering practices, and advocate AI/ML democratization.

Showpad accelerates data maturity to unlock innovation using Amazon QuickSight

Post Syndicated from Shruthi Panicker original https://aws.amazon.com/blogs/big-data/showpad-accelerates-data-maturity-to-unlock-innovation-using-amazon-quicksight/

Showpad aligns sales and marketing teams around impactful content and powerful training, helping sellers engage with buyers and generate the insights needed to continuously improve conversion rates. In 2021, Showpad set forth the vision to use the power of data to unlock innovations and drive business decisions across its organization. Showpad’s legacy solution was fragmented and expensive, with different tools providing conflicting insights and lengthening time to insight. The company decided to use AWS to unify its business intelligence (BI) and reporting strategy for both internal organization-wide use cases and in-product embedded analytics targeted at its customers.

Showpad built new customer-facing embedded dashboards within Showpad eOSTM and migrated its legacy dashboards to Amazon QuickSight, a unified BI service providing modern interactive dashboards, natural language querying, paginated reports, machine learning (ML) insights, and embedded analytics at scale.

In this post, we share how Showpad used QuickSight to streamline data and insights access across teams and customers. Showpad migrated over 70 dashboards with over 1,000 visuals. They have rolled out the solution to all its 600 employees, increased dashboard development activity by three times, and reduced dashboard turnaround time from months to weeks. Showpad also launched dashboards and reports to over 1,300 customers worldwide, providing access to tens of thousands of users across all its customers.

Streamlining data-driven decisions by defragmenting the data and reporting architecture

Founded in 2011, dual headquartered in Belgium and Chicago and with offices around the world, Showpad provides a single destination for sales representatives to access all sales content and information, along with coaching and training tools to create informed, upskilled, and trusted buying teams. The platform also provides analytics and insights to support successful information sharing and fuel continuous improvement. In 2021, Showpad decided to take the next step in its data evolution and set forth the vision to power innovation, product decisions, and customer engagement using data-driven insights. This required Showpad to accelerate its data maturity as a company by mindfully using data and technology holistically to help its customers.

But the company’s legacy BI solution and data were fragmented across multiple tools, some with proprietary logic. “Each of these tools were getting data from a different place, and that’s where it gets difficult,” says Jeroen Minnaert, head of data at Showpad. “If each tool tells a different story because it has different data, we won’t have alignment within the business on what this data means.” Showpad also struggled with data quality issues in terms of consistency, ownership, and insufficient data access across its targeted user base due to a complex BI access process, licensing challenges, and insufficient education.

Showpad wanted to unify all the data into a single unified interface through a data lake, democratize that data through a BI solution such that autonomous teams across the company could effectively use data, and drive and unlock innovation in the company through advanced insights data, artificial intelligence, and ML. The company already used AWS in other aspects of its business and found that QuickSight would not only meet all its BI and reporting needs with seamless integrations into the AWS stack, but also bring with it several unique benefits unlike incumbents and other tools evaluated. “We chose QuickSight because of its embedded analytic capabilities, serverless architecture, and consumption-based pricing,” says Minnaert. “Using QuickSight to launch interactive dashboards and reporting for our customers, along with the ability for our customer success teams to create or alter dashboard prototypes on our internal-facing QuickSight instance and then promote those dashboards to customers through the product, was a very compelling use case.”

QuickSight would help local data stewards, who weren’t technical but knew the use cases intimately, to create their own dashboards and prototype them with their customers before promoting them through the product. “The serverless model was also compelling because we did not have to pay for server instances nor license fees per reader. With QuickSight, we pay for usage. This makes it easy for us to provide access to everyone by default. This is a key pillar in our ability to democratize data,” says Minnaert.

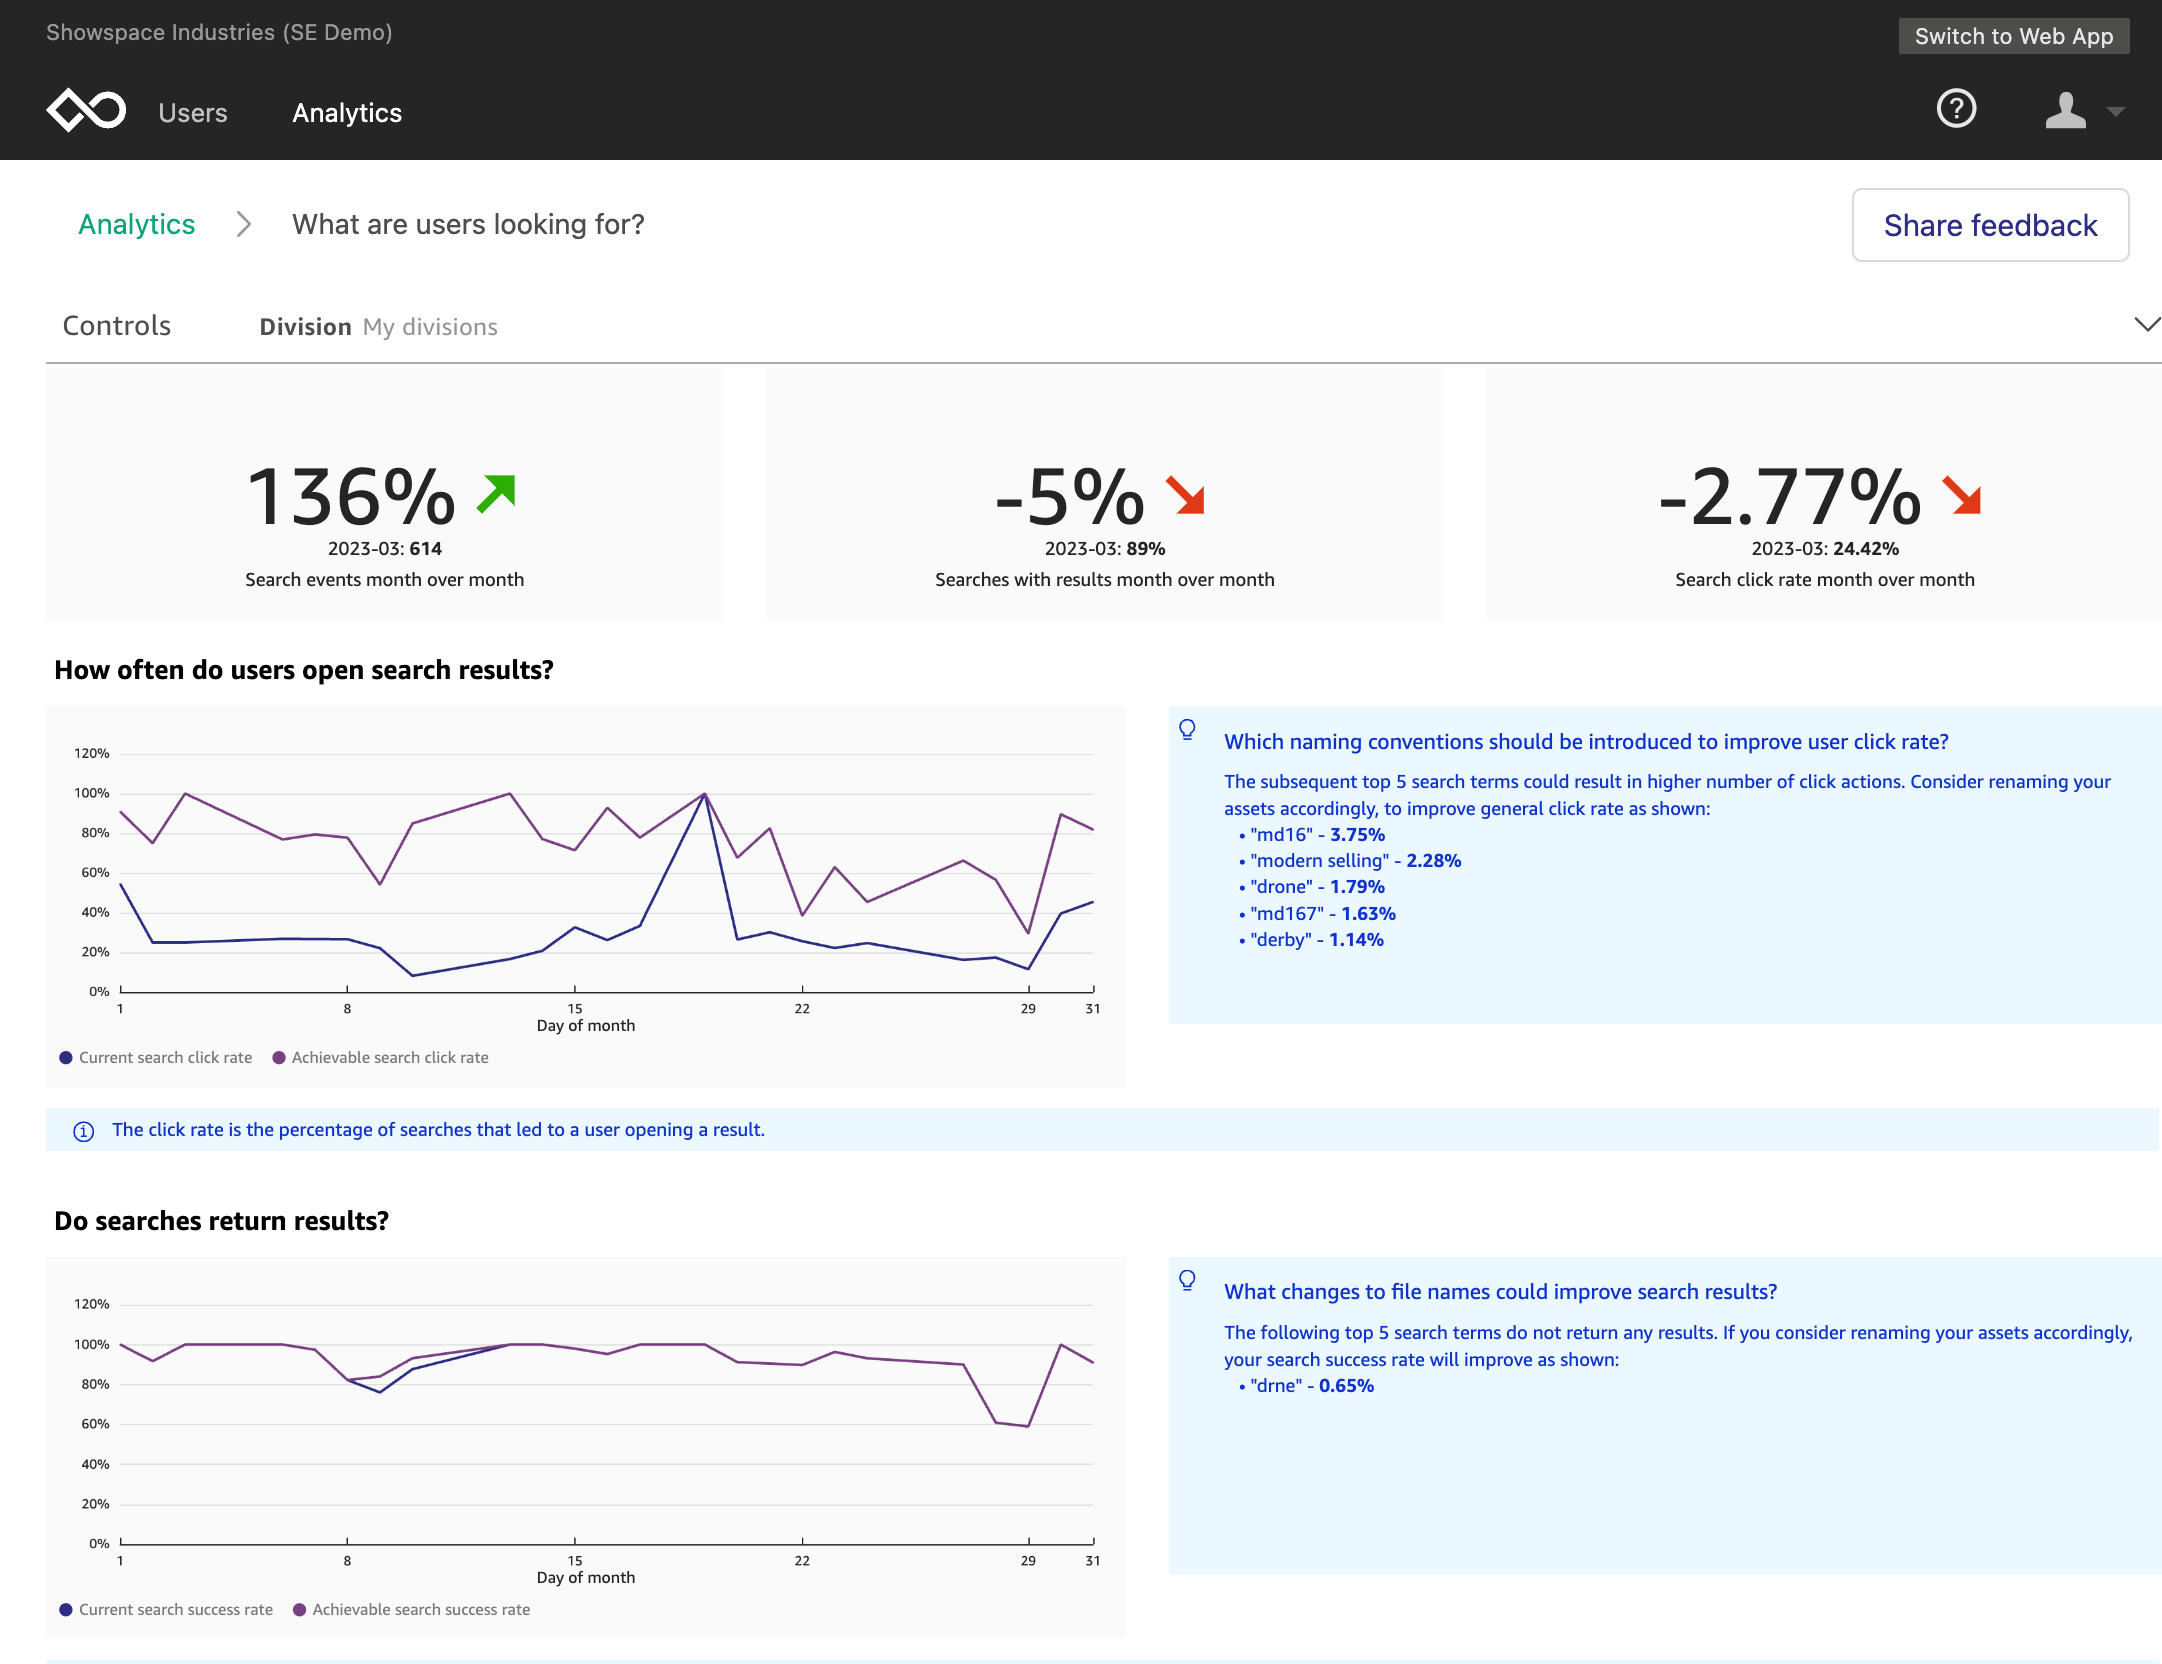
A screenshot of Showpad's Platform/Adoption dashboard

Architecting a portable data layer and migrating to QuickSight to accelerate time to value

After choosing QuickSight as its solution in November 2021, Showpad took on two streams of development: migrating internal organization-wide BI reporting and building in-product reporting using embedded analytics. Showpad worked closely alongside the QuickSight team to have a smooth rollout. The company involved members of the QuickSight team in its internal communications and set up meetings every 2 weeks to resolve difficult issues quickly.

On the internal reporting front, the data team took a “working backwards” approach to make sure it had the right approach before going all in with all existing dashboards. Showpad selected five difficult and complex dashboards and took 3 months to explore various possibilities using QuickSight. For example, the team determined that user log-in would be automated with single sign-on and Okta and built a plan for assets organization, asset promotion, and access controls. The company also used the opportunity to reimagine its data pipeline and architecture. A key architectural decision that Showpad took during this time was to create a portable data layer by decoupling the data transformation from visualization, ML, or ad hoc querying tools and centralizing its business logic. The portable data layer facilitated the creation of data products for varied use cases, made available within various tools based on the need of the consumer—be it a business analyst, data scientist, or business user.

After the solution approach was decided on and the foundation was built, the team wanted to scale. However, with 70 dashboards with over 1,000 visuals with varying levels of complexities, including proprietary logic unique to certain tools, and data from over 1,000 tables ingesting data from over 20 data sources, the team decided to take a measured approach to the migration. The entire data team of 20 people were “all on hands on deck” for the project.

First, Showpad created a landscape of all the dashboards, connecting data sources and dependencies before prioritizing the migration order. The company decided to start with dashboards with the fewest dependencies, like product and engineering dashboards that had a single data source, followed by revenue operations dashboards with a couple of data sources, and lastly with customer success and marketing dashboards that combined product and engineering and revenue operations data. After migration was complete, Showpad validated all the numbers and worked with business stakeholders for quality assurance. It launched the first set of dashboards in April 2022, followed by customer success and marketing dashboards in July 2022. As of January 2023, Showpad’s QuickSight instance includes over 2,433 datasets and 199 dashboards.

Showpad also achieves benefits for its customers by using QuickSight to deliver a wide variety of insights, including usage dashboards, industry comparisons, user comparison, group comparison, and revenue attribution. On the second workstream of in-product customer-facing reporting, Showpad released its first version of QuickSight reporting to customers in June 2022. “We went through user research, development, and beta tests in a span of 6 months, which was a fast turnaround and a big win for us,” says Minnaert. And Showpad aims to further accelerate the turnaround time to make a report and ship it to a customer.

With the foundational architecture now in place, shipping to a customer can happen in a few sprints, with most of the time spent on iterating and fine-tuning insights instead of engineering a scalable reporting solution. Showpad can also improve the insights it offers to customers. “Using QuickSight in our product makes it a powerful tool,” says Minnaert. “We can launch reporting for our customers so that they can look at and interpret data by themselves.” Showpad can then follow up with tailor-made reporting for each customer using the same data so that it tells a consistent story.

After a dashboard is agreed on, the dashboard can go through Showpad’s automated dashboard promotion process that can take an idea from development to production to a smile on a customer’s face in weeks, not months.

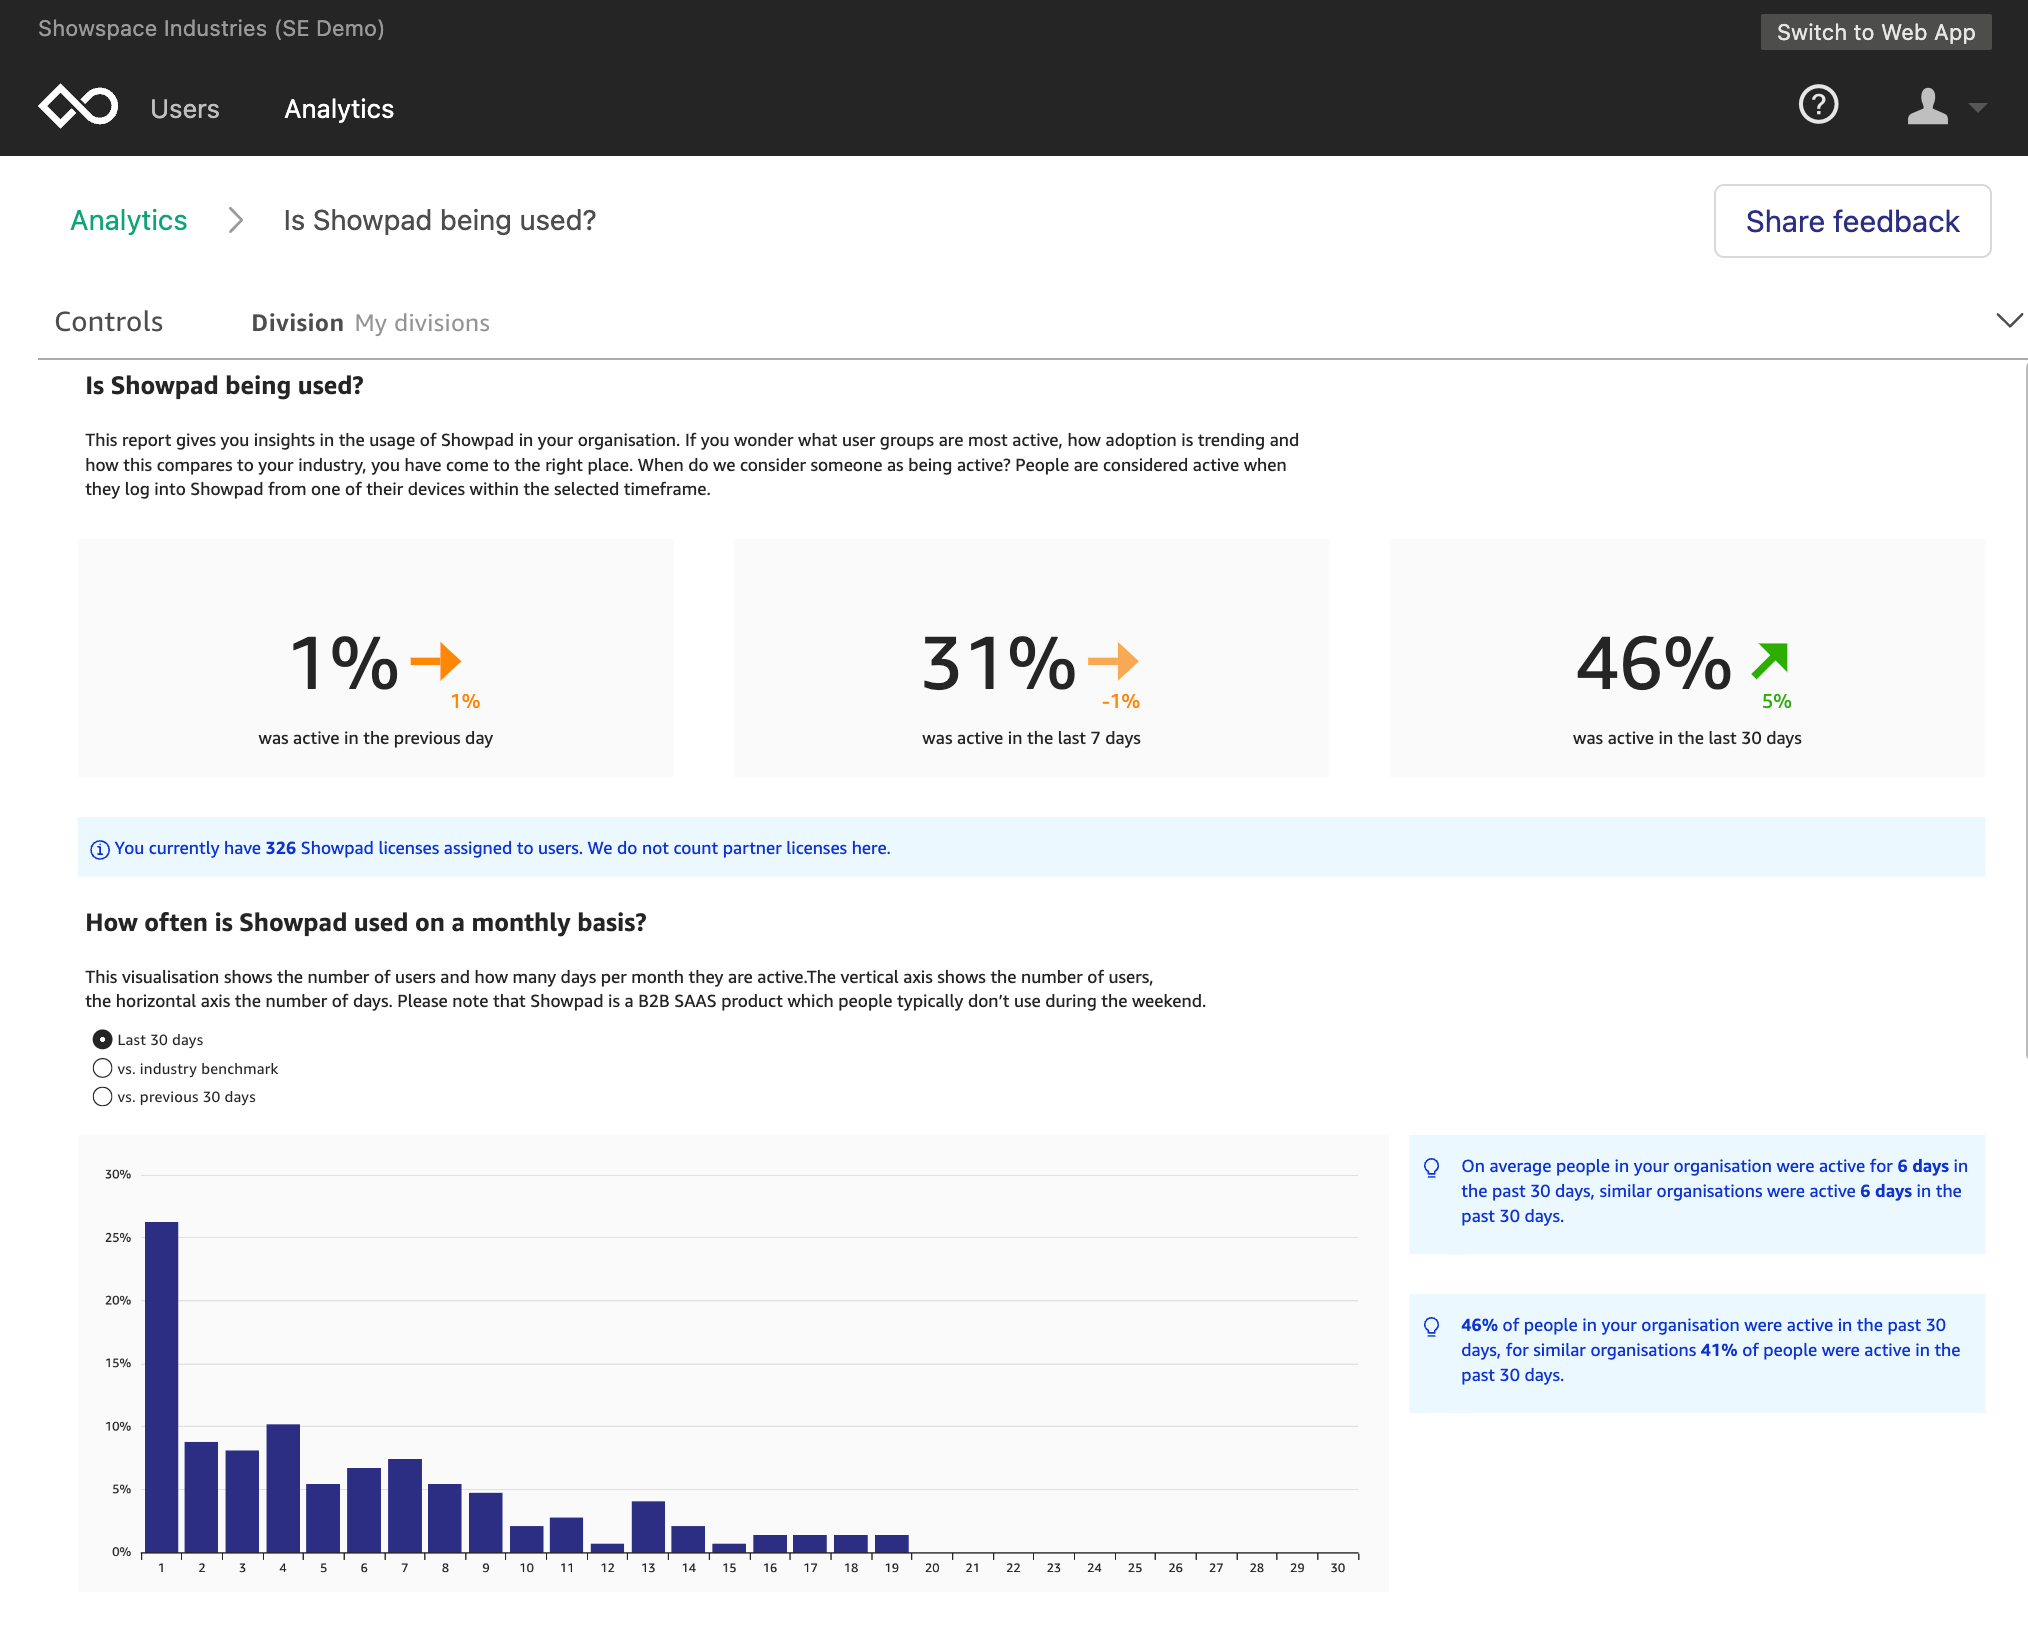
A screenshot of their Shared Space engagement dashboard

Unlocking innovation with self-service BI and rapid prototyping

By providing dashboard and report building to analysts and nontechnical users, Showpad drastically reduced overall turnaround time to build and deliver insights, down from months to weeks. Showpad also increased dashboard development activity by three times across the organization.

Showpad users can quickly prototype reports in a well-known environment—building reports using QuickSight, and then testing them with customers by helping customers understand how the reporting would look and function. “After we settle on reports or dashboards, it does not take much engineering effort to bring them to production,” says Minnaert. “We can make a lot of innovation happen by quickly prototyping and bringing validated prototypes to production.” Showpad’s users and customers also benefit from performance gains with 10 times increased speed when using SPICE (Super-fast, Parallel, In-memory Calculation Engine), which is the robust in-memory engine that QuickSight uses. It takes only seconds to load dashboards.

Because QuickSight is serverless and uses a session-based pricing model, Showpad expects to see cost savings. By paying per use, Showpad can easily provide access to all its users and customers without purchasing expensive per-reader licenses. Showpad also doesn’t need to pay for server instances or maintain infrastructure for BI. In addition, Showpad can deprecate custom reporting, infrastructure, and multiple tools with the new data architecture and QuickSight. “Much of our cost savings will come from being able to deprecate the custom reporting that we’ve made in the past,” says Minnaert. “The custom reporting used a lot of infrastructure that we no longer need to maintain.” Showpad expects to see a three times increase in projected return on investment in the upcoming year.

Showpad completed its internal BI migration to QuickSight by the end of 2022. Showpad also continues to expand the in-product reporting while continuing to optimize performance for the best customer experience. Showpad hopes to further reduce the time it takes to load a dashboard to under 1 second.

In conjunction with Showpad’s new portable data layer, QuickSight helps users of all types across its organization and customers self-serve data and insights rapidly. Everyone in Showpad gets access to data and insights the day they onboard with Showpad. To make self-service even easier, Showpad will soon launch embedded Amazon QuickSight Q so anyone can ask questions in natural language and receive accurate answers with relevant visualizations that help them gain insights from the data. By helping business users and experts rapidly prototype dashboards and reports in line with user and customer needs, Showpad uses the power of data to unlock innovation and drive growth across its organization. “QuickSight has become our go-to tool for any BI requirement at Showpad—both internal and external customer facing, especially when it comes to correlating data across departments and business units,” says Minnaert.

Get started with QuickSight

Migrating to QuickSight enabled Showpad to streamline data and insights access across teams and customers and reduced overall turnaround time to build and deliver insights from months to weeks.

Learn more about unleashing your organization’s ability to accelerate revenue growth with Showpad. To learn more about how QuickSight can help your business with dashboards, reports, and more, visit Amazon QuickSight.


About the Author

Shruthi Panicker is a Senior Product Marketing Manager with Amazon QuickSight at AWS. As an engineer turned product marketer, Shruthi has spent over 15 years in the technology industry in various roles from software engineering, to solution architecting to product marketing. She is passionate about working at the intersection of technology and business to tell great product stories that help drive customer value.

MLPerf Inference v3.0 Shows New Accelerators

Post Syndicated from Cliff Robinson original https://www.servethehome.com/mlperf-inference-v3-0-is-out-nvidia-dell-super-micro-moffett-amd-intel-gigabyte-qualcomm-hpe/

MLPerf Inference v3.0 is out with a number of new accelerators from NVIDIA, Moffett, NeuChips, Rebellions, and more

The post MLPerf Inference v3.0 Shows New Accelerators appeared first on ServeTheHome.

Using InsightVM Remediation Projects To Ensure Accountability

Post Syndicated from Landon Dalke original https://blog.rapid7.com/2023/04/05/using-insightvm-remediation-projects-to-ensure-accountability/

Using InsightVM Remediation Projects To Ensure Accountability

One benefit of InsightVM reporting is that it enables security teams to build accountability into remediation projects. There are a number of ways this can be accomplished and the approach you take will be dictated by your organization’s specific structure and needs.

In this blog, we’ll look at two types of console-driven reports and two types of cloud-driven reports (projects). Depending on who will be conducting remediations, you may choose one over the others. We’ll explore why in detail below.

Reporting Prerequisites

Before we can get too deep into reporting, some prerequisites need to be met. Mainly, we need scan data in the InsightVM console. To get scan data, we need to perform at least one site run against at least one asset (preferably with credentials or Scan Assistant) or at least one Insight Agent deployed. Whether agent-driven or traditionally scanned, the data will be in the form of a Site in InsightVM.

We can then organize the Site data into logical filters called Dynamic Asset Groups, or DAGs. We can create DAGs based on numerous filters; the most common filters are ‘OS’ or ‘IP address in the range of.’ Using these types of Dynamic Asset Groups allows us to create both OS and location-based organization of our scan data, which can later be used to scope both reports and query builder.

Remember: Use Sites and Agents to obtain asset and vulnerability data.  Use DAGs and Tags to organize the data.

Console reports are run from the Reporting link  in the left-hand menu of the InsightVM console. There are two console reports that I recommend to customers. The first is called Top Remediation w/ details.

Using InsightVM Remediation Projects To Ensure Accountability

Top Remediation w/ details reports include a variety of actionable information, such as:

Real Risk Prioritization: Real Risk is great because it factors in CVSSv2 base metrics, potential malware kits and exploit kits, and the publish date (aka how long the vulnerability has been exposed to hackers).

Using InsightVM Remediation Projects To Ensure Accountability

The Risk score value is not the important metric, but instead, how that number compares to the other risk score numbers in the report. Prioritizing the biggest risk score first for maximum impact is a really good way to prioritize.

Solution Driven Remediation: Remediations, also known as Solutions, are the second primary reason to use this report. Solutions are usually cumulative and allow many vulnerabilities to be remediated with a single solution. The Top Remediation report only shows solutions, and when combined with risk, it enables you to see the maximum impact solutions, that will have the most significant impact on reducing risk in your environment.

Ability to change the total number of solutions: The number of solutions can be changed using the reports Advanced Options, so the report is not so intimidating. 25 Solutions is very intimidating/overwhelming, but 5 or 10 solutions are much more consumable by the remediation team.

Details show the Solution and the Assets affected: Details, being the last attribute, allows you to see the solutions for each of the Top Remediations and the assets affected.

The second console-driven report type I like to call out is called a SQL Query Export report. These reports allow customers to use the SQL Query data model to create custom CSV reports that meet their needs. Rapid7 maintains a repository of over 100 example queries on Github.

Both of these reports are highly impactful, however, there is one fundamental question I always ask before recommending them:

Is the security team performing the remediation, or will the reports be sent to another team?

If the security team is responsible for remediation, these console-driven reports are amazing because of self-accountability. However, if reports are going to another team, then one of the cloud-driven reports, aka Remediation Projects, are a better fit. Why? Remediation Projects provide the built-in accountability necessary to make progress. The key word is: Accountability

Accountability is the number one reason I recommend using Remediation Projects over the Top Remediation or SQL Query Export reports. If you generate a Top Remediation report and send it over to say, Bob, Bob may say ‘thanks’, walk around the corner, and throw it in the trash. A month goes by, and you ask, ‘so Bob, how are things going? I’m not seeing much progress’, to which Bob might answer, “prove it”.

If this sounds familiar, that’s because I hear it from many customers I work with that send reports to other teams. With PDF-based, it can be very hard to “prove it”—and then nothing ever gets done.

This is where remediation projects come in. With Remediation Projects, you can track whenever a solution is resolved, and the number cannot be manually manipulated. This means the only way to increase the  ‘solutions resolved’ number is to actually fix the vulnerabilities and validate them with either a scan or an agent assessment. Now when Bob responds with ‘prove it’ you can simply reply with ‘sure, let’s loop in your manager’.

I know this sounds harsh, but it’s a reality many security practitioners have to work with daily.

Built-in accountability makes remediation projects the number one choice for businesses that send reports to other teams for remediation.
So, how do you create the best possible Remediaiton Projects? I usually recommend creating projects by using Dashboards. My personal favorite Dashboard is the Threat Feed Dashboard. This Dashboard can be found by clicking on “See more in the R7 Library”

Using InsightVM Remediation Projects To Ensure Accountability

Then search for Threat, and Add the ‘Threat Feed Dashboard’.

Using InsightVM Remediation Projects To Ensure Accountability

Once this Dashboard comes up, there are three cards that I like to focus on:

Using InsightVM Remediation Projects To Ensure Accountability

First, let’s talk about the ‘Most Common Actively Targeted Vulnerabilities card. This card is driven by Project Heisenberg, which has deployed over 150 honeypots worldwide across five continents.

Using InsightVM Remediation Projects To Ensure Accountability
From: https://www.rapid7.com/blog/post/2017/06/13/live-threat-driven-prioritization/

Prioritization utilizes CVSS, or the Common Vulnerability Scoring System. We also have Real Risk, which enhances CVSS prioritization using additional metrics (exploits, malware, publish age). Lastly, Threat feed, in my opinion, is the next level of Prioritization and should be prioritized highly within your vulnerability remediation program.

How to use Dashboard Cards to create team-based or location-based (scoped) Remediation Projects

Before we dive any further into the Most Common Actively Targeted Vulnerabilities card, I first recommend clicking on the Query Builder. The query builder link can be found in the upper right of the page:

Using InsightVM Remediation Projects To Ensure Accountability

Query Builder is a way to see all of your data, and create filters for that data and save those filters in the form of queries. If you have been following along, then we should already have some DAGs created within the console for data organization. We can use one of those DAG’s to create a filter in Query Builder. For example we can Add a filter for “asset.groups IN” and select one of your asset groups, in my example, I am using Windows Devices:

Using InsightVM Remediation Projects To Ensure Accountability

On my test console, this filters only Windows devices, and I can now Save that query so I can use it to scope my Dashboards and Projects based on the Windows Team.

Using InsightVM Remediation Projects To Ensure Accountability

Once it is saved, hit the X in the upper right corner to exit out of Query Builder.

Now that we have a Saved Query, we can Load that query into our Threat Feed Dashboard by clicking on ‘Load Dashboard Query’:

Using InsightVM Remediation Projects To Ensure Accountability

Once the query is loaded, our Threat Feed Dashboard will now only show assets defined by the Windows Devices query, which is scoped by the Windows Devices DAG within the Console.

This can be helpful if you want to create a custom team-based Dashboard for each team.

Next, if we click on the ‘<Expand Card>’ option within the Most Common Actively Targeted Vulnerability card we can see that the card is also scoped with our Dashboard query. We can then select All of the solutions (Or just the top 10 sorted by risk) and click on ‘Create a Static Remediation Project’ to use the scoped threat feed dashboard card to create a static project. For more information on reating a remediation project, click here.

Using InsightVM Remediation Projects To Ensure Accountability

Lastly, I like to focus on the following two cards with or without a query loaded into the Dashboard:

Using InsightVM Remediation Projects To Ensure Accountability

The above screenshot is lab data by the way, hopefully this doesn’t look familiar. The Most Common Actively Targeted card is amazing and should be prioritized, but I also really like this card as it focuses on Exploitable vulnerabilities by Severity.

Based on the card labeled ‘Exploitable Assets by Skill Level’, we can see in my test environment that 72% of exploitable assets can be exploited by a novice. This should be a very scary number, and we should prioritize reducing this number as quickly as we can.

If we look at the ‘Exploitable Vulnerability Discovery Date by Severity’ card, we can see how long we have known about exploitable vulnerabilities in our environment. The Discovery date is the same as the find date in our own personal environments. Based on the example above, we have over 35,000 critical exploitable vulnerabilities that we have known about for over 90 days and have not fixed. This environment is all test data, but if your environment looks similar this should be a very scary thing to be seeing.

For example, as security practitioners, we should ask the fundamental question, ‘What if I get breached?’. One answer might be to determine the vulnerability that caused the breach. Another might be, how long have we known about the vulnerability and not fixed it? If the answer to that second statement is less than 60 days, hopefully, you can already start thinking about the many excuses we could use; however, if it’s over 90 days, the excuses start to get pretty difficult to come up with.

To prevent not only a breach but also to prevent being in a situation where you need to explain why the breach happened on a vulnerability that has been known about for over 90 days, I highly recommend using this card as a source of data for additional Remediation Projects.

Conclusion

To summarize our journey: We created some sites to bring in vulnerability data into our console. We then organized that data using Dynamic Asset Groups (DAGs). We then used those DAGs to scope query’s (in Query Builder) so we could scope Dashboards. With the scoped dashboard, we get scoped cards which we used to create Projects.

With the Query Builder we get organization. Combining the query with the Threat Feed Dashboard, we get Organized Prioritization. If we then use this data to create Projects we get Organized Prioritization with Accountability. This is a perfect combo to get some work done in reducing vulnerabilities using Reporting.

Remember that the number one reason to use projects is Accountability.

To learn more about InsightVM remediation capabilities, check out the following blog posts:

InsightVM Release Update: Let’s Focus on Remediation for Just a Minute

Decentralize Remediation Efforts to Gain More Efficiency with InsightVM

NEVER MISS A BLOG

Get the latest stories, expertise, and news about security today.

GitHub Availability Report: March 2023

Post Syndicated from Jakub Oleksy original https://github.blog/2023-04-05-github-availability-report-march-2023/

In March, we experienced six incidents that resulted in degraded performance across GitHub services. This report also sheds light into a February incident that resulted in degraded performance for GitHub Codespaces.

February 28 15:42 UTC (lasting 1 hour and 26 minutes)

On February 28 at 15:42 UTC, our monitors detected a higher than normal failure rate for creating and starting GitHub Codespaces in the East US region, caused by slower than normal VM allocation time from our cloud provider. To reduce impact to our customers during this time, we redirected codespace creations to a secondary region. Codespaces in other regions were not impacted during this incident.

To help reduce the impact of similar incidents in the future, we tuned our monitors to allow for quicker detection. We are also making architectural changes to enable failover for existing codespaces and to initiate failover automatically without human intervention.

March 01 12:01 UTC (lasting 3 hour and 06 minutes)

On March 1 at 12:01 UTC, our monitors detected a higher than normal latency for requests to Container, NPM, Nuget, and RubyGems Packages registries. Initial impact was 5xx responses to 0.5% of requests, peaking at 10% during this incident. We determined the root cause to be an unhealthy disk on a VM node hosting our database, which caused significant performance degradation at the OS level. All MySQL servers on this problematic node experienced connection delays and slow query execution, leading to the high failure rate.

We mitigated this with a failover of the database. We recognize this incident lasted too long and have updated our runbooks for quicker mitigation short term. To address the reliability issue, we have architectural changes in progress to migrate the application backend to a new MySQL infrastructure. This includes improved observability and auto-recovery tooling, thereby increasing application availability.

March 02 23:37 UTC (lasting 2 hour and 18 minutes)

On March 2 at 23:37 UTC, our monitors detected an elevated amount of failed requests for GitHub Actions workflows, which appeared to be caused by TLS verification failures due to an unexpected SSL certificate bound to our CDN IP address. We immediately engaged our CDN provider to help investigate. The root cause was determined to be a configuration change on the provider’s side that unintentionally changed the SSL certificate binding to some of our GitHub Actions production IP addresses. We remediated the issue by removing the certificate binding.

Our team is now evaluating onboarding multiple DNS/CDN providers to ensure we can maintain consistent networking even when issues arise that are out of our control.

March 15 14:07 UTC (lasting 1 hour and 20 minutes)

On March 15 at 14:07 UTC, our monitors detected increased latency for requests to Container, NPM, Nuget, RubyGems package registries. This was caused by an operation on the primary database host that was performed as part of routine maintenance. During the maintenance, a slow running query that was not properly drained blocked all database resources. We remediated this issue by killing the slow running query and restarting the database.

To prevent future incidents, we have paused maintenance until we investigate and address the draining of long running queries. We have also updated our maintenance process to perform additional safety checks on long running queries and blocking processes before proceeding with production changes.

March 27 12:25 UTC (lasting 1 hour and 33 minutes)

On March 27 at 12:25 UTC, we were notified of impact to pages, codespaces and issues. We resolved the incident at 13:29 UTC.

Due to the recency of this incident, we are still investigating the contributing factors and will provide a more detailed update in next month’s report.

March 29 14:21 UTC (lasting 4 hour and 29 minutes)

On March 29 at 14:21 UTC, we were notified of impact to pages, codespaces and actions. We resolved the incident at 18:50 UTC.

Due to the recency of this incident, we are still investigating the contributing factors and will provide a more detailed update in next month’s report.

March 31 01:16 UTC (lasting 52 minutes)

On March 31 at 01:16 UTC, we were notified of impact to Git operations, issues and pull requests. We resolved the incident at 02:08 UTC.

Due to the recency of this incident, we are still investigating the contributing factors and will provide a more detailed update in next month’s report.


Please follow our status page for real-time updates on status changes. To learn more about what we’re working on, check out the GitHub Engineering Blog.

FBI (and Others) Shut Down Genesis Market

Post Syndicated from Bruce Schneier original https://www.schneier.com/blog/archives/2023/04/fbi-and-others-shut-down-genesis-market.html

Genesis Market is shut down:

Active since 2018, Genesis Market’s slogan was, “Our store sells bots with logs, cookies, and their real fingerprints.” Customers could search for infected systems with a variety of options, including by Internet address or by specific domain names associated with stolen credentials.

But earlier today, multiple domains associated with Genesis had their homepages replaced with a seizure notice from the FBI, which said the domains were seized pursuant to a warrant issued by the U.S. District Court for the Eastern District of Wisconsin.

The U.S. Attorney’s Office for the Eastern District of Wisconsin did not respond to requests for comment. The FBI declined to comment.

But sources close to the investigation tell KrebsOnSecurity that law enforcement agencies in the United States, Canada and across Europe are currently serving arrest warrants on dozens of individuals thought to support Genesis, either by maintaining the site or selling the service bot logs from infected systems.

The seizure notice includes the seals of law enforcement entities from several countries, including Australia, Canada, Denmark, Germany, the Netherlands, Spain, Sweden and the United Kingdom.

Slashdot story.

Как възстановителният подход може да се съчетае с традиционното правосъдие

Post Syndicated from original https://www.toest.bg/kak-vuzstanovitelniyat-podhod-mozhe-da-se-suchetae-s-traditsionnoto-pravosudie/

Как възстановителният подход може да се съчетае с традиционното правосъдие

<< Към част първа

В първия текст – „Възстановителното правосъдие – опит за помирение“, представихме как и защо възниква необходимостта от възстановително правосъдие в съвременните общества и какво по същество представлява тази концепция, разработена от критичната криминология. За да откроим отчетливо основните възстановителни ценности и практики, често ги сравняваме с установените практики в традиционното правосъдие и ги противопоставяме на тях. Но също така всекидневно се убеждаваме, че традиционното правосъдие невинаги е достатъчно, за да се възстановят накърнените социални връзки и да се постигне така необходимото разбиране на станалото.

Една история, която може да се случи навсякъде

В този втори текст ще разкажем историята на един казус от практиката на съдия от районен съд в малък град близо до София. Макар че съдебното дело отдавна е приключило и наказанието е изпълнено, за да бъде защитено правото на личен живот на участниците в наказателното производство, техните имена, названията на населени места и други отличителни особености на случая са променени.

Тази история показва потенциала на възстановителния подход да повиши доверието в традиционното правосъдие, да го направи по-ефективно и да осмисли целите и съдържанието на наказанието. Ясно се вижда, че усилията на съдията, ангажирането на инициативата на кмета и на близките на извършителите и жертвата спомага за изграждането и развитието на местната общност. Своеобразната възстановителна програма, която съдията е приложил по време на изпитателния срок, е довела до насърчаване на толерантността и готовността за лично участие – първоначалното недоверие и сдържаност на участниците постепенно се преодоляват, като в крайна сметка е поставено начало на пълноценна промяна в живота на двамата младежи и на пострадалия от извършеното престъпление.

Става въпрос за двама приятели – Калоян и Никола, които живеели в село, намиращо се в близост до малкия град – седалище на районния съд. Семействата и на двете момчета били бедни, родителите им – безработни, нямали добро образование и трудно намирали препитание в малкия град. Затова родителите на Калоян и Никола напуснали селото в търсене на работа в чужбина или в по-големи градове в страната.

Калоян бил на 24 години, а Никола – на 20 години. И двамата завършили осми клас, трудно се справяли, нямали подкрепа и напуснали училище. Не работели постоянно, тъй като в селото нямало подходяща работа за тях. Разчитали техните близки да им осигуряват подслон и прехрана, както и от време на време да им дават пари, с които си купували основно алкохол и цигари. Калоян живеел при по-големия си брат в селото, защото родителите им работели от дълго време в чужбина. Никола съжителствал с баба си в селото, а неговите родители се преместили в друг отдалечен град, където управлявали неголяма селскостопанска ферма.

Жертвата на престъплението – Георги, бил трудноподвижен възрастен мъж, който живеел сам, а в селото живеели двама от неговите племенници.

Калоян и Никола предварително се уговорили да извършат грабеж от дома на Георги, тъй като имали нужда от пари, за да си купят алкохол и цигари. Те познавали човека, понеже преди време му помогнали при цепенето на дърва за огрев. Било им известно също, че има спестени пари от пенсията си. При сговарянето двамата се разбрали, че ще влязат с взлом в дома на възрастния мъж, за когото знаели, че е безпомощен и беззащитен. При извършване на престъплението младежите повредили външната порта на двора, разбили входната врата на къщата, като счупили стъклата, и влезли в чуждия дом. Грабежът бил извършен на 20 януари 2015 г. в 2 часа през нощта. Двамата взели от възрастния мъж 95 лв.

При нападението Георги не оказал съпротива, бил силно уплашен и молел двете момчета да не го бият, след което сам им посочил къде държи парите си.

Въпреки липсата на съпротива и отправените молби двамата извършители упражнили сила, като нанесли удари с юмруци и ритници по тялото и лицето на възрастния мъж – причинили му разкъсно-контузни рани и кръвонасядания по лицето и тялото, които били установени при проведения впоследствие медицински преглед. Освен че причинили физически травми, двамата младежи заплашвали пострадалия, че ако не им даде парите си, ще го убият. Дълго време след престъплението жертвата Георги изпитвал безпокойство и страх, не излизал от дома си и молел своите близки да се редуват да стоят при него, защото не искал да остава сам, опасявайки се, че ще бъде нападнат отново.

С парите, взети от възрастния човек, двамата младежи си купили цигари и алкохол, които консумирали следващите няколко дни.

Калоян бил осъждан през 2011 г. за множество кражби. Наложено му било наказание лишаване от свобода, като изпълнението на това наказание било отложено с тригодишен изпитателен срок. В този срок Калоян не бил извършил престъпление, поради което настъпила реабилитацията му. Грабежа извършил месец и половина след изтичане на изпитателния срок.

След като били заловени от полицията, двамата младежи се признали за виновни и изразили съгласие наказателното дело да приключи със споразумение. За да може да се реши наказателното дело по този начин, е необходимо да се възстановят на жертвата отнетите насила пари. Поради това бащата на Калоян възстановил на Георги отнетата сума от 95 лв.

Прокурорът и защитниците на двете момчета постигнали споразумение за решаване на наказателното дело, в което предвидили всеки от тях да получи минимално наказание: Калоян – пет месеца, а Никола – три месеца лишаване от свобода, изпълнението на което да бъде отложено за три години.

Съдията обяснил на адвокатите и подсъдимите, че определените наказания са занижени и не отговарят на тежестта на престъплението, включително на болките и страданията, които е претърпял пострадалият. Според закона за престъплението, което са извършили Калоян и Никола, се предвижда наказание лишаване от свобода от три до десет години. При сключване на споразумение законът позволява наказанието да бъде определено и под минимума от три години – това е своеобразен стимул за подсъдимите да признаят вината си и така да се постигне бързина на правосъдието, защото известно е, че скъсената дистанция между престъплението и наказанието спомага за ефективността на наказателната политика и за възстановяване на общественото спокойствие.

По правило в това съдебно производство съдът има за задача да осъществи контрол върху решените със споразумението въпроси и ако не открие противоречие със закона и морала, едва тогава да го одобри. Смисълът на тази процедура е, че одобреното от съда споразумение има същата правна стойност като влязла в сила присъда. При споразумението подсъдимите се признават за виновни и така спестяват на държавата време и средства за постигане на окончателна присъда. Същевременно съдът следи за това законът да бъде правилно приложен и да не се стигне до несправедлив резултат, включително да не се злепоставят интересите на подсъдимите, жертвата и обществото.

След като се съобразили с дадените от съдията указания, защитниците и прокурорът предложили споразумение, според което Калоян и Никола се признавали за виновни, че са извършили престъплението грабеж, отнемайки със сила 95 лв. от Георги, за което Калоян приел да изтърпи три години, а Никола – една година лишаване от свобода. И за двамата подсъдими съдът постановил изпълнението на наказанията да се отложи за изпитателен срок – пет години за Калоян и четири години за Никола. В случай че в така определения изпитателен срок подсъдимите извършат друго умишлено престъпление, те при определени условия трябва да изтърпят и отложените наказания.

Смисълът на възпитателната грижа

По-същественото в случая е, че законът дава възможност в този изпитателен срок да се упражнява възпитателна грижа спрямо осъдените лица. Смисълът на възпитателната грижа е да се предложи на извършителя на престъплението подходяща за неговите нужди образователна програма, да му се помогне да си намери работа, да бъдат осигурени подходящи здравни и психологически услуги.

Възпитателните грижи може да включват и различни по вид възстановителни програми – най-общо да се предложи на извършителя и жертвата начин да се срещнат и да разговорят за причините и последиците от престъплението. Тази възстановителна среща (или поредица от срещи) трябва да бъде добре подготвена от трето лице – може да го наречем помирител, – който да предпази както жертвата, така и извършителя от задълбочаване на проблема и да им помогне сами да стигнат до приемливо и за двете страни решение. В нашия случай, доколкото законът предвижда прилагане на възпитателни грижи за условно осъдените, съдът предвидил със споразумението организирането на грижите за осъдените да се възложи на кмета на селото, в което живеели Калоян, Никола и жертвата Георги.

Една седмица след одобряване на споразумението съдията организирал среща в кметството на селото, на която освен кметът присъствали двамата осъдени – Калоян и Никола, жертвата Георги, бащата и братът на Калоян, майката и бащата на Никола, двамата племенници на Георги, полицейският инспектор на селото. Преди срещата съдията провел отделен разговор с осъдените и жертвата. Никола и Калоян изразили готовност да участват, докато Георги имал опасения и се страхувал да се изправи очи в очи отново със своите нападатели. След няколко дни възрастният мъж склонил да участва в срещата, но пожелал да присъстват и двамата му племенници.

На тази първа среща осъдените получили възможност да говорят за причините за престъплението. Те обяснили, че съжаляват за нанесените материални и морални вреди на Георги, че не са искали да го наранят, че са постъпили лекомислено и никога няма да повторят извършеното. Двамата се извинили на пострадалия и изразили намерение да поправят счупената врата и повредената ограда, както и да помагат на Георги в грижите за домакинството му.

Георги първоначално бил много резервиран и уплашен, не искал да говори, но впоследствие разказал как е преживял нападението – за изпитания страх, ужас и несигурност. Най-шокиращо за него било това, че той познавал двете момчета и не очаквал от тях да проявят такава непредизвикана агресия и насилие спрямо него. Племенниците на пострадалия били загрижени за здравето и сигурността на своя чичо и настояли той да не бъде притесняван повече.

Общ(ностен) контрол

След проведения разговор участниците се обединили около няколко решения, които да спомогнат за поправяне на вредите от престъплението, за възстановяване на нарушеното спокойствие в селото, както и за подпомагане на личното развитие на двете момчета.

Кметът на селото поел задължение да осигури работа на Калоян в полза на общността на селото и за поправяне на причинените на Георги материални щети, както и да помогне за индивидуалното му обучение. Братът на Калоян се съгласил да му предостави подслон и грижа в дома си в същото село. Родителите на Никола обещали да упражняват надзор и да полагат грижи за сина си, както и да му гарантират работа в управляваната от тях селскостопанска ферма. Присъстващият на срещата съдия поел задължение да осъществява общия контрол за изпълнение на взетите на срещата решения.

При проведената среща между извършителите и жертвата на престъплението съдията е приложил познатата възстановителна практика на фамилната конференция, за която споменахме в първия текст. Разликата е, че при възстановителните срещи по дефиниция не трябва да присъстват овластени лица – съдия, кмет, полицейски инспектор, а самите участници в конфликта и техните близки да бъдат подпомагани само от непрофесионален помирител.

В нашето законодателство все още не е предвидена възможност непрофесионални помирители да участват в помирителни срещи извършител–жертва или във фамилни и училищни конференции. Организираната от съдията среща е добър пример за изпълване с ново съдържание на съществуващо от десетилетия в нашия наказателен закон задължение на районния съдия по местоживеене на извършителите да осъществява общия контрол относно възпитателните грижи и поведението на условно осъдените. Срещата е показателна и за възможностите на възстановителния подход да хуманизира и обогатява практиките на традиционното правосъдие.

След един месец в сградата на районния съд се провела втора среща, на която присъствали Калоян и Никола, както и бащите на двете момчета, кметът на селото и полицейският инспектор. След като обсъдили изпълнението на решенията от първата среща, участниците разговаряли за промяната на част от обстоятелствата в живота на младежите, което налагало да се предвидят нови мерки.

Поради това, че братът на Калоян, в чийто дом той живеел, заминал в чужбина, Калоян поел задължение да се грижи за домашните животни в неговото стопанство. Той обещал да изпраща на полицейския инспектор на селото всяка сутрин няколко бутилки мляко от кравите, за които щял да се грижи, а инспекторът да ги доставя в дома на Георги. Полицейският инспектор поел задължение да разговаря с племенниците на Георги и да им гарантира, че Калоян по никакъв начин няма да представлява заплаха за техния чичо, а те съответно да проявят толерантност и да му дадат шанс за промяна.

Кметът на селото се ангажирал да предостави възможност на Калоян един ден от седмицата да помага на общинските служители за почистване на гробищния парк в селото. Кметът намерил възможност и да го подпомогне за продължаване на образованието му, като разговарял с пенсиониран учител от селото, който доброволно да преподава на момчето по български език, литература и география.

Никола продължавал да работи във фермата на родителите си. По време на срещата се разбрало, че ще замине с родителите си в чужбина, където те си намерили работа. Баща му обещал всеки месец да изпраща писмо, в което да разказва какво се случва със сина му – дали работи и най-общо как се развива животът му.

В следващите няколко години съдията продължил през няколко месеца да организира срещи, в които участвали Калоян и неговият баща, а бащата на Никола изпращал редовно писма. По време на срещите се обсъждали актуалните нужди на двете момчета, а кметът на селото помагал на Калоян при намиране на работа и за повишаване на образованието му.

В продължение на няколко месеца Калоян предоставял на Георги бутилки прясно краве мляко, като използвал посредничеството на полицейския инспектор на селото. Освен това Калоян с помощта на брат си поправил повредената ограда и входна врата на къщата на Георги. С помощта на кмета на селото се включил в почистването на гробищния парк и редовно посещавал уроците, провеждани от пенсионирания учител.

При изтичането на изпитателния срок се установило, че Калоян и Никола не са извършили нарушения на закона – и двамата работели, издържали се сами, а пострадалият Георги не ги възприемал повече като заплаха за живота и имуществото си.

Примерът от практиката на съдията трябва да ни окуражи да създаваме различни по вид възстановителни програми, които да стимулират на свой ред развитието на социални услуги в полза на извършителите и жертвите на престъпления, а това е добра алтернатива за оздравяване на разкъсваната от противопоставяне и разделения обществена тъкан.

Изследването на отношението между разобличението, наказанието и защитата на обществената сигурност, включително чрез насърчаване на извършителя на престъпление с подходящи средства да развие ресурса си за законосъобразен начин на живот, за да не представлява опасност за обществото, показва областите на възможното и полезно съвместяване на възстановителния подход и възстановителните практики с нормативно уредения процесуален ред за реализиране на наказателната отговорност и за изпълнение на наказанието.

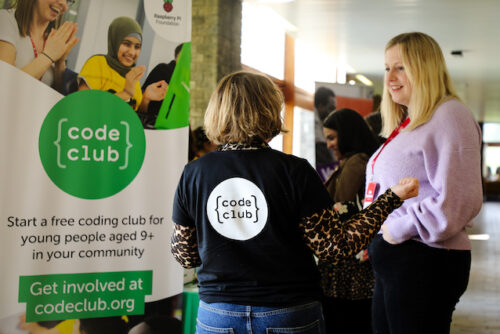
Survey results: the usage of money in Debian

Post Syndicated from original https://lwn.net/Articles/928414/

The Debian project has reported
on a survey of developers
on the use of project funds to support
development work.

There seems to be broad support for paying people who are already
involved as Debian contributors, but very little support for hiring
contractors, that is to say, those who are not already Debian
contributors in some way. Members of the Security Team were by far
the most supportive towards the idea of paying Debian contributors.

The full
report
is available for those wanting all the details and pie charts.

The collective thoughts of the interwebz