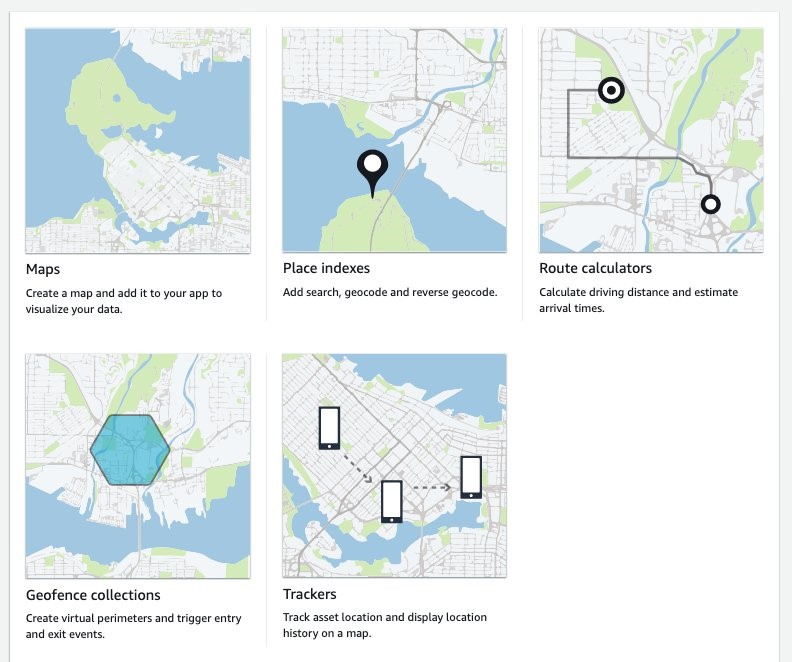
Tag Archives: Amazon Location

Enrich your customer data with geospatial insights using Amazon Redshift, AWS Data Exchange, and Amazon QuickSight

Post Syndicated from Tony Stricker original https://aws.amazon.com/blogs/big-data/enrich-your-customer-data-with-geospatial-insights-using-amazon-redshift-aws-data-exchange-and-amazon-quicksight/

It always pays to know more about your customers, and AWS Data Exchange makes it straightforward to use publicly available census data to enrich your customer dataset.

The United States Census Bureau conducts the US census every 10 years and gathers household survey data. This data is anonymized, aggregated, and made available for public use. The smallest geographic area for which the Census Bureau collects and aggregates data are census blocks, which are formed by streets, roads, railroads, streams and other bodies of water, other visible physical and cultural features, and the legal boundaries shown on Census Bureau maps.

If you know the census block in which a customer lives, you are able to make general inferences about their demographic characteristics. With these new attributes, you are able to build a segmentation model to identify distinct groups of customers that you can target with personalized messaging. This data is available to subscribe to on AWS Data Exchange—and with data sharing, you don’t need to pay to store a copy of it in your account in order to query it.

In this post, we show how to use customer addresses to enrich a dataset with additional demographic details from the US Census Bureau dataset.

Solution overview

The solution includes the following high-level steps:

  1. Set up an Amazon Redshift Serverless endpoint and load customer data.
  2. Set up a place index in Amazon Location Service.
  3. Write an AWS Lambda user-defined function (UDF) to call Location Service from Amazon Redshift.
  4. Subscribe to census data on AWS Data Exchange.
  5. Use geospatial queries to tag addresses to census blocks.
  6. Create a new customer dataset in Amazon Redshift.
  7. Evaluate new customer data in Amazon QuickSight.

The following diagram illustrates the solution architecture.

architecture diagram

Prerequisites

You can use the following AWS CloudFormation template to deploy the required infrastructure. Before deployment, you need to sign up for QuickSight access through the AWS Management Console.

Load generic address data to Amazon Redshift

Amazon Redshift is a fully managed, petabyte-scale data warehouse service in the cloud. Redshift Serverless makes it straightforward to run analytics workloads of any size without having to manage data warehouse infrastructure.

To load our address data, we first create a Redshift Serverless workgroup. Then we use Amazon Redshift Query Editor v2 to load customer data from Amazon Simple Storage Service (Amazon S3).

Create a Redshift Serverless workgroup

There are two primary components of the Redshift Serverless architecture:

  • Namespace – A collection of database objects and users. Namespaces group together all of the resources you use in Redshift Serverless, such as schemas, tables, users, datashares, and snapshots.
  • Workgroup – A collection of compute resources. Workgroups have network and security settings that you can configure using the Redshift Serverless console, the AWS Command Line Interface (AWS CLI), or the Redshift Serverless APIs.

To create your namespace and workgroup, refer to Creating a data warehouse with Amazon Redshift Serverless. For this exercise, name your workgroup sandbox and your namespace adx-demo.

Use Query Editor v2 to load customer data from Amazon S3

You can use Query Editor v2 to submit queries and load data to your data warehouse through a web interface. To configure Query Editor v2 for your AWS account, refer to Data load made easy and secure in Amazon Redshift using Query Editor V2. After it’s configured, complete the following steps:

  • Use the following SQL to create the customer_data schema within the dev database in your data warehouse:
CREATE SCHEMA customer_data;
  • Use the following SQL DDL to create your target table into which you’ll load your customer address data:
CREATE TABLE customer_data.customer_addresses (
    address character varying(256) ENCODE lzo,
    unitnumber character varying(256) ENCODE lzo,
    municipality character varying(256) ENCODE lzo,
    region character varying(256) ENCODE lzo,
    postalcode character varying(256) ENCODE lzo,
    country character varying(256) ENCODE lzo,
    customer_id integer ENCODE az64
) DISTSTYLE AUTO;

The file has no column headers and is pipe delimited (|). For information on how to load data from either Amazon S3 or your local desktop, refer to Loading data into a database.

Use Location Service to geocode and enrich address data

Location Service lets you add location data and functionality to applications, which includes capabilities such as maps, points of interest, geocoding, routing, geofences, and tracking.

Our data is in Amazon Redshift, so we need to access the Location Service APIs using SQL statements. Each row of data contains an address that we want to enrich and geotag using the Location Service APIs. Amazon Redshift allows developers to create UDFs using a SQL SELECT clause, Python, or Lambda.

Lambda is a compute service that lets you run code without provisioning or managing servers. With Lambda UDFs, you can write custom functions with complex logic and integrate with third-party components. Scalar Lambda UDFs return one result per invocation of the function—in this case, the Lambda function runs one time for each row of data it receives.

For this post, we write a Lambda function that uses the Location Service API to geotag and validate our customer addresses. Then we register this Lambda function as a UDF with our Redshift instance, allowing us to call the function from a SQL command.

For instructions to create a Location Service place index and create your Lambda function and scalar UDF, refer to Access Amazon Location Service from Amazon Redshift. For this post, we use ESRI as a provider and name the place index placeindex.redshift.

Test your new function with the following code, which returns the coordinates of the White House in Washington, DC:

select public.f_geocode_address('1600 Pennsylvania Ave.','Washington','DC','20500','USA');

Subscribe to demographic data from AWS Data Exchange

AWS Data Exchange is a data marketplace with more than 3,500 products from over 300 providers delivered—through files, APIs, or Amazon Redshift queries—directly to the data lakes, applications, analytics, and machine learning models that use it.

First, we need to give our Redshift namespace permission via AWS Identity and Access Management (IAM) to access subscriptions on AWS Data Exchange. Then we can subscribe to our sample demographic data. Complete the following steps:

  1. On the IAM console, add the AWSDataExchangeSubscriberFullAccess managed policy to your Amazon Redshift commands access role you assigned when creating the namespace.
  2. On the AWS Data Exchange console, navigate to the dataset ACS – Sociodemographics (USA, Census Block Groups, 2019), provided by CARTO.
  3. Choose Continue to subscribe, then choose Subscribe.

The subscription may take a few minutes to configure.

  1. When your subscription is in place, navigate back to the Redshift Serverless console.
  2. In the navigation pane, choose Datashares.
  3. On the Subscriptions tab, choose the datashare that you just subscribed to.
  4. On the datashare details page, choose Create database from datashare.
  5. Choose the namespace you created earlier and provide a name for the new database that will hold the shared objects from the dataset you subscribed to.

In Query Editor v2, you should see the new database you just created and two new tables: one that holds the block group polygons and another that holds the demographic information for each block group.

Query Editor v2 data source explorer

Join geocoded customer data to census data with geospatial queries

There are two primary types of spatial data: raster and vector data. Raster data is represented as a grid of pixels and is beyond the scope of this post. Vector data is comprised of vertices, edges, and polygons. With geospatial data, vertices are represented as latitude and longitude points and edges are the connections between pairs of vertices. Think of the road connecting two intersections on a map. A polygon is a set of vertices with a series of connecting edges that form a continuous shape. A simple rectangle is a polygon, just as the state border of Ohio can be represented as a polygon. The geography_usa_blockgroup_2019 dataset that you subscribed to has 220,134 rows, each representing a single census block group and its geographic shape.

Amazon Redshift supports the storage and querying of vector-based spatial data with the GEOMETRY and GEOGRAPHY data types. You can use Redshift SQL functions to perform queries such as a point in polygon operation to determine if a given latitude/longitude point falls within the boundaries of a given polygon (such as state or county boundary). In this dataset, you can observe that the geom column in geography_usa_blockgroup_2019 is of type GEOMETRY.

Our goal is to determine which census block (polygon) each of our geotagged addresses falls within so we can enrich our customer records with details that we know about the census block. Complete the following steps:

  • Build a new table with the geocoding results from our UDF:
CREATE TABLE customer_data.customer_addresses_geocoded AS 
select address
    ,unitnumber
    ,municipality
    ,region
    ,postalcode
    ,country
    ,customer_id
    ,public.f_geocode_address(address||' '||unitnumber,municipality,region,postalcode,country) as geocode_result
FROM customer_data.customer_addresses;
  • Use the following code to extract the different address fields and latitude/longitude coordinates from the JSON column and create a new table with the results:
CREATE TABLE customer_data.customer_addresses_points AS
SELECT customer_id
    ,geo_address
    address
    ,unitnumber
    ,municipality
    ,region
    ,postalcode
    ,country
    ,longitude
    ,latitude
    ,ST_SetSRID(ST_MakePoint(Longitude, Latitude),4326) as address_point
            --create new geom column of type POINT, set new point SRID = 4326
FROM
(
select customer_id
    ,address
    ,unitnumber
    ,municipality
    ,region
    ,postalcode
    ,country
    ,cast(json_extract_path_text(geocode_result, 'Label', true) as VARCHAR) as geo_address
    ,cast(json_extract_path_text(geocode_result, 'Longitude', true) as float) as longitude
    ,cast(json_extract_path_text(geocode_result, 'Latitude', true) as float) as latitude
        --use json function to extract fields from geocode_result
from customer_data.customer_addresses_geocoded) a;

This code uses the ST_POINT function to create a new column from the latitude/longitude coordinates called address_point of type GEOMETRY and subtype POINT.   It uses the ST_SetSRID geospatial function to set the spatial reference identifier (SRID) of the new column to 4326.

The SRID defines the spatial reference system to be used when evaluating the geometry data. It’s important when joining or comparing geospatial data that they have matching SRIDs. You can check the SRID of an existing geometry column by using the ST_SRID function. For more information on SRIDs and GEOMETRY data types, refer to Querying spatial data in Amazon Redshift.

  • Now that your customer addresses are geocoded as latitude/longitude points in a geometry column, you can use a join to identify which census block shape your new point falls within:
CREATE TABLE customer_data.customer_addresses_with_census AS
select c.*
    ,shapes.geoid as census_group_shape
    ,demo.*
from customer_data.customer_addresses_points c
inner join "carto_census_data"."carto".geography_usa_blockgroup_2019 shapes
on ST_Contains(shapes.geom, c.address_point)
    --join tables where the address point falls within the census block geometry
inner join carto_census_data.usa_acs.demographics_sociodemographics_usa_blockgroup_2019_yearly_2019 demo
on demo.geoid = shapes.geoid;

The preceding code creates a new table called customer_addresses_with_census, which joins the customer addresses to the census block in which they belong as well as the demographic data associated with that census block.

To do this, you used the ST_CONTAINS function, which accepts two geometry data types as an input and returns TRUE if the 2D projection of the first input geometry contains the second input geometry. In our case, we have census blocks represented as polygons and addresses represented as points. The join in the SQL statement succeeds when the point falls within the boundaries of the polygon.

Visualize the new demographic data with QuickSight

QuickSight is a cloud-scale business intelligence (BI) service that you can use to deliver easy-to-understand insights to the people who you work with, wherever they are. QuickSight connects to your data in the cloud and combines data from many different sources.

First, let’s build some new calculated fields that will help us better understand the demographics of our customer base. We can do this in QuickSight, or we can use SQL to build the columns in a Redshift view. The following is the code for a Redshift view:

CREATE VIEW customer_data.customer_features AS (
SELECT customer_id 
    ,postalcode
    ,region
    ,municipality
    ,geoid as census_geoid
    ,longitude
    ,latitude
    ,total_pop
    ,median_age
    ,white_pop/total_pop as perc_white
    ,black_pop/total_pop as perc_black
    ,asian_pop/total_pop as perc_asian
    ,hispanic_pop/total_pop as perc_hispanic
    ,amerindian_pop/total_pop as perc_amerindian
    ,median_income
    ,income_per_capita
    ,median_rent
    ,percent_income_spent_on_rent
    ,unemployed_pop/coalesce(pop_in_labor_force) as perc_unemployment
    ,(associates_degree + bachelors_degree + masters_degree + doctorate_degree)/total_pop as perc_college_ed
    ,(household_language_total - household_language_english)/coalesce(household_language_total) as perc_other_than_english
FROM "dev"."customer_data"."customer_addresses_with_census" t );

To get QuickSight to talk to our Redshift Serverless endpoint, complete the following steps:

Now you can create a new dataset in QuickSight.

  • On the QuickSight console, choose Datasets in the navigation pane.
  • Choose New dataset.

create a new dataset in quicksight

  • We want to create a dataset from a new data source and use the Redshift: Manual connect option.

Redshift manual connection

  • Provide the connection information for your Redshift Serverless workgroup.

You will need the endpoint for our workgroup and the user name and password that you created when you set up your workgroup. You can find your workgroup’s endpoint on the Redshift Serverless console by navigating to your workgroup configuration. The following screenshot is an example of the connection settings needed. Notice the connection type is the name of the VPC connection that you previously configured in QuickSight. When you copy the endpoint from the Redshift console, be sure to remove the database and port number from the end of the URL before entering it in the field.

Redshift edit data source

  • Save the new data source configuration.

You’ll be prompted to choose the table you want to use for your dataset.

  • Choose the new view that you created that has your new derived fields.

Quicksight choose your table

  • Select Directly query your data.

This will connect your visualizations directly to the data in the database rather than ingesting data into the QuickSight in-memory data store.

Directly query your data

  • To create a histogram of median income level, choose the blank visual on Sheet1 and then choose the histogram visual icon under Visual types.
  • Choose median_income under Fields list and drag it to the Value field well.

This builds a histogram showing the distribution of median_income for our customers based on the census block group in which they live.

QuickSight histogram

Conclusion

In this post, we demonstrated how companies can use open census data available on AWS Data Exchange to effortlessly gain a high-level understanding of their customer base from a demographic standpoint. This basic understanding of customers based on where they live can serve as the foundation for more targeted marketing campaigns and even influence product development and service offerings.

As always, AWS welcomes your feedback. Please leave your thoughts and questions in the comments section.


About the Author

Tony Stricker is a Principal Technologist on the Data Strategy team at AWS, where he helps senior executives adopt a data-driven mindset and align their people/process/technology in ways that foster innovation and drive towards specific, tangible business outcomes. He has a background as a data warehouse architect and data scientist and has delivered solutions in to production across multiple industries including oil and gas, financial services, public sector, and manufacturing. In his spare time, Tony likes to hang out with his dog and cat, work on home improvement projects, and restore vintage Airstream campers.

Gain insights from historical location data using Amazon Location Service and AWS analytics services

Post Syndicated from Alan Peaty original https://aws.amazon.com/blogs/big-data/gain-insights-from-historical-location-data-using-amazon-location-service-and-aws-analytics-services/

Many organizations around the world rely on the use of physical assets, such as vehicles, to deliver a service to their end-customers. By tracking these assets in real time and storing the results, asset owners can derive valuable insights on how their assets are being used to continuously deliver business improvements and plan for future changes. For example, a delivery company operating a fleet of vehicles may need to ascertain the impact from local policy changes outside of their control, such as the announced expansion of an Ultra-Low Emission Zone (ULEZ). By combining historical vehicle location data with information from other sources, the company can devise empirical approaches for better decision-making. For example, the company’s procurement team can use this information to make decisions about which vehicles to prioritize for replacement before policy changes go into effect.

Developers can use the support in Amazon Location Service for publishing device position updates to Amazon EventBridge to build a near-real-time data pipeline that stores locations of tracked assets in Amazon Simple Storage Service (Amazon S3). Additionally, you can use AWS Lambda to enrich incoming location data with data from other sources, such as an Amazon DynamoDB table containing vehicle maintenance details. Then a data analyst can use the geospatial querying capabilities of Amazon Athena to gain insights, such as the number of days their vehicles have operated in the proposed boundaries of an expanded ULEZ. Because vehicles that do not meet ULEZ emissions standards are subjected to a daily charge to operate within the zone, you can use the location data, along with maintenance data such as age of the vehicle, current mileage, and current emissions standards to estimate the amount the company would have to spend on daily fees.

This post shows how you can use Amazon Location, EventBridge, Lambda, Amazon Data Firehose, and Amazon S3 to build a location-aware data pipeline, and use this data to drive meaningful insights using AWS Glue and Athena.

Overview of solution

This is a fully serverless solution for location-based asset management. The solution consists of the following interfaces:

  • IoT or mobile application – A mobile application or an Internet of Things (IoT) device allows the tracking of a company vehicle while it is in use and transmits its current location securely to the data ingestion layer in AWS. The ingestion approach is not in scope of this post. Instead, a Lambda function in our solution simulates sample vehicle journeys and directly updates Amazon Location tracker objects with randomized locations.
  • Data analytics – Business analysts gather operational insights from multiple data sources, including the location data collected from the vehicles. Data analysts are looking for answers to questions such as, “How long did a given vehicle historically spend inside a proposed zone, and how much would the fees have cost had the policy been in place over the past 12 months?”

The following diagram illustrates the solution architecture.
Architecture diagram

The workflow consists of the following key steps:

  1. The tracking functionality of Amazon Location is used to track the vehicle. Using EventBridge integration, filtered positional updates are published to an EventBridge event bus. This solution uses distance-based filtering to reduce costs and jitter. Distanced-based filtering ignores location updates in which devices have moved less than 30 meters (98.4 feet).
  2. Amazon Location device position events arrive on the EventBridge default bus with source: ["aws.geo"] and detail-type: ["Location Device Position Event"]. One rule is created to forward these events to two downstream targets: a Lambda function, and a Firehose delivery stream.
  3. Two different patterns, based on each target, are described in this post to demonstrate different approaches to committing the data to a S3 bucket:
    1. Lambda function – The first approach uses a Lambda function to demonstrate how you can use code in the data pipeline to directly transform the incoming location data. You can modify the Lambda function to fetch additional vehicle information from a separate data store (for example, a DynamoDB table or a Customer Relationship Management system) to enrich the data, before storing the results in an S3 bucket. In this model, the Lambda function is invoked for each incoming event.
    2. Firehose delivery stream – The second approach uses a Firehose delivery stream to buffer and batch the incoming positional updates, before storing them in an S3 bucket without modification. This method uses GZIP compression to optimize storage consumption and query performance. You can also use the data transformation feature of Data Firehose to invoke a Lambda function to perform data transformation in batches.
  4. AWS Glue crawls both S3 bucket paths, populates the AWS Glue database tables based on the inferred schemas, and makes the data available to other analytics applications through the AWS Glue Data Catalog.
  5. Athena is used to run geospatial queries on the location data stored in the S3 buckets. The Data Catalog provides metadata that allows analytics applications using Athena to find, read, and process the location data stored in Amazon S3.
  6. This solution includes a Lambda function that continuously updates the Amazon Location tracker with simulated location data from fictitious journeys. The Lambda function is triggered at regular intervals using a scheduled EventBridge rule.

You can test this solution yourself using the AWS Samples GitHub repository. The repository contains the AWS Serverless Application Model (AWS SAM) template and Lambda code required to try out this solution. Refer to the instructions in the README file for steps on how to provision and decommission this solution.

Visual layouts in some screenshots in this post may look different than those on your AWS Management Console.

Data generation

In this section, we discuss the steps to manually or automatically generate journey data.

Manually generate journey data

You can manually update device positions using the AWS Command Line Interface (AWS CLI) command aws location batch-update-device-position. Replace the tracker-name, device-id, Position, and SampleTime values with your own, and make sure that successive updates are more than 30 meters in distance apart to place an event on the default EventBridge event bus:

aws location batch-update-device-position --tracker-name <tracker-name> --updates "[{\"DeviceId\": \"<device-id>\", \"Position\": [<longitude>, <latitude>], \"SampleTime\": \"<YYYY-MM-DDThh:mm:ssZ>\"}]"

Automatically generate journey data using the simulator

The provided AWS CloudFormation template deploys an EventBridge scheduled rule and an accompanying Lambda function that simulates tracker updates from vehicles. This rule is enabled by default, and runs at a frequency specified by the SimulationIntervalMinutes CloudFormation parameter. The data generation Lambda function updates the Amazon Location tracker with a randomized position offset from the vehicles’ base locations.

Vehicle names and base locations are stored in the vehicles.json file. A vehicle’s starting position is reset each day, and base locations have been chosen to give them the ability to drift in and out of the ULEZ on a given day to provide a realistic journey simulation.

You can disable the rule temporarily by navigating to the scheduled rule details on the EventBridge console. Alternatively, change the parameter State: ENABLED to State: DISABLED for the scheduled rule resource GenerateDevicePositionsScheduleRule in the template.yml file. Rebuild and re-deploy the AWS SAM template for this change to take effect.

Location data pipeline approaches

The configurations outlined in this section are deployed automatically by the provided AWS SAM template. The information in this section is provided to describe the pertinent parts of the solution.

Amazon Location device position events

Amazon Location sends device position update events to EventBridge in the following format:

{
    "version":"0",
    "id":"<event-id>",
    "detail-type":"Location Device Position Event",
    "source":"aws.geo",
    "account":"<account-number>",
    "time":"<YYYY-MM-DDThh:mm:ssZ>",
    "region":"<region>",
    "resources":[
        "arn:aws:geo:<region>:<account-number>:tracker/<tracker-name>"
    ],
    "detail":{
        "EventType":"UPDATE",
        "TrackerName":"<tracker-name>",
        "DeviceId":"<device-id>",
        "SampleTime":"<YYYY-MM-DDThh:mm:ssZ>",
        "ReceivedTime":"<YYYY-MM-DDThh:mm:ss.sssZ>",
        "Position":[
            <longitude>, 
            <latitude>
	]
    }
}

You can optionally specify an input transformation to modify the format and contents of the device position event data before it reaches the target.

Data enrichment using Lambda

Data enrichment in this pattern is facilitated through the invocation of a Lambda function. In this example, we call this function ProcessDevicePosition, and use a Python runtime. A custom transformation is applied in the EventBridge target definition to receive the event data in the following format:

{
    "EventType":<EventType>,
    "TrackerName":<TrackerName>,
    "DeviceId":<DeviceId>,
    "SampleTime":<SampleTime>,
    "ReceivedTime":<ReceivedTime>,
    "Position":[<Longitude>,<Latitude>]
}

You could apply additional transformations, such as the refactoring of Latitude and Longitude data into separate key-value pairs if this is required by the downstream business logic processing the events.

The following code demonstrates the Python application logic that is run by the ProcessDevicePosition Lambda function. Error handling has been skipped in this code snippet for brevity. The full code is available in the GitHub repo.

import json
import os
import uuid
import boto3

# Import environment variables from Lambda function.
bucket_name = os.environ["S3_BUCKET_NAME"]
bucket_prefix = os.environ["S3_BUCKET_LAMBDA_PREFIX"]

s3 = boto3.client("s3")

def lambda_handler(event, context):
    key = "%s/%s/%s-%s.json" % (bucket_prefix,
                                event["DeviceId"],
                                event["SampleTime"],
                                str(uuid.uuid4())
    body = json.dumps(event, separators=(",", ":"))
    body_encoded = body.encode("utf-8")
    s3.put_object(Bucket=bucket_name, Key=key, Body=body_encoded)
    return {
        "statusCode": 200,
        "body": "success"
    }

The preceding code creates an S3 object for each device position event received by EventBridge. The code uses the DeviceId as a prefix to write the objects to the bucket.

You can add additional logic to the preceding Lambda function code to enrich the event data using other sources. The example in the GitHub repo demonstrates enriching the event with data from a DynamoDB vehicle maintenance table.

In addition to the prerequisite AWS Identity and Access Management (IAM) permissions provided by the role AWSBasicLambdaExecutionRole, the ProcessDevicePosition function requires permissions to perform the S3 put_object action and any other actions required by the data enrichment logic. IAM permissions required by the solution are documented in the template.yml file.

{
    "Version":"2012-10-17",
    "Statement":[
        {
            "Action":[
                "s3:ListBucket"
            ],
            "Resource":[
                "arn:aws:s3:::<S3_BUCKET_NAME>"
            ],
            "Effect":"Allow"
        },
        {
            "Action":[
                "s3:PutObject"
            ],
            "Resource":[
                "arn:aws:s3:::<S3_BUCKET_NAME>/<S3_BUCKET_LAMBDA_PREFIX>/*"
            ],
            "Effect":"Allow"
        }
    ]
}

Data pipeline using Amazon Data Firehose

Complete the following steps to create your Firehose delivery stream:

  1. On the Amazon Data Firehose console, choose Firehose streams in the navigation pane.
  2. Choose Create Firehose stream.
  3. For Source, choose as Direct PUT.
  4. For Destination, choose Amazon S3.
  5. For Firehose stream name, enter a name (for this post, ProcessDevicePositionFirehose).
    Create Firehose stream
  6. Configure the destination settings with details about the S3 bucket in which the location data is stored, along with the partitioning strategy:
    1. Use <S3_BUCKET_NAME> and <S3_BUCKET_FIREHOSE_PREFIX> to determine the bucket and object prefixes.
    2. Use DeviceId as an additional prefix to write the objects to the bucket.
  7. Enable Dynamic partitioning and New line delimiter to make sure partitioning is automatic based on DeviceId, and that new line delimiters are added between records in objects that are delivered to Amazon S3.

These are required by AWS Glue to later crawl the data, and for Athena to recognize individual records.
Destination settings for Firehose stream

Create an EventBridge rule and attach targets

The EventBridge rule ProcessDevicePosition defines two targets: the ProcessDevicePosition Lambda function, and the ProcessDevicePositionFirehose delivery stream. Complete the following steps to create the rule and attach targets:

  1. On the EventBridge console, create a new rule.
  2. For Name, enter a name (for this post, ProcessDevicePosition).
  3. For Event bus¸ choose default.
  4. For Rule type¸ select Rule with an event pattern.
    EventBridge rule detail
  5. For Event source, select AWS events or EventBridge partner events.
    EventBridge event source
  6. For Method, select Use pattern form.
  7. In the Event pattern section, specify AWS services as the source, Amazon Location Service as the specific service, and Location Device Position Event as the event type.
    EventBridge creation method
  8. For Target 1, attach the ProcessDevicePosition Lambda function as a target.
    EventBridge target 1
  9. We use Input transformer to customize the event that is committed to the S3 bucket.
    EventBridge target 1 transformer
  10. Configure Input paths map and Input template to organize the payload into the desired format.
    1. The following code is the input paths map:
      {
          EventType: $.detail.EventType
          TrackerName: $.detail.TrackerName
          DeviceId: $.detail.DeviceId
          SampleTime: $.detail.SampleTime
          ReceivedTime: $.detail.ReceivedTime
          Longitude: $.detail.Position[0]
          Latitude: $.detail.Position[1]
      }

    2. The following code is the input template:
      {
          "EventType":<EventType>,
          "TrackerName":<TrackerName>,
          "DeviceId":<DeviceId>,
          "SampleTime":<SampleTime>,
          "ReceivedTime":<ReceivedTime>,
          "Position":[<Longitude>, <Latitude>]
      }

  11. For Target 2, choose the ProcessDevicePositionFirehose delivery stream as a target.
    EventBridge target 2

This target requires an IAM role that allows one or multiple records to be written to the Firehose delivery stream:

{
    "Version": "2012-10-17",
    "Statement": [
        {
            "Action": [
                "firehose:PutRecord",
                "firehose:PutRecords"
            ],
            "Resource": [
                "arn:aws:firehose:<region>:<account-id>:deliverystream/<delivery-stream-name>"
            ],
            "Effect": "Allow"
        }
    ]
}

Crawl and catalog the data using AWS Glue

After sufficient data has been generated, complete the following steps:

  1. On the AWS Glue console, choose Crawlers in the navigation pane.
  2. Select the crawlers that have been created, location-analytics-glue-crawler-lambda and location-analytics-glue-crawler-firehose.
  3. Choose Run.

The crawlers will automatically classify the data into JSON format, group the records into tables and partitions, and commit associated metadata to the AWS Glue Data Catalog.
Crawlers

  1. When the Last run statuses of both crawlers show as Succeeded, confirm that two tables (lambda and firehose) have been created on the Tables page.

The solution partitions the incoming location data based on the deviceid field. Therefore, as long as there are no new devices or schema changes, the crawlers don’t need to run again. However, if new devices are added, or a different field is used for partitioning, the crawlers need to run again.
Tables

You’re now ready to query the tables using Athena.

Query the data using Athena

Athena is a serverless, interactive analytics service built to analyze unstructured, semi-structured, and structured data where it is hosted. If this is your first time using the Athena console, follow the instructions to set up a query result location in Amazon S3. To query the data with Athena, complete the following steps:

  1. On the Athena console, open the query editor.
  2. For Data source, choose AwsDataCatalog.
  3. For Database, choose location-analytics-glue-database.
  4. On the options menu (three vertical dots), choose Preview Table to query the content of both tables.
    Preview table

The query displays 10 sample positional records currently stored in the table. The following screenshot is an example from previewing the firehose table. The firehose table stores raw, unmodified data from the Amazon Location tracker.
Query results
You can now experiment with geospatial queries.The GeoJSON file for the 2021 London ULEZ expansion is part of the repository, and has already been converted into a query compatible with both Athena tables.

  1. Copy and paste the content from the 1-firehose-athena-ulez-2021-create-view.sql file found in the examples/firehose folder into the query editor.

This query uses the ST_Within geospatial function to determine if a recorded position is inside or outside the ULEZ zone defined by the polygon. A new view called ulezvehicleanalysis_firehose is created with a new column, insidezone, which captures whether the recorded position exists within the zone.

A simple Python utility is provided, which converts the polygon features found in the downloaded GeoJSON file into ST_Polygon strings based on the well-known text format that can be used directly in an Athena query.

  1. Choose Preview View on the ulezvehicleanalysis_firehose view to explore its content.
    Preview view

You can now run queries against this view to gain overarching insights.

  1. Copy and paste the content from the 2-firehose-athena-ulez-2021-query-days-in-zone.sql file found in the examples/firehose folder into the query editor.

This query establishes the total number of days each vehicle has entered ULEZ, and what the expected total charges would be. The query has been parameterized using the ? placeholder character. Parameterized queries allow you to rerun the same query with different parameter values.

  1. Enter the daily fee amount for Parameter 1, then run the query.
    Query editor

The results display each vehicle, the total number of days spent in the proposed ULEZ, and the total charges based on the daily fee you entered.
Query results
You can repeat this exercise using the lambda table. Data in the lambda table is augmented with additional vehicle details present in the vehicle maintenance DynamoDB table at the time it is processed by the Lambda function. The solution supports the following fields:

  • MeetsEmissionStandards (Boolean)
  • Mileage (Number)
  • PurchaseDate (String, in YYYY-MM-DD format)

You can also enrich the new data as it arrives.

  1. On the DynamoDB console, find the vehicle maintenance table under Tables. The table name is provided as output VehicleMaintenanceDynamoTable in the deployed CloudFormation stack.
  2. Choose Explore table items to view the content of the table.
  3. Choose Create item to create a new record for a vehicle.
    Create item
  4. Enter DeviceId (such as vehicle1 as a String), PurchaseDate (such as 2005-10-01 as a String), Mileage (such as 10000 as a Number), and MeetsEmissionStandards (with a value such as False as Boolean).
  5. Choose Create item to create the record.
    Create item
  6. Duplicate the newly created record with additional entries for other vehicles (such as for vehicle2 or vehicle3), modifying the values of the attributes slightly each time.
  7. Rerun the location-analytics-glue-crawler-lambda AWS Glue crawler after new data has been generated to confirm that the update to the schema with new fields is registered.
  8. Copy and paste the content from the 1-lambda-athena-ulez-2021-create-view.sql file found in the examples/lambda folder into the query editor.
  9. Preview the ulezvehicleanalysis_lambda view to confirm that the new columns have been created.

If errors such as Column 'mileage' cannot be resolved are displayed, the data enrichment is not taking place, or the AWS Glue crawler has not yet detected updates to the schema.

If the Preview table option is only returning results from before you created records in the DynamoDB table, return the query results in descending order using sampletime (for example, order by sampletime desc limit 100;).
Query results
Now we focus on the vehicles that don’t currently meet emissions standards, and order the vehicles in descending order based on the mileage per year (calculated using the latest mileage / age of vehicle in years).

  1. Copy and paste the content from the 2-lambda-athena-ulez-2021-query-days-in-zone.sql file found in the examples/lambda folder into the query editor.
    Query results

In this example, we can see that out of our fleet of vehicles, five have been reported as not meeting emission standards. We can also see the vehicles that have accumulated high mileage per year, and the number of days spent in the proposed ULEZ. The fleet operator may now decide to prioritize these vehicles for replacement. Because location data is enriched with the most up-to-date vehicle maintenance data at the time it is ingested, you can further evolve these queries to run over a defined time window. For example, you could factor in mileage changes within the past year.

Due to the dynamic nature of the data enrichment, any new data being committed to Amazon S3, along with the query results, will be altered as and when records are updated in the DynamoDB vehicle maintenance table.

Clean up

Refer to the instructions in the README file to clean up the resources provisioned for this solution.

Conclusion

This post demonstrated how you can use Amazon Location, EventBridge, Lambda, Amazon Data Firehose, and Amazon S3 to build a location-aware data pipeline, and use the collected device position data to drive analytical insights using AWS Glue and Athena. By tracking these assets in real time and storing the results, companies can derive valuable insights on how effectively their fleets are being utilized and better react to changes in the future. You can now explore extending this sample code with your own device tracking data and analytics requirements.


About the Authors

Alan Peaty is a Senior Partner Solutions Architect at AWS. Alan helps Global Systems Integrators (GSIs) and Global Independent Software Vendors (GISVs) solve complex customer challenges using AWS services. Prior to joining AWS, Alan worked as an architect at systems integrators to translate business requirements into technical solutions. Outside of work, Alan is an IoT enthusiast and a keen runner who loves to hit the muddy trails of the English countryside.

Parag Srivastava is a Solutions Architect at AWS, helping enterprise customers with successful cloud adoption and migration. During his professional career, he has been extensively involved in complex digital transformation projects. He is also passionate about building innovative solutions around geospatial aspects of addresses.

How to send geofenced marketing messages using Amazon Pinpoint

Post Syndicated from Zach Elliott original https://aws.amazon.com/blogs/messaging-and-targeting/send-geofenced-marketing-messages-using-amazon-pinpoint/

Introduction

Geofencing, which creates a virtual geographical boundary that triggers a marketing action to a mobile device when a user enters or exits that boundary, can be used in marketing messages to drive more traffic and increase conversions. Amazon Pinpoint, AWS’ multichannel communication tool, can be used to create mobile notifications using geofencing technology, so customers receive notifications about a business when they’re close by that physical location.

Ways retailers can use geofencing:

There are a number of different use cases that retail or location-based businesses can use geofencing to drive customer conversions:

  1. Target the customer with real-time offers and promotions when the customer is near the store: Detecting and establishing an interaction with the customer while in the store improves the customer experience. Using geofencing, retailers will be able to detect the presence and will be able to send coupon or promotional notifications.
  2. Improve product search in the store: As the consumer enters the geofenced store, activate the product search for the store to help the consumer to search and navigate easily within the store.
  3. Get more information about the customer in the store: Retailers will be able to collect more accurate consumer behavior inside the store by recording the interaction between the consumers and product search, and using geofencing and position to calculate the dwell time inside the store or how long the consumer is waiting in the queue.

In this blog we will talk about how you can use Amazon Location Service to trigger a notification using Amazon Pinpoint when a consumer enters a geofenced store.

Architecture Overview

Architecture Overview for Pinpoint and Geofencing Solution

Fig. 1: Geofencing and Pinpoint – Sample Architecture

Figure 1 depicts the solution architecture and resources deployed by the AWS CloudFormation Template, described in more detail in later sections. In the solution workflow:

  1.  Store Management defines a Geofence around store locations they wish to enroll using Amazon Location Service Geofencing and circular geofences.
  2. A customer who has opted into location tracking using the app will update an Amazon Location Service Tracker Resource. This tracker will be evaluated against the store geofences.
  3. If a geofence ENTER event is triggered, a message is sent to Amazon EventBridge.
  4. EventBridge will trigger an AWS Lambda function.
  5. The Lambda function looks up the Store Information in an Amazon DynamoDB table that matches the geofence ID in order to enrich the email.
  6. Event is sent to a Pinpoint Journey with information from the Geofence event as well as store info.
  7. Personalized email is sent to customer via Pinpoint

Configuring AWS Cloudformation

To deploy the Amazon Location Service resources as well as EventBridge, DynamoDB, and Lambda, we have created an AWS Cloudformation Template.

Use this link to launch the CloudFormation stack in the US-West-2 region. Selecting the button next to “I acknowledge that AWS CloudFormation might create IAM resources.” click Create stack

Fig 2. Cloudformation Console

Fig. 2: AWS CloudFormation Console showing stack options.

Once the stack is complete. We can begin configuring Pinpoint.

Configuring Pinpoint

Our project was created for us via the CloudFormation template, but we still need to configure some items in Pinpoint. First, we’ll set up our email identity to send and receive messages from; for the purposes of this blog, you’ll use the same email address for sending and receiving the email, but in a production environment, your sending identity could either be a specific email address you’ve verified for messaging, or an entire email domain you’ve verified via DNS.

Configuring email channel

Adding an email

  1. On the left-side Pinpoint menu, expand the Email option and choose Email identities
  2. Select Verify email identity
  3. Enter an email address you have access to for the confirmation step
  4. Select Verify email address
Fig. 3: Verifying email identity

Fig. 3: AWS Console showing email verification

Fig. 4: Email verification options

Fig. 4: Email verification options

Now, check your inbox for a verification email. It should look something like this:

Fig. 5: Email Verification message from Amazon Pinpoint

Fig. 5: Email Verification message from Amazon Pinpoint

Click the link to verify your email address. Now we can begin sending and receiving messages at this address.

Now that we have a verified email, we can configure the email channel.

Configuring the email channel

  1. On the left-side Pinpoint menu, navigate to All projects and select CoffeeShop
  2. Navigate to Settings and select Email
  3. Select Edit next to Identity details
  4. Select the checkbox for Enable the email channel for this project
  5. Select Use an existing email address and select the address you verified in the previous step.
  6. Select Save
Fig. 6: Configuring the email channel

Fig. 6: Configuring the email channel

Configuring email template

Next, we need to define what our email looks like that is sent to our customers when they enter a geofence. We’ve provided HTML code for a basic Coffee Shop template here

Configure email template

  1. On the left-side Pinpoint menu, navigate to Message templates, select Create template
  2. Name the template CoffeeShopGeoTarget and set the subject to “We haven’t seen you in a while”
  3. Paste the contents of the HTML template into the Message field.
  4. Select Create
Fig. 7: Configuring the email template

Fig. 7: Configuring the email template

You can see multiple attributes are used in the template. These attributes come from our segment in the case of FirstName, and DynamoDB in the case of the store name and address.

Configuring email segment

Now we need to define who we are going to send an email to. For this, we need to set up our segment within Pinpoint. We’ve provided a sample segment file here. Download this file and open it in a text editor.

Fig. 8: Configuring the email segment

Fig. 8: Configuring the email segment

Replace all the values with your own information . The email needs to be the same email we verified in an earlier step. Create a UserID for the user that can be used to uniquely identify them. Leave ChannelType as “EMAIL” to indicate we are using the email channel in Pinpoint, and leave OptOut as “NONE” which indicates the user would like to receive all communications and has not opted-out of receiving notifications. Once the information is edited, save the file.

Importing the segment

  1. On the left-side Pinpoint menu, navigate to All projects, and select your CoffeeShop Project
  2. Navigate to Segments and select Import a segment
  3. Drag the downloaded csv file into the Drop files here box.
  4. Select Create Segment
Fig. 9: Importing a segment

Fig. 9: Importing a segment

Configuring Journey

In this post, we will be setting up a very simple Journey that sends an email anytime a user enters a geofence. If we wanted to go a step farther, we could add additional activities later in the Journey such as determining if the customer purchased something based on receiving the email, and sending them targeted emails based on the drink they ordered.
Now that we’ve added the email channel, we can set up our journey.

Configuring journey entry

  1. On the left-side Pinpoint menu, navigate to the CoffeeShop Project and select Journeys
  2. Select Create journey
  3. Name the journey “CoffeeShopGeoTarget
  4. Set the entry condition to “geofence enter”
  5. Select Save
Fig. 10: Journey event configuration

Fig. 10: Journey event configuration

Configuring journey activity

  1. Select the Add activity icon
  2. Select Send an email from the dropdown
  3. Choose the email template we created earlier
  4. Enter the verified email we configured earlier
  5. Select Save
Fig. 11: Journey email destination configuration

Fig. 11: Journey email destination configuration

Reviewing Journey

  1. Select Review
  2. Select Mark as reviewed
  3. Select Publish
Fig. 12: Reviewing the Journey

Fig. 12: Reviewing the Journey

Once we publish our journey, a 5 minute timer will start, which will give us time to set up our tracking environment.

Configuring Amazon Location Resources

Now that we’ve configured Pinpoint to send geotargeted emails, we need to set up our Geofences as well as emulate a person passing nearby our coffee shops. To do that, we will use the AWS CLI and AWS Cloudshell .

To open AWS CloudShell, select it in the upper right near the region selection.

Fig. 13: Location of AWS Cloudshell in the AWS Console

Fig. 13: Location of AWS Cloudshell in the AWS Console

AWS CloudShell will now open in the bottom half of the AWS Console , note it may take up to a minute on first launch. First, we’ll create our geofences. For this, we will use Circular geofences around a point location. In this case, we will create two geofences, one for a Coffee shop at Amazon’s Doppler office, and one for a shop at Amazon’s Nitro North office. These correlate with the DynamoDB store information table.

aws location put-geofence --collection-name StoreCollection --geofence-id store_1508 --geometry 'Circle={Center=[-122.33826293063228, 47.61530011310656], Radius=100}'

Successful Geofence creation will create output similar to the below:

{
"CreateTime": "2023-04-21T19:31:57.807000+00:00",
"GeofenceId": "store_1508",
"UpdateTime": "2023-04-21T19:31:57.807000+00:00"
}

Next we create our second geofence:

aws location put-geofence --collection-name StoreCollection --geofence-id store_1509 --geometry 'Circle={Center=[-122.34051934099395, 47.61751544952795], Radius=100}'

Successful Geofence creation will create output similar to the below:

{
"CreateTime": "2023-04-21T19:32:41.980000+00:00",
"GeofenceId": "store_1509",
"UpdateTime": "2023-04-21T19:32:41.980000+00:00"
}

Now that our geofences are created, we can emulate a person walking by and triggering a geofence. We will do this using Amazon Location Service Trackers. In CloudShell, enter the following command:

aws location batch-update-device-position --tracker-name CustomerDevices --updates Accuracy={Horizontal=0},DeviceId=111,Position=-122.33811005706218,47.61541094771129,SampleTime=$(date +%s)

When this command is issued, a geofence is then evaluated which will trigger an event sent to Amazon EventBridge. This event then triggers a Lambda, which creates an event with Pinpoint. This triggers the Journey, which sends an email.

Now check your email, you should see a customized email with the store you were close to and your name . Note because we are not using domain verification, you may receive a warning on the email message. See our documentation on how to use domain verification.

Fig. 14: Email received from Amazon Pinpoint

Fig. 14: Email received from Amazon Pinpoint

Next Steps

For this blog, we used the default Journey configuration. However, we can further optimize our Journey by following Tips and best practices for journeys. You can also set up push notifications or in-app notifications to further optimize the customer experience to catch them in the moment they walk by, instead of when they may check their email next. You can read more about push notifications here.

Clean up

Deleting CloudFormation template

  1. In the AWS Console, navigate to the AWS CloudFormation console. Select the PinpointGeotarget stack
  2. Select Delete Stack

Deleting Pinpoint resources

  1. In the AWS Console, navigate to the Pinpoint Console
  2. Select Message templates
  3. Select the CoffeeShop template
  4. Select Delete then confirm you wish to delete it

Removing email identity

  1. In the AWS Console, navigate to the Pinpoint Console
  2. Navigate to Email, and select Email identities
  3. Select the radio button next to the verified email you configured
  4. Select Remove email identity
  5. Type Delete to confirm the removal

Conclusion

In this post, we explored how you can detect the presence of the customer whenever they cross near the geofenced physical store, using Amazon Location Service in which Amazon EventBridge receives the event, triggers an AWS Lambda function, and then triggers a Journey in Amazon Pinpoint to send a notification to the customer with a coupon.

Further more, integrating this solution with your customer data platform and with Amazon Personalize will help you to personalize the promotions and vouchers to fit the tastes and tendencies of customers

Zach Elliott works as a Solutions Architect focusing on Amazon Location Service at AWS. He is passionate about helping customers build geospatial solutions on AWS. He is also part of the IoT Subject Matter Expert community at AWS and loves helping customers develop unique IoT-based solutions.

Anshul Srivastava Headshot

With an illustrious track record as a technology thought-leader, Anshul joined AWS in 2016 and is the EMEA technology leader for retail. He is responsible for defining and executing the company’s retail technology strategy, which includes building retail-focused solutions with services like Amazon Forecast and Amazon Personalize, as well as experiences like Frictionless Shopping with AI/ML and IoT services from AWS. Anshul also works very closely with AWS global retail customers to help transform their businesses with cutting-edge AWS technologies.

Optimizing fleet utilization with Amazon Location Service and HERE Technologies

Post Syndicated from Mahesh Geeniga original https://aws.amazon.com/blogs/architecture/optimizing-fleet-utilization-with-amazon-location-service-and-here-technologies/

The fleet management market is expected to grow at a Compound Annual Growth Rate (CAGR) of 15.5 percent—from 25.5 billion US dollars in 2022 to USD 52.4 billion in 2027. Optimizing how your organization uses its vehicle fleet is important for logistics and service providers such as last mile, middle mile, and field services.

In this post, we demonstrate how to build and run a solution for many-to-many vehicle routing using HERE Tour Planning and Amazon Location Service. HERE Technologies is a data provider for Amazon Location Service and provides it with map rendering, geocoding, search, and routing. HERE Tour Planning expands on functionality such as geocoding, basic routing, and matrix routing to consider parameters such as time windows, job requirements or priorities, vehicle capabilities, range, and traffic information. They also support immediate re-planning when conditions change.

The architecture described in this post can help you optimize your fleets for delivering shipments, such as perishable items on pallets, from a central distribution center to multiple retail locations. The architecture uses the AWS Cloud Development Kit (AWS CDK) to help you provision and version control your infrastructure. The architecture also uses Event Driven Architecture (EDA) based on AWS Lambda and Amazon DynamoDB. It uses Amazon Simple Storage Service (Amazon S3) and DynamoDB to store the artifacts generated and integrates with Amazon Location Service to plot the routes visually on a map for each delivery driver.

Solution overview

This post will help you:

  • Configure the many-to-many vehicle routing architecture using HERE Tour Planning and Amazon Location Service
  • Submit a HERE Tour Planning problem
  • Generate an optimized solution file
  • Run a React app that:
    • Generates a list of routes for each vehicle in the fleet
    • Allows drivers to select and view routes in detail

The following diagram outlines how the architecture works.

Many-to-many vehicle routing architecture

Figure 1. Many-to-many vehicle routing architecture using HERE Tour Planning and Amazon Location Service

Let’s explore the steps in the diagram.

  1. The fleet operator uploads the tour requirements file to an Amazon S3 bucket.
  2. The upload invokes a Lambda function to process the new Tour Request. If the HERE API key is present, it calls the HERE Tour Planning API.
  3. The HERE Tour Planning API calculates the solution to the routing problem.
  4. The driver uses the React app to select a vehicle, which requests a route.
  5. The invoked Lambda function uses Amazon Location Service to calculate the route and render it in the React app.

Prerequisites

This walkthrough requires the following installations and resources:

  • Have an AWS account
  • Install the AWS Amplify CLI (command-line interface)
  • Install the AWS CDK CLI
  • Install the AWS CLI
    • Configure and authenticate the AWS CLI to interact with your AWS account.
  • Have your preferred integrated development environment (IDE), such as Visual Studio Code
  • Have GitHub repository access
    • git clone https://github.com/aws-samples/aws-here-optimize-fleet-utilization
  • Have a HERE API Key (optional)
    • This is needed to invoke the HERE Tour Planning API for generating solutions to new routing problems.
    • The GitHub sample repository includes a problem and pre-solved solution file, so you don’t need to acquire a HERE API key to learn about these offerings.
    • To acquire an API key, create a free account on the HERE Platform, then follow the instructions in the HERE Tour Planning documentation to create your API key.
    • There can be additional charges based on API key use. For more details, see the HERE Tour Planning section within HERE service rates.

Walkthrough

Provision the infrastructure

  1. The architecture uses NPM node modules. Run the following commands to install the dependencies:
    • # AWS Lambda function dependencies
      cd lib/lambda/calculate-route
      npm install
    • # Sample Frontend application dependencies
      cd frontend/here-driver-app
      npm install
  2. If you have never used AWS CDK in your AWS account, you must first bootstrap the solution, which creates Amazon S3 buckets and metadata to support AWS CDK operations. Note: Architectural components described in this article are covered under AWS Free Tier and HERE Free monthly usage, but additional charges can occur based on usage beyond the Free Tier limits. We recommend following the Cleanup instructions after completing the walkthrough.
      • From the root of the repository, run the following command to generate the needed infrastructure:
        • cdk bootstrap
      • Output similar to the following indicates that you successfully bootstrapped the AWS account with what AWS CDK requires.

        Successful bootstrap of AWS account with AWS CDK requirements

        Figure 2. Successful bootstrap of AWS account with AWS CDK requirements

  3. Deploy the infrastructure for this solution by running the following command. This provisions much of the infrastructure required for this solution such as DynamoDB, Lambda functions, and Amazon S3 buckets:
    • cdk deploy
  4. Next, Amplify provisions the remaining resources to complete the architecture. Navigate to the folder for the frontend by running the following command:
    • cd frontend/here-driver-app
  5. Run the following series of Amplify commands to create the remaining resources, Amazon API Gateway, Amazon Cognito, and Amazon Location Service. For additional details, see Clone sample Amplify project.
  6. To accept the defaults, run the following command:
    • amplify init
  7. To push the infrastructure out to the AWS account, run the following command:
    • amplify push
  8. To publish the environment, run the following command:
    • amplify publish

Create problem and generate architecture files

The next step is to create the HERE Tour Planning problem file and submit it to the HERE Tour Planning API to solve. Note: You can either sign up for the HERE Developer program to receive an API key to test this solution live or use the problem and pre-solved solution provided in the /data folder of the repository.

  1. Open the Amazon S3 bucket that the previous step created.
  2. Upload a problem file (in JSON format) to the bucket.
  3. An Amazon S3 event notification invokes a Lambda function that performs a synchronous call to the HERE Tour Planning API and generates vehicle routing problem solution file in JSON format.
  4. The Lambda function saves the solution file to the Amazon S3 bucket and additional details about the solution to a DynamoDB table.
  5. The delivery drivers can use the example React app to view the list of vehicles and the routes.
Creating a problem file and submitting it to HERE Tour Planning API

Figure 3. Creating a problem file and submitting it to HERE Tour Planning API

Frontend

The next step is to run the React Frontend app to see the results. Access to the app and the API Gateway is secured with Amazon Cognito.

  1. To run the web application, run the following command:
    • npm start
  2. A local web server runs on http://localhost:3000.
  3. To use the system, the user must authenticate. Amazon Cognito allows users to sign in or create a new account.
  4. After you authenticate, the Home screen displays a list of available vehicles and routes.

    Available vehicles and routes

    Figure 4. Available vehicles and routes

Choose a vehicle to see the detail of the route. Each red marker is a stop.

Vehicle route details

Figure 5. Vehicle route details

Cleanup

To avoid incurring future charges, delete all resources created.

  1. Run the following commands to delete the application in AWS Amplify. As an alternative, you can use the Amplify console to delete Amplify resources:
    • cd frontend/here-driver-app
      amplify pull
      amplify delete
  2. With AWS CDK, run the following command to delete the AWS CloudFormation stack that was used to provision the resources. Note: You can leave the AWS CLI, Amplify CLI, and CDK CLI installed on your computer for future development:
    • cdk destroy

Conclusion

In this post, using shipment delivery from a central distribution center use case, we’ve demonstrated how you can build your own serverless solution for optimizing middle and last mile operations. The solution uses multi-vehicle and multi-stop optimization services provided by HERE Tour Planning and Amazon Location Service to visualize the generated routes for each delivery vehicle driver. For additional details about HERE’s offerings on AWS Marketplace, see AWS Marketplace: HERE Technologies.

Processing geospatial IoT data with AWS IoT Core and the Amazon Location Service

Post Syndicated from Marcia Villalba original https://aws.amazon.com/blogs/compute/processing-geospatial-iot-data-with-aws-iot-core-and-the-amazon-location-service/

This post is written by Swarna Kunnath (Cloud Application Architect), and Anand Komandooru (Sr. Cloud Application Architect).

This blog post shows how to republish messages that arrive from Internet of Things (IoT) devices across AWS accounts using a replatforming approach. A replatforming approach minimizes changes to the core application architecture, allowing an organization to reduce risk and meet business needs more quickly. In this post, you also learn how to track an IoT device’s location using the Amazon Location Service.

The example used in this post relates to an aviation company that has airplanes with line replacement unit devices or transponders. Transponders are IoT devices that send airplane geospatial data (location and altitude) to the AWS IoT Core service. The company’s airplane transponders send location data to the AWS IoT Core service provisioned in an existing AWS account (source account). The solution required manual intervention to track airplane location sent by the transponders.

They must rearchitect their application due to an internal reorganization event. As part of the rearchitecture approach, the business decides to enhance the application to process the transponder messages in another AWS account (destination account). In addition, the business needs full automation of the airplane’s location tracking process, to minimize the risk of the application changes, and to deliver the changes quickly.

Solution overview

The high-level solution republishes the IoT messages from the source account to the destination account using AWS IoT Core, Amazon SQS, AWS Lambda, and integrates the application with Amazon Location Service. IoT messages are replicated to an IoT topic in the destination account for downstream processing, minimizing changes to the original application architecture. Integration with Amazon Location Service automates the process of device location tracking and alert generation.

The AWS IoT platform allows you to connect your internet-enabled devices to the AWS Cloud via MQTT, HTTP, or WebSocket protocol. Once connected, the devices send data to the MQTT topics. Data ingested on MQTT topics is routed into AWS services (Amazon S3, SQS, Amazon DynamoDB, and Lambda) by configuring rules in the AWS IoT Rules Engine. The AWS IoT Rules Engine offers ways to define queries to format and filter messages published by these devices, and supports integration with several other AWS services as targets.

The Amazon Location Service lets you add geospatial data including capabilities such as maps, points of interest, geocoding, routing, geofences, and tracking. The tracker with geofence tracks the location of the device based on the geospatial data in the published IoT messages. Amazon Location Service generates enter and exit events and integrates with Amazon EventBridge and Amazon Simple Notification Service (Amazon SNS) to generate alerts based on defined filters in EventBridge rules.

The solution in this post delivers high availability, scalability, and cost efficiency by using serverless and managed services. The serverless services used by this solution also provide automatic scaling and built-in high availability. Integrating Amazon Location Service with AWS IoT and EventBridge helps to automate the auditing and processing of geospatial messages.

Solution architecture

These steps describe an end-to-end sequence of events:

  1. An IoT device (a transponder in an airplane) publishes a message to the AWS IoT Core service in the source account.
  2. The message arrives at an AWS IoT Core topic in the source account.
  3. AWS IoT Rules Engine receives the message and processes it, using IoT rules attached to the corresponding topic in the source account.
  4. An AWS IoT rule replicates the message to an SQS queue in the destination account.
  5. A Lambda function in the destination account polls the SQS queue and publishes received messages in batches to the destination account IoT topic.
  6. The Location action configured to the IoT rule sends the messages to Amazon Location Service tracker from the IoT topic.
  7. An Amazon Location tracker sends events when an IoT device enters or exits a linked geofence.
  8. EventBridge receives these events and, via the configured event rule, sends out SNS notifications for the configured devices.

Pre-requisites

This example has the following prerequisites:

  1. Access to the AWS services mentioned in this blog post within two AWS Accounts.
  2. A local install of AWS SAM CLI to build and deploy the sample code.

Solution walkthrough

To deploy this solution, first deploy IoT components via the AWS Serverless Application Model (AWS SAM), in the source and destination accounts. After, configure Amazon Location Service resources in the destination account. To learn more, visit the AWS SAM deployment documentation.

Deploying the code

Deploy the following AWS SAM templates in order:

To build and deploy the code, run:

sam build --template <TemplateName>.yaml
sam deploy --guided

Configuring a tracker

Amazon Location Trackers send device location updates that provide data to retrieve current and historical locations for devices.

Using Amazon Location Trackers and Amazon Location Geofences together, you can automatically evaluate the location updates from your IoT devices against your geofences to generate the geofence events. Actions could be taken to generate the alerts based on the areas of interest.

  1. Follow the instructions in the documentation to create the tracker resource from the AWS Management Console. Use this information for the new tracker:
    • Name: Enter a unique name that has a maximum of 100 characters. For example, FlightTracker.
    • Description: Enter an optional description. For example, Tracker for storing device positions.
  2. Configure a Location action to the destination IoT rule that receives messages from the destination IoT topic and publishes them in batches to the configured Tracker device (for example, FlightTracker). The parameters in the JSON data that is returned to the Location action can also be configured via substitution templates.

Geofence collection

Geofences contain points and vertices that form a closed boundary, which defines an area of interest. For example, flight origin and destination details. You can use tools, such as GeoJSON.io, to draw geofences and save the output as a GeoJSON file. Follow the instructions in the documentation to create the GeoJSON file and link it to the geofence collection.

  1. Create the geofence collection with a GeoJSON file and link it to the tracker you just created.
  2. Link the tracker to the geofence by following these instructions and start tracking the device’s location updates. You can link them together so that you automatically evaluate location updates against all your geofences. You can evaluate device positions against geofences on demand as well.

When device positions are evaluated against geofences, they generate events. For example, when a plane enters or exits a location specified in the geofence.

You can configure EventBridge with rules to react to these events. You can set up SNS to notify your clients when a specific tracker device location changes. Follow the instructions in the documentation on how to set up EventBridge rules to integrate with Amazon Location Service events.

Testing the solution

You can test the first part of the solution by sending an IoT message with location details in the JSON format from the source account and verify that the message arrives at the destination account SQS queue. Detailed instructions to publish a test message from the source account that includes location information (latitude and longitude) can be found here.

Messages from the destination account SQS queue are published to the Amazon Location Service Tracker. When the location in the test message matches the criteria provided in the geofence, Amazon Location Service generates an event. EventBridge has a rule configured that gets matched when an Amazon Location tracker event arrives, and the rule target is an SNS topic that sends an email or text message to the client.

Cleaning up

To avoid incurring future charges, delete the CloudFormation stacks, location tracker, and geofence collection created as part of the solution walk-through. Replace the resource identifiers in the following commands with the ID/name of the resources.

  1. Delete the SAM application stack:
    aws cloudformation delete-stack --stack-name <StackName>
    

    Refer to this documentation for further information.

  2. Delete the location tracker:
    aws location delete-tracker --tracker-name <TrackerName>
  3. Delete the geofence collection:
    aws location delete-geofence-collection --collection-name <GeoCollectionName>

Conclusion

This blog post shows how to create a serverless solution for cross account IoT message publishing and tracking device location updates using Amazon Location Service.

It describes the process of how to publish AWS IoT messages across multiple accounts. Integration with the Amazon Location Service shows how to track IoT device location updates and generate alerts, alleviating the need for manual device location tracking.

For more serverless learning resources, visit Serverless Land.

AWS Week in Review – December 19, 2022

Post Syndicated from Sébastien Stormacq original https://aws.amazon.com/blogs/aws/aws-week-in-review-december-19-2022/

We are half way between the re:Invent conference and the end-of-year holidays, and I did expect the cadence of releases and news to slow down a bit, but nothing is further away from reality. Our teams continue to listen to your feedback and release new capabilities and incremental improvements.

This week, many items caught my attention. Here is my summary.

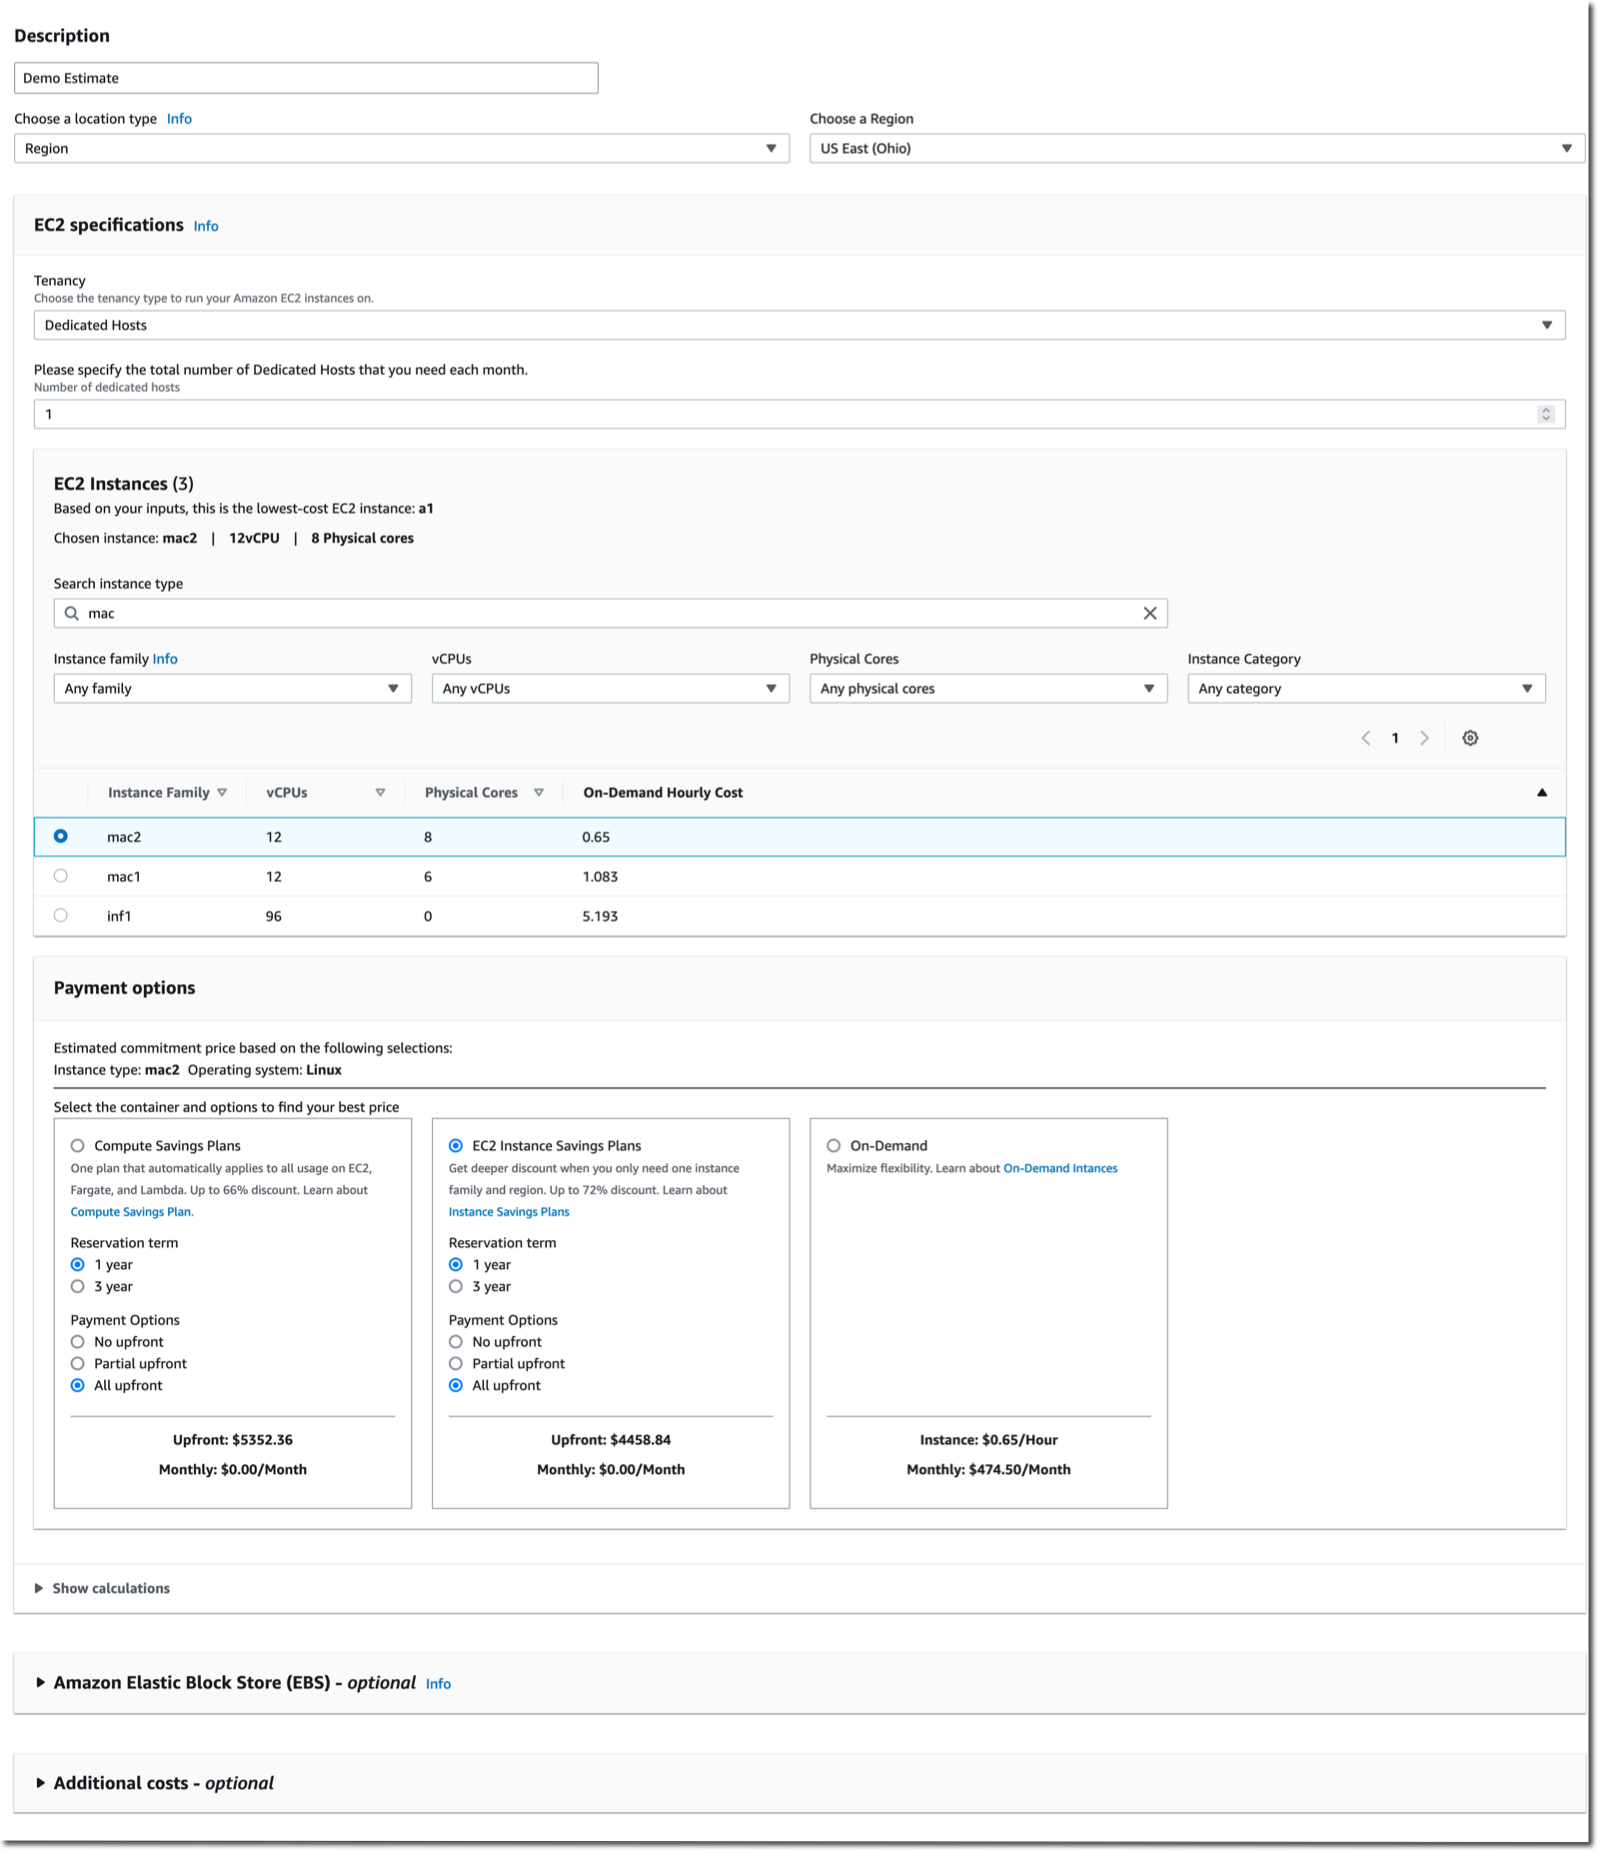
The AWS Pricing Calculator for Amazon EC2 is getting a redesign to provide you with a simplified, consistent, and efficient calculator to estimate costs. It also added a way to bulk estimate costs for EC2 instances, EC2 Dedicated Hosts, and Amazon EBS services. Try it for yourself today.

AWS Pricing Calculator

Amazon CloudWatch Metrics Insights alarms now enables you to trigger alarms on entire fleets of dynamically changing resources (such as automatically scaling EC2 instances) with a single alarm using standard SQL queries. For example, you can now write a query like this to collect data about CPU utilization over your entire dynamic fleet of EC2 instances.

SELECT AVG(CPUUtilization) FROM SCHEMA("AWS/EC2", InstanceId)

AWS Amplify is a command line tool and a set of libraries to help you to build web and mobile applications connected to a cloud backend. We released Amplify Library for Android 2.0, with improvements and simplifications for user authentication. The team also released Amplify JavaScript library version 5, with improvements for React and React Native developers, such as a new notifications channel, also known as in-app messaging, that developers can use to display contextual messages to their users based on their behavior. The Amplify JavaScript library has also received improvements to reduce the overall bundle size and installation size.

Amazon Connect added granular access control based on resource tags for routing profiles, security profiles, users, and queues. It also adds bulk import for user hierarchy tags. This allows you to use attribute-based access control policies for Amazon Connect resources.

Amazon RDS Proxy now supports PostgreSQL major version 14. RDS Proxy is a fully managed, highly available database proxy for Amazon Relational Database Service (Amazon RDS) that makes applications more scalable, more resilient to database failures, and more secure. It is typically used by serverless applications that can have a large number of open connections to the database server and may open and close database connections at a high rate, exhausting database memory and compute resources.

AWS Gateway Load Balancer endpoints now support Ipv6 addresses. You can now send IPv6 traffic through Gateway Load Balancers and its endpoints to distribute traffic flows to dual stack appliance targets.

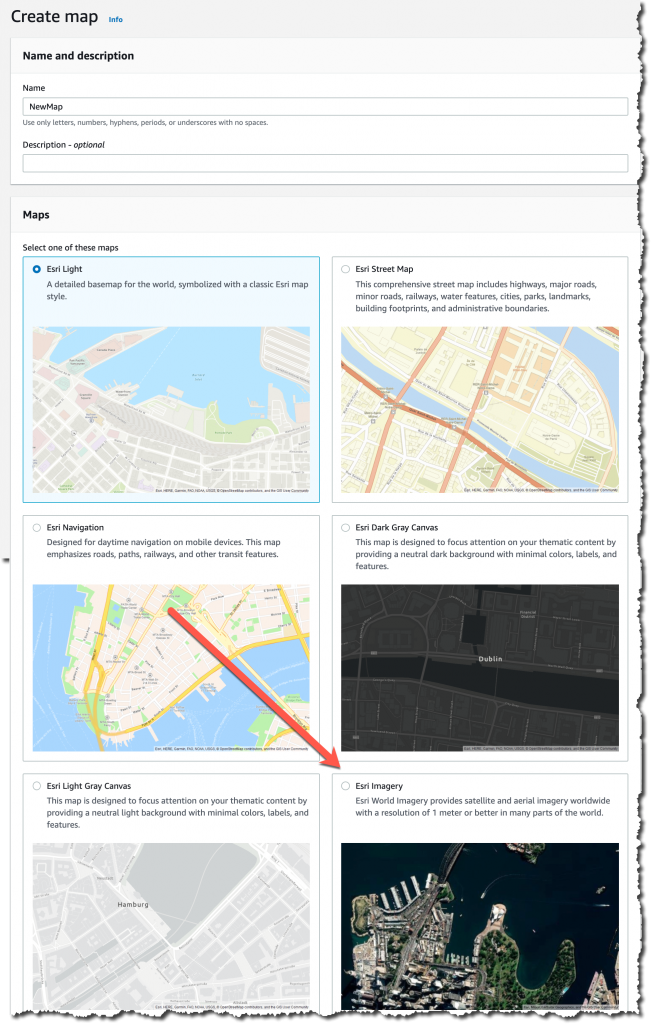
Amazon Location Service now provides Open Data Maps maps, in addition to ESRI and Here maps. I also noticed that Amazon is a core member of the new Overture Maps Foundation, officially hosted by the Linux Foundation. The mission of the Overture Maps Foundation is to power new map products through openly available datasets that can be used and reused across applications and businesses. The program is driven by Amazon Web Services (AWS), Facebook’s parent company Meta, Microsoft, and Dutch mapping company TomTom.

AWS Mainframe Modernization is a set of managed tools providing infrastructure and software for migrating, modernizing, and running mainframe applications. It is now available in three additional AWS Regions and supports AWS CloudFormation, AWS PrivateLink, AWS Key Management Service.

X in Y. Jeff started this section a while ago to list the expansion of new services and capabilities to additional Regions. I noticed 11 Regional expansions this week:

Other AWS News
This week, I also noticed these AWS news items:

Amazon SageMaker turned 5 years old 🎉🎂. You can read the initial blog post we published at the time. To celebrate the event, the Amazon Science published this article where AWS’s Vice President Bratin Saha reflects on the past and future of AWS’s machine learning tools and AI services.

The security blog published a great post about the Cedar policy language. It explains how Amazon Verified Permissions provides a pre-built, flexible permissions system that you can use to build permissions based on both ABAC and RBAC in your applications. Cedar policy language is also at the heart of Amazon Verified Access I blogged about during re:Invent.

And just like every week, my most excellent colleague Ricardo published the open source newsletter.

Upcoming AWS Events
Check your calendars and sign up for these AWS events:

AWS re:Invent recaps in your area. During the re:Invent week, we had lots of new announcements, and in the next weeks, you can find in your area a recap of all these launches. All the events will be posted on this site, so check it regularly to find an event nearby.

AWS re:Invent keynotes, leadership sessions, and breakout sessions are available on demand. I recommend that you check the playlists and find the talks about your favorite topics in one collection.

AWS Summits season will restart in Q2 2023. The dates and locations will be announced here.

Stay Informed
That is my selection for this week! Heads up – the Week in Review will be taking a short break for the end of the year, but we’ll be back with regular updates starting on January 9, 2023. To better keep up with all of this news, do not forget to check out the following resources:

— seb
This post is part of our Week in Review series. Check back each week for a quick roundup of interesting news and announcements from AWS!

Validating addresses with AWS Lambda and the Amazon Location Service

Post Syndicated from James Beswick original https://aws.amazon.com/blogs/compute/validating-addresses-with-aws-lambda-and-the-amazon-location-service/

This post is written by Matthew Nightingale, Associate Solutions Architect.

Traditional methods of performing address validation on geospatial datasets can be expensive and time consuming. Using Amazon Location Service with AWS Lambda in a serverless data processing pipeline, you may achieve significant performance improvements and cost savings on address validation jobs that use geospatial data.

This blog contains a deployable AWS Serverless Application Model (AWS SAM) template. It also uses sample data sourced from publicly available datasets that you can deploy and use to test the application. This blog offers a starting point to build out a serverless address validation pipeline in your own AWS account.

Overview

This application implements a serverless scatter/gather architecture using Lambda and Amazon S3, performing address validation with the Amazon Location Service. An S3 PUT event triggers each Lambda function to run data processing jobs along each step of the pipeline.

To test the application, a user uploads a .CSV file to S3. This dataset is labeled with fields that are recognized by the 2waygeocoder Lambda function. The application returns a processed dataset to S3 appended with location information from the Amazon Location Places API.

Solution overview

  1. The Scatter Lambda function takes a dataset from the S3 bucket labeled input and splits it into equally sized shards.
  2. The Process Lambda function takes each shard from the pre-processed bucket. It performs address validation in parallel with a 2waygeocoder function calling the Amazon Location Service Places API.
  3. The Gather Lambda function takes each shard from the post-processed bucket. It appends the data into a complete dataset with additional address information.

Amazon Location Service

Amazon Location Service sources high-quality geospatial data from HERE and ESRI to support searches by using a place index resource.

With the Amazon Locations Places API, you can convert addresses and other textual queries into geographic coordinates (also known as geocoding). You can also convert geographic positions into addresses and place descriptions (known as reverse geocoding).

The example application includes a 2waygeocoder capable of both geocoding and reverse geocoding. The next section shows examples of the call and response from the Amazon Location Places API for both geocoding and reverse geocoding.

Geocoding with Amazon Location Service

Here is an example of calling the Amazon Location Service Places API using the AWS SDK for Python (Boto3). This uses the search_place_index_for_text method:

Response = location.search_place_index_for_text(
	IndexName = ‘explore.place’ 
###index is created using Amazon Location service
	Text = “Boston, MA”)
location_response = Reponse[“Results”]
print(location_response)

Example response:

Response

Example reverse-geocoding with Amazon Location Service

Here is another example of calling the Amazon Location Service Places API using the AWS SDK for Python (boto3). This uses the search_place_index_for_position method:

Response = location.search_place_index_for_position(
	IndexName = ‘explore.place’ 
###index is created using Amazon Location service
	Position = “-71.056739, 42.358660”))
location_response = Reponse[“Results”]
print(location_response)

Example response:

Response

Design considerations

Processing data with Lambda in parallel using a serverless scatter/gather pipeline helps provide performance efficiency at lower cost. To provide even greater performance, you can optimize your Lambda configuration for higher throughput. There are several strategies you can implement to do this and a key few topics to keep in mind.

Increase the allocated memory for your Lambda function

The simplest way to increase throughput is to increase the allocated memory of the Lambda function.

Faster Lambda functions can process more data and increase throughput. This works even if a Lambda function’s memory utilization is low. This is because increasing memory also increases vCPUs in proportion to the amount configured. Each function supports up to 10 GB of memory and you can access up to six vCPUs per function.

To see the average cost and execution speed for each memory configuration, the Lambda Power Tuning tool helps to visualize the tradeoffs.

Optimize shard size

Another method for increasing performance in a serverless scatter/gather architecture is to optimize the total number of shards created by the scatter function. Increasing the total number of shards consequently reduces the size of any single shard, allowing Lambda to process each shard faster.

When scaling with Lambda, one instance of a function handles one request at a time. When the number of requests increases, Lambda creates more instances of the function to process traffic. Because S3 invokes Lambda asynchronously, there is an internal queue buffering requests between the event source and the Lambda service.

In a serverless scatter/gather architecture, having more shards results in more concurrent invocations of the process Lambda function. For more information about scaling and concurrency with Lambda, see this blog post. Increasing concurrency with Lambda can lead to API request throttling.

Consider API request throttling with your concurrent Lambda functions

In a serverless scatter/gather architecture, the rate at which your code calls APIs increases by a factor equal to the number of concurrent Lambda functions. This means API request limits can quickly be exceeded. You must consider Service Quotas and API request limits when trying to increase the performance of your serverless scatter/gather architecture.

For example, the Amazon Location Places APIs called in the processing function of this application has a default limit of 50 API requests per second. The 2waygeocoder calls on average about 12 APIs per second. Splitting the application into more than four shards may cause API throttling exception errors in this case. Requests to increase Service Quotas can be made through your AWS account.

Deploying the solution

You need the following perquisites to deploy the example application:

Deploy the example application:

  1. Clone the repository and download the sample source code to your environment where AWS SAM is installed:
    git clone https://github.com/aws-samples/amazon-location-service-serverless-address-validation
  2. Change into the project directory containing the template.yaml file:
    cd ~/environment/amazon-location-service-serverless-address-validation
  3. Build the application using AWS SAM:
    sam build
    Terminal output
  4. Deploy the application to your account using AWS SAM. Be sure to follow proper S3 naming conventions providing globally unique names for S3 buckets:
    sam deploy --guided
    Deployment output

Testing the application

Testing geocoding

To test the application, download the dataset that is linked in Testing the Application section of the GitHub repository. These tests demonstrate both the geocoding and reverse-geocoding capabilities of the application.

First, test the geocoding capabilities. You perform address validation on the City of Hartford Business Listing dataset linked in the GitHub repository. The dataset contains a listing of all the active businesses registered in the city Hartford, CT, and each business address. The GitHub repo links to an external website where you can download the dataset.

  1. Download the .csv version of the City of Hartford Business Listing dataset. The link is found in the Testing the Application section of the README file on GitHub.
  2. Open the file locally to explore its contents.
  3. Ensure that the .csv file contains columns labeled as “Address”, “City”, and “State”. The 2waygeocoder deployed as part of the AWS SAM template recognizes these columns to perform geocoding.
  4. Before testing the application’s geocoding capabilities, explore the pricing of Amazon Location Service. In order to save money, you can trim the length of the dataset for testing by removing rows. Once the dataset is trimmed to a desired length, navigate to S3 in the AWS Management Console.
  5. Upload the dataset to the S3 bucket labeled “input”. This triggers the scatter function.
  6. Navigate to the S3 bucket labeled “raw” to view the shards of your dataset created by the scatter function.
  7. Navigate to Lambda and select the 2waygeocoder function to view the CloudWatch Logs to see any information that is returned by the function code in near-real-time.
  8. Once the data is processed, navigate to the S3 bucket labeled “destination” to view the complete processed dataset that is created by the gather function. It may take several minutes for your dataset to finish processing.

Congratulations! You have successfully geocoded a dataset using Amazon Location Service with a serverless address validation pipeline.

Testing reverse-geocoding

Next, test the reverse-geocoding capabilities of the application. You perform address validation on the Miami Housing Dataset linked in the GitHub repository. This dataset contains information on 13,932 single-family homes sold in Miami. The repo links to an external website where you can download the dataset.

Before testing, explore the pricing of Amazon Location Service. To start the test:

  1. Download the zip file containing the .csv version of the dataset from . The link is found in the Testing the Application section of the README file on GitHub.
  2. Open the file locally to explore its contents.
  3. Ensure the .csv file contains columns A and B labeled “Latitude” and “Longitude”. You must edit these column headers to match the correct format that is recognized by the 2waygeocoder to perform reverse-geocoding. Only the “L” should be capitalized.
  4. To minimize cost, trim the length of the dataset for testing by removing rows. At the full size of ~13,933 rows, the dataset takes approx. 5 minutes to process.
  5. Once the dataset is trimmed to a desired length and both column A and B are labeled as “Latitude” and “Longitude” respectively, navigate to S3 in the AWS Management Console, and upload the dataset to your S3 bucket labeled “Input”.
  6. Navigate to the S3 bucket labeled “raw” to view the shards of your dataset.
  7. Navigate to Lambda and select the 2waygeocoder function to view the CloudWatch Logs to see any information that is returned by the function code in near-real-time.
  8. Navigate to the S3 bucket labeled “destination” to view the complete processed dataset that is created by the gather function. It may take several minutes for your dataset to finish processing.

Congratulations! You have successfully reverse-geocoded a dataset with Amazon Location Service using a serverless scatter/gather pipeline. You can move on to the conclusion, or continue to test the geocoding capabilities of the application with additional datasets.

Next steps

To get started testing your own datasets, use the AWS SAM template from GitHub deployed as part of this blog. Ensure that the labels in your dataset are labeled to match the constructs used in this blog post. The 2waygeocoder recognizes columns labeled “Latitude” and “Longitude” to perform reverse-geocoding, and “Address”, “City”, and “State” to perform geocoding.

Now that the data has been geocoded by Amazon Location Service and is in S3, you can use Amazon QuickSight geospatial charts to quickly and easily create interactive charts. For information on how to create a Dataset in QuickSight using Amazon S3 Files, check out the QuickSight User Guide.

Below is an example using QuickSight Geospatial charts to map the Miami housing dataset. The map shows average sale price by zipcode:

QuickSight map

This example uses QuickSight geospatial charts to map the City of Hartford Business dataset. The map shows DBA (doing business as) by latitude and longitude:

Dataset visualization

Conclusion

This blog post performs address validation with the Amazon Location Service, demonstrating both geocoding and reverse geocoding capabilities.

Using a serverless architecture with S3 and Lambda, you can achieve both cost optimization and performance improvement compared with traditional methods of address validation. Using this application, your organization can better understand and harness geospatial data.

For more serverless learning resources, visit Serverless Land.

Simulated location data with Amazon Location Service

Post Syndicated from Aaron Sempf original https://aws.amazon.com/blogs/devops/simulated-location-data-with-amazon-location-service/

Modern location-based applications require the processing and storage of real-world assets in real-time. The recent release of Amazon Location Service and its Tracker feature makes it possible to quickly and easily build these applications on the AWS platform. Tracking real-world assets is important, but at some point when working with Location Services you will need to demo or test location-based applications without real-world assets.

Applications that track real-world assets are difficult to test and demo in a realistic setting, and it can be hard to get your hands on large amounts of real-world location data. Furthermore, not every company or individual in the early stages of developing a tracking application has access to a large fleet of test vehicles from which to derive this data.

Location data can also be considered highly sensitive, because it can be easily de-anonymized to identify individuals and movement patterns. Therefore, only a few openly accessible datasets exist and are unlikely to exhibit the characteristics required for your particular use-case.

To overcome this problem, the location-based services community has developed multiple openly available location data simulators. This blog will demonstrate how to connect one of those simulators to Amazon Location Service Tracker to test and demo your location-based services on AWS.

Walk-through

Part 1: Create a tracker in Amazon Location Service

This walkthrough will demonstrate how to get started setting up simulated data into your tracker.

Amazon location Service console
Step 1: Navigate to Amazon Location Service in the AWS Console and select “Trackers“.

Step 2: On the “Trackers” screen click the orange “Create tracker“ button.

Select Create Tracker

Create a Tracker form

Step 3: On the “Create tracker” screen, name your tracker and make sure to reply “Yes” to the question asking you if you will only use simulated or sample data. This allows you to use the free-tier of the service.

Next, click “Create tracker” to create you tracker.

Confirm create tracker

Done. You’ve created a tracker. Note the “Name” of your tracker.

Generate trips with the SharedStreets Trip-simulator

A common option for simulating trip data is the shared-steets/trip-simulator project.

SharedStreets maintains an open-source project on GitHub – it is a probabilistic, multi-agent GPS trajectory simulator. It even creates realistic noise, and thus can be used for testing algorithms that must work under real-world conditions. Of course, the generated data is fake, so privacy is not a concern.

The trip-simulator generates files with a single GPS measurement per line. To playback those files to the Amazon Location Service Tracker, you must use a tool to parse the file; extract the GPS measurements, time measurements, and device IDs of the simulated vehicles; and send them to the tracker at the right time.

Before you start working with the playback program, the trip-simulator requires a map to simulate realistic trips. Therefore, you must download a part of OpenStreetMap (OSM). Using GeoFabrik you can download extracts at the size of states or selected cities based on the area within which you want to simulate your data.

This blog will demonstrate how to simulate a small fleet of cars in the greater Munich area. The example will be written for OS-X, but it generalizes to Linux operating systems. If you have a Windows operating system, I recommend using Windows Subsystem for Linux (WSL). Alternatively, you can run this from a Cloud9 IDE in your AWS account.

Step 1: Download the Oberbayern region from download.geofabrik.de

Prerequisites:

curl https://download.geofabrik.de/europe/germany/bayern/oberbayern-latest.osm.pbf -o oberbayern-latest.osm.pbf

Step 2: Install osmium-tool

Prerequisites:

brew install osmium-tool

Step 3: Extract Munich from the Oberbayern map

osmium extract -b "11.5137,48.1830,11.6489,48.0891" oberbayern-latest.osm.pbf -o ./munich.osm.pbf -s "complete_ways" --overwrite

Step 4: Pre-process the OSM map for the vehicle routing

Prerequisites:

docker run -t -v $(pwd):/data osrm/osrm-backend:v5.25.0 osrm-extract -p /opt/car.lua /data/munich.osm.pbf
docker run -t -v $(pwd):/data osrm/osrm-backend:v5.25.0 osrm-contract /data/munich.osrm

Step 5: Install the trip-simulator

Prerequisites:

npm install -g trip-simulator

Step 6: Run a 10 car, 30 minute car simulation

trip-simulator \
  --config car \
  --pbf munich.osm.pbf \
  --graph munich.osrm \
  --agents 10 \
  --start 1563122921000 \
  --seconds 1800 \
  --traces ./traces.json \
  --probes ./probes.json \
  --changes ./changes.json \
  --trips ./trips.json

The probes.json file is the file containing the GPS probes we will playback to Amazon Location Service.

Part 2: Playback trips to Amazon Location Service

Now that you have simulated trips in the probes.json file, you can play them back in the tracker created earlier. For this, you must write only a few lines of Python code. The following steps have been neatly separated into a series of functions that yield an iterator.

Prerequisites:

Step 1: Load the probes.json file and yield each line

import json
import time
import datetime
import boto3

def iter_probes_file(probes_file_name="probes.json"):
    """Iterates a file line by line and yields each individual line."""
    with open(probes_file_name) as probes_file:
        while True:
            line = probes_file.readline()
            if not line:
                break
            yield line

Step 2: Parse the probe on each line
To process the probes, you parse the JSON on each line and extract the data relevant for the playback. Note that the coordinates order is longitude, latitude in the probes.json file. This is the same order that the Location Service expects.

def parse_probes_trip_simulator(probes_iter):
    """Parses a file witch contains JSON document, one per line.
    Each line contains exactly one GPS probe. Example:
    {"properties":{"id":"RQQ-7869","time":1563123002000,"status":"idling"},"geometry":{"type":"Point","coordinates":[-86.73903753135207,36.20418779626351]}}
    The function returns the tuple (id,time,status,coordinates=(lon,lat))
    """
    for line in probes_iter:
        probe = json.loads(line)
        props = probe["properties"]
        geometry = probe["geometry"]
        yield props["id"], props["time"], props["status"], geometry["coordinates"]

Step 3: Update probe record time

The probes represent historical data. Therefore, when you playback you will need to normalize the probes recorded time to sync with the time you send the request in order to achieve the effect of vehicles moving in real-time.

This example is a single threaded playback. If the simulated playback lags behind the probe data timing, then you will be provided a warning through the code detecting the lag and outputting a warning.

The SharedStreets trip-simulator generates one probe per second. This frequency is too high for most applications, and in real-world applications you will often see frequencies of 15 to 60 seconds or even less. You must decide if you want to add another iterator for sub-sampling the data.

def update_probe_record_time(probes_iter):
    """
    Modify all timestamps to be relative to the time this function was called.
    I.e. all timestamps will be equally spaced from each other but in the future.
    """
    new_simulation_start_time_utc_ms = datetime.datetime.now().timestamp() * 1000
    simulation_start_time_ms = None
    time_delta_recording_ms = None
    for i, (_id, time_ms, status, coordinates) in enumerate(probes_iter):
        if time_delta_recording_ms is None:
            time_delta_recording_ms = new_simulation_start_time_utc_ms - time_ms
            simulation_start_time_ms = time_ms
        simulation_lag_sec = (
            (
                datetime.datetime.now().timestamp() * 1000
                - new_simulation_start_time_utc_ms
            )
            - (simulation_start_time_ms - time_ms)
        ) / 1000
        if simulation_lag_sec > 2.0 and i % 10 == 0:
            print(f"Playback lags behind by {simulation_lag_sec} seconds.")
        time_ms += time_delta_recording_ms
        yield _id, time_ms, status, coordinates

Step 4: Playback probes
In this step, pack the probes into small batches and introduce the timing element into the simulation playback. The reason for placing them in batches is explained below in step 6.

def sleep(time_elapsed_in_batch_sec, last_sleep_time_sec):
    sleep_time = max(
        0.0,
        time_elapsed_in_batch_sec
        - (datetime.datetime.now().timestamp() - last_sleep_time_sec),
    )
    time.sleep(sleep_time)
    if sleep_time > 0.0:
        last_sleep_time_sec = datetime.datetime.now().timestamp()
    return last_sleep_time_sec


def playback_probes(
    probes_iter,
    batch_size=10,
    batch_window_size_sec=2.0,
):
    """
    Replays the probes in live mode.
    The function assumes, that the probes returned by probes_iter are sorted
    in ascending order with respect to the probe timestamp.
    It will either yield batches of size 10 or smaller batches if the timeout is reached.
    """
    last_probe_record_time_sec = None
    time_elapsed_in_batch_sec = 0
    last_sleep_time_sec = datetime.datetime.now().timestamp()
    batch = []
    # Creates two second windows and puts all the probes falling into
    # those windows into a batch. If the max. batch size is reached it will yield early.
    for _id, time_ms, status, coordinates in probes_iter:
        probe_record_time_sec = time_ms / 1000
        if last_probe_record_time_sec is None:
            last_probe_record_time_sec = probe_record_time_sec
        time_to_next_probe_sec = probe_record_time_sec - last_probe_record_time_sec
        if (time_elapsed_in_batch_sec + time_to_next_probe_sec) > batch_window_size_sec:
            last_sleep_time_sec = sleep(time_elapsed_in_batch_sec, last_sleep_time_sec)
            yield batch
            batch = []
            time_elapsed_in_batch_sec = 0
        time_elapsed_in_batch_sec += time_to_next_probe_sec
        batch.append((_id, time_ms, status, coordinates))
        if len(batch) == batch_size:
            last_sleep_time_sec = sleep(time_elapsed_in_batch_sec, last_sleep_time_sec)
            yield batch
            batch = []
            time_elapsed_in_batch_sec = 0
        last_probe_record_time_sec = probe_record_time_sec
    if len(batch) > 0:
        last_sleep_time_sec = sleep(time_elapsed_in_batch_sec, last_sleep_time_sec)
        yield batch

Step 5: Create the updates for the tracker

LOCAL_TIMEZONE = (
    datetime.datetime.now(datetime.timezone(datetime.timedelta(0))).astimezone().tzinfo
)

def convert_to_tracker_updates(probes_batch_iter):
    """
    Converts batches of probes in the format (id,time_ms,state,coordinates=(lon,lat))
    into batches ready for upload to the tracker.
    """
    for batch in probes_batch_iter:
        updates = []
        for _id, time_ms, _, coordinates in batch:
            # The boto3 location service client expects a datetime object for sample time
            dt = datetime.datetime.fromtimestamp(time_ms / 1000, LOCAL_TIMEZONE)
            updates.append({"DeviceId": _id, "Position": coordinates, "SampleTime": dt})
        yield updates

Step 6: Send the updates to the tracker
In the update_tracker function, you use the batch_update_device_position function of the Amazon Location Service Tracker API. This lets you send batches of up to 10 location updates to the tracker in one request. Batching updates is much more cost-effective than sending one-by-one. You pay for each call to batch_update_device_position. Therefore, batching can lead to a 10x cost reduction.

def update_tracker(batch_iter, location_client, tracker_name):
    """
    Reads tracker updates from an iterator and uploads them to the tracker.
    """
    for update in batch_iter:
        response = location_client.batch_update_device_position(
            TrackerName=tracker_name, Updates=update
        )
        if "Errors" in response and response["Errors"]:
            for error in response["Errors"]:
                print(error["Error"]["Message"])

Step 7: Putting it all together
The follow code is the main section that glues every part together. When using this, make sure to replace the variables probes_file_name and tracker_name with the actual probes file location and the name of the tracker created earlier.

if __name__ == "__main__":
    location_client = boto3.client("location")
    probes_file_name = "probes.json"
    tracker_name = "my-tracker"
    iterator = iter_probes_file(probes_file_name)
    iterator = parse_probes_trip_simulator(iterator)
    iterator = update_probe_record_time(iterator)
    iterator = playback_probes(iterator)
    iterator = convert_to_tracker_updates(iterator)
    update_tracker(
        iterator, location_client=location_client, tracker_name=tracker_name
    )

Paste all of the code listed in steps 1 to 7 into a file called trip_playback.py, then execute

python3 trip_playback.py

This will start the playback process.

Step 8: (Optional) Tracking a device’s position updates
Once the playback is running, verify that the updates are actually written to the tracker repeatedly querying the tracker for updates for a single device. Here, you will use the get_device_position function of the Amazon Location Service Tracker API to receive the last known device position.

import boto3
import time

def get_last_vehicle_position_from_tracker(
    device_id, tracker_name="your-tracker", client=boto3.client("location")
):
    response = client.get_device_position(DeviceId=device_id, TrackerName=tracker_name)
    if response["ResponseMetadata"]["HTTPStatusCode"] != 200:
        print(str(response))
    else:
        lon = response["Position"][0]
        lat = response["Position"][1]
        return lon, lat, response["SampleTime"]
        
if __name__ == "__main__":   
    device_id = "my-device"     
    tracker_name = "my-tracker"
    while True:
        lon, lat, sample_time = get_last_vehicle_position_from_tracker(
            device_id=device_id, tracker_name=tracker_name
        )
        print(f"{lon}, {lat}, {sample_time}")
        time.sleep(10)

In the example above, you must replace the tracker_name with the name of the tracker created earlier and the device_id with the ID of one of the simulation vehicles. You can find the vehicle IDs in the probes.json file created by the SharedStreets trip-simulator. If you run the above code, then you should see the following output.

location probes data

AWS IoT Device Simulator

As an alternative, if you are familiar with AWS IoT, AWS has its own vehicle simulator that is part of the IoT Device Simulator solution. It lets you simulate a vehicle fleet moving on a road network. This has been described here. The simulator sends the location data to an Amazon IoT endpoint. The Amazon Location Service Developer Guide shows how to write and set-up a Lambda function to connect the IoT topic to the tracker.

The AWS IoT Device Simulator has a GUI and is a good choice for simulating a small number of vehicles. The drawback is that only a few trips are pre-packaged with the simulator and changing them is somewhat complicated. The SharedStreets Trip-simulator has much more flexibility, allowing simulations of fleets made up of a larger number of vehicles, but it has no GUI for controlling the playback or simulation.

Cleanup

You’ve created a Location Service Tracker resource. It does not incur any charges if it isn’t used. If you want to delete it, you can do so on the Amazon Location Service Tracker console.

Conclusion

This blog showed you how to use an open-source project and open-source data to generate simulated trips, as well as how to play those trips back to the Amazon Location Service Tracker. Furthermore, you have access to the AWS IoT Device Simulator, which can also be used for simulating vehicles.

Give it a try and tell us how you test your location-based applications in the comments.

About the authors

Florian Seidel

Florian is a Solutions Architect in the EMEA Automotive Team at AWS. He has worked on location based services in the automotive industry for the last three years and has many years of experience in software engineering and software architecture.

Aaron Sempf

Aaron is a Senior Partner Solutions Architect, in the Global Systems Integrators team. When not working with AWS GSI partners, he can be found coding prototypes for autonomous robots, IoT devices, and distributed solutions.

Access Amazon Location Service from Amazon Redshift

Post Syndicated from Parag Srivastava original https://aws.amazon.com/blogs/big-data/access-amazon-location-service-from-amazon-redshift/

Organizations typically store business and customer data in databases like Amazon Relational Database Service (Amazon RDS) and Amazon Redshift, and often want to enrich this data by integrating with external services. One such enrichment is to add spatial attributes such as location coordinates for an address. With the introduction of Amazon Location Service, you now have access to geospatial functionalities such as map visualization, geocoding, and reverse geocoding using data providers such as Esri and HERE.

Moreover, with the ability of Amazon Redshift and RDS databases to call AWS Lambda functions through user-defined functions (UDFs), you can now integrate these databases with geospatial functionality provided by Amazon Location Service. For more information about user-defined functions in Amazon Redshift, see Creating a scalar Lambda UDF.

In this post, we take customer addresses stored in an Amazon Redshift database and call Amazon Location Service geocoding APIs to find the coordinates of the addresses and persist them in the database. If you are using Amazon Redshift, see Access Amazon Location Service from Amazon Redshift.

Prerequisites

Before you get started, make sure you have the following prerequisites:

  • An understanding of basic concepts such as AWS Identity and Access Management (IAM) roles and policies, Lambda functions, and Amazon Redshift.
  • An Amazon Redshift cluster with a table that contains customer addresses and the following details: street number, street name, street type, municipality name, state or province code, postal or zip code, and country code. You also need a column to save the coordinates for the address.
  • A SQL developer tool of your choice to connect to the Amazon Redshift cluster.
  • An Amazon QuickSight account with access to Amazon Redshift.

Solution overview

Our solution consists of the following components:

  • A Python Lambda function to call the search_place_index_for_text function. This function takes a text input and returns the coordinates as longitude and latitude values for each search result.
  • An IAM role to allow Lambda to call the SearchPlaceIndexForText operation for Amazon Location Service.
  • A Lambda UDF in the Amazon Redshift database to invoke the Lambda function.
  • An IAM role to allow Amazon Redshift to invoke the Lambda function.
  • SQL statements to update and select the coordinate data for records in the Amazon Redshift database by calling the Lambda UDF.
  • A QuickSight dataset that uses the SQL statement to access the coordinate data.
  • A QuickSight analysis that displays the address location in a geospatial chart.

The following diagram illustrates our solution architecture:

To implement the solution, we complete the following steps:

  1. Set up a place index resource for Amazon Location Service.
  2. Create a common address geocoding function.
  3. Invoke the Amazon Location Service API from Amazon Redshift.
  4. Create a Lambda function.
  5. Set up Amazon Redshift.
  6. Run SQL statements to invoke the Lambda function.
  7. Visualize the address locations in QuickSight.

Pay close attention to names and parameters used in this post; they must match and be consistent across all solution components.

The full code is available in GitHub. The code also includes an AWS CloudFormation template.

Set up a place index resource for Amazon Location Service

Amazon Location Service uses a place index resource for providing geocoding and reverse geocoding functionality. Let’s start by creating a new place index resource. Your account may have a default place index but we don’t use it for this post because it isn’t configured for storage.

  1. On the Amazon Location Service console, use the navigation pane to launch the wizard to create a new place index.
  2. For Name, enter placeindex.redshift.
  3. For Data provider, select either of the data providers for your place index.
  4. For Data storage options, select Yes, results will be stored because we’re saving the geocoding results in a database field.
  5. Leave all other values as their default and choose Create place index.

We use the place index name in the Lambda code as a parameter to the search_place_index_for_text API call.

Create a common address geocoding Lambda function

Next, let’s create a Lambda function to call the Amazon Location Service API. We reuse this function code for both Amazon Redshift and Amazon RDS because the underlying service call is the same.

Error handling has been skipped in this code snippet for brevity. The full code is available in GitHub.

We use country_code to limit the search_place_index_for_text API to a particular country using the ISO 3166-1 alpha-3 country code. Amazon Location Service throws an exception if an input is provided but doesn’t contain a valid value.

Create a new file geocode.py with the following code snippet:

import boto3
import os

location = boto3.client("location")

def geocode_address(address_line, municipality_name, state_code, post_code, country_code):

    text = ("%s, %s %s %s" % (address_line, municipality_name, state_code, post_code))
    response = location.search_place_index_for_text(IndexName="placeindex.redshift", FilterCountries=[country_code], Text=text)

    data = response["Results"]
    if len(data) >= 1:
        response = {
            "Longitude": data[0]["Place"]["Geometry"]["Point"][0],
            "Latitude": data[0]["Place"]["Geometry"]["Point"][1],
            "Label": data[0]["Place"]["Label"],
            "MultipleMatch": False
        }
        
        if len(data) > 1:
            response["MultipleMatch"] = True
    else:
        response = {
            "Error": "No geocoding results found"
        }
        
    return response

Invoke the Amazon Location Service API from Amazon Redshift

Each Amazon Redshift compute node invokes Lambda functions in parallel in order to return the results quickly. The function returns a success or fail status code along with the results. In case of a failure, an error message can be returned back.

The Amazon Redshift Lambda UDF invocation provides an arguments list containing an ordered list of input parameters representing fields of the database records (see the following code). The function reads the input parameters by the list position and maps them to variables for processing the request.

{
   "arguments":[
      [
         "410 TERRY AVE N",
         "SEATTLE",
         "WA",
         "98109",
         "USA"
      ],
      [
         "510 W GEORGIA ST",
         "VANCOUVER",
         "BC",
         "V6B0M3",
         "CAN"
      ]
   ],
   "num_records":2
}

The interface expects results to be returned in the same order and containing the same number of items as the request. See the following code:

{
   "success":true,
   "results":[
      {
         "Longitude":-122.33664798659117,
         "Latitude":47.62231899780329,
         "Label":"410 Terry Ave N, Seattle, WA, 98109, USA",
         "MultipleMatch":false
      },
      {
         "Longitude":-123.11693997267491,
         "Latitude":49.281259993687854,
         "Label":"510 W Georgia St, Vancouver, British Columbia, V6B 0M3, CAN",
         "MultipleMatch":true
      }
   ]
}

In case of an exception, the function can return the fail status along with an error message:

{
  "success": false,
  "error_msg": "Error in processing request"
}

Create a Lambda function

We now create a Lambda function GeocodeAddresses-Redshift using the Python runtime.

Error handling has been skipped in this code snippet for brevity. The full code is available in GitHub.

  1. Create the file geocode.py as described in the previous section.

It’s important to set the timeout on the Lambda function to a longer duration to process multiple records in one call.

  1. Replace the default generated code in lambda_function.py with the following code:
import json
from geocode import *

def lambda_handler(event, context):

    try:
        response = dict()
        records = event["arguments"]
        results = []

        for record in records:
            address_line, municipality_name, state_code, post_code, country_code = record
            try:
                results.append(json.dumps(geocode_address(address_line, municipality_name, state_code, post_code, country_code)))
            except:
                results.append(None)
            
        response['success'] = True
        response['results'] = results
    except Exception as e:
        response['success'] = False
        response['error_msg'] = str(e)
    
    return json.dumps(response)
  1. This function requires permission to call the search_place_index_for_text API to geocode addresses using the place index placeindex.redshift that we created earlier.
  2. Update the IAM role for the Lambda function to add the following inline policy GeocodeAddresses-Redshift-policy:
{
    "Version": "2012-10-17",
    "Statement": [
        {
            "Action": [
                "geo:SearchPlaceIndexForText"
            ],
            "Resource": "arn:aws:geo:<Region>:<AccountId>:place-index/placeindex.redshift",
            "Effect": "Allow"
        }
    ]
}

Set up Amazon Redshift

Now we create a new Lambda UDF in Amazon Redshift and configure it to use an IAM role that gives the permissions to invoke the specific Lambda function. For more information, see Creating a scalar Lambda UDF.

  1. Create an IAM role Redshift-Lambda-role and add the following inline policy Redshift-Lambda-policy to this role to allow Amazon Redshift to invoke the GeocodeAddresses-Redshift function that we created:
{
    "Version": "2012-10-17",
    "Statement": [
        {
            "Effect": "Allow",
            "Action": "lambda:InvokeFunction",
            "Resource": [
                "arn:aws:lambda:<Region>:<AccountId>:function:GeocodeAddresses-Redshift"
            ]
        }
    ]
}

We need to associate this IAM role with the Amazon Redshift cluster.

  1. On the Amazon Redshift console, choose the cluster to use.
  2. Under Manage IAM Roles, add the Redshift-Lambda-role role to the cluster.
  3. Wait for the cluster to be modified and be in Available status.

Now we create an Amazon Redshift external function to invoke a Lambda function.

  1. Use your preferred SQL editor to connect to your Amazon Redshift cluster and create a new external function f_geocode_address in Amazon Redshift using the following code:
CREATE OR REPLACE EXTERNAL FUNCTION public.f_geocode_address(VARCHAR, VARCHAR,
                                                             VARCHAR, VARCHAR,
                                                             VARCHAR)
RETURNS VARCHAR
STABLE
LAMBDA 'GeocodeAddresses-Redshift'
IAM_ROLE 'arn:aws:iam::<AccountId>:role/Redshift-Lambda-role';

This external function calls the Lambda function using the permissions provided in the Redshift-Lambda-role role that we created.

Run SQL statements to invoke the Lambda function

We’re now ready to run SQL statements that can take address records from the customer_address table in the Amazon Redshift database and geocode them using Amazon Location Service.

If you don’t have a customer_address table, you can create it using the script included in the full code in GitHub.

You may choose to simply select the geocoding results as part of the SQL statement, as in the following code. It’s important to understand that Lambda functions called from SELECT SQL statements contain fields from multiple database records in each call. Therefore, the timeout on the function should be set to a longer duration to process multiple records in one call.

SELECT customer_id,
       f_geocode_address(address_line,
                         municipality_name,
                         state_code,
                         post_code,
                         country_code)
FROM customer_address
WHERE address_status = 'NEW'
  AND country_code IS NOT NULL;

Geocoding results can be persisted in a separate database table in Amazon Redshift. We can then parse the saved JSON results to extract the geographic coordinates.

CREATE TABLE customer_address_geocode AS
SELECT customer_id,
       address_line,
       municipality_name,
       state_code,
       post_code,
       country_code,
       f_geocode_address(address_line,
                         municipality_name,
                         state_code,
                         post_code,
                         country_code) AS geocode_result
FROM customer_address
WHERE address_status = 'NEW'
  AND country_code IS NOT NULL;

Now let’s extract the geographic coordinates from the results field.

SELECT customer_id,
    cast(json_extract_path_text(geocode_result, 'Longitude') as float) as Longitude,
    cast(json_extract_path_text(geocode_result, 'Latitude') as float) as Latitude
FROM customer_address_geocode;

Visualize the address location using QuickSight

Let’s configure a dataset in QuickSight and create an analysis for this dataset.

  1. Create a new Amazon Redshift data source Redshift-Geocode either using an auto-discovered or manually configured endpoint.
  2. Create a new dataset for the data source using the preceding SELECT statement as a custom SQL.

Now we’re ready to configure our analysis.

  1. On the QuickSight console, create a new QuickSight analysis using the address location dataset.
  2. Choose the Point on map visual type.

  1. Choose the longitude and latitude fields from the fields list and drag them to the Geospatial field wells.

You should now see points on the map representing the customer address locations.

Conclusion

Congratulations! We have successfully integrated Amazon Location Service with Amazon Redshift and geocoded address data in an Amazon Redshift table without leaving our SQL environment. We enriched the address data by adding location coordinates. We also successfully visualized the address locations on a map in QuickSight. You can now explore extending the solution to other functionalities of Amazon Location Service such as reverse geocoding or even integrating with Lambda functions for any other custom functionality.


About the author

Parag Srivastava is a Solutions Architect at Amazon Web Services (AWS), helping enterprise customers with successful cloud adoption and migration. During his professional career, he has been extensively involved in complex digital transformation projects. He is also passionate about building innovative solutions around geospatial aspects of addresses.

Amazon Location Service Is Now Generally Available with New Routing and Satellite Imagery Capabilities

Post Syndicated from Marcia Villalba original https://aws.amazon.com/blogs/aws/amazon-location-service-is-now-generally-available-with-new-routing-and-satellite-imagery-capabilities/

In December of 2020, we made Amazon Location Service available in preview form for you to start building web and mobile applications with location-based features. Today I’m pleased to announce that we are making Amazon Location generally available along with two new features: routing and satellite imagery.

I have been a full-stack developer for over 15 years. On multiple occasions, I was tasked with creating location-based applications. The biggest challenges I faced when I worked with location providers were integrating the applications into the existing application backend and frontend and keeping the data shared with the location provider secure. When Amazon Location was made available in preview last year, I was so excited. This service makes it possible to build location-based applications with a native integration with AWS services. It uses trusted location providers like Esri and HERE and customers remain in control of their data.

Amazon Location includes the following features:

  • Maps to visualize location information.
  • Places to enable your application to offer point-of-interest search functionality, convert addresses into geographic coordinates in latitude and longitude (geocoding), and convert a coordinate into a street address (reverse geocoding).
  • Routes to use driving distance, directions, and estimated arrival time in your application.
  • Trackers to allow you to retrieve the current and historical location of the devices running your tracking-enabled application.
  • Geofences to give your application the ability to detect and act when a tracked device enters or exits a geographical boundary you define as a geofence. When a breach of the geofence is detected, Amazon Location will send an event to Amazon EventBridge, which can trigger a downstream set of actions, like invoking an AWS Lambda function or sending a notification using Amazon Simple Notification Service (SNS). This level of integration with AWS services is one of the most powerful features of Amazon Location. It will help shorten your application’s time to production.

In the preview announcement blog post, Jeff introduced the service functionality in a lot of detail. In this blog post, I want to focus on the new two features: satellite imagery and routing.

Satellite Imagery

You can use satellite imagery to pack your maps with information and provide more context to the map users. It helps the map users answer questions like “Is there a swamp in that area?” or “What does that building look like?”

To get started with satellite imagery maps, go to the Amazon Location console. On Create a new map, choose Esri Imagery. 

Creating a new map with satellite imagery

Routing
With Amazon Location Routes, your application can request the travel time, distance, and all directions between two locations. This makes it possible for your application users to obtain accurate travel-time estimates based on live road and traffic information.

If you provide these extra attributes when you use the route feature, you can get very tailored information including:

  • Waypoints: You can provide a list of ordered intermediate positions to be reached on the route. You can have up to 25 stopover points including the departure and destination.
  • Departure time: When you specify the departure time for this route, you will receive a result optimized for the traffic conditions at that time.
  • Travel mode: The mode of travel you specify affects the speed and the road compatibility. Not all vehicles can travel on all roads. The available travel modes are car, truck and walking. Depending on which travel mode you select, there are parameters that you can tune. For example, for car and truck, you can specify if you want a route without ferries or tolls. But the most interesting results are when you choose the truck travel mode. You can define the truck dimensions and weight and then get a route that is optimized for these parameters. No more trucks stuck under bridges!

Amazon Location Service and its features can be used for interesting use cases with low effort. For example, delivery companies using Amazon Location can optimize the order of the deliveries, monitor the position of the delivery vehicles, and inform the customers when the vehicle is arriving. Amazon Location can be also used to route medical vehicles to optimize the routing of patients or medical supplies. Logistic companies can use the service to optimize their supply chain by monitoring all the delivery vehicles.

To use the route feature, start by creating a route calculator. In the Amazon Location console, choose Route calculators. For the provider of the route information, choose Esri or HERE.

Screenshot of create a new routing calculator

You can use the route calculator from the AWS SDKs, AWS Command Line Interface (CLI) or the Amazon Location HTTP API.

For example, to calculate a simple route between departure and destination positions using the CLI, you can write something like this:

aws location \
    calculate-route \
        --calculator-name MyExampleCalculator \
        --departure-position -123.1376951951309 49.234371474778385 \
        --destination-position -122.83301379875074 49.235860182576886

The departure-position and destination-positions are defined as longitude, latitude.

This calculation returns a lot of information. Because you didn’t define the travel mode, the service assumes that you are using a car. You can see the total distance of the route (in this case, 29 kilometers). You can change the distance unit when you do the calculation. The service also returns the duration of the trip (in this case, 29 minutes). Because you didn’t define when to depart, Amazon Location will assume that you want to travel when there is the least amount of traffic.

{
    "Legs": [{
        "Distance": 26.549,
        "DurationSeconds": 1711,
        "StartPosition":[-123.1377012, 49.2342994],
        "EndPosition": [-122.833014,49.23592],
        "Steps": [{
            "Distance":0.7,
            "DurationSeconds":52,
            "EndPosition":[-123.1281,49.23395],
            "GeometryOffset":0,
            "StartPosition":[-123.137701,49.234299]},
            ...
        ]
    }],
    "Summary": {
        "DataSource": "Esri",
        "Distance": 29.915115551209176,
        "DistanceUnit": "Kilometers",
        "DurationSeconds": 2275.5813682980006,
        "RouteBBox": [
            -123.13769762299995,
            49.23068000000006,
            -122.83301399999999,
            49.258440000000064
        ]
    }
}

It will return an array of steps, which form the directions to get from departure to destination. The steps are represented by a starting position and end position. In this example, there are 11 steps and the travel mode is a car.

Screenshot of route drawn in map

The result changes depending on the travel mode you selected. For example, if you do the calculation for the same departure and destination positions but choose a travel mode of walking, you will get a series of steps that draw the map as shown below. The travel time and distance are different: 24.1 kilometers and 6 hours and 43 minutes.

Map of route when walking

Available Now
Amazon Location Service is now available in the US East (N. Virginia), US East (Ohio), US West (Oregon), Europe (Frankfurt), Europe (Ireland), Europe (Stockholm), Asia Pacific (Singapore), Asia Pacific (Sydney), and Asia Pacific (Tokyo) Regions.

Learn about the pricing models of Amazon Location Service. For more about the service, see Amazon Location Service

Marcia