New – Amazon EC2 Hpc6id Instances Optimized for High Performance Computing

Post Syndicated from Channy Yun original https://aws.amazon.com/blogs/aws/new-amazon-ec2-hpc6id-instances-optimized-for-high-performance-computing/

We have given you the flexibility and ability to run the largest and most complex high performance computing (HPC) workloads with Amazon Elastic Compute Cloud (Amazon EC2) instances that feature enhanced networking like C5n, C6gn, R5n, M5n, and our recently launched HPC instances Hpc6a.

We heard feedback from customers asking us to deliver more options to support their most intensive workloads with higher per-vCPU compute performance as well as larger memory and local disk storage to reduce job completion time for data-intensive workloads like Finite Element Analysis (FEA) and seismic processing.

Announcing Amazon EC2 Hpc6id Instance for HPC Workloads
Today, we announce the general availability of Amazon EC2 Hpc6id instances, a new instance type that is purpose-built for tightly coupled HPC workloads. Amazon EC2 Hpc6id instances are powered by 3rd Gen Intel Xeon Scalable processors (Ice Lake) that run at frequencies up to 3.5 GHz, 1024 GiB memory, 15.2 TB local SSD disk, 200 Gbps Elastic Fabric Adapter (EFA) network bandwidth, which is 4x higher than R6i instances.

Amazon EC2 Hpc6id instances have the best per-vCPU HPC performance when compared to similar x86-based EC2 instances for data-intensive HPC workloads.

Here are the detailed specs:

Instance Name CPUs RAM EFA Network Bandwidth Attached Storage
hpc6id.32xlarge 64 1024 GiB Up to 200 Gbps 15.2 TB local SSD disk

Amazon EC2 Hpc6id Instances Use Cases
Customers running license-bound scenarios can lower infrastructure and HPC software licensing costs with Hpc6id. Other customers with HPC codes that are optimized for Intel-specific features, such as Math Kernel Library or AVX-512, can migrate their largest HPC workloads to Hpc6id and scale up their workloads on AWS by taking advantage of 200 Gbps EFA bandwidth.

Other customers using HPC software codes that are optimized for per-CPU performance are also able to consolidate their workloads on fewer nodes and complete jobs faster with Hpc6id. Faster job completion time helps customers to reduce both infrastructure and software licensing costs. Customers can use Hpc6id instances to quickly carry out complex calculations across a range of cluster sizes—up to tens of thousands of cores.

Customers also can use Hpc6id instances with AWS ParallelCluster to provision Hpc6id instances alongside other instance types, giving customers the flexibility to run different workload types within the same HPC cluster. Hpc6id instances benefit from the AWS Nitro System, a rich collection of building blocks that offloads many of the traditional virtualization functions to dedicated hardware and software to deliver high performance, high availability, and high security while also reducing virtualization overhead.

Now Available
Amazon EC2 Hpc6id instances are available for purchase as On-Demand or Reserved Instances or with Savings Plans. Hpc6id instances are available in the US East (Ohio) and AWS GovCloud (US-West) Regions. To optimize Amazon EC2 Hpc6id instances networking for tightly coupled workloads, use cluster placement groups within a single Availability Zone.

To learn more, visit our Hpc6 instance page and get in touch with our HPC team, AWS re:Post for EC2, or through your usual AWS Support contacts.

– Channy

Preview: Amazon Security Lake – A Purpose-Built Customer-Owned Data Lake Service

Post Syndicated from Channy Yun original https://aws.amazon.com/blogs/aws/preview-amazon-security-lake-a-purpose-built-customer-owned-data-lake-service/

To identify potential security threats and vulnerabilities, customers should enable logging across their various resources and centralize these logs for easy access and use within analytics tools. Some of these data sources include logs from on-premises infrastructure, firewalls, and endpoint security solutions, and when utilizing the cloud, services such as Amazon Route 53, AWS CloudTrail, and Amazon Virtual Private Cloud (Amazon VPC).

The Amazon Simple Storage Service (Amazon S3) and AWS Lake Formation simplify the creation and management of a data lake on AWS. But, some customers’ security teams still struggle to define and implement security domain–specific aspects, such as data normalization, which requires them to analyze each log source’s structure and fields, define schemas and mappings, and pull in data enrichment such as threat intelligence.

Today we are announcing the preview release of Amazon Security Lake, a purpose-built service that automatically centralizes an organization’s security data from cloud and on-premises sources into a purpose-built data lake stored in your account. Amazon Security Lake automates the central management of security data, normalizing from integrated AWS services and third-party services and managing the lifecycle of data with customizable retention and also automates storage tiering.

Here are the key features of Amazon Security Lake:

  • Variety of supported log and event sources – During the preview, Amazon Security Lake automatically collects logs for AWS CloudTrail, Amazon VPC, Amazon Route 53, Amazon S3, and AWS Lambda, as well as security findings via AWS Security Hub for AWS Config, AWS Firewall Manager, Amazon GuardDuty, AWS Health Dashboard, AWS IAM Access Analyzer, Amazon Inspector, Amazon Macie, and AWS Systems Manager Patch Manager. Additionally, over 50 sources of third-party security findings can be sent to Amazon Security Lake. Security Partners are also directly sending data in a standard schema called the Open Cybersecurity Schema Framework (OCSF) format to Amazon Security Lake, such as Cisco Security, CrowdStrike, Palo Alto Networks, and more.
  • Data transformation and normalization – Security Lake automatically partitions and converts incoming log data to a storage and query-efficient Apache Parquet and OCSF format, making the data broadly and immediately usable for security analytics without the need for post-processing. Security Lake supports integrations with analytics partners such as IBM, Splunk, Sumo Logic, and more to address a variety of security use cases such as threat detection, investigation, and incident response.
  • Customizable data access levels – You can configure the level of subscribers consuming data stored in the Security Lake, such as specific data sources for data access to all new objects or directly querying data stored. You can also specify a rollup Region that the Security Lake is available in and multiple AWS accounts across your AWS Organizations. This can help you comply with data residency compliance requirements.

By reducing the operational overhead of security data management, you can make it easier to gather more security signals from across your organization and analyze that data to improve the protection of your data, applications, and workloads.

Configure Your Security Lake for Collection Data
To get started with Amazon Security Lake, choose Get started in the AWS console. You can enable log and event sources for all Regions and all accounts.

You can select log and event sources such as CloudTrail logs, VPC flow logs, and Route53 resolver logs into your data lake. Select Regions will contribute their data to your data lake with the Amazon S3-managed encryption that Amazon S3 will create and manage all encryption keys, as well as the specific AWS accounts in your organizations.

Next, you can select rollup and contributing Regions. All aggregated data from contributing Regions reside in the rollup Region. You can create multiple rollup Regions, which can help you comply with data residency compliance requirements. Optionally, you can define the Amazon S3 storage classes and the retention period you want the data to transition from the standard Amazon S3 storage classes used in Security Lake.

After initial configuration, choose Sources in the left pane of the console if you can add or remove log sources in your Regions or account.

You can also collect data from custom sources, such as Bind DNS logs, endpoint telemetry logs, on-premise Netflow logs, and so on. Before adding a custom source, you need to create AWS IAM role to grant permissions for AWS Glue.

To create a custom data source, choose Create custom source in the left menu of Custom sources.

It requires you to enter the IAM role Amazon Resource Names (ARNs) to write data to Security Lake and invoke AWS Glue on your behalf. Then, you can provide details about your custom source.

For efficient data processing and querying, objects from your custom sources should be partitioned by AWS Region, AWS account, year, month, day, and hour with a Parquet-formatted object.

Consume Your Data from Security Lake
Now you can create a subscriber, a service that consumes logs and events from Security Lake. To add or see your subscribers, choose Subscribers in the left pane of the console.

The Security Lake supports two types of subscriber data access methods:

  • Data access (Amazon S3) – Subscribers are notified of new objects for a source as the data is written to your Security Lake S3 bucket. You can choose to notify subscribers of new objects with an Amazon Simple Queue Service (Amazon SQS) queue or through messaging to an HTTPS endpoint provided by the subscriber. This type is useful to ingest selected data in your analytics application—good for use cases that require frequent access to data.
  • Query access (Lake Formation) – Subscribers can consume data by directly querying AWS Lake Formation tables in your S3 bucket through services like Amazon Athena. This type is useful to provide on-demand query access to data without the need to pre-ingest anything and for use cases that require infrequent access or on large volume sources too expensive to ingest upfront or retain in analytics tools.

When you add a subscriber, you can choose Amazon S3 to create data access for the subscriber. If you select the default method of notification, you can receive the following object notification message in either an HTTPS endpoint or Amazon SQS.

{
  "source": "aws.s3",
  "time": "2021-11-12T00:00:00Z",
  "region": "ca-central-1",
  "resources": [
    "arn:aws:s3:::example-bucket"
  ],
  "detail": {
    "bucket": {
      "name": "example-bucket"
    },
    "object": {
      "key": "example-key",
      "size": 5,
      "etag": "b57f9512698f4b09e608f4f2a65852e5"
    },
    "request-id": "N4N7GDK58NMKJ12R",
    "requester": "123456789012"
  }
}

Subscribers with query access can directly query data that is stored in Security Lake by using services like Amazon Athena and other services that can read from AWS Lake Formation. The following are sample queries of CloudTrail data.

SELECT 
      time, 
      api.service.name, 
      api.operation, 
      api.response.error, 
      api.response.message, 
      src_endpoint.ip 
    FROM ${athena_db}.${athena_table}
    WHERE eventHour BETWEEN '${query_start_time}' and '${query_end_time}' 
      AND api.response.error in (
        'Client.UnauthorizedOperation',
        'Client.InvalidPermission.NotFound',
        'Client.OperationNotPermitted',
        'AccessDenied')
    ORDER BY time desc
    LIMIT 25

Subscribers only have access to source data in the AWS Region that you’ve selected when you create the subscriber. To give a subscriber access to data from multiple Regions, you can set the Region where you create your subscriber as a rollup Region.

Third-Party Integrations
For supported third-party integrations, there are a number of sources as well as subscribing services integrated with Amazon Security Lake.

Amazon Security Lake supports third-party sources providing OCSF security data, including Barracuda Networks, Cisco, Cribl, CrowdStrike, CyberArk, Lacework, Laminar, Netscout, Netskope, Okta, Orca, Palo Alto Networks, Ping Identity, SecurityScorecard, Tanium, The Falco Project, Trend Micro, Vectra AI, VMware, Wiz, and Zscaler.

You can also use third-party security, automation, and analytics tools supporting Security Lake, including Datadog, IBM, Rapid7, Securonix, SentinelOne, Splunk, Sumo Logic, and Trellix. There are also service partners such as Accenture, Atos, Deloitte, DXC, Kyndryl, PWC, Rackspace, and Wipro that can work with you and Amazon Security Lake.

Join the Preview
The preview release of Amazon Security Lake is now available in the US East (Ohio), US East (N. Virginia), US West (Oregon), Asia Pacific (Sydney), Asia Pacific (Tokyo), Europe (Frankfurt), and Europe (Ireland) Regions.

To learn more, see the Amazon Security Lake page and Amazon Security Lake User Guide. We want to hear more feedback during the preview. Please send feedback in AWS re:Post and through your usual AWS support contacts.

– Channy

New analytical questions available in Amazon QuickSight Q: “Why” and “Forecast”

Post Syndicated from Shannon Kalisky original https://aws.amazon.com/blogs/big-data/new-analytical-questions-available-in-amazon-quicksight-q-why-and-forecast/

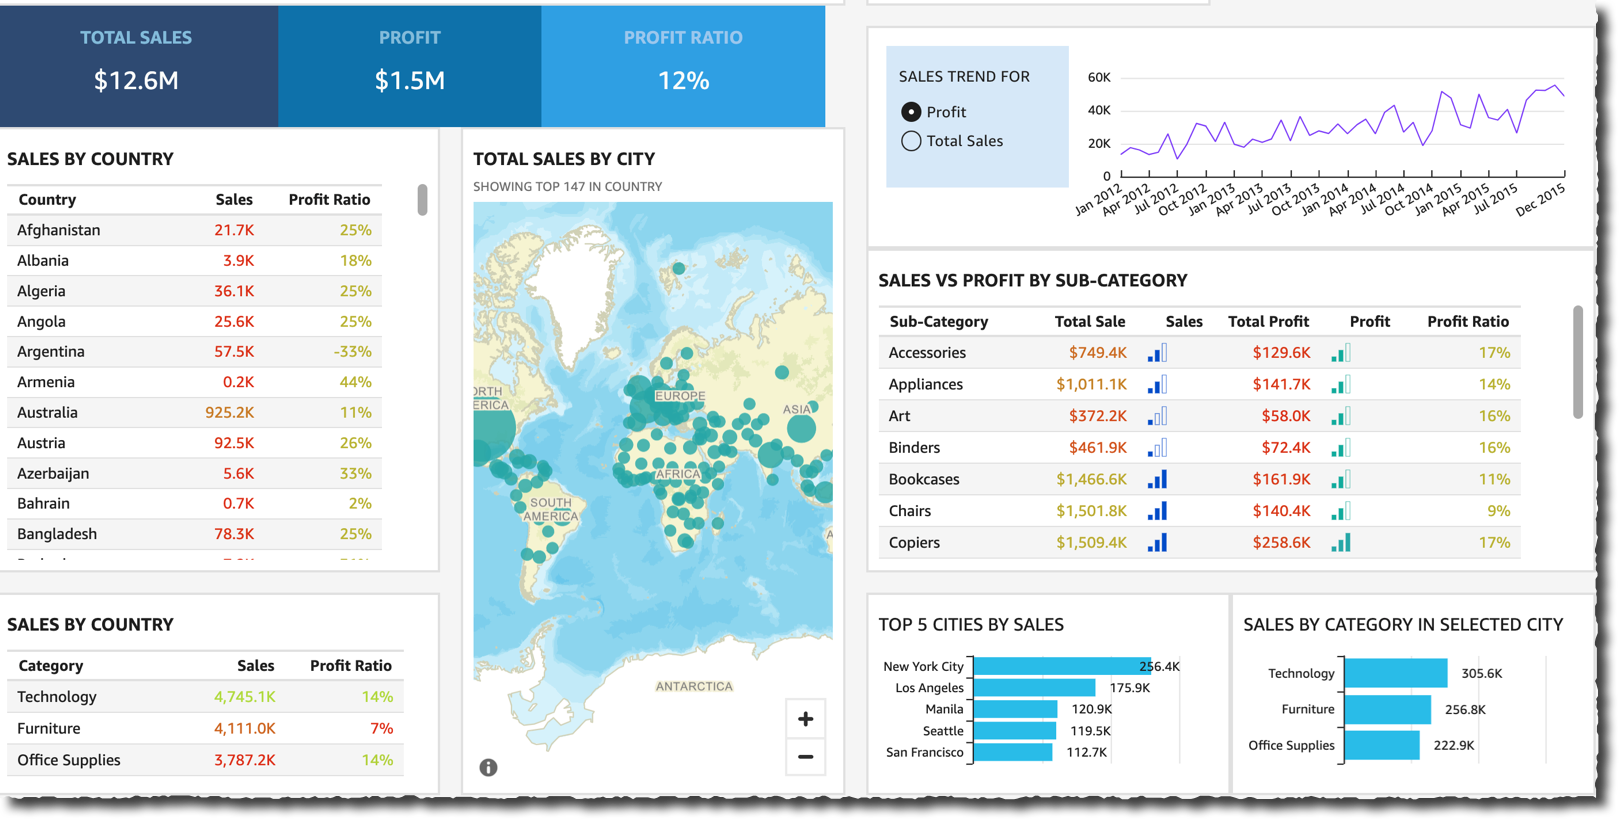
Amazon QuickSight Q uses machine learning (ML) to enable any user to ask questions about business data in natural language and receive accurate answers with relevant visualizations in seconds. Today, Amazon QuickSight announces support for two new question types that simplify and scale complex analytical tasks using natural language: “forecast” and “why.”

In this post, we explore each of these new question types with examples of how to use them.

Prerequisites

The features explored in this post are part of QuickSight Q. If you’re an existing QuickSight user, be sure that the Q add-on is enabled. For steps on how to do this, see Getting Started with Amazon QuickSight Q.

Forecasting questions

Customers often ask how they can forecast future business performance. This is a useful tool to understand if things are proceeding well, or if some action may be needed to get back on track. Forecasting uses historic data to project metrics into the future.

Creating forecasts is often the job of analysts or data scientists. However, the new forecasting question type in Q enables non-analyst users to predict future trajectories for up to three measures simultaneously. Rather than learning formulas or parameter settings, you can get a forecast by entering forecast into the language bar, followed by up to three metrics that you want to see predictions for. This natural language approach is an easy and intuitive way for managers and others who depend on data to get a sense of what’s likely to happen if things don’t change.

Although the experience of creating a forecast in Q is simple, under the hood is a proven and robust forecasting algorithm called Random Cut Forest (RCF). For more information, see How RCF is applied to generate forecasts.

How to ask a forecasting question

To ask a forecasting question, start the question with the word forecast or the phrase Show me a forecast. The minimum information needed to create a forecast is one of these two question starters, plus the measure you want to forecast. For example, Forecast sales is enough to generate a forecast, as shown in the following screenshot.

Forecasting in Q also supports filters. Filters are applied by adding information to the question. The following example shows using a filter in a forecast statement.

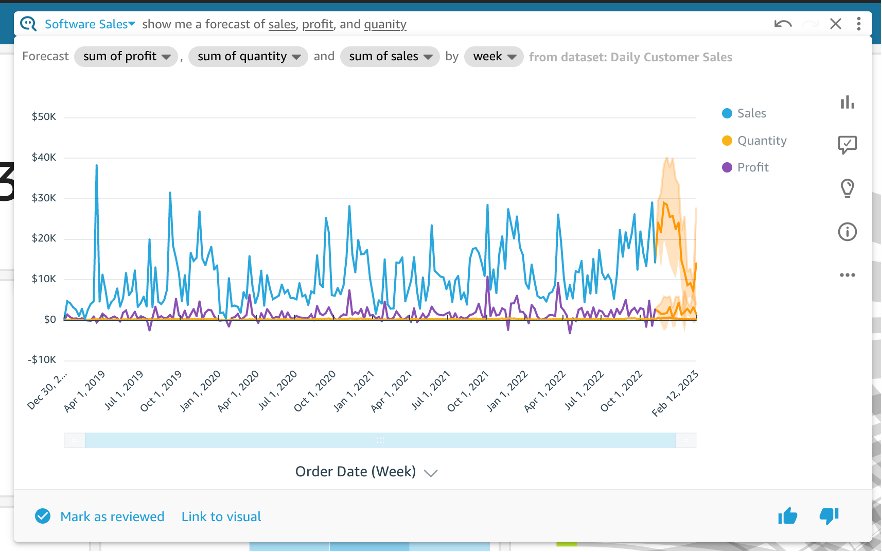
Q allows you to forecast up to three numeric measures in a single question. The following example shows a forecast of sales, profit, and quantity.

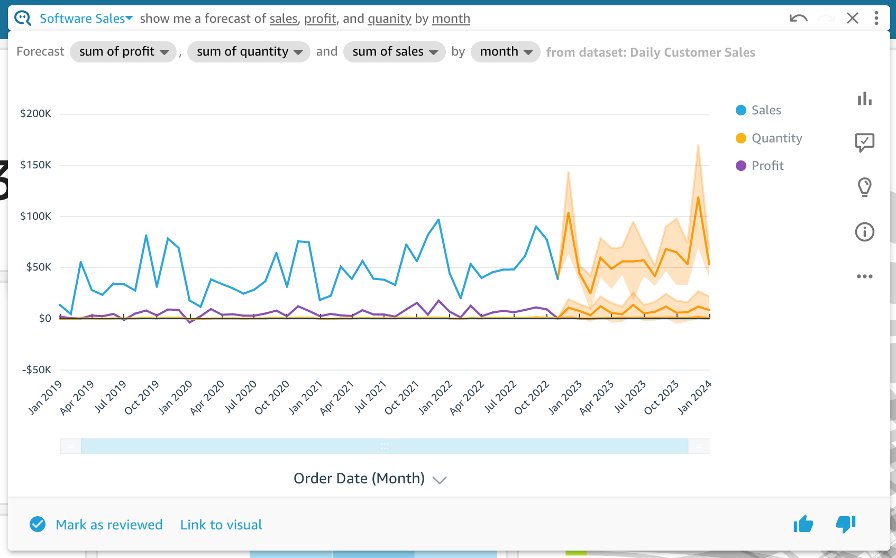
If the data you have is dense, it can cause the forecast to be crowded into the right side of the visual. Adjusting the time granularity to a coarser step, such as going from weekly granularity to monthly, will help make the visual easier to read. To do this, simply specify the desired time granularity in the question. The following example shows a different view of the previous example grouped by month instead of week.

Note that at this release forecasting in Q doesn’t support dimensional group-by functionality. Dimensional group-bys split the forecast by the different values in a categorical field, for example: Show me a forecast of sales by region.

Why questions

“Why” is one of the most fundamental questions people ask. For many organizations, understanding why is the key to delighting customers, driving innovation, and outmaneuvering the competition. However, manually analyzing a body of data to discover contributing changes is difficult, time-consuming, and requires special analytics skill.

The new why question type enables business users to instantly get insights previously only accessible to trained analysts. Business users need to understand what contributed to changes in their data, so they can make decisions about what action to take. Why questions are easy to ask and natural to think of, so business users can quickly pinpoint insights they need to know.

When you ask a why question in Q, you trigger an on-the-fly contribution analysis that will automatically identify the key drivers of change for the measure you asked about and quantify which value from each driver contributed the most to that change. This gives you an idea of the relative influence each value had to the measure.

How to ask a why question

A why question needs three things:

  • To start with the word “why.”
  • A numeric measure, such as sales, enrollment numbers, profit, price, and so on.
  • A date or time span, such as last quarter, January 2022, or last month. Note that at this release the time span should be complete, but asking about ongoing spans such as “this week” or “this year” or specifying the current month will not yet work.

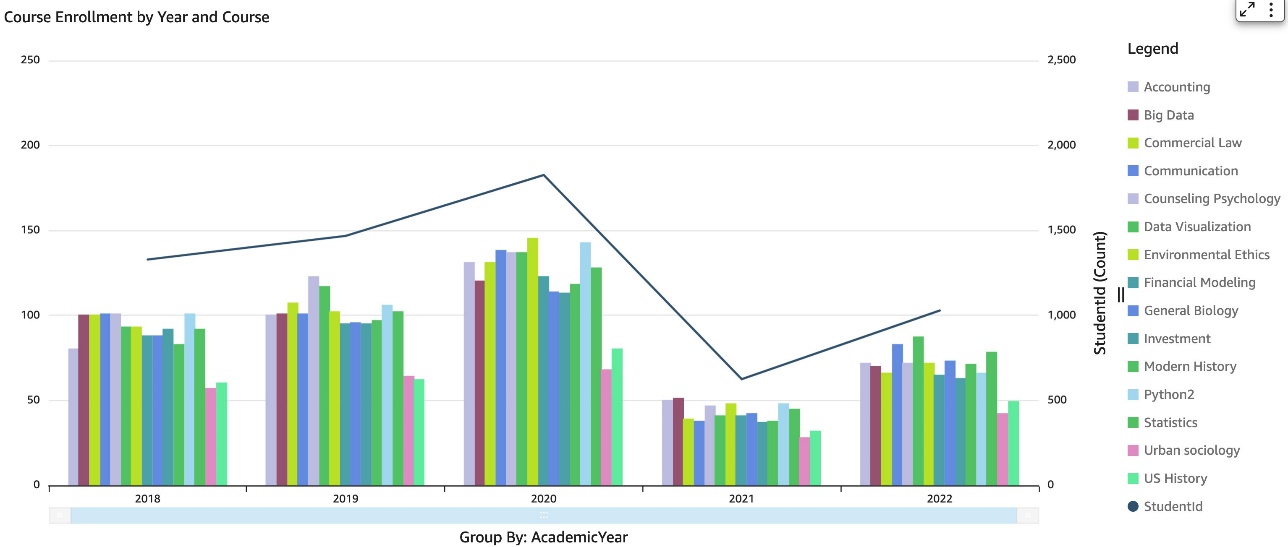
Why questions often start from seeing something that sparks our curiosity. For example, if I were an administrator reviewing student enrollment and I saw the following visual, I would naturally wonder “Why did enrollment drop in 2021?”

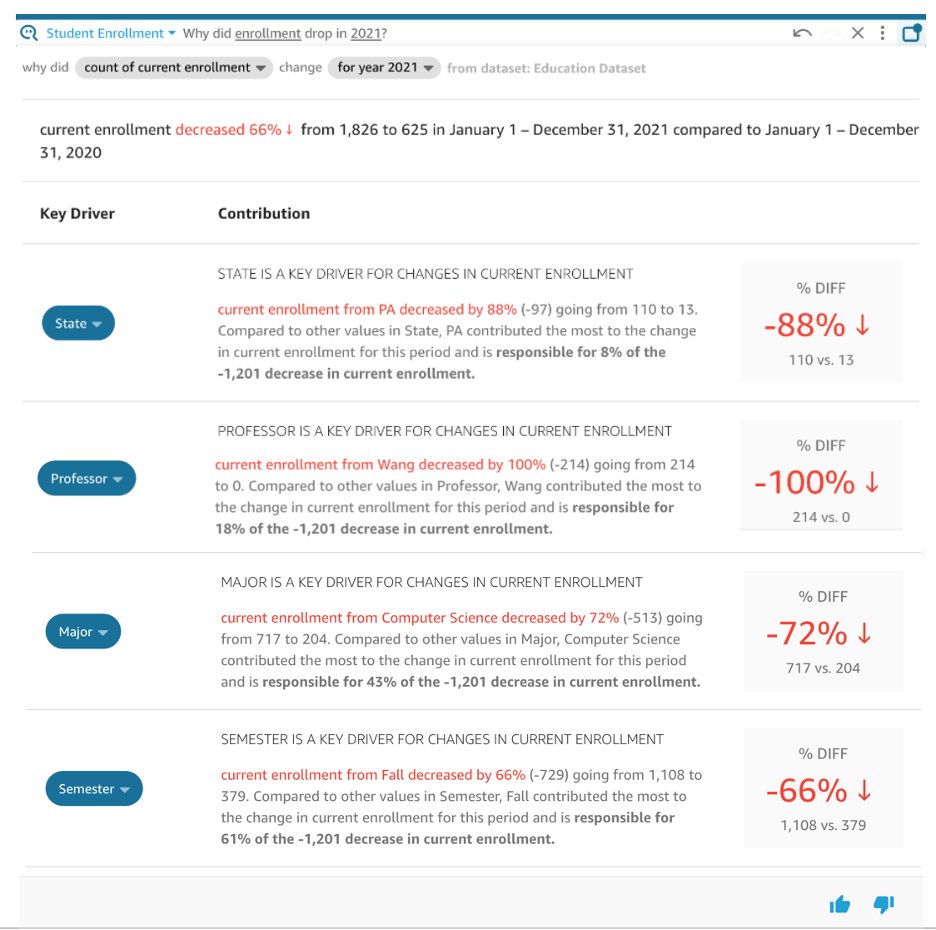
Now we can ask just that, as shown in the following screenshot.

The why answer identifies up to four key drivers (shown in the blue ovals on the left side of the answer), which get unpacked into contribution narratives (center of the answer) that describe the specific value from the key driver that played the biggest role. On the right side of the answer is a quick-view KPI that summarizes the change in the key driver value. Note that you may need to mouse over and scroll in the Q answer pane to see all the drivers.

Refining why questions

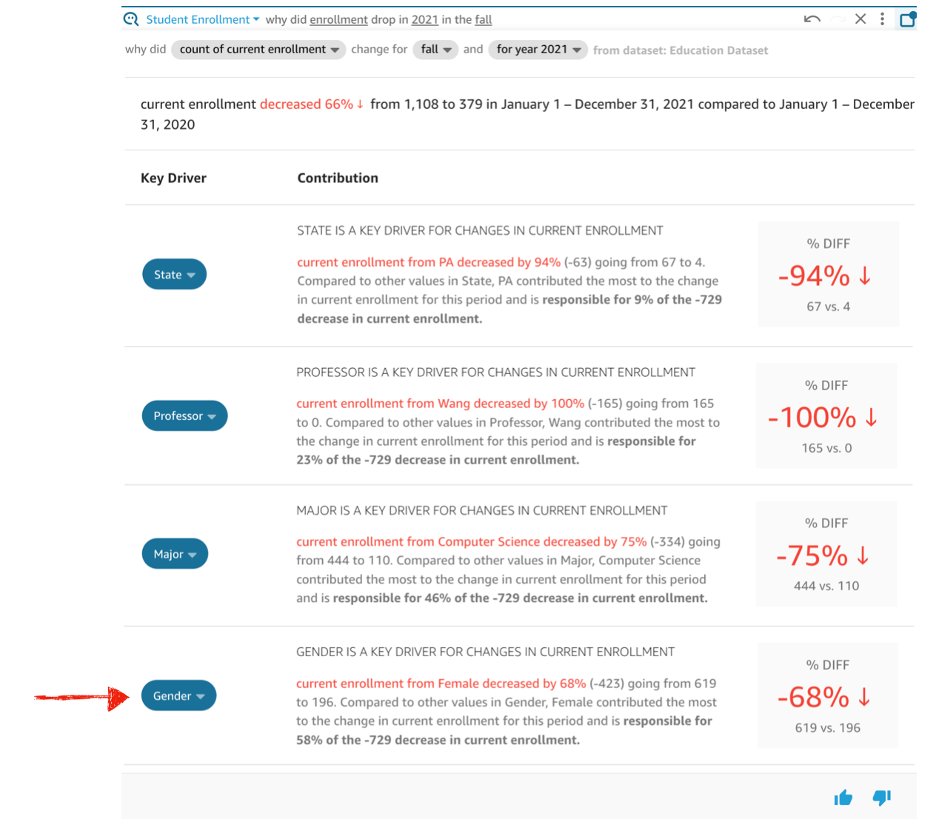
In the why answer displayed in the previous example, enrollment dropped more in the fall semester, which is why it appears as a top contributor to the drop in enrollment. To drill into the factors that influenced the drop in fall enrollment, you can ask more precise questions. In this case, adding in the fall to the end of the question focuses the analysis on just the fall semester.

Focusing on fall brings more specific metrics, and reveals gender is an additional key driver specific to that semester.

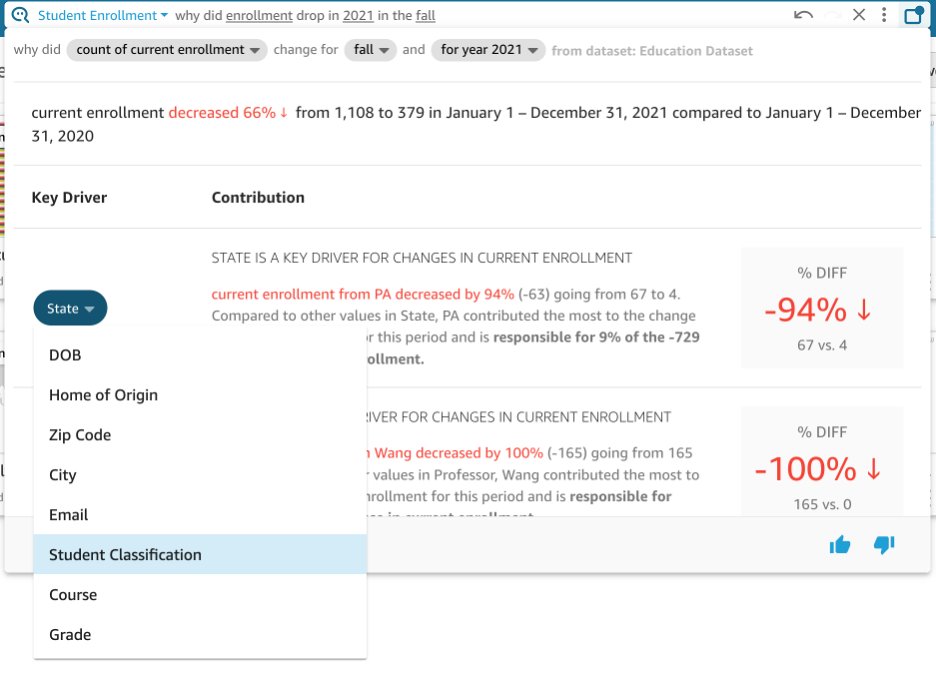
You can explore additional drivers by choosing the driver and changing to a different field. This can be a helpful way understand the impact of another variable or to avoid redundancy if the data structure led Q to recommend two very similar or overlapping dimensions.

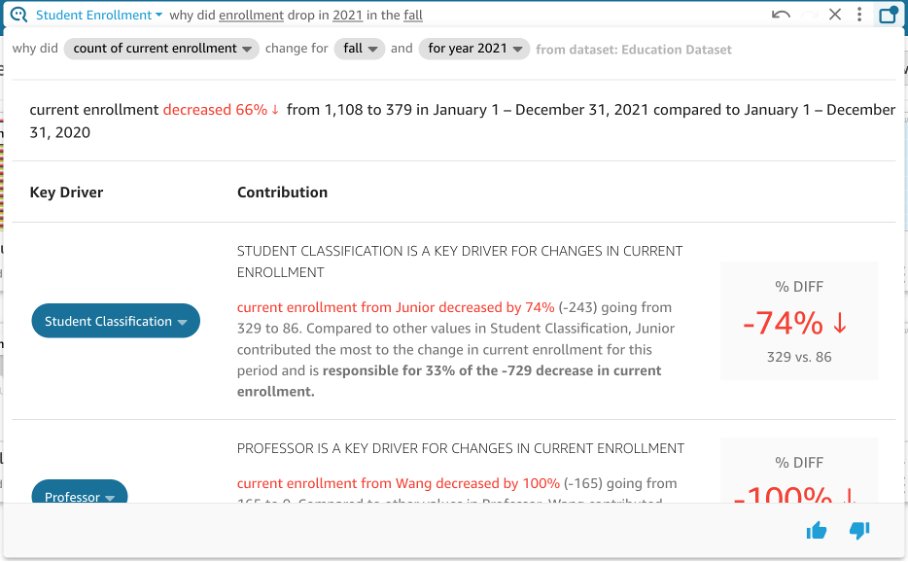
In the following example, we can change State to Student Classification to explore if the drop in enrollment disproportionately impacted any particular student group, such as freshman or graduate students.

In the following result, enrollment from juniors (third-year students) was much lower than it was in 2020, and represents a large portion of the drop in enrollment.

Conclusion

With why and forecasting questions, business users can dig deeper to understand the contributing factors of metric changes or model potential growth. These new question types are available at no additional cost for all Q customers.

The examples used in post utilize the sample QuickSight topics that come included with your QuickSight subscription. For forecasting, we used the Software Sales sample topic, and for why questions, we used the Student Enrollment sample topic. To try the questions on your own, activate the applicable sample topic.


About the author

Shannon Kalisky is a Senior Product Manager – Technical that covers natural language question patterns and model robustness for Amazon QuickSight Q.

Lina: Tales of the M1 GPU

Post Syndicated from original https://lwn.net/Articles/916208/

Asahi Lina gives a detailed
update
on progress toward a graphics driver for Apple M1 hardware.

There is still a long road ahead! The UAPI that we are using right
now is still a prototype, and there are a lot of new features that
need to be added or redesigned in order to support a full Vulkan
driver in the future. Since Linux mandates that the UAPI needs to
remain stable and backwards compatible across versions (unlike
macOS), that means that the kernel driver will not be heading
upstream for many months, until we have a more complete
understanding of the GPU rendering parameters and have implemented
all the new design features needed by Vulkan.

New – Amazon Redshift Integration with Apache Spark

Post Syndicated from Channy Yun original https://aws.amazon.com/blogs/aws/new-amazon-redshift-integration-with-apache-spark/

Apache Spark is an open-source, distributed processing system commonly used for big data workloads. Spark application developers working in Amazon EMR, Amazon SageMaker, and AWS Glue often use third-party Apache Spark connectors that allow them to read and write the data with Amazon Redshift. These third-party connectors are not regularly maintained, supported, or tested with various versions of Spark for production.

Today we are announcing the general availability of Amazon Redshift integration for Apache Spark, which makes it easy to build and run Spark applications on Amazon Redshift and Redshift Serverless, enabling customers to open up the data warehouse for a broader set of AWS analytics and machine learning (ML) solutions.

With Amazon Redshift integration for Apache Spark, you can get started in seconds and effortlessly build Apache Spark applications in a variety of languages, such as Java, Scala, and Python.

Your applications can read from and write to your Amazon Redshift data warehouse without compromising on the performance of the applications or transactional consistency of the data, as well as performance improvements with pushdown optimizations.

Amazon Redshift integration for Apache Spark builds on an existing open source connector project and enhances it for performance and security, helping customers gain up to 10x faster application performance. We thank the original contributors on the project who collaborated with us to make this happen. As we make further enhancements we will continue to contribute back into the open source project.

Getting Started with Spark Connector for Amazon Redshift
To get started, you can go to AWS analytics and ML services, use data frame or Spark SQL code in a Spark job or Notebook to connect to the Amazon Redshift data warehouse, and start running queries in seconds.

In this launch, Amazon EMR 6.9, EMR Serverless, and AWS Glue 4.0 come with the pre-packaged connector and JDBC driver, and you can just start writing code. EMR 6.9 provides a sample notebook, and EMR Serverless provides a sample Spark Job too.

First, you should set AWS Identity and Access Management (AWS IAM) authentication between Redshift and Spark, between Amazon Simple Storage Service (Amazon S3) and Spark, and between Redshift and Amazon S3. The following diagram describes the authentication between Amazon S3, Redshift, the Spark driver, and Spark executors.

For more information, see Identity and access management in Amazon Redshift in the AWS documentation.

Amazon EMR
If you already have an Amazon Redshift data warehouse and the data available, you can create the database user and provide the right level of grants to the database user. To use this with Amazon EMR, you need to upgrade to the latest version of the Amazon EMR 6.9 that has the packaged spark-redshift connector. Select the emr-6.9.0 release when you create an EMR cluster on Amazon EC2.

You can use EMR Serverless to create your Spark application using the emr-6.9.0 release to run your workload.

EMR Studio also provides an example Jupyter Notebook configured to connect to an Amazon Redshift Serverless endpoint leveraging sample data that you can use to get started quickly.

Here is a Scalar example to build your applications both with Spark Dataframe and Spark SQL. Use IAM-based credentials for connecting to Redshift and use IAM role for unloading and loading data from S3.

// Create the JDBC connection URL and define the Redshift context
val jdbcURL = "jdbc:redshift:iam://<RedshiftEndpoint>:<Port>/<Database>?DbUser=<RsUser>"
val rsOptions = Map (
  "url" -> jdbcURL,
  "tempdir" -> tempS3Dir, 
  "aws_iam_role" -> roleARN,
  )
// Reference the sales table from Redshift 
val sales_df = spark
  .read 
  .format("io.github.spark_redshift_community.spark.redshift") 
  .options(rsOptions) 
  .option("dbtable", "sales") 
  .load() 
sales_df.createOrReplaceTempView("sales") 
// Reference the date table from Redshift using Data Frame 
sales_df.join(date_df, sales_df("dateid") === date_df("dateid"))
  .where(col("caldate") === "2008-01-05")
  .groupBy().sum("qtysold")
  .select(col("sum(qtysold)"))
  .show() 

If Amazon Redshift and Amazon EMR are in different VPCs, you have to configure VPC peering or enable cross-VPC access. Assuming both Amazon Redshift and Amazon EMR are in the same virtual private cloud (VPC), you can create a Spark job or Notebook and connect to the Amazon Redshift data warehouse and write Spark code to use the Amazon Redshift connector.

To learn more, see Use Spark on Amazon Redshift with a connector in the AWS documentation.

AWS Glue
When you use AWS Glue 4.0, the spark-redshift connector is available both as a source and target. In Glue Studio, you can use a visual ETL job to read or write to a Redshift data warehouse simply by selecting a Redshift connection to use within a built-in Redshift source or target node.

The Redshift connection contains Redshift connection details along with the credentials needed to access Redshift with the proper permissions.

To get started, choose Jobs in the left menu of the Glue Studio console. Using either of the Visual modes, you can easily add and edit a source or target node and define a range of transformations on the data without writing any code.

Choose Create and you can easily add and edit a source, target node, and the transform node in the job diagram. At this time, you will choose Amazon Redshift as Source and Target.

Once completed, the Glue job can be executed on Glue for the Apache Spark engine, which will automatically use the latest spark-redshift connector.

The following Python script shows an example job to read and write to Redshift with dynamicframe using the spark-redshift connector.

import sys
from awsglue.transforms import *
from awsglue.utils import getResolvedOptions
from pyspark.context import SparkContext
from awsglue.context import GlueContext
from awsglue.job import Job

## @params: [JOB_NAME]
args = getResolvedOptions(sys.argv, ['JOB_NAME'])
sc = SparkContext()
glueContext = GlueContext(sc)
spark = glueContext.spark_session
job = Job(glueContext)
job.init(args['JOB_NAME'], args)

print("================ DynamicFrame Read ===============")
url = "jdbc:redshift://<RedshiftEndpoint>:<Port>/dev"
read_options = {
    "url": url,
    "dbtable": dbtable,
    "redshiftTmpDir": redshiftTmpDir,
    "tempdir": redshiftTmpDir,
    "aws_iam_role": aws_iam_role,
    "autopushdown": "true",
    "include_column_list": "false"
}

redshift_read = glueContext.create_dynamic_frame.from_options(
    connection_type="redshift",
    connection_options=read_options
) 

print("================ DynamicFrame Write ===============")

write_options = {
    "url": url,
    "dbtable": dbtable,
    "user": "awsuser",
    "password": "Password1",
    "redshiftTmpDir": redshiftTmpDir,
    "tempdir": redshiftTmpDir,
    "aws_iam_role": aws_iam_role,
    "autopushdown": "true",
    "DbUser": "awsuser"
}

print("================ dyf write result: check redshift table ===============")
redshift_write = glueContext.write_dynamic_frame.from_options(
    frame=redshift_read,
    connection_type="redshift",
    connection_options=write_options
)

When you set up your job detail, you can only use the Glue 4.0 – Supports spark 3.3 Python 3 version for this integration.

To learn more, see Creating ETL jobs with AWS Glue Studio and Using connectors and connections with AWS Glue Studio in the AWS documentation.

Gaining the Best Performance
In the Amazon Redshift integration for Apache Spark, the Spark connector automatically applies predicate and query pushdown to optimize for performance. You can gain performance improvement by using the default Parquet format for the connector used for unloading with this integration.

As the following sample code shows, the Spark connector will turn the supported function into a SQL query and run the query in Amazon Redshift.

import sqlContext.implicits._val
sample= sqlContext.read
.format("io.github.spark_redshift_community.spark.redshift")
.option("url",jdbcURL )
.option("tempdir", tempS3Dir)
.option("unload_s3_format", "PARQUET")
.option("dbtable", "event")
.load()

// Create temporary views for data frames created earlier so they can be accessed via Spark SQL
sales_df.createOrReplaceTempView("sales")
date_df.createOrReplaceTempView("date")
// Show the total sales on a given date using Spark SQL API
spark.sql(
"""SELECT sum(qtysold)
| FROM sales, date
| WHERE sales.dateid = date.dateid
| AND caldate = '2008-01-05'""".stripMargin).show()

Amazon Redshift integration for Apache Spark adds pushdown capabilities for operations such as sort, aggregate, limit, join, and scalar functions so that only the relevant data is moved from the Redshift data warehouse to the consuming Spark application, thereby improving performance.

Available Now
The Amazon Redshift integration for Apache Spark is now available in all Regions that support Amazon EMR 6.9, AWS Glue 4.0, and Amazon Redshift. You can start using the feature directly from EMR 6.9 and Glue Studio 4.0 with the new Spark 3.3.0 version.

Give it a try, and please send us feedback either in the AWS re:Post for Amazon Redshift or through your usual AWS support contacts.

– Channy

Hard Drive Cost Per Gigabyte

Post Syndicated from original https://www.backblaze.com/blog/hard-drive-cost-per-gigabyte/

“A penny for your thoughts” is a common boomer expression (so says my 23 year old). Instead, how about “a penny for a gigabyte of hard disk”? That’s new, tech-y, and, well, it’s almost true.

When Backblaze purchased hard drives back in 2009, we paid over $0.11 per gigabyte. In 2017, when we did a review of the cost of hard drives, the cost per gigabyte had fallen to just below $0.03 per gigabyte. Today, we can get 16TB hard drives for about $0.014 per gigabyte on average. That’s not quite a penny, but we think we’ll get there soon enough. In the meantime, let’s look at our hard drive purchases over the years and see what we can learn about the cost per gigabyte of hard drive storage.

How Many Drives?

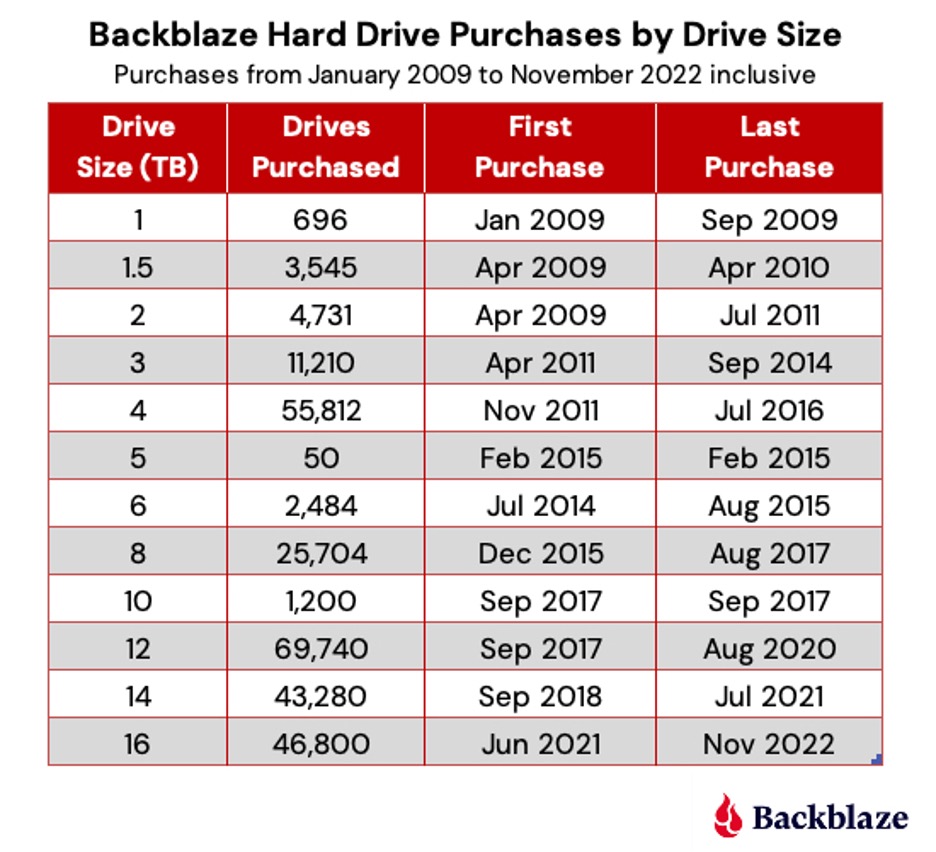
Backblaze has purchase records going back to 2009. In that time, we’ve purchased 265,332 hard drives. We even recorded each of the hundreds of hard drives purchased during our drive farming days in 2011 and our crowdsourcing days in 2012. Thank you, Cecilia! The 265,322 number is not precise—some drives were purchased before 2009, some drives were purchased and never put into service, and, occasionally, we received a small number of test drives from manufacturers. Still, the 265,332 number is close. The breakdown in drives purchased by drive size is shown below.

The 16TB drives are the only drive size we are currently purchasing. It is possible we could purchase a small group of spares for one of the other drive sizes. Unlikely at this point, but possible. In addition, the 16TB count does not include 12,000 drives purchased and scheduled for delivery over the next few months.

In 2023 we expect to qualify 18TB, 20TB, and potentially 22TB drives. Of course, we will wait a bit before purchasing in bulk to ensure the qualified drive models are stable over time and the price per gigabyte meets our expectations. Speaking of expectations, look for those drives to show up in the quarterly Drive Stats reports starting about mid-2023.

Drive Type

All of the drives we purchase use Perpendicular Magnetic Recording (PMR), also known as Conventional Magnetic Recording (CMR). We do not use Shingled Magnetic Recording (SMR) drives. SMR drives are sometimes less expensive but are demonstrably slower with random writes and when they are reusing space made available from previous file deletes. In most data backup use cases, where variable length writes and file deletions are the norm, the minimal cost savings of SMR drives is negated by the storage inefficiencies introduced by having to perform multiple writes to store data in tracks where data had been previously deleted.

The Cost Per Gigabyte

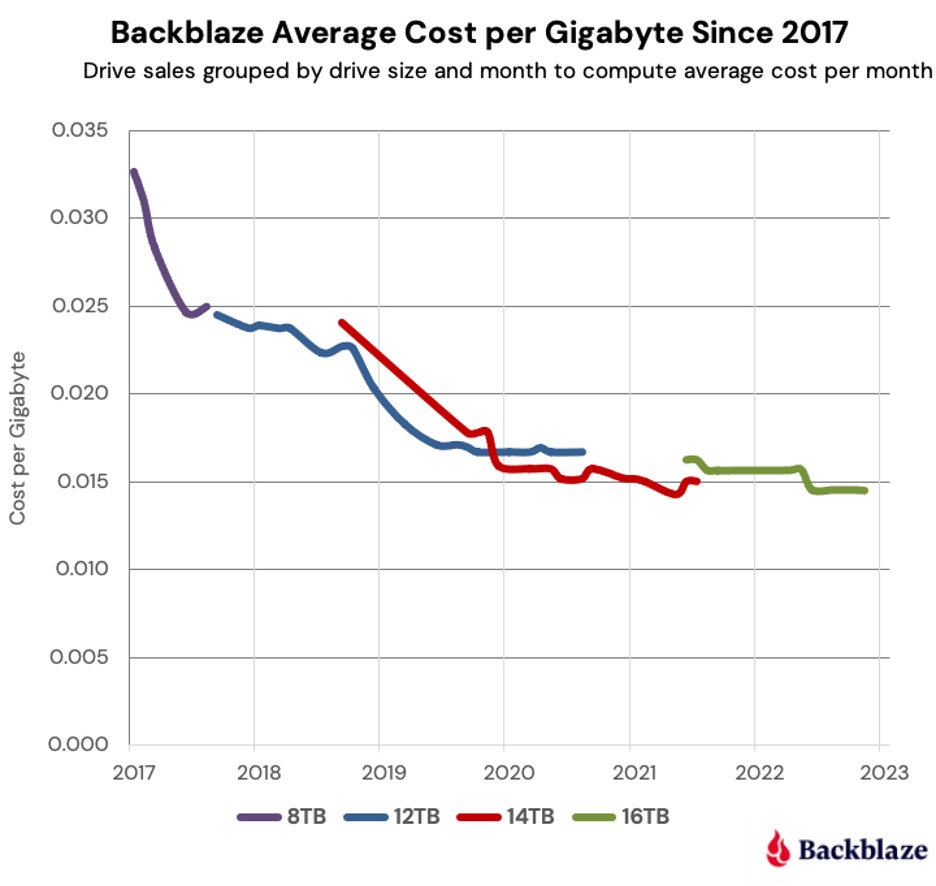
As noted earlier, our hard drive cost per gigabyte had fallen to a little over $0.03 by the end of 2017. At that point 8TB drives were our primary drives. Over the next few years we added 12TB, 14TB, and 16TB drives to the mix and the average cost per gigabyte continued to decrease as shown in the chart below.

From 2017 to November 2022, the average cost per gigabyte decreased by 56.36% for all of the drives ($0.033 down to $0.0144). That’s over 9% per year on average across the four drive sizes. To put that data in context, below is the complete chart from 2009 through November 2022 for all drives sizes we have used as data drives during that period.

You can observe the overall down and to the right trend over the period, although the 3TB and 4TB drives make that drop messy. This was due primarily to the Thailand drive crisis which began in the second half of 2011 and continued to affect the market into 2013 before things got back to normal.

Overall, the drop in the average price per gigabyte was from $0.114 in 2009 to just $0.014 as of November 2022. That’s a difference of $0.100 (one thin dime) over the period. That equates to an 87.4% decrease in the average cost per terabyte since 2009. If we calculate the average decrease per month over that period, we get the cost per gigabyte of the hard drives we use decreasing 0.52% per month since January 2009.

During that time drive technology hardly stood still as drive manufacturers crammed more platters in the same basic 3 ½ inch chassis, dramatically increased areal media density, figured out how to use helium inside the drives, started using glass substrates for their platters, and other improvements and innovations. Regardless of what you may think of a given drive manufacturer, that’s pretty awesome for the industry as a whole.

At this point, a fair question would be why the cost we charge for storage hasn’t decreased 87% since 2009? Our friends at IDC (source: Figure 10; IDC Thought Leadership Practice Case Study) have calculated that in 2009, there was about 0.3 zettabytes of data stored on hard drives worldwide, and they estimated that by the end of 2022 there would be 1.8 zettabytes. That’s an increase of 500% for the amount of data stored on hard drives over the period. Let’s just say the global population is storing a lot more data and leave it at that.

Dollars and Sense

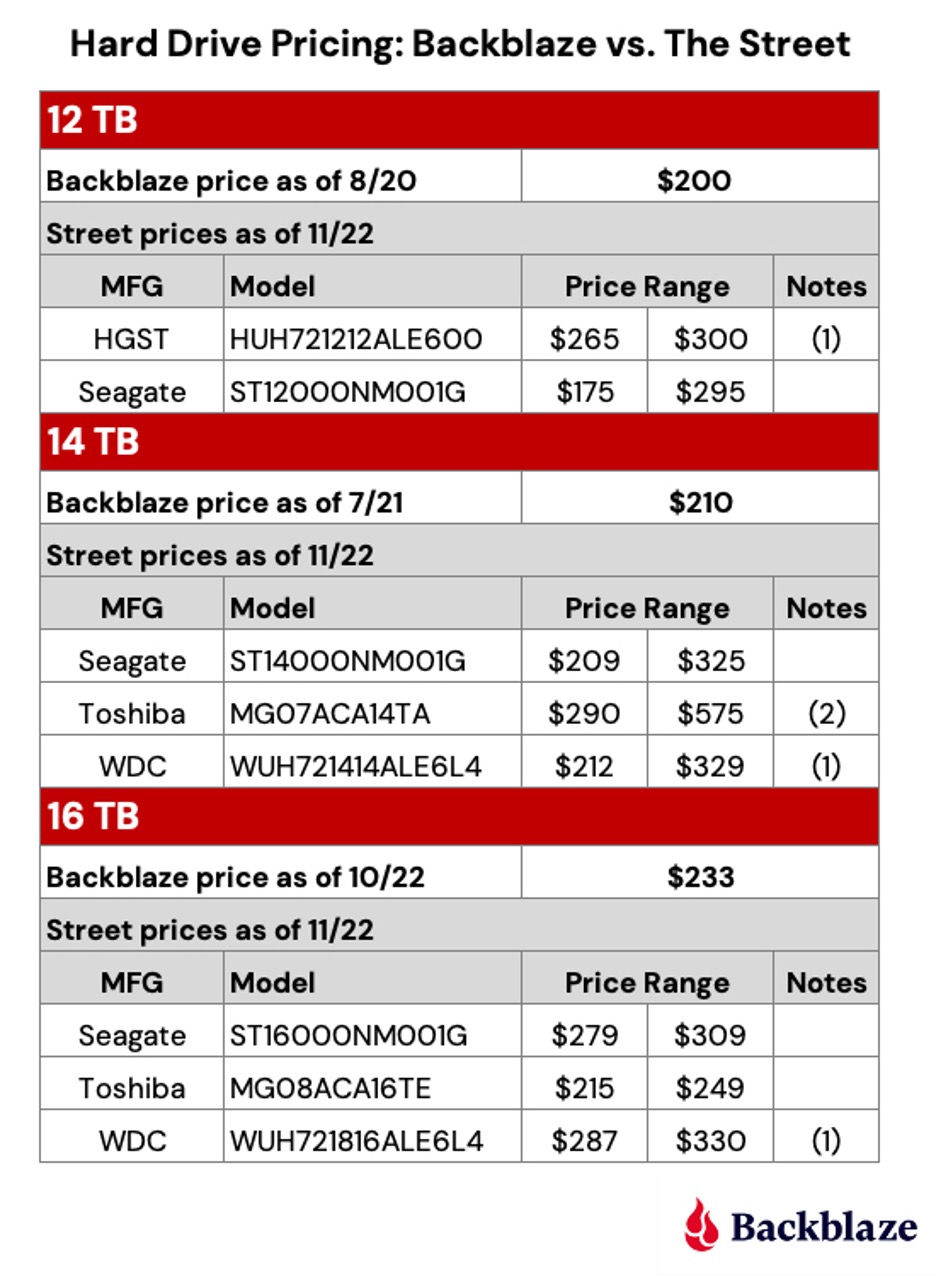
Of course, you don’t buy hard drives using percentages, you use dollars (or pesos, or pounds, or euros, and so on.) Let’s take a minute to see what price you would have to pay versus what we have paid. We’ve listed the best street price we could find for some of the 12TB, 14TB, and 16TB drives we use.

Notes:

  1. As Western Digital continues to assimilate the HGST drive business, the model numbers of these drives are changing to WDC standards.
  2. This model is sold as a server-based drive, similar models such as the MG07ACA14TE are less expensive.

Remember, we buy drives in bulk quantity and on contract with guaranteed pricing, delivery dates, and such. It’s not quite the same thing as buying a drive from a shrink wrapped pallet at Costco or from a Cyber Monday deal on Amazon. You may be able to buy a couple of drives at a great price, but when you need 12,000 drives delivered to your front door on a certain date, Amazon Prime isn’t going to cut it. As a result, it may cost a dollar or two more per drive to ensure we have what we need when we need it.

Lessons Learned

  • The cost per gigabyte has continued to fall over the past 13 years we’ve been tracking our drive purchases. This was in spite of the Thailand drive crisis which started in 2011, as well as the Coronavirus and the continuing supply chain problems it caused.
  • Drive manufacturer consolidation hasn’t stopped the cost per gigabyte from decreasing from 2009 through 2022. That said, it is impossible to say what the cost per gigabyte would be without consolidation.
  • On average, the cost per gigabyte of a drive will fall on average about 0.5% per month over time, slowly at first, then accelerating for some period before bottoming out.
  • In nearly every case, the cost per gigabyte of each new drive size introduced will eventually fall below that of its predecessor. For example, the cost per gigabyte for a 14TB drive will be less than a 12TB, and the cost per gigabyte for the 16TB drive will be less than the 14TB.

Where Is the Bottom?

When we published our 2017 report on this topic, we proclaimed the race to the bottom was over, implying that the cost per gigabyte could not go much (if any) lower. We were wrong.

So where is the bottom? There’s an expression that goes something like, “We have done so much for so long with so little that we can now do practically anything with nothing.” There are probably folks at the drive manufacturers mumbling that expression to themselves on a daily basis as they try to cram more bits in less space on increasingly thin sheets of coated glass racing by at 5,400/7,200/15,000 revolutions per minute.

Getting back to reality, the next milestone we can see is $0.01 per gigabyte for a hard drive—that’s not a sale price, but a stable street price. Let’s go out on a limb and say that we will reach that in mid-2025 with 22TB or 24TB drives. That would mean you could buy a 22TB drive at Costco or on Amazon for about $220, or a 24TB for $240.

Is $0.01 per gigabyte the bottom? At the risk of having boomers shout “How low can you go?” and throw their backs out doing the limbo, we’ll ask: How low can the cost per gigabyte go? Tell us what you think.

The post Hard Drive Cost Per Gigabyte appeared first on Backblaze Blog | Cloud Storage & Cloud Backup.

Preview: Amazon OpenSearch Serverless – Run Search and Analytics Workloads without Managing Clusters

Post Syndicated from Channy Yun original https://aws.amazon.com/blogs/aws/preview-amazon-opensearch-serverless-run-search-and-analytics-workloads-without-managing-clusters/

Most AWS analytics services have compelling serverless offerings that make it even easier for customers to analyze vast amounts of data without having to configure, scale, or manage the underlying infrastructure.

Along with other serverless analytics, such as Amazon QuickSight for business intelligence and AWS Glue for data integration, we have introduced Amazon EMR Serverless, Amazon MSK Serverless, and Amazon Redshift Serverless this year.

Today, we announce the preview release of a new serverless option for Amazon OpenSearch Service that makes it easy for customers to run large-scale search and analytics workloads without managing clusters. It automatically provisions and scales the underlying resources to deliver fast data ingestion and query responses for even the most demanding and unpredictable workloads, eliminating the need to configure and optimize clusters.

With Amazon OpenSearch Serverless, you do not need to account for factors that are hard to know in advance, such as the frequency and complexity of queries or the volume of data expected to be analyzed. Instead of managing infrastructure, you can focus on using OpenSearch for exploring and deriving insights from your data. You can also get started using familiar APIs to load and query data and use OpenSearch Dashboards for interactive data analysis and visualization.

Configure Your OpenSearch Serverless Collection
To get started with Amazon OpenSearch Serverless, you create a Collection via the AWS Management Console, AWS Command-Line Interface (AWS CLI), or AWS API.

Before the launch of OpenSearch Serverless, you created a managed cluster, specifying instance types, counts, and storage options, and then managed the lifecycle and shard strategy for indices within that cluster. With OpenSearch Serverless, you create a Collection, which manages a group of indices that work together to support a specific workload. You no longer need to specify the hardware or manage the indices directly.

To create an OpenSearch Serverless collection and secure data, set up Encryption policies to assign AWS KMS keys to one or more collections and attach Network policies to collections to control the access from specified VPCs and public IP addresses.

To create an encryption policy, choose Encryption policies in the left navigation pane and Create encryption policy. Encryption at rest secures the indices within your collection. For each collection, AWS KMS generates a unique, symmetric encryption key. Encryption policies are the optimal way to manage AWS KMS keys across multiple collections. You can define the target collection name or a prefix that automatically applies the encryption settings from this policy to the collection.

In order for users to access a collection, choose Network policies in the left navigation pane and Create network policy. Network policies determine whether your collection is accessible over the internet from public networks or whether it must be accessed through OpenSearch Serverless–managed VPC endpoints.

You can define multiple rules for each collection, either the Public or VPC, as a recommended option for the Access Type. If you select a public option, you can access the collection from OpenSearch Dashboards.

Also, you can configure access for OpenSearch Dashboards and the OpenSearch endpoint. For the Resource type, enable both Access to OpenSearch endpoints and Access to OpenSearch Dashboards. In both input boxes, select the Collection Name property and your collection name or prefix.

Finally, to create an OpenSearch Serverless collection, choose Create collection in the home page or choose Collections in the left navigation pane and choose Create collection.

Input your collection name, description, and collection type, either Time series or Search by your data type.

  • Time series – The log analytics segment that focuses on analyzing large volumes of semistructured, machine-generated data in real time for operational, security, user behavior, and business insights.
  • Search – Full-text search that powers applications in your internal networks (content management systems, legal documents) and internet-facing applications such as e-commerce website search and content search.

When you choose Create, a collection typically takes less than a minute to initialize.

Upload and Search Data in Your Collection
Before uploading and searching data in your collection, configure the IAM policy to access the actual data within a collection. Choose Data access policies in the left navigation pane and Create data access policy.

You can apply multiple policies simultaneously to the same resource. Each policy contains a set of rules. Each rule has a resource (collection or index), permissions for the resource, and a list of principals (IAM users, role ARNs, or SAML identities).

Here is a sample policy that provides a single user the minimum permissions required to create an index in your collection, index some data, and search for it. Replace the principal ARN with the ARN of the account that you’ll use to sign in to OpenSearch Dashboards.

[
  {
    "Rules": [
      {
        "ResourceType": "index",
        "Resource": [
          "index/books/*"
        ],
        "Permission": [
          "aoss:CreateIndex",
          "aoss:ReadDocument",
          "aoss:UpdateIndex",
          "aoss:DeleteIndex",
          "aoss:WriteDocument"
        ]
      }
    ],
    "Principal": [
      "arn:aws:iam::123456789012:user/admin"
    ]
  }
]

Now, you can upload data to an OpenSearch Serverless collection using Postman or curl. You can also use Dev Tools within the OpenSearch Dashboards console. Choose OpenSearch Dashboards on the detail page of your collection.

Sign in to OpenSearch Dashboards using the AWS access and secret keys for the principal that you specified in your data access policy. Within OpenSearch Dashboards, open the left navigation menu and choose Dev Tools.

To create a single index called books-index, run PUT books-index, and index your first single document into books-index.

You can also query search data in Dev Tools.

GET books_index/_search
{
    "query": {
    "simple_query_string": {
    "query": "Jeff",
    "fields": ["author"]
    } 
  }
}

In the case of time-series data, you can ingest data with all of the streaming ingestion options, such as native OpenSearch streaming APIs, Amazon Kinesis Data Firehose, AWS Glue, and a wide range of open-source streaming ingestion pipelines like Logstash, FluentBit, Fluentd, and Data Prepper.

In addition, you can snapshot your data from a managed cluster on OpenSearch Service and restore it to your collection, making it easy to migrate your workloads. Once your data is in your collection, you can then query it using your favorite OpenSearch client and interactively analyze and visualize your data using OpenSearch Dashboards.

Things to Know
Here are a couple of things to keep in mind about additional features and considerations when you choose Amazon OpenSearch Serverless:

  • SAML Authentications – You can use your existing identity provider to offer single sign-on (SSO) for the OpenSearch Dashboards endpoints of OpenSearch Serverless SAML authentication lets you use third-party identity providers to sign in to OpenSearch Dashboards to index and search data. OpenSearch Serverless supports providers that use the SAML 2.0 standard, such as Okta, Keycloak, Active Directory Federation Services, and Auth0.
  • Private VPC Endpoints – You can use AWS PrivateLink to create a private connection between your VPC and OpenSearch Serverless. You can access your collections as if they were in your VPC without the use of an internet gateway, NAT device, VPN connection, or AWS Direct Connect connection. To create an interface endpoint, choose VPC endpoints in the left navigation pane of OpenSearch Service.
  • Managed Clusters – You may prefer to use an option of Amazon OpenSearch Service’s managed clusters in scenarios where you need tight control over cluster configuration or specific customizations. For example, your workloads may need custom plugins that run best on accelerated computing instances and need more control on configuration such as data sharding strategy. You can choose either provisioned instances or serverless according to the requirements of your workload.

Join the Preview
The preview release of Amazon OpenSearch Serverless is now available in the US East (N. Virginia, Ohio), US West (Oregon), EU (Ireland), Asia Pacific (Tokyo). With OpenSearch Serverless, there are no upfront costs, and you pay only for the data that is ingest and the queries you run. For pricing details, see the OpenSearch Service pricing page. To learn more, visit the Amazon OpenSearch Service User Guide.

We want to hear more feedback during the preview. Please send feedback to AWS re:Post for Amazon OpenSearch Service or through your usual AWS support contacts.

– Channy

Cloudflare partners to simplify China connectivity for corporate networks

Post Syndicated from Kyle Krum original https://blog.cloudflare.com/cloudflare-one-china/

Cloudflare partners to simplify China connectivity for corporate networks

Cloudflare partners to simplify China connectivity for corporate networks

IT teams have historically faced challenges with performance, security, and reliability for employees and network resources in mainland China. Today, along with our strategic partners, we’re excited to announce expansion of our Cloudflare One product suite to tackle these problems, with the goal of creating the best SASE experience for users and organizations in China.

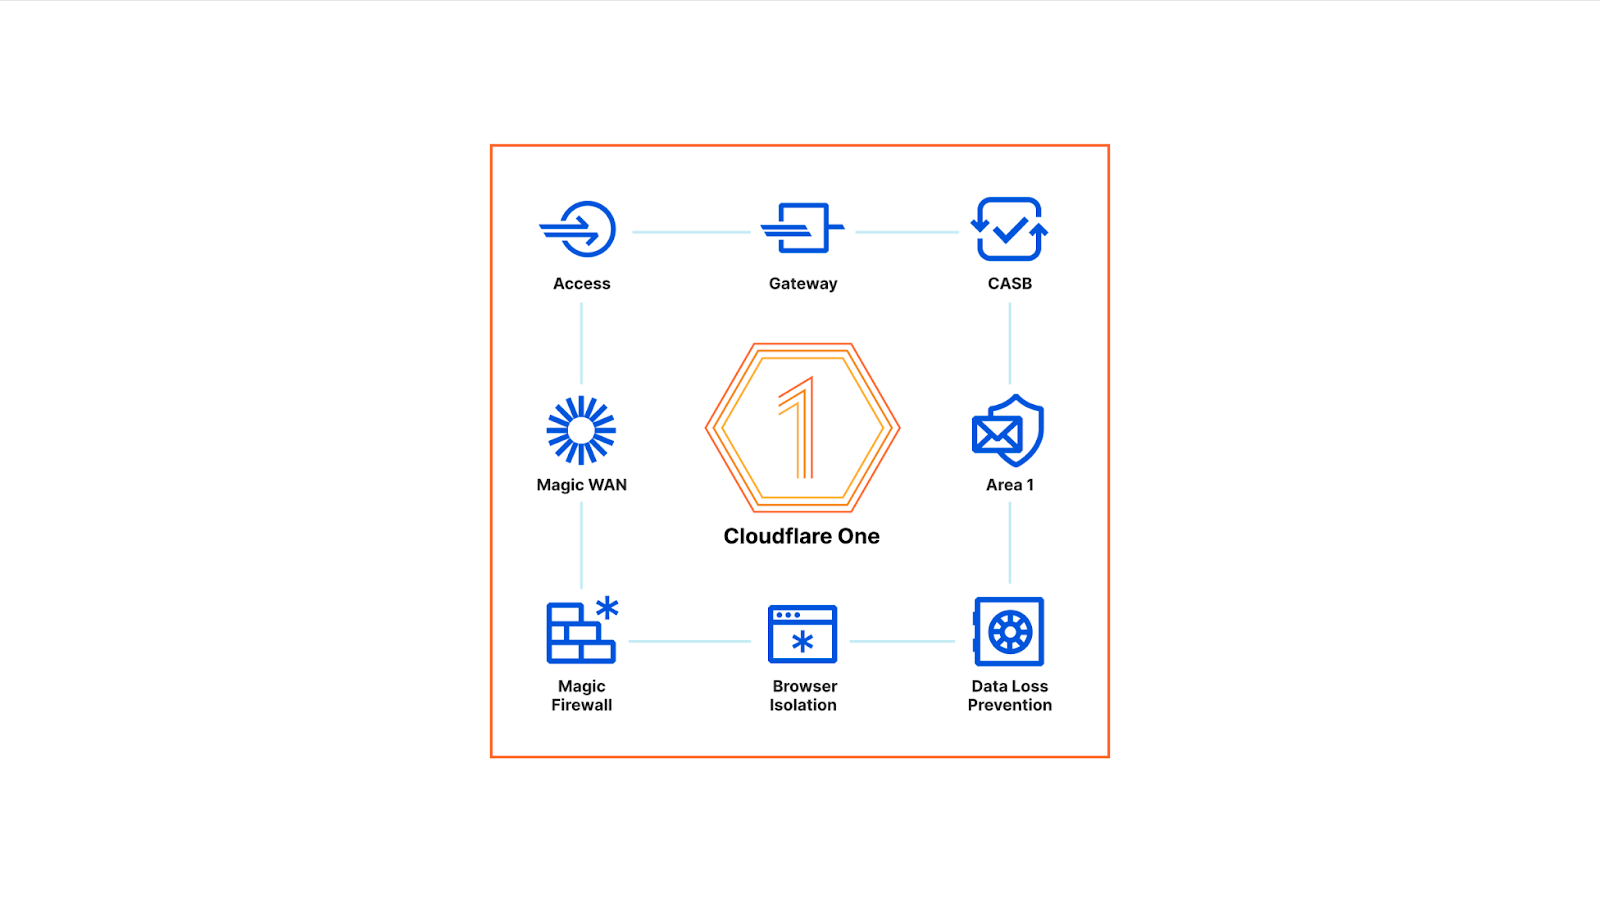
Cloudflare One, our comprehensive SASE platform, allows organizations to connect any source or destination and apply single-pass security policies from one unified control plane. Cloudflare One is built on our global network, which spans 275 cities across the globe and is within 50ms of 95% of the world’s Internet-connected population. Our ability to serve users extremely close to wherever they’re working—whether that’s in a corporate office, their home, or a coffee shop—has been a key reason customers choose our platform since day one.

In 2015, we extended our Application Services portfolio to cities in mainland China; in 2020, we expanded these capabilities to offer better performance and security through our strategic partnership with JD Cloud. Today, we’re unveiling our latest steps in this journey: extending the capabilities of Cloudflare One to users and organizations in mainland China, through additional strategic partnerships. Let’s break down a few ways you can achieve better connectivity, security, and performance for your China network and users with Cloudflare One.

Accelerating traffic from China networks to private or public resources outside of China through China partner networks

Performance and reliability for traffic flows across the mainland China border have been a consistent challenge for IT teams within multinational organizations. Packets crossing the China border often experience reachability, congestion, loss, and latency challenges on their way to an origin server outside of China (and vice versa on the return path). Security and IT teams can also struggle to enforce consistent policies across this traffic, since many aspects of China networking are often treated separately from the rest of an organization’s global network because of their unique challenges.

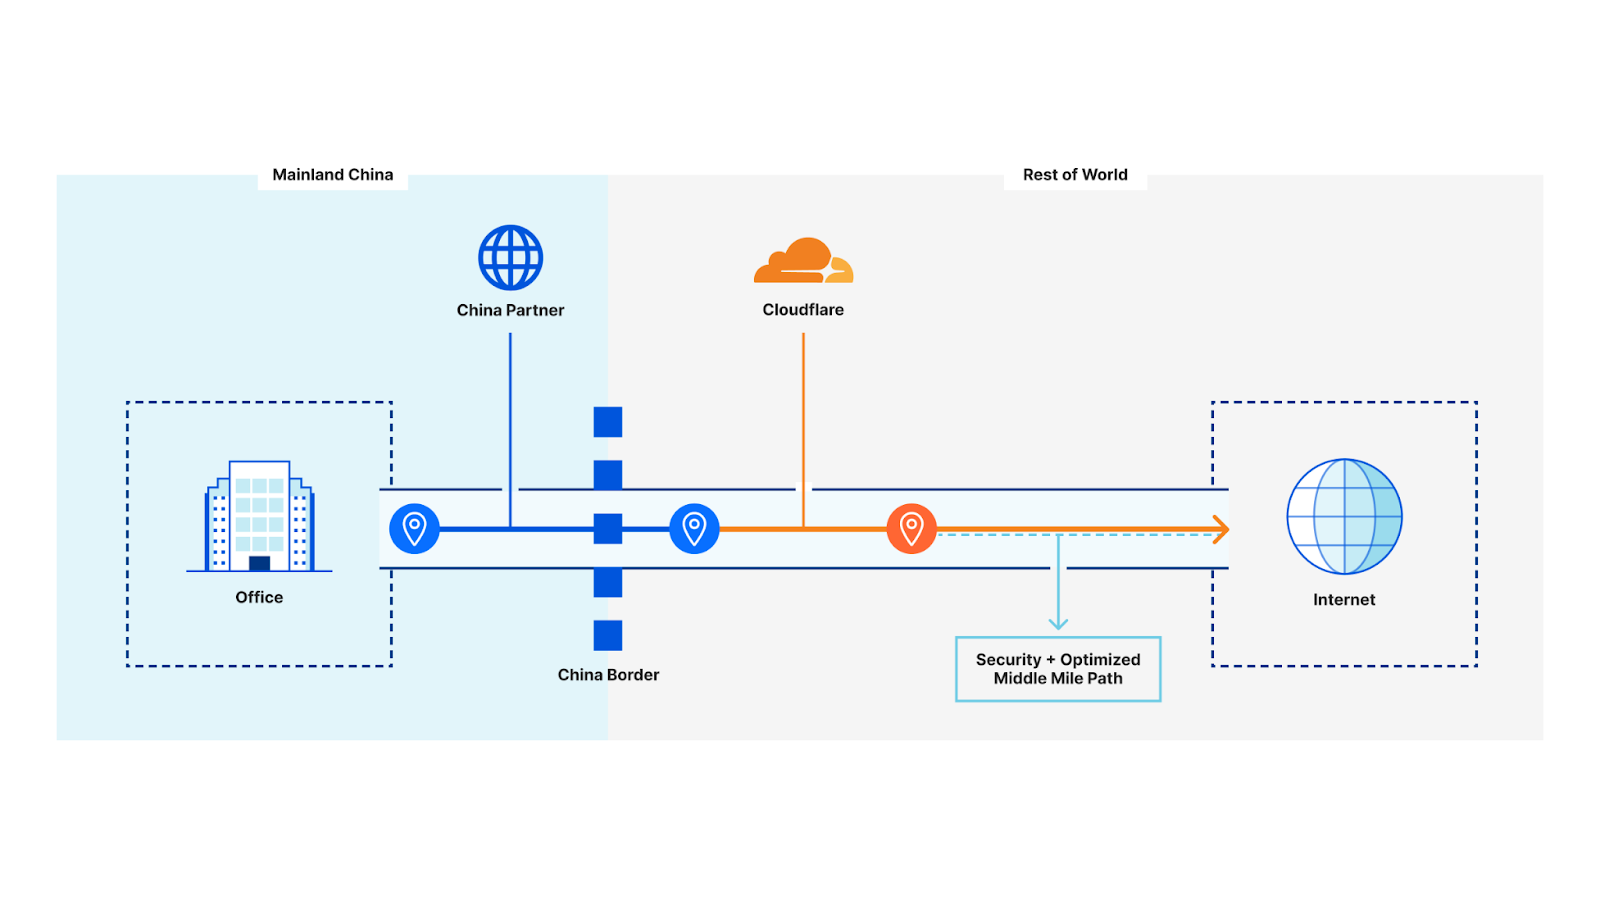
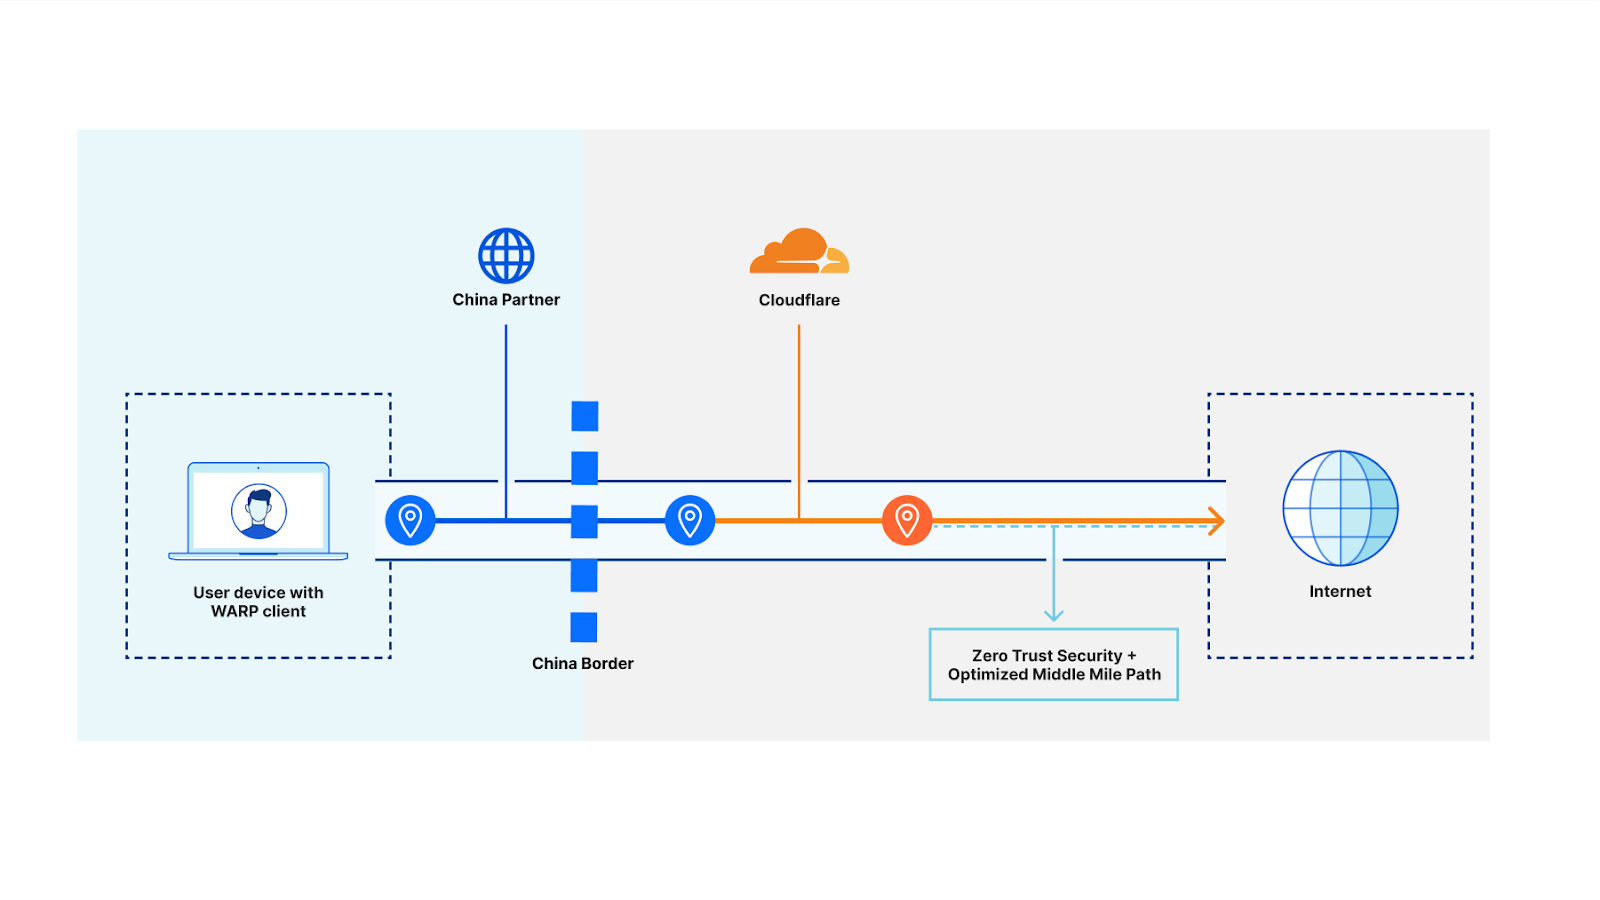
Cloudflare is excited to address these challenges with our strategic China partners, combining our network infrastructure to deliver a better end-to-end experience to customers. Here’s an example architecture demonstrating the optimized packet flow with our partners and Cloudflare together:

Cloudflare partners to simplify China connectivity for corporate networks

Acme Corp, a multinational organization, has offices in Shanghai and Beijing. Users in those offices need to reach resources hosted in Acme’s data centers in Ashburn and London, as well as SaaS applications like Jira and Workday. Acme procures last mile connectivity at each office in mainland China from Cloudflare’s China partners.

Cloudflare’s partners route local traffic to its destination within China, and global traffic across a secure link to the closest available Cloudflare data center on the other side of the Chinese border.

At that data center, Cloudflare enforces a full stack of security functions across the traffic including network firewall-as-a-service and Secure Web Gateway policies. The traffic is then routed to its destination, whether that’s another connected location on Acme’s private network (via Anycast GRE or IPsec tunnel or direct connection) or a resource on the public Internet, across an optimized middle-mile path. Acme can choose whether Internet-bound traffic egresses from a shared or dedicated Cloudflare-owned IP pool.

Return traffic back to Acme’s connected network location in China takes the opposite path: source → Cloudflare’s network (where, again, security policies are applied) → Partner network → Acme local network.

Cloudflare and our partners are excited to help customers solve challenges with cross-border performance and security. This solution is easy to deploy and available now – reach out to your account team to get started today.

Enforcing uniform security policy across remote China user traffic

The same challenges that impact connectivity from China-based networks reaching out to global resources also impact remote users working in China. Expanding on the network connectivity solution we just described, we’re looking forward to improving user connectivity to cross-border resources by adapting our device client (WARP). This solution will also allow security teams to enforce consistent policy across devices connecting to corporate resources, rather than managing separate security stacks for users inside and outside of China.

Cloudflare partners to simplify China connectivity for corporate networks

Acme Corp has users that are either based in or traveling to China for business and need to access corporate resources that are hosted beyond China, without necessarily being physically in an Acme office in order to enable this access. Acme uses an MDM provider to install the WARP client on company-managed devices and enroll them in Acme’s Cloudflare Zero Trust organization. Within China, the WARP client utilizes Cloudflare’s China partner networks to establish the same Wireguard tunnel to the nearest Cloudflare point of presence outside of mainland China. Cloudflare’s partners act as the carrier of our customers’ IP traffic through their acceleration service and the content remains secure inside WARP.

Just as with traffic routed via our partners to Cloudflare at the network layer, WARP client traffic arriving at its first stop outside of China is filtered through Gateway and Access policies. Acme’s IT administrators can choose to enforce the same, or additional policies for device traffic from China vs other global locations. This setup makes life easier for Acme’s IT and security teams – they only need to worry about installing and managing a single device client in order to grant access and control security regardless of where employees are in the world.

Cloudflare and our partners are actively testing this solution in private beta. If you’re interested in getting access as soon as it’s available to the broader public, please contact your account team.

Extending SASE filtering to local China data centers (future)

The last two use cases have focused primarily on granting network and user access from within China to resources on the other side of the border – but what about improving connectivity and security for local traffic?

We’ve heard from both China-based and multinational organizations that are excited to have the full suite of Cloudflare One functions available across China to achieve a full SASE architecture just a few milliseconds from everywhere their users and applications are in the world. We’re actively working toward this objective with our strategic partners, expanding upon the current availability of our application services platform across 45 data centers in 38 unique cities in mainland China.

Cloudflare partners to simplify China connectivity for corporate networks

Talk to your account team today to get on the waitlist for the full suite of Cloudflare One functions delivered across our China Network and be notified as soon as beta access is available!

Get started today

We’re so excited to help organizations improve connectivity, performance and security for China networks and users. Contact your account team today to learn more about how Cloudflare One can help you transform your network and achieve a SASE architecture inside and outside of mainland China.

If you’d like to learn more, join us for a live webinar on Dec 6, 2022 10:00 AM PST through this link where we can answer all your questions about connectivity in China.

Unifying Threat Findings to Elevate Your Runtime Cloud Security

Post Syndicated from Alon Berger original https://blog.rapid7.com/2022/11/29/unifying-threat-findings-to-elevate-your-runtime-cloud-security/

Unifying Threat Findings to Elevate Your Runtime Cloud Security

The widespread growth in cloud adoption in recent years has given businesses across all industries the ability to transform and scale in ways never before possible. However, the speed of those changes, combined with the drastically increased volume and complexity of resources in cloud environments, often forces organizations to choose between slowing the pace of their innovation or taking on massive amounts of unmanaged risk.

Cloud security teams still struggle to gather all the relevant insights such as alerts, threat findings, and notifications in a single, consolidated place, and even when they succeed, these findings are often missing much of the context needed to perform quickly and conduct proper investigations with confidence.

A Single Pane of Glass for Runtime Security Threats

To address and overcome these challenges, we’ve introduced a series of agentless cloud detection and response (CDR) capabilities, empowering our customers to utilize better observability and context for proactive and collaborative investigations.

As part of our new CDR capabilities, we first introduced a unified threat findings view that curates runtime threat detections from various customer resources and cloud service providers to allow faster intelligence analysis and detection of potential risks.

This offers frictionless workflow integrations with third-party cloud vendors, collecting cloud events, alerts, and threat intelligence feeds from associated services, such as AWS GuardDuty. The new unified view not only consolidates all runtime threat detections from various sources, but also provides richer security context by associating the findings with the affected cloud resources and their properties, all in a single place.

These seamless integrations also ensure that companies are able to leverage their CSP’s newest security tools and capabilities, as well as keeping up with the latest developments in the ever-changing world of cloud infrastructure.

In addition to consolidating third-party threat findings, we’ve also built native detection for suspicious events in customer cloud environments. These native detection capabilities, which are based on research from Rapid7 cloud security experts and detect suspicious events within 90 seconds, include identifying potential threat actor behaviors such as:

  • A user marking an existing resource as publicly accessible/exposed to the world
  • A user making a resource unencrypted at rest
  • A user removing transit encryption for a resource
  • A user removing cloud protective measures, such as password policy
  • A user adding overly permissive policies to an existing resource

Along with providing individual alerts for these detections, admin can now also filter resources to get a view of only those assets that have seen a suspicious event in the last 24 hours. This allows flexibility in how individuals and teams are able to review, investigate, and report on recent threats across their cloud environment.

Simplify Mitigation at Scale

Runtime security is key to providing visibility and detecting a variety of threats that piggyback on network resources. With Rapid7’s continuous monitoring and analysis of native and third-party threat findings, teams are able to leverage advanced automated remediation of risks in their environment, including misconfigured resources and hygiene drifts, known and unknown vulnerabilities, uncontrolled access (Secrets, tokens, credentials, etc.), and more.

Along with identifying threats, teams are now able to leverage an intelligent automated notification for third-party integrations such as SIEM, ticketing platform, or chat solutions. This significantly helps with an advanced and much faster remediation process to isolate relevant resources and prevent further suspicious activity until a thorough investigation is completed.

Take a Holistic Approach to Runtime Security in
the Cloud

Rapid7 is on a mission to help drive cloud security forward across the entire industry and community. With this new set of capabilities, including our recently launched unified threats findings view, getting visibility into risks and threats is easier and more powerful than ever. Ultimately, we aim for our customers to benefit from our current and upcoming offerings, helping them to create greater impact and to drive business forward faster and at scale.

Want to learn more? Click here.

Cartier-Tilet: Emacs 29 is nigh

Post Syndicated from original https://lwn.net/Articles/916201/

Lucien Cartier-Tilet looks
forward
to the upcoming Emacs 29 release.

In case you didn’t know, Emacs’ current syntax highlighting is
currently based on a system of regexes. Although it is not the
worst thing to use, it’s not the best either, and it can become
quite slow on larger files.

TreeSitter parses programming languages based into a concrete
syntax tree. From there, not only can syntax highlighting can be
done at high speed, but a much deeper analysis of the code is
possible and actions such sa syntax manipulation can also be
achieved since the syntax tree itself is available as an object
which can be manipulated!

Security updates for Tuesday

Post Syndicated from original https://lwn.net/Articles/916189/

Security updates have been issued by Debian (frr, gerbv, mujs, and twisted), Fedora (nodejs and python-virtualbmc), Oracle (dotnet7.0, kernel, kernel-container, krb5, varnish, and varnish:6), SUSE (busybox, python3, tiff, and tomcat), and Ubuntu (harfbuzz).

Charles V of Spain Secret Code Cracked

Post Syndicated from Bruce Schneier original https://www.schneier.com/blog/archives/2022/11/charles-v-of-spain-secret-code-cracked.html

Diplomatic code cracked after 500 years:

In painstaking work backed by computers, Pierrot found “distinct families” of about 120 symbols used by Charles V. “Whole words are encrypted with a single symbol” and the emperor replaced vowels coming after consonants with marks, she said, an inspiration probably coming from Arabic.

In another obstacle, he used meaningless symbols to mislead any adversary trying to decipher the message.

The breakthrough came in June when Pierrot managed to make out a phrase in the letter, and the team then cracked the code with the help of Camille Desenclos, a historian. “It was painstaking and long work but there was really a breakthrough that happened in one day, where all of a sudden we had the right hypothesis,” she said.

Using relevant contexts to engage girls in the Computing classroom: Study results

Post Syndicated from Katharine Childs original https://www.raspberrypi.org/blog/gender-balance-in-computing-relevance/

Today we are sharing an evaluation report on another study that’s part of our Gender Balance in Computing research programme. In this study, we investigated the impact of using relevant contexts in classroom programming activities for 12- to 13-year-olds on girls’ and boys’ attitudes towards Computing.

Two female learners code at a computer together.

We have been working on Gender Balance in Computing since 2018, together with partner organisations Behavioural Insights Team, Apps for Good, and WISE, to conduct research studies exploring ways to encourage more girls and young women to engage with Computing in school. The research programme has been funded by the Department for Education, and we deliver it as part of the National Centre for Computing Education. The report we share today is about the penultimate study in the programme.

Components of a Computing curriculum

A typical Computing curriculum is built around content: a list of concepts, knowledge, and skills that will be covered during the course. For some learners, that list will be enough to motivate and engage them in Computing. But other learners require more to engage with the subject, such as context about how they can use the computing skills they learn in the real world. Crucially, this difference between learners is often gendered. Research has shown that many boys become absorbed by the content in Computing courses, whereas for many girls the context for using computing skills is more important, and this context needs to relate to a variety of relevant scenarios where computing can solve problems.

In a computing classroom, a girl laughs at what she sees on the screen.

Developing teaching materials to highlight the relevance of Computing

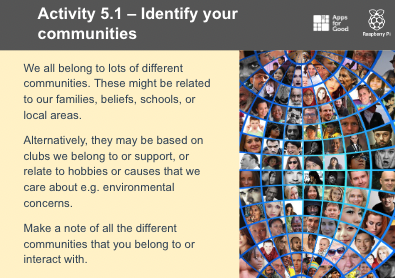
In the Relevance study, we worked together with colleagues from Apps for Good to create teaching materials that present Computing in contexts that were relevant to pupils’ own interests. To do this, we drew on a research concept called identification. This states that when learners become interested in a topic because it relates to part of their own identity, that makes the subject more personally meaningful to them, which in turn means that they are more likely to continue studying it. In the materials we created, we drew on learners’ identities based on the communities that they belonged to (see image below). The materials asked them to identify the connections they had to their own communities, and to then use this as the context to design and create a mobile phone app.

A slide from a Computing lesson inviting learners to identify the communities they are part of based on their family, beliefs, school, interests, etc.
The intervention materials asked learners to think about the communities they belong to.

“I feel a sense of achievement in Computing when making your ideas a reality makes you proud of your creation, which is rewarding.” (Female learner, Relevance study evaluation report p. 57)

The Relevance research study

Between January 2022 and April 2022, more than 95 secondary schools were part of our study investigating the effect that learning with these resources might have on the attitudes of Year 8 pupils (aged 12–13) towards Computing. We are very grateful to all the schools, pupils, and teachers who took part in this study.

To enable evaluation of the study as a randomised controlled trial, the schools were randomly divided into two groups: a ‘control’ group that taught standard Computing lessons, and a ‘treatment’ group that delivered the intervention materials we had developed. The impact of the intervention was independently evaluated by the Behavioural Insights Team using data collected from pupils via surveys at the start and end of the intervention. The evaluators also collected data while conducting lesson observations, pupil group discussions, teacher interviews, and teacher surveys to understand how the intervention was delivered.

The girls who took part in the intervention chose an interesting range of contexts for their apps, including: 

  • Solving problems in the school community, such as homework timetabling and public transport
  • Interest-based communities, such as melody-making and interior design 
  • Issues in wider communities, such as sea life population and mental health

“I feel like it’s an important subject, and I feel like sea life is at risk right now, and I want to help people realise that.” (Female learner, Relevance study evaluation report p. 60)

“I feel like computing can create apps to do with solving mental health problems, which I think are very important and personally need a lot of improvement on the way we can cope with mental health.” (Female learner, Relevance study evaluation report p. 60)

What we learned from the Relevance study

The start of this blog refers to the core components of a Computing curriculum: concepts, knowledge, and skills. One way of building a curriculum is to list these components and develop a scheme of work which covers them all. However, in a recent computing education paper, researchers present an alternative way: developing curricula around the possible endpoints of learners. For computing, one endpoint could be the economic opportunities of a programming career, but equally, another could be using digital technologies for creative expression. The researchers argue that when learners have the opportunity to use computing as a tool related to personally meaningful contexts, a more diverse group of learners can become engaged in the subject.

A group of young people in a computer science classroom pose for a group photo.

Girls who took part in our Relevance study expressed the importance of creativity. “I think last term we had instructions and you follow them, whereas now it’s like your own ideas and your own creativity and whatever you make,” said one female learner (report, p. 56). The series of lessons where learners designed a prototype of their app was particularly popular among girls because this activity included creative expression. Girls who see themselves as creative align their interests with subjects that allow them to express this part of their identity.

A slide from a Computing lesson inviting learners to design a mobile phone app on paper.
With the intervention materials, learners developed a paper prototype of their app before going on to create code for it.

Based on learner responses to a ‘yes/no’ question about whether they were likely to choose GCSE Computer Science, the evaluators of the study found no statistically significant differences between the students who were part of the treatment and control groups. However, when learners were asked instead to select from a list which subjects they were likely to choose at GCSE, there was a statistically significant difference in the results: girls from schools in the treatment group were more likely to choose GCSE Computer Science as one of their options than girls in the control group. This finding suggests that it would be beneficial to gender balance in Computing if educators who design Computing curricula consider multiple endpoints for learners and include personally meaningful contexts to create learning experiences that are relevant to diverse groups of learners.

Find out more about making computing relevant for your learners

This is the penultimate report to be published about the studies that are part of the Gender Balance in Computing programme. If you would like to stay up-to-date with the programme, you can sign up to our newsletter. Our final report is about a study that explored the role that options booklets and evenings play in students’ subject choice.

The post Using relevant contexts to engage girls in the Computing classroom: Study results appeared first on Raspberry Pi.

Fast Way to Upgrade Your Zabbix Knowledge

Post Syndicated from Nicole Makarova original https://blog.zabbix.com/fast-way-to-upgrade-your-zabbix-knowledge/20267/

Since Zabbix 6.0 LTS has been released with a lot of new features and improvements, it might be tricky for one to figure out how to use these features on their own. Here, Zabbix comes to the rescue with Upgrade Training Courses to boost your knowledge in just one day.

If you previously completed the Zabbix 5.0 core training, the Upgrade Program will be an excellent way to learn about the recent improvements and add-ons of the new version without retaking the entire course. It is akin to a crash course that saves you both time and effort.

Zabbix Upgrade Training Program Overview

The Upgrade Training Program consists of two courses: Zabbix 6.0 Certified Specialist Upgrade Course and Zabbix 6.0 Certified Professional Upgrade Course. Let us tell you more about each upgraded training.

The Certified Specialist Upgrade Course covers the updated and new features of the basics, such as different data collection approaches, problem detection, data preprocessing, different visualization features, and more. Some of the long-awaited features you will get familiar with during the upgrade course are new Dashboard Widgets (e.g.: Item Value Widget), Top Hosts Widget, and the ability to display your monitored infrastructure on the Geomap Widget. Another thing that might serve your interest is the Service Monitoring section, which has been completely redesigned with a focus on flexible business service monitoring, alerting, and root cause analysis.

On the contrary, Certified Professional Upgrade Course focuses on advanced environments, where infrastructure scalability and redundancy are the common requirements. Hence, this course includes six major features, with two of them being High Availability and Advanced Problem Detection. The Zabbix server High Availability feature allows you to deploy multiple Zabbix servers that will remain in standby mode and will be failed over if the currently active server becomes unavailable. The Advanced Problem Detection section focuses on anomaly detection and baseline monitoring features, as Zabbix now supports history functions. This means that Zabbix can semi-automatically detect anomalous values and create alerts if such values are detected. The same approach can be used in baseline monitoring: Zabbix can now calculate baseline values for your metrics and react if your values are outside of this baseline.

As you see, such extensive training wraps up all the meaningful recent improvements of Zabbix 6.0 and delivers them to you in one day, not requiring you to spend a week on the course retake. And besides, it is also cheaper than the entire course.

This is the first time Zabbix is providing a quick and easy way to upgrade existing Zabbix 5.0 Specialist and Zabbix 5.0 Professional certifications to Zabbix 6.0. The course is designed for experienced Zabbix administrators, who are working with Zabbix 5.0 on daily basis. The one-day course featuring all important changes and updates in the most recent Zabbix LTS version is a very cost and time-efficient option.
– Kaspars Mednis, Chief Trainer at Zabbix

Applying for the Right Course

Now it is time to pick the right Upgrade Course to apply for if you are ready to evolve your Zabbix skills. Here are a few hints on how to do it.

If you have already completed our core training and received the Zabbix 5.0 Certified Specialist Certificate, you should apply for the Zabbix 6.0 Certified Specialist Upgrade Course. This one-day course includes 5 hours of training and a one-hour exam that will challenge you to check your knowledge of the whole Zabbix 6.0 LTS version and its new features.

Therefore, if you were certified as a 5.0 Certified Professional, go for the Zabbix 6.0 Certified Specialist + Professional Upgrade Course bundle. This one includes both: Specialist and Professional courses and lasts a little longer. After completing the Specialist course, Professionals will have their additional 1.5-hour training and a 30-minute exam to master their knowledge.

Useful Things to Know

We suggest revising your knowledge of the Zabbix usage, as the exam of the Upgrade Training Program includes questions about both: the entire Zabbix 6.0 LTS release, as well as new features and improvements. Feel free to use your Zabbix 5.0 materials from the previous core training you have completed or explore Zabbix Documentation in case the materials are unavailable to you for some reason.

Please, bear in mind that 6.0 Certified Professional Upgrade training is meant only for the 5.0 Certified Professionals who have previously acquired the 6.0 Certified Specialist level.

The Upgrade Training Program is available online all over the world in different languages and for various time zones. And what’s more, upon successful course completion, you will receive an official Zabbix training certificate stating you have upgraded to the Zabbix 6.0 Certified Specialist or Professional.

Ready for takeoff? Then check out the full schedule and cost of the program on our Upgrade Courses page and pick your training. For even more details, please contact our Sales Team.

Discover more courses and make a solid investment into your Zabbix skills by applying to:
• Core Training Courses to become a professional or an expert
• Extra Courses to study in depth one specific monitoring topic
• Exams to prove your Zabbix knowledge


New – Accelerate Your Lambda Functions with Lambda SnapStart

Post Syndicated from Jeff Barr original https://aws.amazon.com/blogs/aws/new-accelerate-your-lambda-functions-with-lambda-snapstart/

Our customers tell me that they love AWS Lambda for many reasons. On the development side they appreciate the simple programming model and ease with which their functions can make use of other AWS services. On the operations side they benefit from the ability to build powerful applications that can respond quickly to changing usage patterns.

As you might know if you are already using Lambda, your functions are run inside of a secure and isolated execution environment. The lifecycle of each environment consists of three main phases: Init, Invoke, and Shutdown. Among other things, the Init phase bootstraps the runtime for the function and runs the function’s static code. In many cases, these operations are completed within milliseconds and do not lengthen the phase in any appreciable way. In the remaining cases, they can take a considerable amount of time, for several reasons. First, initializing the runtime for some languages can be expensive. For example, the Init phase for a Lambda function that uses one of the Java runtimes in conjunction with a framework such as Spring Boot, Quarkus, or Micronaut can sometimes take as long as ten seconds (this includes dependency injection, compilation of the code for the function, and classpath component scanning). Second, the static code might download some machine learning models, pre-compute some reference data, or establish network connections to other AWS services.

Introducing Lambda SnapStart
In order to allow you to put Lambda to use in even more ways, we are introducing Lambda SnapStart today.

After you enable Lambda SnapStart for a particular Lambda function, publishing a new version of the function will trigger an optimization process. The process launches your function and runs it through the entire Init phase. Then it takes an immutable, encrypted snapshot of the memory and disk state, and caches it for reuse. When the function is subsequently invoked, the state is retrieved from the cache in chunks on an as-needed basis and used to populate the execution environment. This optimization makes invocation time faster and more predictable, since creating a fresh execution environment no longer requires a dedicated Init phase.

We are launching with support for Java functions that make use of the Corretto (java11) runtime, and expect to see Lambda SnapStart put to use right away for applications that make use of Spring Boot, Quarkus, Micronaut, and other Java frameworks. Enabling Lambda SnapStart for Java functions can make them start up to 10x faster, at no extra cost.

Using Lambda SnapStart
Because my last actual encounter with Java took place in the last century, I used the Serverless Spring Boot 2 example from the AWS Labs repo as a starting point. I installed the AWS SAM CLI and did a test build & deploy to establish a baseline. I invoked the function and saw that the Init duration was slightly more than 6 seconds:

Then I added two lines to template.yml to configure the SnapStart property:

I rebuilt and redeployed, published a fresh version of the function to set up SnapStart, and ran another test:

With SnapStart, the initialization phase (represented by the Init duration that I showed you earlier) happens when I publish a new version of the function. When I invoke a function that has SnapStart enabled, Lambda restores the snapshot (represented by the Restore duration) before invoking the function handler. As a result, the total cold invoke with SnapStart is now Restore duration + Duration. SnapStart has reduced the cold start duration from over 6 seconds to less than 200 ms.

Becoming Snap-Resilient
Lambda SnapStart speeds up applications by reusing a single initialized snapshot to resume multiple execution environments. This has a few interesting implications for your code:

Uniqueness – When using SnapStart, any unique content that used to be generated during the initialization must now be generated after initialization in order to maintain uniqueness. If you (or a library that you reference) uses a pseudo-random number generator, it should not be based on a seed that is obtained during the Init phase. We have updated OpenSSL’s RAND_Bytes to ensure randomness when used in conjunction with SnapStart, and we have verified that java.security.SecureRandom is already snap-resilient. Amazon Linux’s /dev/random and /dev/urandom are also snap-resilient.

Network Connections -If your code creates long-term connections to network services during the Init phase and uses them during the Invoke phase, make sure that it can re-establish the connection if necessary. The AWS SDKs have already been updated to do this.

Ephemeral Data – This is effectively a more general form of the above items. If your code downloads or computes reference information during the Init phase, consider doing a quick check to make sure that it has not gone stale during the caching period.

Lambda provides a pair of runtime hooks to help you to maintain uniqueness, as well as a scanning tool to help detect possible issues.

Things to Know
Here are a couple of other things to know about Lambda SnapStart:

Caching – Cached snapshots are removed after 14 days of inactivity. Lambda will automatically refresh the cache if a snapshot depends on a runtime that has been updated or patched.

Pricing – There is no extra charge for the use of Lambda SnapStart.

Feature Compatibility – You cannot use Lambda SnapStart with larger ephemeral storage, Elastic File Systems, Provisioned Concurrency, or Graviton2. In general, we recommend using SnapStart for your general-purpose Lambda functions and Provisioned Concurrency for the subset of those functions that are exceptionally sensitive to latency.

Firecracker – This feature makes use of Firecracker Snapshotting.

Regions – Lambda SnapStart is available in the US East (Ohio, N. Virginia), US West (Oregon), Asia Pacific (Singapore, Sydney, Tokyo), and Europe (Frankfurt, Ireland, Stockholm) Regions.

— Jeff;

Amazon Inspector Now Scans AWS Lambda Functions for Vulnerabilities

Post Syndicated from Marcia Villalba original https://aws.amazon.com/blogs/aws/amazon-inspector-now-scans-aws-lambda-functions-for-vulnerabilities/

Amazon Inspector is a vulnerability management service that continually scans workloads across Amazon Elastic Compute Cloud (Amazon EC2) instances, container images living in Amazon Elastic Container Registry (Amazon ECR), and, starting today, AWS Lambda functions and Lambda layers.

Until today, customers that wanted to analyze their mixed workloads (including EC2 instances, container images, and Lambda functions) against common vulnerabilities needed to use AWS and third-party tools. This increased the complexity of keeping all their workloads secure.

In addition, the log4j vulnerability a few months ago was a great example that scanning your functions for vulnerabilities only before deployment is not enough. Because new vulnerabilities can appear at any time, it is very important for the security of your applications that the workloads are continuously monitored and rescanned in near real-time as new vulnerabilities are published.

Getting started
The first step to getting started with Amazon Inspector is to enable it for your account or your entire AWS Organizations. Once activated, Amazon Inspector automatically scans the functions in the selected accounts. Amazon Inspector is a native AWS service; this means that you don’t need to install a library or agent in your functions or layers for this to work.

Amazon Inspector is available starting today for functions and layers written in Java, NodeJS, and Python. By default, it continually scans all the functions inside your account, but if you want to exclude a particular Lambda function, you can attach the tag with the key InspectorExclusion and the value LambdaStandardScanning.

Amazon Inspector scans functions and layers initially upon deployment and automatically rescans them when there are changes in the workloads, for example, when a Lambda function is updated or when a new vulnerability (CVE) is published.

Summary for Amazon Inspector findings

In addition to functions, Amazon Inspector scans your Lambda layers; however, it only scans the specific layer version that is used in a function. If a layer or layer version is not used by any function, then it won’t get analyzed. If you are using third-party layers, Amazon Inspector also scans them for vulnerabilities.

You can see the findings for the different functions in the Amazon Inspector Findings console filtered By Lambda function. When Amazon Inspector finds something, all the findings are routed to AWS Security Hub and to Amazon EventBridge so you can build automation workflows, like sending notifications to the developers or system administrators.

Findings by function

Available Now
Amazon Inspector support for AWS Lambda functions and layers is generally available today in US East (Ohio), US East (N. Virginia), US West (N. California), US West (Oregon), Asia Pacific (Hong Kong), Asia Pacific (Mumbai), Asia Pacific (Seoul), Asia Pacific (Singapore), Asia Pacific (Sydney), Asia Pacific (Tokyo), Canada (Central), Europe (Frankfurt), Europe (Ireland), Europe (London), Europe (Milan), Europe (Paris), Europe (Stockholm), Middle East (Bahrain), and South America (Sao Paulo).

If you want to try this new feature, there is a 15-day free trial for you. Visit the service page to read more about the service and the free trial.

— Marcia

New — Create and Share Operational Reports at Scale with Amazon QuickSight Paginated Reports

Post Syndicated from Donnie Prakoso original https://aws.amazon.com/blogs/aws/new-create-and-share-operational-reports-at-scale-with-amazon-quicksight-paginated-reports/

There are various ways to report on data insights, and paginated reports is one of them. Paginated reports are essential documents that contain critical business information for end-users. For decades, paginated reports have been the standard business reporting format. The following are examples of paginated reports. On the left shows the report for income statement and on the right is the yearly summary corporate statement:

Examples of paginated reports

As the example shows, paginated reports contain various highly formatted insights and are designed to be printable, in landscape or portrait orientation, so they can be consumed easily by readers. It’s called paginated because it often spans tens of hundreds of pages of data.

Although it may appear to be a simple task, generating paginated reports is heavily dependent on legacy data warehouses and legacy business intelligence tools, especially because modern business intelligence tools do not offer this capability. As a result, organizations typically have to maintain multiple business intelligence systems to have separate solutions for building critical operational reports and summarized dashboards. Each solution presents its set of challenges with data governance, security, and access management. This caused a disjointed experience both authors and end users. Legacy BI systems also run on-premises infrastructure, which is expensive to maintain and upgrade.

Introducing Amazon QuickSight Paginated Reports
Today, I’m pleased to announce Amazon QuickSight Paginated Reports. This feature allows customers to create and share highly formatted, personalized reports containing business-critical data to hundreds of thousands of end-users without any infrastructure setup or maintenance, up-front licensing, or long-term commitments.

Here’s a quick look on how Amazon QuickSight Paginated Reports works:

Quick look on Amazon QuickSight Paginated Reports

With Amazon QuickSight Paginated Reports, customers can now create and share paginated reports to their users from the same familiar QuickSight interface that they use to create and consume interactive dashboards. They can use one single BI service to create and deliver interactive analytics in dashboards, format reports with paginated reports, or embed analytics in apps while also allowing end users to ask questions of the underlying data using machine learning (ML) powered natural language query with QuickSight Q. From ML powered interactive dashboard to generating and distributing operational reports, these benefits impact different stakeholder groups in an organization

For Readers – Amazon QuickSight Paginated Reports makes it easy for readers to consume reports in a familiar and scheduled fashion, in highly formatted models in .pdf or .csv formats. Readers can access these reports via email, Amazon QuickSight web and mobile interfaces, mobile applications, or embedded portals.

For Authors – This feature gives report authors the flexibility to create highly formatted reports with images, texts, charts, tables, and exact page sizes. They can create reports from the same data models as dashboards, reusing data models built up, using access permissions (RLS/CLS) setup, and publishing in the same dashboards where their users look for data. These dashboards are also available via API, allowing migration between accounts or programmatic creation and migration of these assets as needed.

The Amazon QuickSight Paginated Reports makes it easy to build reports without the need for separate training or investment in a dedicated application. With an easy-to-use web-based authoring interface, this feature allows report authors to create complex data models in the form of operational reports for hundreds of thousands of report readers and enables data-driven decision-making.

For IT Leaders – This feature also provides IT leaders with benefits such as fully managed reporting capabilities consolidated within Amazon QuickSight. This reduces the time and resources required to set up and maintain reporting solutions, helping IT leaders to start looking at the cloud for their BI needs and transitioning legacy reporting to the cloud to save time and resources.

Amazon QuickSight Paginated Reports also leverages existing QuickSight capabilities, such as user management, data preparation, advanced scheduling and audit logging. By inheriting the capabilities from QuickSight, it removes the need to manage any infrastructure or provisioning setup to deliver reports to hundreds of thousands of users.

Get Started with Amazon QuickSight Paginated Reports
Let’s see how to get started with Amazon QuickSight Paginated Reports. I will focus more on how authors can create, publish and deliver reports to readers.

For Authors: Creating a Report
First, I open the QuickSight console. Then, in the navigation section, I select the dataset that I will use for reporting purposes. 

Selecting dataset

After I check and confirm the dataset, I select Use in Analysis.

Using dataset in analysis

On the next page, I have the option to select the sheet type, Interactive sheet, or Paginated report. I select Paginated report, and here I can configure the report for Paper size and either Portrait or Landscape orientation.

Select Paginated report

Now I’m starting my report creation. The sheet area I can use is adjusted to the paper size option I defined in the previous step. In this reporting sheet, QuickSight provides me with Header and Footer areas.

Header and footer area

First, I want to add the title of this report in the header section. I select the Header area, and in the menu section, I select Add text.

Adding text

Now, I can start entering the title of the report. I name this report “Attendance Statistics” and customize the header using the company logo. I can also use the text toolbar to format the text and add page numbers. For any changes I’ve made, I can also see the preview directly on this page.

Using text toolbar

I can also add other visuals in any section by selecting Add visual.

Adding visual

From here, I can start building reports with the available visuals, just like I normally do on the Amazon QuickSight dashboard. For example, if I need to add a summary to the pie chart, I can add another text box and drag and drop to set the layout and resize the visuals as needed.

Arranging layout

If I need to add another section, from the menu, I select Add section, and I can add other visuals or insights into this new section. As for visual tabular data, the visual will be generated across pages.

Table will automatically expand across pages

For Author: Publish and Schedule Report
Once the analysis is completed, I need to publish this analysis as a dashboard by selecting Share and then Publish dashboard. Then I can choose to create a new dashboard by selecting Publish new dashboard or Replace an existing dashboard. I can also select the sheet(s) I want to publish.

Publishing dashboard

At this stage, I’m ready to set a schedule to deliver my reports to readers. To do that, I need to open the dashboard and define a schedule by selecting Add schedule.

Select Add Schedule

In this menu, I can specify the schedule name and also the content format. In the Content section, I can choose either PDF or CSV format. For PDF format, I can select the sheet I want to use. For CSV format, I can select multiple visuals.

Schedule configuration

As for the delivery report schedule, I can define the schedule as Daily, Weekly, Monthly, or one-time delivery with Do not repeat. I can also specify the date and time of delivery, including the time zone.

Schedule timing configuration

Then, I specify the configuration of the email message. In the final section, I can also specify how readers access this report, by using Download link or File attachment. Once I’m done setting up the schedule, I can Save it or send this report according to the schedule by selecting Save and run now.


Save or save and run now

For Readers: Receiving and Accessing Reports
Here is an example email from the schedule that QuickSight has sent to me as a reader. I can download this report from the email attachment or from the dashboard. 

Example mail with paginated report

I can also use the provided link in the email to view recent snapshots. The Recent Snapshots feature allows me to review previously generated reports.Recent snapshots feature

Things to Know
Programmatic API Access – In addition to using the Amazon QuickSight console, customers can also use the AWS API and SDK to interact programmatically with Amazon QuickSight Paginated Reports.

AWS Partners – To make it easier for customers to migrate their legacy BI solutions to Amazon QuickSight, customers can work with AWS partners, Ironside Consulting and Data Terrain. Ironside and Data Terrain offerings are available in the AWS Marketplace, with more details at Amazon QuickSight Partners page.

Availability and Pricing – Amazon QuickSight Paginated Reports is available as an add-on to the existing Amazon QuickSight Enterprise or Enterprise enabled with Q in all supported AWS Regions.

Visit the Amazon QuickSight Paginated Reports page to learn more details on how to use this feature, learn how to get started, and understand the pricing.

Happy building!
— Donnie

New Amazon QuickSight API Capabilities to Accelerate Your BI Transformation

Post Syndicated from Sébastien Stormacq original https://aws.amazon.com/blogs/aws/new-amazon-quicksight-api-capabilities-to-accelerate-your-bi-transformation/

Regular readers of this blog, and AWS customers alike, know the benefits of infrastructure as code (IaC). It allows you to describe your infrastructure using a programming language to consistently deploy your infrastructure to multiple environments or AWS Regions. Other benefits are the possibility to version-control your infrastructure using the same development tools and workflow you use to manage your application source code. IaC also offers the ability to programmatically validate part of the infrastructure before it is deployed.

Today, we are expanding the capabilities of QuickSight APIs to allow programmatic creation and management of dashboards, analysis, and templates. These capabilities allow BI teams to manage their BI assets as code, similar to IaC. It brings greater agility to BI teams, and it allows them to accelerate BI migrations from legacy products through programmatic migration options.

Business intelligence and IT operations (BIOps) are inspired by best practices learned over decades from DevOps. BIOps enable faster innovation for your customers, bringing them data insights quickly. Dashboards are usually developed and deployed manually due to the UI-driven nature of BI authoring. This presents a challenge for BIOps, as changes to dashboards during deployments might not be fully validated, leading to errors and downtime when changes are inadvertently moved to production. The new QuickSight APIs enable you to programmatically create and modify your QuickSight analyses and dashboards, enable version control on these assets in your code repository, and help to accelerate your migration to the AWS Cloud.

Programmatic creation and management of analysis, templates, and dashboards also helps you to migrate assets from older BI solutions. Among all of the data and analytics workloads moving to the cloud, business intelligence tends to be among the last pieces to be migrated from the legacy, on-premises solutions. BI teams often have thousands of custom reports and dashboards, built over decades, that are tedious to migrate. Migrating these reports is time-consuming as BI teams need to spend months of work migrating each of these assets manually one by one.

Terminology
With this launch, QuickSight adds a new describe set of APIs. We are also updating existing create, update, and list API verbs. Altogether, these new and updated APIs allow you to work with the data model of analyses, templates, and dashboards for fine grain control via APIs.

  • A QuickSight analysis is the easy-to-use workspace for creating data visualizations, which are graphical representations of your data. Each analysis contains a collection of visualizations that you arrange and customize.
  • A QuickSight dashboard lets you share interactive visualizations or static reports from an analysis with other users.
  • A QuickSight template is an entity that encapsulates the metadata required to create an analysis or a dashboard. It abstracts the dataset associated with the analysis by replacing it with placeholders.

The new APIs (DescribeAnalysisDefinition, DescribeTemplateDefinition, DescribeDashboardDefinition) now allow developers to manage all supported charts and visual components.

Let’s See It in Action
Let’s imagine I want to programmatically create a QuickSight analysis.

Programmatically creating a new business intelligence analysis is a three-step process: create the data source that provides data for analyses, create a dataset based on the data source, and create the QuickSight analysis.

The first step when using QuickSight programmatically or through the user interface is to define your data sources. Data sources define the properties of the databases that have the data you want to analyze. Creating and managing data sources programmatically is not new. You can refer to the QuickSight API Operations to Control Data Sources page.

The second step is to create the dataset to link one or multiple data sources. Again, programmatically managing datasets is not new.

When using the new describe API, analysis, dashboards, and templates are defined as JSON objects fully modeled in the AWS SDK. In this demo, I am using the AWS Command Line Interface (CLI) that uses JSON objects. When you use Java or another AWS SDK, you can programmatically manipulate all elements.

The easiest way to get started to programmatically create a new analysis or dashboard is to start with the definition of an existing one that you created in the console.

The third step is to create the analysis. I first call the describe-analysis-definition API to describe an existing analysis. I receive a JSON file that is the full response of the API call. I can inspect and modify the Definition in the describe-analysis-definition response to create a new analysis.

aws quicksight describe-analysis-definition      \
        --aws-account-id 0123456789              \
        --analysis-id linechart-kpi-donut-pivot
> ./AWS\ Blog\ Sample\ Code/linechart-kpi-donut-pivot.json

Note: This JSON file cannot be used directly without several modifications as input to the create API.

When I am ready to create a new analysis, I generate a JSON file using the --generate-cli-skeleton argument. Then, I copy the original or modified Definition object from my earlier call to describe-analysis-definition into create-sales-analysis.json.

aws quicksight create-analysis \ 
      --generate-cli-skeleton > create-sales-analysis.json

aws quicksight create-analysis  \
      --cli-input-json file://./AWS\ Blog\ Sample\ Code/create-sales-analysis.json

The Definition field shares the same shape across dashboards, templates, and analyses, so the Definition used to create our analysis can also be re-used to create a new dashboard if desired with the create-dashboard API.

aws quicksight create-dashboard \
      --generate-cli-skeleton > create-dashboard.json

I can then modify create-dashboard.json to include the Definition from my create-sales-analysis.json file, as well as update other parameters, then make a call to create-dashboard.

aws quicksight create-dashboard \
       --cli-input-json file://./AWS\ Blog\ Sample\ Code/create-dashboard.json

Here is an extract of the JSON file I used.

QuickSight API - Create Dashboard

Obviously, developing a dashboard using the API is an iterative process. Here is the result after several iterations.

QuickSight API - new dashboard

I can apply the same technique to programmatically migrate assets from older BI solutions.

Pricing and Availability
The new API allows you to define your business intelligence dashboard as programmable objects. It will speed up migration from older BI tools. QuickSight’s API documentation page has all the details.

The API is available at no additional charge to all QuickSight Enterprise Edition customers in all AWS Regions where QuickSight is available. AWS CloudFormation support for the newly supported data models on these APIs is coming soon.

Go build your first dashboard programmatically today! 

— seb

The collective thoughts of the interwebz