CVE-2022-3786 and CVE-2022-3602: Two High-Severity Buffer Overflow Vulnerabilities in OpenSSL Fixed

Post Syndicated from Rapid7 original https://blog.rapid7.com/2022/11/01/cve-2022-3786-and-cve-2022-3602-two-high-severity-buffer-overflows-in-openssl-fixed/

CVE-2022-3786 and CVE-2022-3602: Two High-Severity Buffer Overflow Vulnerabilities in OpenSSL Fixed

The Rapid7 research team will update this blog post as we learn more details about this vulnerability and its attack surface area. We expect to update this page next by 3 PM EDT on November 1, 2022.

The OpenSSL project released version 3.0.7 on November 1, 2022, to address CVE-2022-3786 and CVE-2022-3602, two high-severity vulnerabilities affecting OpenSSL’s 3.0.x version stream discovered and reported by Polar Bear and Viktor Dukhovni. OpenSSL is a widely used open-source cryptography library that allows for the implementation of secure communications online; this includes generating public/private keys and use of SSL and TLS protocols. (Currently, only the 1.1.1 and 3.0 version streams of OpenSSL are supported). The OpenSSL team warned maintainers and users on October 25 that a critical flaw was on the way — only the second to ever impact the product. Upon release, however, neither vulnerability carried a critical severity rating.

CVE-2022-3786 and CVE-2022-3602 are buffer overflow vulnerabilities in OpenSSL versions below 3.0.7 that both rely on a maliciously crafted email address in a certificate. They differ in two crucial ways: CVE-2022-3786 can overflow an arbitrary number of bytes on the stack with the "." character (a period), leading to denial of service, while CVE-2022-3602 allows a crafted email address to overflow exactly four attacker-controlled bytes on the stack. OpenSSL has a blog available here.

According to the OpenSSL advisory, the vulnerability occurs after certificate verification and requires either a CA to have signed the malicious certificate or for the application to continue certificate verification despite failure to construct a path to a trusted issuer. In other words, exploitability is significantly limited:

  • In the case where a server is the target (a webserver, database server, mail server, etc): The server must first request client authentication as part of a mutual authentication configuration. This is an unusual configuration, and usually specialized to higher-security use cases.
  • In the case where a client is the target (web browser, email reader, database connector, etc): The attacker would need to first coerce a vulnerable client to connect to a malicious server. This could be done through impersonation (MitM on the network, hijacking an existing resource, etc) or by providing an incentive for a person to click a link (through phishing, watering holes, etc).

For both scenarios, these kinds of attacks do not lend themselves well to widespread exploitation.

Once again, these vulnerabilities only affect the OpenSSL 3.0.x version stream, which has not yet been widely adopted. We are not aware of any exploitation in the wild at the time of the vulnerability’s release on November 1, 2022.

Affected products

  • OpenSSL versions 3.0.0 to 3.0.6 (fixed in 3.0.7)

A broad array of popular distributions and technologies use OpenSSL in their offerings, including many widely used Linux distributions. OpenSSL 1.x, which is unaffected, is still the most popular version stream in use. Major distribution maintainers will likely have individual updates out quickly, but we expect a long tail of advisories and trailing fixes as vendors update additional implementations. Community tracking efforts like this one from Royce Williams, or government tracking efforts like this one from NCSC-NL may also be helpful for following individual vendor impact or remediation communications.

Mitigation guidance

Organizations that are running an affected version of OpenSSL should update to 3.0.7 when practical, prioritizing operating system-level updates and public-facing shared services with direct dependencies on OpenSSL. Emergency patching is not indicated.

Rapid7 customers

Our engineering team is in the process of developing both authenticated and unauthenticated vulnerability checks to allow InsightVM and Nexpose customers to assess their exposure to CVE-2022-3786 and CVE-2022-3602. We expect these checks to be available in a content release today (November 1, 2022).

In the meantime, InsightVM customers can use Query Builder with the query software.description CONTAINS OpenSSL 3 to find potentially affected assets. Nexpose and InsightVM customers can create a Dynamic Asset Group with a filtered asset search looking for Software name contains OpenSSL 3.

Additionally, Nexpose and InsightVM customers can use the following SQL query in a SQL Query Export (Security Console -> Reports -> SQL Query Export) to identify whether they have (any version of) OpenSSL in their environments. This query will produce a CSV file with a list of assets containing installed software with “openssl” in its title, and the corresponding version previously found in scans or Insight Agent-based assessments:

SELECT da.sites AS "Site_Name", da.ip_address AS "IP_Address", da.mac_address AS "MAC_Address", da.host_name AS "DNS_Hostname", ds.vendor AS "Vendor", ds.name AS "Software_Name", ds.family AS "Software_Family", ds.version AS "Software_Version", ds.software_class AS "Software_Class" FROM dim_asset_software das JOIN dim_software ds USING(software_id) JOIN dim_asset da ON da.asset_id = das.asset_id WHERE ds.software_class LIKE '%' AND ds.name ILIKE '%openssl%' ORDER BY ds.name ASC

The Software_Version column of the CSV can be used to narrow the scope down to OpenSSL 3.x – note that this query may also return packages that are not OpenSSL proper, e.g. libgnutls-openssl27, that have a version number starting with 3 but do not correspond to 3.0.x of OpenSSL per se.

Film Festival Cologne’2022 Bivol and Capital distinguished as contributors to German documentary on Ruja Ignatova

Post Syndicated from Николай Марченко original https://bivol.bg/bivol-and-capital-distinguished-as-contributors-to-german-documentary-on-ruja-ignatova.html

вторник 1 ноември 2022


Investigative reporting outlet Bivol and the weekly newspaper Capital were the only Bulgarian media invited to work on the production of a new documentary about cryptoqueen Ruja Ignatova. Die Kryptoqueen…

“Биволъ” и “Капитал” с участием в новом фильме о Руже Игнатовой

Post Syndicated from Николай Марченко original https://bivol.bg/%D0%B1%D0%B8%D0%B2%D0%BE%D0%BB%D1%8A-%D0%B8-%D0%BA%D0%B0%D0%BF%D0%B8%D1%82%D0%B0%D0%BB-%D1%81-%D1%83%D1%87%D0%B0%D1%81%D1%82%D0%B8%D0%B5%D0%BC-%D0%B2-%D0%BD%D0%BE%D0%B2%D0%BE%D0%BC-%D1%84.html

вторник 1 ноември 2022


Сайт журналистских расследований «Биволъ» и еженедельник «Капитал» — единственные болгарские СМИ, привлеченные в качестве официальных партнеров создателей документального фильма о криптокоролеве Руже Игнатовой. На прошлой неделе Die Kryptoqueen – The…

Security updates for Tuesday

Post Syndicated from original https://lwn.net/Articles/913352/

Security updates have been issued by Debian (python3.7), Gentoo (android-tools, expat, firefox, libjxl, libxml2, pjproject, sqlite, thunderbird, and zlib), Oracle (compat-expat1), Slackware (php8 and vim), SUSE (kernel, libtasn1, podman, and pyenv), and Ubuntu (libtasn1-6).

Международният кинофестивал в Кьолн’2022 „Биволъ“ и „Капитал“ с принос за новия филм за Ружа Игнатова

Post Syndicated from Николай Марченко original https://bivol.bg/%D0%B1%D0%B8%D0%B2%D0%BE%D0%BB%D1%8A-%D0%B8-%D0%BA%D0%B0%D0%BF%D0%B8%D1%82%D0%B0%D0%BB-%D1%81-%D0%BF%D1%80%D0%B8%D0%BD%D0%BE%D1%81-%D0%B7%D0%B0-%D0%BD%D0%BE%D0%B2.html

вторник 1 ноември 2022


Сайтът за разследваща журналистика „Биволъ“ и вестник „Капитал“ са единствените български медии, които са били привлечени като официални партньори на създателите на документалния филм за криптокралицата Ружа Игнатова. Миналата седмица…

How Wego secured developer connectivity to Amazon Relational Database Service instances

Post Syndicated from Adriaan de Jonge original https://aws.amazon.com/blogs/architecture/how-wego-secured-developer-connectivity-to-amazon-relational-database-service-instances/

How do you securely access Amazon Relational Database Service (Amazon RDS) instances from a developer’s laptop? Online travel marketplace, Wego, shares their journey from bastion hosts in the public subnet to lightweight VPN tunnels on top of Session Manager, a capability of AWS Systems Manager, using temporary access keys.

In this post, we explore how developers get access to allow-listed resources in their virtual private cloud (VPC) directly from their workstation, by tunnelling VPN over secure shell (SSH), which, in turn, is tunneled over Session Manager.

Note: This blog post is not intended as a step-by-step, how-to guide. Commands stated here are for illustrative purposes and may need customization.

Wego’s architecture before starting this journey

In 2021, Wego’s developer connectivity architecture was based on jump hosts in a public subnet, as illustrated in Figure 1.

Original Wego architecture

Figure 1. Original Wego architecture

Figure 1 demonstrates a network architecture with both public and private subnets. The public subnet contains an Amazon Elastic Compute Cloud (Amazon EC2) instance that serves as jump host. The diagram illustrates a VPN tunnel between the developer’s desktop and the VPC.

In Wego’s previous architecture, the jump host was connected to the internet for terminal access through the secure shell (SSH) protocol, which accepts traffic at Port 22. Despite restrictions to the allowed source IP addresses, exposing Port 22 to the internet can increase the likeliness of a security breach; it is possible to spoof (mimic) an allowed IP address and attempt a denial of service attack.

Moving the jump host to a private subnet with Session Manager

Session Manager helps minimize the likeliness of a security breach. Figure 2 demonstrates how Wego moved the jump host from a public subnet to a private subnet. In this architecture, Session Manager serves as the main entry point for incoming network traffic.

Wego's new architecture using Session Manager

Figure 2. Wego’s new architecture using Session Manager

We will explore how developers connect to Amazon RDS directly from their workstation in this architecture.

Tunnel TCP traffic through Session Manager

Session Manager is best known for its terminal access capability, but it can also tunnel TCP connections. This is helpful if you want to access EC2 instances from your local workstation (Figure 3).

Tunneling TCP traffic over Session Manager

Figure 3. Tunneling TCP traffic over Session Manager

Here’s an example command to forward traffic from local host Port 8888 to an EC2 instance:

$ aws ssm start-session --target <instance-id> \
  --document-name AWS-StartPortForwardingSession \
  --parameters '{"portNumber":["8888"], "localPortNumber":["8888"]}'

This assumes the target EC2 instance is configured with AWS Systems Manager connectivity.

Tunnel SSH traffic over Session Manager

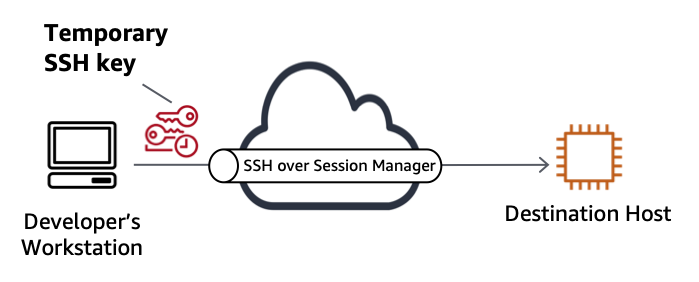
SSH is a protocol built on top of TCP; therefore, you can tunnel SSH traffic similarly (Figure 4).

Tunneling SSH traffic over Session Manager

Figure 4. Tunneling SSH traffic over Session Manager

To allow a short-hand notation for SSH over SSM, add the following configuration to the ~/.ssh/config configuration file:

host i-* mi-*
    ProxyCommand sh -c "aws ssm start-session --target %h \
        --document-name AWS-StartSSHSession \
        --parameters 'portNumber=%p'"

You can now connect to the EC2 instance over SSH with the following command:

ssh -i <key-file> <username>@<ec2-instance-id>

For example:

ssh -i my_key ec2-user@i-1234567890abcdef0

Ideally, your key-file is a short-lived credential, as recommended by the AWS Well-Architected Framework, as it narrows the window of opportunity for a security breach. However, it can be tedious to manage short-lived credentials. This is where EC2 Instance Connect comes to the rescue!

Replace SSH keys with EC2 Instance Connect

EC2 Instance Connect is available both on the AWS console and the command line. It makes it easier to work with short-lived keys. On the command line, it allows us to install our own temporary access credentials into a private EC2 instance for the duration of 60 seconds (Figure 5).

Connecting to SSH with temporary keys

Figure 5. Connecting to SSH with temporary keys

Ensure the EC2 instance connect plugin is installed on your workstation:

pip3 install ec2instanceconnectcli

This blog post assumes you are using Amazon Linux on the EC2 instance with all pre-requisites installed. Make sure your IAM role or user has the required permissions.

To generate a temporary SSH key pair, insert:

$ ssh-keygen -t rsa -f my_key
$ ssh-add my_key

To install the public key into the EC2 instance, insert:

$ aws ec2-instance-connect send-ssh-public-key \
  --instance-id <instance-id> \
  --instance-os-user <username> \
  --ssh-public-key <location ssh key public key> \
  --availability-zone <availabilityzone> \
  --region <region>

For example:

$ aws ec2-instance-connect send-ssh-public-key \
  --instance-id i-1234567890abcdef0 \
  --instance-os-user ec2-user \
  --ssh-public-key file://my_key.pub \
  --availability-zone ap-southeast-1b \
  --region ap-southeast-1

Connect to the EC2 instance within 60 seconds and delete the key after use.

Tunneling VPN over SSH, then over Session Manager

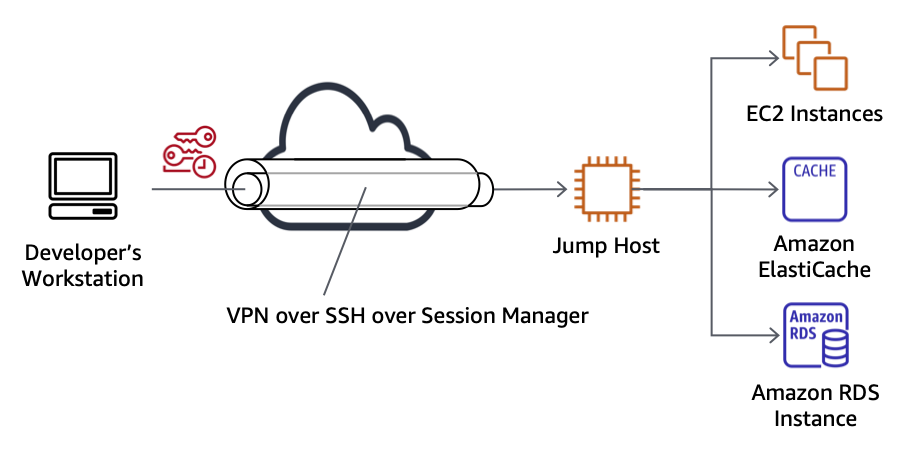
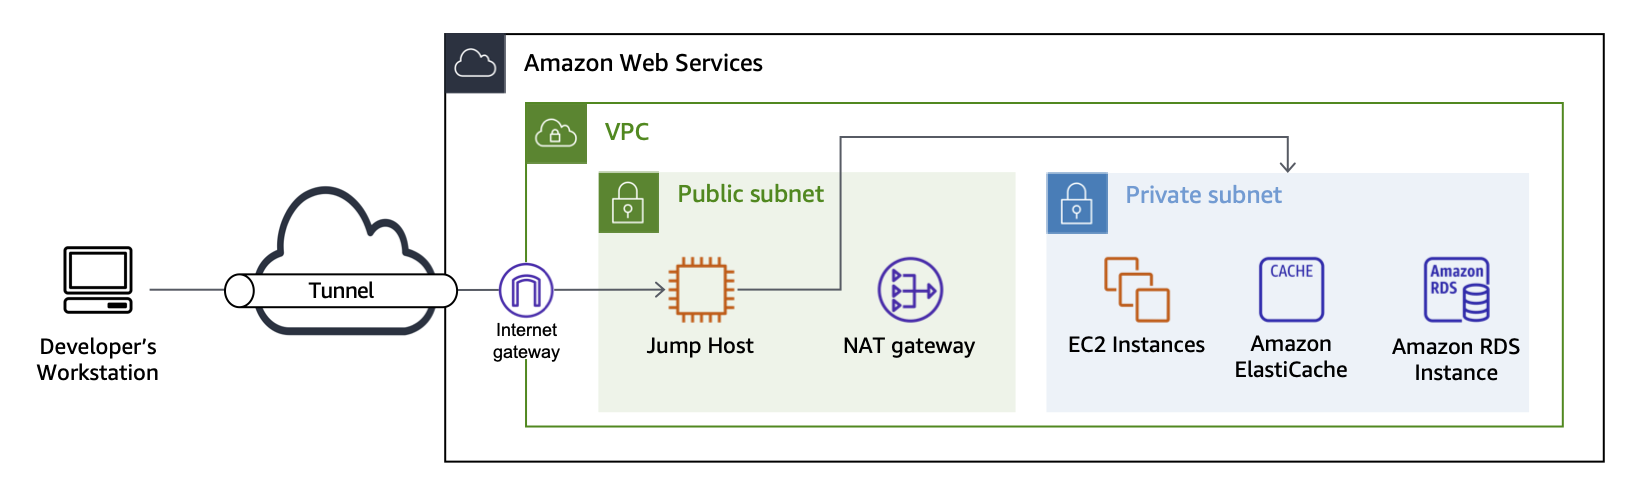
In this section, we adopt a third-party, open-source tool that is not supported by AWS, called sshuttle. sshuttle is a transparent proxy server that works as a VPN over SSH. It is based on Python and released under the LGPL 2.1 license. It runs across a wide range of Linux distributions and on macOS (Figure 6).
Tunneling VPN over SSH over Session Manager

Figure 6. Tunneling VPN over SSH over Session Manager

Why do we need to tunnel VPN over SSH, rather than using the earlier TCP over Session Manager? Keep in mind that the developer’s goal is to connect to Amazon RDS, not Amazon EC2. The SSM tunnel only works for connections to EC2 instances, not Amazon RDS.

A lightweight VPN solution, like sshuttle, bridges this gap by allowing you to forward traffic from Amazon EC2 to Amazon RDS. From the developer’s perspective, this works transparently, as if it is regular network traffic.

To install sshuttle, use one of the documented commands:

$ pip3 install sshuttle

To start sshuttle, use the following command pattern:

$ sshuttle -r <username>@<instance-id> <private CIDR range>

For example:

$ sshuttle -r ec2-user@i-1234567890abcdef0 10.0.0.0/16

Make sure the security group for the RDS DB instance allows network access from the jump host. You can now connect directly from the developer’s workstation to the RDS DB instance based on its IP address.

Advantages of this architecture

In this blog post, we layered a VPN over SSH that, in turn, is layered over Session Manager, plus we used temporary SSH keys.

Wego designed this architecture, and it was practical and stable for day-to-day use. They found that this solution runs at lower cost than AWS Client VPN and is sufficient for the use case of developers accessing online development environments.

Wego’s new architecture has a number of advantages, including:

  • More easily connecting to workloads in private and isolated subnets
  • Inbound security group rules are not required for the jump host, as Session Manager is an outbound connection
  • Access attempts are logged in AWS CloudTrail
  • Access control uses standard IAM policies, including tag-based resource access
  • Security groups and network access control lists still apply to “allow” or “deny” traffic to specific destinations
  • SSH keys are installed only temporarily for 60 seconds through EC2 Instance Connect

Conclusion

In this blog post, we explored Wego’s access patterns that can help you reduce your exposure to potential security attacks. Whether you adopt Wego’s full architecture or only adopt intermediary steps (like SSH over Session Manager and EC2 Instance Connect), reducing exposure to the public subnet and shortening the lifetime of access credentials can improve your security posture!

Further reading

Backblaze Drive Stats for Q3 2022

Post Syndicated from original https://www.backblaze.com/blog/backblaze-drive-stats-for-q3-2022/

As of the end of Q3 2022, Backblaze was monitoring 230,897 hard drives and SSDs in our data centers around the world. Of that number, 4,200 are boot drives, with 2,778 SSDs and 1,422 HDDs. The SSDs were previously covered in our recently published Midyear SSD Report. Today, we’ll focus on the 226,697 data drives under management as we review their quarterly and lifetime failure rates as of the end of Q3 2022.

We’ll also take a look at the relationship between hard drive failure rates and hard drive cost. Along the way, we’ll share our observations and insights on the data presented, and, as always, we look forward to you doing the same in the comments section at the end of the post.

Q3 2022 Hard Drive Failure Rates

Let’s start with reviewing our data for the Q3 2022 period. In that quarter, we tracked 226,697 hard drives used to store data. For our evaluation, we removed 388 drives from consideration as they were used for testing purposes or drive models which did not have at least 60 drives. This leaves us with 226,309 hard drives grouped into 29 different models to analyze.

Notes and Observations on the Q2 2022 Stats

Zero failures for Q3: Three drives had zero failures this quarter: the 8TB HGST (model: HUH728080ALE604), the 8TB Seagate (model: ST8000NM000A), and the 16TB WDC (model: WUH721816ALE6L0). For the 8TB HGST, that was the second quarter in a row with zero failures. Of the three, only the WDC model has enough lifetime data (drive days) to be comfortable with the calculated annualized failure rate (AFR). As we will see later in this review, this 14TB WDC model has a lifetime AFR of 0.11% with the confidence interval range of just 0.30 at a 95% confidence level.

The new disks in town: There are two new models in this quarter’s data: the 8TB Seagate (model: ST8000NM000A) and the 16TB Seagate (model: ST16000NM002J). Neither has enough data to be interesting yet, but as noted above, the 8TB Seagate had zero failures in its first quarter in operation. These additions give us 29 different models we are tracking, up from 27 in the previous quarter.

The 29 models break down by manufacturer as:

  • HGST: 7 models
  • Seagate: 13 models
  • Toshiba: 6 models
  • WDC: 3 models

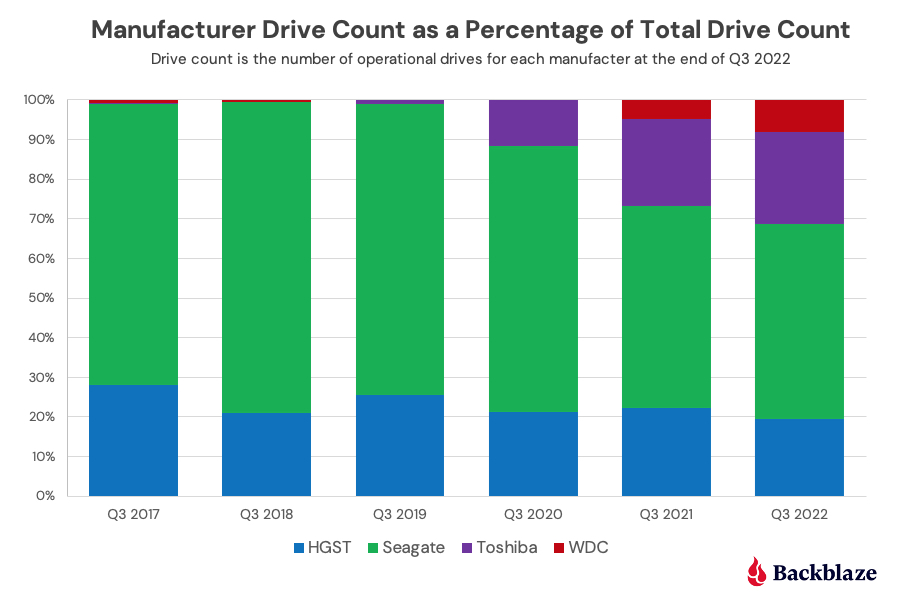
The chart below shows, by manufacturer, how our drive fleet has changed over the past six years.

The old guard is feeling old: All three of the oldest drives we currently use are showing signs of their age as each experienced an increase in AFR from Q2 to Q3 2022 as shown below.

MFG Model Size Q3 2022 Avg Age Q2 AFR Q3 AFR
Seagate ST4000DM000 4TB 83.1 3.42% 4.38%
Seagate ST6000DX000 6TB 89.6 0.91% 1.34%
TOSHIBA MD04ABA400V 4TB 88.3 0.00% 8.25%

Note that the 4TB Toshiba only had two failures in Q3 2022. The high AFR (8.25%) is due to the limited number of drive days in the quarter (8,849) from only 95 drives. For all three, it seems their spindles, actuators, and media are starting to wear out after seven years or so of constant spinning.

The Quarterly AFR continues to rise: The AFR for Q3 2022 was 1.64%, increasing from 1.46% in Q2 2022 and from 1.10% a year ago. As noted previously, this is related to the aging of the entire drive fleet and we would expect this number to go down as older drives are retired and replaced over the next year. A possible harbinger of what is to come can be seen in the 16TB models which as a group had an 0.80% AFR in Q3 2022. As these drives are used to replace the aging 4TB drives, the quarterly AFR should decrease.

Hard Drive Failure Versus Hard Drive Cost

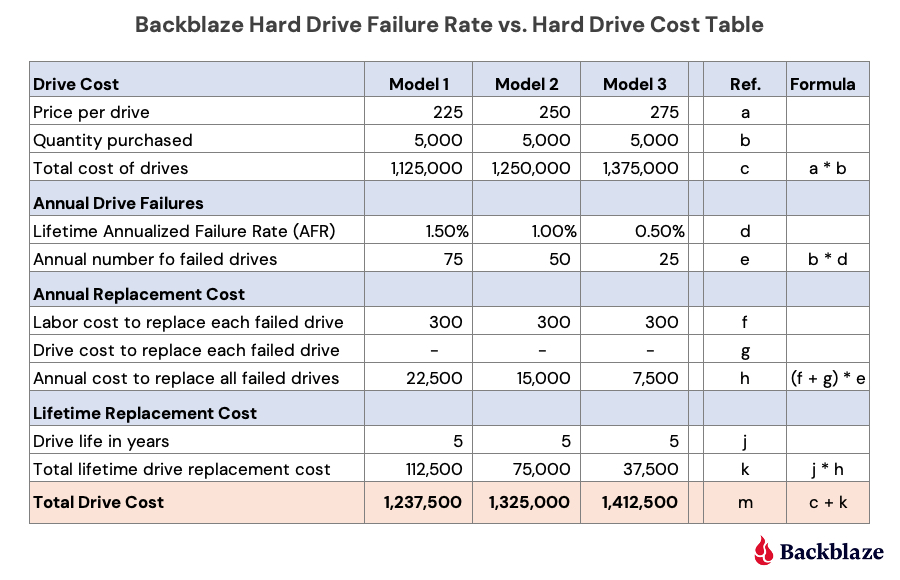
One question that comes up is why we would continue to buy a drive model that has a higher annualized failure rate versus a comparably sized, but more expensive, model. Two primary reasons: First, we are able to do so as our cloud storage Backblaze Vault architecture is designed for drive failure. Second, by studying data like drive stats and such, we work hard to understand our environment from the inside out. Understanding the relationship between cost and drive failure is one of those learnings. Here’s a simple example below using three fictitious models of 14TB drives, Model 1, Model 2, and Model 3.

Let’s take a look at the different sections (i.e. blue rows) of this table.

Drive Cost: Each model has a different price: low ($225), medium ($250), and high ($275). We would buy the same number of drives (5,000) of each model and we get the cost of each model.

Annual Drive Failures: This is the AFR of each drive model. For this example, we assigned the lowest price model to the highest failure rate, the highest price model to the lowest failure rate, and so on. In practice, we would use our own AFR numbers for a given model that we are considering purchasing. Regardless, we get the annual number of failed drives for each model.

Annual Replacement Cost: Labor cost covers the human cost involved from identifying the failure to returning and replacing the drive. Drive cost is zero here as the assumption is that all drives are returned for credit or replacement to the manufacturer or their agent. A zero value here may not always be the case; hence the line item. In either case, the annual cost to replace the failed drives for each model is computed.

Lifetime Replacement Cost: Take the number of years you expect the drive model to be in service times the annual cost to replace the failed drives. All of this gets us the total cost of each drive model—the peach section. In our example, the most expensive model (Model 3) is the most expensive drive over the five-year life expectancy and the lowest cost drive model (Model 1) is the least expensive over the same period, even with a higher annualized failure rate.

But we’re not done. The next question is: What would the annualized failure rate for the least expensive choice, Model 1, need to be such that the total cost after five years would be the same as Model 2 and then Model 3? In other words, how much failure can we tolerate before our original purchase decision is wrong? When we crunch the numbers we come out with the following:

  • Model 1 and Model 2 have the same total drive cost ($1,325,000) when the annualized failure rate for Model 1 is 2.67%.
  • Model 1 and Model 3 have the same total drive cost ($1,412,500) when the annualized failure rate for Model 1 is 3.83%.

The model presented is a simplified version of how we think about drive purchase decisions using annualized drive failure rates as part of the equation. You can make this model more accurate, and complicated, by adding in the drive failure rate changes over time (the bathtub curve) and prorating the cost of returning failed drives over the years. Whether that is needed is up to you.

The need for such a model is important in our business if you are interested in optimizing the efficiency of your cloud storage platform. Otherwise, just robotically buying the most expensive, or least expensive, drives is turning a blind eye to the expense side of the ledger.

On an individual or small office/home office level, your drive purchasing decision requires a lot less math, and often comes down to what drive can you afford. Even so, you should still try to do some research. Our drive stats can help, but in all cases you should have a solid backup plan in place as no drive you can buy is failure proof.

Lifetime Hard Drive Failure Rates

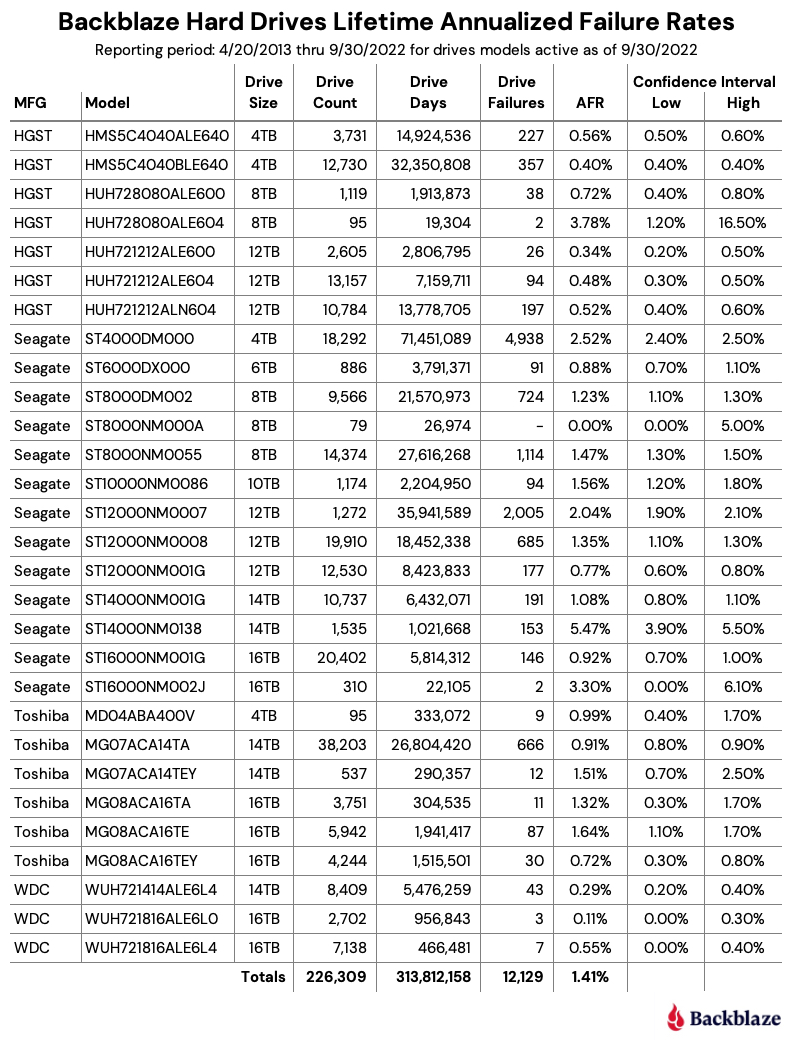
As of September 30, 2022, Backblaze was monitoring 226,697 hard drives used to store data. For our evaluation, we removed 388 drives from consideration as they were used for testing purposes or drive models which did not have at least 60 drives. This leaves us with 226,309 hard drives grouped into 29 different models to analyze for the lifetime report.

Notes and Observations About the Lifetime Stats

The lifetime annualized failure rate for all the drives listed above is 1.41%. That is a slight increase from the previous quarter of 1.39%, but lower than one year ago (Q3 2021) which was 1.45%.

The usual caution should be applied to those drive models that have wide confidence intervals, one percent or greater. Such a gap indicates there is not enough data or that the data we do have is not readily predictable.

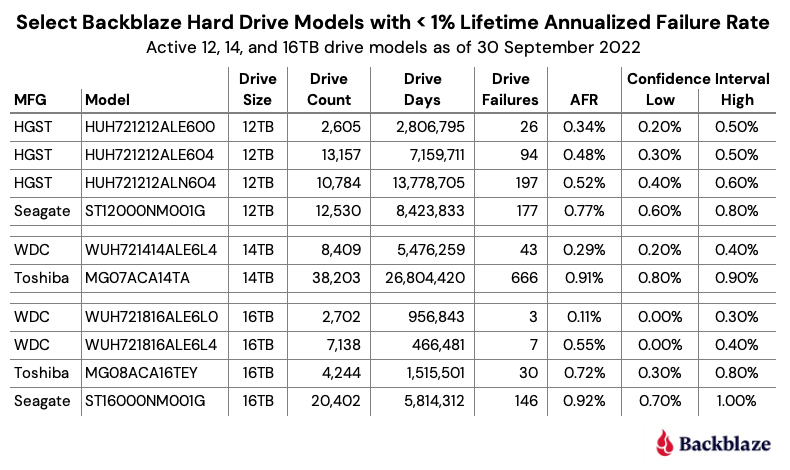
That said, we do have plenty of drive models for which we have solid data. Below we’ve extracted the 12TB, 14TB, and 16TB models from the lifetime table above that have a Lifetime AFR of less than 1% and have a confidence interval of 0.5% or less. These are hard drives which, up to this point, have shown solid reliability in our environment.

The Hard Drive Stats Data

The complete data set used to create the information in this review is available on our Hard Drive Test Data page. You can download and use this data for free for your own purpose. All we ask are three things: 1) you cite Backblaze as the source if you use the data, 2) you accept that you are solely responsible for how you use the data, and 3) you do not sell this data to anyone; it is free.

If you want the tables and charts used in this report, you can download the .zip file from Backblaze B2 Cloud Storage which contains the .jpg and/or .xlsx files as applicable.

Good luck, and let us know if you find anything interesting.

The post Backblaze Drive Stats for Q3 2022 appeared first on Backblaze Blog | Cloud Storage & Cloud Backup.

Iran’s Digital Surveillance Tools Leaked

Post Syndicated from Bruce Schneier original https://www.schneier.com/blog/archives/2022/11/irans-digital-surveillance-tools-leaked.html

It’s Iran’s turn to have its digital surveillance tools leaked:

According to these internal documents, SIAM is a computer system that works behind the scenes of Iranian cellular networks, providing its operators a broad menu of remote commands to alter, disrupt, and monitor how customers use their phones. The tools can slow their data connections to a crawl, break the encryption of phone calls, track the movements of individuals or large groups, and produce detailed metadata summaries of who spoke to whom, when, and where. Such a system could help the government invisibly quash the ongoing protests ­—or those of tomorrow ­—an expert who reviewed the SIAM documents told The Intercept.

[…]

SIAM gives the government’s Communications Regulatory Authority ­—Iran’s telecommunications regulator ­—turnkey access to the activities and capabilities of the country’s mobile users. “Based on CRA rules and regulations all telecom operators must provide CRA direct access to their system for query customers information and change their services via web service,” reads an English-language document obtained by The Intercept. (Neither the CRA nor Iran’s mission to the United Nations responded to a requests for comment.)

Lots of details, and links to the leaked documents, at the Intercept webpage.

Non-formal learning activities: What do we know and how do we apply it to computing?

Post Syndicated from Katharine Childs original https://www.raspberrypi.org/blog/gender-balance-in-computing-non-formal-learning/

At the Raspberry Pi Foundation, we engage young people in learning about computing and creating with digital technologies. We do this not only by developing curricula for formal education and introducing tens of thousands of children around the world to coding at home, but also through supporting non-formal learning activities such as Code Club and CoderDojo.

A teacher watches two female learners code in Code Club session in the classroom.
Code Clubs are after-school coding clubs.

To find out what works in non-formal computing learning, we’ve conducted two research projects recently: a systematic literature review, and a set of two interventions that were applied and evaluated as part of our Gender Balance in Computing programme. In this blog, we outline these two research projects.

What is non-formal learning?

When you think of young people learning computing, do you think of schools, classrooms, and curricula? You’d be right that lots of computing education for young people takes place in classrooms as part of national curricula. However, a lot of learning can take place outside of formal schooling. When we talk about non-formal computing education, we mean structured or semi-structured learning environments such as clubs or community groups, often set up by volunteers. These may take place in a school, library, or community venue; but we’ve also heard of some of our communities running non-formal learning activities on buses, in fire stations, or at football grounds  — there really is no limit to where learning can happen.

A CoderDojo coding session for young people.
CoderDojos are community-based coding clubs and some take place in offices.

It’s harder to assess the impact and effectiveness of non-formal computing activities than formal computing education: we have to think outside of the traditional measures such as grades and formal exams or assessments. Instead, we estimate outcomes according to measures such as level of participant engagement, attendance, attrition rates, and changes in participants’ attitudes towards computing. We have previously also piloted non-formal assessments such as quizzes and found that these were well-received by adult facilitators and children alike. 

Project 1: Researching the impact of non-formal computing education

Earlier this year, we conducted a systematic literature review into computing education for K–12 learners in non-formal settings. We identified 88 relevant research studies, which we read, compared, and synthesised to provide an overview of what is already known about the effectiveness of non-formal computing activities and to identify opportunities for further research. 

Our analysis looked for common themes within existing studies and suggested some benefits that non-formal learning offers, including: 

  • Access to advanced and innovative topics
  • Awareness about computing careers 
  • The chance to personalise projects according to learner interests
  • The opportunity for learners to progress at their own pace
  • The chance for learners to develop a sense of community through peers and role models

We presented this research at an international computing education conference called ICER 2022, and you can read about it in our open-access paper in the ICER conference proceedings.

A tweet about a presentation about non-formal learning at the ICER 2022 conference.

Project 2: Making links between non-formal learning and formal computing study skills 

One particularly interesting characteristic of non-formal learning is that it tends to attract a broader range of learners than formal computing lessons. For example, a 2019 survey found that about 40% of the young people who attend Code Clubs were female. This is a high percentage compared with the proportion of girls among the learners choosing Computer Science GCSE in England, which is currently around 20%. We believe this points to an opportunity to capitalise on girls’ interest in learning activities outside of the classroom, and we hope to use non-formal activities to encourage more girls to take an interest in formal computer science education.

Two learners from Code Club at Hillside School.
Code Clubs are well-attended by girls.

As part of our Gender Balance in Computing research programme in England, we worked with Apps for Good and the Behavioual Insights Team (BIT) to run two interventions in school-based non-formal settings, for which we adapted non-formal resources and used behavioural science concepts to strengthen the links the resources make between non-formal learning and studying computing more formally. One intervention ran in secondary schools for learners aged 13–14 years old, who used an adapted Apps for Good course, and the other ran in primary school for learners aged 8–11 year olds, who took part in Code Clubs using adapted versions of our projects.

A tweet from a school participating in a research project related to non-formal learning.

The interventions were evaluated independently by a separate team from BIT, based on data from surveys completed by learners before and after the interventions, and interviews with teachers and learners. This data was analysed by the independent team to explore the impact the interventions had on learners’ attitudes towards computing and intention to study the subject in the future. 

What did we learn from these research projects? 

Our literature review concluded that future research in this area would benefit from experimenting with a variety of approaches to designing, and measuring the impact of, computing activities in a non-formal setting. For example, this could include comparing the short-term and long-term impact of specific interventions, aiming to cater for different types of participants, and offering different types of learning experiences.

A girl codes at a laptop while a woman looks on during a Code Club session.

In these two Gender Balance in Computing interventions, there was limited statistical evidence of an improvement in participants’ attitude towards computing or in their stated intention to study computer programming in the future. The independent evaluators recommended that the learning content that was created for the interventions could be adapted further to make the link between non-formal and formal learning even more salient. On the other hand, as is often the case with research, some interesting themes — ones that we weren’t looking for — emerged from the data, including: 

  • In the secondary school intervention, there was a small, positive change in girls’ attitudes toward computing when they saw that it was relevant to real-world problems
  • In the primary school intervention, some teachers also reported an increased confidence to pursue computing among girls who had used the adapted Code Club resources, and they highlighted the importance of positive female role models in computing

In both projects, the findings suggest that it is beneficial for learners to participate in non-formal learning activities that link to real-world situations, and that this could be particularly beneficial for girls to help them see computing as a subject that is relevant to their own interests and goals. Another common theme in both projects is that non-formal learning activities play an important role in showing what a “computer person” looks like and who belongs in computing. This suggests there’s a need for a diverse range of volunteers to run non-formal computing activities, and that we should make sure that non-formal learning resources include representations of a diverse range of learners.

Computing classroom with woman teacher and young students at laptops doing Scratch coding.

Undertaking these research projects has provided evidence that the work the Foundation does is on the right track and suggested opportunities to use these themes in our future non-formal work and resources. 

Find out more about our work on non-formal computing education

More information about research projects at the Raspberry Pi Foundation and our newly launched Raspberry Pi Computing Education Research Centre can be found on our research pages and on the Research Centre’s website.

The post Non-formal learning activities: What do we know and how do we apply it to computing? appeared first on Raspberry Pi.

Systemd 252 released

Post Syndicated from original https://lwn.net/Articles/913287/

Systemd version 252 has been released. As usual, the list of changes is
long. It includes a new systemd-measure tool for the calculation of PCR
values and a bunch of infrastructure to use the result for disk encryption:

Net effect: if you boot a properly prepared kernel, TPM-bound disk
encryption now defaults to be locked to kernels which carry PCR
signatures from the same key pair. Example: if a hypothetical distro
FooOS prepares its UKIs like this, TPM-based disk encryption is now –
by default – bound to only FooOS kernels, and encrypted volumes bound
to the TPM cannot be unlocked on kernels from other sources.

There’s a lot more; see the announcement for all of the details.

[$] Still waiting for stackable security modules

Post Syndicated from original https://lwn.net/Articles/912775/

The Linux security module (LSM) mechanism was created as a result of the first Kernel Summit in 2001; it was
designed to allow the development of multiple approaches to Linux security.
That goal has been met; there are several security modules available with
current kernels. The LSM subsystem was not designed, though, to allow
multiple security modules to work together on the same system. Developers
have been working to rectify that problem almost since the LSM subsystem
was merged, but with limited success; some small security modules can be
stacked on top of the “major” ones, but arbitrary stacking is not possible.
Now, a full 20 years after
security-module support went into the 2.5 development kernel series, it
looks like a solution to the stacking problem may finally be getting
closer.

Security updates for Monday

Post Syndicated from original https://lwn.net/Articles/913261/

Security updates have been issued by Debian (batik, chromium, expat, libxml2, ncurses, openvswitch, pysha3, python-django, thunderbird, and tomcat9), Fedora (cacti, cacti-spine, curl, mbedtls, mingw-expat, and xen), Gentoo (apptainer, bind, chromium, exif, freerdp, gdal, gitea, hiredis, jackson-databind, jhead, libgcrypt, libksba, libtirpc, lighttpd, net-snmp, nicotine+, open-vm-tools, openexr, rpm, schroot, shadow, sofia-sip, tiff, and xorg-server), Mageia (libreoffice), Oracle (expat), Red Hat (device-mapper-multipath), and SUSE (cacti, cacti-spine, chromium, exim, jhead, kernel, libmad, opera, and pdns-recursor).

Microservice observability with Amazon OpenSearch Service part 1: Trace and log correlation

Post Syndicated from Subham Rakshit original https://aws.amazon.com/blogs/big-data/part-1-microservice-observability-with-amazon-opensearch-service-trace-and-log-correlation/

Modern enterprises are increasingly adopting microservice architectures and moving away from monolithic structures. Although microservices provide agility in development and scalability, and encourage use of polyglot systems, they also add complexity. Troubleshooting distributed services is hard because the application behavioral data is distributed across multiple machines. Therefore, in order to have deep insights to troubleshoot distributed applications, operational teams need to collect application behavioral data in one place to scan through them.

Although setting up monitoring systems focuses on analyzing only log data can help you understand what went wrong and notify about any anomalies, it fails to provide insight into why something went wrong and exactly where in the application code it went wrong. Fixing issues in a complex network of systems is like finding a needle in a haystack. Observability based on Open Standards defined by OpenTelemetry addresses the problem by providing support to handle logs, traces, and metrics within a single implementation.

In this series, we cover the setup and troubleshooting of a distributed microservice application using logs and traces. Logs are immutable, timestamped, discreet events happening over a period of time, whereas traces are a series of related events that capture the end-to-end request flow in a distributed system. We look into how to collect a large volume of logs and traces in Amazon OpenSearch Service and correlate these logs and traces to find the actual issue and where the issue was generated.

Any investigation of issues in enterprise applications needs to be logged in an incident report, so that operational and development teams can collaborate to roll out a fix. When any investigation is carried out, it’s important to write a narrative about the issue so that it can be used in discussion later. We look into how to use the latest notebook feature in OpenSearch Service to create the incident report.

In this post, we discuss the architecture and application troubleshooting steps.

Solution overview

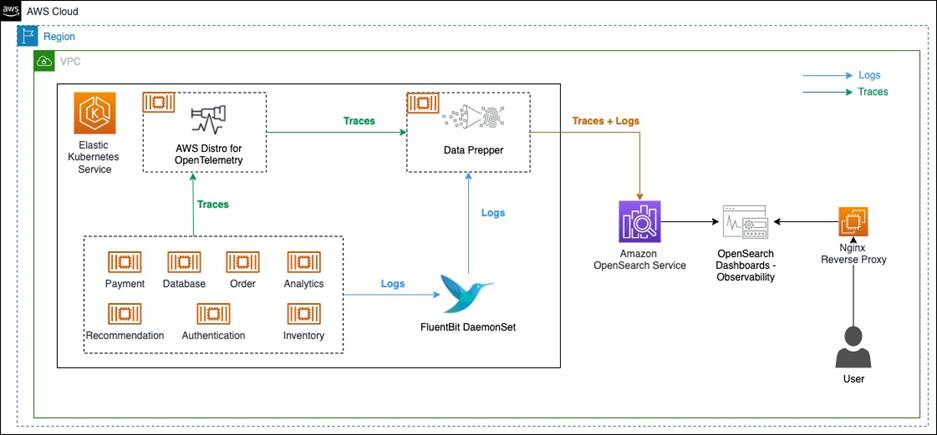
The following diagram illustrates the observability solution architecture to capture logs and traces.

The solution components are as follows:

  • Amazon OpenSearch Service is a managed AWS service that makes it easy to deploy, operate, and scale OpenSearch clusters in the AWS Cloud. OpenSearch Service supports OpenSearch and legacy Elasticsearch open-source software (up to 7.10, the final open-source version of the software).
  • FluentBit is an open-source processor and forwarder that collects, enriches, and sends metrics and logs to various destinations.
  • AWS Distro for OpenTelemetry is a secure, production-ready, AWS-supported distribution of the OpenTelemetry project. With AWS Distro for OpenTelemetry, you can instrument your applications just once to send correlated metrics and traces to multiple AWS and Partner monitoring solutions, including OpenSearch Service.
  • Data Prepper is an open-source utility service with the ability to filter, enrich, transform, normalize, and aggregate data to enable an end-to-end analysis lifecycle, from gathering raw logs to facilitating sophisticated and actionable interactive ad hoc analyses on the data.
  • We use a sample observability shop web application built as a microservice to demonstrate the capabilities of the solution components.
  • Amazon Elastic Kubernetes Service (Amazon EKS) is a managed service that you can use to run Kubernetes on AWS without needing to install, operate, and maintain your own Kubernetes control plane or nodes. Kubernetes is an open-source system for automating the deployment, scaling, and management of the container.

In this solution, we have a sample o11y (Observability) Shop web application written in Python and Java, and deployed in an EKS cluster. The web application is composed of various services. When some operations are done from the front end, the request travels through multiple services on the backend. The application services are running as separate containers, while AWS Distro for OpenTelemetry, FluentBit, and Data Prepper are running as sidecar containers.

FluentBit is used for collecting log data from application containers, and then sends logs to Data Prepper. For collecting traces, first the application services are instrumented using the OpenTelemetry SDK. Then, with AWS Distro for OpenTelemetry collector, trace information is collected and sent to Data Prepper. Data Prepper forwards the logs and traces data to OpenSearch Service.

We recommend deploying the OpenSearch Service domain within a VPC, so a reverse proxy is needed to be able to log in to OpenSearch Dashboards.

Prerequisite

You need an AWS account with necessary permissions to deploy the solution.

Set up the environment

We use AWS CloudFormation to provision the components of our architecture. Complete the following steps:

  1. Launch the CloudFormation stack in the us-east-1 Region:
  2. You may keep the stack name default to AOS-Observability.
  3. You may change the OpenSearchMasterUserName parameter used for OpenSearch Service login while keeping other parameter values to default. The stack provisions a VPC, subnets, security groups, route tables, an AWS Cloud9 instance, and an OpenSearch Service domain, along with a Nginx reverse proxy. It also configures AWS Identity and Access Management (IAM) roles. The stack will also generate a new random password for OpenSearch Service domain which can be seen in the CloudFormation Outputs tab under AOSDomainPassword.
  4. On the stack’s Outputs tab, choose the link for the AWS Cloud9 IDE.
  5. Run the following code to install the required packages, configure the environment variables and provision the EKS cluster:
    curl -sSL https://raw.githubusercontent.com/aws-samples/observability-with-amazon-opensearch-blog/main/scripts/eks-setup.sh | bash -s <<CloudFormation Stack Name>>

    After the resources are deployed, it prints the hostname for the o11y Shop web application.

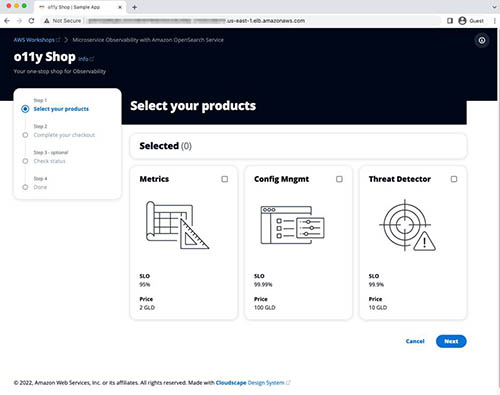
  6. Copy the hostname and enter it in the browser.

This opens the o11y Shop microservice application, as shown in the following screenshot.

Access the OpenSearch Dashboards

To access the OpenSearch Dashboards, complete the following steps:

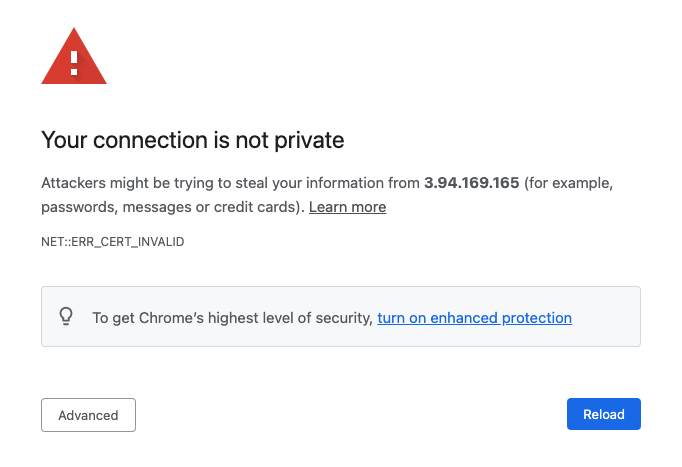
  1. Choose the link for AOSDashboardsPublicIP from the CloudFormation stack outputs. Because the OpenSearch Service domain is deployed inside the VPC, we use an Nginx reverse proxy to forward the traffic to the OpenSearch Service domain. Because the OpenSearch Dashboards URL is signed using a self-signed certificate, you need to bypass the security exception. In production, a valid certificate is recommended for secure access.
  2. Assuming you’re using Google Chrome, while you are on this page, enter thisisunsafe.Google Chrome redirects you to the OpenSearch Service login page.
  3. Log in with the OpenSearch Service login details (found in the CloudFormation stack output: AOSDomainUserName and AOSDomainPassword).You’re presented with a dialog requesting you to add data for exploration.
  4. Select Explore on my own.
  5. When asked to select a tenant, leave the default options and choose Confirm.
  6. Open the Hamburger menu to explore the plugins within OpenSearch Dashboards.

This is the OpenSearch Dashboards user interface. We use it in the next steps to analyze, explore, fix, and find the root cause of the issue.

Logs and traces generation

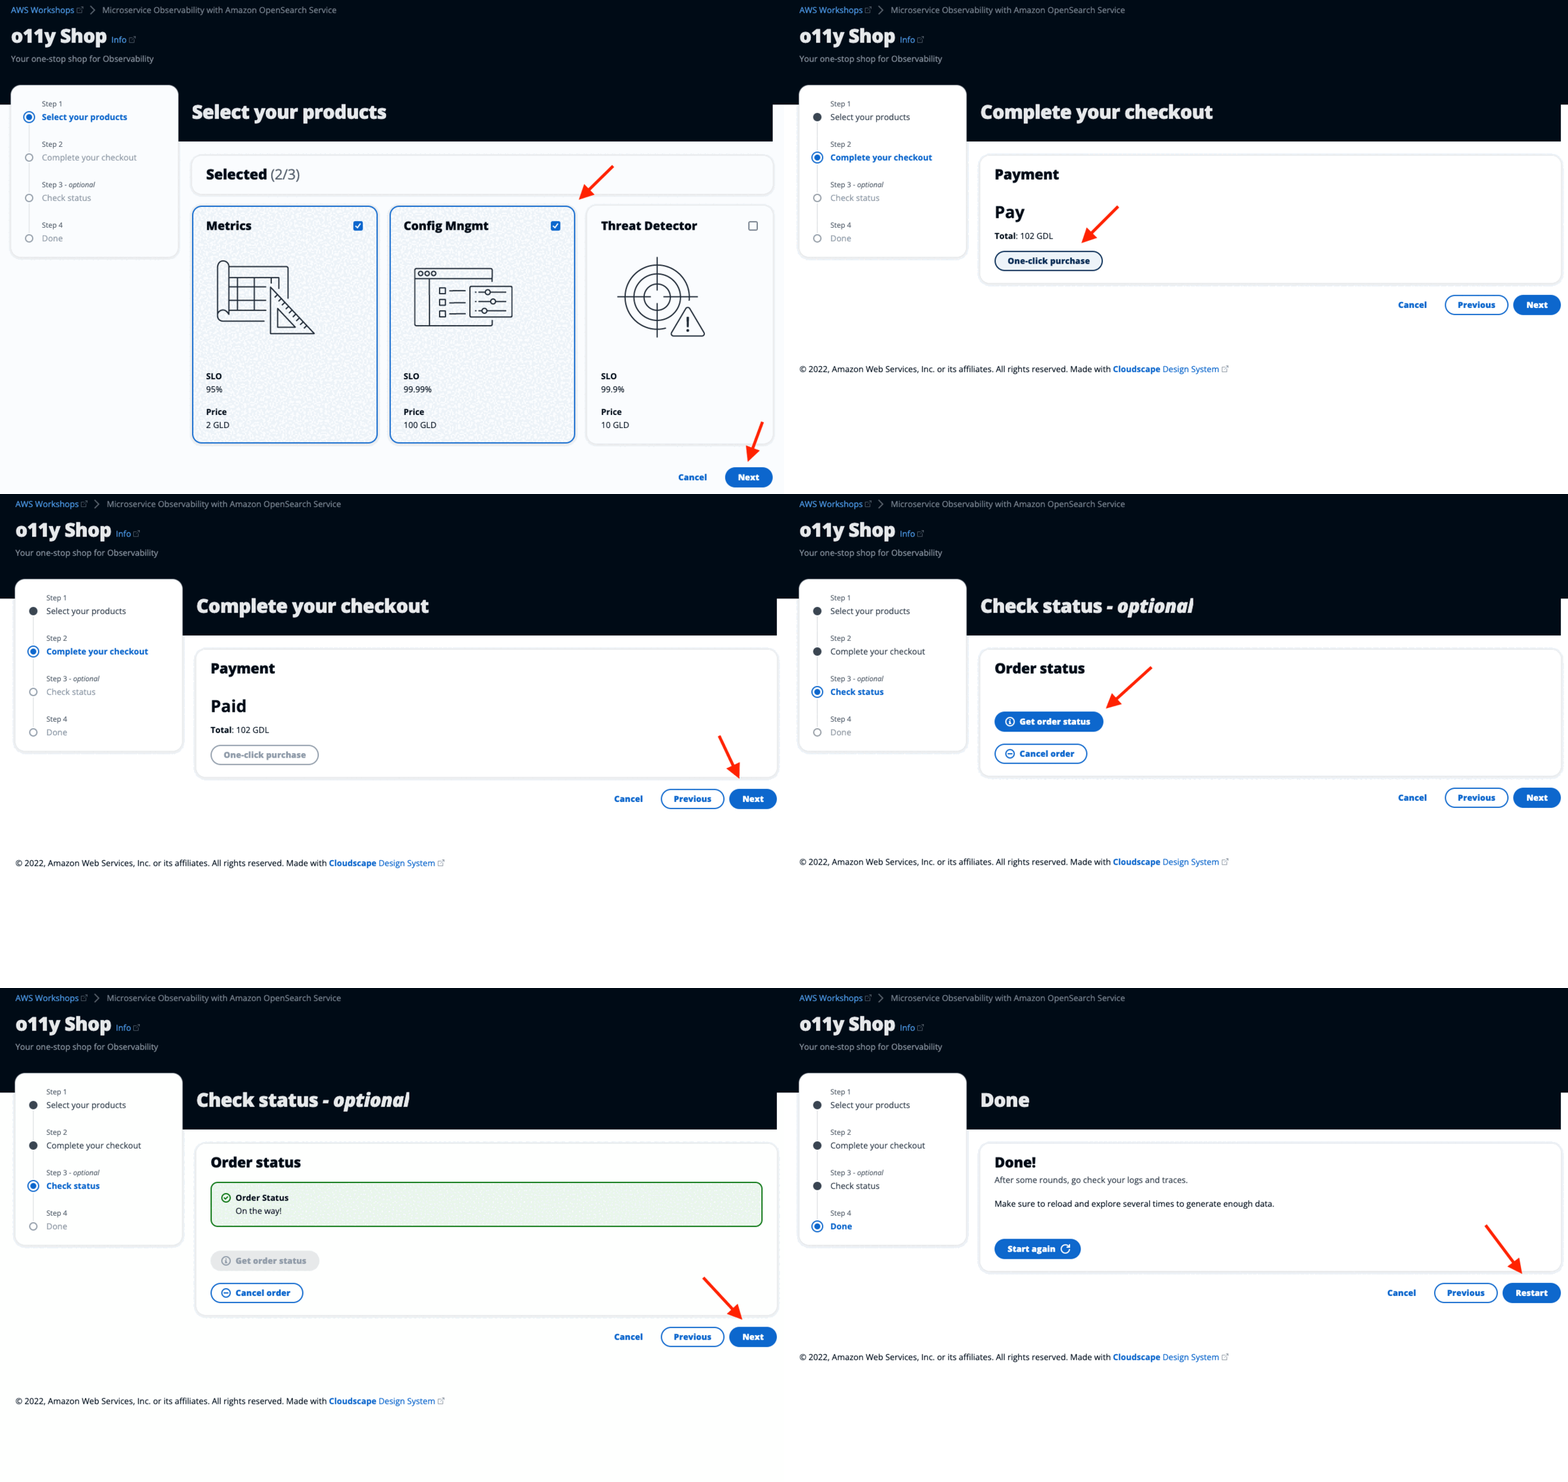
Click around the o11y Shop application to simulate user actions. This will generate logs and some traces for the associated microservices stored in OpenSearch Service. You can do the process multiple times to generate more sample logs and traces data.

Create an index pattern

An index pattern selects the data to use and allows you to define properties of the fields. An index pattern can point to one or more indexes, data streams, or index aliases.

You need to create an index pattern to query the data through OpenSearch Dashboards.

  1. On OpenSearch Dashboards, choose Stack Management.
  2. Choose Index Patterns
  3. Choose Create index pattern.
  4. For Index pattern name, enter sample_app_logs. OpenSearch Dashboards also supports wildcards.
  5. Choose Next step.
  6. For Time field, choose time.
  7. Choose Create index pattern.
  8. Repeat these steps to create the index pattern otel-v1-apm-span* with event.time as the time field for discovering traces.

Search logs

Choose the menu icon and look for the Discover section in OpenSearch Dashboards. The Discover panel allows you to view and query logs. Check the log activity happening in the microservice application.

If you can’t see any data, increase the time range to something large (like the last hour). Alternatively, you can play around the o11y Shop application to generate recent logs and traces data.

Instrument applications to generate traces

Applications need to be instrumented to generate and send trace data downstream. There are two types of instrumentation:

  • Automatic – In automatic instrumentation, no application code change is required. It uses an agent that can capture trace data from the running application. It requires usage of the language-specific API and SDK, which takes the configuration provided through the code or environment and provides good coverage of endpoints and operations. It automatically determines the span start and end.
  • Manual – In manual instrumentation, developers need to add trace capture code to the application. This provides customization in terms of capturing traces for a custom code block, naming various components in OpenTelemetry like traces and spans, adding attributes and events, and handling specific exceptions within the code.

In our application code, we use manual instrumentation. Refer to Manual Instrumentation to collect traces in the GitHub repository to understand the steps.

Explore trace analytics

OpenSearch Service version 1.3 has a new module to support observability.

  1. Choose the menu icon and look for the Observability section under OpenSearch Plugins.
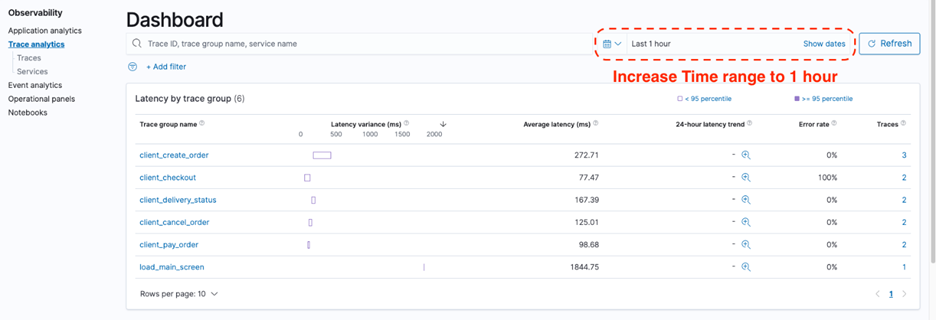
  2. Choose Trace analytics to examine some of the traces generated by the backend service. If you fail to see sufficient data, increase the time range. Alternatively, choose all the buttons on the sample app webpage for each application service to generate sufficient trace data to debug. You can choose each option multiple times. The following screenshot shows a summarized view of the traces captured.

    The dashboard view groups traces together by trace group name and provides information about average latency, error rate, and trends associated with a particular operation. Latency variance indicates if the latency of a request falls below the 95 percentile or above. If there are multiple trace groups, you can reduce the view by adding filters on various parameters.
  3. Add a filter on the trace group client_checkout.

    The following screenshot shows our filtered results.

    The dashboard also features a map of all the connected services. The Service map helps provide a high-level view on what’s going on in the services based on the color-coding grouped by Latency, Error rate, and Throughput. This helps you identify problems by service.
  4. Choose Error rate to explore the error rate of the connected services.Based on the color-coding in the following diagram, it’s evident that the payment service is throwing errors, whereas other services are working fine without any errors.
  5. Switch to the Latency view, which shows the relative latency in milliseconds with different colors.
    This is useful for troubleshooting bottlenecks in microservices.

    The Trace analytics dashboard also shows distribution of traces over time and trace error rate over time.
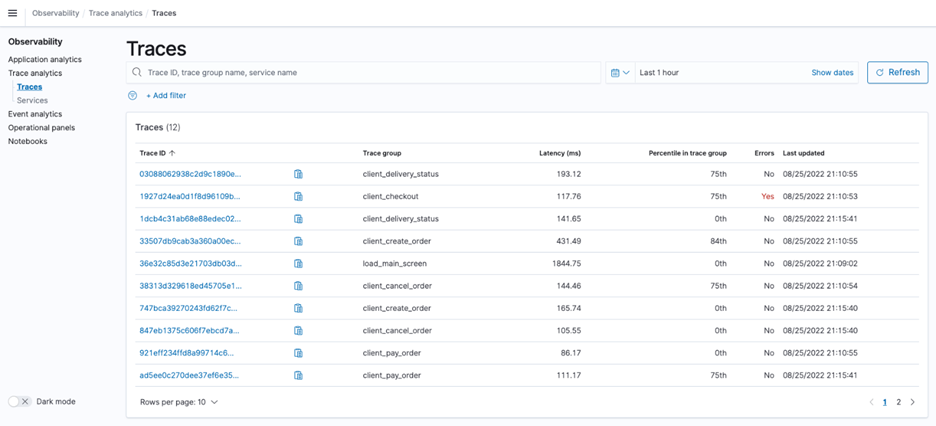
  6. To discover the list of traces, under Trace analytics in the navigation pane, choose Traces.
  7. To find the list of services, count of traces per service, and other service-level statistics, choose Services in the navigation pane.

Search traces

Now we want to drill down and learn more about how to troubleshoot errors.

  1. Go back to the Trace analytics dashboard.
  2. Choose Error Rate Service Map and choose the payment service on the graph.The payment service is in dark red. This also sets the payment service filter on the dashboard, and you can see the trace group in the upper pane.
  3. Choose the Traces link of the client_checkout trace group.

    You’re redirected to the Traces page. The list of traces for the client_checkout trace group can be found here.
  4. To view details of the traces, choose Trace IDs.You can see a pie chart showing how much time the trace has spent in each service. The trace is composed of multiple spans, which is defined as a timed operation that represents a piece of workflow in the distributed system. On the right, you can also see time spent in each span, and which have an error.
  5. Copy the trace ID in the client-checkout group.

Log and trace correlation

Although the log and trace data provides valuable information individually, the actual advantage is when we can relate trace data to log data to capture more details about what went wrong. There are three ways we can correlate traces to logs:

  • Runtime – Logs, traces, and metrics can record the moment of time or the range of time the run took place.
  • Run context – This is also known as the request context. It’s standard practice to record the run context (trace and span IDs as well as user-defined context) in the spans. OpenTelemetry extends this practice to logs where possible by including the TraceID and SpanID in the log records. This allows us to directly correlate logs and traces that correspond to the same run context. It also allows us to correlate logs from different components of a distributed system that participated in the particular request.
  • Origin of the telemetry – This is also known as the resource context. OpenTelemetry traces and metrics contain information about the resource they come from. We extend this practice to logs by including the resource in the log records.

These three correlation methods can be the foundation of powerful navigational, filtering, querying, and analytical capabilities. OpenTelemetry aims to record and collect logs in a manner that enables such correlations.

  1. Use the copied traceId from the previous section and search for corresponding logs on the Event analytics page.
    We use the following PPL query:

    source = sample_app_logs | where traceId = “<<trace_id>>”

    Make sure to increase the time range to at least the last hour.

  2. Choose Update to find the corresponding log data for the trace ID.
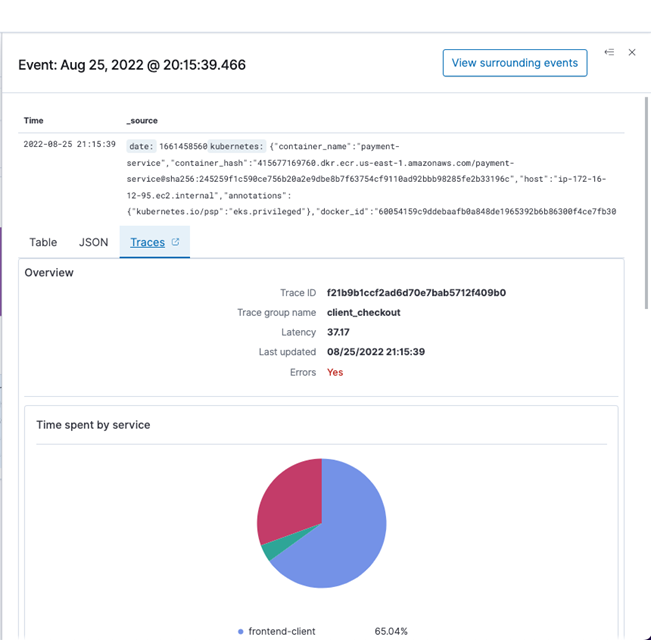
  3. Choose the expand icon to find more details.This shows you the details of the log including the traceId. This log shows that the payment checkout operation failed. This correlation allowed us to find key information in the log that allows us to go to the application and debug the code.
  4. Choose the Traces tab to see the corresponding trace data linked with the log data.
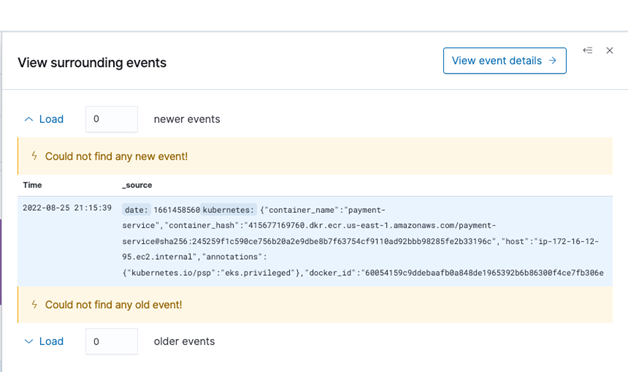
  5. Choose View surrounding events to discover other events happening at the same time.

This information can be valuable when you want to understand what’s going on in the whole application, particularly how other services are impacted during that time.

Cleanup

This section provides the necessary information for deleting various resources created as part of this post.

It is recommended to perform the below steps after going through the next post of the series.

  1. Execute the following command on the Cloud9 terminal to remove Elastic Kubernetes Service Cluster and its resources.
    eksctl delete cluster --name=observability-cluster

  2. Execute the script to delete the Amazon Elastic Container Registry repositories.
    cd observability-with-amazon-opensearch-blog/scripts
    bash 03-delete-ecr-repo.sh

  3. Delete the CloudFormation stacks in sequence - eksDeploy, AOS-Observability.

Summary

In this post, we deployed an Observability (o11y) Shop microservice application with various services and captured logs and traces from the application. We used FluentBit to capture logs, AWS Distro for Open Telemetry to capture traces, and Data Prepper to collect these logs and traces and send it to OpenSearch Service. We showed how to use the Trace analytics page to look into the captured traces, details about those traces, and service maps to find potential issues. To correlate log and trace data, we demonstrated how to use the Event analytics page to write a simple PPL query to find corresponding log data. The implementation code can be found in the GitHub repository for reference.

The next post in our series covers the use of PPL to create an operational panel to monitor our microservices along with an incident report using notebooks.


About the Author

Subham Rakshit is a Streaming Specialist Solutions Architect for Analytics at AWS based in the UK. He works with customers to design and build search and streaming data platforms that help them achieve their business objective. Outside of work, he enjoys spending time solving jigsaw puzzles with his daughter.

Marvin Gersho is a Senior Solutions Architect at AWS based in New York City. He works with a wide range of startup customers. He previously worked for many years in engineering leadership and hands-on application development, and now focuses on helping customers architect secure and scalable workloads on AWS with a minimum of operational overhead. In his free time, Marvin enjoys cycling and strategy board games.

Rafael Gumiero is a Senior Analytics Specialist Solutions Architect at AWS. An open-source and distributed systems enthusiast, he provides guidance to customers who develop their solutions with AWS Analytics services, helping them optimize the value of their solutions.

AWS Week in Review – October 31, 2022

Post Syndicated from Antje Barth original https://aws.amazon.com/blogs/aws/aws-week-in-review-october-31-2022/

No tricks, just treats in this weekly roundup of news and announcements. Let’s switch our AWS Management Console into dark mode and dive right into it.

Last Week’s Launches
Here are some launches that got my attention during the previous week:

AWS Local Zones in Hamburg and Warsaw now generally available – AWS Local Zones help you run latency-sensitive applications closer to end users. The AWS Local Zones in Hamburg, Germany, and Warsaw, Poland, are the first Local Zones in Europe. AWS Local Zones are now generally available in 20 metro areas globally, with announced plans to launch 33 additional Local Zones in metro areas around the world. See the full list of available and announced AWS Local Zones, and learn how to get started.

Amazon SageMaker multi-model endpoint (MME) now supports GPU instances – MME is a managed capability of SageMaker Inference that lets you deploy thousands of models on a single endpoint. MMEs can now run multiple models on a GPU core, share GPU instances behind an endpoint across multiple models, and dynamically load and unload models based on the incoming traffic. This can help you reduce costs and achieve better price performance. Learn how to run multiple deep learning models on GPU with Amazon SageMaker multi-model endpoints.

Amazon EC2 now lets you replace the root Amazon EBS volume for a running instance – You can now use the Replace Root Volume for patching features in Amazon EC2 to replace your instance root volume using an updated AMI without needing to stop the instance. This makes patching of the guest operating system and applications easier, while retraining the instance store data, networking, and IAM configuration. Check out the documentation to learn more.

AWS Fault Injection Simulator now supports network connectivity disruption – AWS Fault Injection Simulator (FIS) is a managed service for running controlled fault injection experiments on AWS. AWS FIS now has a new action type to disrupt network connectivity and validate that your applications are resilient to a total or partial loss of connectivity. To learn more, visit Network Actions in the AWS FIS user guide.

Amazon SageMaker Automatic Model Tuning now supports Grid Search – SageMaker Automatic Model Tuning helps you find the hyperparameter values that result in the best-performing model for a chosen metric. Until now, you could choose between random, Bayesian, and hyperband search strategies. Grid search now lets you cover every combination of the specified hyperparameter values for use cases in which you need reproducible tuning results. Learn how Amazon SageMaker Automatic Model Tuning now supports grid search.

For a full list of AWS announcements, be sure to keep an eye on the What’s New at AWS page.

Other AWS News
Here are some additional news items that you may find interesting:

Celebrating over 20 years of AI/ML innovation – On October 25, we hosted the AWS AI/ML Innovation Day. Bratin Saha and other leaders in the field shared the great strides we have made in the past and discussed what’s next in the world of ML. You can watch the recording here.

AWS open-source news and updates – My colleague Ricardo Sueiras writes this weekly open-source newsletter in which he highlights new open-source projects, tools, and demos from the AWS Community. Read edition #133 here.

Upcoming AWS Events
Check your calendars and sign up for these AWS events:

AWS re:Invent is only 4 weeks away! Join us live in Las Vegas from November 28–December 2 for keynote announcements, training and certification opportunities, access to 1,500+ technical sessions, and much more. Seats are still available to reserve, and walk-ups are available onsite. You can also join us online to watch live keynotes and leadership sessions.

If you are into machine learning like me, check out the ML attendee guide. AWS Machine Learning Hero Vinicius Caridá put together recommended sessions and tips and tricks for building your agenda. We also have attendee guides on additional topics and industries.

On November 2, there is a virtual event for building modern .NET applications on AWS. You can register for free.

On November 11–12, AWS User Groups in India are hosting the AWS Community Day India 2022, with success stories, use cases, and much more from industry leaders. Sign up for free to join this virtual event.

That’s all for this week. Check back next Monday for another Week in Review!

— Antje

This post is part of our Week in Review series. Check back each week for a quick roundup of interesting news and announcements from AWS!

7 Rapid Questions with Toshio Honda, Sr. Security Solutions Engineer

Post Syndicated from Rapid7 original https://blog.rapid7.com/2022/10/31/7-rapid-questions-with-toshio-honda-sr-security-solutions-engineer/

You have been with Rapid7 for 4 years now, what originally attracted you to work here?

7 Rapid Questions with Toshio Honda, Sr. Security Solutions Engineer

I worked for a cybersecurity company who is a leader for the “Prevention” area prior to joining Rapid7, and I was looking for the next opportunity based on 3 criteria:, “Interesting Products”, “a flexible work environment” and “a supportive and talented team of people”. Rapid7 checked the box for all three of these areas, with a platform of products to help customer’s security operations across areas/categories beyond my experience/expertise, allowing me to stretch and grow my skills. The company is well known for having unique intelligence like Metasploit, as well as being placed #17 in the list of The Cybersecurity 500 by Cybersecurity Ventures. These things attracted me to work here.

What does the team in Japan look like, and what growth have you seen during your time here?

When I joined Rapid7 in January 2018, there were approximately 10+ employees in Japan. These people were primarily made up of Sales and Sales Engineering for products like Nexpose/InsightVM, AppSpider/InsightAppSec, and Metasploit Pro. As the team continues to change and grow, we are now at 20+ employees and hiring in Customer Success and Support so really broadening the skill sets in the region to better support our customers. As we continue to evolve and move towards a solution/platform provider to solve complex customer challenges, and support their security operations with broader products and managed services. Each individual has capabilities and talent as part of the team, which is a huge difference in terms of ‘types’.

What makes the culture at Rapid7 different from other tech and/or cybersecurity companies?

I believe transparency is a major differentiator. The leadership team in Rapid7 listens to each individual, and you have an opportunity to share your ideas and give feedback whether you are brand new or have been in your field for years.

What are the 3 biggest things you have learned during your time at Rapid7?

Here’re the 3 things that came up to my mind:
1. Be Proactive
2. Change is a Constant
3. Ask questions to turn the unknown into known

Being proactive means looking outside your immediate team to identify the right people, and gather the right information. Our team in Japan is relatively small, so it’s essential that we partner with other team members from different departments and locations in order to ensure we are anticipating potential challenges and getting the right people involved upfront.

For #2, almost everything can/will change, from our product roadmaps to the needs of our customer. As we anticipate change and embrace the opportunity to grow, it’s important to maintain customer’s expectations and see how Rapid7 can continue to be a strategic partner in maintaining their security solutions.

For #3, as a Solution Architect, I often have conversations with customers, and sometimes see they don’t even know what they need to improve their security posture. It’s important to unravel what they would need by asking questions to clarify their requirements. The same principle can be applied in case of security incidents. If you don’t have visibility (detections) for an incident, you wouldn’t be able to stop a breach. As a practitioner in Rapid7, I keep those

How would you describe your role at Rapid7?

My main role is Solution Architect (Security Solutions Engineer / Sales Engineer), but I’ve also been given the opportunity to learn new skills that are outside of my typical job description. In addition to my main role, I’ve been able to learn more about customer advisory, technical support and account management, and our professional services. Learning in these different areas has grown my confidence as a technical contributor, and provided me with some new insights into real world customer environments and security operations.

Describe your proudest moment working for Rapid7.

This is a really good question. I can’t pick one as there are so many moments in my memory. However, I am always proudest when I am able to solve especially complex or challenging problems customers are struggling with.

What advice would you give someone thinking about coming to work here?

If you enjoy challenging the status quo and solving interesting challenges, Rapid7 would be a great place to work. The company has a track record and history of supporting employees who have new ideas, so you’ll be supported to think creatively and craft your own vision as to how to support our customers and align to business goals.

If you’re interested in learning about open roles at Rapid7, visit our careers page.

The collective thoughts of the interwebz