Build the next generation, cross-account, event-driven data pipeline orchestration product

Post Syndicated from Maria Guerra original https://aws.amazon.com/blogs/big-data/build-the-next-generation-cross-account-event-driven-data-pipeline-orchestration-product/

This is a guest post by Mehdi Bendriss, Mohamad Shaker, and Arvid Reiche from Scout24.

At Scout24 SE, we love data pipelines, with over 700 pipelines running daily in production, spread across over 100 AWS accounts. As we democratize data and our data platform tooling, each team can create, maintain, and run their own data pipelines in their own AWS account. This freedom and flexibility is required to build scalable organizations. However, it’s full of pitfalls. With no rules in place, chaos is inevitable.

We took a long road to get here. We’ve been developing our own custom data platform since 2015, developing most tools ourselves. Since 2016, we have our self-developed legacy data pipeline orchestration tool.

The motivation to invest a year of work into a new solution was driven by two factors:

  • Lack of transparency on data lineage, especially dependency and availability of data
  • Little room to implement governance

As a technical platform, our target user base for our tooling includes data engineers, data analysts, data scientists, and software engineers. We share the vision that anyone with relevant business context and minimal technical skills can create, deploy, and maintain a data pipeline.

In this context, in 2015 we created the predecessor of our new tool, which allows users to describe their pipeline in a YAML file as a list of steps. It worked well for a while, but we faced many problems along the way, notably:

  • Our product didn’t support pipelines to be triggered by the status of other pipelines, but based on the presence of _SUCCESS files in Amazon Simple Storage Service (Amazon S3). Here we relied on periodic pulls. In complex organizations, data jobs often have strong dependencies to other work streams.
  • Given the previous point, most pipelines could only be scheduled based on a rough estimate of when their parent pipelines might finish. This led to cascaded failures when the parents failed or didn’t finish on time.
  • When a pipeline fails and gets fixed, then manually redeployed, all its dependent pipelines must be rerun manually. This means that the data producer bears the responsibility of notifying every single team downstream.

Having data and tooling democratized without the ability to provide insights into which jobs, data, and dependencies exist diminishes synergies within the company, leading to silos and problems in resource allocation. It became clear that we needed a successor for this product that would give more flexibility to the end-user, less computing costs, and no infrastructure management overhead.

In this post, we describe, through a hypothetical case study, the constraints under which the new solution should perform, the end-user experience, and the detailed architecture of the solution.

Case study

Our case study looks at the following teams:

  • The core-data-availability team has a data pipeline named listings that runs every day at 3:00 AM on the AWS account Account A, and produces on Amazon S3 an aggregate of the listings events published on the platform on the previous day.
  • The search team has a data pipeline named searches that runs every day at 5:00 AM on the AWS account Account B, and exports to Amazon S3 the list of search events that happened on the previous day.
  • The rent-journey team wants to measure a metric referred to as X; they create a pipeline named pipeline-X that runs daily on the AWS account Account C, and relies on the data of both previous pipelines. pipeline-X should only run daily, and only after both the listings and searches pipelines succeed.

User experience

We provide users with a CLI tool that we call DataMario (relating to its predecessor DataWario), and which allows users to do the following:

  • Set up their AWS account with the necessary infrastructure needed to run our solution
  • Bootstrap and manage their data pipeline projects (creating, deploying, deleting, and so on)

When creating a new project with the CLI, we generate (and require) every project to have a pipeline.yaml file. This file describes the pipeline steps and the way they should be triggered, alerting, type of instances and clusters in which the pipeline will be running, and more.

In addition to the pipeline.yaml file, we allow advanced users with very niche and custom needs to create their pipeline definition entirely using a TypeScript API we provide them, which allows them to use the whole collection of constructs in the AWS Cloud Development Kit (AWS CDK) library.

For the sake of simplicity, we focus on the triggering of pipelines and the alerting in this post, along with the definition of pipelines through pipeline.yaml.

The listings and searches pipelines are triggered as per a scheduling rule, which the team defines in the pipeline.yaml file as follows:

trigger: 
    schedule: 
        hour: 3

pipeline-x is triggered depending on the success of both the listings and searches pipelines. The team defines this dependency relationship in the project’s pipeline.yaml file as follows:

trigger: 
    executions: 
        allOf: 
            - name: listings 
              account: Account_A_ID 
              status: 
                  - SUCCESS 
            - name: searches 
              account: Account_B_ID 
              status: 
                  - SUCCESS

The executions block can define a complex set of relationships by combining the allOf and anyOf blocks, along with a logical operator operator: OR / AND, which allows mixing the allOf and anyOf blocks. We focus on the most basic use case in this post.

Accounts setup

To support alerting, logging, and dependencies management, our solution has components that must be pre-deployed in two types of accounts:

  • A central AWS account – This is managed by the Data Platform team and contains the following:
    • A central data pipeline Amazon EventBridge bus receiving all the run status changes of AWS Step Functions workflows running in user accounts
    • An AWS Lambda function logging the Step Functions workflow run changes in an Amazon DynamoDB table to verify if any downstream pipelines should be triggered based on the current event and previous run status changes log
    • A Slack alerting service to send alerts to the Slack channels specified by users
    • A trigger management service that broadcasts triggering events to the downstream buses in the user accounts
  • All AWS user accounts using the service – These accounts contain the following:
    • A data pipeline EventBridge bus that receives Step Functions workflow run status changes forwarded from the central EventBridge bus
    • An S3 bucket to store data pipelines artifacts, along their logs
    • Resources needed to run Amazon EMR clusters, like security groups, AWS Identity and Access Management (IAM) roles, and more

With the provided CLI, users can set up their account by running the following code:

$ dpc setup-user-account

Solution overview

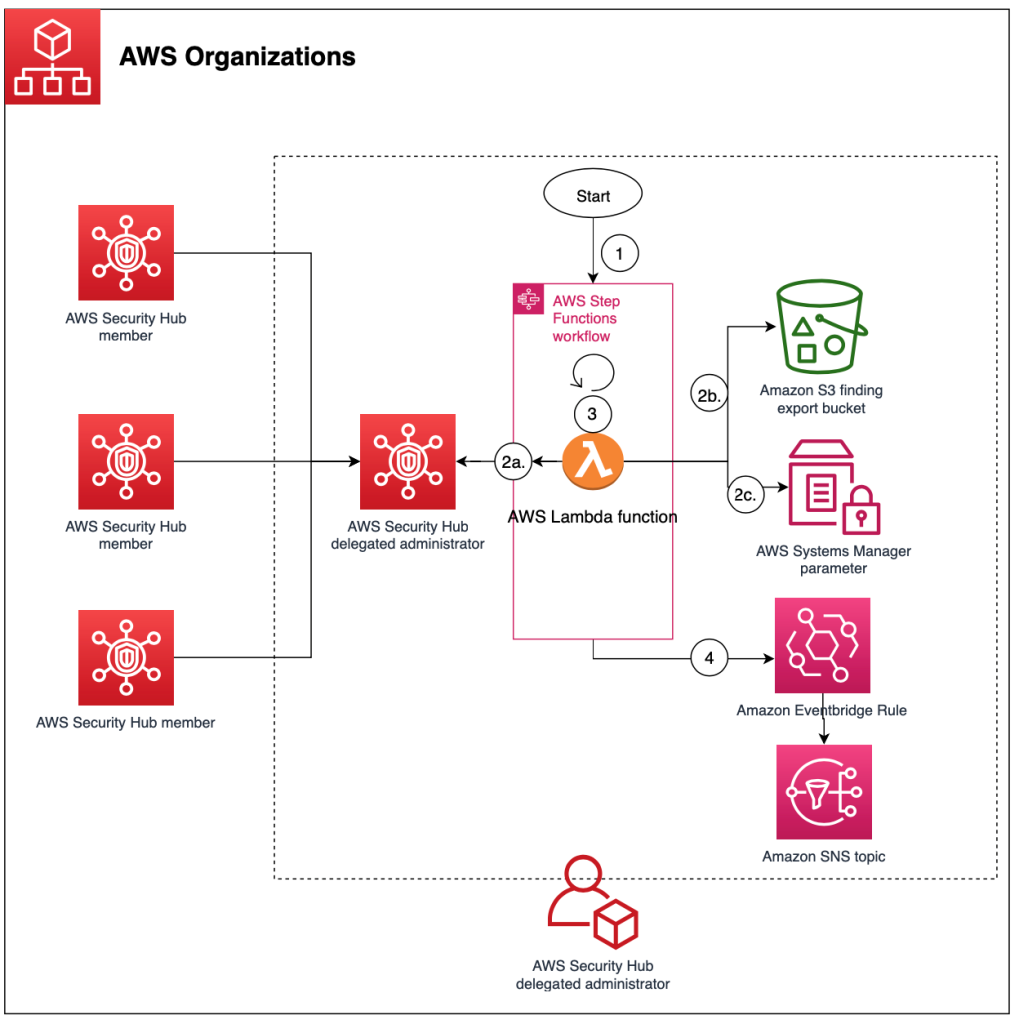
The following diagram illustrates the architecture of the cross-account, event-driven pipeline orchestration product.

In this post, we refer to the different colored and numbered squares to reference a component in the architecture diagram. For example, the green square with label 3 refers to the EventBridge bus default component.

Deployment flow

This section is illustrated with the orange squares in the architecture diagram.

A user can create a project consisting of a data pipeline or more using our CLI tool as follows:

$ dpc create-project -n 'project-name'

The created project contains several components that allow the user to create and deploy data pipelines, which are defined in .yaml files (as explained earlier in the User experience section).

The workflow of deploying a data pipeline such as listings in Account A is as follows:

  • Deploy listings by running the command dpc deploy in the root folder of the project. An AWS CDK stack with all required resources is automatically generated.
  • The previous stack is deployed as an AWS CloudFormation template.
  • The stack uses custom resources to perform some actions, such as storing information needed for alerting and pipeline dependency management.
  • Two Lambda functions are triggered, one to store the mapping pipeline-X/slack-channels used for alerting in a DynamoDB table, and another one to store the mapping between the deployed pipeline and its triggers (other pipelines that should result in triggering the current one).
  • To decouple alerting and dependency management services from the other components of the solution, we use Amazon API Gateway for two components:
    • The Slack API.
    • The dependency management API.
  • All calls for both APIs are traced in Amazon CloudWatch log groups and two Lambda functions:
    • The Slack channel publisher Lambda function, used to store the mapping pipeline_name/slack_channels in a DynamoDB table.
    • The dependencies publisher Lambda function, used to store the pipelines dependencies (the mapping pipeline_name/parents) in a DynamoDB table.

Pipeline trigger flow

This is an event-driven mechanism that ensures that data pipelines are triggered as requested by the user, either following a schedule or a list of fulfilled upstream conditions, such as a group of pipelines succeeding or failing.

This flow relies heavily on EventBridge buses and rules, specifically two types of rules:

  • Scheduling rules.
  • Step Functions event-based rules, with a payload matching the set of statuses of all the parents of a given pipeline. The rules indicate for which set of statuses all the parents of pipeline-X should be triggered.

Scheduling

This section is illustrated with the black squares in the architecture diagram.

The listings pipeline running on Account A is set to run every day at 3:00 AM. The deployment of this pipeline creates an EventBridge rule and a Step Functions workflow for running the pipeline:

  • The EventBridge rule is of type schedule and is created on the default bus (this is the EventBridge bus responsible for listening to native AWS events—this distinction is important to avoid confusion when introducing the other buses). This rule has two main components:
    • A cron-like notation to describe the frequency at which it runs: 0 3 * * ? *.
    • The target, which is the Step Functions workflow describing the workflow of the listings pipeline.
  • The listings Step Function workflow describes and runs immediately when the rule gets triggered. (The same happens to the searches pipeline.)

Each user account has a default EventBridge bus, which listens to the default AWS events (such as the run of any Lambda function) and scheduled rules.

Dependency management

This section is illustrated with the green squares in the architecture diagram. The current flow starts after the Step Functions workflow (black square 2) starts, as explained in the previous section.

As a reminder, pipeline-X is triggered when both the listings and searches pipelines are successful. We focus on the listings pipeline for this post, but the same applies to the searches pipeline.

The overall idea is to notify all downstream pipelines that depend on it, in every AWS account, passing by and going through the central orchestration account, of the change of status of the listings pipeline.

It’s then logical that the following flow gets triggered multiple times per pipeline (Step Functions workflow) run as its status changes from RUNNING to either SUCCEEDED, FAILED, TIMED_OUT, or ABORTED. The reason being that there could be pipelines downstream potentially listening on any of those status change events. The steps are as follows:

  • The event of the Step Functions workflow starting is listened to by the default bus of Account A.
  • The rule export-events-to-central-bus, which specifically listens to the Step Function workflow run status change events, is then triggered.
  • The rule forwards the event to the central bus on the central account.
  • The event is then caught by the rule trigger-events-manager.
  • This rule triggers a Lambda function.
  • The function gets the list of all children pipelines that depend on the current run status of listings.
  • The current run is inserted in the run log Amazon Relational Database Service (Amazon RDS) table, following the schema sfn-listings, time (timestamp), status (SUCCEEDED, FAILED, and so on). You can query the run log RDS table to evaluate the running preconditions of all children pipelines and get all those that qualify for triggering.
  • A triggering event is broadcast in the central bus for each of those eligible children.
  • Those events get broadcast to all accounts through the export rules—including Account C, which is of interest in our case.
  • The default EventBridge bus on Account C receives the broadcasted event.
  • The EventBridge rule gets triggered if the event content matches the expected payload of the rule (notably that both pipelines have a SUCCEEDED status).
  • If the payload is valid, the rule triggers the Step Functions workflow pipeline-X and triggers the workflow to provision resources (which we discuss later in this post).

Alerting

This section is illustrated with the gray squares in the architecture diagram.

Many teams handle alerting differently across the organization, such as Slack alerting messages, email alerts, and OpsGenie alerts.

We decided to allow users to choose their preferred methods of alerting, giving them the flexibility to choose what kind of alerts to receive:

  • At the step level – Tracking the entire run of the pipeline
  • At the pipeline level – When it fails, or when it finishes with a SUCCESS or FAILED status

During the deployment of the pipeline, a new Amazon Simple Notification Service (Amazon SNS) topic gets created with the subscriptions matching the targets specified by the user (URL for OpsGenie, Lambda for Slack or email).

The following code is an example of what it looks like in the user’s pipeline.yaml:

notifications:
    type: FULL_EXECUTION
    targets:
        - channel: SLACK
          addresses:
               - data-pipeline-alerts
        - channel: EMAIL
          addresses:
               - [email protected]

The alerting flow includes the following steps:

  1. As the pipeline (Step Functions workflow) starts (black square 2 in the diagram), the run gets logged into CloudWatch Logs in a log group corresponding to the name of the pipeline (for example, listings).
  2. Depending on the user preference, all the run steps or events may get logged or not thanks to a subscription filter whose target is the execution-tracker-lambda Lambda function. The function gets called anytime a new event gets published in CloudWatch.
  3. This Lambda function parses and formats the message, then publishes it to the SNS topic.
  4. For the email and OpsGenie flows, the flow stops here. For posting the alert message on Slack, the Slack API caller Lambda function gets called with the formatted event payload.
  5. The function then publishes the message to the /messages endpoint of the Slack API Gateway.
  6. The Lambda function behind this endpoint runs, and posts the message in the corresponding Slack channel and under the right Slack thread (if applicable).
  7. The function retrieves the secret Slack REST API key from AWS Secrets Manager.
  8. It retrieves the Slack channels in which the alert should be posted.
  9. It retrieves the root message of the run, if any, so that subsequent messages get posted under the current run thread on Slack.
  10. It posts the message on Slack.
  11. If this is the first message for this run, it stores the mapping with the DB schema execution/slack_message_id to initiate a thread for future messages related to the same run.

Resource provisioning

This section is illustrated with the light blue squares in the architecture diagram.

To run a data pipeline, we need to provision an EMR cluster, which in turn requires some information like Hive metastore credentials, as shown in the workflow. The workflow steps are as follows:

  • Trigger the Step Functions workflow listings on schedule.
  • Run the listings workflow.
  • Provision an EMR cluster.
  • Use a custom resource to decrypt the Hive metastore password to be used in Spark jobs relying on central Hive tables or views.

End-user experience

After all preconditions are fulfilled (both the listings and searches pipelines succeeded), the pipeline-X workflow runs as shown in the following diagram.
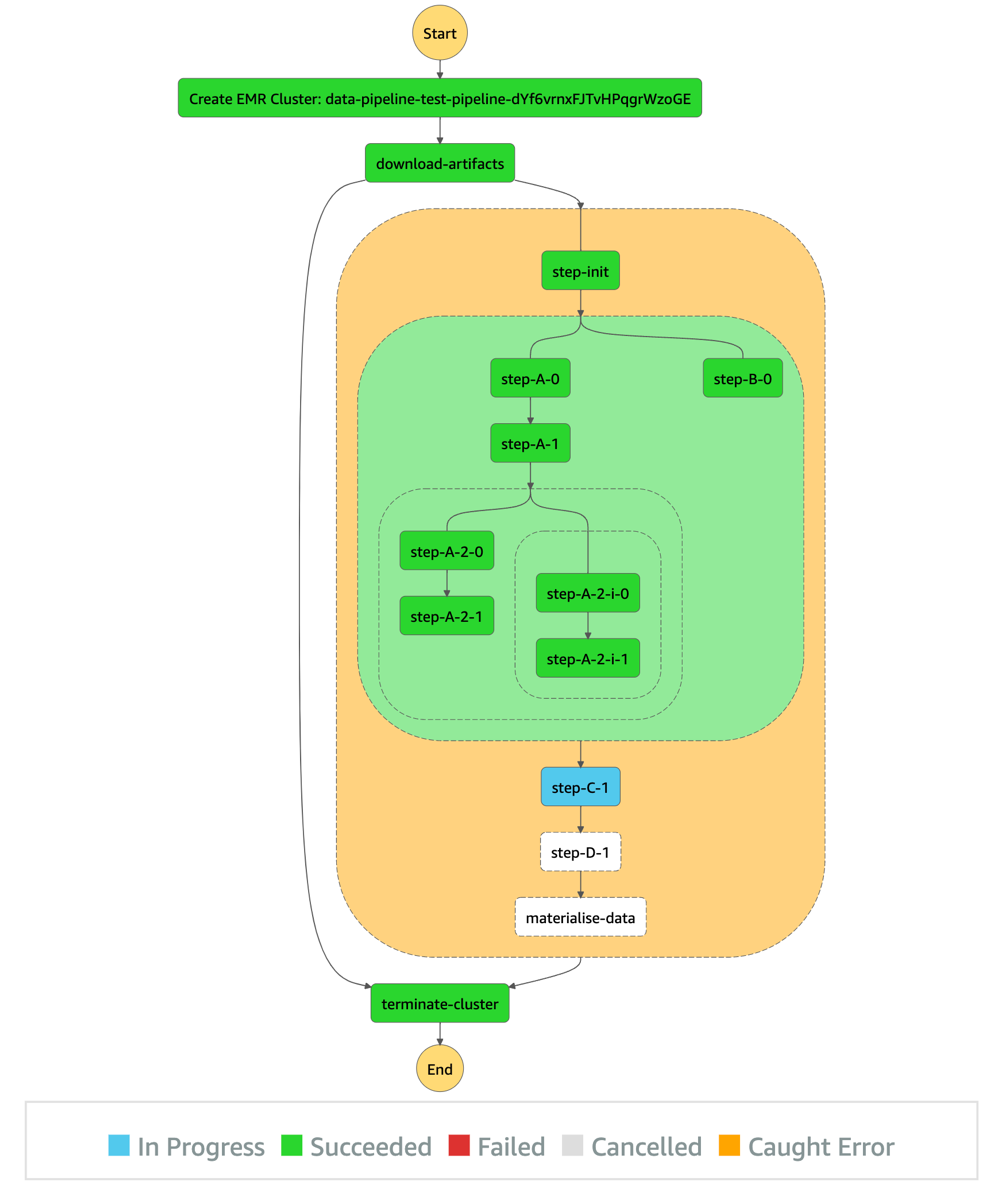
As shown in the diagram, the pipeline description (as a sequence of steps) defined by the user in the pipeline.yaml is represented by the orange block.

The steps before and after this orange section are automatically generated by our product, so users don’t have to take care of provisioning and freeing compute resources. In short, the CLI tool we provide our users synthesizes the user’s pipeline definition in the pipeline.yaml and generates the corresponding DAG.

Additional considerations and next steps

We tried to stay consistent and stick to one programming language for the creation of this product. We chose TypeScript, which played well with AWS CDK, the infrastructure as code (IaC) framework that we used to build the infrastructure of the product.

Similarly, we chose TypeScript for building the business logic of our Lambda functions, and of the CLI tool (using Oclif) we provide for our users.

As demonstrated in this post, EventBridge is a powerful service for event-driven architectures, and it plays a central and important role in our products. As for its limitations, we found that pairing Lambda and EventBridge could fulfill all our current needs and granted a high level of customization that allowed us to be creative in the features we wanted to serve our users.

Needless to say, we plan to keep developing the product, and have a multitude of ideas, notably:

  • Extend the list of core resources on which workloads run (currently only Amazon EMR) by adding other compute services, such Amazon Elastic Compute Cloud (Amazon EC2)
  • Use the Constructs Hub to allow users in the organization to develop custom steps to be used in all data pipelines (we currently only offer Spark and shell steps, which suffice in most cases)
  • Use the stored metadata regarding pipeline dependencies for data lineage, to have an overview of the overall health of the data pipelines in the organization, and more

Conclusion

This architecture and product brought many benefits. It allows us to:

  • Have a more robust and clear dependency management of data pipelines at Scout24.
  • Save on compute costs by avoiding scheduling pipelines based approximately on when its predecessors are usually triggered. By shifting to an event-driven paradigm, no pipeline gets started unless all its prerequisites are fulfilled.
  • Track our pipelines granularly and in real time on a step level.
  • Provide more flexible and alternative business logic by exposing multiple event types that downstream pipelines can listen to. For example, a fallback downstream pipeline might be run in case of a parent pipeline failure.
  • Reduce the cross-team communication overhead in case of failures or stopped runs by increasing the transparency of the whole pipelines’ dependency landscape.
  • Avoid manually restarting pipelines after an upstream pipeline is fixed.
  • Have an overview of all jobs that run.
  • Support the creation of a performance culture characterized by accountability.

We have big plans for this product. We will use DataMario to implement granular data lineage, observability, and governance. It’s a key piece of infrastructure in our strategy to scale data engineering and analytics at Scout24.

We will make DataMario open source towards the end of 2022. This is in line with our strategy to promote our approach to a solution on a self-built, scalable data platform. And with our next steps, we hope to extend this list of benefits and ease the pain in other companies solving similar challenges.

Thank you for reading.


About the authors

Mehdi Bendriss is a Senior Data / Data Platform Engineer, MSc in Computer Science and over 9 years of experience in software, ML, and data and data platform engineering, designing and building large-scale data and data platform products.

Mohamad Shaker is a Senior Data / Data Platform Engineer, with over 9 years of experience in software and data engineering, designing and building large-scale data and data platform products that enable users to access, explore, and utilize their data to build great data products.

Arvid Reiche is a Data Platform Leader, with over 9 years of experience in data, building a data platform that scales and serves the needs of the users.

Marco Salazar is a Solutions Architect working with Digital Native customers in the DACH region with over 5 years of experience building and delivering end-to-end, high-impact, cloud native solutions on AWS for Enterprise and Sports customers across EMEA. He currently focuses on enabling customers to define technology strategies on AWS for the short- and long-term that allow them achieve their desired business objectives, specializing on Data and Analytics engagements. In his free time, Marco enjoys building side-projects involving mobile/web apps, microcontrollers & IoT, and most recently wearable technologies.

GitHub Availability Report: October 2022

Post Syndicated from Jakub Oleksy original https://github.blog/2022-11-02-github-availability-report-october-2022/

In October, we experienced four incidents that resulted in significant impact and degraded state of availability to multiple GitHub services. This report also sheds light into an incident that impacted Codespaces in September.

October 26 00:47 UTC (lasting 3 hours and 47 minutes)

Our alerting systems detected an incident that impacted most Codespaces customers. Due to the recency of this incident, we are still investigating the contributing factors and will provide a more detailed update on cause and remediation in the November Availability Report, which we will publish the first Wednesday of December.

October 13 20:43 UTC (lasting 48 minutes)

On October 13, 2022 at 20:43 UTC, our alerting systems detected an increase in the Projects API error response rate. Due to the significant customer impact, we went to status red for Issues at 20:47 UTC. Within 10 minutes of the alert, we traced the cause to a recently-deployed change.

This change introduced a database validation that required a certain value to be present. However, it did not correctly set a default value in every scenario. This resulted in the population of null values in some cases, which produced an error when pulling certain records from the database.

We initiated a roll back of the change at 21:08 UTC. At 21:13 UTC, we began to see a steady decrease in the number of error responses from our APIs back to normal levels, changed the status of Issues to yellow at 21:24 UTC, and changed the status of Issues to green at 21:31 UTC once all metrics were healthy.

Following this incident, we have added mitigations to protect against missing values in the future, and we have improved testing around this particular area. We have also fixed our deployment dashboards, which contained some inaccurate data for pre-production errors. This will ensure that errors are more visible during the deploy process to help us prevent these issues from reaching production.

October 12 23:27 UTC (lasting 3 hours and 31 minutes)

On October 12, 2022 at 22:30 UTC, we rolled out a global configuration change for Codespaces. At 23:15 UTC, after the change had propagated to a variety of regions, we noticed new Codespace creation starting to trend downward and were alerted to issues from our monitors. At 23:27 UTC, we deemed the impact significant enough to status Codespaces yellow, and eventually red, based on continued degradation.

During the incident, it was discovered that one of the older components of the backend system did not cope well with the configuration change, causing a schema conflict. This was not properly tested prior to the rollout. Additionally, this component version does not support gradual exposure across regions—so many regions were impacted at once. Once we detected the issue and determined the configuration change was the cause, we worked to carefully roll back the large schema change. Due to the complexity of the rollback, the procedure took an extended period of time. Once the rollback was complete and metrics tracking new Codespaces creations were healthy, we changed the status of the service back to green at 02:58 UTC.

After analyzing this incident, we determined we can eliminate our dependency on this older configuration type and have repair work in progress to eliminate this type of configuration from Codespaces entirely. We have also verified that all future changes to any component will follow safe deployment practices (one test region followed by individual region rollouts) to avoid global impact in the future.

October 5 06:30 UTC (lasting 31 minutes)

On October 5, 2022 at 06:30 UTC, webhooks experienced a significant backlog of events caused by a high volume of automated user activity causing a rapid series of create and delete operations. This activity triggered a large influx of webhook events. However, many of these events caused exceptions in our webhook delivery worker because data needed to generate their webhook payloads had been deleted from the database. Attempting to retry these failed jobs tied up our worker and it was unable to process new incoming events, resulting in a severe backlog in our queues. Downstream services that rely on webhooks to receive their events were unable to receive them, which resulted in service degradation. We updated GitHub Actions to status red because the webhooks delay caused new job execution to be severely delayed.

Investigation into the source of the automated activity led us to find that there was automation creating and deleting many repositories in quick succession. As a mitigation, we disabled the automated accounts that were causing this activity in order to give us time to find a longer term solution for such activity.

Once the automated accounts were disabled, it brought the webhook deliveries back to normal and the backlog got mitigated at 07:01 UTC. We also updated our webhook delivery workers to not retry any jobs for which it was determined that the data did not exist in the database. Once the fix was put in place, the accounts were re-enabled and no further problems were encountered with our worker. We recognize that our services must be resilient to spikes in load and will make improvements based on what we’ve learned in this incident.

September 28 03:53 UTC (lasting 1 hour and 16 minutes)

On September 27, 2022 at 23:14 UTC, we performed a routine secret rotation procedure on Codespaces. On September 28, 2022 at 03:21 UTC, we received an internal report stating that port forwarding was not working on the Codespaces web client and began investigating. At 03:53 UTC. we statused yellow due to the broad user impact we were observing. Upon investigation, we found that we missed a step in the secret rotation checklist a few hours earlier, which caused some downstream components to fail to pick up the new secret. This resulted in some traffic not reaching backend services as expected. At 04:29 UTC, we ran the missed rotation step, after which we quickly saw the port forwarding feature returning to a healthy state. At this moment, we considered the incident to be mitigated. We investigated why we did not receive automated alerts about this issue and found that our alerts were monitoring error rates but did not alert for lack of overall traffic to the port forwarding backend. We have since improved our monitoring to include anomalies in traffic levels that cover this failure mode.

Several hours later, at 17:18 UTC, our monitors alerted us of an issue in a separate downstream component, which was similarly caused by the previous missed secret rotation step. We could see Codespaces creation and start failures increasing in all regions. The effect from the earlier secret rotation was not immediate because this secret is used in exchange for a token, which is cached for up to 24 hours. Our understanding was that the system would pick up the new secret without intervention, but in reality this secret was picked up only if the process was restarted. At 18:27 UTC, we restarted the service in all regions and could see that the VM pools, which were heavily drained before, started to slowly recover. To accelerate the draining of the backlog of queued jobs we increased the pool size at 18:45 UTC. This helped all but two pools in West Europe, which were still not recovering. At 19:44 UTC, we identified an instance of the service in West Europe that was not rotated along the rest. We rotated that instance and quickly saw a recovery in the affected pools.

After the incident, we identified why multiple downstream components failed to pick up the rotated secret. We then added additional monitoring to identify which secret versions are in use across all components in the service to more easily track and verify secret rotations. To address this short term, we have updated our secret rotation checklist to include the missing steps and added additional verification steps to ensure the new secrets are picked up everywhere. Longer term, we are automating most of our secret rotation processes to avoid human error.

In summary

Please follow our status page for real-time updates on status changes. To learn more about what we’re working on, check out the GitHub Engineering Blog.

Common questions when evolving your VM program

Post Syndicated from Rapid7 original https://blog.rapid7.com/2022/11/02/common-questions-when-evolving-your-vm-program/

Common questions when evolving your VM program

Authored by Natalie Hurd

Perhaps your organization is in the beginning stages of planning a digital transformation, and it’s time to start considering how the security team will adapt. Or maybe your digital transformation is well underway, and the security team is struggling to keep up with the pace of change. Either way, you’ve likely realized that the approach you’ve used with traditional infrastructure will need to evolve as you think about managing risk in your modern ecosystem. After all, a cloud instance running Kubernetes clusters to support application development is quite different from an on-premise Exchange server!

A recent webinar led by two of Rapid7’s leaders, Peter Scott (VP, Product Marketing) and Cindy Stanton (SVP, Product and Customer Marketing), explored the specific challenges of managing the evolution of risk across traditional and cloud environments. The challenges may be plentiful, but the strategies for success are just as numerous!

Over the course of several years, Rapid7 has helped many customers evolve their security programs in order to keep pace with the evolution of technology, and Peter and Cindy have noticed some themes of what tends to make these organizations successful. They advise working with your team & other stakeholders to find answers to the following questions:

  • What sorts of resources does your organization run in the cloud, and who owns them?
  • What does “good” look like when securing your cloud assets, and how will you measure success?
  • Which standards and frameworks is your company subject to, compliance or otherwise?

Gathering answers to these questions as early as possible will not only aid in the efficacy of your security program, it will also help to establish strong relationships & understanding amongst key stakeholders.

Establishing Ownership


Common questions when evolving your VM program

Proactively identifying teams and individuals that own the assets in your environment will go a long way towards ensuring speed of resolution when risk is present. Peter strongly suggests working with your organization’s Product or Project Development teams to figure out who owns what and get it documented. This way, when you see a misconfiguration, vulnerability or threat that needs to be dealt with, you know exactly who to talk to to get it resolved, saving important time.

The owners that you identify will not only have a hand to play in fixing problems, they can help make the necessary changes to “shift left” and prevent problems in the first place. The sooner you can identify these stakeholders and build relationships with them, the more successful you’ll be in the long run.

Defining “Good” and Tracking Achievement


Common questions when evolving your VM program

Since we’ve established that securing traditional environments is not the same as securing modern environments, we can also agree that the definition of success may not be the same either! After you’ve established ownership, Cindy notes that it’s also important to define what “good” looks like, and how you plan to measure & report on it. Once you’ve created a definition of “good” within your immediate team, it’s also important to socialize that with stakeholders across your organization and track progress towards achieving that state. Tracking & sharing progress is valuable whether your organization meets, exceeds or falls short of your goals; celebrating the wins is just as important as seeking to understand the losses!

Aligning to Standards and Frameworks


Common questions when evolving your VM program

Every industry comes with its own set of compliance and regulatory standards that must be adhered to, and it’s important to understand how security fits in. Your team can use these frameworks as a North Star of sorts when considering how to secure your environment, and the cloud aspects of your environment are no exception. Ben Austin, the moderator of the webinar, provides some perspective on the utility of compliance as a method for demonstrating progress in risk reduction. If your assets are more compliant today than they were 3 months ago, that’s a win for every stakeholder involved. If assets are getting less compliant, then you can work with your already-identified asset owners to make a plan to turn the ship around, and contextualize the importance of remaining compliant with them.

Check out our two previous blogs in the series to learn more about Addressing the Evolving Attack Surface and Adapting your VM Program to Regain Control, and watch the full webinar replay any time!

Security updates for Wednesday

Post Syndicated from original https://lwn.net/Articles/913504/

Security updates have been issued by Debian (ffmpeg and linux-5.10), Fedora (libksba, openssl, and php), Gentoo (openssl), Mageia (curl, gdk-pixbuf2.0, libksba, nbd, php, and virglrenderer), Red Hat (kernel, kernel-rt, libksba, and openssl), SUSE (gnome-desktop, hdf5, hsqldb, kernel, nodejs10, openssl-3, php7, podofo, python-Flask-Security, python-lxml, and xorg-x11-server), and Ubuntu (backport-iwlwifi-dkms, firefox, ntfs-3g, and openssl).

Cloudflare is not affected by the OpenSSL vulnerabilities CVE-2022-3602 and CVE-2022-37

Post Syndicated from Evan Johnson original https://blog.cloudflare.com/cloudflare-is-not-affected-by-the-openssl-vulnerabilities-cve-2022-3602-and-cve-2022-37/

Cloudflare is not affected by the OpenSSL vulnerabilities CVE-2022-3602 and CVE-2022-37

Cloudflare is not affected by the OpenSSL vulnerabilities CVE-2022-3602 and CVE-2022-37

Yesterday, November 1, 2022, OpenSSL released version 3.0.7 to patch CVE-2022-3602 and CVE-2022-3786, two HIGH risk vulnerabilities in the OpenSSL 3.0.x cryptographic library. Cloudflare is not affected by these vulnerabilities because we use BoringSSL in our products.

These vulnerabilities are memory corruption issues, in which attackers may be able to execute arbitrary code on a victim’s machine. CVE-2022-3602 was initially announced as a CRITICAL severity vulnerability, but it was downgraded to HIGH because it was deemed difficult to exploit with remote code execution (RCE). Unlike previous situations where users of OpenSSL were almost universally vulnerable, software that is using other versions of OpenSSL (like 1.1.1) are not vulnerable to this attack.

How do these issues affect clients and servers?

These vulnerabilities reside in the code responsible for X.509 certificate verification – most often executed on the client side to authenticate the server and the certificate presented. In order to be impacted by this vulnerability the victim (client or server) needs a few conditions to be true:

  • A malicious certificate needs to be signed by a Certificate Authority that the victim trusts.
  • The victim needs to validate the malicious certificate or ignore a series of warnings from the browser.
  • The victim needs to be running OpenSSL 3.0.x before 3.0.7.

For a client to be affected by this vulnerability, they would have to visit a malicious site that presents a certificate containing an exploit payload. In addition, this malicious certificate would have to be signed by a trusted certificate authority (CA).

Servers with a vulnerable version of OpenSSL can be attacked if they support mutual authentication – a scenario where both client and a server provide a valid and signed X.509 certificate, and the client is able to present a certificate with an exploit payload to the server.

How should you handle this issue?

If you’re managing services that run OpenSSL: you should patch vulnerable OpenSSL packages. On a Linux system you can determine if you have any processes dynamically loading OpenSSL with the lsof command. Here’s an example of finding OpenSSL being used by NGINX.

root@55f64f421576:/# lsof | grep libssl.so.3
nginx   1294     root  mem       REG              254,1           925009 /usr/lib/x86_64-linux-gnu/libssl.so.3 (path dev=0,142)

Once the package maintainers for your Linux distro release OpenSSL 3.0.7 you can patch by updating your package sources and upgrading the libssl3 package. On Debian and Ubuntu this can be done with the apt-get upgrade command

root@55f64f421576:/# apt-get --only-upgrade install libssl3

With that said, it’s possible that you could be running a vulnerable version of OpenSSL that the lsof command can’t find because your process is statically compiled. It’s important to update your statically compiled software that you are responsible for maintaining, and make sure that over the coming days you are updating your operating system and other installed software that might contain the vulnerable OpenSSL versions.

Key takeaways

Cloudflare’s use of BoringSSL helped us be confident that the issue would not impact us prior to the release date of the vulnerabilities.

More generally, the vulnerability is a reminder that memory safety is still an important issue. This issue may be difficult to exploit because it requires a maliciously crafted certificate that is signed by a trusted CA, and certificate issuers are likely to begin validating that the certificates they sign don’t contain payloads that exploit these vulnerabilities.  However, it’s still important to patch your software and upgrade your vulnerable OpenSSL packages to OpenSSL 3.0.7 given the severity of the issue.

To learn more about our mission to help build a better Internet, start here. If you’re looking for a new career direction, check out our open positions.

Зависимостите в България – кратка справка от първа ръка

Post Syndicated from Юлия Георгиева original https://toest.bg/zavisimostite-v-bulgaria/

Традиционно темата за зависимостите в България е силно митологизирана, което води и до замитането ѝ под килима. Точно както за страшните караконджули и самодиви не се говори на висок глас и по тъмно, така и тази тема е поставена в сферата на мистичното зло. Според разпространената митология проблемът със зависимостите е проблем на новото, на времето на Прехода, а през соца такова нещо не е имало. Всъщност страната ни има доста богата култура на употреба на психоактивни вещества, която се корени далеч в праисторията ни.

Нека си припомним, че едни от първите производители на вино в света са траките, които са живели по тези земи и са започнали да произвеждат варианти на виното преди повече от 5000 години. А тогава на него се е гледало като на сакрална напитка, мост към божественото, възможност да комуникираш с по-висшите сили. Достъпът до него е бил привилегия за избрани. Но траките далеч не са се ограничавали само до употребата на алкохол. В свой доклад, озаглавен „За Родопите, растенията, съдържащи алкалоиди, и тяхното приложение в религиозните ритуали и медицината“, Лидия Кирилова пише:

Няма никакво съмнение за това, че траките са познавали и използвали в магическите си ритуали някои от многобройните лекарствени растения, растящи на Балканския полуостров. Според Херодот те „хвърляли върховете на конопа в огъня и дишали дима през кухи тръстикови стебла, от което ставали като пияни и накрая заспивали“. Съществуват неясни сведения, че по долината на Струма жреците приготвяли упойваща напитка от татул. 

По-късно виното намира своето място и в християнската религиозна традиция. В православието църковното причастие включва даването на хляб и вино, които са символ на тялото и кръвта на Исус, а виното присъства на практика във всички църковни ритуали в жизнения цикъл на човека – от кръщенето, през сватбата, та до погребението. Един от най-обичаните и уважавани български светци е Трифон Зарезан, наследник на Дионис. А исторически виното е и символ на сила и могъщество, привилегия на победителите – Крум пие вино от черепа на победения Никифор.

В по-ново време популярна става и ракията, която бързо е припозната за традиционна напитка. Интересно е да отбележим, че тя е толкова важна за българина, та дори през османското владичество никой не е посегнал на домашното ѝ производство, независимо че ислямът не позволява употребата на алкохол. Традицията за производство и консумация на домашна ракия продължава и до днес, а политиците не успяват да съберат кураж и да поставят производството ѝ под контрол, който би гарантирал безопасността на напитката. През последните петнайсетина години темата се повдига регулярно и се подхвърля като горещ картоф между институциите, които се опитват да се спасят от отговорност. Куриозен факт е, че през 2015 г. един от опитите да се регламентира производството на ракия доведе до жалба от страна на малки производители до омбудсмана Мая Манолова и по този казус тя дори сезира Конституционния съд.

Цялата история дава ясна представа за важността, която употребата на алкохол и някои други психоактивни вещества (тютюнът все още е изключително популярен в страната) представлява за българите. Естествено, извън културнотрадиционния контекст съществува и чисто здравен. През 2019 г. България е на девето място в света по употреба на алкохол с впечатляващите 12,46 литра годишна консумация на човек. За сравнение: Русия е със скромните 10,5 литра, а сърбите изпиват eдва по 8,85 литра годишно. Очевидно консумацията на алкохол е широко приета в българското общество и на нея се гледа като на нещо нормално, дори задължително.

В същото време е странно как общественият разговор за консумацията на наркотици (които също са психоактивни вещества със сходен здравен риск и действие) е абсолютно табу.

А наркотиците никак не са ново явление

Действително употребата на психоактивни вещества през социализма е много по-слабо разпространена, отколкото в по-късните години, но все пак е налице. Вещества като омнопон, лидол, морфин, както и различни препарати, съдържащи опиати, са достъпни само за малък кръг от хора. Те се снабдяват с тях чрез познати лекари и медицински лица, с фалшиви рецепти или кражби от аптеки и болници.

През 60-те години проблемът става толкова видим, че Народната република създава Кабинет за лечение на алкохолизъм и тютюнопушене, който през 70-те се трансформира в Център за профилактика и лечение на зависимости. През 80-те години центърът се превръща във водещо лечебно заведение за зависими и приема пациенти и от други балкански страни, като Гърция, където тогава подобни грижи не съществуват. През 2004 г. центърът е регистриран като Държавна психиатрична болница за лечение на наркомании и алкохолизъм на бюджетна издръжка с капацитет от 40 места (през 70-те години са били 160).

Важно е също да се отбележи, че през 80-те години България е известна с износа си на каптагон (вид амфетамин) към Близкия изток, който е сериозен източник на така нужната на НРБ твърда валута. Този износ поставя основите и на един от най-големите канали за трафик на наркотици между Европа и Близкия изток, който е ключов и до днес.

Деветдесетте години на ХХ век са времето, когато България се сблъсква челно с огромния проблем за нелегалните наркотици. Докато хероиновата епидемия удря Западна Европа през 80-те и страните започват да вземат спешни мерки, в България първоначално всичко изглежда спокойно. Отварянето на страната обаче води до навлизането на хероина и кокаина от Близкия изток (основно през същия онзи канал за износ на каптагон), а родната марихуана става суперпопулярна и се разпространява със скоростта на горски пожар.

Невижданата хероинова епидемия отнема живота на хиляди млади хора. Хероинът бързо се превръща в начин на живот, вид бунт срещу системата. Използва се основно от хора с образование и желание за свобода и различност, гневни на предишния режим, на мизерията и безпътицата в този период.

Инициативи в сферата на зависимостите

В отговор на този изключително сериозен проблем през 1994 г. се създава Националният център по наркомании, който отговаря за изготвянето и координацията на дейностите по превенция, лечение, рехабилитация, намаляване на вредите и т.н. През 1997 г. се основава първата неправителствена организация, която се занимава с намаляването на вредите от употребата на наркотици – Фондация „Инициатива за здраве“. През следващата година се създават две сходни организации – „Доза обич“ в Бургас и „Панацея“ в Пловдив. Тяхното финансиране идва от международни източници.

Важно е да обърнем специално внимание на тези неправителствени организации и на тяхната дейност, защото те са в основата на последвалия отговор на държавата по темата. Дейността им е свързана главно с превенция на кръвнопреносими инфекции, като СПИН, хепатит С, хепатит В и сифилис, но най-важната им функция всъщност е поддържането на добър контакт с младите хора, които употребяват наркотици, осигуряване на среда, в която те да се чувстват сигурни и да споделят трудностите си, което им помага и да съберат кураж, за да започнат промяна. Изключително важно е, че организациите работят на терен, на местата, където хората се събират и се чувстват в безопасност.

Малко по-късно се създава и първата безплатна субституираща програма в страната, която оказва подкрепа на най-тежко зависимите от опиати пациенти. Създават се и първите частни терапевтични общности, които следват високи международни стандарти за работа. За съжаление, тогава се появяват и придобиват популярност и т.нар. комуни, които третират зависимите младежи като безплатна работна ръка и възможност за реализиране на по-големи печалби.

Стъпки в правилната посока

През 2003 г. в България навлиза Глобалният фонд за борба с ХИВ, туберкулоза и малария, чието финансиране дава възможност на Министерството на здравеопазването да предложи наистина всеобхватна превенция от ХИВ за хората, употребяващи наркотици. Освен трите вече работещи организации се формират множество нови, които покриват почти изцяло територията на страната. Изграждат се екипи, провеждат се обучения за персонала, закупуват се оборудване и апаратура. Благодарение на тези средства България се превръща в страна еталон за борбата със СПИН и други кръвнопреносими инфекции.

Прави впечатление обаче, че дейностите, свързани с превенция и лечение на зависимостите, някак изостават от превенцията от ХИВ. Държавните институции не подкрепят със средства доказано ефективните научни методи за превенция, обучение за които са получили преподаватели от цялата страна, и съвсем естествено те престават да бъдат от интерес за училищата и учителите. Безплатното лечение остава затворено в кръга на психиатричната помощ, където опит и знания за зависимостите имат единици специалисти ентусиасти, работещи основно в Държавната психиатрична болница за лечение на наркомании и алкохолизъм в софийския квартал „Суходол“ и в Шесто мъжко отделение на Държавната психиатрична болница в Раднево. Частните терапевтични общности стават мнозинство и цените им хвръкват, независимо че далеч не всички дават добри резултати. Учителите са оставени да преценяват сами как в часовете на класа да осъществяват превенция на употребата на наркотици.

В същото време служители от Министерството на здравеопазването отчитат изключително добри резултати по отношение на борбата с ХИВ, участват във всевъзможни международни форуми, където представят добрите си практики. Множество експерти изграждат успешна кариера на международно ниво и остават в чужбина.

След напускането на Глобалния фонд

През 2017 г. финансирането от Глобалния фонд приключи. Независимо че всяко правителство след 2003 г. е подписало споразумение България да гарантира продължението на дейностите след оттеглянето на Глобалния фонд, адекватно финансиране няма и до днес. Процесът по закриване на организации, работещи за превенцията от ХИВ и кръвнопреносими инфекции, вече е започнал през 2014 г., още при първите финансови съкращения от Глобалния фонд. Тогава започва и сериозна кампания за „преструктуриране“ (или иначе казано – закриване) на Националния център по наркомании, която достигна целта си през 2019 г.

Последните опити за продължаване на дейностите по превенция от ХИВ от страна на експертните неправителствени организации беше в периода от юли 2019 до юли 2020 г., когато бяха открити два пъти повече нови серопозитивни лица в сравнение с предишните периоди. След това работата на терен с хора, които активно употребяват наркотици, престана. Никой не прави превенция на кръвнопреносими инфекции, никой не тества на терен, никой не работи с мотивацията за лечение на зависимите хора, както се правеше през годините.

В тази тежка ситуация през 2019 г. Центърът за хуманни политики пое грижата за единствения дневен център за хора, които употребяват наркотици – „Розовата къща“. Място, на което страдащите от зависимост могат да получат храна, дрехи, хигиенни материали, лекарства, да потърсят съдействие за издаване на документи, записване при личен лекар, подаване на искане за ТЕЛК, лечение на зависимостта си или пък на друго заболяване. Място, на което да получат подкрепа в битката си за по-достоен живот. Дейността на „Розовата къща“ се финансира основно от частни лица и организации.

За край на този обзор ми се ще да отбележа нещо много важно, което сякаш като общество често забравяме: 

зависимостта е преди всичко заболяване.

По-точната научна дефиниция е, че зависимостта е „хронично-рецидивиращо заболяване, което предизвиква трайни промени в мозъчната биохимия“. Към същата група впрочем спада и захарният диабет.

Успешното лечение на зависимостта не опира само до личното решение и воля на болния. Зависимият има нужда от подкрепа и терапия, която да е безплатна и достъпна. А ние – от повече открити разговори за този социален проблем и за стигмата, с която обричаме на маргинализация част от нашето общество.

Заглавна снимка: Бележка, оставена от самите ползватели на „Розовата къща“ © Мила Бобадова

Източник

Гретчен Парлато и силата на деликатния музикален изказ

Post Syndicated from original https://toest.bg/gretchen-parlato-plovdiv-jazz-fest/

Гретчен Парлато е една от най-добрите съвременни джаз певици. Има 4 самостоятелни и над 85 съвместни албума. Пяла е с Хърби Хенкок, Уейн Шортър, Маркъс Милър, Аирто Морейра и много други големи имена в музиката. Третият ѝ албум The Lost and Found от 2011 г. получи над 30 национални и международни награди, а най-новият – Flor – донесе на певицата втора номинация за „Грами“ в категорията „Най-добър вокален джаз албум“ (първата беше за концертния Live in NYC от 2015 г.). 

Flor излиза през март 2021 г., след дълга пауза по майчинство, което е и сред основните теми в албума на американската певица. За записа си тя работи с утвърдени имена като Марсел Камарго, Артьом Манукян, Лео Коста, Аирто Морейра, Джералд Клейтън и Марк Гилиана. Именно за да представи своя последен албум, Гретчен Парлато започна своето световно турне. В рамките на обиколката тя ще пристигне и на сцената на предстоящия „Пловдив Джаз Фест“ заедно със своята група, в т.ч. и впечатляващия джаз пианист Тейлър Айгсти, който пък е тазгодишният носител на „Грами“ за най-добър съвременен инструментален албум. 

Програмата на осмото издание на „Пловдив Джаз Фест“ включва шест концерта в рамките на четири вечери – от 4 до 7 ноември. По време на изданието ще можем да се насладим и на музиката на легендарния Чарлз Мингъс, представена от четирима пианисти – Антони Дончев (България), Дани Грисет (САЩ), Пьотр Вилезол (Полша), Роберто Таренци (Италия); да чуем младата джаз тромпетистка от британско-бахрейнски произход Яз Мохамед; да отпразнуваме заедно 70-годишнината на великата Йълдъз Ибрахимова, която ще се качи на сцената с Живко Петров, Веселин Веселинов – Еко и Христо Йоцов; да се потопим в творчеството на американския джаз пианист и композитор Емет Коен, а също и на може би най-известния фламенко-джаз пианист Давид Пеня Дорантес. Концертът на Гретчен Парлато и нейния квартет е заключителният за фестивала и ще се състои на 7 ноември от 20 ч. в Дома на културата „Борис Христов“ в Пловдив.

Помолихме известната българска джаз певица Мирослава Кацарова, която е и организатор на престижния фестивал, да направи това блицинтервю с Гретчен Парлато специално за читателите на „Тоест“. 


Вие сте една от любимите ми певици и честно казано, сред основните причини да Ви ценя толкова високо като вокалист и творец е Вашето умение интелигентно да овладявате вокалната си фраза и избора Ви да не правите певчески демонстрации, а да създавате умни и тихи кулминации в песните си. Бихте ли ни разкрили пътя, който изминахте, за да достигнете до този деликатен музикален изказ?

Благодаря Ви за тези комплименти, те значат много за мен. Моята цел винаги е била да пея така, както говоря, да остана автентична, истинска, честна и чиста с гласа и артистичността си. Щом веднъж човек открие своя глас, не е необходимо да звучи като някой друг. Трябва да звучи естествено и без усилие. В моето изкуство да работя задълбочено, технически, емоционално и духовно означава да се издигна високо в артистичния си изказ и в смисъла си на творец.

Със сигурност имате свои любими вокалисти, но кои от тях особено са Ви вдъхновили?

Имам неизброимо много любими певци, особено ако преминем отвъд границите на джаза. Но сега ще се спра само на някои – Боби Макферин, Жоао Жилберто, Ела Фицджералд, Сара Вон… И това са наистина малка част от тях. Особено Боби и Жоао ме научиха, че нюансите, детайлите и интимността могат да бъдат изключително мощни, а също и да развият дълбоко чувство за ритмично фразиране.

Най-новият Ви албум Flor се появи след дълга пауза, дължаща се на майчинството Ви. На какво Ви научи този период и отрази ли се той на музиката и на избора Ви като артист?

Майчинството категорично трансформира чувството ми за перспектива, цел, смисъл в изкуството и в живота. Flor е почит към това време, към сина ми, към разцъфването ми отново като артист и откриването на баланса между майчинство и творчество. Да съм майка ми позволява да си задам въпроса как това се отразява на сина ми, на семейството ми, и дори повече – как това се отразява на другите хора, които ще го чуят сега и по-нататък в бъдещето. Нашето изкуство ни надживява, а това ни помага да мислим за качеството на творчеството си и за неговото въздействие и способност да изцелява. 

С какво се занимавате сега, правите ли нови записи и какви са Вашите нови музикални посоки? И в този контекст – какво е бъдещето на джаза според Вас?

Идната пролет предстои да запишем двойния си албум с китариста Лайънъл Луеке. Планираме да направим турне с този проект, така че следете за датите на предстоящите ни концерти. Иначе, бъдещето на джаза е отворено и безкрайно, постоянно разширяващо се, растящо… Но в същото време – с дълбоки корени в традицията и наследството. Всичко е възможно в бъдещето на джаза, затова съм тук.

Заглавна снимка: © Lauren Desberg

Източник

Your guide to Amazon Communication Developer Services (CDS) at re:Invent 2022

Post Syndicated from Lauren Cudney original https://aws.amazon.com/blogs/messaging-and-targeting/your-guide-to-amazon-communication-developer-services-cds-at-reinvent-2022/

Your guide to AWS Communication Developer Services (CDS) at re:Invent 2022

AWS Communication Developer Services  has an exciting lineup at re:Invent this year, with 12 sessions spanning communication solutions through Amazon Pinpoint, Amazon Simple Email Service, and Amazon Chime SDK. With breakouts, workshops, and an in-person customer reception, there will be something for everyone. Here is a detailed guide to help you build your agenda and get the most our of your re:Invent 2022 experience.

AWS guide to CDS CPaaS at reInvent

In addition to AWS executive keynotes, like Adam Selipsky’s on Tuesday morning, there are several session you don’t want to miss:

Topic – CPaaS and AWS Communication Services

Improving multichannel communications (BIZ201) – Breakout session
Wednesday November 30, 11:30 PM – 12:30 PM PDT
Your communication strategy directly impacts customer satisfaction, revenue, growth, and retention. This session covers how the customer communication landscape is changing and how you can shift your product strategies to impact business outcomes. Learn how AWS Communication Developer Services (CDS) improve customer communication through CPaaS channels like email, SMS, push notifications, telephony, audio, and video. Explore how building a multichannel architecture can shift user habits and increase satisfaction. This session is tailored for chief marketing officers, chief product officers, chief innovation officers, marketing technologists, and communication builders.
Speaker: Siddhartha Rao, GM, Amazon Chime SDK, Amazon Web Services

Topic – Email (Amazon Simple Email Service)

Improve email inbox deliverability with innovation from Amazon SES (BIZ306) – Chalk Talk
Wednesday, November 30, 4:00 – 5:00 PM PDT
This chalk talk demonstrates how to improve email deliverability, leading to increased email ROI. Learn how to build new features in Amazon SES that increase deliverability through system and configuration suggestions, and then automatically implement those changes for more seamless sending. This chalk talk is designed for email data engineers, marketing operations professionals, and marketing engineers.

Topic – Messaging and Orchestration through SMS, Push, In App (Amazon Pinpoint)

Successfully engage customers using Amazon Pinpoint’s SMS channel (BIZ301) – Chalk Talk
Monday, November 28, 1:00 – 2:00 PM PDT
Developing or upgrading an SMS program can be challenging for any enterprise undergoing digital transformation. In this chalk talk, Amazon Pinpoint experts demonstrate how to build a two-way SMS solution and how to monitor global message deliverability. This talk is designed for communication builders, marketing technologists, and IT decision-makers.

Integrate AI and ML into customer engagement (BIZ309) – Chalk Talk
Thursday, December 1, 3:30 – 4:30 PM PDT
In this chalk talk, learn how to use Amazon Lex AI and Amazon Personalize ML to create two-way engagements with customers in Amazon Pinpoint. Amazon Pinpoint is an omni-channel messaging platform on AWS, supporting SMS, push notifications, email, voice, and custom channels. Follow along as Amazon Pinpoint specialists walk through sample architecture and code that uses Amazon Lex AI chatbots to check order status, share updates via the customer’s preferred channel, and personalize responses to the customer, taking customer engagement to the next level.

Topic – Voice and Video (Amazon Chime SDK)

Use AI to live transcribe and translate multiparty video calls – Workshop
Thursday, December 1, 2:00 – 4:00 PM PDT
Harness the power of real-time transcription in web-based voice or video calls through the Amazon Chime SDK. Join this interactive workshop to learn how to build transcription and translation into multiparty video calls requiring additional compliance and language accessibility, such as telehealth appointments, government services, parent-teacher interactions, or financial services. Experts guide attendees in a hands-on demo that combines the power of Amazon Chime SDK, Amazon Transcribe, and Amazon Translate into one simple interface. This workshop is designed for communication developers. You must bring your laptop to participate.

We look forward to seeing you at re:Invent!

[$] Moving past TCP in the data center, part 1

Post Syndicated from original https://lwn.net/Articles/913260/

At the recently concluded Netdev
0x16 conference
, which was held both in Lisbon, Portugal and virtually,
Stanford professor John Ousterhout gave his personal views on where
networking in data centers needs to be headed. To solve the problems that
he sees, he suggested some “fairly significant changes” to those
environments, including leaving behind the venerable—ubiquitous—TCP
transport protocol. While LWN was unable to attend the conference itself,
due to scheduling and time-zone conflicts, we were able to view the video of
Ousterhout’s keynote talk to bring you this report.

Your guide to AWS Analytics at re:Invent 2022

Post Syndicated from Imtiaz Sayed original https://aws.amazon.com/blogs/big-data/your-guide-to-aws-analytics-at-reinvent-2022/

Join the global cloud community at AWS re:Invent this year to meet, get inspired, and rethink what’s possible!

Reserved seating is available for registered attendees to secure seats in the sessions of their choice. You can reserve a seat in your favorite sessions by signing in to the attendee portal and navigating to Event > Sessions. For those who can’t make it in person, you can get your free online pass to watch live keynotes and leadership sessions by registering for a virtual-only access. This curated attendee guide helps data and analytics enthusiasts manage their schedule*, as well as navigate the AWS analytics and business intelligence tracks to get the best out of re:Invent.

For additional session details, visit the AWS Analytics splash page.

#AWSanalytics, #awsfordata, #reinvent22

Keynotes

KEY002 | Adam Selipsky (CEO, Amazon Web Services) | Tuesday, November 29 | 8:30 AM – 10:30 AM

Join Adam Selipsky, CEO of Amazon Web Services, as he looks at the ways that forward-thinking builders are transforming industries and even our future, powered by AWS.

KEY003 | Swami Sivasubramanian (Vice President, AWS Data and Machine Learning) | Wednesday, November 30 | 8:30 AM – 10:30 AM

Join Swami Sivasubramanian, Vice President of AWS Data and Machine Learning, as he reveals the latest AWS innovations that can help you transform your company’s data into meaningful insights and actions for your business.

Leadership sessions

ANT203-L | Unlock the value of your data with AWS analytics | G2 Krishnamoorthy, VP of AWS Analytics | Wednesday, November 30 | 2:30 PM – 3:30 PM

G2 addresses the current state of analytics on AWS, covers the latest service innovations around data, and highlights customer successes with AWS analytics. Also, learn from organizations like FINRA and more who have turned to AWS for their digital transformation journey.

Breakout sessions

AWS re:Invent breakout sessions are lecture-style and one hour long sessions delivered by AWS experts, customers, and partners.

Monday, Nov 28 Tuesday, Nov 29 Wednesday, Nov 30 Thursday, Dec 1 Friday, Dec 2

10:00 AM – 11:00 AM

ANT326 | How BMW, Intuit, and Morningstar are transforming with AWS and Amazon Athena

11:00 AM – 12:00 PM

ANT301 | Democratizing your organization’s data analytics experience

10:00 AM – 11:00 AM

ANT212 | How JPMC and LexisNexis modernize analytics with Amazon Redshift

12:30 PM – 1:30 PM

ANT207 | What’s new in AWS streaming

8:30 AM – 9:30 AM

ANT311 | Building security operations with Amazon OpenSearch Service

11:30 AM – 12:30 PM

ANT206 | What’s new in Amazon OpenSearch Service

12:15 PM – 1:15 PM

ANT334 | Simplify and accelerate data integration and ETL modernization with AWS Glue

10:00 AM – 11:00 AM

ANT209 | Build interactive analytics applications

12:30 PM – 1:30 PM

BSI203 | Differentiate your apps with Amazon QuickSight embedded analytics

.

12:15 PM – 1:15 PM

ANT337 | Migrating to Amazon EMR to reduce costs and simplify operations

1:15 PM – 2:15 PM

ANT205 | Achieving your modern data architecture

10:45 AM – 11:45 AM

ANT218 | Leveling up computer vision and artificial intelligence development

1:15 PM – 2:15 PM

ANT336 | Building data mesh architectures on AWS

.

1:00 PM – 2:00 PM

ANT341 | How Riot Games processes 20 TB of analytics data daily on AWS

2:00 PM – 3:00 PM

BSI201 | Reinvent how you derive value from your data with Amazon QuickSight

11:30 AM – 12:30 PM

ANT340 | How Sony Orchard accelerated innovation with Amazon MSK

2:00 PM – 3:00 PM

ANT342 | How Poshmark accelerates growth via real-time analytics and personalization

.

1:45 PM – 2:45 PM

BSI207 | Get clarity on your data in seconds with Amazon QuickSight Q

2:45 PM – 3:45 PM

ANT339 | How Samsung modernized architecture for real-time analytics

1:00 PM – 2:00 PM

ANT201 | What’s new with Amazon Redshift

3:30 PM – 4:30 PM

ANT219 | Dow Jones and 3M: Observability with Amazon OpenSearch Service

.

3:15 PM – 4:15 PM

ANT302 | What’s new with Amazon EMR

3:30 PM – 4:30 PM

ANT204 | Enabling agility with data governance on AWS

2:30 PM – 3:30 PM

BSI202 | Migrate to cloud-native business analytics with Amazon QuickSight

. .

4:45 PM – 5:45 PM

ANT335 | How Disney Parks uses AWS Glue to replace thousands of Hadoop jobs

5:00 PM – 6:00 PM

ANT338 | Scaling data processing with Amazon EMR at the speed of market volatility

4:45 PM – 5:45 PM

ANT324 | Modernize your data warehouse

. .

5:30 PM – 6:30 PM

ANT220 | Using Amazon AppFlow to break down data silos for analytics and ML

5:45 PM – 6:45 PM

ANT325 | Simplify running Apache Spark and Hive apps with Amazon EMR Serverless

5:30 PM – 6:30 PM

ANT317 | Self-service analytics with Amazon Redshift Serverless

. .

Chalk talks

Chalk talks are an hour long, highly interactive content format with a small audience. Each begins with a short lecture delivered by an AWS expert, followed by a Q&A session with the audience.

Monday, Nov 28 Tuesday, Nov 29 Wednesday, Nov 30 Thursday, Dec 1 Friday, Dec 2

12:15 PM – 1:15 PM

ANT303 | Security and data access controls in Amazon EMR

11:00 AM – 12:00 PM

ANT318 [Repeat] | Build event-based microservices with AWS streaming services

9:15 AM – 10:15 AM

ANT320 [Repeat] | Get better price performance in cloud data warehousing with Amazon Redshift

11:45 AM – 12:45 PM

ANT329 | Turn data to insights in seconds with secure and reliable Amazon Redshift

9:15 AM – 10:15 AM

ANT314 [Repeat] | Why and how to migrate to Amazon OpenSearch Service

12:15 PM – 1:15 PM

BSI401 | Insightful dashboards through advanced calculations with QuickSight

11:45 AM – 12:45 PM

BSI302 | Deploy your BI assets at scale to thousands with Amazon QuickSight

10:45 AM – 11:45 AM

ANT330 [Repeat] | Run Apache Spark on Kubernetes with Amazon EMR on Amazon EKS

1:15 PM – 2:15 PM

ANT401 | Ingest machine-generated data at scale with Amazon OpenSearch Service

10:00 AM – 11:00 AM

ANT322 [Repeat] | Simplifying ETL migration and data integration with AWS Glue

1:00 PM – 2:00 PM

ANT323 [Repeat] | Break through data silos with Amazon Redshift

1:15 PM – 2:15 PM

ANT327 | Modernize your analytics architecture with Amazon Athena

12:15 PM – 1:15 PM

ANT323 [Repeat] | Break through data silos with Amazon Redshift

2:00 PM – 3:00 PM

ANT333 [Repeat] | Build a serverless data streaming workload with Amazon Kinesis

..

1:45 PM – 2:45 PM

ANT319 | Democratizing ML for data analysts

2:45 PM – 3:45 PM

ANT320 [Repeat] | Get better price performance in cloud data warehousing with Amazon Redshift

4:00 PM – 5:00 PM

ANT314 [Repeat] | Why and how to migrate to Amazon OpenSearch Service

.2:00 AM – 3:00 PM

ANT330 [Repeat] | Run Apache Spark on Kubernetes with Amazon EMR on Amazon EKS

.

1:45 PM – 2:45 PM

ANT322 [Repeat] | Simplifying ETL migration and data integration with AWS Glue

2:45 PM – 3:45 PM

BSI301 | Architecting multi-tenancy for your apps with Amazon QuickSight

4:45 PM – 5:45 PM

ANT333 [Repeat] | Build a serverless data streaming workload with Amazon Kinesis

. .

5:30 PM – 6:30 PM

ANT315 | Optimizing Amazon OpenSearch Service domains for scale and cost

4:15 PM – 5:15 PM

ANT304 | Run serverless Spark workloads with AWS analytics

4:45 PM – 5:45 PM

ANT331 | Understanding TCO for different Amazon EMR deployment models

. .
.

5:00 PM – 6:00 PM

ANT328 | Build transactional data lakes using open-table formats in Amazon Athena

4:45 PM – 5:45 PM

ANT321 | What’s new in AWS Lake Formation

. .
. .

7:00 PM – 8:00 PM

ANT318 [Repeat] | Build event-based microservices with AWS streaming services

. .

Builders’ sessions

These are one-hour small-group sessions with up to nine attendees per table and one AWS expert. Each builders’ session begins with a short explanation or demonstration of what you’re going to build. Once the demonstration is complete, bring your laptop to experiment and build with the AWS expert.

Monday, Nov 28 Tuesday, Nov 29 Wednesday, Nov 30 Thursday, Dec 1 Friday, Dec 2
………………………….

11:00 AM – 12:00 PM

ANT402 | Human vs. machine: Amazon Redshift ML inferences

1:00 PM – 2:00 PM

ANT332 | Build a data pipeline using Apache Airflow and Amazon EMR Serverless

11:00 AM – 12:00 PM

ANT316 [Repeat] | How to build dashboards for machine-generated data

………………………
. .

7:00 PM – 8:00 PM

ANT316 [Repeat] | How to build dashboards for machine-generated data

. .

Workshops

Workshops are two-hour interactive sessions where you work in teams or individually to solve problems using AWS services. Each workshop starts with a short lecture, and the rest of the time is spent working the problem. Bring your laptop to build along with AWS experts.

Monday, Nov 28 Tuesday, Nov 29 Wednesday, Nov 30 Thursday, Dec 1 Friday, Dec 2

10:00 AM – 12:00 PM

ANT306 [Repeat] | Beyond monitoring: Observability with operational analytics

11:45 AM – 1:45 PM

ANT313 | Using Apache Spark for data science and ML workflows with Amazon EMR

8:30 AM – 10:30 AM

ANT307 | Improve search relevance with ML in Amazon OpenSearch Service

11:00 AM – 1:00 PM

ANT403 | Event detection with Amazon MSK and Amazon Kinesis Data Analytics

8:30 AM – 10:30 AM

ANT309 [Repeat]| Build analytics applications using Apache Spark with Amazon EMR Serverless

4:00 PM – 6:00 PM

ANT309 [Repeat]| Build analytics applications using Apache Spark with Amazon EMR Serverless

2:45 PM – 4:45 PM

ANT310 [Repeat] | Build a data mesh with AWS Lake Formation and AWS Glue

12:15 PM – 2:15 PM

ANT306 [Repeat] | Beyond monitoring: Observability with operational analytics

11:45 AM – 1:45 PM

BSI205 | Build stunning customized dashboards with Amazon QuickSight

.
. .

12:15 PM – 2:15 PM

ANT312 | Near real-time ML inferences with Amazon Redshift

2:45 PM – 4:45 PM

ANT308 | Seamless data sharing using Amazon

.
. .

5:30 PM – 7:30 PM

ANT310 [Repeat] | Build a data mesh with AWS Lake Formation and AWS Glue

. .
. .

5:30 PM – 7:30 PM

BSI303 | Seamlessly embed analytics into your apps with Amazon QuickSight

. .

* All schedules are in PDT time zone.

AWS Analytics & Business Intelligence kiosks

Join us at the AWS Analytics Kiosk in the AWS Village at the Expo. Dive deep into AWS Analytics with AWS subject matter experts, see the latest demos, ask questions, or just drop by to socially connect with your peers.


About the author

Imtiaz (Taz) Sayed is the WW Tech Leader for Analytics at AWS. He enjoys engaging with the community on all things data and analytics. He can be reached via
LinkedIn.

Hands-On IoT Hacking: Rapid7 at DEF CON 30 IoT Village, Pt. 3

Post Syndicated from Deral Heiland original https://blog.rapid7.com/2022/11/01/hands-on-iot-hacking-rapid7-at-def-con-30-iot-village-pt-3/

Hands-On IoT Hacking: Rapid7 at DEF CON 30 IoT Village, Pt. 3

Welcome back to our blog series on Rapid7’s IoT Village exercise from DEF CON 30. In our previous posts, we covered how to achieve access to flash memory and how to extract file system data from the device. In this post, we’ll cover how to modify the data we’ve extracted.

Modify extracted file systems data

Now that you have unsquashfs’d the Squash file system, the next step is to take a look at the extracted file system and its general structure. In our example, the unsquashed file system is located at /root/Desktop/Work/squashfs-root. To see the structure, while in the folder /Desktop/Work, you can run the following command to change director and then list the file and folders:

  • cd squashfs-root
  • ls -al

As you can see, we have unpacked a copy of the squash file system containing the embedded Linux root file system that was installed on the cable modem for the ARM processor.

The next goal will be to make the following three changes so we can eventually gain access to the cable modem via SSH:

  1. Create or add a dropbear_rsa_key to squashfs.
  2. Remove symbolic link to passwd and recreate it.
  3. Modify the inittab file to launch dropbear on startup.

To make these changes, you will first need to change the directory to the squashfs-root folder. In our IoT Village exercise example, that folder was “~/Desktop/Work/squashfs-root/etc”, and the attendees used the following command:

  • cd ~/Desktop/Work/squashfs-root/etc

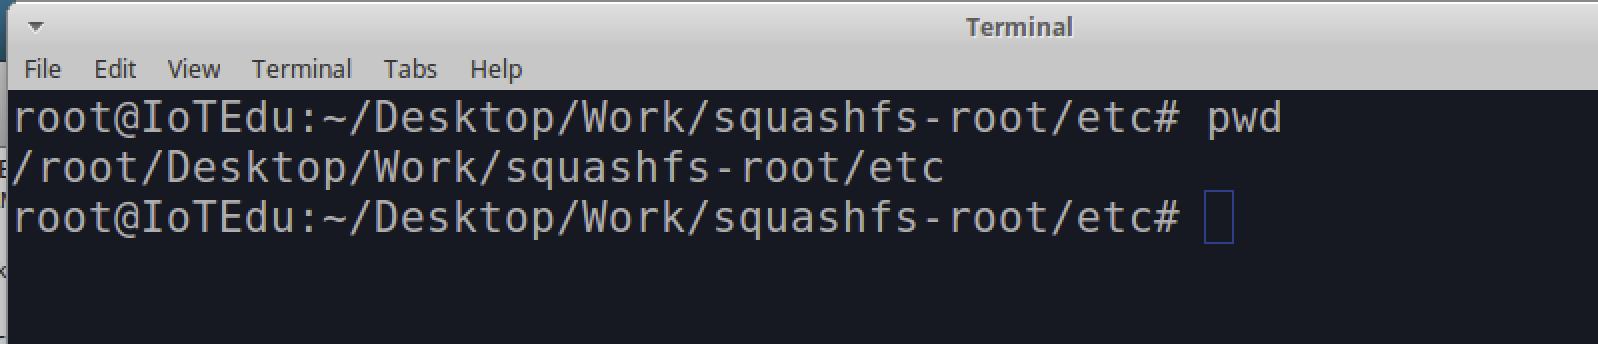
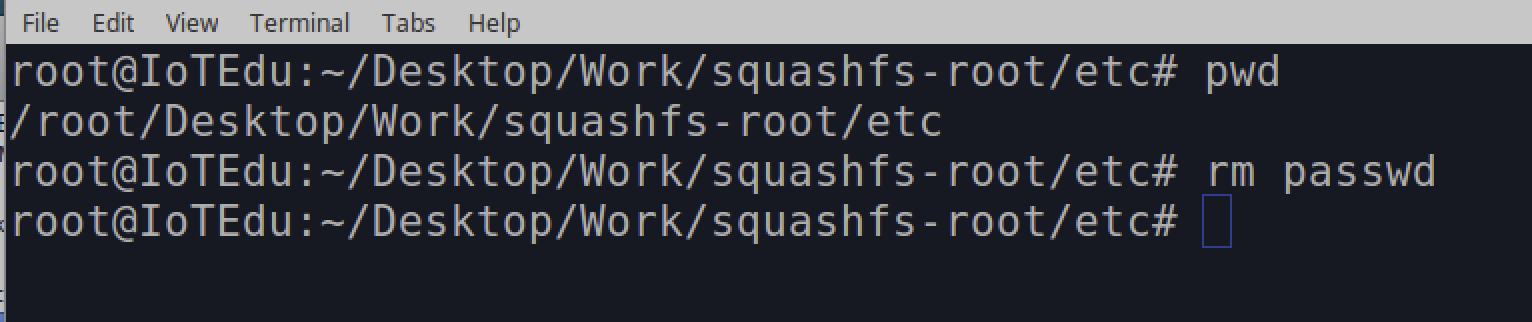
It is critical that you are in the correct directory and not in the etc directory of your local host before running any of the following commands to avoid potential damage to your laptop or desktop’s configuration. You can validate this by entering the command “pwd”, which allows you to examine the returned path results as shown below:

  • pwd
Hands-On IoT Hacking: Rapid7 at DEF CON 30 IoT Village, Pt. 3

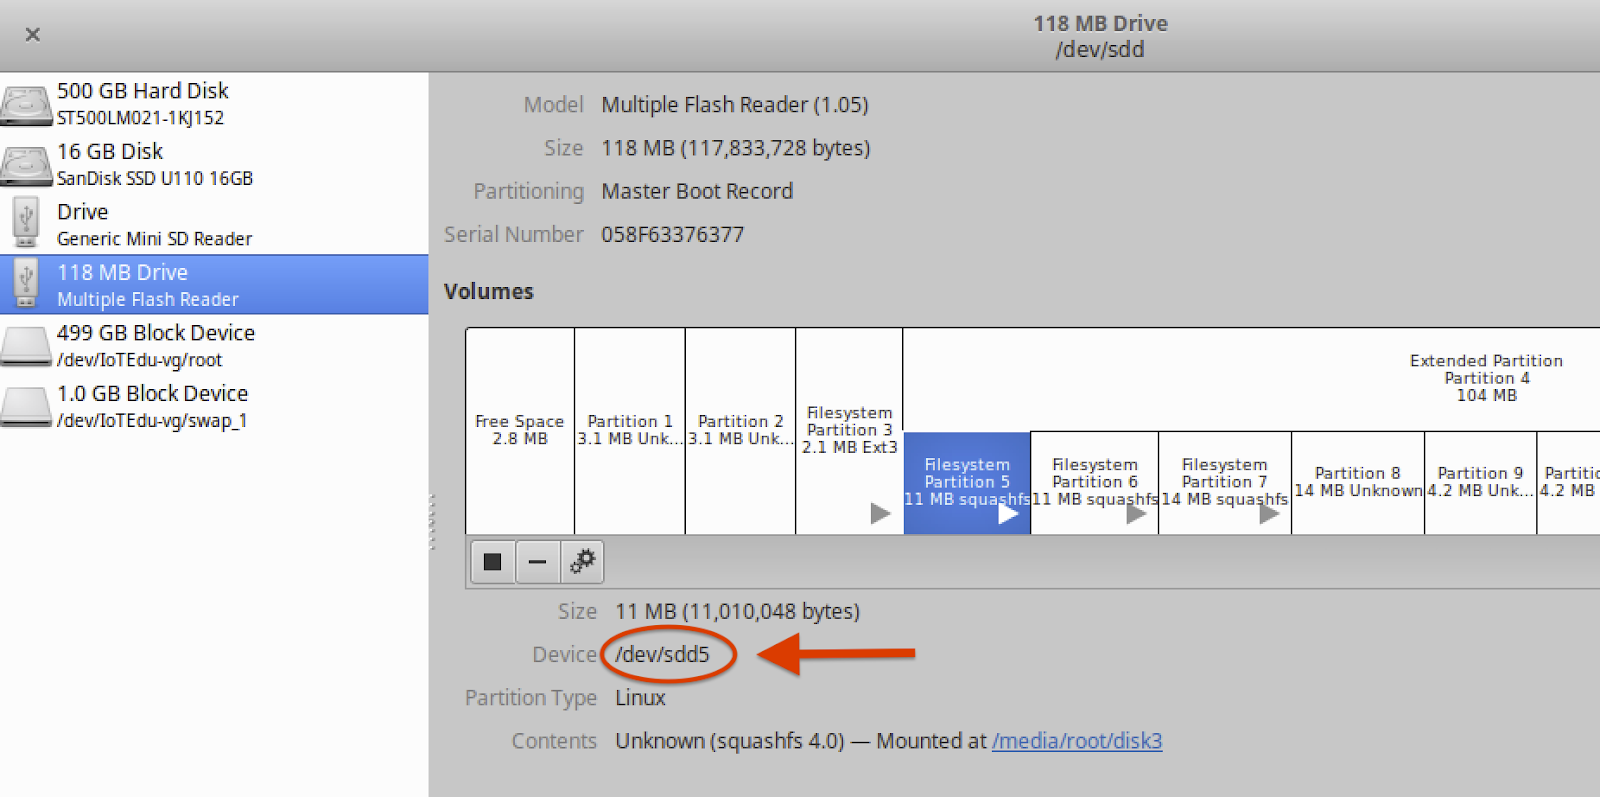
The next thing we need to do is locate a copy of the dropbear_rsa_key file and copy it over to “~/Desktop/Work/squashfs-root/etc”. This RSA key is needed to support dropbear services, which allow SSH communication to the cable modem. It turns out that a usable copy of dropbear_rsa_key file is located within the etc folder on Partition 12, which in our example was found to be mounted at /media/root/disk/etc. You can use the application Disks to confirm the location of the mount point for Partition 12, similar to the method we used for Partition 5 shown in Figure 4.

By running the following command during the IoT Village exercise, attendees were successfully able to copy the dropbear_rsa_key from Partition 12 into “~/Desktop/Work/squashfs-root/etc/”:

  • cp /media/root/disk/etc/dropbear_rsa_key .
Hands-On IoT Hacking: Rapid7 at DEF CON 30 IoT Village, Pt. 3

Next, we had participants remove the symbolic linked passwd file and create a new passwd file that points to the correct shell. Originally, the symbolic link pointed to a passwd file that pointed the root user to a shell that prevented root from accessing the system. By changing the passwd file, we can assign a usable shell environment to the root user.

Like above, the first step is to make sure you are in the correct folder listed below:

“~/Desktop/Work/squashfs-root/etc”

Once you have validated that you are in the correct folder, you can run the following command to delete the passwd file from the squash file systems:

  • rm passwd
Hands-On IoT Hacking: Rapid7 at DEF CON 30 IoT Village, Pt. 3

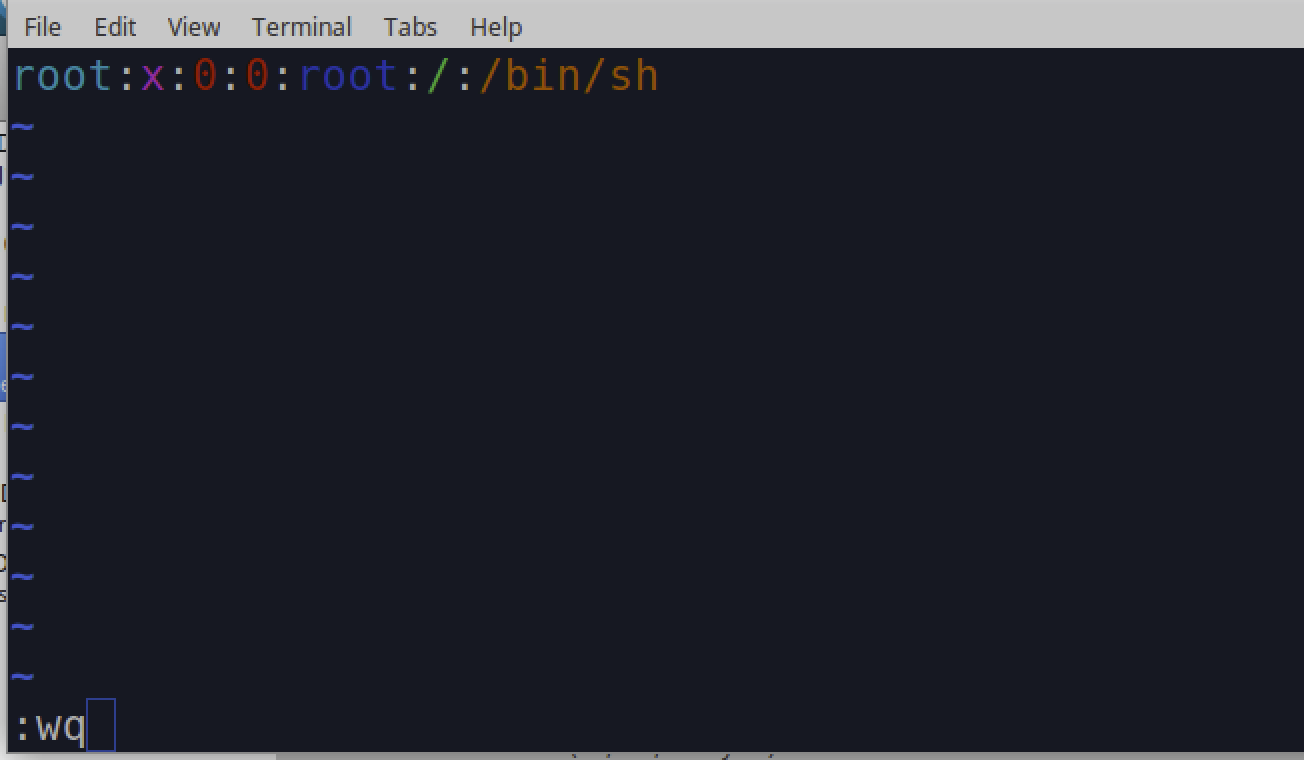
Once this is deleted, you can next create a new passwd file and add the following data to this file as shown below using vi:

Note: Here is a list of common vi interaction commands that are useful when working within vi:

  • i = insert mode. This allows you to enter data in the file
  • esc key will exit insert mode
  • esc key followed by entering :wq and then the enter key will write and exit vi
  • esc key followed dd will delete the line you are on
  • esc key followed x will single character
  • esc key followed shift a will place you in append insert mode at the end of the line
  • esc key followed a will place you in append insert mode at the point of your cursor
  • vi passwd

Once in vi, add the following line:

root:x:0:0:root:/:/bin/sh

Hands-On IoT Hacking: Rapid7 at DEF CON 30 IoT Village, Pt. 3

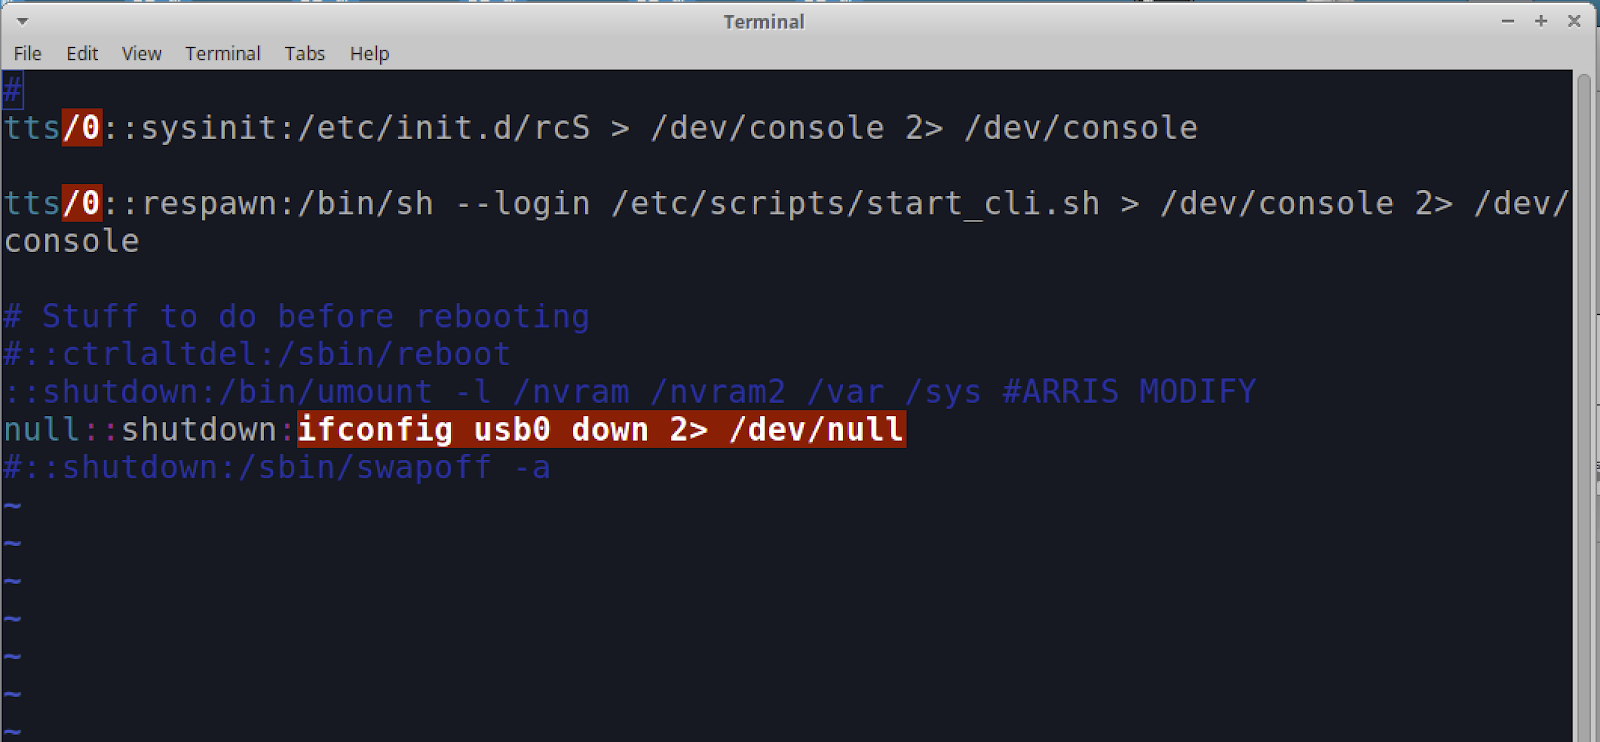
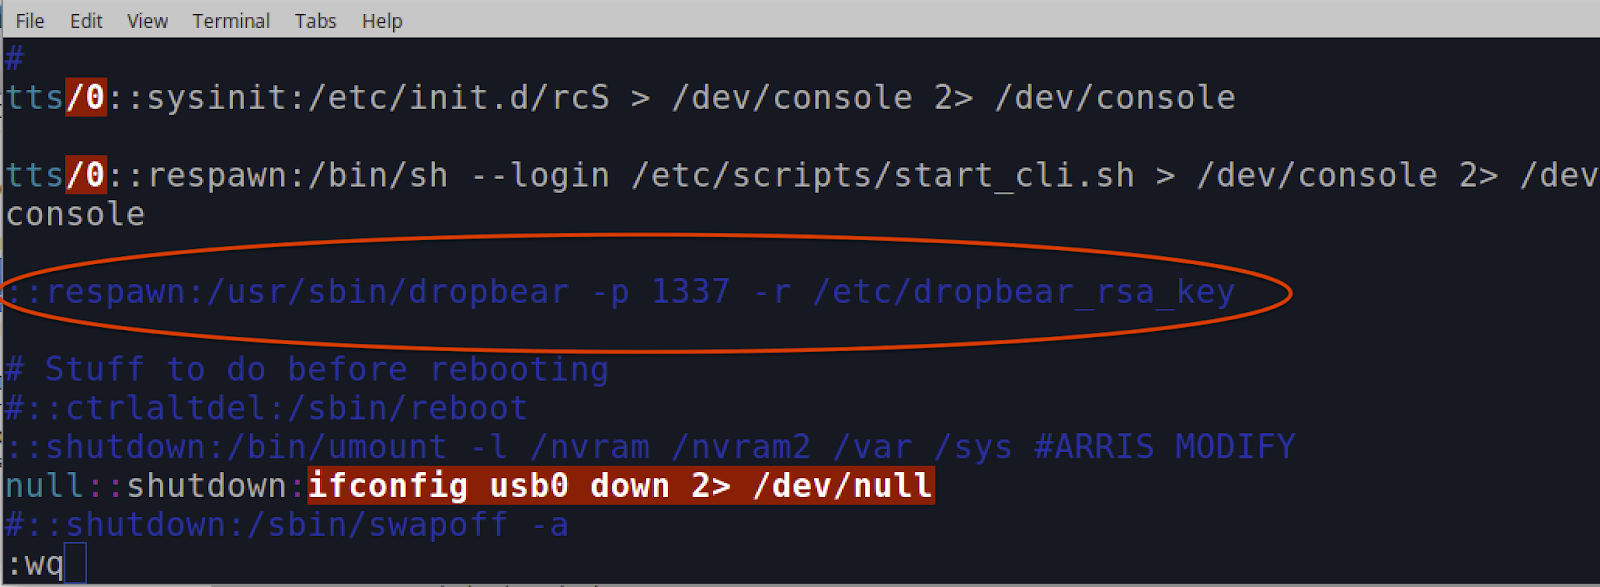
Next, we need to alter the inittab file. Again, make sure you are currently in the folder “/root/Desktop/Work/squashfs-root/etc”. Once this is validated, you can use vi to open and edit the inittab file.

  • vi inittab

The file should originally look like this:

Hands-On IoT Hacking: Rapid7 at DEF CON 30 IoT Village, Pt. 3

You will need to add the following line to the file:

::respawn:/usr/sbin/dropbear -p 1337 -r /etc/dropbear_rsa_key

Add the line as shown below, and save the file:

Hands-On IoT Hacking: Rapid7 at DEF CON 30 IoT Village, Pt. 3

Once you’ve completed all these changes, double-check them to make sure they are correct before moving on to the next sections. This will help avoid the need to redo everything if you made an incorrect alteration.

If everything looks correct, it’s time to move repack the squash file system and write the data back to Partition 5 on the cable modem.

Repacking squash file system and rewriting back to Modem

In this step, you will be repacking the squash file system and using the Linux dd command to write the image back to the cable modems NAND Flash memory.

The first thing you will need to do is change the directory back to the working folder – in our example, that is “/Desktop/Work”. This can be done from the current location of “~/Desktop/Work/squashfs-root/etc” by running the following command:

  • cd ../../
Hands-On IoT Hacking: Rapid7 at DEF CON 30 IoT Village, Pt. 3

Next, you’ll use the command “mksquashfs” to repack the squash folder into a binary file called new-P5.bin. To do this, run the following command from the “/Desktop/Work” folder that you should currently be in.

  • mksquashfs squashfs-root/ new-P5.bin
Hands-On IoT Hacking: Rapid7 at DEF CON 30 IoT Village, Pt. 3

Once the above command has completed, you should have a file called new-P5.bin. This binary file contains the squashfs-root folder properly packed and ready to be copied back onto the cable modem partition 5.

Note: If for some reason you think you have made a mistake and need to rerun the “mksquashfs” command, make sure you delete the new-P5.bin file first. “mksquashfs” will not overwrite the file, but it will append the data to it. If this happens it will cause the new-P5.bin images to have duplicates of all the files which will cause your attempt to gain root access to fail. So, if you rerun mksquashfs make sure to delete the old new-P5.bin file first.

One you have run the mksquashfs and have a new-P5.bin file containing the repacked squashfs, you’ll use the Linux dd command to write the binary file back to the cable modem partition 5.

To complete this step, first make sure you have identified the correct “Device:” location using the method shown in Figure 7 from part 2 of this blog series.

Hands-On IoT Hacking: Rapid7 at DEF CON 30 IoT Village, Pt. 3

In this example, the “Device:” was determined to be sdd5. So we can write the binary images by running the following dd command:

  • dd if=new-P5.bin of=/dev/sdd5
Hands-On IoT Hacking: Rapid7 at DEF CON 30 IoT Village, Pt. 3

Once the dd command completes, the modified squash file system image should now be written on the modem’s NAND flash memory chip. Before proceeding, disconnect the SD Card reader from the cable modem as shown below.

Note: Attaching the SD Card Reader and 12V power supply to the cable modem at the same time will damage the cable modem and render it nonfunctional.

Hands-On IoT Hacking: Rapid7 at DEF CON 30 IoT Village, Pt. 3

In our next and final post in this series, we’ll cover how to gain root access over the device’s secure shell protocol (SSH). Check back with us next week!

Export historical Security Hub findings to an S3 bucket to enable complex analytics

Post Syndicated from Jonathan Nguyen original https://aws.amazon.com/blogs/security/export-historical-security-hub-findings-to-an-s3-bucket-to-enable-complex-analytics/

AWS Security Hub is a cloud security posture management service that you can use to perform security best practice checks, aggregate alerts, and automate remediation. Security Hub has out-of-the-box integrations with many AWS services and over 60 partner products. Security Hub centralizes findings across your AWS accounts and supported AWS Regions into a single delegated administrator account in your aggregation Region of choice, creating a single pane of glass to consolidate and view individual security findings.

Because there are a large number of possible integrations across accounts and Regions, your delegated administrator account in the aggregation Region might have hundreds of thousands of Security Hub findings. To perform complex analytics or machine learning across the existing (historical) findings that are maintained in Security Hub, you can export findings to an Amazon Simple Storage Service (Amazon S3) bucket. To export new findings that have recently been created, you can implement the solution in the aws-security-hub-findings-export GitHub repository. However, Security Hub has data export API rate quotas, which can make exporting a large number of findings challenging.

In this blog post, we provide an example solution to export your historical Security Hub findings to an S3 bucket in your account, even if you have a large number of findings. We walk you through the components of the solution and show you how to use the solution after deployment.

Prerequisites

To deploy the solution, complete the following prerequisites:

  1. Enable Security Hub.
  2. If you want to export Security Hub findings for multiple accounts, designate a Security Hub administrator account.
  3. If you want to export Security Hub findings across multiple Regions, enable cross-Region aggregation.

Solution overview and architecture

In this solution, you use the following AWS services and features:

  • Security Hub export orchestration
    • AWS Step Functions helps you orchestrate automation and long-running jobs, which are integral to this solution. You need the ability to run a workflow for hours due to the Security Hub API rate limits and number of findings and objects.
    • AWS Lambda functions handle the logic for exporting and storing findings in an efficient and cost-effective manner. You can customize Lambda functions to most use cases.
  • Storage of exported findings
  • Job status tracking
    • Amazon EventBridge tracks changes in the status of the Step Functions workflow. The solution can run for over 100 hours; by using EventBridge, you don’t have to manually check the status.
    • Amazon Simple Notification Service (Amazon SNS) sends you notifications when the long-running jobs are complete or when they might have issues.
    • AWS Systems Manager Parameter Store provides a quick way to track overall status by maintaining a numeric count of successfully exported findings that you can compare with the number of findings shown in the Security Hub dashboard.

Figure 1 shows the architecture for the solution, deployed in the Security Hub delegated administrator account in the aggregation Region. The figure shows multiple Security Hub member accounts to illustrate how you can export findings for an entire AWS Organizations organization from a single delegated administrator account.

Figure 1: High-level overview of process and resources deployed in the Security Hub account

Figure 1: High-level overview of process and resources deployed in the Security Hub account

As shown in Figure 1, the workflow after deployment is as follows:

  1. The Step Functions workflow for the Security Hub export is invoked.
  2. The Step Functions workflow invokes a single Lambda function that does the following:
    1. Retrieves Security Hub findings that have an Active status and puts them in a temporary file.
    2. Pushes the file as an object to Amazon S3.
    3. Adds the global count of exported findings from the Step Functions workflow to a Systems Manager parameter for validation and tracking purposes.
    4. Repeats steps b–c for about 10 minutes to get the most findings while preventing the Lambda function from timing out.
    5. If a nextToken is present, pushes the nextToken to the output of the Step Functions.

      Note: If the number of items in the output is smaller than the number of items returned by the API call, then the return output includes a nextToken, which can be passed to a subsequent command to retrieve the next set of items.

  3. The Step Functions workflow goes through a Choice state as follows:
    • If a Security Hub nextToken is present, Step Functions invokes the Lambda function again.
    • If a Security Hub nextToken isn’t present, Step Functions ends the workflow successfully.
  4. An EventBridge rule tracks changes in the status of the Step Functions workflow and sends events to an SNS topic. Subscribers to the SNS topic receive a notification when the status of the Step Functions workflow changes.

Deploy the solution

You can deploy the solution through either the AWS Management Console or the AWS Cloud Development Kit (AWS CDK).

To deploy the solution (console)

  • In your delegated administrator Security Hub account, launch the AWS CloudFormation template by choosing the following Launch Stack button. It will take about 10 minutes for the CloudFormation stack to complete.

    Launch Stack

    Note: The stack will launch in the US East (N. Virginia) Region (us-east-1). If you are using cross-Region aggregation, deploy the solution into the Region where Security Hub findings are consolidated. You can download the CloudFormation template for the solution, modify it, and deploy it to your selected Region.

To deploy the solution (AWS CDK)

  1. Download the code from our aws-security-hub-findings-historical-export GitHub repository, where you can also contribute to the sample code. The CDK initializes your environment and uploads the Lambda assets to Amazon S3. Then, you deploy the solution to your account.
  2. While you are authenticated in the security tooling account, run the following commands in your terminal. Make sure to replace <AWS_ACCOUNT> with the account number, and replace <REGION> with the AWS Region where you want to deploy the solution.
    cdk bootstrap aws://<AWS_ACCOUNT>/<REGION>
    cdk deploy SechubHistoricalPullStack

Solution walkthrough and validation

Now that you’ve successfully deployed the solution, you can see each aspect of the automation workflow in action.

Before you start the workflow, you need to subscribe to the SNS topic so that you’re notified of status changes within the Step Functions workflow. For this example, you will use email notification.

To subscribe to the SNS topic

  1. Open the Amazon SNS console.
  2. Go to Topics and choose the Security_Hub_Export_Status topic.
  3. Choose Create subscription.
  4. For Protocol, choose Email.
  5. For Endpoint, enter the email address where you want to receive notifications.
  6. Choose Create subscription.
  7. After you create the subscription, go to your email and confirm the subscription.

You’re now subscribed to the SNS topic, so any time that the Step Functions status changes, you will receive a notification. Let’s walk through how to run the export solution.

To run the export solution

  1. Open the Amazon Step Functions console.
  2. In the left navigation pane, choose State machines.
  3. Choose the new state machine named sec_hub_finding_export.
  4. Choose Start execution.
  5. On the Start execution page, for Name – optional and Input – optional, leave the default values and then choose Start execution.
    Figure 2: Example input values for execution of the Step Functions workflow

    Figure 2: Example input values for execution of the Step Functions workflow

  6. This will start the Step Functions workflow and redirect you to the Graph view. If successful, you will see that the overall Execution status and each step have a status of Successful.
  7. For long-running jobs, you can view the CloudWatch log group associated with the Lambda function to view the logs.
  8. To track the number of Security Hub findings that have been exported, open the Systems Manager console, choose Parameter Store, and then select the /sechubexport/findingcount parameter. Under Value, you will see the total number of Security Hub findings that have been exported, as shown in Figure 3.
    Figure 3: Systems Manager Parameter Store value for the number of Security Hub findings exported

    Figure 3: Systems Manager Parameter Store value for the number of Security Hub findings exported

Depending on the number of Security Hub findings, this process can take some time. This is primarily due to the GetFindings quota of 3 requests per second. Each GetFindings request can return a maximum of 100 findings, so this means that you can get up to 300 findings per second. On average, the solution can export about 1 million findings per hour. If you have a large number of findings, you can start the finding export process and wait for the SNS topic to notify you when the process is complete.

How to customize the solution

The solution provides a general framework to help you export your historical Security Hub findings. There are many ways that you can customize this solution based on your needs. The following are some enhancements that you can consider.

Change the Security Hub finding filter

The solution currently pulls all findings with RecordState: ACTIVE, which pulls the active Security Hub findings in the AWS account. You can update the Lambda function code, specifically the finding_filter JSON value within the create_filter function, to pull findings for your use case. For example, to get all active Security Hub findings from the AWS Foundational Security Best Practices standard, update the Lambda function code as follows.

{
                 WorkflowState: [
                     {
                         "Value": "NEW ",
                         "Comparison": "EQUALS"
                     },
                 ],
                 "RecordState": [
                     {
                         "Value": "ACTIVE",
                         "Comparison": "EQUALS"
                     },
                 ]
            }

Export more than 100 million Security Hub findings

The example solution can export about 100 million Security Hub findings. This number is primarily determined by the speed at which findings can be exported, due to the following factors:

If you want to export more than 100 million Security Hub findings, do one of the following:

Note: If you implement either of these solutions, make sure that the nextToken also gets passed to the new Step Functions execution by updating the Lambda function code to parse and pass the nextToken received in the last request.

Speed up the export

One way to increase the export bandwidth, and reduce the overall execution time, is to run the export job in parallel across the individual Security Hub member accounts rather than from the single delegated administrator account.

You could use CloudFormation StackSets to deploy this solution in each Security Hub member account and send the findings to a centralized S3 bucket. You would need to modify the solution to allow an S3 bucket to be provided as an input, and all the Lambda function Identity and Access Management (IAM) roles would need cross-account access to the S3 bucket and corresponding AWS Key Management Service (AWS KMS) key. You would also need to make updates in each member account to iterate through the various Regions in which the Security Hub findings exist.

Next steps

The solution in this post is designed to assist in the retrieval and export of all existing findings currently in Security Hub. After you successfully run this solution to export historical findings, you can continuously export new Security Hub findings by using the sample solution in the aws-security-hub-findings-export GitHub repository.

Now that you’ve exported the Security Hub findings, you can set up and run custom complex reporting or queries against the S3 bucket by using Amazon Athena and AWS Glue. Additionally, you can run machine learning and analytics capabilities by using services like Amazon SageMaker or Amazon Lookout for Metrics.

Conclusion

In this post, you deployed a solution to export the existing Security Hub findings in your account to a central S3 bucket, so that you can apply complex analytics and machine learning to those findings. We walked you through how to use the solution and apply it to some example use cases after you successfully exported existing findings across your AWS environment. Now your security team can use the data in the S3 bucket for predictive analytics and determine if there are Security Hub findings and specific resources that might need to be prioritized for review due to a deviation from normal behavior. Additionally, you can use this solution to enable more complex analytics on multiple fields by querying large and complex datasets with AWS Athena.

If you have feedback about this post, submit comments in the Comments section below. If you have questions about this post, start a thread on AWS Security Hub re:Post.

 
Want more AWS Security news? Follow us on Twitter.

Jonathan Nguyen

Jonathan Nguyen

Jonathan is a Shared Delivery Team Senior Security Consultant at AWS. His background is in AWS Security with a focus on threat detection and incident response. Today, he helps enterprise customers develop a comprehensive security strategy and deploy security solutions at scale, and he trains customers on AWS Security best practices.

The collective thoughts of the interwebz