Privacy video: Innovating securely

Post Syndicated from Chad Woolf original https://aws.amazon.com/blogs/security/privacy-video-innovating-securely/

I’m pleased to share a video of a conversation about privacy I had with my colleague Laura Dawson, the North American Lead at the AWS Institute. Privacy is becoming more of a strategic issue for our customers, similar to how security is today. We discussed how, while the two topics are similar in some ways, they also have important differences. We also talked about the importance of building a strong privacy program, and how AWS helps customers safeguard privacy while still taking advantage of digital modernization opportunities.

The differences between security and privacy aren’t fully understood in some industries. Security principles are better known in the industry – security involves considering the confidentiality, integrity, and availability of information. It’s about keeping unauthorized parties away from your data, and about making sure access to your systems and data is appropriate. Similarly, privacy is about control of data through its entire lifecycle, specifically personal identifiable information (PII). That includes the collection, use, transmission, and deletion of that data. Properly managing the privacy of PII is like security when you consider the “access control” aspect, but privacy is about making sure you always have granular control of what is happening to that PII from formation/gathering through to deletion.

Unlike security, which is now commonly recognized as a core business function, privacy practices and principles are still in the early stages of being widely accepted. This is why AWS advocates for organizations to follow the principles of Privacy by Design, to ensure that privacy processes and controls are baked into everything you do.

I also discussed with Laura some of the privacy trends I see happening in the tech industry right now, such as homomorphic encryption, anonymization, and PII discovery tools. The privacy challenges organizations face today, however, aren’t just technology challenges; they’re also business challenges, of how to get value from the data you control, in a way that meets privacy best practices and accounts for your customers’ interests.

For more about these and other privacy topics, check out the video of my conversation with Laura. To learn more about privacy at AWS, check out the Data Privacy Center and Data Protection at AWS.

Author

Chad Woolf

Chad joined Amazon in 2010 and built the AWS compliance functions from the ground up, including audit and certifications, privacy, contract compliance, control automation engineering and security process monitoring. Chad’s work also includes enabling public sector and regulated industry adoption of the AWS cloud and leads the AWS trade and product compliance team.

Haas: Surviving Without A Superuser – Part One

Post Syndicated from original https://lwn.net/Articles/878206/rss

PostgreSQL developer Robert Haas has begun
a blog series
on what would be needed to allow database administrators
to safely delegate superuser powers.

Consider, for example, the case of a service provider who would
like to support a database with multiple customers as tenants. The
customers will naturally want to feel as if they have the powers of
a true superuser, with the ability to do things like create new
roles, drop old ones, change permissions on objects that they don’t
own, and generally enjoy the freedom to bypass permission checks at
the SQL level which superusers enjoy. The service provider, who is
the true superuser, also wants this, but does not want the
customers to be able to do the really scary things that a superuser
can do, like changing archive_command to
rm -rf / or deleting the
entire contents of pg_proc so that the system crashes and the
database in which the operation was performed is permanently
ruined.

Load CDC data by table and shape using Amazon Kinesis Data Firehose Dynamic Partitioning

Post Syndicated from Anand Shah original https://aws.amazon.com/blogs/big-data/load-cdc-data-by-table-and-shape-using-amazon-kinesis-data-firehose-dynamic-partitioning/

Amazon Kinesis Data Firehose is the easiest way to reliably load streaming data into data lakes, data stores, and analytics services. Customers already use Amazon Kinesis Data Firehose to ingest raw data from various data sources using direct API call or by integrating Kinesis Data Firehose with Amazon Kinesis Data Streams including “change data capture” (CDC) use case.

Customers typically use single Kinesis Data Stream per business domain to ingest CDC data. For example, related fact and dimension tables change data is sent to the same stream. Once the data is loaded to Amazon S3, customers use ETL tools to split the data by tables, shape, and desired partitions as the first step in the data enrichment process.

This post demonstrates how customers can use Amazon Kinesis Firehose Dynamic Partitioning to split the data by table, shape (by message schema/version), and by desired partitions on the fly to do this first step of data enrichment while ingesting data.

Solution Overview

In this post, we provide a working example of a CDC pipeline where fake customer, order, and transaction table data is pushed from the source and registered as tables to the AWS Glue Data Catalog. The following architecture diagram illustrates this overall flow. We are using AWS Lambda to generate test CDC data for this post. However, in the real world you would use AWS Data Migration Service (DMS) or a similar tool to push change data to the Amazon Kinesis Data Stream.

The workflow includes the following steps:

  1. An Amazon EventBridge event triggers an AWS Lambda function every minute.
  2. The Lambda function generates test transactions, customers and order CDC data, as well as sends the data to Amazon Kinesis Data Stream.
  3. Amazon Kinesis Data Firehose reads data from Amazon Kinesis Data Stream.
  4. Amazon Kinesis Data Firehose
    1. Applies Dynamic Partitioning configuration defined in the Firehose configuration
    2. Invokes AWS Lambda transform to derive custom Dynamic Partitioning.
  5. Amazon Kinesis Data Firehose saves data to Amazon Simple Storage Service (S3) bucket.
  6. The user runs queries on Amazon S3 bucket data using Amazon Athena, which internally uses the AWS Glue Data Catalog to supply meta data.

Deploying using AWS CloudFormation

You use CloudFormation templates to create all of the necessary resources for the data pipeline. This removes opportunities for manual error, increases efficiency, and ensures consistent configurations over time.

Steps to follow:

  1. Click here to Launch Stack:
  2. Acknowledge that the template may create AWS Identity and Access Management (IAM) resources.
  3. Choose Create stack.

This CloudFormation template takes about five minutes to complete and creates the following resources in your AWS account:

  • An S3 bucket to store ingested data
  • Lambda function to publish test data
  • Kinesis Data Stream connected to Kinesis Data Firehose
  • A Lambda function to compute custom dynamic partition for Kinesis Data Firehose transform
  • AWS Glue Data Catalog tables and Athena named queries for you to query data processed by this example

Once the AWS CloudFormation stack creation is successful, you should be able to see data automatically arriving to Amazon S3 in about five more minutes.

Data sources input

The Lambda function automatically publishes four types of messages to the Kinesis Data Stream at regular intervals with random data when invoked in the following format. In this example, we use three tables:

  • Customers: Has basic customer details.
  • Orders: Mimics orders placed by customers on the shopping website or mobile app.
  • Transactions: Mimics payment transaction done for the order. The transaction table showcases possible message schema evolution that can happen over time from message schema v1 to v2. It also shows how you can split messages by schema version if you don’t want to merge them into a universal schema.

Customer table sample message

{
   "version": 1,
   "table": "Customer",
   "data": {
        "id": 1,
        "name": "John",
        "country": "US"
   }
}

Orders table sample message

{
   "version": 1,
   "table": "Order",
   "data": {
        "id": 1,
        "customerId": 1,
        "qty": 1,
        "product": {
            "name": "Book 54",
            "price": 12.6265
        }
   }
}

Transactions in old message format (v1)

{
    "version": 1, 
    "txid": "52", 
    "amount": 32.6516
}

Transactions in new message format (v2 – latest)

This message example demonstrates message evolution over time. txid from old message format is now renamed to transactionId, and new information like source is added to the original old transaction message in the new message version v2.

{
   "version": 2,
   "transactionId": "52",
   "amount": 32.6516,
   "source": "Web"
}

Dynamic Partitioning Logic

Amazon Kinesis Data Firehose dynamic partitioning configuration is defined using jq style syntax. We will use the table field for the first partition and the version field for the second level partition. We can derive the table partition using dynamic partitioning jq syntax “.version”. As you can see, the version field is available in all of the messages. Therefore, we can use it directly in partitioning. However, the table field is not available for old and new transaction messages. Therefore, we derive the table field using custom transform Lambda function.

We check the existence of the table field from the incoming message and populate it with the static value “Transaction” if table field is not present. Lambda function also returns PartitionKeys for Kinesis Data Firehose to use as dynamic partition. The Lambda function also derives the year, month, and day from the current time.

for firehose_record_input in firehose_records_input['records']:
    # Get user payload
    payload = base64.b64decode(firehose_record_input['data'])
    json_value = json.loads(payload)


    # Create output Firehose record and add modified payload and record ID to it.
    firehose_record_output = {}

    table = "Transaction"
    if "table" in json_value:
        table = json_value["table"]

    now = datetime.datetime.now()
    partition_keys = {"table": table, "year": str(now.year), "month": str(now.month), "day": str(now.day)}

The Kinesis Data Firehose S3 destination Prefix is set to table=!{partitionKeyFromLambda:table}/version=!{partitionKeyFromQuery:version}/year=!{partitionKeyFromLambda:year}/month=!{partitionKeyFromLambda:month}/day=!{partitionKeyFromLambda:day}/

  • table partition key is coming from the Lambda function based on custom logic.
  • version partition key is extracted using jq expression using Kinesis Data Firehose dynamic partition configuration. Here, the version refers to the shape of the message and not the version of the data. For example, Updates to Customer record with same ID is not merged into one.
  • year, month, and day partition keys are coming from the Lambda function based on current time

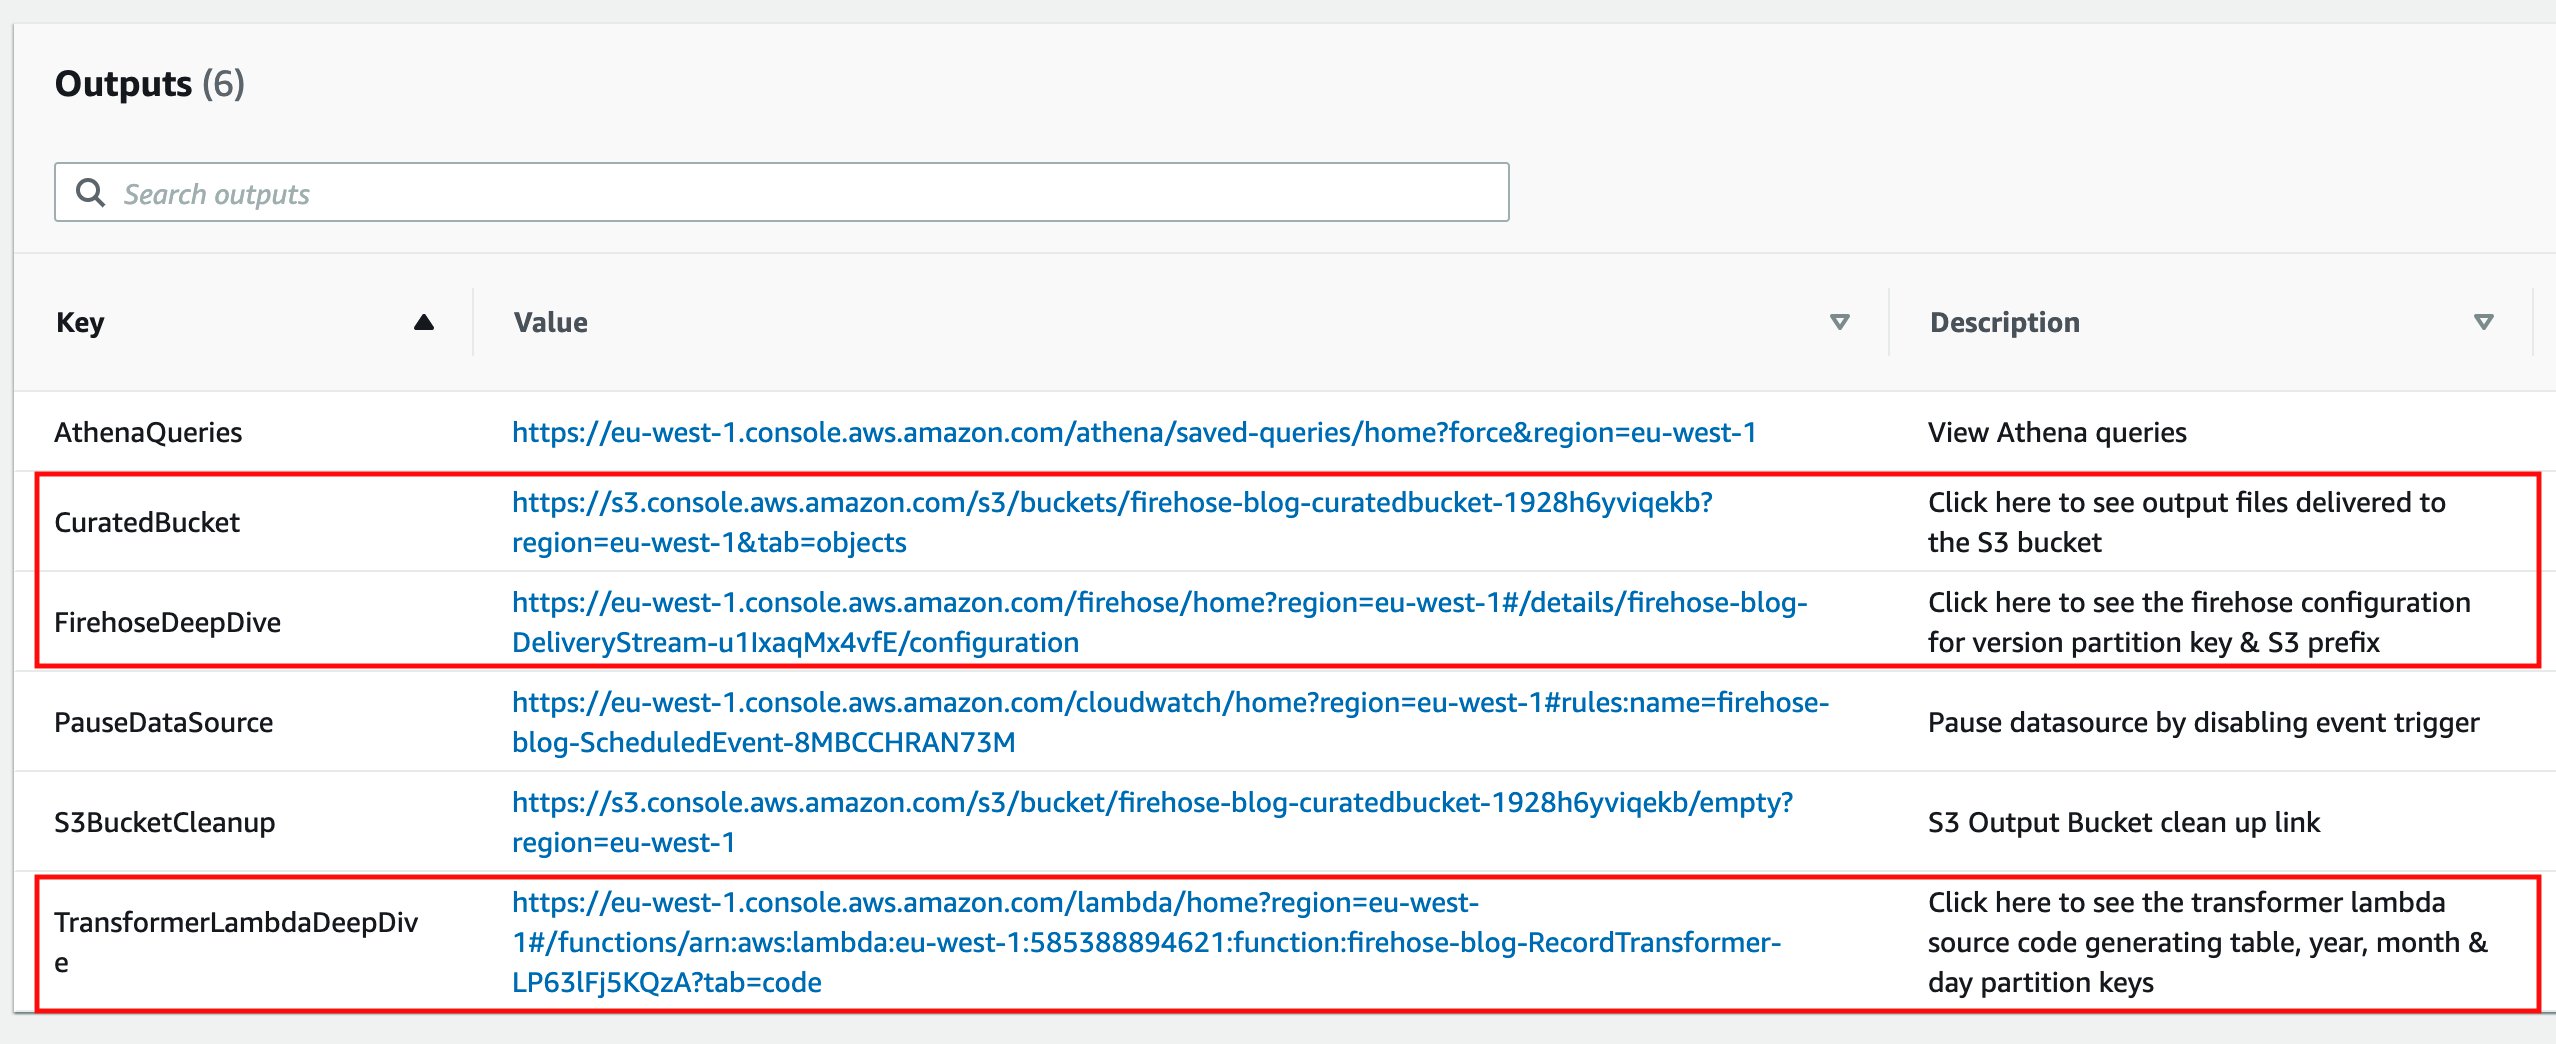
You can follow the respective links from the CloudFormation stack Output tab to deep dive into the Kinesis Data Firehose configuration, record transformer Lambda function source code, and see output files in the Amazon S3 curated bucket. The entire code is also available in the GitHub repository.

Ingested data output

Kinesis Data Firehose processes all the messages and outputs result in the following S3 hive style partitioned paths:

# AWS Glue Data Catalog table transactions_v1
s3://curated-bucket/table=transaction/version=1/year=2021/month=9/day=20/file-name.gz
# AWS Glue Data Catalog table transactions
s3://curated-bucket/table=transaction/version=2/year=2021/month=9/day=20/file-name.gz
# AWS Glue Data Catalog table customers
s3://curated-bucket/table=customer/version=1/year=2021/month=9/day=20/file-name.gz
# Glue catalog table orders
s3://curated-bucket/table=order/version=1/year=2021/month=9/day=20/file-name.gz

Query output data stored in Amazon S3

Kinesis Data Firehose loads new data every minute to the Amazon S3 bucket, and the associated tables are already created by CloudFormation for you in the AWS Glue Data Catalog. You can directly query Amazon S3 bucket data using the following steps:

  1. Go to Amazon Athena service and select the database with the same name as the CloudFormation stack name without dashes.
  2. Select the three dots next to each table name to open the table menu and select Load Partitions. This will add a new partition to the AWS Glue Data Catalog.
  3. Go to the CloudFormation stack Output tab.
  4. Select the link mentioned next to the key AthenaQueries.
  5. This will take you to the Amazon Athena saved query console. Type the word Blog to search named queries created by this blog.
  6. Select the query called “Blog – Query Customer Orders”. This will open the query in the Athena query console. Select Run query to see the results.
  7. Select the Saved queries menu from the top bar to go back to the Amazon Athena saved query console. Repeat the steps for other Blog queries to see results from the “new and old transactions” queries.

Clean up

Complete the following steps to delete your resources and stop incurring costs:

  1. Go to the CloudFormation stack Output tab.
  2. Select the link mentioned next to the key PauseDataSource. This will take you to the Amazon EventBridge event rules console.
  3. Select the Actions button from the top right menu bar and select Disable.
  4. Confirm the choice by clicking the Disable button again on the prompt. This will disable Amazon EventBridge event trigger that invokes the data generator Lambda function. This lets us make sure that no new data is sent to the Kinesis data stream by Lambda from now onward.
  5. Wait for at least two minutes for all of the buffered events to reach to the S3 from the Kinesis Data Firehose.
  6. Go back to the CloudFormation stack Output tab.
  7. Select the link mentioned next to the key S3BucketCleanup.

You’re redirected to the Amazon S3 console.

  1. Enter permanently delete to delete all of the objects in your S3 bucket.
  2. Choose Empty.
  3. On the AWS CloudFormation console, select the stack you created and choose Delete.

Summary

This post demonstrates how to use the Kinesis Data Firehose Dynamic Partitioning feature to load CDC data on the fly in near real-time. It also shows how we can split CDC data by table and message schema version for backward compatibility and quick query capability. To learn more about dynamic partitioning, you can refer to this blog and this documentation. Provide us with any feedback you have about the new feature.


About the Author

Anand Shah is a Big Data Prototyping Solution Architect at AWS. He works with AWS customers and their engineering teams to build prototypes using AWS Analytics services and purpose-built databases. Anand helps customers solve the most challenging problems using the art of the possible technology. He enjoys beaches in his leisure time.

SEEK Asia modernizes search with CI/CD and Amazon OpenSearch Service

Post Syndicated from Fabian Tan original https://aws.amazon.com/blogs/big-data/seek-asia-modernizes-search-with-ci-cd-and-amazon-opensearch-service/

This post was written in collaboration with Abdulsalam Alshallah (Salam), Software Architect, and Hans Roessler, Principal Software Engineer at SEEK Asia.

SEEK is a market leader in online employment marketplaces with deep and rich insights into the future of work. As a global business, SEEK has a presence in Australia, New Zealand, Hong Kong, Southeast Asia, Brazil and Mexico and its websites attract over 400 million visits per year. SEEK Asia’s business operates across seven countries and includes leading portal brands such as jobsdb.com and jobstreet.com and leverages data and technology to create innovative solutions for candidates and hirers.

In this post, we share how SEEK Asia modernized their search-based system with a continuous integration and continuous delivery (CI/CD) pipeline and Amazon OpenSearch Service (successor to Amazon Elasticsearch Service).

Challenges associated with a self-managed search system

SEEK Asia provides a search-based system that enables employers to manage interactions between hirers and candidates. Although the system was already on AWS, it was a self-managed system running on Amazon Elastic Compute Cloud (Amazon EC2) with limited automation.

The self-managed system posed several challenges:

  • Slower release cycles – Deploying new configurations or new field mappings into the Elasticsearch cluster was a high-risk activity because changes affected the stability of the system. The little automation on both the self-managed cluster and workflows led to slower release cycles.
  • Higher operational overhead – Sizing the cluster to deliver greater performance, while managing cost effectively, was the other challenge. As with every other distributed system, even with sizing guidance, identifying the appropriate number of shards per node and the number of nodes to meet performance requirements still required some amount of trial and error, turning the exercise into a tedious and time-consuming activity. This consequently also led to slower release cycles. To overcome this challenge, in many occasions, oversizing the cluster became the quickest way to achieve the desired time to market, at the expense of cost.

Further challenges the team faced with self-managing their own Elasticsearch cluster included keeping up with new security patches, and minor and major platform upgrades.

Automating search delivery with Amazon OpenSearch Service

SEEK Asia knew that automation would the key to solving the challenges of their existing search service. Automating the undifferentiated heavy lifting would enable them to deliver more value to their customers quickly and improve staff productivity.

With the problems defined, the team set out to solve the challenges by automating the following:

  • Search infrastructure deployment
  • Search A/B testing infrastructure deployment
  • Redeployment of search infrastructure for any new infrastructure configuration (such as security patches or platform upgrades) and index mapping updates

The key services enabling the automation would be Amazon OpenSearch Service and establishing a search infrastructure CI/CD pipeline.

Architecture overview

The following diagram illustrates the architecture of the SEEK infrastructure and CI/CD pipeline with Amazon OpenSearch Service.

The workflow includes the following steps:

  1. Before the workflow kicks off, an existing Amazon OpenSearch Service cluster with a live feeder hydrates it. The live feeder is a serverless application built on Amazon Simple Queue Service (Amazon SQS) via Amazon Simple Notification Service (Amazon SNS) and AWS Lambda. Amazon SQS queues documents for processing, Amazon SNS enables data fanout (if required), and a Lambda function is invoked to process messages in the SQS queue to import data into Amazon OpenSearch Service. The feeder receives live updates for changes that need to be reflected on the cluster. Write concurrency to Amazon OpenSearch Service is managed by limiting the number of concurrent Lambda function invocations.
  2. The Amazon OpenSearch Service index mapping is version controlled in SEEK’s Git repository. Whenever an update to the index mapping is committed, the CI/CD pipeline kicks off a new Amazon OpenSearch Service cluster provisioning workflow.
  3. As part of the workflow, a new data hydration initialization feeder is deployed. The initialization feeder construct is similar to the live feeder, with one additional component: a script that runs within the CI/CD pipeline to calculate the number of batches required to hydrate the newly provisioned Amazon OpenSearch Service cluster up to a specific timestamp. The feeder systems were designed to achieve idempotency processing. This meant unique identifiers (UIDs) from the source data stores are reused for each document, and duplicated documents update an existing document with the exact same values.
  4. At the same time as Step 3, an Amazon OpenSearch Service cluster is deployed. To accelerate the initial data hydration process temporarily, the new cluster may be sized two or three times larger against sizing guidance with shard replicas and index refresh interval disabled until the hydration process is complete. The existing Amazon OpenSearch Service cluster remains as is, which means that two clusters are running concurrently.
  5. The script inspects the number of documents the source data store has and groups the documents by batch sizes. SEEK identified that 1,000 documents per batch provided the optimal ingestion import time, after running numerous experiments.
  6. Each batch is represented as one message and is queued into Amazon SQS via Amazon SNS. Every message that lands in Amazon SQS invokes a Lambda function. The Lambda function queries a separate data store, builds the document, and loads it into Amazon OpenSearch Service. The more messages that go into the queue, the more functions are invoked. To create baselines that allowed for further indexing optimization, the team took the following configurations into consideration and reiterated to achieve higher ingestion performance:
    1. Memory of the Lambda function
    2. Size of batch
    3. Size of each document in the batch
    4. Size of cluster (memory, vCPU, and number of primary shards)
  7. With the initialization feeder running, new documents are streamed to the cluster until it is synced with the data source. Eventually, the newly provisioned Amazon OpenSearch Service cluster catches up and is in the same state as the existing cluster. The hydration is complete when there are no remaining messages in the SQS queue.
  8. The initialization feeder is deleted and the Amazon OpenSearch Service cluster is downsized automatically to complete the deployment workflow, with replica shards created and the index refresh interval configured.
  9. Live search traffic is routed to the newly provisioned cluster when A/B testing is enabled via the API layer built on Application Load Balancer, Amazon Elastic Container Service (Amazon ECS), and Amazon CloudFront. The API layer decouples the client interface from the backend implementation that runs on Amazon OpenSearch Service.

Improved time to market and other outcomes

With Amazon OpenSearch Service, SEEK was able to automate an entire cluster, complete with Kibana, in a secure, managed environment. If testing didn’t produce the desired results, the team could change the dimensions of the cluster horizontally or vertically using different instance offerings within minutes. This enabled them to perform stress tests quickly to identify the sweet spot between performance and cost of the workload.

“By integrating Amazon OpenSearch Service with our existing CI/CD tools, we’re able to fully automate our search function deployments, which accelerated software delivery time,” says Abdulsalam Alshallah, APAC Software Architect. “The newly found confidence in the modern stack, alongside improved engineering practices, allowed us to mitigate the risk of changes—improving our time to market by 89% with zero impact to uptime.”

With the adoption of Amazon OpenSearch Service, other teams also saw improvements, including the following:

  • Common Vulnerability and Exposure (CVE) has dropped to zero with Amazon OpenSearch Service handling the underlying hardware security updates on SEEK’s behalf, improving their security posture
  • Improved availability with the Amazon OpenSearch Service Availability Zone awareness feature

Conclusion

Amazon OpenSearch Service managed capabilities has helped SEEK Asia to improve customer experience with speed and automation. By removing the undifferentiated heavy lifting, teams can deploy changes quickly to their search engines, allowing customers to get the latest search features faster and ultimately contributing to the SEEK purpose of helping people live more productive working lives and organisations succeed.

To learn more about Amazon OpenSearch Service, see Amazon OpenSearch Service features, the Developer Guide, or Introducing OpenSearch.


About the Authors

Fabian Tan is a Principal Solutions Architect at Amazon Web Services. He has a strong passion for software development, databases, data analytics and machine learning. He works closely with the Malaysian developer community to help them bring their ideas to life.

Hans Roessler is a Principal Software Architect at SEEKAsia. He is excited about new technologies and upgrading legacy to newer stacks. Always staying in touch with the latest technologies is one of his passions.

Abdulsalam Alshallah (Salam) is a Software architect at SEEK, Previously a Lead Cloud Architect for SEEKAsia, Salam has always been excited about new technologies, Cloud, Serverless & DevOps, in addition to his passion of eliminating wasted time/effort & resources; He is also one of the leaders of AWS User Group Malaysia.

Introducing stack graphs

Post Syndicated from Douglas Creager original https://github.blog/2021-12-09-introducing-stack-graphs/

Today, we announced the general availability of precise code navigation for all public and private Python repositories on GitHub.com. Precise code navigation is powered by stack graphs, a new open source framework we’ve created that lets you define the name binding rules for a programming language using a declarative, domain-specific language (DSL). With stack graphs, we can generate code navigation data for a repository without requiring any configuration from the repository owner, and without tapping into a build process or other CI job. In this post, I’ll dig into how stack graphs work, and how they achieve these results.

(This post is a condensed version of a talk that I gave at Strange Loop in October 2021. Please check out the video of that talk if you’d like to learn even more!)

What is code navigation?

Code navigation is a family of features that let you explore the relationships in your code and its dependencies at a deep level. The most basic code navigation features are “jump to definition” and “find all references.” Both build on the fact that names are pervasive in the code that we write. Programming languages let us define things — functions, classes, modules, methods, variables, and more. Those things have names so that we can refer back to them in other parts of our code.

A picture (even a simple one) is worth a thousand words:

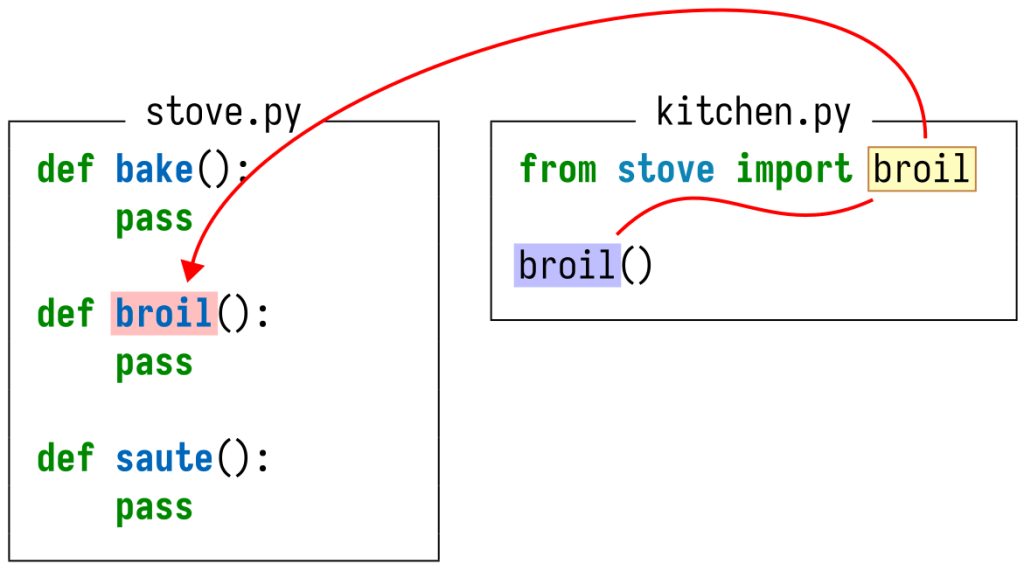
a simple Python module

In this Python module, the reference to broil at the end of the file refers to the function definition earlier in the file. (Throughout this post, I’ll highlight definitions in red and references in blue.)

Our goal, then, is to collect information about the lists of definitions and references, and to be able to determine which definitions each reference maps to, for all of the code hosted on GitHub.

Why is this hard?

In the above example, the definition and reference were close to each other, and it was easy to visually see the relationship between them. But it won’t always be that easy!

names can shadow each other in Python but not in Rust

For instance, what if there are multiple definitions with the same name? In Python, names can shadow each other, which means that the broil reference should refer to the latter of the two definitions.

But these rules are language-specific! In Rust, top-level definitions are not allowed to shadow each other, but local variables are. So, this transliteration of my example from Python to Rust is an error according to the Rust language spec. If we were writing a Rust compiler, we would want to surface this error for the programmer to fix. But what about for an exploration feature like code navigation? We might want to show some result even for erroneous code. We’re only human, after all!

code can live in multiple packages

Up to now, I’ve only shown you examples consisting of a single file. But when was the last time you worked on a software project consisting of a single file? It’s much more likely that your code will be split across multiple files, multiple packages, and multiple repositories. Programming languages give us the ability to refer to definitions that might be quite far away. But as you might expect, the rules for how you refer to things in other files are different for different languages.

In the above example, I’ve split everything up into three files living in two separate packages or repositories. (I’m using emoji to represent the package names.) In Python, import statements let us refer to names defined in other modules, and the name of a module is determined by the name of the file containing its code. Together, this lets us see that the broil reference in chef.py in the “chef” package refers to the broil definition in stove.py in the “frying pan” package.

code can change

Code changes and evolves over time. What happens when one of your dependencies changes the implementation of a function that you’re calling? Here, the maintainers of the “frying pan” package have added some logging to the broil function. As a result, the broil reference in chef.py now refers to a different definition. Insidiously, it was an intermediate file that changed — not the file containing the reference, nor the file containing the original definition! If we’re not careful, we’ll have to reanalyze every file in the repository, and in all its dependencies, whenever any file changes! This makes the amount of work we must do quadratic in the number of changed files, rather than linear, which is especially problematic at GitHub’s scale.

Our last difficulty is one of scale. As mentioned above, we want to provide this feature for all of the code hosted on GitHub. Moreover, we don’t want to require any manual configuration on the part of each repository owner. You shouldn’t have to figure out how to produce code navigation data for your language and project, or have to configure a CI build to generate that data. Code navigation should Just Work.

At GitHub’s scale, this poses two problems. The first is the sheer amount of code that comes in every minute of every day. In each commit that we receive, it’s very likely that only a small number of files have been modified. We must be able to rely on incremental processing and storage, reusing the results that we’ve already calculated and saved for the files that haven’t changed.

The second challenge is the number of programming languages that we need to (eventually) support. GitHub hosts code written in every programming language imaginable. Git itself doesn’t care what language you use for your project — to Git, everything is just bytes. But for a feature like code navigation, where the name binding rules are different for each language, we must know how to parse and interpret the content of those files. To support this at scale, it must be as easy as possible for GitHub engineers and external language communities to describe the name binding rules for a language.

To summarize:

  • Different languages have different name binding rules.
  • Some of those rules can be quite complex.
  • The result might depend on intermediate files.
  • We don’t want to require manual per-repository configuration.
  • We need incremental processing to handle our scale.

Stack graphs

After examining the problem space, we created stack graphs to tackle these challenges, based on the scope graphs framework from Eelco Visser’s research group at TU Delft. Below I’ll discuss what stack graphs are and how they work.

Because we must rely on incremental results, it’s important that at index time (that is, when we receive pushes containing new commits), we look at each file completely in isolation. Our goal is to extract “facts” about each file that describe the definitions and references in the file, and all possible things that each reference could resolve to.

For instance, consider this example:

two Python files

Our final result must be able to encode the fact that the broil reference and definition live in different files. But to be incremental, our analysis must look at each file separately. I’m going to step into each file to show you what information GitHub can extract in isolation.

the stack graph for stove.py

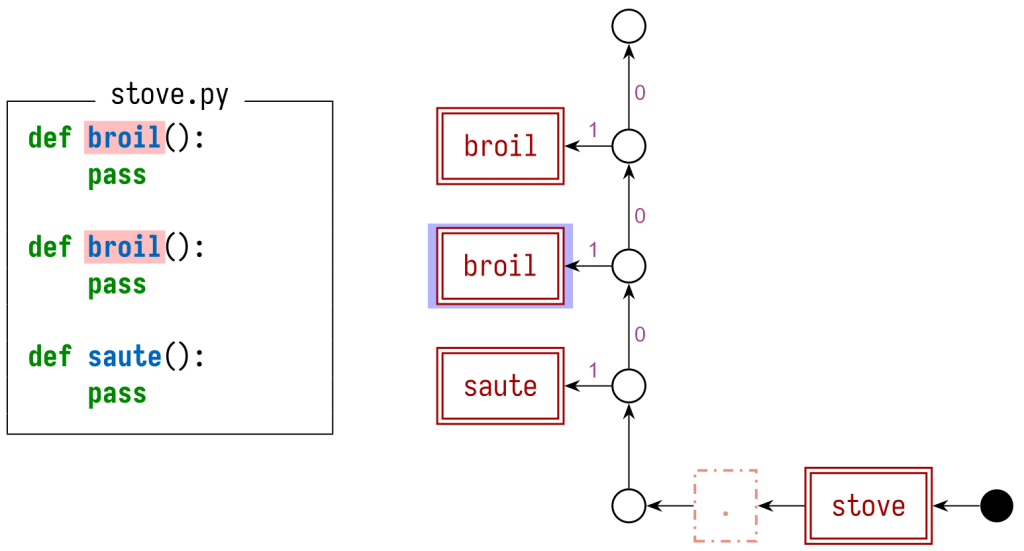
Looking first at stove.py, we can see that it contains a definition of broil. From the name of the file, we know that this definition lives in a module called stove, giving a fully qualified name of stove.broil. We can create a graph structure representing this fact (along with information about the other symbols in the file). Each definition (including the module itself) gets a red, double-bordered definition node. The other nodes, and the pattern of how we’ve connected these nodes with edges, define the scoping and shadowing rules for these symbols. For other programming languages, which don’t implement the same shadowing behavior as Python, we’d use a different pattern of edges to connect everything.

the stack graph for kitchen.py

We can do the same thing for kitchen.py. The broil reference is represented by a blue, single-bordered reference node. The import statement also appears in the graph, as a gadget of nodes involving the broil and stove symbols.

Because we are looking at this file in isolation, we don’t yet know what the broil reference resolves to. The import statement means that it might resolve to stove.broil, defined in some other file — but that depends on whether there is a file defining that symbol. This example does in fact contain such a file (we just looked at it!), but we must ignore that while extracting incremental facts about kitchen.py.

At query time, however, we’re able to bring together the data from all files in the commit that you’re looking at. We can load the graphs for each of the files, producing a single “merged” graph for the entire commit:

the merged stack graph

Within this merged graph, every valid name binding is represented by a path from a reference node to a definition node.

However, not every path in the graph represents a valid name binding! For instance, looking only at the graph structure, there are perfectly fine paths from the broil reference node to the saute and bake definition nodes. To rule out those paths, we also maintain a symbol stack while searching for paths. Each blue node pushes a symbol onto the stack, and each red node pops a symbol from the stack. Importantly, we are not allowed to move into a “pop” node if its symbol does not match the top of the stack.

We’ve shown the contents of the symbol stack at a handful of places in the path that’s highlighted above. Most importantly, when we reach the portion of the graph containing the saute, broil, and bake definition nodes, the symbol stack contains ⟨broil⟩, ensuring that the only valid path that we discover is the one that ends at the broil definition.

We can also use different graph structures to handle my other examples. For example:

the stack graph for shadowed Python definitions

In this graph, we annotate some of the graph edges with a precedence value. Paths that include edges with a higher precedence value are preferred over those with lower precedences. This lets us correctly handle Python’s shadowing behavior.

For other programming languages, which don’t implement the same shadowing behavior as Python, we’d use a different pattern of edges to connect everything. For instance, the stack graph for my Rust example from earlier would be:

the stack graph for conflicting Rust definitions

To model Rust’s rule that top-level definitions with the same name are conflicts, we have a single node that all definitions hang off of. We can use precedences to choose whether to show all conflicting definitions (by giving them all the same precedence value), or just the first one (by assigning precedences sequentially).

With a stack graph available to us, we can implement “jump to definition:”

  1. The user clicks on a reference.
  2. We load in the stack graphs for each file in the commit, and merge them
    together.
  3. We perform a path-finding search starting from the reference node
    corresponding to the symbol that the user clicked on, considering
    symbol stacks and precedences to ensure that we don’t create any invalid
    paths.
  4. Any valid paths that we find represent the definitions that the reference
    refers to. We display those in a hover card.

Creating stack graphs using Tree-sitter

I’ve described how to use stack graphs to perform code navigation lookups, but I haven’t mentioned how to create stack graphs from the source code that you push to GitHub.

For that, we turned to Tree-sitter, an open source parsing framework. The Tree-sitter community has already written parsers for a wide variety of programming languages, and we already use Tree-sitter in many places across GitHub. This makes it a natural choice to build stack graphs on.

Tree-sitter’s parsers already let us efficiently parse the code that our users upload. For instance, the Tree-sitter parser for Python produces a concrete syntax tree (CST) for our stove.py example file:

$ tree-sitter parse stove.py
(module [0, 0] - [10, 0]
  (function_definition [0, 0] - [1, 8]
    name: (identifier [0, 4] - [0, 8])
    parameters: (parameters [0, 8] - [0, 10])
    body: (block [1, 4] - [1, 8]
      (pass_statement [1, 4] - [1, 8])))
  (function_definition [3, 0] - [4, 8]
    name: (identifier [3, 4] - [3, 9])
    parameters: (parameters [3, 9] - [3, 11])
    body: (block [4, 4] - [4, 8]
      (pass_statement [4, 4] - [4, 8])))
  (function_definition [6, 0] - [7, 8]
    name: (identifier [6, 4] - [6, 9])
    parameters: (parameters [6, 9] - [6, 11])
    body: (block [7, 4] - [7, 8]
      (pass_statement [7, 4] - [7, 8]))))

Tree-sitter also provides a query language that lets us look for patterns within the CST:

(function_definition
  name: (identifier) @name) @function

This query would locate all three of our example method definitions, annotating each definition as a whole with a @function label and the name of each method with a @name label.

As part of developing stack graphs, we’ve added a new graph construction language to Tree-sitter, which lets you construct arbitrary graph structures (including but not limited to stack graphs) from parsed CSTs. You use stanzas to define the gadget of graph nodes and edges that should be created for each occurrence of a Tree-sitter query, and how the newly created nodes and edges should connect to graph content that you’ve already created elsewhere. For instance, the following snippet would create the stack graph definition node for my example Python method definitions:

(function_definition
  name: (identifier) @name) @function
{
    node @function.def
    attr (@function.def) kind = "definition"
    attr (@function.def) symbol = @name
    edge @function.containing_scope -> @function.def
}

This approach lets us create stack graphs incrementally for each source file that we receive, while only having to analyze the source code content, and without having to invoke any language-specific tooling or build systems. (The only language-specific part is the set of graph construction rules for that language!)

But wait, there’s more!

This post is already quite long, and I’ve only scratched the surface. You might be wondering:

  • Performing a full path-finding search for every “jump to definition” query seems wasteful. Can we precalculate more information at index time while still being incremental?

  • All the examples we’ve shown are pretty trivial. Can we handle more complex examples?

    For instance, how about the following Python file, where we need to use dataflow to trace what particular value was passed in as a parameter to passthrough to correctly resolve the reference to one on the final line?

    def passthrough(x):
      return x
    
    class A:
      one = 1
    
    passthrough(A).one
    

    Or the following Java file, where we have to trace inheritance and generic type parameters to see that the reference to length should resolve to String.length from the Java standard library?

    import java.util.HashMap;
    
    class MyMap extends HashMap<String, String> {
      int firstLength() {
          return this.entrySet().iterator().next().getKey().length();
      }
    }
    
  • Why aren’t we using the Language Server Protocol (LSP) or Language Server Index Format (LSIF)?

To dig even deeper and learn more, I encourage you to check out my Strange Loop talk and the stack-graphs crate: our open source Rust implementation of these ideas. And in the meantime, keep navigating!


Visualize live analytics from Amazon QuickSight connected to Amazon OpenSearch Service

Post Syndicated from Lokesh Yellanur original https://aws.amazon.com/blogs/big-data/visualize-live-analytics-from-amazon-quicksight-connected-to-amazon-opensearch-service/

Live analytics refers to the process of preparing and measuring data as soon as it enters the database or persistent store. In other words, you get insights or arrive at conclusions immediately. Live analytics enables businesses to respond to events without delay. You can seize opportunities or prevent problems before they happen. Speed is the main benefit of live analytics. The faster a business can use data for insights, the faster they can act on critical decisions.

Some live analytics use cases include:

  • Analyzing access logs and application logs from servers to identify any server performance issues that could lead to application downtime or help detect unusual activity. For instance, analyzing monitoring data from a manufacturing line can help early intervention before machinery malfunctions.
  • Targeting individual customers in retail outlets with promotions and incentives while the customers are in the store and close to the merchandise.

We see customers using real-time analytics using our ELK stack. The ELK stack is an acronym used to describe a stack that comprises three popular open-source projects: Elasticsearch, Logstash, and Kibana. Often referred to as Elasticsearch, the ELK stack gives you the ability to aggregate logs from all your systems and applications, analyze these logs, and create visualizations for application and infrastructure monitoring, faster troubleshooting, security analytics, and more. In this post, we extend the live analytics visualizations using Amazon QuickSight.

Solution overview

Amazon OpenSearch Service (successor to Amazon Elasticsearch Service) is a fully managed service that makes it easy for you to deploy, secure, and run OpenSearch cost-effectively at scale. You can build, monitor, and troubleshoot your applications using the tools you love at the scale you need. The service provides support for open-source OpenSearch APIs, managed Kibana, integration with Logstash and other AWS services, and built-in alerting and SQL querying. In addition, Amazon OpenSearch Service lets you pay only for what you use—there are no upfront costs or usage requirements. With Amazon OpenSearch Service, you get the ELK stack you need without the operational overhead.

QuickSight is a scalable, serverless, embeddable, machine learning (ML)-powered business intelligence (BI) service built for the cloud. QuickSight lets you easily create and publish interactive BI dashboards that include ML-powered insights. QuickSight dashboards can be accessed from any device and seamlessly embedded into your applications, portals, and websites.

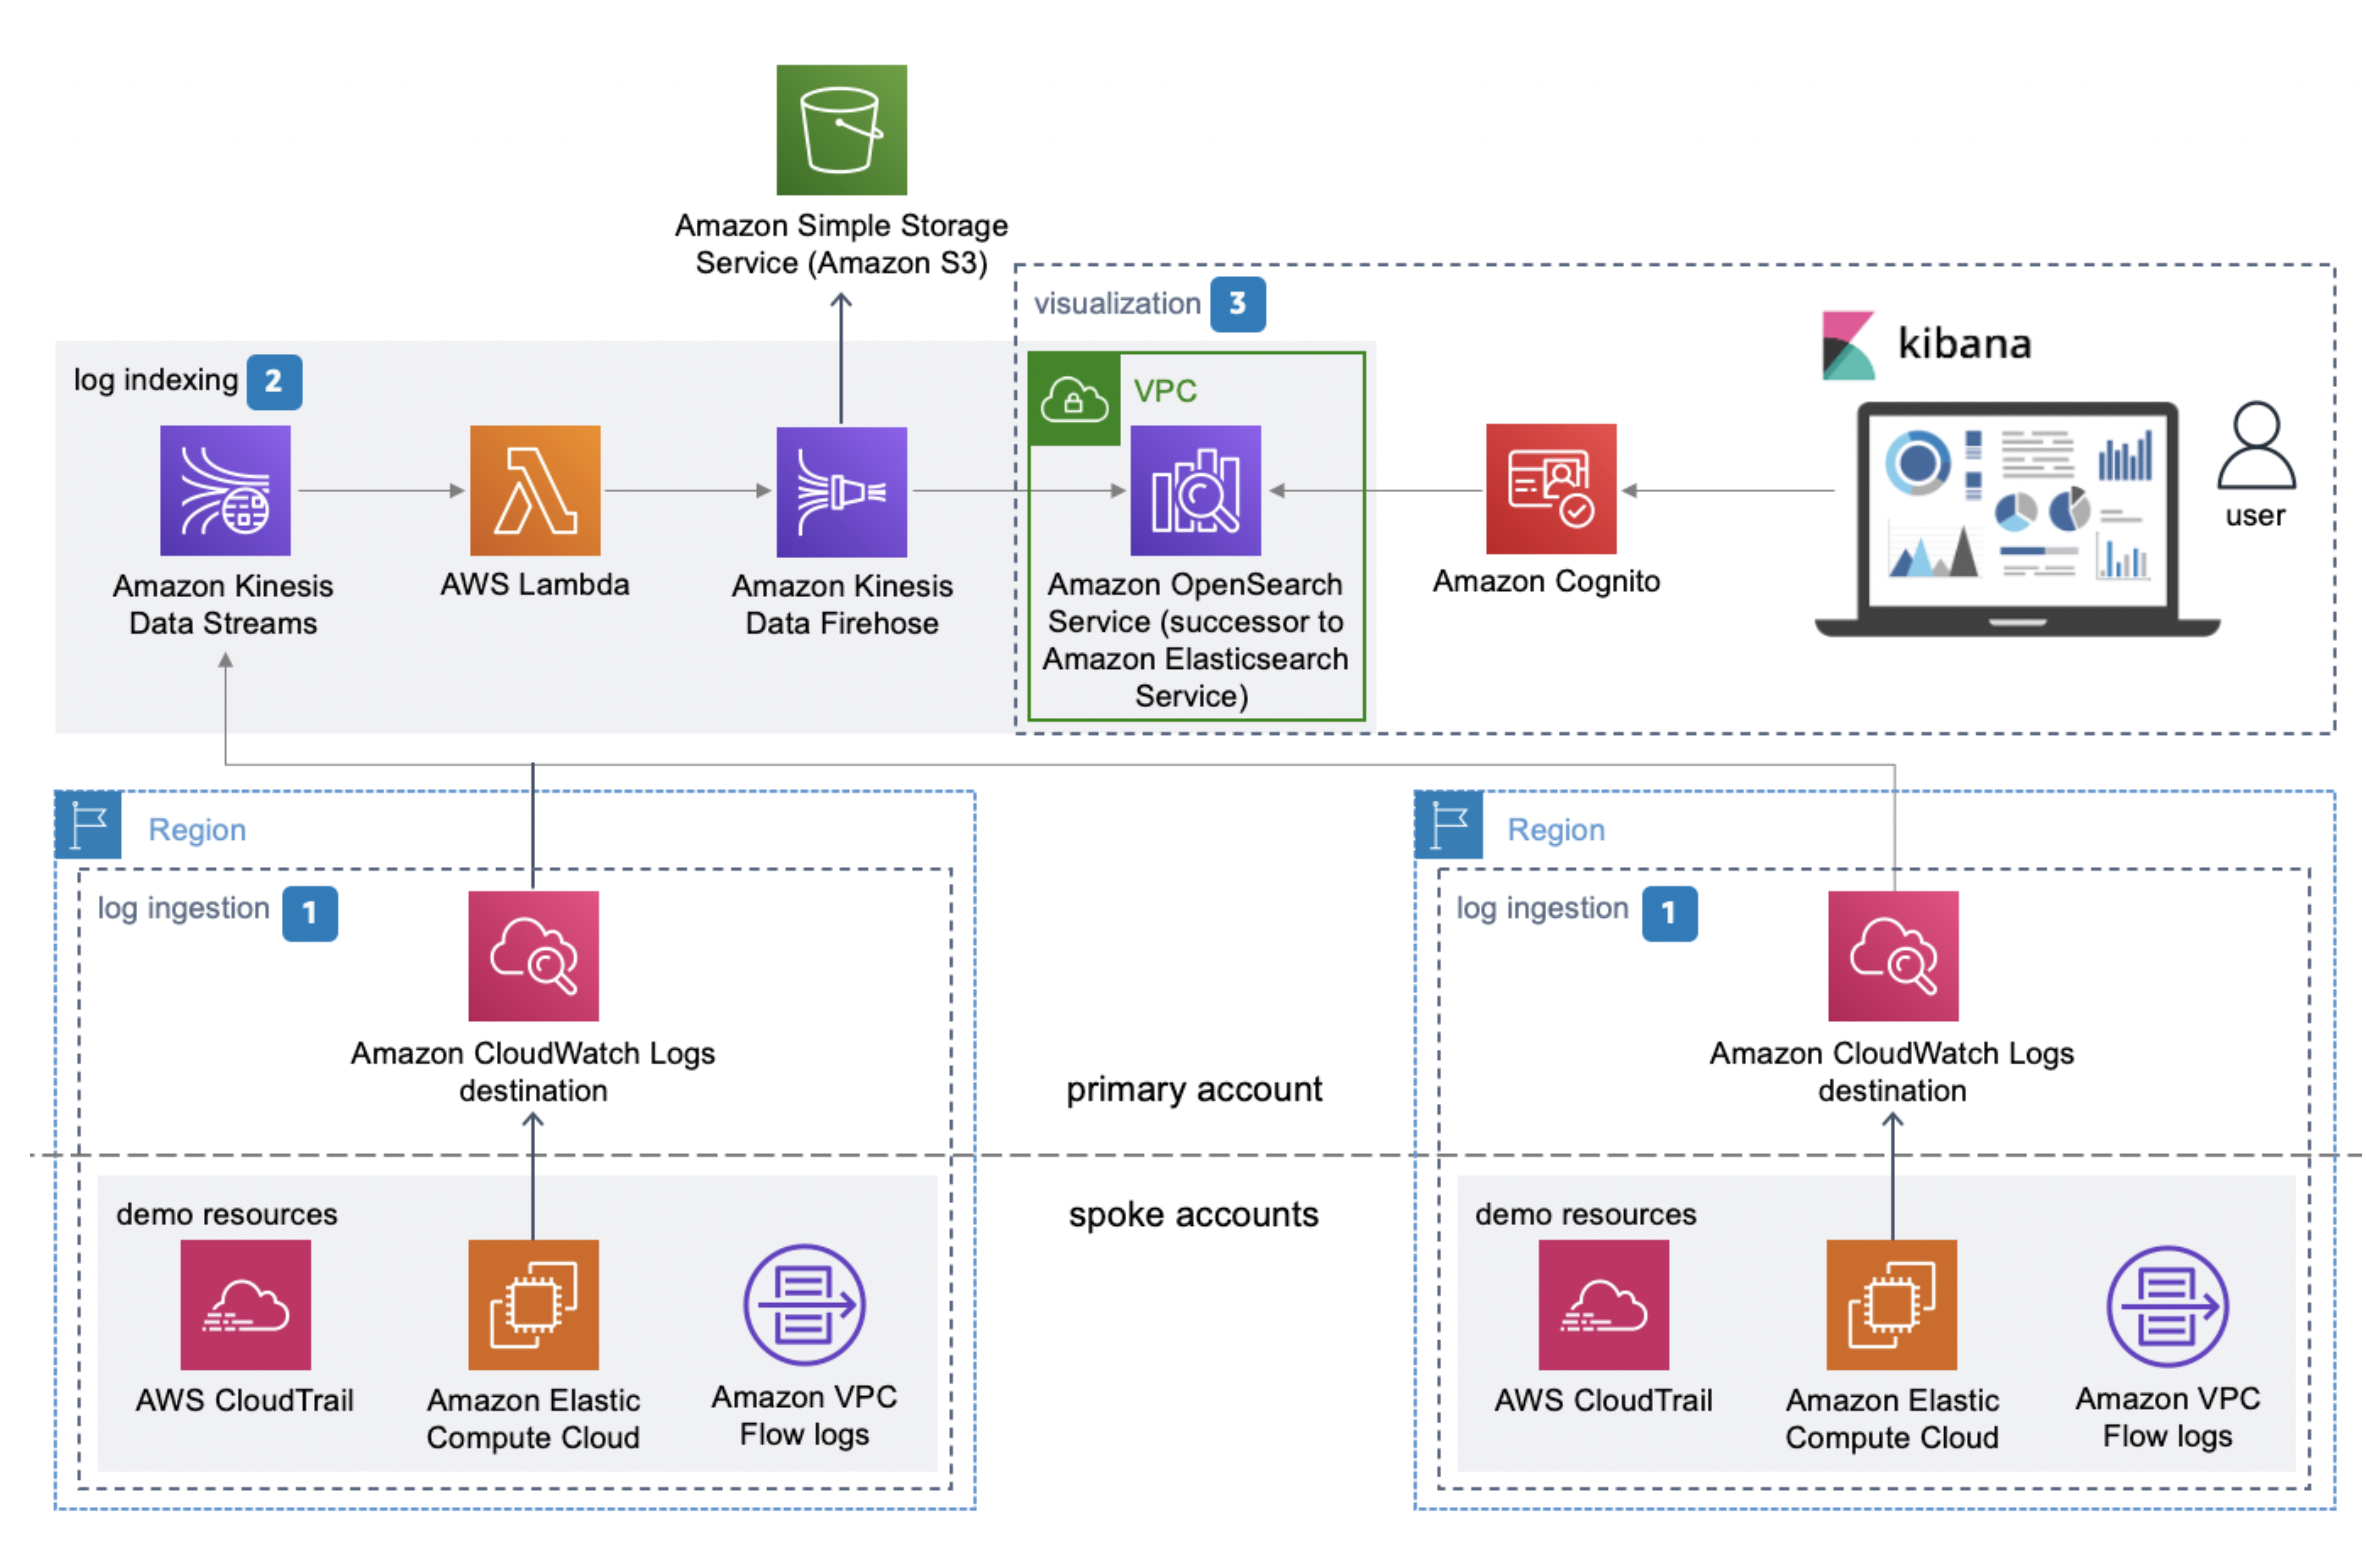
This post helps you visualize the Centralized Logging solution using QuickSight. Centralized logging helps organizations collect, analyze, and display Amazon CloudWatch logs in a single dashboard in QuickSight.

This solution consolidates, manages, and analyzes log files from various sources. You can collect CloudWatch logs from multiple accounts and AWS Regions. Access log information can be beneficial in security and access audits. It can also help you learn about your customer base and understand your Amazon Simple Storage Service (Amazon S3) bill.

The following diagram illustrates the solution architecture.

For more information about the solution, see Centralized Logging.

Prerequisites

Before you implement the solution, complete the prerequisite steps in this section.

Provision your resources

Launch the following AWS CloudFormation template to launch the Centralized Logging solution:

After you create the stack, you receive an email (to the administrator email address) with your login information, as shown in the following screenshot.

Launch QuickSight in a VPC

Sign up for a QuickSight subscription with the Enterprise license.

QuickSight Enterprise Edition is fully integrated with Amazon Virtual Private Cloud (Amazon VPC). A VPC based on this service closely resembles a traditional network that you operate in your own data center. It enables you to secure and isolate traffic between resources.

Allow QuickSight to access Amazon OpenSearch Service

Make sure QuickSight has access to both the VPC and Amazon OpenSearch Service.

  1. On the QuickSight dashboard, choose the user icon and choose Manage QuickSight.
  2. Choose Security & permissions in the navigation pane.
  3. Choose Add or Remove to update QuickSight access to AWS services.
  1. For Allow access and autodiscovery for these recourses, select Amazon OpenSearch Service.

Manage the VPC and security group connections

You need to give permissions on the QuickSight console to connect to Amazon OpenSearch Service. After you enable Amazon OpenSearch Service on the Security & permissions page, you add a VPC connection with the same VPC and subnet as your Amazon OpenSearch Service domain and create a new security group.

You first create a security group for QuickSight.

  1. Add an inbound rule to allow all communication from the Amazon OpenSearch Service domain.
  2. For Type, choose All TCP.
  3. For Source, select Custom, then enter the ID of the security group used by your Amazon OpenSearch Service domain.
  4. Add an outbound rule to allow all traffic to the Amazon OpenSearch Service domain.
  5. For Type, choose Custom TCP Rule.
  6. For Port Range, enter 443.
  7. For Destination, select Custom, then enter the ID of the security group used by your Amazon OpenSearch Service domain.

Next, you create a security group for the Amazon OpenSearch Service domain.

  1. Add an inbound rule that allows all incoming traffic from the QuickSight security group.
  2. For Type, choose Custom TCP.
  3. For Port Range, enter 443.
  4. For Source, select Custom, then enter the QuickSight security group ID.
  5. Add an outbound rule that allows all traffic to the QuickSight security group.
  6. For Type, choose All TCP.
  7. For Destination, select Custom, then enter the QuickSight security group ID.

Choose your datasets

To validate the connection and create the data source, complete the following steps:

  1. On the QuickSight console, choose Datasets.
  2. Choose Create dataset.
  3. Choose Amazon OpenSearch Service.
  4. For Data source name, enter a name.
  5. Depending on your Amazon OpenSearch Service connections of either public or VPC, choose your connection type and Amazon OpenSearch Service domain.
  6. Choose Validate connection.
  7. Choose Create data source.

  1. Choose Tables.
  2. Select the table in the data source you created.
  3. Review your settings and choose Visualize.

Visualize the data loaded

QuickSight, with its wide array of visuals available, allows you to create meaningful visuals from Amazon OpenSearch Service data.

When you choose Visualize from the previous steps, you start creating an analysis. QuickSight provides a range of visual types to display data, such as graphs, tables, heat maps, scatter plots, line charts, pie charts, and more. The following steps allow you to add a visual type to display the data from the datasets.

  1. On the Add menu, choose Add visual.
  2. Choose your visual type.
  3. Add fields to the field wells to bring data into the visuals to be displayed.

The following screenshot shows a sample group of visuals.

Automatically refresh your data

You can access and visualize your data through direct queries. Your data is queried live each time a visual is rendered. This gives you live access to your data. Additionally, you can automatically refresh the visuals every 1–60 minutes, so that you don’t have to reload the page to see the most up-to-date information. The following screenshot shows the auto-refresh settings while preparing to publish your dashboard.

For more information about the auto-refresh option, see Using Amazon OpenSearch with Amazon QuickSight.

The following screenshot shows an example visualization.

Clean up

When you’re done using this solution, to avoid incurring future charges, delete the resources you created in this walkthrough, including your S3 buckets,  Amazon OpenSearch Service cluster, and other associated resources.

Summary

This post demonstrated how to extend your ELK stack with QuickSight in a secure way for analyzing access logs. The application logs help you identify any server performance issues that could lead to application downtime. They can also help detect unusual activity.

As always, AWS welcomes feedback. Please submit comments or questions in the comments section.


About the Authors

Lokesh Yellanur is a Solutions Architect at AWS. He helps customers with data and analytics solutions in AWS.

Joshua Morrison is a Senior Solutions Architect at AWS based in Richmond, Virginia. He spends time working with customers to help with their adoption of modern cloud technology and security best practices. He enjoys being a father and picking up heavy objects.

Suresh Patnam is a Sr Solutions Architect at AWS; He works with customers to build IT strategy, making digital transformation through the cloud more accessible, focusing on big data, data lakes, and AI/ML. In his spare time, Suresh enjoys playing tennis and spending time with his family. Connect him on LinkedIn.

Applying Federated Learning for ML at the Edge

Post Syndicated from Randy DeFauw original https://aws.amazon.com/blogs/architecture/applying-federated-learning-for-ml-at-the-edge/

Federated Learning (FL) is an emerging approach to machine learning (ML) where model training data is not stored in a central location. During ML training, we typically need to access the entire training dataset on a single machine. For purposes of performance scaling, we divide the training data between multiple CPUs, multiple GPUs, or a cluster of machines. But in actuality, the training data is available in a single place. This poses challenges when we gather data from many distributed devices, like mobile phones or industrial sensors. For privacy reasons, we may not be able to collect training data from mobile phones. In an industrial setting, we may not have the network connectivity to push a large volume of sensor data to a central location. In addition, raw sensor data may contain sensitive information about a plant’s operation.

In this blog, we will demonstrate a working example of federated learning on AWS. We’ll also discuss some design challenges you may face when implementing FL for your own use case.

Federated learning challenges

In FL, all data stays on the devices. A training coordinator process invokes a training round or epoch, and the devices update a local copy of the model using local data. When complete, the devices each send their updated copy of the model weights to the coordinator. The coordinator combines these weights using an approach like federated averaging, and sends the new weights to each device. Figures 1 and 2 compare traditional ML with federated learning.

Traditional ML training:

Figure 1. Traditional ML training

Figure 1. Traditional ML training

Federated Learning:

Figure 2. Federated learning. Note that in federated learning, all data stays on the devices, as compared to traditional ML.

Figure 2. Federated learning. Note that in federated learning, all data stays on the devices, as compared to traditional ML.

Compared to traditional ML, federated learning poses several challenges.

Unpredictable training participants. Mobile and industrial devices may have intermittent connectivity. We may have thousands of devices, and the communication with these devices may be asynchronous. The training coordinator needs a way to discover and communicate with these devices.

Asynchronous communication. As previously noted, devices like IoT sensors may use communication protocols like MQTT, and rely on IoT frameworks with asynchronous pub/sub messaging. For example, the training coordinator cannot simply make a synchronous call to a device to send updated weights.

Passing large messages. The model weights can be several MB in size, making them too large for typical MQTT payloads. This can be problematic when network connections are not high bandwidth.

Emerging frameworks. Deep learning frameworks like TensorFlow and PyTorch do not yet fully support FL. Each has emerging options for edge-oriented ML, but they are not yet production-ready, and are intended mostly for simulation work.

Solving for federated learning challenges

Let’s begin by discussing the framework used for FL. This framework should work with any of the major deep learning systems like PyTorch and TensorFlow. It should clearly separate what happens on the training coordinator versus what happens on the devices. The Flower framework satisfies these requirements. In the simplest cases, Flower only requires that a device or client implement four methods: get model weights, set model weights, run a training round, and return metrics (like accuracy). Flower provides a default weight combination strategy, federated averaging, although we could design our own.

Next, let’s consider the challenges of devices and coordinator-to-device communication. Here it helps to have a specific use case in mind. Let’s focus on an industrial use case using the AWS IoT services. The IoT services will provide device discovery and asynchronous messaging tools. Running Flower code in tasks running on Amazon ECS on AWS Fargate containers orchestrated by an AWS Step Functions workflow, bridges the gap between the synchronous training process and the asynchronous device communication.

Devices: Our devices are registered with the AWS IoT Core, which gives access to MQTT communication. We use an AWS IoT Greengrass device, which lets us push AWS Lambda functions on the core device to run the actual ML training code. Greengrass also provides access to other AWS services and provides a streaming capability for pushing large payloads to the AWS Lambdacloud. Devices publish heartbeat messages to an MQTT topic to facilitate device discovery by the training coordinator.

Flower processes: The Flower framework requires a server and one or more clients. The clients communicate with the server synchronously over gRPC, so we cannot directly run the Flower client code on the devices. Rather, we use Amazon ECS Fargate containers to run the Flower server and client code. The client container acts as a proxy and communicates with the devices using MQTT messaging, Greengrass streaming, and direct Amazon S3 file transfer. Since the devices cannot send responses directly to the proxy containers, we use IoT rules to push responses to an Amazon DynamoDB bookkeeping table.

Orchestration: We use a Step Functions workflow to launch a training run. It performs device discovery, launches the server container, and then launches one proxy client container for each Greengrass core.

Metrics: The Flower server and proxy containers emit useful data to logs. We use Amazon CloudWatch log metric filters to collect this information on a CloudWatch dashboard.

Figure 3 shows the high-level design of the prototype.

Figure 3. FL prototype deployed on Amazon ECS Fargate containers and AWS IoT Greengrass cores.

Figure 3. FL prototype deployed on Amazon ECS Fargate containers and AWS IoT Greengrass cores

Production considerations

As you move into production with FL, you must design for a new set of challenges compared to traditional ML.

What type of devices do you have? Mobile and IoT devices are the most common candidates for FL.

How do the devices communicate with the coordinator? Devices come and go, and don’t always support synchronous communication. How will you discover devices that are available for FL and manage asynchronous communication? IoT frameworks are designed to work with large fleets of devices with intermittent connectivity. But mobile devices will find it easier to push results back to a training coordinator using regular API endpoints.

How will you integrate FL into your ML practice? As you saw in this example, we built a working FL prototype using AWS IoT, container, database, and application integration services. A data science team is likely to work in Amazon SageMaker or an equivalent ML environment that provides model registries, experiment tracking, and other features. How will you bridge this gap? (We may need to invent a new term – “MLEdgeOps.”)

Conclusion

In this blog, we gave a working example of federated learning in an IoT scenario using the Flower framework. We discussed the challenges involved in FL compared to traditional ML when building your own FL solution. As FL is an important and emerging topic in edge ML scenarios, we invite you to try our GitHub sample code. Please give us feedback as GitHub issues, particularly if you see additional federated learning challenges that we haven’t covered yet.

[$] Blocking straight-line speculation — eventually

Post Syndicated from original https://lwn.net/Articles/877845/rss

The Spectre class of vulnerabilities was given that name because, it was
thought, these problems would haunt us for a long time. As the fourth
anniversary of the disclosure of Meltdown and
Spectre
approaches, there is no reason to doubt the accuracy of that
name. One of
the more recent Spectre variants goes by the name “straight-line
speculation”; it was first disclosed in June 2020, but fixes are still
trying to find their way into the compilers and the kernel.

Google Shuts Down Glupteba Botnet, Sues Operators

Post Syndicated from Bruce Schneier original https://www.schneier.com/blog/archives/2021/12/google-shuts-down-glupteba-botnet-sues-operators.html

Google took steps to shut down the Glupteba botnet, at least for now. (The botnet uses the bitcoin blockchain as a backup command-and-control mechanism, making it hard to get rid of it permanently.) So Google is also suing the botnet’s operators.

It’s an interesting strategy. Let’s see if it’s successful.

Security updates for Thursday

Post Syndicated from original https://lwn.net/Articles/878142/rss

Security updates have been issued by Fedora (firefox, libopenmpt, matrix-synapse, vim, and xen), Mageia (gmp, heimdal, libsndfile, nginx/vsftpd, openjdk, sharpziplib/mono-tools, and vim), Red Hat (java-1.8.0-ibm), Scientific Linux (firefox), SUSE (kernel-rt), and Ubuntu (bluez).

2022 Planning: Simplifying Complex Cybersecurity Regulations

Post Syndicated from Harley Geiger original https://blog.rapid7.com/2021/12/09/2022-planning-simplifying-complex-cybersecurity-regulations/

2022 Planning: Simplifying Complex Cybersecurity Regulations

Compliance does not equal security, but it’s also true that a strong cybersecurity program meets many compliance obligations. How can we communicate industry regulatory requirements in a more straightforward way that enhances understanding while saving time and effort? How can we more easily demonstrate that a robust cybersecurity program will typically meet many compliance requirements?

Rapid7’s latest white paper, “Simplifying the Complex: Common Practices Across Cybersecurity Regulations,” is an educational resource aimed at breaking down complicated regulatory text into a set of consistent cybersecurity practices. The paper analyzes 10 major cybersecurity regulations, identifies common practices across the regulations, and provides insight on how to operationalize these practices.

Read the full white paper

Get it here

You can also reserve your spot for the upcoming webinar, “Common Cybersecurity Compliance Requirements.” Register now at our 2022 Planning webinar series page. This talk is designed to help you apply simplification practices across regulations and help your team plan for the year ahead.  

Different regulations, common practices

Cybersecurity regulations are complex. They target a patchwork of industry sectors and are enforced by disparate federal, state, and international government agencies. However, there are patterns: Cybersecurity regulations often require similar baseline security practices, even though the legislation may structure compliance requirements differently.

Identifying these common elements can help regulated entities, regulators, and cybersecurity practitioners communicate how compliance obligations translate to operational practices. For example, an organization’s security leader(s) could use this approach to drive executive support and investment prioritization by demonstrating how a robust security program addresses an array of compliance obligations facing the organization.

This white paper organizes common regulatory requirements into 6 core components of organizational security programs:

  1. Security program: Maintain a comprehensive security program.
  2. Risk assessment: Assess internal and external cybersecurity risks and threats.
  3. Security safeguards: Implement safeguards to control the risks identified in the risk assessment.
  4. Testing and evaluation: Assess the effectiveness of policies, procedures, and safeguards to control risks.
  5. Workforce and personnel: Establish security roles and responsibilities for personnel.
  6. Incident response: Detect, investigate, document, and respond to cybersecurity incidents and events.

Learn additional background information on each regulation and how these 6 practices are incorporated into many of them. The white paper also provides extensive citations for each requirement so that readers can locate the official text directly.  

Rapid7 solutions help support compliance

Your organization is different from any other — that’s a fact. You’ll operationalize security practices based on individual risk profile, technology, and structure. Rapid7 helps you approach implementation with the context for each of the cybersecurity practices we outline, including:

  1. Operational overview: See how the cybersecurity practice generally operates within an organization’s security program.
  2. Organizational structure: This stipulates which teams or functions within an organization implement the cybersecurity practice.
  3. Successful approaches: These provide approaches to successfully implementing the cybersecurity practice.
  4. Common challenges: These spell out common issues that hinder consistently successful implementation.

Rapid7’s portfolio of solutions can help meet and exceed the cybersecurity practices commonly required by regulations. To illustrate this, the white paper provides extensive product and service mapping intended to help every unique organization achieve its compliance goals. We discuss the key, go-to products and services that help fulfill each practice, as well as those that provide additional support.

For example, when it comes to maintaining a comprehensive security program, it might help to measure the effectiveness of your program’s current state with a cybersecurity maturity assessment. Or, if you’re trying to stay compliant with safeguards to control risk, InsightCloudSec can help govern Identity and Access Management (IAM) and adopt a unified zero-trust security model across your cloud and container environments. And what about testing? From pentesting to managed application security services, simulate real-world attacks at different stages of the software development lifecycle (SDLC) to understand your state of risk and know if your end product is customer-ready.  

Which regulations are discussed in the white paper?

Sector-based

  1. HIPAA (health)
  2. GLBA (financial)
  3. NYDFS Cybersecurity Regulation (financial)
  4. PCI DSS (retail)
  5. COPPA (retail)
  6. NERC CIP (electrical)

Broadly applicable

  1. State Data Security Laws (CA, FL, MA, NY, TX)
  2. SOX

International

  1. GDPR
  2. NIS Directive

When it comes to compliance, it’s not just about running afoul of a regulating body you may not have been aware of when entering a new market. Customer trust is difficult to get back once you lose it.    

A comprehensive cybersecurity program from a trusted and vetted provider will help ensure you’re well-protected from threats and in compliance with regulations wherever your company does business. Whether it’s monitoring and testing services, risk assessments, or certification and training for personnel, your provider should deliver tailored solutions and products that help you meet your unique compliance goals — and protect your users — now and well into the future.

Learn more at our webinar on Monday, December 13

Sign up today

Note: The white paper discussed should not be used as a compliance guide and is not legal advice.

Cloudflare announces partnerships with leading cyber insurers and incident response providers

Post Syndicated from Deeksha Lamba original https://blog.cloudflare.com/cyber-risk-partnerships/

Cloudflare announces partnerships with leading cyber insurers and incident response providers

Cloudflare announces partnerships with leading cyber insurers and incident response providers

We are excited to announce our cyber risk partnership program with leading cyber insurance carriers and incident response providers to help our customers reduce their cyber risk. Cloudflare customers can qualify for discounts on premiums or enhanced coverage with our partners. Additionally, our incident response partners are partnering with us for mitigating under attack scenarios in an accelerated manner.  

What is a business’ cyber risk?

Let’s start with security and insurance —  e.g., being a homeowner is an adventure and a responsibility. You personalize your home, maintain it, and make it secure against the slightest possibility of intrusion — fence it up, lock the doors, install a state of the art security system, and so on. These measures definitely reduce the probability of an intrusion, but you still buy insurance. Why? To cover for the rare possibility that something might go wrong — human errors, like leaving the garage door open, or unlikely events, like a fire, hurricane etc. And when something does go wrong, you call the experts (aka police) to investigate and respond to the situation.

Running a business that has any sort of online presence is evolving along the same lines. Getting the right security posture in place is absolutely necessary to protect your business, customers, and employees from nefarious cyber attacks. But as a responsible business owner/CFO/CISO, nevertheless you buy cyber insurance to protect your business from long-tail events that could allow malicious attackers into your environment, causing material damage to your business. And if such an event does take place, you engage with incident response companies for active investigation and mitigation.

In short, you do everything in your control to reduce your business’ cyber risk by having the right security, insurance, and active response measures in place.

The cyber insurance industry and the rise of ransomware attacks

Over the last two years, the rise of ransomware attacks has wreaked havoc on businesses and the cyber insurance industry. As per a Treasury Department report, nearly 600 million dollars in banking transactions were linked to possible ransomware payments in Suspicious Activity Reports (SARs) filed by financial services firms to the U.S. Government for the first six months of 2021, a jump of more than 40% over the total for all of 2020. Additionally, the Treasury Department investigators identified about 5.2 billion dollars in bitcoin transactions as potential ransomware payments, indicating that the actual amount of ransomware payments was much higher1.

The rise of these attacks has and should make businesses more cautious, making them more inclined to have the right cybersecurity posture in place  and to buy cyber insurance coverage.

Cloudflare announces partnerships with leading cyber insurers and incident response providers

Further, the rising frequency and severity of attacks, especially ransomware attacks, has led to increasing insurance claims and loss ratios (loss ratios refers to insurance claims i.e., how much insurance companies pay out in claims costs divided by total earned premiums i.e., how much customers pay them for insurance) for the cyber insurers. As per a recent research report, the most frequent types of losses covered by cyber insurers were ransomware (41%), funds transfer loss (27%), and business email compromise incidents (19%). These trends are pushing legacy insurance carriers to reevaluate how much coverage they can afford to offer and how much they have to charge clients to do so; thereby, triggering a structural change that can impact the ability of companies, especially the small and medium businesses, to minimize their cyber risk.

The end result has been a drastic increase in the premiums and denial rates over the last 12 months amongst some carriers, which has pushed customers to seek new coverage. The premiums have increased upwards of 50%, according to infosec experts and vendors, with some quotes jumping closer to 100%.2 Also, the lack of accessible cyber insurance and proper coverage disproportionately impacts the small and medium enterprises that find themselves as the common target for these cyber attacks. According to a recent research report, 70% of ransomware attacks are aimed at organizations with less than 1,000 employees.3 The increased automation of cyber attacks coupled with the use of insecure remote access tools during the pandemic has left these organizations exposed all while being faced with increased cyber insurance premiums or no access to coverage.

While some carriers are excluding ransomware payments from customers’ policies or are denying coverage to customers who don’t have the right security measures in place, there is a new breed of insurance carriers that are incentivizing customers in the form of broader coverage or lower prices for proactively implementing cybersecurity controls.

Cloudflare’s cyber risk partnerships

At Cloudflare, we have always believed in making the Internet a better place. We have been helping our customers focus on their core business while we take care of their cyber security. We are now going a step further, helping our customers reduce their cyber risk by partnering with leading cyber insurance underwriters and incident response providers.

Our objective is to help our customers reduce their cyber risk. We are doing so in partnership with several leading companies highlighted below. Our customers can qualify for enhanced coverage and discounted premiums for their cyber insurance policies by leveraging their security posture with Cloudflare.

Cloudflare announces partnerships with leading cyber insurers and incident response providers

Insurance companies: Powered by Cloudflare’s security suite, our customers have comprehensive protection against the most common and severe threat vectors. In most of the cases, when attackers see that a business is using Cloudflare they realize they will not be able to execute a denial of service (DoS) attack or infiltrate the customer’s network. Knowing the power of Cloudflare, the attackers prefer to spend their time on more vulnerable targets. This implies that our customers face a lower frequency and severity of attacks — an ideal customer set that could imply a lower loss ratio for underwriters. Our partners understand the security benefits of using Cloudflare’s security suite and are letting our customers qualify for lower premium rates and enhanced coverage.

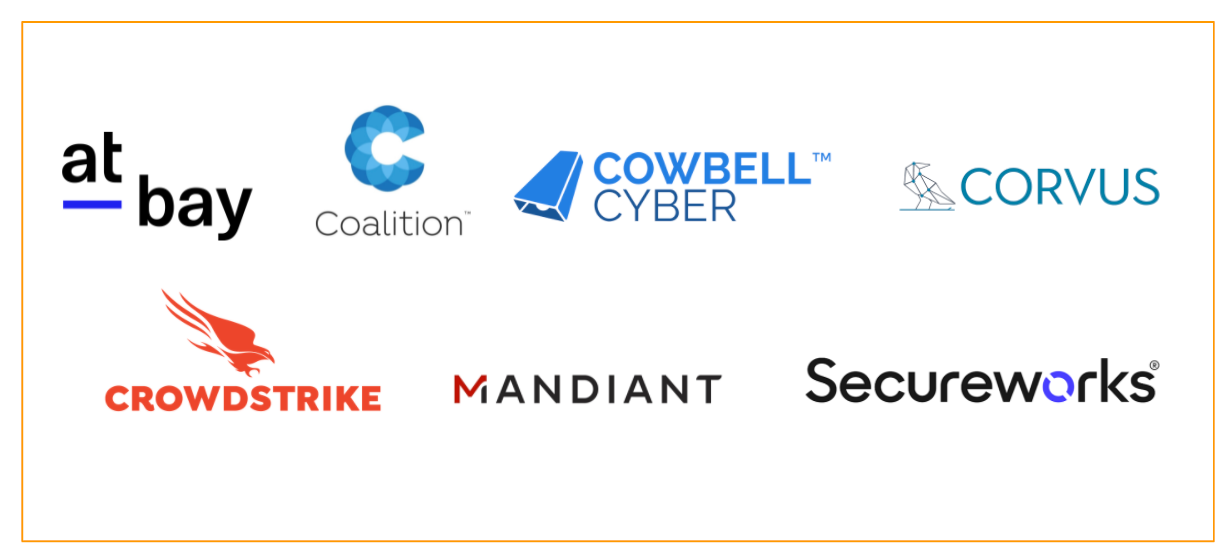
Cloudflare customers can qualify for discounts/credits on premiums and enhanced coverage with our partners At-Bay, Coalition, and Cowbell Cyber.

“An insurance policy is an effective tool to articulate the impact of security choices on the financial risk of a company. By offering better pricing to companies who implement stronger controls, like Cloudflare’s Comprehensive DDoS Protection, we help customers understand how best to reduce risk. Incentivizing our customers to adopt innovative security solutions like Cloudflare, combined with At-Bay’s free active risk monitoring, has helped reduce ransomware in At-Bay’s portfolio 7x below the market average.”
– Rotem Iram,
Co-founder and CEO, At-Bay

“It’s incredible what Cloudflare has done to create a safer Internet. When Cloudflare’s technology is paired with insurance, we are able to protect businesses in an entirely new way. We are excited to offer Cloudflare customers enhanced cyber insurance coverage alongside Coalition’s active security monitoring platform to help businesses build true cyber resilience with an always-on insurance policy.”
– Joshua Motta, Co-founder & CEO, Coalition

“We are excited to work with Cloudflare to address our customers’ cybersecurity needs and help reduce their cyber risk. Collaborating with cybersecurity companies like Cloudflare will definitely enable a more data-driven underwriting approach that the industry needs”
– Nate Walsh, Head of Strategic Partnerships, Corvus Insurance

“The complexity and frequency of cyber attacks continue to rise, and small and medium enterprises are increasingly becoming the center of these attacks. Through partners like Cloudflare, we want to encourage these businesses to adopt the best security standards and proactively address vulnerabilities, so they can benefit from savings on their cyber insurance policy premiums.”
– Jack Kudale, Founder and CEO, Cowbell Cyber

Incident Response companies: Our incident response partners deal with active under attack situations day in, day out — helping customers mitigate the attack, and getting their web property and network back online. Many times, precious time is wasted in trying to figure out which security vendor to reach out to and how to get hold of the right team. We are announcing new relationships with prominent incident response providers CrowdStrike, Mandiant, and Secureworks to enable rapid referral of organizations under attack. As a refresher — my colleague, James Espinosa, wrote a great blog post on how Cloudflare helps customers against ransomware DDoS attacks.

“The speed in which a company is able to identify, investigate and remediate a threat heavily determines how it will fare in the end. Our partnership with Cloudflare provides companies the ability to take action rapidly and contain exposure at the time of an attack, enabling them to get back on their feet and return to business as usual as quickly as possible.”
– Thomas Etheridge, Senior Vice President, CrowdStrike Services

“As cyber threats continue to rapidly evolve, the need for organizations to put response plans in place increases. Together, Mandiant and Cloudflare are enabling our mutual customers to mitigate the risk breaches pose to their business operations. We hope to see more of these much-needed technology collaborations that help organizations address the growing threat of ransomware and DDoS attacks in a timely manner.”
– Marshall Heilman, EVP & Chief Technology Officer, Mandiant

“Secureworks’ proactive incident response and adversarial testing expertise combined with Cloudflare’s intelligent global platform enables our mutual customers to better mitigate the threats of sophisticated cyberattacks. This partnership is a much needed approach to addressing advanced cyber threats with speed and automation.”
– Chris Bell, Vice President – Strategic Alliances, Secureworks

What’s next?

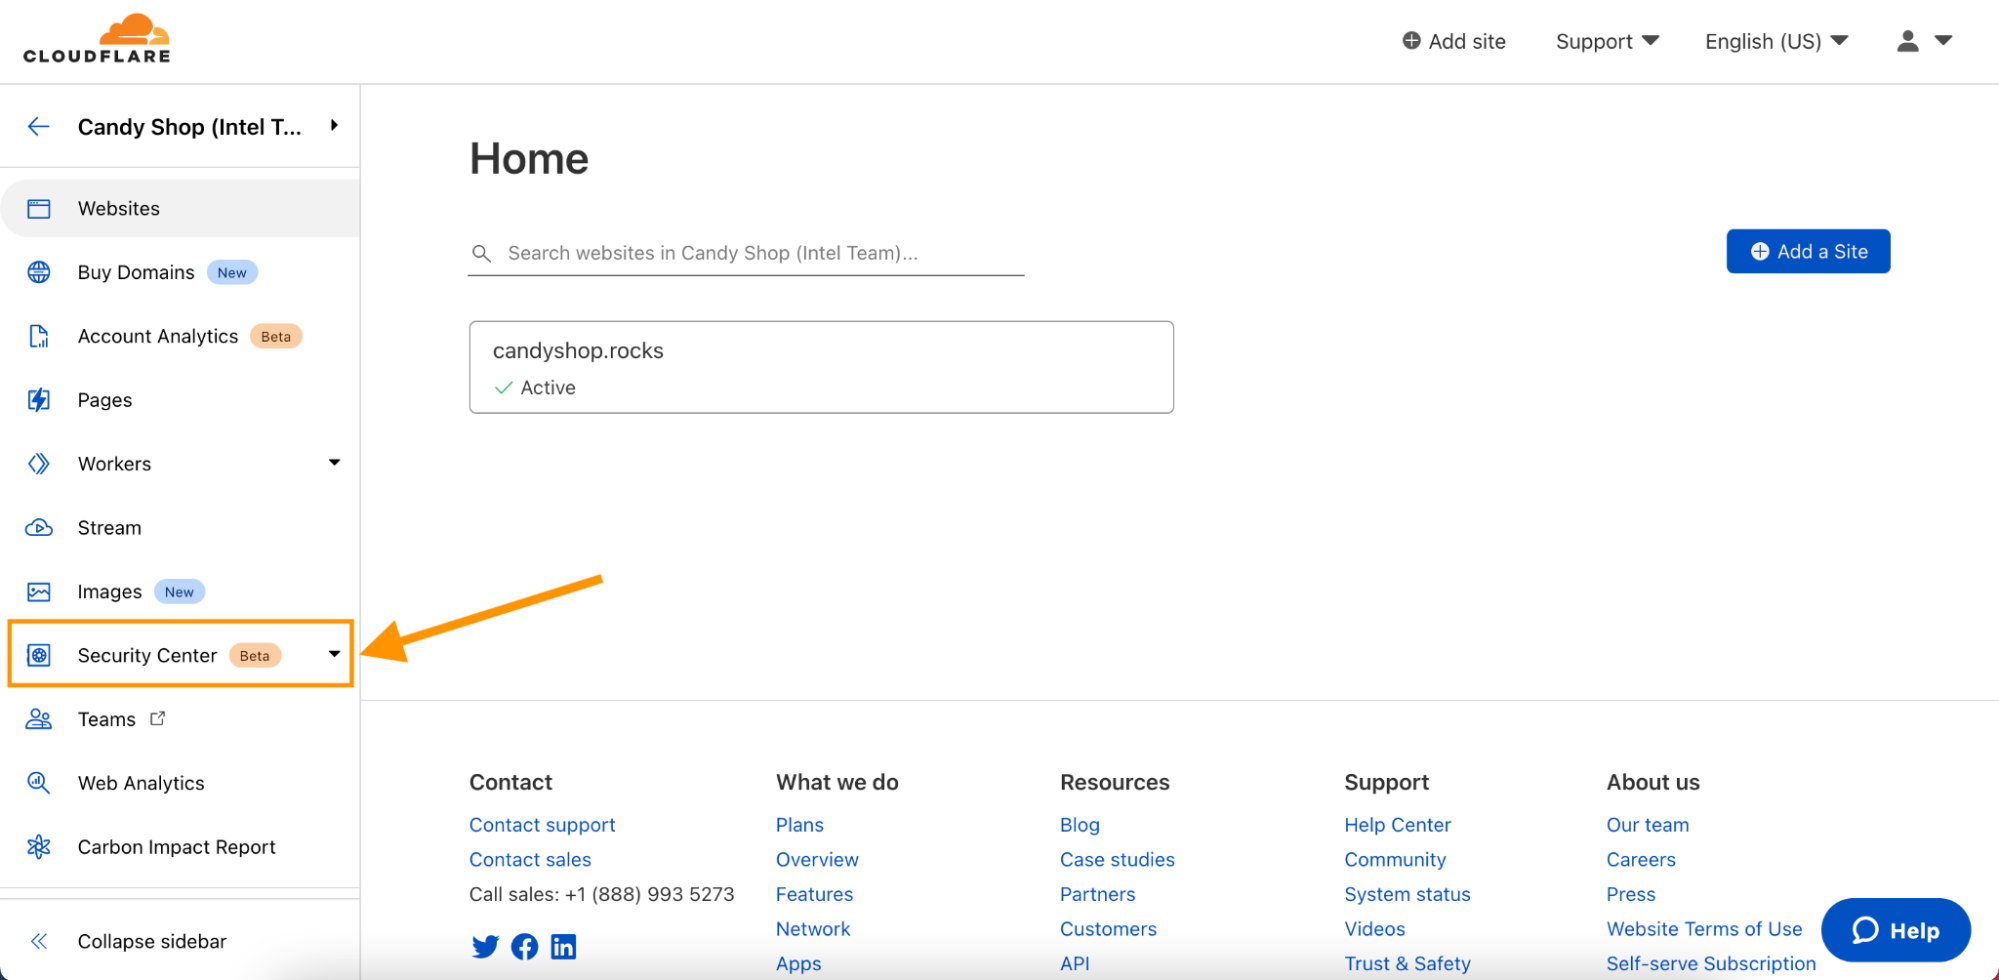
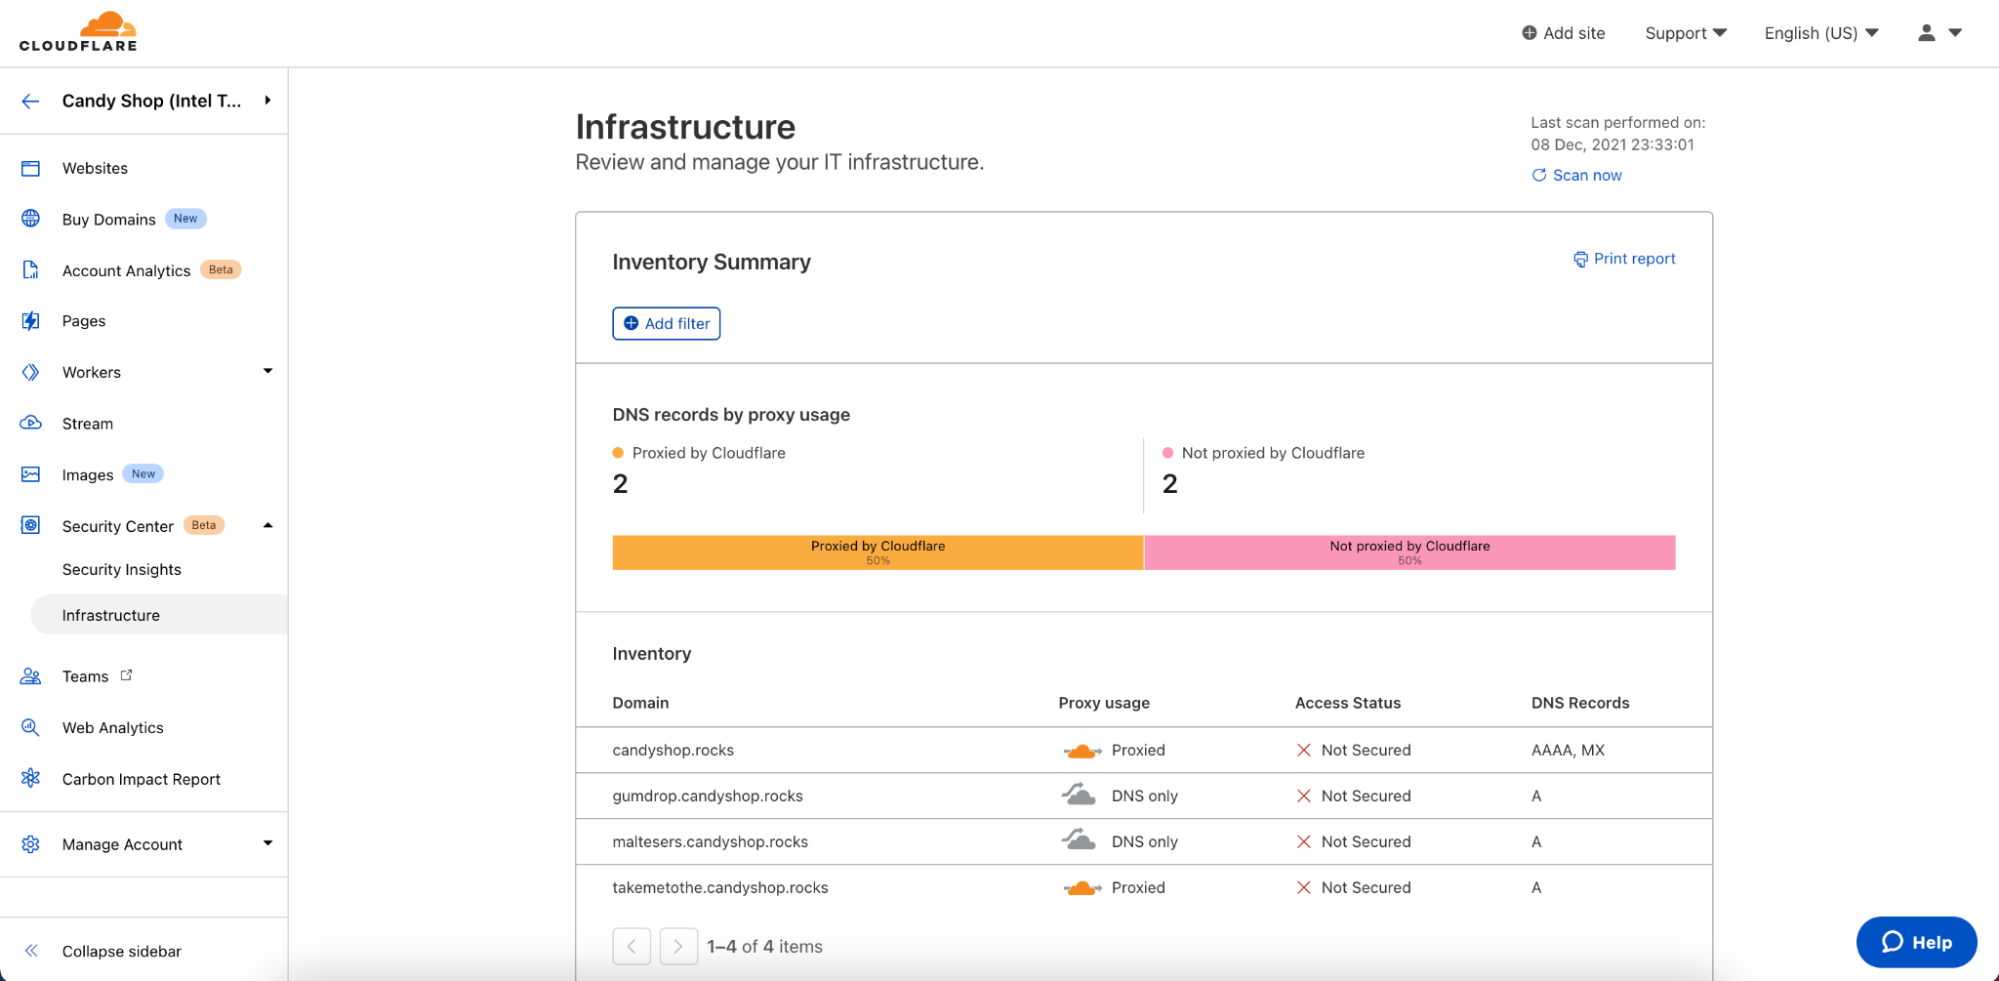
In summary, Cloudflare and its partners are coming together to ensure that our customers can run their business while getting adequate cybersecurity and risk coverage. However, we will not stop here. In the coming months, we’ll be working on creating programmatic ways to share threat intelligence with our cyber risk partners. Through our Security Center, we want to enable our customers, if they so choose, to safely share their security posture information with our partners for easier, transparent underwriting. Given the scale of our network and the magnitude and heterogeneity of attacks that we witness, we are in a strong position to provide our partners with insights around long-tail risks.

If you are interested in learning more, please refer to the partner links (At-Bay, Coalition, and Cowbell Cyber) or visit our cyber risk partnership page. If you’re interested in becoming a partner, please fill up this form.

….
Sources:
1https://www.wsj.com/articles/suspected-ransomware-payments-for-first-half-of-2021-total-590-million-11634308503
Gallagher, Cyber Insurance Market Update, Mid-year 2021
2https://www.ajg.com/us/news-and-insights/2021/aug/global-cyber-market-update/
3https://searchsecurity.techtarget.com/news/252507932/Cyber-insurance-premiums-costs-skyrocket-as-attacks-surge

Introducing Cloudflare Security Center

Post Syndicated from Malavika Balachandran Tadeusz original https://blog.cloudflare.com/security-center/

Introducing Cloudflare Security Center

Introducing Cloudflare Security Center

Today we are launching Cloudflare Security Center, which brings together our suite of security products, our security expertise, and unique Internet intelligence as a unified security intelligence solution.

Cloudflare was launched in 2009 to help build a better Internet and make Internet performance and security accessible to everyone. Over the last twelve years, we’ve disrupted the security industry and launched a broad range of products to address our customer’s pain points across Application Security, Network Security, and Enterprise Security.

While there are a plethora of solutions on the market to solve specific pain points, we’ve architected Cloudflare One as a unified platform to holistically address our customers’ most pressing security challenges.  As part of this vision, we are extremely excited to launch the public beta of Security Center. Our goal is to help customers understand their attack surface and quickly take action to reduce their risk of an incident.

Starting today, all Cloudflare users can use Security Center (available in your Cloudflare dashboard) to map their attack surface, review potential security risks and threats to their organizations, and mitigate these risks with a few clicks.

The changing corporate attack surface

A year ago, we announced Cloudflare One to address the complex nature of corporate networking today. The proliferation of public cloud, SaaS applications, mobile devices, and remote work has made the traditional model of the corporate network obsolete. The Internet is the new enterprise WAN, necessitating a novel approach to the way security teams manage their attack surface.

Second, the way we build applications has changed. Web applications today heavily use open source code and third-party scripts. Earlier this year we announced Page Shield, now GA, to help our customers track and monitor their third-party JavaScript dependencies.

These transformations in the IT landscape, coupled with the natural evolution that every organization goes through — such as growth, attrition, and M&A activity — create significant complexity for IT and security teams to stay on top of their organization’s ever-changing attack surface.

Introducing Cloudflare Security Center

The importance of attack surface management

An attack surface refers to the entire IT footprint of an organization that is susceptible to cyberattacks. Your attack surface consists of all the corporate servers, devices, SaaS, and cloud assets that are accessible from the Internet.

Over the last six months, something we’ve heard consistently from our customers is that they often don’t have a good grasp of their attack surface.

Because of the ease of creating new resources with the public cloud or SaaS, IT teams struggle to stay on top of shadow IT resources. Even when IT is aware of new infrastructure being spun up by dev teams, ensuring that these new resources are configured in line with corporate security standards is a constant battle.

It’s not only new resources that cause problems for IT teams — IT teams also want to quickly identify and decommission forgotten websites or applications that may have sensitive data or expose their organization to potential security risks.

These challenges are further complicated by the use of third-party software. Open source code, JavaScript libraries, SaaS applications, or self-hosted software introduce supply-chain risk into your attack surface. Security teams want to monitor potential vulnerabilities and malicious dependencies in third-party software.

Lastly, external threats add to your organization’s attack surface. Security teams want to quickly identify and take down rogue assets created by malicious actors. These rogue assets are often phishing sites or malware distribution points that attempt to trick the organization’s customers or employees into providing sensitive details or downloading a file.

The challenges of attack surface management

With such an expansive list of potential risks and threats to an organization, it’s no surprise that organizations of all sizes are struggling to keep up with their attack surface. Many of our customers have built in-house solutions or use a range of security products to ascertain and monitor their attack surface.

But we’ve consistently heard from our customers that these solutions just don’t work. They are often too noisy and produce far too many alerts, making it difficult for security teams to triage and prioritize issues. Customers are also tired of security vendor sprawl and don’t want to add yet another tool to integrate with their existing security solutions. Security teams have limited resources — across staff and budget — and they want a solution that creates less, not more, work.

Introducing Cloudflare Security Center

In order to make attack surface management accessible and actionable for all organizations, we are excited to launch Cloudflare Security Center. Security Center is a single place to map your attack surface, identify potential security risks, and mitigate risks with a few clicks.

Starting today, you’ll find “Security Center” in your Account Home page.

Introducing Cloudflare Security Center

Once you navigate to Security Center within the Cloudflare dashboard, you’ll find two new features:

  • Security Insights: Review and manage potential security risks and vulnerabilities associated with your IT infrastructure.
  • Infrastructure: Review and manage your IT infrastructure

In today’s release, if you navigate to Security Insights, you can view a log of potential security risks, vulnerabilities, and insecure configurations associated with your IT infrastructure on Cloudflare. Our security experts have helped curate our automated detections to help you quickly triage and address the most critical issues impacting your attack surface.

If this is your first time using Security Center, you will need to click Start scan to consent to Cloudflare scanning your infrastructure. Once you opt in to Security Center, we will scan your infrastructure on a regular schedule:

  • If you have any Pro or higher plan zones, or are using Teams Standard or higher, after opting in to Security Center, we will scan your infrastructure on a daily basis.
  • For all other Cloudflare plans, after opting in to Security Center, we will scan your infrastructure every three days.

After every scan, you can visit the Security Insights page to view a high level summary of your attack surface and dig into the specifics of any potential security risks we have identified.

Directly from Security Insights, you can resolve any insights by making the recommended changes to your Cloudflare configurations in just a few clicks.

With each scan, we inventory your IT assets on Cloudflare as part of the Infrastructure feature within Security Center. Here, you can view a summary of your domains on Cloudflare. At the top of the page, you can find a breakdown of your DNS records by Proxy Usage. Below this chart, you can review a list of all your domains on Cloudflare, as well as view other key details about your domains.

Introducing Cloudflare Security Center

What’s next

All features made available as part of today’s Security Center beta release are included in your existing Cloudflare plan. It’s our mission to help build a better Internet, and we believe that making attack surface management accessible and actionable is an important part of that mission. We want everyone, from an individual web developer to the CIO of a Fortune 100 company, to be able to easily secure their IT footprint.

You can get started today with Security Center’s beta release by visiting your Cloudflare dashboard. With just a few clicks, you can ensure that your Cloudflare settings are optimized for your organization’s security.

We’d love your feedback on Security Center. If you have any comments, questions or concerns, you can contact us directly at [email protected], or on our Cloudflare Community forum.

Stay tuned for further updates, as we continue to add more features to Security Center. Soon, you’ll be able to control not only your IT assets on Cloudflare, but your entire IT footprint. We’ll continue to build upon our risk detection capabilities, going beyond Application Security to Network Security, Enterprise Security, and Brand Security.

Shadow IT: make it easy for users to follow the rules

Post Syndicated from Kenny Johnson original https://blog.cloudflare.com/shadow-it/

Shadow IT: make it easy for users to follow the rules

Shadow IT: make it easy for users to follow the rules

SaaS application usage has exploded over the last decade. According to Gartner, global spending on SaaS in 2021 was $145bn and is forecasted to reach $171bn in 2022. A key benefit of SaaS applications is that they are easy to get started with and either free or low cost. This is great for both users and leaders — it’s easy to try out new tools with no commitment or procurement process. But this convenience also presents a challenge to CIOs and security teams. Many SaaS applications are great for a specific task, but lack required security controls or visibility. It can be easy for employees to start using SaaS applications for their everyday job without IT teams noticing — these “unapproved” applications are popularly referred to as Shadow IT.

CIOs often have no visibility over what applications their SaaS employees are using. Even when they do, they may not have an easy way to block users from using unapproved applications, or on the contrary, to provide easy access to approved ones.

Visibility into application usage

In an office, it was easier for CIOs and their teams to monitor application usage in their organization. Mechanisms existed to inspect outbound DNS and HTTP traffic over office Wi-Fi equipment and detect unapproved applications. In an office setting, IT teams could also notice colleagues using new SaaS applications or maybe hear them mention these new applications. When users moved to remote work due to COVID-19 and other factors, this was no longer possible, and network-driven logging became ineffective. With no central network, the focus of application monitoring needed to shift to user’s devices.

We’re excited to announce updates to Cloudflare for Teams that address Shadow IT challenges. Our Zero Trust platform provides a framework to identify new applications, block applications and provide a single location for approved applications. Cloudflare Gateway allows admins to monitor user traffic and detect new application usage. Our Shadow IT report then presents a list of new applications and allows for approval or rejection of each application.

Shadow IT: make it easy for users to follow the rules

This gives CIOs in-depth understanding of what applications are being used across their business, and enables them to come up with a plan to allow and block applications based on their approval status in the organization.

Blocking the right applications

Once the list of “shadow” applications is known, the next step is to block these applications with a meaningful error message to steer the user toward an approved application. The point should not be to make the user feel like they have done something wrong, but to encourage and provide them with the right application to leverage.

Shadow IT: make it easy for users to follow the rules

Cloudflare Gateway allows teams to configure policies to block unapproved applications and provide clear instructions to a user about what their alternatives are to that application. In Gateway, administrators can configure application-specific policies like “block all file sharing applications except Google Drive.” Tenant control can be utilized to restrict access to specific instances of a given application to prevent personal account usage of these tools.

Protect your approved applications

The next step is to protect the application you do want your users to use. In order to fully protect your SaaS applications, it is important to secure the initial authorization and maintain a clear audit trail of user activity. Cloudflare Access for SaaS allows administrators to protect the front door of their SaaS applications and verify user identity, multi-factor authentication, device posture and location before allowing access. Gateway then provides a clear audit trail of all user activity within the application to provide a clear picture in the case of a breach or other security events.

This allows CIOs and their teams to define which users may or may not access specific applications. Instead of creating broad access lists, they can define exactly which users need a specific tool to complete their job. This is beneficial for both security and licensing costs.

Show your users the applications they need

The final challenge is making it clear to users which applications they do and do not have access to. New employees often spend their first few weeks discovering new applications that would have helped them get up to speed more quickly.

We wanted to make it easy to provide a single place for users to access all of their approved applications. We added bookmarks and application visibility control to the Access application launcher to make this even easier.

Shadow IT: make it easy for users to follow the rules

Once all your applications are available through the application launcher, we log all user activity across these applications. And even better, many of these applications are hosted on Cloudflare which leads to performance improvements overall.

Getting started with the Access application launcher is easy and free for the first 50 users! Get started today from the Cloudflare for Teams dashboard.

How to customize your layer 3/4 DDoS protection settings

Post Syndicated from Omer Yoachimik original https://blog.cloudflare.com/l34-ddos-managed-rules/

How to customize your layer 3/4 DDoS protection settings

How to customize your layer 3/4 DDoS protection settings

After initially providing our customers control over the HTTP-layer DDoS protection settings earlier this year, we’re now excited to extend the control our customers have to the packet layer. Using these new controls, Cloudflare Enterprise customers using the Magic Transit and Spectrum services can now tune and tweak their L3/4 DDoS protection settings directly from the Cloudflare dashboard or via the Cloudflare API.

The new functionality provides customers control over two main DDoS rulesets:

  1. Network-layer DDoS Protection ruleset — This ruleset includes rules to detect and mitigate DDoS attacks on layer 3/4 of the OSI model such as UDP floods, SYN-ACK reflection attacks, SYN Floods, and DNS floods. This ruleset is available for Spectrum and Magic Transit customers on the Enterprise plan.
  2. Advanced TCP Protection ruleset — This ruleset includes rules to detect and mitigate sophisticated out-of-state TCP attacks such as spoofed ACK Floods, Randomized SYN Floods, and distributed SYN-ACK Reflection attacks. This ruleset is available for Magic Transit customers only.

To learn more, review our DDoS Managed Ruleset developer documentation. We’ve put together a few guides that we hope will be helpful for you:

  1. Onboarding & getting started with Cloudflare DDoS protection
  2. Handling false negatives
  3. Handling false positives
  4. Best practices when using VPNs, VoIP, and other third-party services
  5. How to simulate a DDoS attack

Cloudflare’s DDoS Protection

A Distributed Denial of Service (DDoS) attack is a type of cyberattack that aims to disrupt the victim’s Internet services. There are many types of DDoS attacks, and they can be generated by attackers at different layers of the Internet. One example is the HTTP flood. It aims to disrupt HTTP application servers such as those that power mobile apps and websites. Another example is the UDP flood. While this type of attack can be used to disrupt HTTP servers, it can also be used in an attempt to disrupt non-HTTP applications. These include TCP-based and UDP-based applications, networking services such as VoIP services, gaming servers, cryptocurrency, and more.

How to customize your layer 3/4 DDoS protection settings

To defend organizations against DDoS attacks, we built and operate software-defined systems that run autonomously. They automatically detect and mitigate DDoS attacks across our entire network. You can read more about our autonomous DDoS protection systems and how they work in our deep-dive technical blog post.

How to customize your layer 3/4 DDoS protection settings

Unmetered and unlimited DDoS Protection

The level of protection that we offer is unmetered and unlimited — It is not bounded by the size of the attack, the number of the attacks, or the duration of the attacks. This is especially important these days because as we’ve recently seen, attacks are getting larger and more frequent. Consequently, in Q3, network-layer attacks increased by 44% compared to the previous quarter. Furthermore, just recently, our systems automatically detected and mitigated a DDoS attack that peaked just below 2 Tbps — the largest we’ve seen to date.

How to customize your layer 3/4 DDoS protection settings
Mirai botnet launched an almost 2 Tbps DDoS attack

Read more about recent DDoS trends.

Managed Rulesets

You can think of our autonomous DDoS protection systems as groups (rulesets) of intelligent rules. There are rulesets of HTTP DDoS Protection rules, Network-layer DDoS Protection rules and Advanced TCP Protection rules. In this blog post, we will cover the latter two rulesets. We’ve already covered the former in the blog post How to customize your HTTP DDoS protection settings.

How to customize your layer 3/4 DDoS protection settings
Cloudflare L3/4 DDoS Managed Rules

In the Network-layer DDoS Protection rulesets, each rule has a unique set of conditional fingerprints, dynamic field masking, activation thresholds, and mitigation actions. These rules are managed (by Cloudflare), meaning that the specifics of each rule is curated in-house by our DDoS experts. Before deploying a new rule, it is first rigorously tested and optimized for mitigation accuracy and efficiency across our entire global network.

In the Advanced TCP Protection ruleset, we use a novel TCP state classification engine to identify the state of TCP flows. The engine powering this ruleset is flowtrackd — you can read more about it in our announcement blog post. One of the unique features of this system is that it is able to operate using only the ingress (inbound) packet flows. The system sees only the ingress traffic and is able to drop, challenge, or allow packets based on their legitimacy. For example, a flood of ACK packets that don’t correspond to open TCP connections will be dropped.

How attacks are detected and mitigated

Sampling

Initially, traffic is routed through the Internet via BGP Anycast to the nearest Cloudflare edge data center. Once the traffic reaches our data center, our DDoS systems sample it asynchronously allowing for out-of-path analysis of traffic without introducing latency penalties. The Advanced TCP Protection ruleset needs to view the entire packet flow and so it sits inline for Magic Transit customers only. It, too, does not introduce any latency penalties.

Analysis & mitigation

The analysis for the Advanced TCP Protection ruleset is straightforward and efficient. The system qualifies TCP flows and tracks their state. In this way, packets that don’t correspond to a legitimate connection and its state are dropped or challenged. The mitigation is activated only above certain thresholds that customers can define.

The analysis for the Network-layer DDoS Protection ruleset is done using data streaming algorithms. Packet samples are compared to the conditional fingerprints and multiple real-time signatures are created based on the dynamic masking. Each time another packet matches one of the signatures, a counter is increased. When the activation threshold is reached for a given signature, a mitigation rule is compiled and pushed inline. The mitigation rule includes the real-time signature and the mitigation action, e.g., drop.

How to customize your layer 3/4 DDoS protection settings

​​​​Example

As a simple example, one fingerprint could include the following fields: source IP, source port, destination IP, and the TCP sequence number. A packet flood attack with a fixed sequence number would match the fingerprint and the counter would increase for every packet match until the activation threshold is exceeded. Then a mitigation action would be applied.

However, in the case of a spoofed attack where the source IP addresses and ports are randomized, we would end up with multiple signatures for each combination of source IP and port. Assuming a sufficiently randomized/distributed attack, the activation thresholds would not be met and mitigation would not occur. For this reason, we use dynamic masking, i.e. ignoring fields that may not be a strong indicator of the signature. By masking (ignoring) the source IP and port, we would be able to match all the attack packets based on the unique TCP sequence number regardless of how randomized/distributed the attack is.

Configuring the DDoS Protection Settings

For now, we’ve only exposed a handful of the Network-layer DDoS protection rules that we’ve identified as the ones most prone to customizations. We will be exposing more and more rules on a regular basis. This shouldn’t affect any of your traffic.

How to customize your layer 3/4 DDoS protection settings
Overriding the sensitivity level and mitigation action

For the Network-layer DDoS Protection ruleset, for each of the available rules, you can override the sensitivity level (activation threshold), customize the mitigation action, and apply expression filters to exclude/include traffic from the DDoS protection system based on various packet fields. You can create multiple overrides to customize the protection for your network and your various applications.

How to customize your layer 3/4 DDoS protection settings
Configuring expression fields for the DDoS Managed Rules to match on

In the past, you’d have to go through our support channels to customize the rules. In some cases, this may have taken longer to resolve than desired. With today’s announcement, you can tailor and fine-tune the settings of our autonomous edge system by yourself to quickly improve the accuracy of the protection for your specific network needs.

For the Advanced TCP Protection ruleset, for now, we’ve only exposed the ability to enable or disable it as a whole in the dashboard. To enable or disable the ruleset per IP prefix, you must use the API. At this time, when initially onboarding to Cloudflare, the Cloudflare team must first create a policy for you. After onboarding, if you need to change the sensitivity thresholds, use Monitor mode, or add filter expressions you must contact Cloudflare Support. In upcoming releases, this too will be available via the dashboard and API without requiring help from our Support team.

How to customize your layer 3/4 DDoS protection settings

Pre-existing customizations

If you previously contacted Cloudflare Support to apply customizations, your customizations have been preserved, and you can visit the dashboard to view the settings of the Network-layer DDoS Protection ruleset and change them if you need. If you require any changes to your Advanced TCP Protection customizations, please reach out to Cloudflare Support.

If so far you didn’t have the need to customize this protection, there is no action required on your end. However, if you would like to view and customize your DDoS protection settings, follow this dashboard guide or review the API documentation to programmatically configure the DDoS protection settings.

Helping Build a Better Internet

At Cloudflare, everything we do is guided by our mission to help build a better Internet. The DDoS team’s vision is derived from this mission: our goal is to make the impact of DDoS attacks a thing of the past. Our first step was to build the autonomous systems that detect and mitigate attacks independently. Done. The second step was to expose the control plane over these systems to our customers (announced today). Done. The next step will be to fully automate the configuration with an auto-pilot feature — training the systems to learn your specific traffic patterns to automatically optimize your DDoS protection settings. You can expect many more improvements, automations, and new capabilities to keep your Internet properties safe, available, and performant.

Not using Cloudflare yet? Start now.

The collective thoughts of the interwebz