Magic Firewall gets Smarter

Post Syndicated from Achiel van der Mandele original https://blog.cloudflare.com/magic-firewall-gets-smarter/

Magic Firewall gets Smarter

Magic Firewall gets Smarter

Today, we’re very excited to announce a set of updates to Magic Firewall, adding security and visibility features that are key in modern cloud firewalls. To improve security, we’re adding threat intel integration and geo-blocking. For visibility, we’re adding packet captures at the edge, a way to see packets arrive at the edge in near real-time.

Magic Firewall is our network-level firewall which is delivered through Cloudflare to secure your enterprise. Magic Firewall covers your remote users, branch offices, data centers and cloud infrastructure. Best of all, it’s deeply integrated with Cloudflare, giving you a one-stop overview of everything that’s happening on your network.

A brief history of firewalls

We talked a lot about firewalls on Monday, including how our firewall-as-a-service solution is very different from traditional firewalls and helps security teams that want sophisticated inspections at the Application Layer. When we talk about the Application Layer, we’re referring to OSI Layer 7. This means we’re applying security features using semantics of the protocol. The most common example is HTTP, the protocol you’re using to visit this website. We have Gateway and our WAF to protect inbound and outbound HTTP requests, but what about Layer 3 and Layer 4 capabilities? Layer 3 and 4 refer to the packet and connection levels. These security features aren’t applied to HTTP requests, but instead to IP packets and (for example) TCP connections. A lot of folks in the CIO organization want to add extra layers of security and visibility without resorting to decryption at Layer 7. We’re excited to talk to you about two sets of new features that will make your lives easier: geo-blocking and threat intel integration to improve security posture, and packet captures to get you better visibility.

Threat Intel and IP Lists

Magic Firewall is great if you know exactly what you want to allow and block. You can put in rules that match exactly on IP source and destination, as well as bitslicing to verify the contents of various packets. However, there are many situations in which you don’t exactly know who the bad and good actors are: is this IP address that’s trying to access my network a perfectly fine consumer, or is it part of a botnet that’s trying to attack my network?

The same goes the other way: whenever someone inside your network is trying to create a connection to the Internet, how do you know whether it’s an obscure blog or a malware website? Clearly, you don’t want to play whack-a-mole and try to keep track of every malicious actor on the Internet by yourself. For most security teams, it’s nothing more than a waste of time! You’d much rather rely on a company that makes it their business to focus on this.

Today, we’re announcing Magic Firewall support for our in-house Threat Intelligence feed. Cloudflare sees approximately 28 million HTTP requests each second and blocks 76 billion cyber threats each day. With almost 20% of the top 10 million Alexa websites on Cloudflare, we see a lot of novel threats pop up every day. We use that data to detect malicious actors on the Internet and turn it into a list of known malicious IPs. And we don’t stop there: we also integrate with a number of third party vendors to augment our coverage.

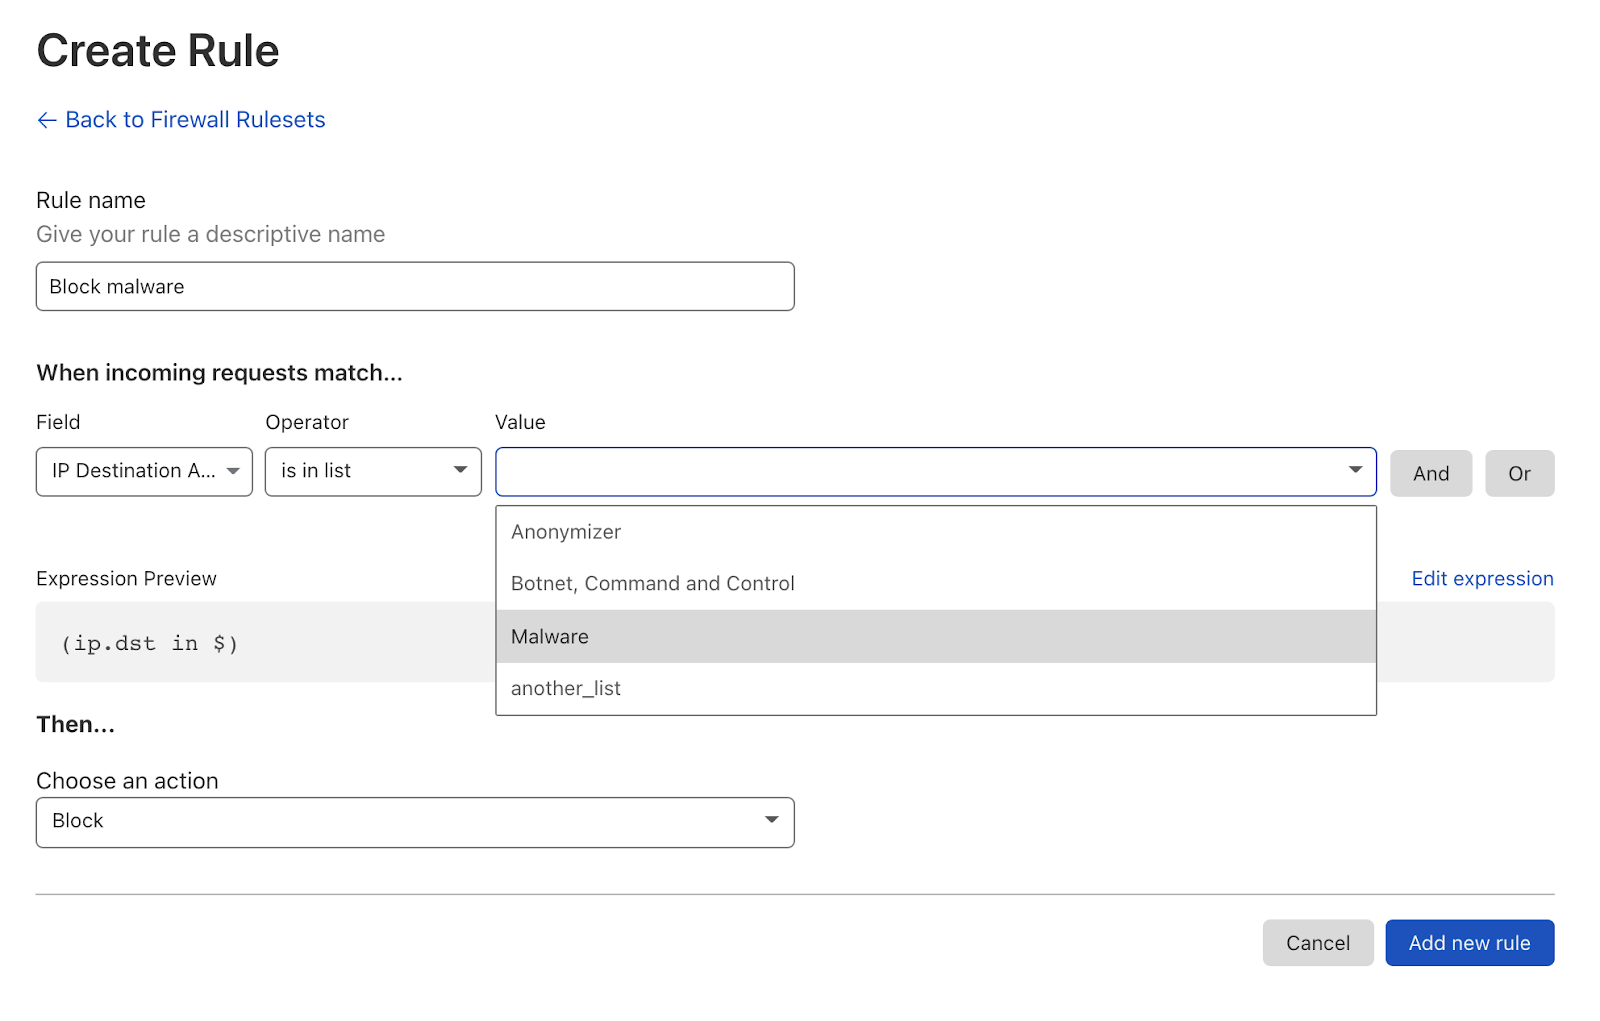
To match on any of the threat intel lists, just set up a rule in the UI as normal:

Magic Firewall gets Smarter

Threat intel feed categories include Malware, Anonymizer and Botnet Command-and-Control centers. Malware and Botnet lists cover properties on the Internet distributing malware and known command and control centers. Anonymizers contain a list of known forward proxies that allow attackers to hide their IP addresses.

In addition to the managed lists, you also have the flexibility of creating your own lists, either to add your own known set of malicious IPs or to make management of your known good network endpoints easier. As an example, you may want to create a list of all your own servers. That way, you can easily block traffic to and from it from any rule, without having to replicate the list each time.

Another particularly gnarly problem that many of our customers deal with is geo restrictions. Many are restricted in where they are allowed (or want to) accept traffic from and to. The challenge here is that nothing about an IP address tells you anything about the geolocation of it. And even worse, IP addresses regularly change hands, moving from one country to the other.

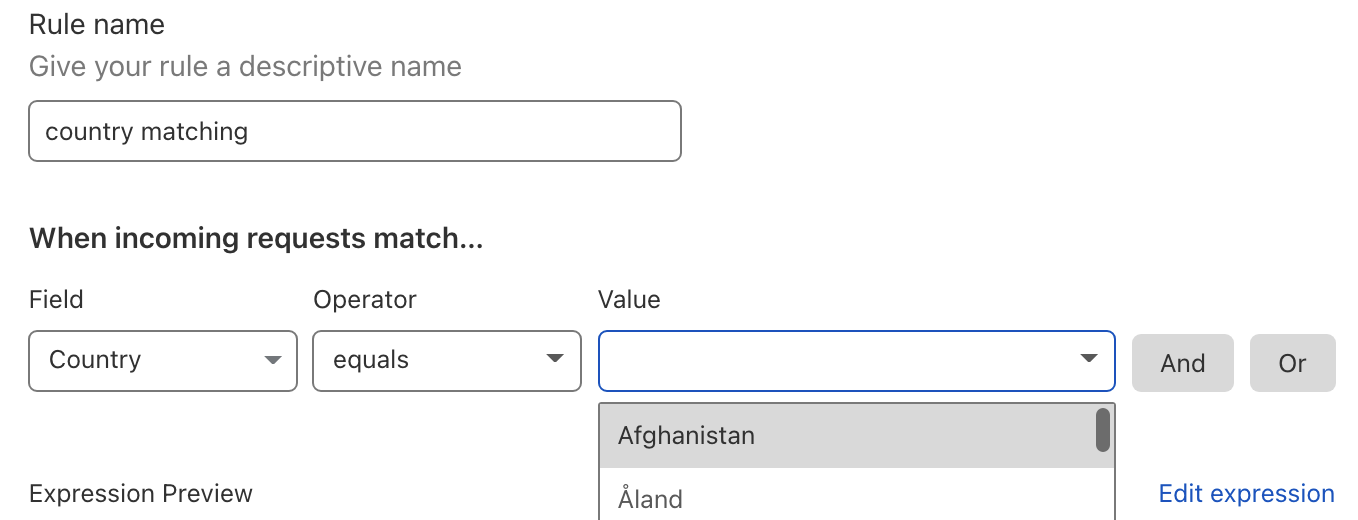
As of today, you can easily block or allow traffic to any country, without the management hassle that comes with maintaining lists yourself. Country lists are kept up to date entirely by Cloudflare, all you need to do is set up a rule matching on the country and we’ll take care of the rest.

Magic Firewall gets Smarter

Packet captures at the edge

Finally, we’re releasing a very powerful feature: packet captures at the edge. A packet capture is a pcap file that contains all packets that were seen by a particular network box (usually a firewall or router) during a specific time frame. Packet captures are useful if you want to debug your network: why can’t my users connect to a particular website? Or you may want to get better visibility into a DDoS attack, so you can put up better firewall rules.

Traditionally, you’d log into your router or firewall and start up something like tcpdump. You’d set up a filter to only match on certain packets (packet capture files can quickly get very big) and grab the file. But what happens if you want coverage across your entire network: on-premises, offices and all your cloud environments? You’ll likely have different vendors for each of those locations and have to figure out how to get packet captures from all of them. Even worse, some of them might not even support grabbing packet captures.

With Magic Firewall, grabbing packet captures across your entire network becomes simple: because you run a single network-firewall-as-a-service, you can grab packets across your entire network in one go. This gets you instant visibility into exactly where that particular IP is interacting with your network, regardless of physical or virtual location. You have the option of grabbing all network traffic (warning, it might be a lot!) or set a filter to only grab a subset. Filters follow the same Wireshark syntax that Magic Firewall rules use:

(ip.src in $cf.anonymizer)

We think these are great additions to Magic Firewall, giving you powerful primitives to police traffic and tooling to gain visibility into what’s actually going on in your network. Threat Intel, geo blocking and IP lists are all available today — reach out to your account team to have them activated. Packet captures is entering early access later in December. Similarly, if you’re interested, please reach out to your account team!

Handy Tips #15: Deploying Zabbix passive and active agents

Post Syndicated from Arturs Lontons original https://blog.zabbix.com/handy-tips-15-deploying-zabbix-passive-and-active-agents/17696/

Deploy Zabbix Agent to collect OS-level metrics.

There are multiple approaches to collecting OS-level metrics – from collecting only simple ping statistics to deploying an SNMP agent or using custom scripts. In many cases, this is either not sufficient or too time-consuming and not flexible enough. By deploying the Zabbix Agent you can enable a quick and easy way to collect OS-level metrics.

Deploy Zabbix Agent and collect metrics by polling the agent or autonomously sending data to your Zabbix Server:

  • Zabbix Agent supports polling (passive) and trapping (active)
  • Negligible performance overhead
  • Can be installed from packages on Linux or the MSI installer on Windows

  • Supports the most popular Unix-like operating systems
  • Zabbix Agent can be extended with custom User Parameters

Check out the video to learn how to deploy the Zabbix Agent in passive and active modes

How to configure and deploy Zabbix passive and active agents:

  1. Install the Zabbix repository and the Zabbix Agent on your host
  2. Open the zabbix_agentd.conf configuration file
  3. Specify your Zabbix Server address in the Server and ServerActive parameters
  4. Define the name of your host in the Hostname parameter
  5. Restart the Zabbix Agent
  6. Navigate to Configuration →  Hosts
  7. Create two hosts in Zabbix frontend – one for passive and one for active checks
  8. For passive Agent host – define an Agent interface containing the address of your Zabbix Server
  9. The active agent Host name should match the Hostname parameter value in the Agent configuration file
  10. Apply the corresponding Linux by Zabbix Agent/Linux by Zabbix Agent active template
  11. Navigate to Monitoring →  Latest data and check if you have received metrics from the hosts

Tips and best practices:
  • A single Zabbix Agent can collect metrics in both passive and active modes
  • Zabbix Agent is backward compatible
  • The frontend ZBX interface icon is related only to passive checks 
  • Active Zabbix Agent doesn’t require an interface configuration in Zabbix frontend
  • For active checks, the Zabbix Agent Hostname in the configuration file must match the Host name in the frontend

Hardening the security of your AWS Elastic Beanstalk Application the Well-Architected way

Post Syndicated from Laurens Brinker original https://aws.amazon.com/blogs/security/hardening-the-security-of-your-aws-elastic-beanstalk-application-the-well-architected-way/

Launching an application in AWS Elastic Beanstalk is straightforward. You define a name for your application, select the platform you want to run it on (for example, Ruby), and upload the source code. The default Elastic Beanstalk configuration is intended to be a starting point which prioritizes simplicity and ease of setup. This allows you to quickly deploy a web application on the AWS Cloud. For increased security of production applications, we recommend additional steps you can take to complement the default configuration.

In this post we will describe our recommendations, which are aligned with the AWS Well-Architected Framework, to help you harden the security posture of your Elastic Beanstalk applications. The Well-Architected Framework provides best practices to help you build secure, high-performing, resilient, and efficient infrastructure for your applications and workloads. Focusing on the Security pillar of the framework, we will walk you through additional configurations for increased network protection and protection of data at rest and in transit.

Introduction to Elastic Beanstalk

Elastic Beanstalk is an orchestration service that provisions and operates infrastructure in the AWS Cloud. You can use Elastic Beanstalk to deploy and manage applications in the cloud. Elastic Beanstalk supports many programming languages and frameworks, such as Java, .NET, PHP, Node.js, Python, Ruby, Go, and Docker. Elastic Beanstalk can help you decrease overhead by handling tasks such as resource provisioning, load balancing, auto scaling, and health monitoring. You only need to upload the application code. Elastic Beanstalk automatically integrates with other AWS services such as Amazon CloudWatch for logging and monitoring.

Target scenario for this post

This post shows you how to achieve the following things:

  • Launch a highly available Ruby application on Elastic Beanstalk.
  • Attach a MySQL database to the application using Amazon RDS.
  • Protect your sensitive data.
  • Align your application’s security configuration to the Security pillar of the Well-Architected Framework.

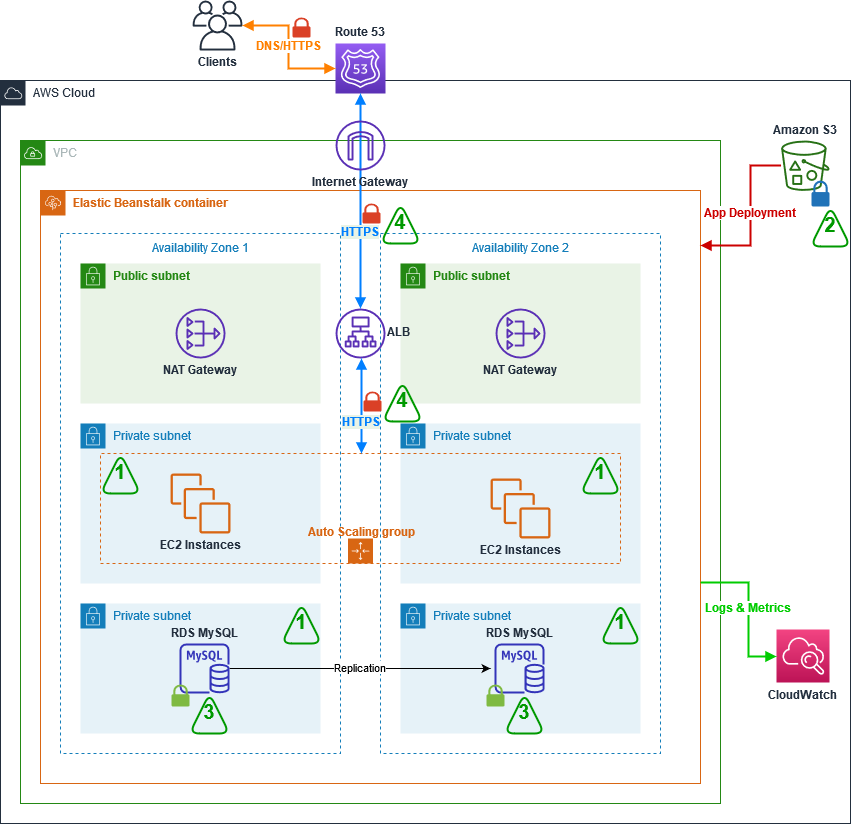
Figure 1: Target architecture for the two-tier web application deployed using Elastic Beanstalk

Figure 1: Target architecture for the two-tier web application deployed using Elastic Beanstalk

Figure 1 depicts the target architecture, which is a two-tier web application. Clients resolve the website’s domain name using the Domain Name System (DNS) service Amazon Route 53. An Application Load Balancer (ALB) is used to direct traffic to and from the Amazon EC2 instances which are running the web servers. The EC2 instances are deployed in an Auto Scaling group in private subnets. To ensure that clients can always access the application, the infrastructure is setup so that it can automatically deal with system failures and scale up when there’s an increase in demand. This is done by placing the EC2 instances in the Auto Scaling group across two Availability Zones for high availability. There is also an RDS MySQL database deployed in a private subnet, which is replicated to a stand-by instance in another Availability Zone for disaster recovery. Logs and Metrics are sent to CloudWatch, and Amazon Simple Storage Service (Amazon S3) is used to store logs and source code. Finally, a Network Address Translation (NAT) gateway and Internet gateway manage inbound and outbound traffic to subnets.

The following sections focus on the four main security configurations numbered in Figure 1:

  1. Deploying the EC2 and RDS instances from the web and database layer in private subnets.
  2. Encrypting the logging and source code S3 bucket.
  3. Encrypting the RDS instance and its stand-by replica.
  4. Encrypting data in transit by using the HTTPS protocol.

Strengthening your Elastic Beanstalk application based on the Security pillar of the Well-Architected Framework

To harden the security of your Elastic Beanstalk application, you can build on top of the default setup to incorporate the following security best practices:

  1. Protect networks – In the default Elastic Beanstalk setup, the EC2 instances are deployed together with an Application Load Balancer (ALB) in a public subnet. In most cases, EC2 instances do not need to be directly accessible from the internet and therefore should be placed in private subnets. The ALB should be left in the public subnet to provide a single entry-point for inbound traffic from external clients and forward this traffic to the instances over a private network. If these instances need to make a direct outbound connection to the internet, for example to call third-party APIs, we recommend creating a Network Address Translation (NAT) gateway in a public subnet, and adding a route from the private subnet where your instances are running to the NAT Gateway. Your instances can then send requests to the internet and receive corresponding responses through the NAT gateway, but the instances themselves will not be directly accessible from the internet. For more options on interactively accessing instances see AWS Systems Manager.
  2. Protect data at rest – We recommend encrypting data at rest. Elastic Beanstalk does not encrypt data stored in Amazon S3 buckets by default, so you should modify the default setup to encrypt the bucket. Similarly, when you set up an RDS database directly through Elastic Beanstalk, you don’t have the option to encrypt the database, so you need to set up your database independently and enable encryption.
  3. Protect data in transit – Web traffic sent between your clients and the ALB over the internet should use HTTPS rather than HTTP. The HTTPS protocol creates an encrypted connection through TLS (Transport Layer Security) between client and server before sending any web traffic. The default setup in Elastic Beanstalk uses HTTP, so the choice to use HTTPS and how to enable it sits with the user. Setting up HTTPS can be done with SSL / TLS server certificates (X.509 certificates) which you manage inside AWS using AWS Certificate Manager or through an external provider. ALB supports TLS-termination, which means that it takes care of the encryption and decryption of the traffic communicated with clients, and then forwards the traffic to the instances over the AWS private network.

Implementing the recommended best practices for your application

To implement the best practices from the section above, you will take the following steps to launch your application, protect networks and to protect data at rest and in transit:

  1. Create your own VPC with public and private subnets.
  2. Create a highly-available Elastic Beanstalk application.
  3. Modify the configuration to deploy instances in private subnets.
  4. Encrypt the log and source code bucket.
  5. Launch an encrypted RDS instance.
  6. Set up encryption in-transit by using the HTTPS protocol.

Create your VPC with public and private subnets

  1. In the AWS Management Console, go to VPC, and select Launch VPC wizard.
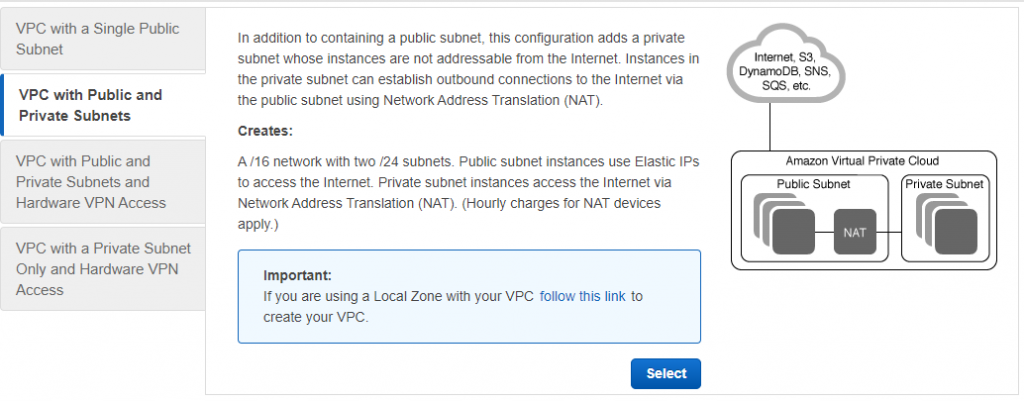
  2. Select the VPC with Public and Private Subnets option on the left-hand side, as shown in Figure 2.

Figure 2: Launch VPC wizard

Figure 2: Launch VPC wizard

  1. Click Select.
  2. Adjust the VPC specifications as needed. Specify a CIDR range and a name for the VPC. For the private and public subnets, you need to additionally specify the subnets CIDR range as well as which Availability Zone they should be created in. In order for instances in the private subnet to access the internet, the set-up creates a NAT gateway that resides in the public subnet. In order to do that, you need to specify an Elastic IP ID. If you don’t have an Elastic IP yet, under the VPC console go to Elastic IP addresses, click on Allocate Elastic IP address and Allocate. Use the Allocation ID in the VPC wizard.
  3. Select Create VPC.
  4. Because the target architecture is highly available, another set of public and private subnets needs to be created and set to reside in a different Availability Zone from the subnets you configured in step 4. This is done by going to the Subnets section in the VPC Console. Click on Create subnet, select the VPC you just created, add a new subnet, making sure to assign it to a different Availability Zone. Press Add new subnet to add a second subnet on the same configuration page. When done, press Create subnet.
  5. By default, the subnets will use the main routing table, which will treat them as private subnets. In order to make one of the newly created subnets public, it needs to be added to the route table, which has a route to the Internet Gateway. Go to the Route Tables section in the VPC Console and find the route table associated with your newly created VPC, which has the route to the Internet Gateway. This should be the Route Table which has 1 explicit subnet association. Click on the Route Table’s ID, and verify that there’s a route to a target with the igw- prefix. Then, under the Subnet association tab, edit the explicit subnet associations to include the newly created subnet.

After this is done, you should have two public and two private subnets across two Availability Zones for your new VPC.

Create a highly available Elastic Beanstalk application

The following steps will show you how to create a highly available Elastic Beanstalk application.

  1. In the AWS Management Console, choose Elastic Beanstalk, and then, in the Get Started section, select Create Application.
  2. Provide a name for the application and define the platform it should run on. In our example, the platform is Ruby.
  3. Provide the source code for your web application or use the sample code provided in the Elastic Beanstalk setup console.
    • To use the sample code, select Sample Application.
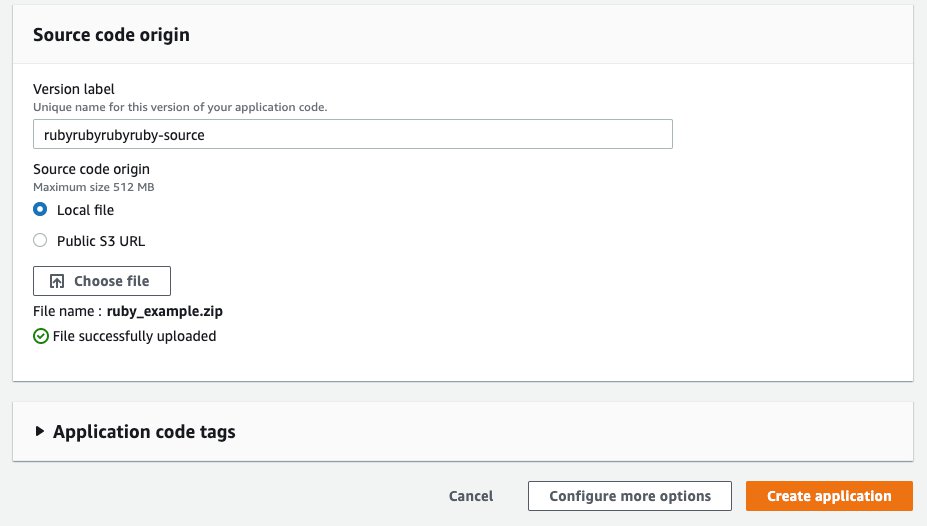
    • To upload your own source code, in the Source code origin section, for Version label, enter the name of your application code, and then for Source code origin, choose Local file, select Choose File, and navigate to the file that you want to use, as shown in Figure 3.

Figure 3: Source code origin section of the Elastic Beanstalk console

Figure 3: Source code origin section of the Elastic Beanstalk console

  1. Select Configure more options
  2. Depending on your application’s needs, you can select a configuration preset that includes recommended values for several configurations. Select High Availability to include a load balancer and auto scaling for multiple Availability Zones.

Deploy your instances in private subnets

In this step, you will set up Elastic Beanstalk to deploy the Application Load Balancer in public subnets to provide a point of access for inbound traffic from the internet, and you deploy the EC2 instances in a private subnet.

While still in the Configure more options settings:

  1. In the Network section, select Edit, and then, from the dropdown list, select the VPC that you just created.
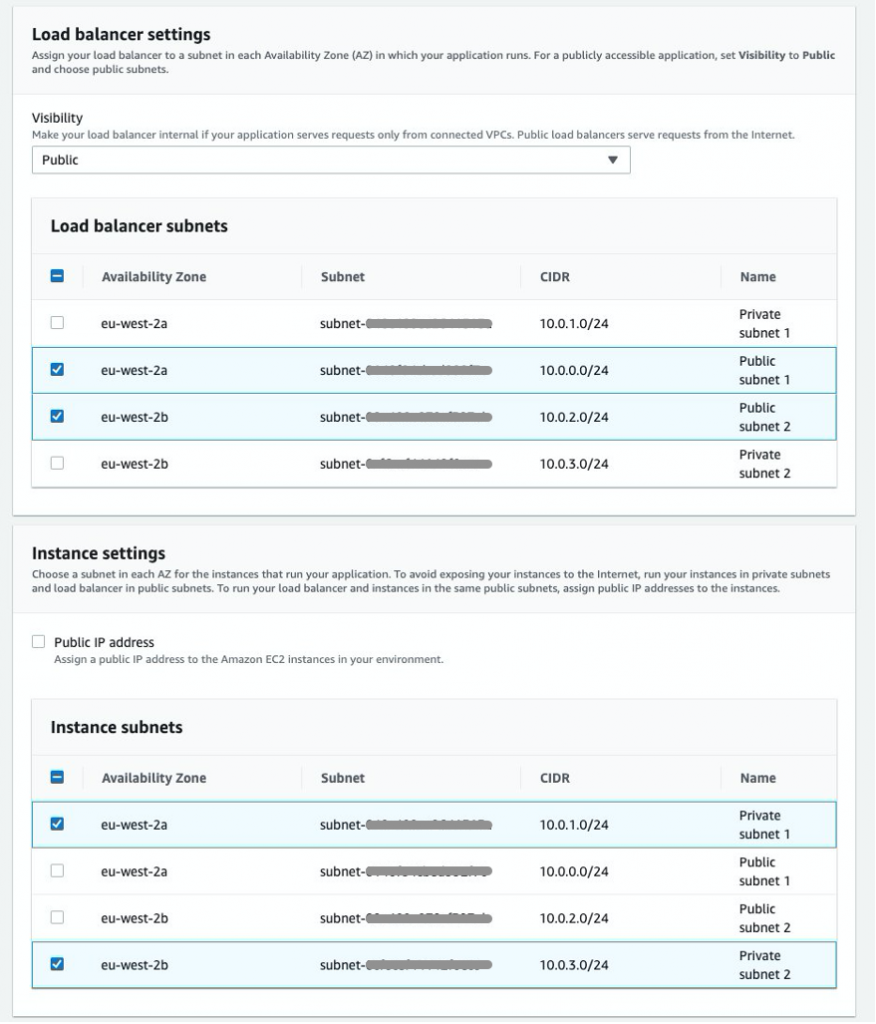
  2. To deploy your instances in private subnets, in the Load balancer settings section, for Load balancer subnets, check the box next to each public subnet, and in the Instance settings section, for Instance subnets, check the box next to each private subnet, as shown in Figure 4.
Figure 4: Elastic Beanstalk subnet settings for Load Balancer and instances

Figure 4: Elastic Beanstalk subnet settings for Load Balancer and instances

  1. Select Save.

Encrypt the log and source code bucket and block public access

After Elastic Beanstalk has created the application, you can encrypt the S3 bucket.

  1. Open the S3 console and choose the bucket that was created automatically as part of the Elastic Beanstalk setup. The bucket name will have the following structure: elasticbeanstalk-region-account-id.
  2. To encrypt the bucket, choose Properties, and then, for Default Encryption, select Edit, and for Server-side encryption, select Enable.
  3. For Encryption key type, you can use an S3-managed encryption key by selecting Amazon S3 key (SSE-S3). If you want more control over the keys used for encryption, select AWS Key Management Service key (SSE-KMS), which is an encryption key protected by AWS Key Management Service (KMS). Here, you can specify to use an AWS managed key or one of your own Customer managed keys from KMS. For more information on SSE-KMS, visit Protecting Data Using Server-Side Encryption with KMS keys Stored in AWS Key Management Service (SSE-KMS).
  4. Select Save changes.

Even though the bucket that was created by Elastic Beanstalk is non-public by default, we recommend to enable “S3 Block Public Access” at the account level or at least at the bucket level to prevent tampering or accidentally changing this setting in the future.

  1. In your S3 console, click on Block Public Access settings for this account.
  2. If Block all public access is not yet enabled, click on Edit, check the box next to Block all public access and click Save.
  3. Apart from that, you can also block public access at the bucket level. For this, click on the respective bucket, open the Permissions section and edit Block public access (bucket settings) similarly to how you did in step 2.

Launch an encrypted RDS instance

Elastic Beanstalk allows you to set up and run RDS instances in your Elastic Beanstalk environment. Until recently, the database was tied to the lifecycle of the Elastic Beanstalk environment, and its use was recommended to be limited to development and testing environments only. For example, if you previously launched an RDS instance using Elastic Beanstalk, and the Elastic Beanstalk environment was terminated, the RDS instance would also be deleted. As of October 6, 2021, Elastic Beanstalk now supports Database Decoupling, so that the database will persist when the environment is deleted.

However, Elastic Beanstalk currently does not allow you to set up encryption for your database. For this reason, this post shows you how to set up your Elastic Beanstalk application with a decoupled database, by creating the database directly in the RDS service, separate from your Elastic Beanstalk application. RDS allows you to encrypt your database.

Decoupling your database and setting it up directly through the RDS service in the AWS console will require additional steps for integration with your Elastic Beanstalk application, which this post will walk you through.

Note: If you are using the Elastic Beanstalk service to create your RDS instance, you can select one of three options:

  • The first option, enabled by selecting the Create snapshot retention option in the database settings in the Elastic Beanstalk console, makes sure that Elastic Beanstalk creates a snapshot of your database prior to termination. You can restore an existing snapshot of your database through the Elastic Beanstalk console. Bear in mind that there will be downtime of your database between snapshot creation and snapshot restore.
  • The second option, Retain, creates a decoupled database, which persists if the Elastic Beanstalk environment has been terminated.
  • The third option Delete removes the database upon termination.

In this step, you will create an encrypted RDS database, allow access to the database from your application’s instances only, and add the required environment variables to your application so you can use your database in the application.

  1. On the RDS service page in the console, select Create database.
  2. For the database creation method, select Standard create.
  3. For Engine options, choose MySQL and select the latest version.
  4. For Templates choose either the Dev/Test or Production template according to your use case.
  5. In the Settings section, provide a name to use as the database identifier and set a username and password.
  6. Select the appropriate DB instance class that meets your processing power and memory requirements.
  7. For Storage, select your storage type and allocate storage.
  8. If you need Multi-AZ deployment, in the Availability & durability section, choose Create a standby instance.
  9. In the Connectivity section, select the VPC that you created in the Create your VPC with public and private subnets section earlier in this blog post, and verify that Public access has been set to No. For VPC security group, choose Create new and provide a name to identify the group later on.
  10. In the Additional configuration section, under Encryption, choose Enable Encryption. You can choose the default AWS KMS key if you’re happy with AWS managing the keys, or provide a custom key if you want more control. Bear in mind that the encryption option cannot be changed after the database has been created.
  11. Leave the defaults for the remaining settings and select Create database.

After you set up the RDS database and your new Elastic Beanstalk application, you can add the database to your application.

  1. In the RDS console, go to your newly created RDS database and scroll down to Security group rules.
  2. Select the security group that has the CIDR/IP – Inbound type.
  3. Under Inbound rules, select the rule that is listed, and then select Edit inbound rules.
  4. Under the Source column, make sure Custom is selected, and in the search-box next to it, select the security group associated with your Elastic Beanstalk Auto Scaling group.

Important: As a security best practice, you should allow traffic to your RDS database from your instances only. Therefore, make sure the security group allows traffic only from the Auto Scaling group’s security group, and that it has no additional entries.

  1. To add the RDS details to the Elastic Beanstalk environment properties, go to your application’s environment in the Elastic Beanstalk service and navigate to Configuration > Software > Edit > Environment Properties. Add RDS_HOSTNAME, RDS_PORT, RDS_DB_NAME, RDS_USERNAME and RDS_PASSWORD as properties and provide the values that you used to set up the database.
  2. Restart the application by going back to your Elastic Beanstalk environment, and then under Environment actions, choose Restart app server(s).

After the server has restarted, you can access the RDS database in your web application by using the environment properties you set in the console, just as you would if you attached the database directly through the Elastic Beanstalk setup. For more information on using environment properties, visit Environment properties and other software settings.

The new database is now separate from your application and it is encrypted to provide data protection at rest.

Important: The environment properties, including the database username and password, are visible and stored in plain text in the Environment Properties in Elastic Beanstalk.

Depending on your security requirements, you can choose to use AWS Secrets Manager to protect your database credentials, which you can then fetch programmatically in your Elastic Beanstalk instance or through Elastic Beanstalk’s custom environment configuration files (.ebextensions). To learn more about using Secrets Manager to protect and rotate database credentials, see Rotate Amazon RDS database credentials automatically with AWS Secrets Manager. However, this will require additional configuration for Elastic Beanstalk and is beyond the scope of this post.

A second possibility is to use IAM database authentication, which allows you to use your Elastic Beanstalk’s EC2 IAM role to connect to your database. This method leverages short-lived authentication tokens rather than a static database password. In order to set this up, you need to enable IAM database authentication, create an IAM policy to allow IAM database access and create a database account for IAM authentication using the AWSAuthenticationPlugin (for MySQL). Authentication tokens are valid for 15 minutes, and if your web instances need to create a new database connection, or reconnect, authentication tokens will need to be refreshed if they have expired, otherwise the connection will be rejected.

For an implementation guide, check out How do I allow users to authenticate to an Amazon RDS MySQL DB instance using their IAM credentials. For Ruby applications, you can get the authentication token in your application by leveraging the auth_token_generator method in the Ruby aws-sdk.

Set up encryption in transit using the HTTPS protocol

In the Elastic Beanstalk architecture, you can encrypt data in transit at three connection points: from your clients to the load balancer, from the load balancer to the EC2 instances, and from the EC2 instances to the RDS database.

Securing the connection from clients to the ALB

You can use a custom domain name to use HTTPS for your Elastic Beanstalk environment and have your clients can connect securely to your environment. If you don’t have a domain name, you can assign a self-signed server certificate to your ALB to use HTTPS for development and testing purposes.

To secure the connection to your ALB, add a HTTPS listener for the traffic inbound port (typically 443) and attach an TLS / SSL server certificate (X.509 certificate). To generate certificates, use AWS Certificate Manager or third-party providers such as Let’s Encrypt. For a walkthrough on how to set up an HTTPS listener through the console or through .ebextensions configuration files, see the Configuring your Elastic Beanstalk environment’s load balancer to terminate HTTPS.

Securing the connection from the ALB to the EC2 instances

While securing the connection between clients and the ALB is enough for most applications, in some cases a complete end-to-end encryption may be required; for example, to comply with (external) regulations. To secure the connection from your ALB to your application running on an EC2 instance, you must use the .ebextensions configuration files to modify the software running on the instance. You then need to allow the HTTPS traffic to pass through from the ALB to your EC2 instance by allowing inbound traffic on port 443 on the instance’s security group. For a Ruby specific example, see Terminating HTTPS on EC2 instances running Ruby.

For a complete end-to-end encryption walkthrough, see How can I configure HTTPS for my Elastic Beanstalk environment?

Securing the RDS connection

To securely connect from your application to your RDS database, you can use SSL or TLS to encrypt the connection. You will need to download an RDS root certificate and require your application to use this certificate when connecting to the RDS instance to verify the RDS server certificate. For more information on how to download and use the root certificate to setup a secure RDS connection, see the Using SSL with a MySQL DB instance documentation page.

This post has shown you how to align your application with some of the security best practices of the Well-Architected Framework. After completing these steps, your architecture includes four key modifications to improve security:

  1. The EC2 and RDS instances are deployed in a private subnet.
  2. The logging and source code S3 bucket is encrypted.
  3. An encrypted RDS instance is attached.
  4. Encryption occurs in transit by using the HTTPS protocol.

Conclusion

In this post, we’ve covered the additional configuration you should be aware of to harden the security posture of your Elastic Beanstalk applications, aligning to the Security pillar of the Well-Architected Framework. The final setup you created uses a VPC and private subnets to allow internet access only to resources that require it, and provides encryption at rest and in transit using AWS Cloud Security services and secure protocols. The Well-Architected Framework describes additional concepts, design principles, and architectural best practices for designing and running workloads in the cloud. To learn more, see AWS Well-Architected.

 
If you have feedback about this post, submit comments in the Comments section below.

Want more AWS Security news? Follow us on Twitter.

Laurens Brinker

Laurens Brinker

Laurens Brinker is an Associate Solutions Architect based in London who is part of the Security Community at AWS. Laurens joined AWS as part of the TechU Graduate program in 2020 and now helps customers running their workloads securely in the AWS Cloud. Outside of work, Laurens enjoys cycling, a casual game of chess, and building small web applications.

Katja Philipp

Katja Philipp

Katja Philipp is an Associate Solutions Architect based in Germany. With a background in M.Sc. Information Systems, she joined AWS in September 2020 with the TechU Graduate program. She enables her customers in the Power & Utilities vertical with best practices around their cloud journey. Katja is passionate about sustainability and how technology can be leveraged to solve current challenges for a better future.

Laura Verghote

Laura Verghote

Laura Verghote is an Associate Technical Trainer based in London, UK. With a background in electrical engineering, she joined AWS in September 2020 with the TechU Graduate program. She delivers a variety of technical trainings to AWS customers across EMEA.

Kimessha Paupamah

Kimessha Paupamah

Kimessha Paupamah is a ProServe Consultant based in South Africa. With a background in Computer Science, she joined AWS in September 2020 with the TechU Graduate program. She accelerates customer business outcomes through guidance on how to architect, design, develop and implement the AWS platform. Kimessha is passionate about enabling customers to build innovative solutions in the cloud.

Benjamin Richer

Benjamin Richer

Benjamin Richer is an Associate Solutions Architect based in Paris. With a background in Network & Telecom, he joined AWS in 2020 through the TechU Graduate Program. Currently working in the Digital Native Business segment he helps grown up Startups optimizing their workload in the Cloud.

Lawsuit is described as typical SLAPP, aimed at silencing and destroying inconvenient media Eurohold Bulgaria sues Bivol for the record sum of €0,5 mln.

Post Syndicated from Николай Марченко original https://bivol.bg/eurohold-bulgaria-sues-bivol-for-the-record-sum-of-e05-mln.html

четвъртък 9 декември 2021


”A large Bulgarian company is suing investigative website Bivol for the record-high amount of 1 million BGN.” That is what attorney Alexander Kashumov announced at an event organized by the…

Делото е определено като типичен SLAPP – за заглушаване и унищожение на неудобна медия „Еврохолд България“ АД съди „Биволъ“ за рекордните 1 млн. лв.

Post Syndicated from Николай Марченко original https://bivol.bg/%D0%B5%D0%B2%D1%80%D0%BE%D1%85%D0%BE%D0%BB%D0%B4-%D0%B1%D1%8A%D0%BB%D0%B3%D0%B0%D1%80%D0%B8%D1%8F-%D0%B0%D0%B4-%D1%81%D1%8A%D0%B4%D0%B8-%D0%B1%D0%B8%D0%B2%D0%BE%D0%BB%D1%8A.html

четвъртък 9 декември 2021


Голяма българска фирма съди Сайта за разследваща журналистика „Биволъ“ за рекордната сума от 1 млн. лв. Това обяви адв. Александър Кашъмов по време на дискусията на Асоциацията на европейските журналисти…

[$] Python discusses deprecations

Post Syndicated from original https://lwn.net/Articles/877957/rss

Feature deprecations are often controversial, but many projects find it
necessary, or desirable, to lose some of the baggage that has accreted over
time. A mid-November request to get rid of three Python standard library
modules provides a case in point. It was initially greeted as a good idea
since the modules had been officially deprecated starting with
Python 3.6; there are better ways to accomplish their
tasks now. But, of course, removing a module breaks any project that uses
it, at least without the project making some, perhaps even trivial,
changes. The cost of that is not insignificant, and the value in doing so
is not always clear, which led to higher-level conversation about deprecations.

Using CloudTrail to identify unexpected behaviors in individual workloads

Post Syndicated from Volker Rath original https://aws.amazon.com/blogs/security/using-cloudtrail-to-identify-unexpected-behaviors-in-individual-workloads/

In this post, we describe a practical approach that you can use to detect anomalous behaviors within Amazon Web Services (AWS) cloud workloads by using behavioral analysis techniques that can be used to augment existing threat detection solutions. Anomaly detection is an advanced threat detection technique that should be considered when a mature security baseline as described in the security pillar of the AWS Well-Architected framework is in place.

Why you should consider behavior-based detection in the cloud

Traditionally, threat detection solutions focus on the endpoint and the network and analyze log events for known indicators of attack and indicators of compromise Other forms of threat detection focus on the user and data using products such as data loss prevention and user and endpoint behavior analytics to detect suspicious user behavior at the data layer. Both solution types analyze operating system, application level, and network logs and focus on the detection of known tactics, techniques, and procedures, but the cloud control plane and other cloud native log sources are outside the use case of traditional threat detection solutions

Being able to detect malicious behavior in your environment is necessary to stay secure in the cloud. This includes the detection of events when cloud services might have been misused. The challenge is that related activities are logged on a control plane level and don’t leave any traces in log sources that are traditionally analyzed for threat detection. For example, unwanted data movements between cloud services or cloud accounts use the cloud backplane for data transfers and don’t necessarily touch any endpoint or network gateway. Therefore, related events only appear within cloud native logs such as AWS CloudTrail or AWS Config and not in network or operating system logs.
 

Figure 1: Solution architecture example

Figure 1: Solution architecture example

In the simplified example shown in Figure 1, only data streams that pass from the cloud to the firewall and then to AWS services are visible to the endpoint (an Amazon EC2 instance) or the gateway security solution.

Data streams that pass through serverless solutions and activities of cloud native services are only visible in cloud native logs.

Amazon GuardDuty is a threat detection service that continuously monitors for malicious activity and unauthorized behavior to protect AWS accounts, and analyzes not only the network flow logs but also the cloud control plane. GuardDuty uses threat intelligence coupled with machine learning and behavior models to detect threats such as account compromise and unusual data access or communications, and should be activated in each cloud account.

But not all unwanted behavior follows known attack patterns. Unwanted behaviors can also include normal activity inside a cloud environment that is different from the intended behavior of a particular workload. Each activity or log entry by itself might not look malicious, but a series of events can reveal possible malicious intent when compared to the individual context of the application. Because there are no bad events as such in CloudTrail like in a firewall or antivirus log, the challenge is to detect threats based on noncompliant behaviors in the context of the application use case and not on known threat vectors.

Anomaly detection is playing an increasingly important role in defense strategies because of the constantly evolving attack and obfuscation techniques that make it hard to detect threats based on known tactics, techniques, and procedures.

What does unwanted behavior look like?

One approach to identifying key events that are related to unwanted behaviors is to identify a set of anomaly-related questions around common cloud activities that consider the workload context. Depending on the workload type, unwanted cloud API events and related questions could look like the following:

Event: An EC2 instance was launched. 
Question: Was an unexpected user or role used or was the EC2 instance launched outside the pipeline?

Event: A user or role performs many API list and describe events within a short timeframe. 
Questions: Does the application normally generate list and describe API calls in production? If not, this could be reconnaissance activity performed by an intruder.

Event: A user or role creates and shares an Amazon Elastic Block Store (Amazon EBS) snapshot with another account. 
Question: Is the snapshot sharing event expected? If not, it could be an attempt to exfiltrate data.

Event: Many failed API calls are detected in CloudTrail. 
Question: Are these failed calls around sensitive services or information? If yes, an unauthorized user could be exploring the environment.

Event: Many ListBucket events are detected for a sensitive Amazon Simple Storage Service (Amazon S3) bucket. 
Question: Are these events unexpected and performed by an unexpected identity? If yes, an unauthorized user performing an S3 bucket enumeration might indicate a reconnaissance activity.

After a set of questions has been identified, they can be converted into application specific threat detection use cases, which can be applied to sensitive production environments. This is a useful strategy because these environments typically have a predictable usage pattern. The predictable patterns reduce the chance of false positives, making it worth the effort of developing use cases for monitoring anomalies. Threat detection use cases can be identified within CloudTrail logs using security information and event management (SIEM) tools or Amazon CloudWatch rules.

Detecting anomalies in CloudTrail with CloudWatch

Activities within your AWS account can be recorded with CloudTrail, which makes it the ideal service not only for deeper investigations into past cloud activities but also to detect unwanted behaviors in near real time. CloudTrail sends logs to an S3 bucket and can forward events to CloudWatch. Using CloudWatch, you can perform searches across all CloudTrail events and define CloudWatch alarms for automatic notifications.

You can create alerts for individual CloudTrail events that you consider an anomaly by creating CloudWatch filters and alarms. A filter defines the events that you want to monitor and an alarm defines the threshold when you want to be notified.

To create a filter for the preceding S3 bucket enumeration example, you would select the CloudTrail log group, and then select Metric Filters and create a new metric filter, as shown in Figure 2.
 

Figure 2: Create CloudWatch metric filter

Figure 2: Create CloudWatch metric filter

Excluding the userAgent AWS Internal excludes S3 access activities performed by other AWS services such as AWS Access Analyzer or Amazon Macie which can be considered normal behavior.

Save this metric filter in a new name space that you use for all of your anomaly detection monitoring. After you have created the filter, create a new CloudWatch alarm based on your filter. Depending on your filter and alarm thresholds, you will receive CloudWatch alarm notifications through a Amazon Simple Notification Service (Amazon SNS) topic and have the opportunity to automatically launch other actions that can perform incident response activities.

After an alert is raised, you can use the same filter pattern to search for the relevant events in CloudWatch. The CloudTrail events will provide more information about who performed the S3 ListBucket events such as IP address (sourceIPAddress), who performed the action (userIdentity), or if the action was performed through the AWS Management Console or AWS Command Line Interface (AWS CLI) (userAgent = aws-internal or aws-cli).   Figure 3 that follows is an example of a CloudTrail log.
 

Figure 3: CloudTrail example log

Figure 3: CloudTrail example log

Detecting anomalies using traps

Another simple, but effective technique to detect intruders based on unwanted behaviors is to use decoy services such as canaries or honey pots. Honey pots are designed to provide information about the behavior of attackers by providing them fake production environments that they can explore—such as hosts within a subnet or data stores such as databases or storage services with dummy data. Canaries are identities or access tokens within honey pot environments that look like privileged identities. Honey pots and canaries both appear attractive to attackers due to the names that are used for users, databases, or host names, but don’t expose the organization to risk if compromised.

Using CloudWatch alarms, you can monitor CloudTrail for events that indicate that attackers have started to explore the honey pot or tried to laterally move using the canary access token. By acting like an attacker yourself, you can generate test events within CloudTrail that will help you to identify the event details—such as event sources, event names, and parameters—that you want to monitor. Here are some examples of CloudTrail events you can monitor for different kinds of traps.

Trap Event source Event name Example instance or user name
Login attempt using a canary identity signin.amazonaws.com ConsoleLogin Backup_Admin
Assume role attempt using a canary role sts.amazonaws.com AssumeRole DevOps_role
Exploration of a honey pot database dynamodb.amazonaws.com ListTable CustomerAccounts
Exploration of a honey pot storage service s3.amazonaws.com GetObject PasswordBackup

Traps are typically deployed in production environments where access and use patterns are predictable and strictly controlled.  They’re a cost effective and easy to implement solution that can provide alarms with a high degree of certainty. Traps also offer a good chance to catch even the most sophisticated threat actors; especially when they use highly automated attacks.

Detecting statistical anomalies

AWS CloudTrail Insights is a feature of CloudTrail that can be used to identify unusual operational activity in your AWS accounts such as spikes in resource provisioning, bursts of AWS Identity and Access Management (IAM) activity, or gaps in periodic maintenance activity.

CloudTrail Insights can provide primary indicators for noncompliant behaviors by establishing a baseline for normal behavior and then generating Insights events when it detects unusual patterns. Primary indicators are events that initiate an investigation.

But even when statistical changes haven’t reached alert thresholds and no issue is raised, statistical insights can be used as a supporting secondary indicator during investigations to better understand the context of an incident. Even minor changes of specific API calls around sensitive data can provide valuable information after an alert from another solution such as GuardDuty, or when the previously described anomaly detection techniques have been raised.

Figure 4 that follows is an example of an Insights chart showing API calls over time.
 

Figure 4: CloudTrail Insights example chart

Figure 4: CloudTrail Insights example chart

Conclusion

In this post I described the importance of monitoring sensitive workloads for noncompliant or unwanted behaviors to complement existing security solutions. Anomaly detection in the cloud monitors cloud service activities on the control plane and checks to see if the behavior is expected in the context of each workload. The effort to set up and support the tools described in this blog post leads to an affordable, practical, and powerful mechanism for the detection of sophisticated threat actors in the cloud. To learn more about how you can analyze API activities in the cloud, see Analyzing AWS CloudTrail in Amazon CloudWatch in the AWS Management & Governance Blog.

If you have feedback about this post, submit comments in the Comments section below. If you have questions about this post, start a new thread on the Amazon ADD FORUM NAME AND LINK or contact AWS Support.

Want more AWS Security how-to content, news, and feature announcements? Follow us on Twitter.

Author

Volker Rath

Volker is a security, risk, and compliance (SRC) principal within AWS Professional Services. During his 20 years of experience in IT security, he developed many solutions that helped organizations improve their security management capabilities. He currently focuses on cloud native threat management strategies as well as SRC strategies for enterprise cloud platforms in the FSI industry. Adventure motorbike travels and basketball are his preferred hobbies in the analog world.

A Dream Team-Up: Integrate InsightAppSec With ServiceNow ITSM

Post Syndicated from Tom Caiazza original https://blog.rapid7.com/2021/12/08/a-dream-team-up-integrate-insightappsec-with-servicenow-itsm/

A Dream Team-Up: Integrate InsightAppSec With ServiceNow ITSM

At Rapid7, we are constantly improving InsightAppSec and tCell with the goal of making our customers’ lives easier. Over the last few months alone, we’ve improved the way your team structures permissions, integrated with Microsoft’s .Net 6.0, and automated authentication to make scan after scan more seamless and efficient. Yeah, you could say we’re obsessed.

So it should come as no surprise that we’re announcing a brand-new integration with ServiceNow to make it easier to create tickets for vulnerability scans and remediation across your security and development teams.

A perfect match

ServiceNow needs no introduction. It is the leader in IT service management (ITSM) vendors, according to the Gartner Magic Quadrant, and has a huge share of the ITSM market. Companies use ServiceNow for triaging, prioritizing, and tracking everything from development tasks, to system performance, to security. It’s the big dog in the space, and with this new integration, InsightAppSec works seamlessly within the system your company already uses for IT service management.

InsightAppSec for ITSM is now available right in the ServiceNow app store and can be enabled quickly, easily, and (crucially) at no additional cost to you!

What it means for your team

Here are a few ways InsightAppSec and ServiceNow will make your and your team’s lives better:

  • Better teaming: Drive visibility, prioritization, and remediation of vulnerabilities across IT, Sec, and DevOps teams.
  • Faster remediation: Selected vulnerabilities are sent from InsideAppSec to ServiceNow as a new ticket. Users can then update the tickets within ServiceNow and the status changes automatically update within InsightAppSec. For example, a resolved status in ServiceNow will automatically update the vulnerability to “Remediated” in IAS.
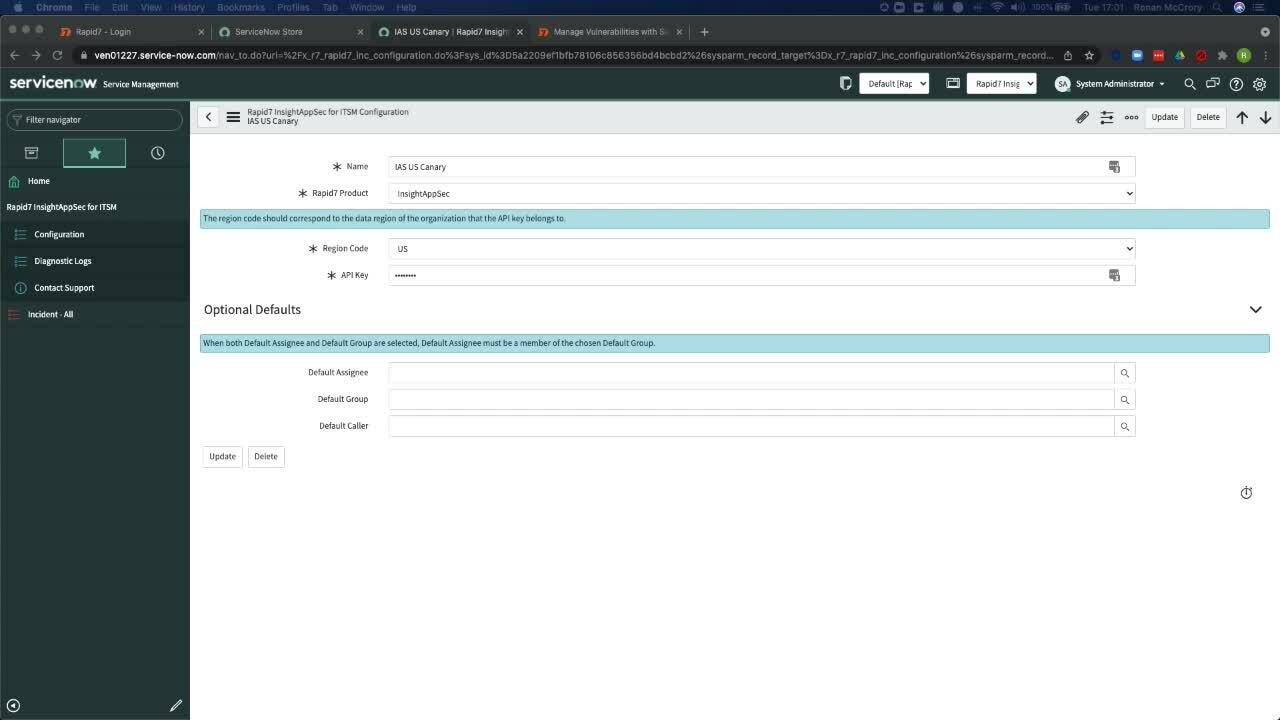
  • Quick and easy setup: Yes, we mentioned this before, but it is just so dang easy. Add InsightAppSec directly from the ServiceNow app store, and configure and maintain it in a workflow similar to those of other ServiceNow integrations.

And this is just the beginning. We’re already looking at ways to integrate InsightAppSec with ServiceNow to make coordination across both platforms as simple as can be. Because when everything works together seamlessly, your company is safer and more efficient, and your security and development teams work better together.

If you would like to learn more about how InsightAppSec is integrating with ServiceNow, check out this video demonstration.


A Dream Team-Up: Integrate InsightAppSec With ServiceNow ITSM

NEVER MISS A BLOG

Get the latest stories, expertise, and news about security today.

New German Government is Pro-Encryption and Anti-Backdoors

Post Syndicated from Bruce Schneier original https://www.schneier.com/blog/archives/2021/12/new-german-government-is-pro-encryption-and-anti-backdoors.html

I hope this is true:

According to Jens Zimmermann, the German coalition negotiations had made it “quite clear” that the incoming government of the Social Democrats (SPD), the Greens and the business-friendly liberal FDP would reject “the weakening of encryption, which is being attempted under the guise of the fight against child abuse” by the coalition partners.

Such regulations, which are already enshrined in the interim solution of the ePrivacy Regulation, for example, “diametrically contradict the character of the coalition agreement” because secure end-to-end encryption is guaranteed there, Zimmermann said.

Introducing backdoors would undermine this goal of the coalition agreement, he added.

I have written about this.

Patch Now: Sonicwall Fixes Multiple Vulnerabilities in SMA 100 Devices

Post Syndicated from Glenn Thorpe original https://blog.rapid7.com/2021/12/08/patch-now-sonicwall-fixes-multiple-vulnerabilities-in-sma-100-devices/

Summary

Patch Now: Sonicwall Fixes Multiple Vulnerabilities in SMA 100 Devices

On December 7, 2021, Sonicwall released a security advisory that includes patching guidance for five vulnerabilities in SonicWall SMA 100 series devices that were discovered by Rapid7 (including CVE-2021-20038 which is rated CVSSv3 9.8, critical), as well as several other CVEs discovered by NCC Group. While exploitation has not yet started for these vulnerabilities, SonicWall “strongly urges” organizations to apply the appropriate patches.

From Sonicwall’s advisory:

Issue ID Summary CVE CVSS Reporting Party Impacted Versions
SMA-3217 Unauthenticated Stack-Based Buffer Overflow CVE-2021-20038 9.8 Rapid7 10.2.0.8-37sv, 10.2.1.1-19sv, 10.2.1.2-24sv
SMA-3204 Authenticated Command Injection CVE-2021-20039 7.2 Rapid7 9.0.0.11-31sv, 10.2.0.8-37sv, 10.2.1.1-19sv
SMA-3206 Unauthenticated File Upload Path Traversal CVE-2021-20040 6.5 Rapid7, NCCGroup 10.2.0.8-37sv, 10.2.1.1-19sv
SMA-3207 Unauthenticated CPU Exhaustion CVE-2021-20041 7.5 Rapid7 9.0.0.11-31sv, 10.2.0.8-37sv, 10.2.1.1-19sv
SMA-3208 Unauthenticated Confused Deputy CVE-2021-20042 6.3 Rapid7 9.0.0.11-31sv, 10.2.0.8-37sv, 10.2.1.1-19sv
SMA-3231 Heap-Based Buffer Overflow CVE-2021-20043 8.8 NCCGroup 10.2.0.8-37sv, 10.2.1.1-19sv
SMA-3233 Post-Authentication Remote Command Execution CVE-2021-20044 7.2 NCCGroup 10.2.0.8-37sv, 10.2.1.1-19sv
SMA-3235 Multiple Unauthenticated Heap-Based and Stack Based Buffer Overflow CVE-2021-20045 9.4 NCCGroup 10.2.0.8-37sv, 10.2.1.1-19sv

Affected versions

The issues listed above impact SMA 100 series appliances (SMA 200, 210, 400, 410, 500v).

Full disclosure scheduled for January 2022

Rapid7 will release the technical details and proof-of-concept code in January 2022 as part of our coordinated vulnerability disclosure process.

Guidance

As with all critical, network-edge appliances, Rapid7 recommends that vulnerabilities be patched immediately. SonicWall devices have previously been exploited at scale in 2021 and are generally high-value targets for attackers. Sonicwall does not list any workarounds for these issues. For more information, see SonicWall’s advisory.

Rapid7 customers

InsightVM and Nexpose customers can assess their exposure to all eight of the CVEs in this advisory with vulnerability checks in the December 7, 2021 content release.

NEVER MISS A BLOG

Get the latest stories, expertise, and news about security today.

Creating a Multi-Region Application with AWS Services – Part 1, Compute and Security

Post Syndicated from Joe Chapman original https://aws.amazon.com/blogs/architecture/creating-a-multi-region-application-with-aws-services-part-1-compute-and-security/

Building a multi-Region application requires lots of preparation and work. Many AWS services have features to help you build and manage a multi-Region architecture, but identifying those capabilities across 200+ services can be overwhelming.

In this 3-part blog series, we’ll explore AWS services with features to assist you in building multi-Region applications. In Part 1, we’ll build a foundation with AWS security, networking, and compute services. In Part 2, we’ll add in data and replication strategies. Finally, in Part 3, we’ll look at the application and management layers.

Considerations before getting started

AWS Regions are built with multiple isolated and physically separate Availability Zones (AZs). This approach allows you to create highly available Well-Architected workloads that span AZs to achieve greater fault tolerance. There are three general reasons that you may need to expand beyond a single Region:

  • Expansion to a global audience as an application grows and its user base becomes more geographically dispersed, there can be a need to reduce latencies for different parts of the world.
  • Reducing Recovery Point Objectives (RPO) and Recovery Time Objectives (RTO) as part of disaster recovery (DR) plan.
  • Local laws and regulations may have strict data residency and privacy requirements that must be followed.

Ensuring security, identity, and compliance

Creating a security foundation starts with proper authentication, authorization, and accounting to implement the principle of least privilege. AWS Identity and Access Management (IAM) operates in a global context by default. With IAM, you specify who can access which AWS resources and under what conditions. For workloads that use directory services, the AWS Directory Service for Microsoft Active Directory Enterprise Edition can be set up to automatically replicate directory data across Regions. This allows applications to reduce lookup latencies by using the closest directory and creates durability by spanning multiple Regions.

Applications that need to securely store, rotate, and audit secrets, such as database passwords, should use AWS Secrets Manager. It encrypts secrets with AWS Key Management Service (AWS KMS) keys and can replicate secrets to secondary Regions to ensure applications are able to obtain a secret in the closest Region.

Encrypt everything all the time

AWS KMS can be used to encrypt data at rest, and is used extensively for encryption across AWS services. By default, keys are confined to a single Region. AWS KMS multi-Region keys can be created to replicate keys to a second Region, which eliminates the need to decrypt and re-encrypt data with a different key in each Region.

AWS CloudTrail logs user activity and API usage. Logs are created in each Region, but they can be centralized from multiple Regions and multiple accounts into a single Amazon Simple Storage Service (Amazon S3) bucket. As a best practice, these logs should be aggregated to an account that is only accessible to required security personnel to prevent misuse.

As your application expands to new Regions, AWS Security Hub can aggregate and link findings to a single Region to create a centralized view across accounts and Regions. These findings are continuously synced between Regions to keep you updated on global findings.

We put these features together in Figure 1.

Multi-Region security, identity, and compliance services

Figure 1. Multi-Region security, identity, and compliance services

Building a global network

For resources launched into virtual networks in different Regions, Amazon Virtual Private Cloud (Amazon VPC) allows private routing between Regions and accounts with VPC peering. These resources can communicate using private IP addresses and do not require an internet gateway, VPN, or separate network appliances. This works well for smaller networks that only require a few peering connections. However, as the number of peered connections increases, the mesh of peered connections can become difficult to manage and troubleshoot.

AWS Transit Gateway can help reduce these difficulties by creating a central transitive hub to act as a cloud router. A Transit Gateway’s routing capabilities can expand to additional Regions with Transit Gateway inter-Region peering to create a globally distributed private network.

Building a reliable, cost-effective way to route users to distributed Internet applications requires highly available and scalable Domain Name System (DNS) records. Amazon Route 53 does exactly that.

Route 53 routing policies can route traffic to a record with the lowest latency, or automatically fail over a record. If a larger failure occurs, the Route 53 Application Recovery Controller can simplify the monitoring and failover process for application failures across Regions, AZs, and on-premises.

Amazon CloudFront’s content delivery network is truly global, built across 300+ points of presence (PoP) spread throughout the world. Applications that have multiple possible origins, such as across Regions, can use CloudFront origin failover to automatically fail over the origin. CloudFront’s capabilities expand beyond serving content, with the ability to run compute at the edge. CloudFront functions make it easy to run lightweight JavaScript functions, and AWS Lambda@Edge makes it easy to run Node.js and Python functions across these 300+ PoPs.

AWS Global Accelerator uses the AWS global network infrastructure to provide two static anycast IPs for your application. It automatically routes traffic to the closest Region deployment, and if a failure is detected it will automatically redirect traffic to a healthy endpoint within seconds.

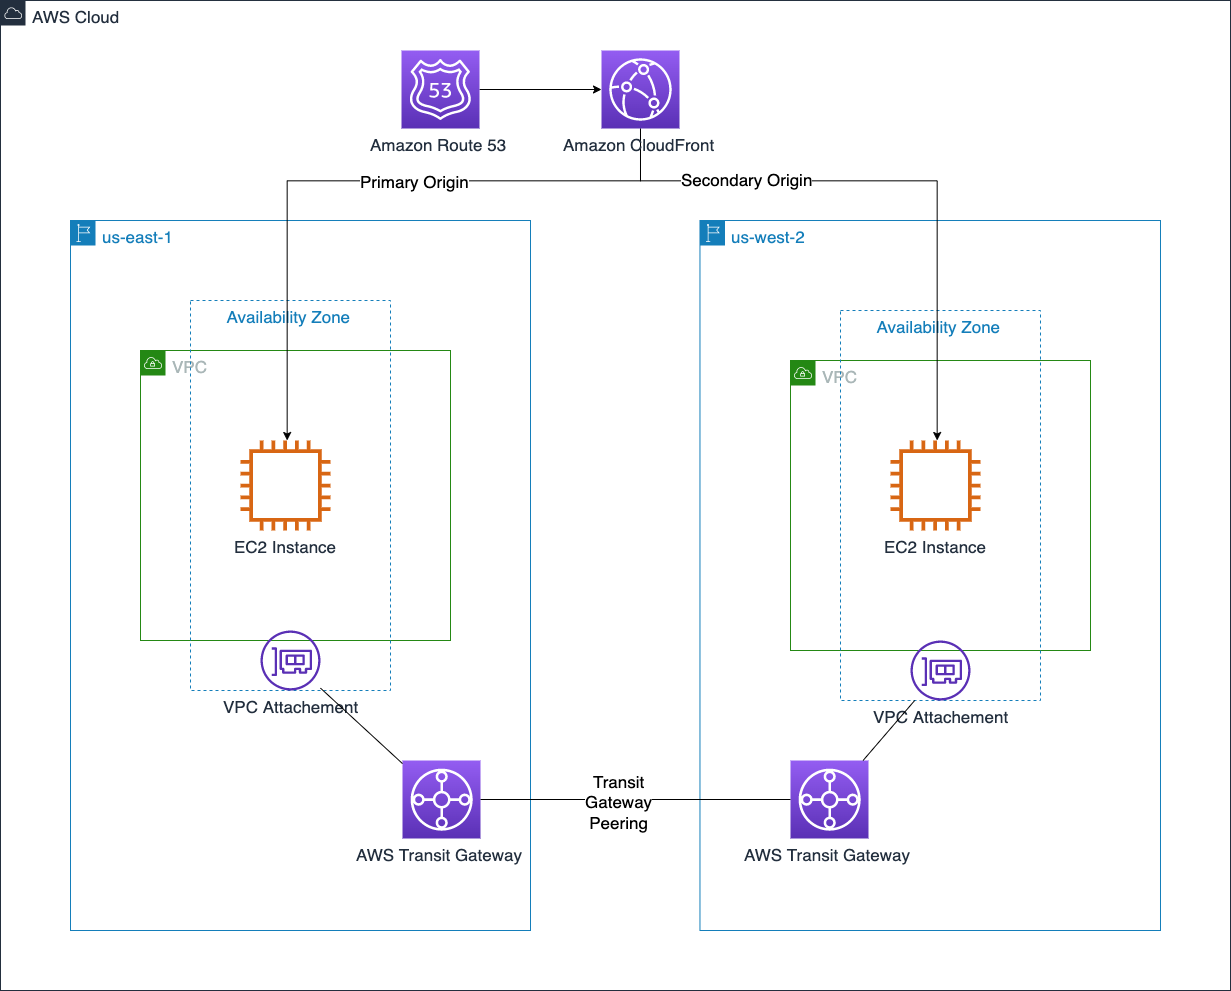
Figure 2 brings these features together to create a global network across two Regions.

AWS VPC connectivity and content delivery

Figure 2. AWS VPC connectivity and content delivery

Building the compute layer

An Amazon Elastic Compute Cloud (Amazon EC2) instance is based on an Amazon Machine Image (AMI). An AMI specifies instance configurations such as the instance’s storage, launch permissions, and device mappings. When a new standard image needs to be created, EC2 Image Builder can be used to streamline copying AMIs to selected Regions.

Although EC2 instances and their associated Amazon Elastic Block Store (Amazon EBS) volumes live in a single AZ, Amazon Data Lifecycle Manager can automate the process of taking and copying EBS snapshots across Regions. This can enhance DR strategies by providing a relatively easy cold backup-and-restore option for EBS volumes.

As an architecture expands into multiple Regions, it can become difficult to track where instances are provisioned. Amazon EC2 Global View helps solve this by providing a centralized dashboard to see Amazon EC2 resources such as instances, VPCs, subnets, security groups, and volumes in all active Regions.

Microservice-based applications that use containers benefit from quicker start-up times. Amazon Elastic Container Registry (Amazon ECR) can help ensure this happens consistently across Regions with private image replication at the registry level. An ECR private registry can be configured for either cross-Region or cross-account replication to ensure your images are ready in secondary Regions when needed.

We bring these compute layer features together in Figure 3.

AMI and EBS snapshot copy across Regions

Figure 3. AMI and EBS snapshot copy across Regions

Summary

It’s important to create a solid foundation when architecting a multi-Region application. These foundations pave the way for you to move fast in a secure, reliable, and elastic way as you build out your application. In this post, we covered options across AWS security, networking, and compute services that have built-in functionality to take away some of the undifferentiated heavy lifting. We’ll cover data, application, and management services in future posts.

Ready to get started? We’ve chosen some AWS Solutions and AWS Blogs to help you!

Looking for more architecture content? AWS Architecture Center provides reference architecture diagrams, vetted architecture solutions, Well-Architected best practices, patterns, icons, and more!

Snaring the Bad Folks

Post Syndicated from Netflix Technology Blog original https://netflixtechblog.com/snaring-the-bad-folks-66726a1f4c80

Project by Netflix’s Cloud Infrastructure Security team (Alex Bainbridge, Mike Grima, Nick Siow)

Cloud security is a hard problem, but an even harder one is cloud security at scale. In recent years we’ve seen several cloud focused data breaches and evidence shows that threat actors are becoming more advanced with their techniques, goals, and tooling. With 2021 set to be a new high for the number of data breaches, it was plainly evident that we needed to evolve how we approach our cloud infrastructure security strategy.

In 2020, we decided to reinvent how we handle cloud security findings by redefining how we write and respond to cloud detections. We knew that given our scale, we needed to rely heavily on automations and that we needed to build our solutions using battle tested scalable infrastructure.

Introducing Snare

Snare Logo

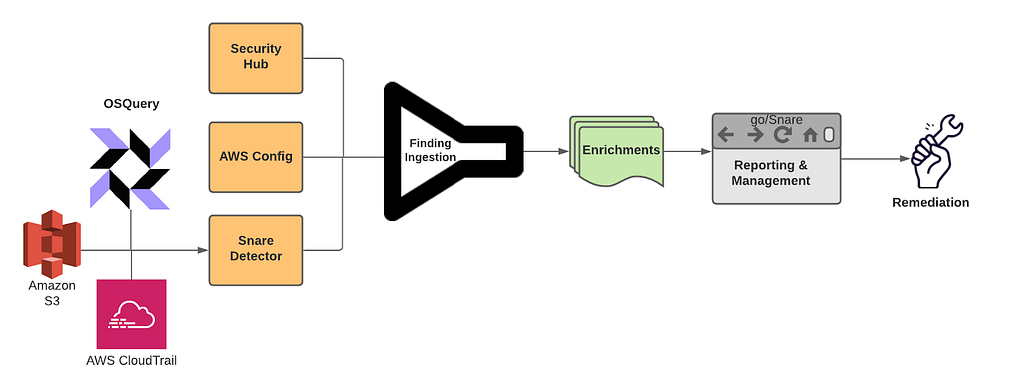
Snare is our Detection, Enrichment, and Response platform for handling cloud security related findings at Netflix. Snare is responsible for receiving millions of records a minute, analyzing, alerting, and responding to them. Snare also provides a space for our security engineers to track what’s going on, drill down into various findings, follow their investigation flow, and ensure that findings are reaching their proper resolution. Snare can be broken down into the following parts: Detection, Enrichment, Reporting & Management, and Remediation.

Snare Finding Lifecycle

Overview

Snare was built from the ground up to be scalable to manage Netflix’s massive scale. We currently process tens of millions of log records every minute and analyze these events to perform in-house custom detections. We collect findings from a number of sources, which includes AWS Security Hub, AWS Config Rules, and our own in-house custom detections. Once ingested, findings are then enriched and processed with additional metadata collected from Netflix’s internal data sources. Finally, findings are checked against suppression rules and routed to our control plane for triaging and remediation.

Where We Are Today

We’ve developed, deployed, and operated Snare for almost a year, and since then, we’ve seen tremendous improvements while handling our cloud security findings. A number of findings are auto remediated, others utilize slack alerts to loop in the oncall to triage via the Snare UI. One major improvement was a direct time savings for our detection squad. Utilizing Snare, we were able to perform more granular tuning and aggregation of findings leading to an average of 73.5% reduction in our false positive finding volume across our ingestion streams. With this additional time, we were able to focus on new detections and new features for Snare.

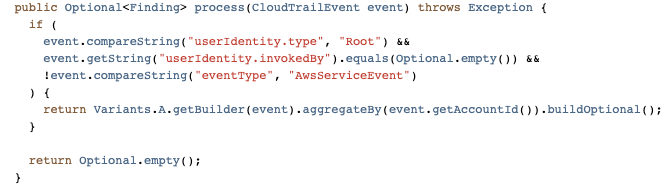
Speaking of new detections, we’ve more than doubled the number of our in-house detections, and onboarded several detection solutions from security vendors. The Snare framework enables us to write detections quickly and efficiently with all of the plumbing and configurations abstracted away from us. Detection authors only need to be concerned with their actual detection logic, and everything else is handled for them.

Simple Snare Root User Detection

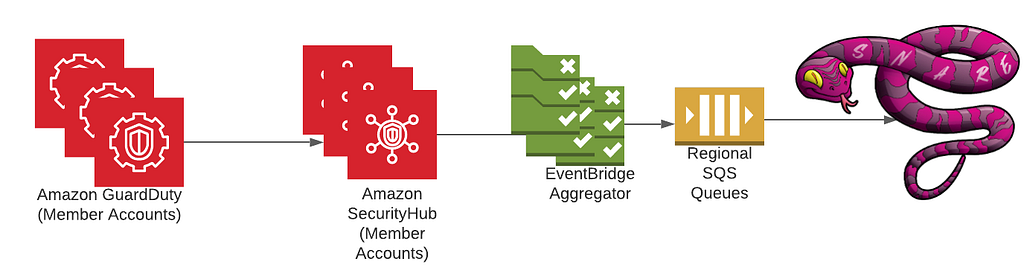
As for security vendors, we’ve most notably worked with AWS to ensure that services like GuardDuty and Security Hub are first class citizens when it comes to detection sources. Integration with Security Hub was a critical design decision from the start due to the high amount of leverage we get from receiving all of the AWS Security findings in a normalized format and in a centralized location. Security Hub has played an integral role in our platform, and made evaluations of AWS security services and new features easy to try out and adopt. Our plumbing between Security Hub and Snare is managed through AWS Organizations as well as EventBridge rules deployed in every region and account to aid in aggregating all findings into our centralized Snare platform.

High Level Security Service Plumbing
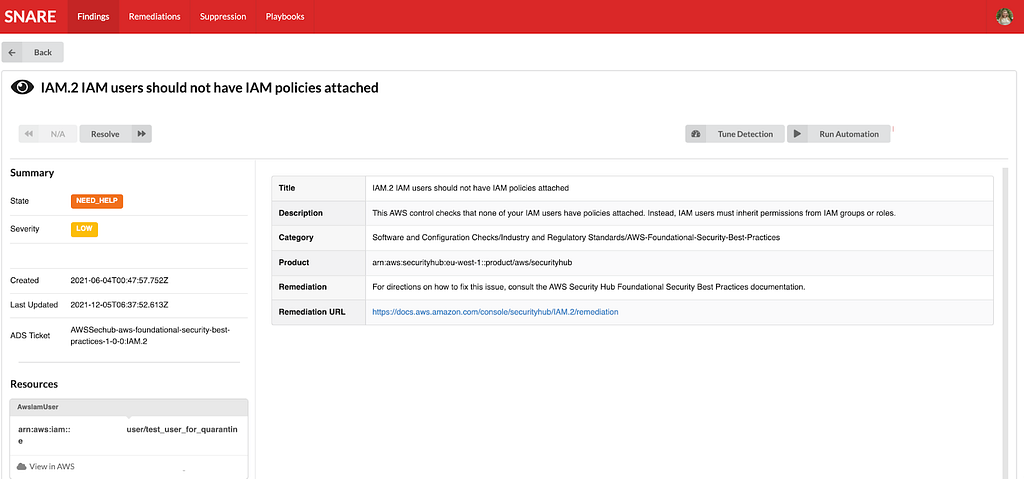
Example AWS Security Finding from our testing/sandbox account In Snare UI

One area that we are investing heavily is our automated remediation potential. We’ve explored a few different options ranging from fully automated remediations, manually triggered remediations, as well as automated playbooks for additional data gathering during incident triage. We decided to employ AWS Step Functions to be our execution environment due to the unique DAGs we could build and the simplistic “wait”/”task token” functionality, which allows us to involve humans when necessary for approval/input.

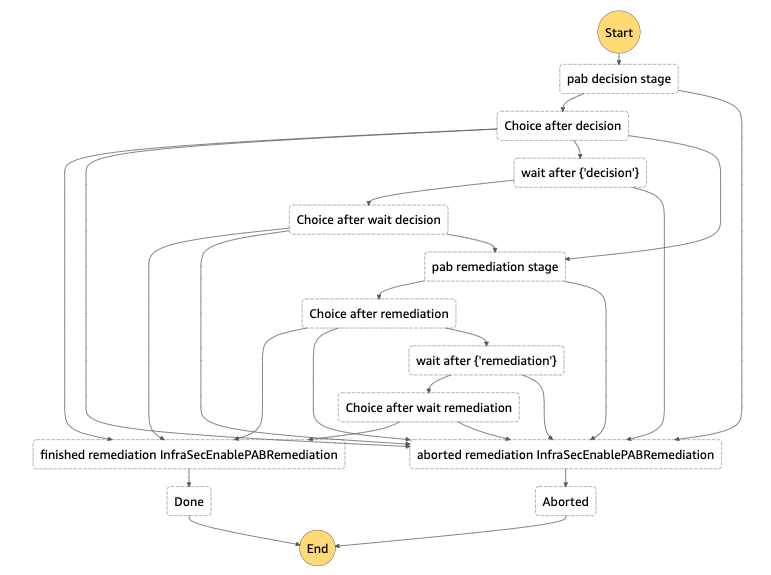
Building on top of step functions, we created a 4 step remediation process: pre-processing, decision, remediation, and post-processing. Pre/post processing can be used for managing out-of-band resource checks, or any work that needs to be done in order to ensure a successful remediation. The decision step is used to perform a final pre-flight check before remediation. This can involve a human reachout, verifying the resource is still around, etc. The remediation step is where we perform our actual remediation. We’ve been able to use this to a great deal of success with infrastructure-wide misconfigured resources being automatically fixed near real time, and enabling the creation of new fully automated incident response playbooks. We’re still exploring new ways we might be able to use this, and are excited for how we might evolve our approach in the near future.

Step Function DAG for S3 Public Access Block Remediation

Diagram from a remediation to enable S3’s public access block on a non-compliant bucket. Each choice stage allows for dynamic routing to a variety of different stages based on the output of the previous function. Wait stages are used when human intervention/approval is needed.

Extensible Learnings

We’ve come a long way in our journey, and we’ve had numerous learning opportunities that we wanted to collect and share. Hopefully, we’ve made the mistakes and learned from those experiences.

Information is Key

Home grown context and metadata streams are invaluable for a detection and response program. By uniting detections and context, you’re able to unlock a new world of possibilities for reducing false positives, creating new detections that rely on business specific context, and help better tailor your severities and automated remediation decisions based on your desired risk appetite. A common theme we’ve often encountered is the need to bring additional context throughout various stages of our pipeline, so make sure to plan for that from the get-go.

Step Functions for Remediations

Step functions provide a highly extensible and unique platform to create remediations. Utilizing the AWS CDK, we were able to build a platform to enable us to easily roll out new remediations. While creating our remediation platform, we explored SSM Automation Runbooks. While SSM Automation Runbooks have great potential for remediating simple issues, we found they weren’t flexible enough to cover a wide spread of our needs, nor did they offer some of the more advanced features we were looking for such as reaching out to humans. Step functions gave us the right amount of flexibility, control, and ease of use in order to be a great asset for the Snare platform.

Closing Thoughts

We’ve come a long way in a year, and we still have a number of interesting things on the horizon. We’re looking at continuing to create new, more advanced features and detections for Snare to reduce cloud security risks in order to keep up with all of the exciting things happening here at Netflix. Make sure to check out some of our other recent blog posts!

Special Thanks

Special thanks to everyone who helped to contribute and provide feedback during the design and implementation of Snare. Notably Shannon Morrison, Sapna Solanki, Jason Schroth from our partner team Detection Engineering, as well as some of the folks from AWS — Prateek Sharma & Ely Kahn. Additional thanks to the rest of our Cloud Infrastructure Security team (Hee Won Kim, Joseph Kjar, Steven Reiling, Patrick Sanders, Srinath Kuruvadi) for their support and help with Snare features, processes, and design decisions!


Snaring the Bad Folks was originally published in Netflix TechBlog on Medium, where people are continuing the conversation by highlighting and responding to this story.

Use unsupervised training with K-means clustering in Amazon Redshift ML

Post Syndicated from Phil Bates original https://aws.amazon.com/blogs/big-data/use-unsupervised-training-with-k-means-clustering-in-amazon-redshift-ml/

Amazon Redshift is the fastest, most widely used, fully managed, and petabyte-scale cloud data warehouse. Tens of thousands of customers use Amazon Redshift to process exabytes of data every day to power their analytics workloads. Data analysts and database developers want to use this data to train machine learning (ML) models, which can then be used to generate insights for use cases such as forecasting revenue, predicting customer churn, and detecting anomalies.

Amazon Redshift ML makes it easy for SQL users to create, train, and deploy ML models using familiar SQL commands. In previous posts, we covered how Amazon Redshift supports supervised learning that includes regression, binary classification, and multiclass classification, as well as training models using XGBoost and providing advanced options such as preprocessors, problem type, and hyperparameters.

In this post, we use Redshift ML to perform unsupervised learning on unlabeled training data using the K-means algorithm. This algorithm solves clustering problems where you want to discover groupings in the data. Unlabeled data is grouped and partitioned based on their similarities and differences. By grouping, the K-means algorithm iteratively determines the best centroids and assigns each member to the closest centroid. Data points nearest the same centroid belong to the same group. Members of a group are as similar as possible to other members in the same group, and as different as possible from members of other groups. To learn more about K-means clustering, see K-means clustering with Amazon SageMaker.

Solution overview

The following are some use cases for K-means:

  • Ecommerce and retail – Segment your customers by purchase history, stores they visited, or clickstream activity.
  • Healthcare – Group similar images for image detection. For example, you can detect patterns for diseases or successful treatment scenarios.
  • Finance – Detect fraud by detecting anomalies in the dataset. For example, you can detect credit card fraud by abnormal purchase patterns.
  • Technology – Build a network intrusion detection system that aims to identify attacks or malicious activity.
  • Meteorology – Detect anomalies in sensor data collection such as storm forecasting.

In our example, we use K-means on the Global Database of Events, Language, and Tone (GDELT) dataset, which monitors world news across the world, and the data is stored for every second of every day. This information is freely available as part of the Registry of Open Data on AWS.

The data is stored as multiple files on Amazon Simple Storage Service (Amazon S3), with two different formats: historical, which covers the years 1979–2013, and daily updates, which cover the years 2013 and later. For this example, we use the historical format and bring in 1979 data.

For our use case, we use a subset of the data’s attributes:

  • EventCode – The raw CA­­­­­­MEO action code describing the action that Actor1 performed upon Actor2.
  • NumArticles – The total number of source documents containing one or more mentions of this event. You can use this to assess the importance of an event. The more discussion of that event, the more likely it is to be significant.
  • AvgTone – The average tone of all documents containing one or more mentions of this event. The score ranges from -100 (extremely negative) to +100 (extremely positive). Common values range between -10 and +10, with 0 indicating neutral.
  • Actor1Geo_Lat – The centroid latitude of the Actor1 landmark for mapping.
  • Actor1Geo_Long – The centroid longitude of the Actor1 landmark for mapping.
  • Actor2Geo_Lat – The centroid latitude of the Actor2 landmark for mapping.
  • Actor2Geo_Long – The centroid longitude of the Actor2 landmark for mapping.

Each row corresponds to an event at a specific location. For example, rows 53-57 in the file 1979.csv which we will use below, seem to all refer to interactions between FRA and AFR, dealing with consultation and diplomatic relations with a mostly positive tone. It is hard, if not impossible for us to make sense of such data at scale. Clusters of events, either with a similar tone, occurring in similar locations or between similar actors, are useful in visualizing and interpreting the data. Clustering can also reveal non-obvious structures such as potential common causes for different events, or the propagation of a root event across the globe, or the change in tone toward a common event over time. However, we do not know what makes two events similar – is it the location, the two actors, the tone, the time or some combination of these? Clustering algorithms can learn from data and determine 1) what makes different datapoints similar, 2) which datapoints are related to which other datapoints and 3) what are the common characteristics of these related datapoints.

Prerequisites

To get started, we need an Amazon Redshift cluster with version 1.0.33433 or higher and an AWS Identity and Access Management (IAM) role attached that provides access to Amazon SageMaker and permissions to an S3 bucket.

For an introduction to Redshift ML and instructions on setting it up, see Create, train, and deploy machine learning models in Amazon Redshift using SQL with Amazon Redshift ML.

To create a simple cluster, complete the following steps:

  1. On the Amazon Redshift console, choose Clusters in the navigation pane.
  2. Choose Create cluster.
  3. Provide the configuration parameters such as cluster name, user name, and password.
  4. For Associated IAM roles, on the menu Manage IAM roles, choose Create IAM role.

If you have an existing role with the required parameters, you can choose Associate IAM roles.

  1. Select Specific S3 buckets and choose a bucket for storing the artifacts generated by Redshift ML.
  2. Choose Create IAM role as default.

A default IAM role is created for you and automatically associated with the cluster.

  1. Choose Create cluster.

Prepare the data

Load the GDELT data into Amazon Redshift using the following SQL. You can use the Amazon Redshift Query Editor v2 or your favorite SQL tool to run these commands.

To create the table, use the following commands:

DROP TABLE IF EXISTS gdelt_data CASCADE;

CREATE TABLE gdelt_data (
GlobalEventId   bigint,
SqlDate  bigint,
MonthYear bigint,
Year   bigint,
FractionDate double precision,
Actor1Code varchar(256),
Actor1Name varchar(256),
Actor1CountryCode varchar(256),
Actor1KnownGroupCode varchar(256),
Actor1EthnicCode varchar(256),
Actor1Religion1Code varchar(256),
Actor1Religion2Code varchar(256),
Actor1Type1Code varchar(256),
Actor1Type2Code varchar(256),
Actor1Type3Code varchar(256),
Actor2Code varchar(256),
Actor2Name varchar(256),
Actor2CountryCode varchar(256),
Actor2KnownGroupCode varchar(256),
Actor2EthnicCode varchar(256),
Actor2Religion1Code  varchar(256),
Actor2Religion2Code varchar(256),
Actor2Type1Code varchar(256),
Actor2Type2Code varchar(256),
Actor2Type3Code varchar(256),
IsRootEvent bigint,
EventCode bigint,
EventBaseCode bigint,
EventRootCode bigint,
QuadClass bigint,
GoldsteinScale double precision,
NumMentions bigint,
NumSources bigint,
NumArticles bigint,
AvgTone double precision,
Actor1Geo_Type bigint,
Actor1Geo_FullName varchar(256),
Actor1Geo_CountryCode varchar(256),
Actor1Geo_ADM1Code varchar(256),
Actor1Geo_Lat double precision,
Actor1Geo_Long double precision,
Actor1Geo_FeatureID bigint,
Actor2Geo_Type bigint,
Actor2Geo_FullName varchar(256),
Actor2Geo_CountryCode varchar(256),
Actor2Geo_ADM1Code varchar(256),
Actor2Geo_Lat double precision,
Actor2Geo_Long double precision,
Actor2Geo_FeatureID bigint,
ActionGeo_Type bigint,
ActionGeo_FullName varchar(256),
ActionGeo_CountryCode varchar(256),
ActionGeo_ADM1Code varchar(256),
ActionGeo_Lat double precision,
ActionGeo_Long double precision,
ActionGeo_FeatureID bigint,
DATEADDED bigint 
) ;

To load data into the table, use the following command:

COPY gdelt_data FROM 's3://gdelt-open-data/events/1979.csv'
region 'us-east-1' iam_role default csv delimiter '\t';  

Create a model in Redshift ML

When using the K-means algorithm, you must specify an input K that specifies the number of clusters to find in the data. The output of this algorithm is a set of K centroids, one for each cluster. Each data point belongs to one of the K clusters that is closest to it. Each cluster is described by its centroid, which can be thought of as a multi-dimensional representation of the cluster. The K-means algorithm compares the distances between centroids and data points to learn how different the clusters are from each other. A larger distance generally indicates a greater difference between the clusters.

Before we create the model, let’s examine the training data by running the following SQL code in Amazon Redshift Query Editor v2:

select AvgTone, EventCode, NumArticles, Actor1Geo_Lat, Actor1Geo_Long, Actor2Geo_Lat, Actor2Geo_Long
from gdelt_data

The following screenshot shows our results.

We create a model with seven clusters from this data (see the following code). You can experiment by changing the K value and creating different models. The SageMaker K-means algorithm can obtain a good clustering with only a single pass over the data with very fast runtimes.

CREATE MODEL news_data_clusters
FROM (select AvgTone, EventCode, NumArticles, Actor1Geo_Lat, Actor1Geo_Long, Actor2Geo_Lat, Actor2Geo_Long
   from gdelt_data)
FUNCTION  news_monitoring_cluster
IAM_ROLE default
AUTO OFF
MODEL_TYPE KMEANS
PREPROCESSORS 'none'
HYPERPARAMETERS DEFAULT EXCEPT (K '7')
SETTINGS (S3_BUCKET '<<your-amazon-s3-bucket-name>>');

For more information about model training, see Machine learning overview. For a list of other hyper-parameters K-means supports, see K-means Hyperparameters, for the full syntax of CREATE MODEL see our documentation.

You can use the SHOW MODEL command to view the status of the model:

SHOW MODEL NEWS_DATA_CLUSTERS;

The results show that our model is in the READY state.

We can now run the query to identify the clusters. The following query shows the cluster associated with each GlobelEventId:

select globaleventid, news_monitoring_cluster ( AvgTone, EventCode, NumArticles, Actor1Geo_Lat, Actor1Geo_Long, Actor2Geo_Lat, Actor2Geo_Long ) as cluster 
from gdelt_data;

We get the following results.

Now let’s run a query to check the distribution of data across our clusters to see if seven is the appropriate cluster size for this dataset:

select events_cluster , count(*) as nbr_events  from   
(select globaleventid, news_monitoring_cluster( AvgTone, EventCode, NumArticles, Actor1Geo_Lat, Actor1Geo_Long, Actor2Geo_Lat, Actor2Geo_Long ) as events_cluster
from gdelt_data)
group by 1;

The results show that very few events are assigned to clusters 1 and 3.

Let’s try running the above query again after re-creating the model with nine clusters by changing the K value to 9.

Using nine clusters helps smooth out the cluster sizes. The smallest is now approximately 11,000 and the largest is approximately 117,000, compared to 188,000 when using seven clusters.

Now, let’s run the following query to determine the centers of the clusters based on number of articles by event code:

select news_monitoring_cluster ( AvgTone, EventCode, NumArticles, Actor1Geo_Lat, Actor1Geo_Long, Actor2Geo_Lat, Actor2Geo_Long ) as events_cluster, eventcode ,sum(numArticles) as numArticles from 
gdelt_data
group by 1,2 ;


Let’s run the following query to get more insights into the datapoints assigned to one of the clusters:

select news_monitoring_cluster ( AvgTone, EventCode, NumArticles, Actor1Geo_Lat, Actor1Geo_Long, Actor2Geo_Lat, Actor2Geo_Long ) as events_cluster, eventcode, actor1name, actor2name, sum(numarticles) as totalarticles
from gdelt_data
where events_cluster = 5
and actor1name <> ' 'and actor2name <> ' '
group by 1,2,3,4
order by 5 desc

Observing the datapoints assigned to the clusters, we see clusters of events corresponding to interactions between US and China – probably due to the establishment of diplomatic relations, between US and RUS – probably corresponding to the SALT II Treaty and those involving Iran– probably corresponding to the Iranian Revolution. Thus, clustering can help us make sense of the data, and show us the way as we continue to explore and use it.

Conclusion

Redshift ML makes it easy for users of all skill levels to use ML technology. With no prior ML knowledge, you can use Redshift ML to gain business insights for your data. You can take advantage of ML approaches such as supervised and unsupervised learning to classify your labeled and unlabeled data, respectively. In this post, we walked you through how to perform unsupervised learning with Redshift ML by creating an ML model that uses the K-means algorithm to discover grouping in your data.

For more information about building different models, see Amazon Redshift ML.


About the Authors

Phil Bates is a Senior Analytics Specialist Solutions Architect at AWS with over 25 years of data warehouse experience.

Debu Panda, a Principal Product Manager at AWS, is an industry leader in analytics, application platform, and database technologies, and has more than 25 years of experience in the IT world. Debu has published numerous articles on analytics, enterprise Java, and databases and has presented at multiple conferences such as re:Invent, Oracle Open World, and Java One. He is lead author of the EJB 3 in Action (Manning Publications 2007, 2014) and Middleware Management (Packt).

Akash Gheewala is a Solutions Architect at AWS. He helps global enterprises across the high tech industry in their journey to the cloud. He does this through his passion for accelerating digital transformation for customers and building highly scalable and cost-effective solutions in the cloud. Akash also enjoys mental models, creating content and vagabonding about the world.

Murali Narayanaswamy is a principal machine learning scientist in AWS. He received his PhD from Carnegie Mellon University and works at the intersection of ML, AI, optimization, learning and inference to combat uncertainty in real-world applications including personalization, forecasting, supply chains and large scale systems.

Improving GitHub code search

Post Syndicated from Pavel Avgustinov original https://github.blog/2021-12-08-improving-github-code-search/

Today, we are rolling out a technology preview for substantial improvements to searching code on GitHub. We want to give you an early look at our efforts and get your feedback as we iterate on helping you explore and discover code—all while saving you time and keeping you focused. Sign up for the waitlist now, and give us your feedback!

Getting started

Once the technology preview is enabled for your account, you can try it out at https://cs.github.com. Initially, we’re creating a separate interface for the new code search as we build it out, but once we’re happy with the feedback and are ready for wider adoption, we will integrate it into the main github.com experience.

At the moment, the search index covers more than five million of the most popular public repositories; in addition, you can search private repositories you have access to. Here are some things to look out for:

  • Easily find what you’re looking for among the top results, with smart ranking and an index that is optimized for code.
  • Search for an exact string, with support for substring matches and special characters, or use regular expressions (enclosed in / separators).
  • Scope your searches with org: or repo: qualifiers, with auto-completion suggestions in the search box.
  • Refine your results using filters like language:, path:, extension:, and Boolean operators (OR, NOT). Search for definitions of a symbol with symbol:.
  • Get your bearings quickly with additional features, like a directory tree view, symbol information for the active scope, jump-to-definition, select-to-search, and more!

The syntax is documented here, and you can press ? on any page to view available keyboard shortcuts. You can also check out the FAQs.

What’s next?

We’re excited to share our work with you as a technology preview while we iterate, and to work with you to find unique, novel use cases and workflows. What radical new idea have you always wanted to try? What feature would make you most productive? Is support for your favorite language missing? Let us know, and let’s make it happen together.

We have no shortage of ideas for what to focus on next. We’ll be growing the index until it covers every repository you can access on GitHub. We’ll experiment with scoring and ranking heuristics to see what works best, and we’ll explore what APIs and integrations would be most impactful. We’ll keep adding support for more languages to the language-specific features. But most of all, we want to listen to your feedback and build the tools you didn’t even know you needed.

The bigger picture: developer productivity at GitHub

As a developer, staying in a flow state is hard. Whenever you look up how to use a library, or have a test fail because your developer environment has diverged from CI, or need to know how an error message can arise, you are interrupted. The longer it takes to resolve the interruption, the more context you lose.

Earlier this year, we launched GitHub Copilot as a technical preview, leveraging the power of AI to let you code confidently even in unfamiliar territory. We also released Codespaces and shared how adopting them internally boosted GitHub’s own productivity. We see our improvements to code search and navigation in the context of these broader initiatives around developer productivity, as part of a unified solution.

For code search, our vision is to help every developer search, discover, navigate, and understand code quickly and intuitively. GitHub code search puts the world’s code at your fingertips: everything is just a search away. It helps you maintain a flow state by showing you the most relevant results first and helping you with auto-completion at every step. And once you get to a result page, the rich browsing experience is optimized for reading and understanding code, allowing you to make sense of unfamiliar logic quickly, even for code outside your IDE.

We plan to share more updates on our progress soon, including deep-dives on the engineering work behind code search and the developers, open source projects, and communities we rely on (special shout-out to @BurntSushi and @lemire, whose work has been fundamental to ours). In the meantime, the number of spots for the technology preview is limited, so sign up today!

Zabbix 6.0 LTS – The next great leap in monitoring by Alexei Vladishev / Zabbix Summit Online 2021

Post Syndicated from Alexei Vladishev original https://blog.zabbix.com/zabbix-6-0-lts-the-next-great-leap-in-monitoring-by-alexei-vladishev-zabbix-summit-online-2021/17683/

The Zabbix Summit Online 2021 keynote speech by Zabbix founder and CEO Alexei Vladishev focuses on the role of Zabbix in modern, dynamic IT infrastructures. The keynote speech also highlights the major milestones leading up to Zabbix 6.0 LTS and together we take a look at the future of Zabbix.

The full recording of the speech is available on the official Zabbix Youtube channel.

Digital transformation journey
Infrastructure monitoring challenges
Zabbix – Universal Open Source enterprise-level monitoring solution
Cost-Effectiveness
Deploy Anywhere
Monitor Anything
Monitoring of Kubernetes and Hybrid Clouds
Data collection and Aggregation
Security on all levels
Powerful Solution for MSPs
Scalability and High Availability
Machine learning and Statistical analysis
More value to users
New visualization capabilities
IoT monitoring
Infrastructure as a code
Tags for classification
What’s next?
Advanced event correlation engine
Multi DC Monitoring
Zabbix Release Schedule
Zabbix Roadmap
Questions

Digital transformation journey

First, let’s talk about how Zabbix plays a role as a part of the Digital Transformation journey for many companies.

As IT infrastructures evolve, there are many ongoing challenges. Most larger companies for example have a set of legacy systems that require to be integrated with more modern systems. This results in a mix of legacy and new technologies and protocols. This means that most management and monitoring tools need to support all of these technologies – Zabbix is no exception here.

Hybrid clouds, containers, and container orchestration systems such as K8S and OpenShift have also played an immense part in the digital transformation of enterprises. It has been a very major paradigm shift – from physical machines to virtual machines, to containers and hybrid parts. We certainly must provide the required set of technologies to monitor such environments and the monitoring endpoints unique to them.

The rapid increase in the complexity of IT infrastructures caused by the two previous points requires our tools to be a lot more scalable than before. We have many more moving parts, likely located in different locations that we need to stay aware of. This also means that any downtime is not acceptable – this is why the high availability of our tools is also vital to us.

Let’s not forget that with increased complexity, many new potential security attack vectors arise and our tools need to support features that can help us with minimizing the security risks.

But making our infrastructures more agile usually comes at a very real financial cost. We must not forget that most of the time we are working with a dedicated budget for our tools and procedures.

Infrastructure monitoring challenges

The increase in the complexity of IT infrastructures also poses multiple monitoring challenges that we have to strive to overcome:

  • Requirements for scalability and high availability for our tools
    • The growing number of devices and networks as well as the increased complexity of IT infrastructures
  • Increasingly complex infrastructures often force us to utilize multiple tools to obtain the required metrics
    • This leads to a requirement for a single pane of glass to enable centralized monitoring
  • Collecting values is often not enough – we need to be able to leverage the collected data to gain the most value out of it
  • We need a solution that can deliver centralized visualization and reporting based on the obtained data
  • Our tools need to be hand-picked so that they can deliver the best ROI in an already complex infrastructure

Zabbix – Universal Open Source enterprise-level monitoring solution

Zabbix is a Universal free and Open Source enterprise-level monitoring solution. The tool comes at absolutely no cost and is available for everyone to try out and use. Zabbix provides the monitoring of modern IT infrastructures on multiple levels.

Universal is the term that we are focusing on. Given the open-source nature of the product, Zabbix can be used in infrastructures of different sizes – from small and medium organizations to large, globe-spanning enterprises. Zabbix is also capable of delivering monitoring of the whole IT stack – from hardware and network monitoring to high-level monitoring such as Business Service monitoring and more.

Cost-Effectiveness

Zabbix delivers a large set of enterprise-grade features at no cost! Features such as 2FA, Single sign-on solutions, no restrictions when it comes to data collection methods, number of monitored devices and services, or database size.

  • Exceptionally low total cost of ownership
    • Free and Open Source solution with quality and security in mind
    • Backed by reliable vendors, a global partner network, and commercial services, such as the 24/7 support
    • No limitations regarding how you use the software
    • Free and readily available documentation, HOWTOs, community resources, videos, and more.
    • Zabbix engineers are easy to find and hire for your organization
    • Cost is fully under your control – Zabbix Commercial services are under fixed-price agreements

Deploy Anywhere

Our users always have the choice of where and how they wish to deploy Zabbix. With official packages for the most popular operating systems such as RHEL, Oracle Linux, Ubuntu, Raspberry Pi OS, and more. With official Helm charts, you can quickly also deploy Zabbix in a Kubernetes cluster or in your OpenShift instance. We also provide official Docker container images with pre-installed Zabbix components that you can deploy in your environment.

We also provide one-click deployment options for multiple cloud service providers, such as Amazon AWS, Microsoft Azure, Google Cloud, Openstack, and many other cloud service providers.

Monitor Anything

With Zabbix, you can monitor anything – from legacy solutions to modern systems. With a large selection of official solutions and substantial community backing our users can be sure that they can find a suitable approach to monitor their IT infrastructure components. There are hundreds of ready-to-use monitoring solutions by Zabbix.

Whenever you deploy a new IT solution in your enterprise, you will want to tie it together with the existing toolset. Zabbix provides many out of the box integrations for the most popular ticketing and alerting systems

Recently we have introduced advanced search capabilities for the Zabbix integrations page, which allows you to quickly lookup the integrations that currently exist on the market. If you visit the Zabbix integrations page and look up a specific vendor or tool, you will see a list of both the official solutions supported by Zabbix and also a long list of community solutions backed by our users, partners, and customers.

Monitoring of Kubernetes and Hybrid Clouds

Nowadays many existing companies are considering migrating their existing infrastructure to either solutions such as Kubernetes or OpenShift, or utilizing cloud service providers such as Amazon AWS or Microsoft Azure.

I am proud to announce, that with the release of Zabbix 6.0 LTS, Zabbix will officially support out-of-the-box monitoring of OpenShfit and Kubernetes clusters.

Data collection and Aggregation

Let’s cover a few recent features that improve the out-of-the-box flexibility of Zabbix by a large margin.

Synthetic monitoring is a feature that was introduced a year ago in Zabbix version 5.2 and it has already become quite popular with our user base. The feature enables monitoring of different devices and solutions over the HTTP protocol. By using synthetic monitoring Zabbix can connect to your HTTP endpoints, such as cloud APIs, Kubernetes, and OpenShift APIs, and other HTTP endpoints, collect the metrics and then process them to extract the required information. Synthetic monitoring is extremely transparent and flexible – it can be fine-tuned to communicate with any HTTP endpoints.

Another major feature introduced in Zabbix 5.4 is the new trigger syntax. This enables our users to define much more flexible trigger expressions, supporting many new problem detection use cases. In addition, we can use this syntax to perform flexible data aggregation operations. For example, now we can aggregate data filtered by wildcards, tags, and host groups, instead of specifying individual items. This is extremely valuable for monitoring complex infrastructures, such as Kubernetes or cloud environments. At the same time, the new syntax is a lot more simple to learn and understand when compared to the old trigger syntax.

Security on all levels

Many companies are concerned about security and data protection when it comes to the tools that they are using in their day-to-day tasks. I’m happy to tell you that Zabbix follows the highest security standards when it comes to the development and usage of the product.

Zabbix is secure by design. In the diagram below you can see all of the Zabbix components, all of which are interconnected, like Zabbix Agent, Server, Proxy, Database, and Frontend. All of the communication between different Zabbix components can be encrypted by using strong encryption protocols like TLS.

If you’re using Zabbix Agent, the agent does not require root privileges. You can run Zabbix Agent under a normal user with all of the necessary user level restrictions in place. Zabbix agent can also be restricted with metric allow and deny lists, so it has access only to the metrics which are permitted for collection by your company policies.

The connections between the Zabbix database backend and the Zabbix Frontend and Zabbix Server also support encryption as of version 5.0 LTS.

As for the frontend component – users can add an additional security layer for their Zabbix frontends by configuring 2FA and SSO logins. Zabbix 6.0 LTS also introduces flexible login password complexity requirements, which can reduce the security breach risk if your frontend is exposed to the internet. To ensure that Zabbix meets the highest standards of the company security compliance, the new Audit log, introduced in Zabbix 6.0 LTS, is capable of logging all of the Zabbix Frontend and Zabbix Server operations.

For an additional security layer – sensitive information like Usernames, Passwords, API keys can be stored in an external vault. Currently, Zabbix supports secret storage in the HashiCorp Vault. Support for the CyberArk vault will be added in the Zabbix 6.2 release.

Another Zabbix feature – the Zabbix API, is often used for the automation of day-to-day configuration workflows, as well as custom integrations and data migration tasks. Zabbix 5.4 added the ability to create API tokens for particular frontend users with pre-defined token expiration dates.

In Zabbix 5.2 we added another layer for the Zabbix Frontend user permissions – User Roles. Now it is possible to define granular user roles with different types of rights and privileges, assigned to specific types of users in your organization. With User Roles, we can define which parts of the Zabbix UI the specific user role has access to and which UI actions the members of this role can perform. This can be combined with API method restrictions which can also be defined for a particular role.

Powerful Solution for MSPs

When we combine all of these features, we can see how Zabbix becomes a powerful solution for MSP customers. MSPs can use Zabbix as an added value service. This way they can provide a monitoring service for their customers and get additional revenue out of it. It is possible to build a customer portal which is a combination of User Roles for read-only access to dashboards and customized UI, rebranding option – which was just introduced in Zabbix 6.0 LTS, and a combination of SLA reporting together with scheduled PDF reports, so the customers can receive reports on a weekly, daily or monthly basis.

Scalability and High Availability

With a growing number of devices and ever-increasing network complexity, Scalability and High availability are extremely important requirements.

Zabbix provides Load balancing options for Zabbix UI and Zabbix API. In order to scale the Zabbix Frontend and Zabbix API, we can simply deploy additional Zabbix Frontend nodes, thus introducing redundancy and high availability.

Zabbix 6.0 LTS comes with out-of-the-box support for the Zabbix Server High Availability cluster. If one of the Zabbix Server nodes goes down, Zabbix will automatically switch to one of the standby nodes. And the best thing about the Zabbix Server High Availability cluster – it takes only 5 minutes to get it up and running. the HA cluster is very easy to configure and use.

One of the features in our future roadmap is introducing support for the History API to work with different time-series DB backends for extra efficiency and scalability. Another feature that we would like to implement in the future is load balancing for Zabbix Servers and Zabbix Proxies. Combining all of these features would truly make Zabbix a cloud-native application with unlimited horizontal scalability.

Machine learning and Statistical analysis

Defining static trigger thresholds is a relatively simple task, but it doesn’t scale too well in dynamic environments. With Machine Learning and Statistical Analysis, we can analyze our data trends and perform anomaly detection. This has been greatly extended in Zabbix 6.0 LTS with Anomaly Detection and Baseline Monitoring functionality.

Zabbix 6.0 Adds an extended set of functions for trend analysis and trend prediction. These support multiple flexible parameters, such as the ability to define seasonality for your data analysis. This is another way how to get additional insights out of the data collected by Zabbix

More value to users

When I think about the direction that Zabbix is headed in, and look at the Zabbix roadmap, one of the main questions I ask is “How can we deliver more value to our enterprise users?”

In Zabbix 6.0 LTS we made some major steps to make Zabbix fit not only for infrastructure monitoring but also fit for Business Service monitoring – the monitoring of services that we provide for our end-users or internal company users. Zabbix 6.0 LTS comes with complex service level object definitions, real-time SLA reporting, multi-tenancy options, Business Service alerting options, and root cause and Impact analysis.

New visualization capabilities

It is important to present the collected data in a human-readable way. That’s why we invest a lot of time and effort in order to improve the native visualization capabilities. In Zabbix 6.0 LTS we have introduced Geographical Maps together with additional widgets for TOP N reporting and templated and multi-page dashboards.

The introduction of reports in Zabbix 5.2 allowed our users to leverage their Zabbix Dashboards to generate scheduled PDF reports with respect to user permissions. Our users can generate daily, weekly, monthly or yearly reports and send them to their infrastructure administrators or customers.

IoT monitoring

With the introduction of support for Modbus and MQTT protocols, Zabbix can be used to monitor IoT devices and obtain environmental information from different sensors such as temperature, humidity, and more. In addition, Zabbix can now be used to monitor factory equipment, building management systems, IoT gateways, and more.

Infrastructure as a code

With IT infrastructures growing in scale, automation is more important than ever. For this reason, many companies prefer preserving and deploying their infrastructure as code. With the support of YAML format for our templates, you can now keep them in a git repository and by utilizing CI/CD tools you can now deploy your templates automatically.

This enables our users to manage their templates in a central location – the git repository, which helps users to perform change management and versioning and then deploy the template to Zabbix by using CI/CD tools.

Tags for classification

Over the past few versions, we have made a major push to support tags for most Zabbix entities. The switch from applications to tags in Zabbix 5.4 made the tool much more flexible. Tags can now be used for the classification of items, triggers, hosts, business services. The tags that the users define can also be used in alerting, filtering, and reporting.

What’s next?

You’re probably wondering – what’s coming next? What are the main vectors for the future development of Zabbix?

First off – we will continue to invest in usability. While the tool is made by professionals for professionals, it is important for us to make using the tool as easy as possible. Improvements to the Zabbix Frontend, general usability, and UX can be expected very soon.

We plan to continue to invest in the visualization and reporting capabilities of Zabbix. We want all data collected by our monitoring tool to provide information in a single pane of glass. This way our users can see the full picture of their environment while also seeing the root cause analysis for the ongoing problems that we face. This way we can get most of the data that Zabbix collects.

Extending the scope of monitoring is an ongoing process for us. We would like to implement additional features for compliance monitoring. I think that we will be able to introduce a solution for application performance monitoring very soon. We’d like to make log monitoring more powerful and comprehensive. monitoring of public and private clouds is also very important for us, given the current IT paradigms.

We’d like to make sure that Zabbix is absolutely extendable on all levels. While we can already extend Zabbix with different types of plugins, webhooks, and UI modules there’s more to come in the near future.

The topic of high availability, scalability, and load balancing is extremely important to us. We will continue building on the existing foundations to make Zabbix a truly cloud-native solution.

Advanced event correlation engine

Advanced event processing is a really important topic. When we talk about a monitoring solution, we pay very much attention to the number of metrics that we are collecting. We mustn’t forget, that for large-scale environments the number of events that we generate based on those metrics is also extremely important. We need to keep control and manage the ever-growing number of different events coming from different sources. This is why we would like to focus on noise reduction, specifically – root cause analysis.

For this reason, we can expect Zabbix to introduce an advanced event correlation model in the future. This model should have the ability to filter and deduplicate the events as well as perform event enrichment, thus leading to a much better root cause analysis.

Multi DC Monitoring

Currently, Multi DC monitoring can be done with Zabbix by deploying a distributed Zabbix instance that utilizes Zabbix proxies. But there are use cases, where it would be more beneficial to have multiple Zabbix servers deployed across different datacenters – all reporting to a single location for centralized event processing, centralized visualization, and reporting as well as centralized dashboards. This is something that is coming soon to Zabbix.

Zabbix Release Schedule

Of course, the burning question is – when is Zabbix 6.0 LTS going to be released? And we are very close to finalizing the next LTS release. I would expect Zabbix 6.0 LTS to be officially released in January 2022.

As for Zabbix 6.2 and 6.4 – these releases are still planned for Q2 and Q4, 2022. The next LTS release – Zabbix 7.0 LTS is planned to be released in Q2, 2023.

Zabbix Roadmap

If you want to follow the development of Zabbix – we have a special page just for that – the Zabbix Roadmap. Here you can find up-to-date information about the development plans for Zabbix 6.2, 6.4, and 7.0 LTS. The Roadmap also represents the current development status of Zabbix 6.0 LTS.

Questions

Q: What would you say is the main benefit of why users should migrate from Zabbix 5.0/4.0 or older versions to 6.0 LTS?

A: I think that Zabbix 6.0 LTS is a very different product – even when you compare it with the relatively recent Zabbix 5.0 LTS. It comes with many improvements, some of which I mentioned here in my keynote. For example, Business Service monitoring provides huge added value to enterprise customers.

With the new trigger syntax and the new functions related to anomaly detection and baseline monitoring our users can get much more out of the data that they already have in their monitoring tool.

The new visualization options – multiple new widgets, geographical maps, scheduled PDF reporting provide a lot of added value to our end-users and to their customers as well.

Q: Any plans to make changes on the Zabbix DB backend level – make it more scaleable or completely redesign it?

A: Right now we keep all of our information in a relational database such as MySQL or PostgreSQL. We have added the support for TimescaleDB which brings some huge advantages to our users, thanks to improved data storage and performance efficiency.

But we still have users that wish to connect different storage engines to Zabbix – maybe specifically optimized to keep time-series data. Actually, this is already on our roadmap. Our plan is to introduce a unified API for historical data so that if you wish to attach your own storage, we just have to deploy a plugin that will communicate both with our historical API and also talk to the storage engine of your choosing. This feature is coming and is already on our Roadmap.

Q: What is your personal favorite feature? Something that you 100% wanted to see implemented in Zabbix 6.0 LTS?

A: I see Zabbix 6.0 LTS as a combination of Zabbix 5.2, 5.4, and finally the features introduced directly in Zabbix 6.0 LTS. Personally, I think that my favorite features in Zabbix 6.0 LTS are features that make up the latest implementation of Anomaly detection.

We could be at the very beginning of exploring more advanced machine learning and statistical analysis capabilities, but I’m pretty sure that with every new release of Zabbix there will be new features related to machine learning, anomaly detection, and trend prediction.

This could provide a way for Zabbix to generate and share insights with our users. Analysis of what’s happening with your system, with your metrics – how the metrics in your system behave.


The collective thoughts of the interwebz