Post Syndicated from LastWeekTonight original https://www.youtube.com/shorts/oWLIm0Bs3Rg
A systematic approach to benchmarking SQL processing engines on AWS
Post Syndicated from Anubhav Awasthi original https://aws.amazon.com/blogs/big-data/a-systematic-approach-to-benchmarking-sql-processing-engines-on-aws/
Selecting the right SQL processing solution for large-scale data analytics is a critical decision for organizations. As data volumes grow exponentially, the technology landscape has evolved to offer diverse options for processing and analyzing this information efficiently. This post presents a systematic framework for evaluating and benchmarking SQL processing engines on AWS, using Apache JMeter to conduct practical performance testing at scale.
The AWS analytics ecosystem
AWS offers a rich portfolio of SQL processing solutions to meet various analytical needs:
- Serverless query services – Amazon Athena is a serverless, interactive query service that uses standard SQL to analyze data in Amazon Simple Storage Service (Amazon S3), offering automatic scaling, parallel query execution, and pay-per-query pricing with no infrastructure management required
- Data warehouse solutions – Amazon Redshift offers scalable, high-performance cloud data warehousing with serverless options, zero-ETL integrations, AI-powered query assistance, and seamless machine learning (ML) integration for modern analytics at scale
- Managed open source engines – Amazon EMR supports Apache Spark SQL, Apache Trino (formerly PrestoSQL), and other distributed query frameworks
- Self-managed options – You can deploy open source engines like Apache Spark, Apache Flink, and Trino on Amazon Elastic Kubernetes Service (Amazon EKS) for greater control
- Partner solutions – You can access specialized big data analytics tools through AWS Marketplace
These options are further enhanced by modern open table formats such as Apache Iceberg, Delta Lake, and Apache Hudi, which bring crucial enterprise features like ACID (Atomicity, Consistency, Isolation, and Durability) transactions, schema evolution, and time travel capabilities to data lakes. These SQL processing solutions operate under the AWS Shared Responsibility Model. AWS manages the security of the underlying infrastructure and services, and customers are responsible for secure configuration, access management, and data protection within their testing environments. This division of responsibility remains important when evaluating and benchmarking different SQL engines. Proper security configuration and implementation by customers is essential for maintaining a secure analytics environment.
Evaluation challenges in SQL engine selection
The rich ecosystem of SQL processing options creates significant evaluation challenges. Each SQL engine employs unique architectural approaches and optimization strategies, making direct comparisons complex. Organizations embarking on this evaluation journey face several interconnected obstacles:
- Creating environments that accurately reflect production scenarios
- Developing test datasets that mirror real-world data characteristics and volumes
- Replicating real-world query patterns and concurrency levels
- Maintaining uniform testing conditions across different engine architectures
- Controlling infrastructure expenses throughout the evaluation process
Performance considerations at petabyte scale
When evaluating solutions for petabyte-scale deployments, the complexity intensifies considerably. Several critical factors come into play:
- Resource management – Distributed SQL engines require precise balancing of CPU, memory, and storage resources. Suboptimal resource allocation can lead to query failures and performance degradation, particularly as data volumes grow.
- Data distribution patterns – How data is distributed across partitions or nodes significantly impacts query performance. Data skew can create processing bottlenecks, with some nodes handling disproportionate workloads while others remain underutilized.
- Concurrency handling – High-concurrency environments demand sophisticated workload scheduling and resource isolation mechanisms. The ability to maintain consistent performance under varying concurrent loads becomes a critical differentiator between solutions.
- Meaningful metrics – Performance evaluation at scale requires comprehensive metrics analysis:
- Mean, median, and percentile response times (particularly p90 and p95)
- Query throughput under varying concurrency levels
- Scalability characteristics across diverse workload types
- Resource utilization efficiency during peak loads
Limitations of traditional benchmarks
Although industry-standard benchmarks like TPC-DS and TPC-H provide valuable insights, our experience with multiple customer engagements has shown that tailored, workload-specific testing often reveals performance characteristics not captured by these standardized tests. This is especially true for complex, multi-tenant environments with diverse query patterns. Organizations that complement standard benchmarks with workload-specific testing typically experience shorter proof-of-concept cycles, optimized evaluation costs, and more efficient testing operations. This comprehensive approach helps reduce uncertainty in the final solution selection process.
Prerequisites
Before you dive into the evaluation process, make sure you have the following prerequisites:
- An AWS account with appropriate permissions to create and manage Amazon Elastic Compute Cloud (Amazon EC2) instances and access the SQL engines you plan to benchmark.
- Basic familiarity with AWS services, particularly Amazon EC2 and the SQL engines you intend to evaluate (such as Athena, Amazon Redshift, or Amazon EMR).
- Experience with SQL and data analytics concepts.
- Access to the SQL engines you choose to benchmark. This post assumes you’ve already set up the engines you want to test. For setup instructions, refer to the AWS documentation for each service.
- A dataset suitable for your benchmarking needs. Dataset creation and loading are not covered in this post. Build petabyte-scale synthetic test data with Amazon EMR on EC2 provides prescriptive guidance to generate test datasets at scale. Make sure your test datasets are stored in S3 buckets with encryption enabled (using SSE-KMS or SSE-S3) and that all service connections use TLS for data in transit.
Benefits of Apache JMeter
As organizations scale their analytics workloads to petabyte levels, there is a growing need for a robust, structured approach to SQL query performance testing. Although many organizations develop custom testing frameworks or use various benchmarking tools, these approaches often lack standardization and can be difficult to replicate across different SQL engines. The complexity of modern data architectures, combined with the variety of available SQL processing solutions, demands a systematic evaluation methodology. Apache JMeter emerges as a powerful solution to address this challenge. Though traditionally known for web application testing, JMeter’s extensible architecture and robust feature set make it particularly well-suited for SQL performance testing at scale.JMeter offers several advantages for evaluating SQL engines:
- Support for multiple protocols and connections
- Ability to simulate complex concurrent workloads
- Built-in performance metrics and reporting
- Extensible architecture for custom testing scenarios
- Integration capabilities with continuous integration and continuous delivery (CI/CD) pipelines
Through this proposed framework, which has been validated across multiple customer engagements at petabyte scale, we aim to help organizations make more informed decisions when selecting a SQL processing solution. Our experience working with customers to assess various AWS Analytics services and open source solutions has demonstrated that a systematic evaluation approach significantly reduces proof-of-concept cycles and optimizes resource investments. This framework has helped organizations effectively evaluate services like Athena, Amazon Redshift, and Amazon EMR, alongside open source solutions such as Trino on Amazon EKS, based on their specific workload profiles and performance requirements.With this methodology, organizations can accomplish the following:
- Navigate the complex landscape of large-scale data processing technologies
- Reduce proof-of-concept cycles from months to weeks
- Minimize infrastructure costs during evaluation phases
- Make data-driven decisions about technology selection
- Better align technology choices with business requirements
- Establish repeatable testing patterns for future evaluations
Testing methodology in practice
A successful SQL engine evaluation requires understanding and replicating real-world workload patterns. Our methodology, refined through numerous customer engagements, focuses on comprehensive testing across multiple dimensions while remaining adaptable to specific organizational needs.
Query pattern selection
We begin by selecting representative query patterns that mirror production workloads:
- Aggregation queries that summarize large datasets using operations like SUM, AVG, and COUNT
- Complex join operations that test the engine’s ability to combine data efficiently across multiple tables
- String operations that evaluate text processing capabilities
- Nested queries that assess the engine’s optimization capabilities for complex query structures
A carefully selected set of 8–10 queries typically provides sufficient coverage while keeping the evaluation manageable. These should reflect your actual workload characteristics and business requirements.
Data volume variations
Testing across different data volumes is important for understanding scalability characteristics. We structure our tests around varying data scan ranges:
- Small-scale scans – Queries accessing 1–7 days of data (megabytes to gigabytes)
- Large-scale scans – Queries spanning 14–30 days (terabytes to petabytes)
This approach evaluates both I/O efficiency with large datasets and metadata handling with smaller, frequent queries, helping understand how services like Amazon EMR, Amazon Redshift, or Athena optimize query execution across different access patterns.
Concurrency testing
Real-world analytics environments rarely process single queries in isolation. Our methodology incorporates the following features:
- Progressive concurrency testing starting at lower levels (typically 16, 32, 64, and 128 parallel queries), though these numbers can be adjusted based on your test infrastructure capacity and specific requirements. We recommend starting with smaller concurrency levels and gradually scaling up to understand performance characteristics
- Varied query complexity and frequency (referred to as query weights) to simulate realistic workload distributions. This means some queries are run more often or are more resource-intensive than others, mimicking real-world usage patterns.
- Mixed query patterns running simultaneously to test resource management.
- Consistent execution across different date ranges to evaluate scaling behavior.
This approach is particularly important when evaluating managed services like the workload management capabilities of Amazon Redshift or the resource allocation strategies of Amazon EMR.
Query weight distribution
Production environments typically see varying frequencies of different query types. Our framework incorporates weighted query distribution to simulate real-world scenarios more accurately. In a typical distribution, frequent lightweight queries might represent 60% of the workload, complex analytical queries might comprise 30%, and resource-intensive data processing operations might make up the remaining 10%.This weighted approach makes sure performance testing reflects actual usage patterns rather than artificial benchmarking scenarios. The exact distribution should mirror your organization’s specific workload patterns.
Sequential vs. concurrent testing
Our methodology implements two distinct testing phases:
- Sequential testing – Establishes baseline performance metrics:
- Runs each query type independently across different date ranges
- Runs multiple iterations to provide consistency and identify variability
- Helps understand individual query performance characteristics
- Concurrent testing – Simulates real-world multi-user scenarios:
- Implements weighted query distributions
- Tests different concurrency levels to identify scaling limitations
- Evaluates resource management capabilities of different engines
JMeter efficiently implements both testing phases while maintaining consistent test conditions across SQL engines. Its ability to handle various JDBC connections makes it particularly suitable for testing AWS analytics services.Through this structured approach, organizations can gather comprehensive performance data reflecting their specific use cases, enabling informed SQL engine selection decisions while maintaining core principles of systematic evaluation and realistic workload simulation.
Test plans
To evaluate SQL engines’ performance under varying workloads, we designed two test scenarios: sequential and concurrent execution plans. Each scenario was executed across different data volumes by adjusting the query date range filters to cover 1, 7, 14, and 30 days. These variations simulate typical analytical workloads with progressively increasing data sizes.For sequential runs, each test was treated as a distinct batch, grouping all queries (Query 1 to Query 9) under the same date range—each query will scan data for 1, 7, 14, and 30 days with appropriate date filtering in the query’s where predicate. We used JMeter to capture average query response times for each batch. This configuration was run three times, and the final metrics reflect the average response time across these iterations to ensure reliability and account for environmental variance.Although three iterations provide initial insights, if you observe significant variations in results (typically more than 10% deviation between runs), consider expanding to 10 or more iterations. This additional sampling helps establish statistical significance, identify true performance patterns, and distinguish outliers (beyond three standard deviations) from normal variations. Document any consistent anomalies, because they may indicate important performance or security considerations for your specific environment.The following table shows the sample test plans template for the sequential test plan run.
| Dataset Time Range | Run | Query Weights | ||||||||
| Query 1 | Query 2 | Query 3 | Query 4 | Query 5 | Query 6 | Query 7 | Query 8 | Query 9 | ||
| 1 day | Run 1 | |||||||||
| Run 2 | ||||||||||
| Run 3 | ||||||||||
| Avg | ||||||||||
| 7 days | Run 1 | |||||||||
| Run 2 | ||||||||||
| Run 3 | ||||||||||
| Avg | ||||||||||
| 14 days | Run 1 | |||||||||
| Run 2 | ||||||||||
| Run 3 | ||||||||||
| Avg | ||||||||||
| 30 days | Run 1 | |||||||||
| Run 2 | ||||||||||
| Run 3 | ||||||||||
| Avg | ||||||||||
For the concurrent test plan, we introduced a probabilistic weighted distribution to the queries (Query 1 to Query 9), simulating a more realistic production-like environment where query frequency varies based on business relevance and usage patterns. This added a layer of complexity to better reflect how the SQL engine would perform under real-world concurrent access patterns.The following table shows the sample test plans template for the concurrent test plan run.
| Dataset Time Range | Concurrent Runs | Query Weights | ||||||||
| Query 1 | Query 2 | Query 3 | Query 4 | Query 5 | Query 6 | Query 7 | Query 8 | Query 9 | ||
| 1 days | 8 | 11% | 11% | 11% | 11% | 11% | 11% | 11% | 11% | 11% |
| 16 | 10% | 5% | 24% | 5% | 5% | 5% | 24% | 14% | 10% | |
| 32 | 8% | 3% | 24% | 5% | 5% | 5% | 24% | 16% | 8% | |
| 64 | 7% | 3% | 24% | 6% | 4% | 6% | 26% | 16% | 9% | |
| 128 | 1% | 4% | 19% | 8% | 5% | 7% | 14% | 20% | 22% | |
| *7 days | 8 | 11% | 11% | 11% | 11% | 11% | 11% | 11% | 11% | 11% |
| 16 | 10% | 5% | 24% | 5% | 5% | 5% | 24% | 14% | 10% | |
| 32 | 8% | 3% | 24% | 5% | 5% | 5% | 24% | 16% | 8% | |
| 64 | 7% | 3% | 24% | 6% | 4% | 6% | 26% | 16% | 9% | |
| **128 | 1% | 4% | 19% | 8% | 5% | 7% | 14% | 20% | 22% | |
| 14 days | 8 | 11% | 11% | 11% | 11% | 11% | 11% | 11% | 11% | 11% |
| 16 | 10% | 5% | 24% | 5% | 5% | 5% | 24% | 14% | 10% | |
| 32 | 8% | 3% | 24% | 5% | 5% | 5% | 24% | 16% | 8% | |
| 64 | 7% | 3% | 24% | 6% | 4% | 6% | 26% | 16% | 9% | |
| 128 | 1% | 4% | 19% | 8% | 5% | 7% | 14% | 20% | 22% | |
| 30 days | 8 | 11% | 11% | 11% | 11% | 11% | 11% | 11% | 11% | 11% |
| 16 | 10% | 5% | 24% | 5% | 5% | 5% | 24% | 14% | 10% | |
| 32 | 8% | 3% | 24% | 5% | 5% | 5% | 24% | 16% | 8% | |
| 64 | 7% | 3% | 24% | 6% | 4% | 6% | 26% | 16% | 9% | |
| 128 | 1% | 4% | 19% | 8% | 5% | 7% | 14% | 20% | 22% | |
For example, for configuration of *7 days concurrent run with **128 concurrency, the proposed configuration distributes Query 1 to Query 9 with appropriate weighted submissions such that Query 9 is executed the greatest number of times in the overall 128 executions submitted across all 9 queries for this run.
JMeter setup
To begin, you must set up JMeter on a machine that can handle the desired test load. An EC2 instance is a flexible and cost-effective option. Choose an instance type with sufficient vCPUs to support your maximum planned concurrency. For example, a c6i.4xlarge or higher is typically suitable for moderate to high throughput testing scenarios. For the operating system, you might choose Amazon Linux, which is optimized for AWS. For production-grade testing environments, deploy the JMeter EC2 instance in a private subnet of a virtual private cloud (VPC) with appropriate security groups that allow only required connections. This network isolation helps maintain security while executing performance tests. Consider using Amazon Virtual Private Cloud (Amazon VPC) endpoints for secure access to AWS services.
After the instance is provisioned, install Java (Java 17 LTS or Java 21 LTS) and download the latest version of JMeter. Be sure to configure the system with appropriate JVM options to allocate sufficient heap memory for large-scale test executions. Refer to Getting Started to learn more.
JMeter concepts
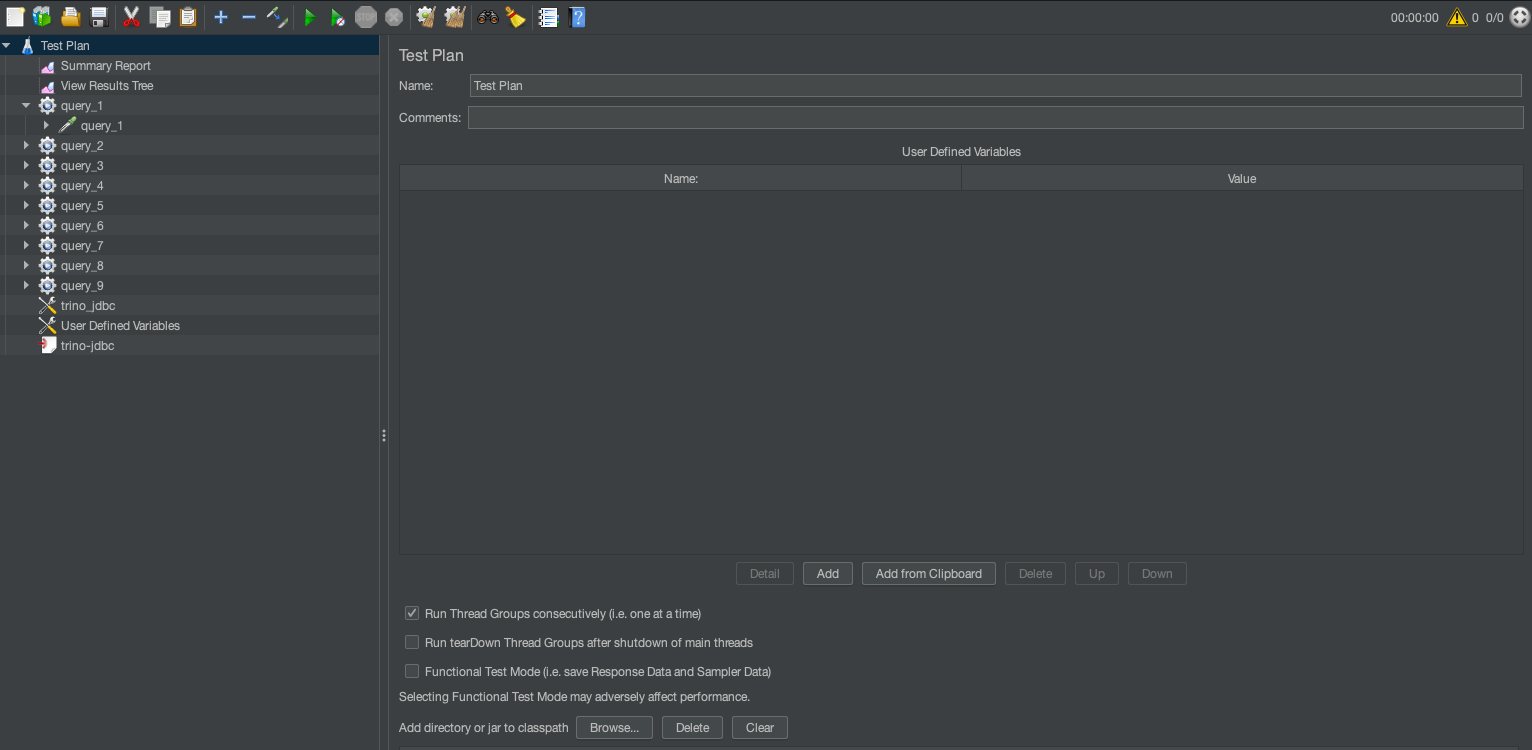
Before you create test plans in JMeter, it’s important to understand a few foundational concepts that influence how your test plan behaves—such as thread groups, user-defined variables, and JDBC connection. These components enable the simulation of real-world query loads, including concurrency and pacing.
Test plans
The test plan is the top-level container for a JMeter test. It defines the overall testing strategy, including the queries to execute, their parameters, and the concurrent user behavior. These plans are represented as jmx files that can then be used for CLI-based execution. JMeter supports both GUI and CLI modes. It is highly recommended that you use the JMeter GUI primarily for creating test plans as jmx, and use the CLI for large load tests. You can also run thread groups consecutively for sequential execution. The default behavior is to run all thread groups in parallel suited for concurrent execution. Refer to Building a Test Plan to learn more about options available with test plans.
User-defined variables
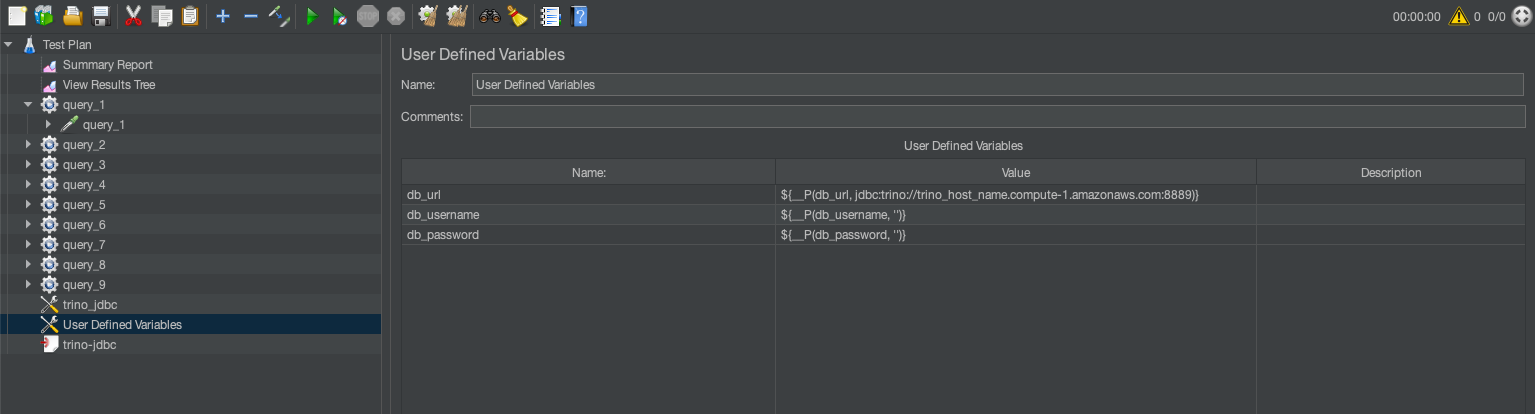
User-defined variables are global parameters that you can reuse throughout the test plan. They are helpful for defining database credentials, server URLs, or query parameters. For example:DB_URL=jdbc:trino://trino-cluster.example.com:8889?SSL=true #Enable SSL/TLS
You can configure authentication (user name and password) through your organization’s approved methods, such as AWS Secrets Manager (see Move hardcoded secrets to AWS Secrets Manager) AWS Identity and Access Management (IAM) roles, or other secure credential management systems.
Thread groups
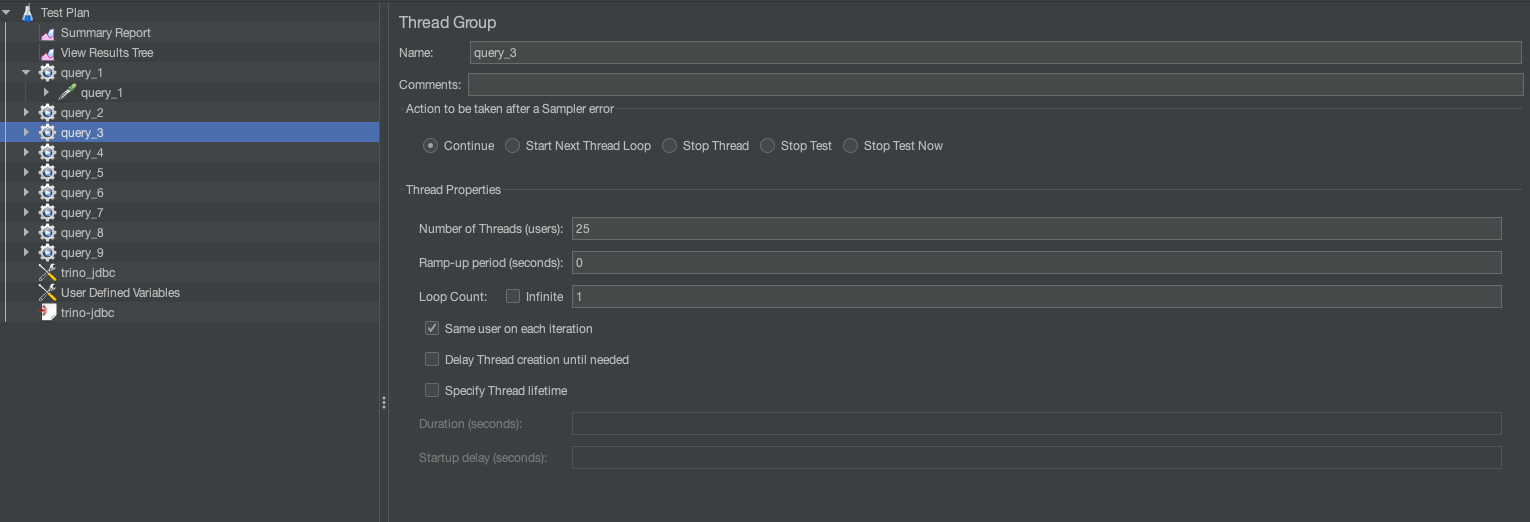
A thread group represents a group of virtual users (threads) executing test actions. Each thread simulates a single user sending requests to the SQL engine. This can be used to simulate concurrent runs. For example, in the preceding template, Query 3 has 19% weightage across 128 runs. This means .19*128=25 total runs, so we set the thread group to 25.
JDBC connection configuration
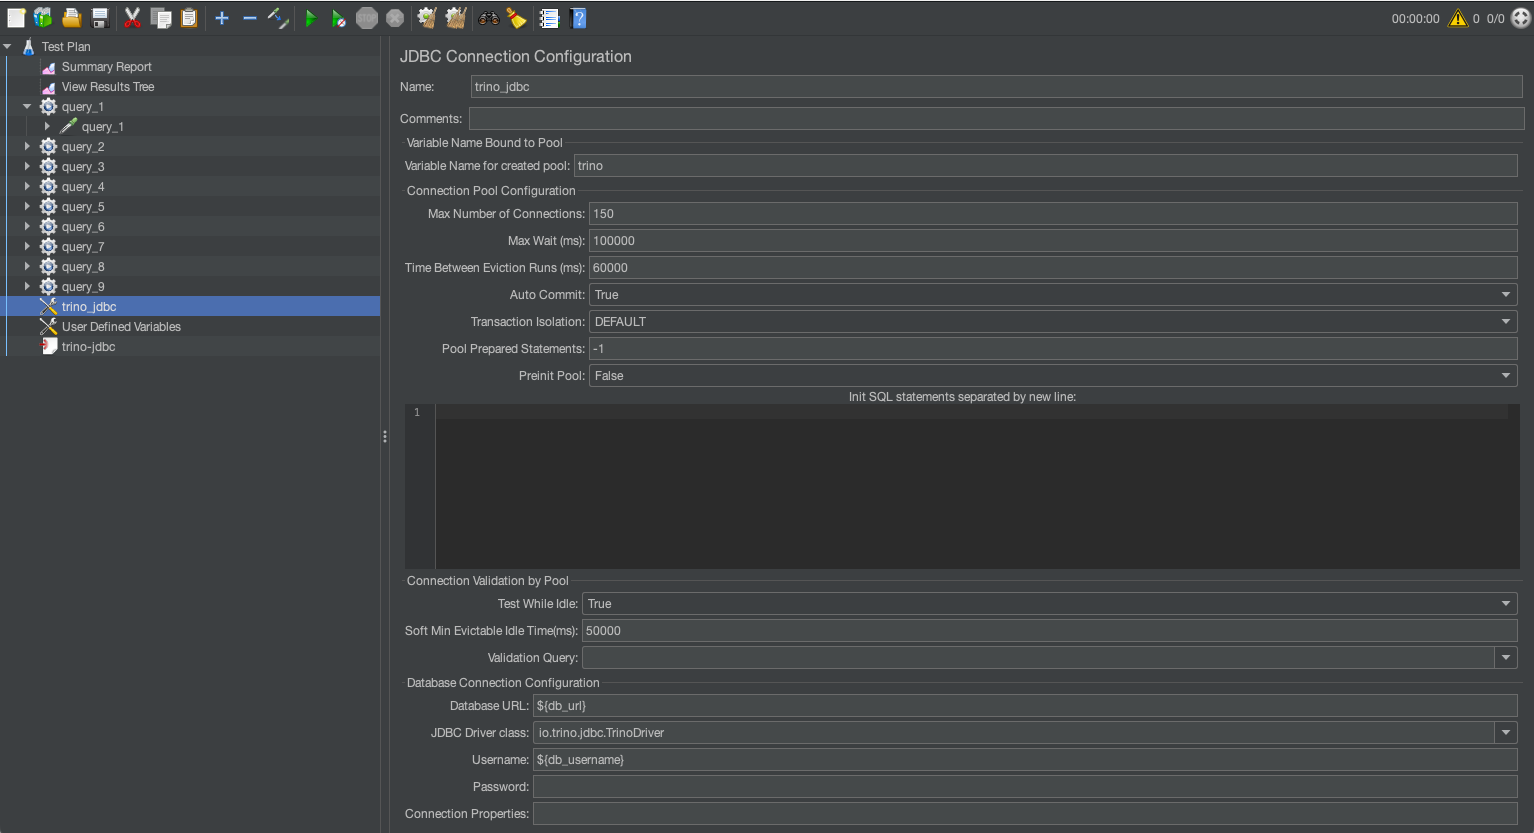
JDBC connection configuration sets up the database connection for the test. It specifies the database URL, driver, and credentials required for executing SQL queries. Key fields to configure are database URL and JDBC driver class. The following table summarizes the different configuration settings.
| SQL Engine | JDBC Driver | JDBC Driver Class |
| Trino on EMR | trino-jdbc-<trino_version>-amzn-0.jar |
io.trino.jdbc.TrinoDriver |
| Athena | Athena JDBC 3.x driver | com.amazon.athena.jdbc.AthenaDriver |
| Amazon Redshift | Amazon Redshift JDBC driver | com.amazon.redshift.jdbc.Driver |
| Trino on EKS | Trino JDBC driver | io.trino.jdbc.TrinoDriver |
JDBC requests
The JDBC request executes SQL queries against the database using the configuration defined in the JDBC connection configuration.
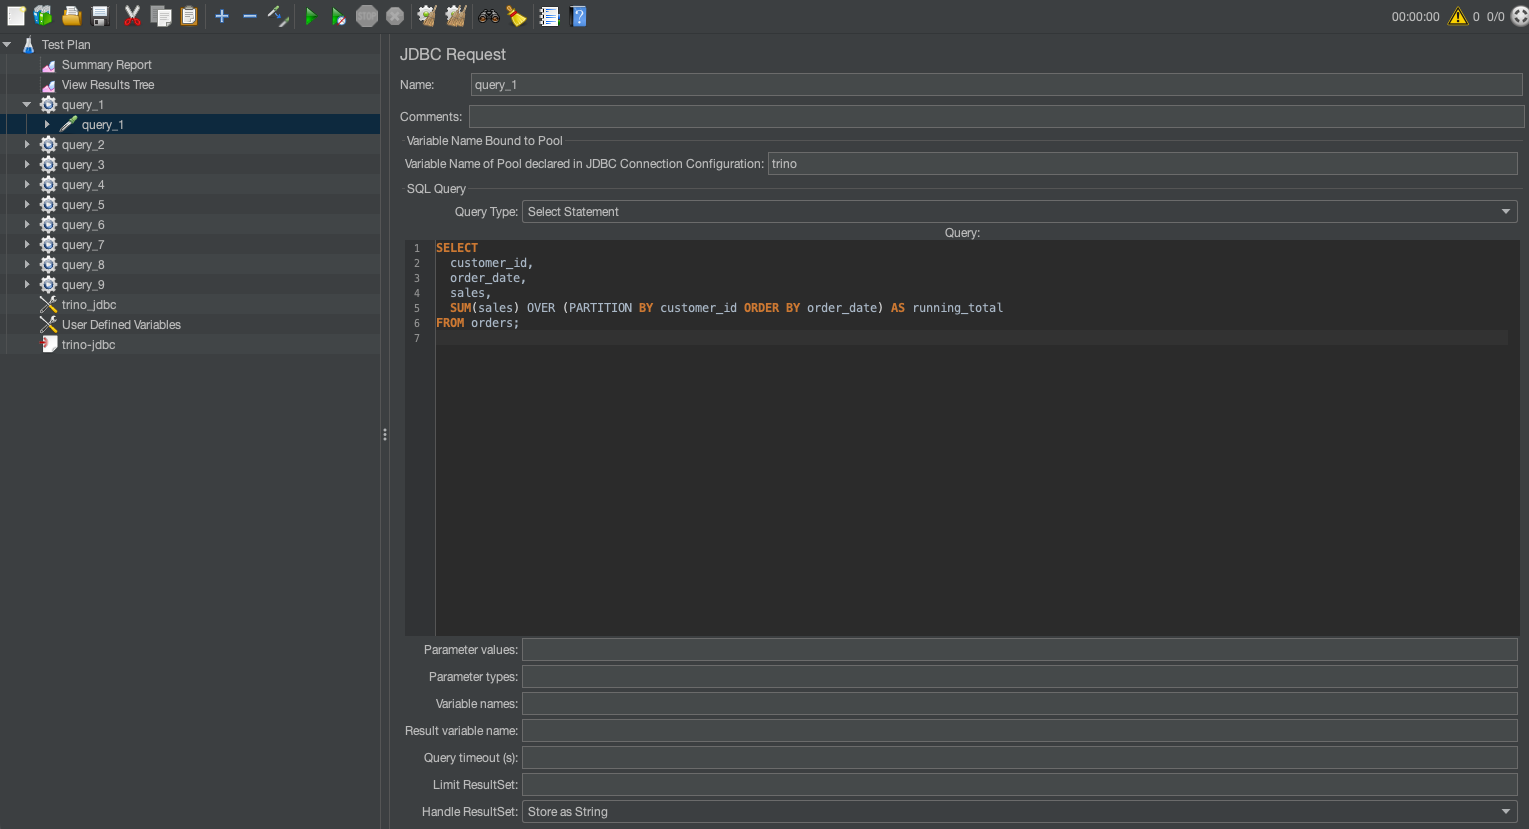
For example, following command runs the JMeter in CLI mode:
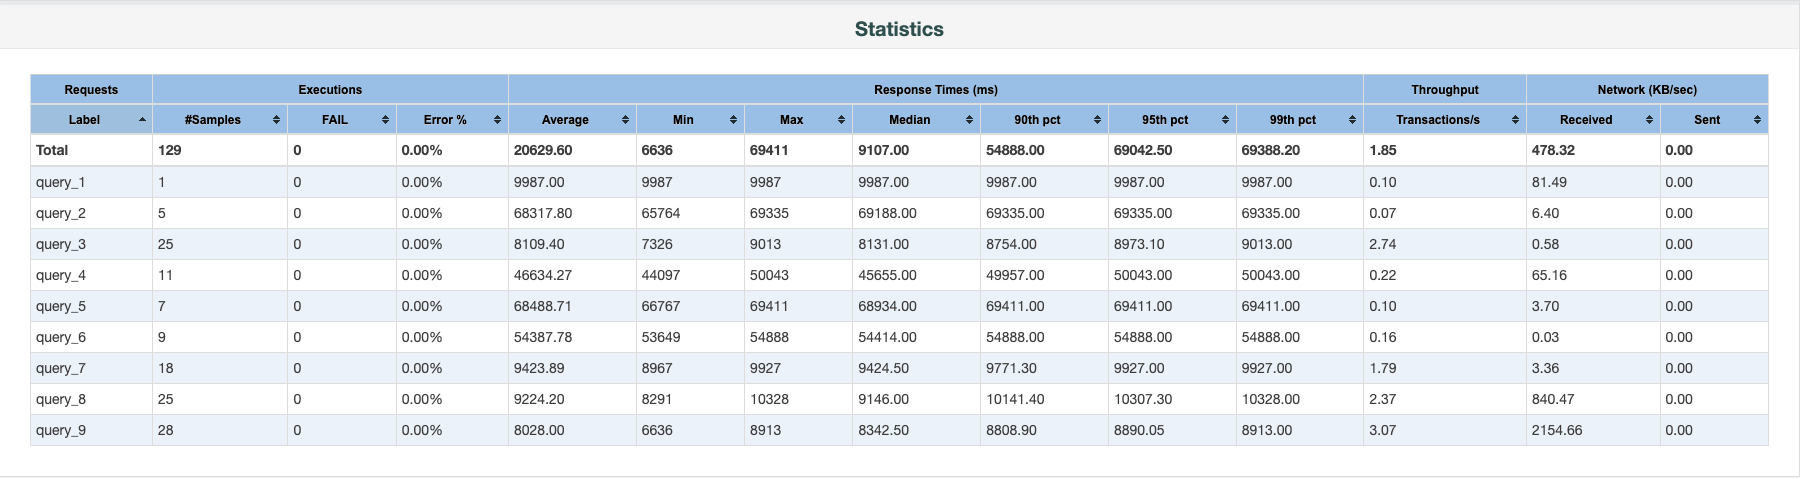
The output folder will contain an HTML report with different statistics. The following screenshot illustrates 128 concurrent runs.
Monitoring and logging
For comprehensive visibility and audit requirements, enable AWS CloudTrail logging, VPC Flow Logs, and service-specific logs (like Amazon S3 access logs). These logs can be centralized in Amazon CloudWatch Logs for monitoring and analysis. This provides proper audit trails while evaluating different SQL engines and helps track access patterns and potential security events.
Post-test steps
After running your JMeter tests, proceed with the following steps:
- Review the HTML report’s key metrics, including response times, throughput, and error rates across different query types and concurrency levels.
- Run identical test plans across your candidate SQL engines for direct performance comparison.
- Refine your test plans based on initial findings, focusing on areas where performance differences are significant.
- Factor in the cost implications alongside performance metrics to make a balanced decision.
These steps can help you systematically evaluate and select the most suitable SQL engine for your analytics workloads.
Resources
In the preceding steps, we walked through a UI-based setup for JMeter along with test plans. We have created a few sample JMeter test plans for both sequential and concurrent runs along with sample test reports. You can modify the plans to fit your needs.
- JMeter sample report
- JMeter test plan for sequential run
- JMeter test plan for concurrent run
Clean up
After you complete your benchmarking process, clean up the resources to avoid unnecessary costs:
- Stop or delete the EC2 instances used for running JMeter.
- Depending on which SQL engines you used for testing, clean up active resources.
- Review your AWS Management Console to confirm no active resources remain.
- If you created test datasets in Amazon S3 or other storage services specifically for this benchmarking, consider deleting them if they’re no longer needed.
- Although JMeter test plans and results don’t incur AWS costs, organize or delete local files as needed for your record-keeping.
Summary
Selecting the right SQL processing solution for large-scale analytics demands a systematic, data-driven approach. Our JMeter framework can help organizations effectively evaluate different SQL engines by simulating real-world workload patterns across various query types, data volumes, and concurrency levels. This methodology reduces proof-of-concept cycles and provides insights beyond traditional benchmarks, helping you assess managed AWS services like Athena and Amazon Redshift and open source solutions on Amazon EKS.
About the authors
GPUs Are Only Half the Equation
Post Syndicated from David Johnson original https://www.backblaze.com/blog/gpus-are-only-half-the-equation/

AI cloud platforms have spent the last few years competing on GPU availability, interconnects, and cluster performance. That makes sense. GPUs are the engine of AI infrastructure, and demand for them has been relentless.
But a GPU can only work as fast as the data pipeline feeding it.
Think of it like a fleet of race cars. You can have the best cars on the track, the fastest pit crew, and a perfect race strategy. But if the fuel lines supplying the pit tanks can’t move gasoline fast enough, the cars are going to sit there waiting.
The cars are not the problem. The fuel supply system is.
The same thing happens in AI infrastructure. GPUs rely on high-performance flash storage when training models or running inference. But before data can be served from that flash tier, it often needs to move from durable object storage into the performance layer. If that upstream object storage layer can’t deliver data quickly and consistently, the entire pipeline slows down.
That’s why GPU availability is only half the equation. The other half is the data supply architecture that keeps those GPUs working.
The hidden bottleneck in AI infrastructure
AI workloads move a lot of data, constantly. Training datasets need to be staged and prepared so jobs can access them quickly. Model checkpoints, artifacts, embeddings, and intermediate outputs need to be written back for durability and reuse. Inference pipelines generate their own steady stream of reads and writes as models serve predictions and capture outputs.
All of that activity puts pressure on the storage and networking layers underneath the AI platform.
The bottleneck usually does not come from one obvious failure. Instead, it builds from a few things happening at once:
- Data retrieval slows down under load.
- Network paths become congested.
- Request overhead compounds at dataset scale.
- I/O behavior becomes less predictable as concurrency increases.
Individually, each of these may seem manageable. Together, they can quietly limit how efficiently AI infrastructure runs.
And the problem gets more visible as platforms scale. A handful of GPUs might be fine, while dozens or hundreds of GPUs create a very different demand profile. The upstream storage layer has to sustain much higher aggregate throughput while also absorbing frequent checkpoint and artifact writes.
Adding more GPUs increases potential compute capacity. But it also increases the rate at which data has to move.
Without enough throughput from the upstream data layer, more compute does not automatically translate into more performance.
Idle GPUs are expensive GPUs
When GPUs wait on data, the impact is both technical and financial.
First, idle GPUs waste compute capacity. GPU time is expensive, and AI workloads are designed to keep those processors busy. When the data pipeline can’t keep up, organizations end up paying for compute that is not being fully used.
Second, data delays slow development. Training runs take longer. Clusters stay reserved for more time. Teams wait longer to evaluate results. Even small drops in utilization can raise the cost of AI work because each run takes longer to finish.
Over time, that means slower iteration, delayed experiments, and longer paths to new models and features.
For AI cloud platforms, the risk is even bigger. Customers judge the platform by outcomes: how quickly jobs start, how consistently workloads run, and whether performance scales as expected. If jobs take longer than expected or results vary from run to run, customers may assume the GPUs are the issue.
But the real problem may be that the data pipeline can’t deliver data fast enough.
AI changes what object storage needs to do
Object storage has traditionally been evaluated around durability, scalability, cost, and general-purpose cloud performance. Those still matter, and AI infrastructure adds a new requirement: sustained data movement.
AI workloads require an object storage layer that can continuously supply downstream performance tiers under real-world load.
That means object storage needs to:
- Sustain high aggregate throughput, not just short bursts.
- Deliver predictable performance under continuous data movement.
- Absorb large checkpoint and artifact writes.
- Quickly rehydrate data when needed.
Many traditional object storage architectures were not built for this kind of steady, high-volume supply model. They can perform well for archival workloads, backups, and general-purpose applications, but AI introduces sustained pressure that exposes architectural limits.
The result is rarely a dramatic failure. More often, it looks like variability. Performance fluctuates under load. Scaling becomes harder to predict. GPU clusters wait on data more often than they should.
That variability becomes a competitive problem.
For AI clouds, storage is now part of the product experience
GPU availability is becoming table stakes. What separates platforms is not just how many GPUs they advertise, but how reliably those GPUs translate into real-world AI performance and productivity.
We said that customers care about outcomes. They want models to train faster. They want workloads to stay stable as they scale. They want infrastructure that helps them iterate quickly instead of introducing another bottleneck.
That means the upstream data layer has become performance infrastructure.
The storage layer also shapes the customer experience. If storage feels disconnected, complicated, or bolted on, customers notice. If it is native, branded, performant, and easy to consume, it strengthens the platform.
That is where B2 Neo comes in.
B2 Neo: Storage built to keep AI workloads moving
Backblaze B2 Neo gives platforms a high-throughput, white-label object storage backbone designed to support AI workloads at production scale.
It is S3-compatible, engineered for sustained throughput, and built to supply high-performance flash tiers without forcing providers to build and operate complex storage infrastructure in-house.
With B2 Neo, AI cloud platforms can offer object storage as a native extension of their own platform, including branded endpoints, partner-controlled pricing, and API-driven provisioning. That gives providers a new branded revenue stream while keeping the customer experience centered on their own platform.
B2 Neo also supports private connectivity options, helping create dedicated data paths that reduce shared network contention and improve predictability for demanding workloads. Backblaze has positioned the platform for high-throughput use cases, including up to 1Tbps aggregate throughput for AI and media workloads.
For platforms, that means storage becomes less of a build-vs-buy distraction and more of a platform advantage.
What AI clouds gain
When the data supply layer can keep up, GPU infrastructure becomes more effective.
Neocloud platforms can improve GPU utilization by reducing the time clusters spend waiting on data. AI teams can iterate faster because training runs and experiments move through the pipeline more efficiently. Platform performance becomes more predictable as datasets grow and clusters scale.
And operationally, neoclouds avoid the burden of building, scaling, and maintaining a large object storage system themselves.
That matters because every engineering cycle spent building commodity infrastructure is a cycle not spent improving the core compute platform, customer experience, orchestration layer, or AI-specific tooling.
The bottom line
AI clouds are winning because they give builders access to the compute resources they need. But compute alone is not enough.
A GPU cluster is only as useful as the data pipeline that keeps it fed.
As AI workloads scale, the storage layer becomes part of the performance story. The neoclouds that solve the data throughput problem will be better positioned to deliver consistent customer outcomes, improve GPU utilization, and turn storage into a native part of the platform experience.
GPU availability is only half the equation; Backblaze delivers the other half.Interested in learning how Backblaze supports AI cloud platforms? Explore B2 Neo or reach out to start a technical and strategic conversation.
The post GPUs Are Only Half the Equation appeared first on Backblaze Blog | Cloud Storage & Cloud Backup
Build petabyte-scale synthetic test data with Amazon EMR on EC2
Post Syndicated from Anubhav Awasthi original https://aws.amazon.com/blogs/big-data/build-petabyte-scale-synthetic-test-data-with-amazon-emr-on-ec2/
As you scale your data systems, you face a challenge: how to test thoroughly without putting customer data at risk. Using production data for testing can expose sensitive customer information to unauthorized access or breaches. For customers in regulated industries like finance and healthcare, this risk isn’t only a concern. It’s unacceptable. A data breach during testing could compromise their privacy, damage their trust, and expose organizations to significant compliance penalties. Synthetic test data solves this problem by generating artificial datasets that replicate the structure and patterns of real data without containing any actual customer information. This approach means you can test performance, validate data pipelines, and develop new features while ensuring that customer data remains protected and compliance requirements are met.
As data volumes grow from terabytes to petabytes, the architecture for generating synthetic data must evolve to meet increasing demands for scale, performance, and data quality. In this post, we show how you can build a scalable synthetic data generation solution using Amazon EMR, Apache Spark, and the Faker library.
The challenge of synthetic data generation
Traditional benchmark datasets like TPC-DS provide standardized schemas and predetermined data volumes for consistent testing environments across different systems. However, they fall short in meeting real-world testing requirements. These benchmarks don’t capture industry-specific patterns or the complex relationships found in actual production data. Their rigid schemas and simplified distributions fail to reflect business requirements, and scaling them while maintaining data consistency proves difficult. Perhaps most critically, generating massive datasets with traditional approaches requires specialized architectures to avoid proportional increases in compute costs and time.
Requirements for production-grade synthetic data
Effective workload validation demands synthetic data that mirrors production distributions while maintaining referential integrity across related tables and entities. The generation process must scale horizontally to accommodate growing data volumes while delivering deterministic results. Given identical input parameters, the system should produce the same dataset across multiple runs, supporting consistent testing cycles and comparative analysis.
Beyond technical requirements, synthetic data addresses compliance needs by minimizing exposure of personally identifiable information (PII) and protected health information (PHI) in non-production environments. This approach satisfies GDPR, HIPAA, and CCPA requirements while supporting secure cross-border data transfer, regular stress testing without compromising sensitive information, and providing an audit-friendly alternative to data masking that preserves analytical properties.
Solution overview
Architecting a synthetic data generation system that scales from terabytes to petabytes requires balancing several competing demands: the system must scale horizontally while maintaining data quality, generate large volumes efficiently, manage compute and storage resources cost-effectively, and support various schemas and output formats.
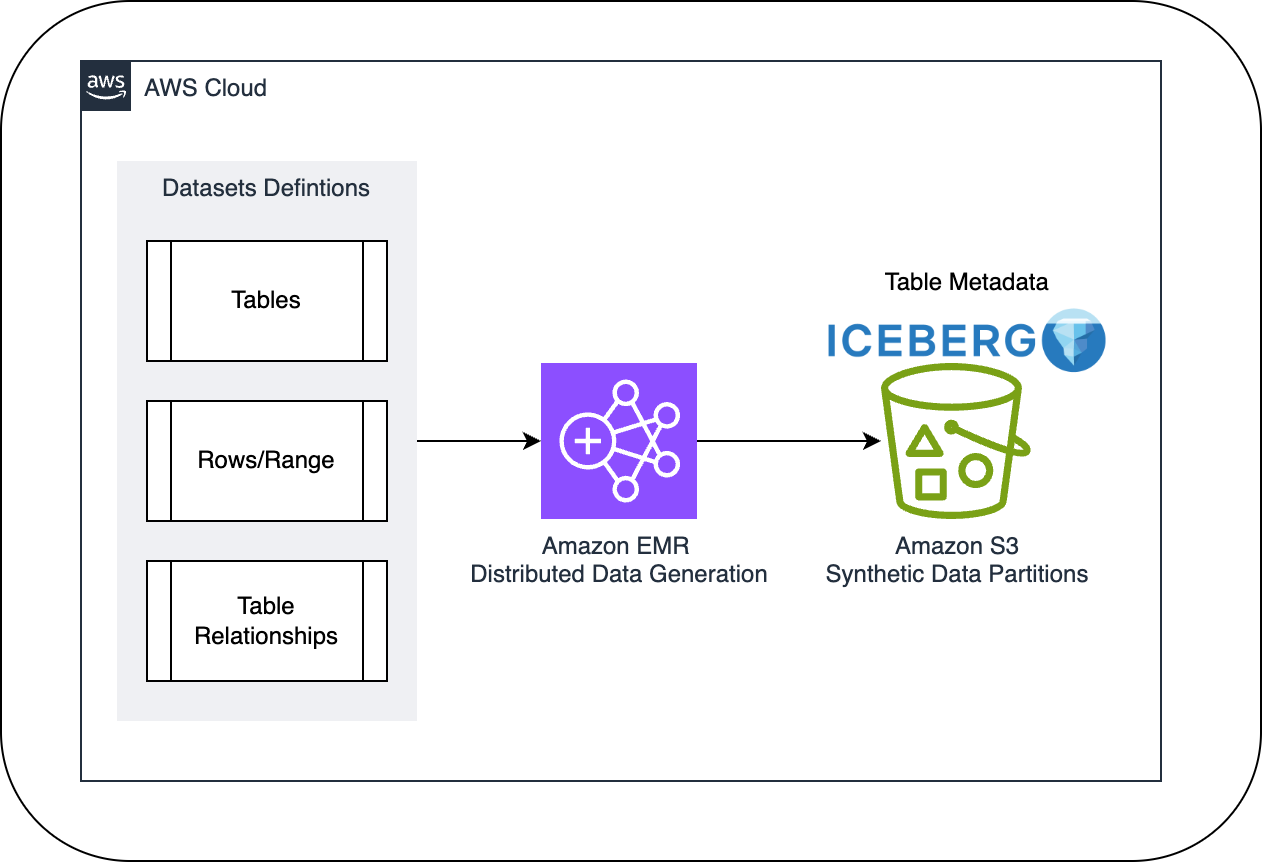
Our architecture addresses these challenges through four core components. Apache Spark on Amazon EMR provides the distributed computing framework necessary for large-scale generation. The Faker library offers synthetic data generation functions that integrate with Spark. Amazon Simple Storage Service (Amazon S3) with Apache Iceberg serves as the storage layer. We chose Iceberg for its schema and partition evolution capabilities without data rewrites, atomic transactions for consistency, precise time travel features for reproducible testing, and optimized performance at extreme scale. Amazon EMR handles dynamic resource allocation and cluster management.
The following diagram illustrates the solution architecture.
Synthetic data generation at scale with Amazon EMR
Amazon EMR emerges as a particularly powerful solution for this use case, offering several advantages that directly address our requirements. It facilitates scaling of compute resources through instance fleets and Spot Instances, which can reduce costs by up to 90% compared to On-Demand pricing. The service provides built-in performance optimization for Spark applications with real-time monitoring through Amazon CloudWatch integration.
The managed infrastructure reduces operational overhead by handling the underlying Spark ecosystem and cluster lifecycle, while still providing control over scaling policies, instance types, and configurations. Integration with Amazon S3, AWS Glue, and Amazon Athena facilitates end-to-end data generation and testing workflows. Support for multiple programming languages and notebooks provides flexibility in implementing generation logic tailored to specific testing scenarios.
The synthetic data generation process follows a systematic approach designed for efficiency and scalability, as illustrated in the following diagram.

Although synthetic data generation isn’t a sensitive workload, it’s important to maintain robust security throughout the data generation process. Amazon EMR provides security features that align with organizational compliance requirements.
For comprehensive security guidance specific to Amazon EMR deployments, refer to Security in Amazon EMR. The solution follows the AWS Shared Responsibility Model, where AWS manages the security of the cloud infrastructure, and customers maintain responsibility for data security, access management, and compliance controls in the cloud. Specifically for synthetic data generation workloads, AWS manages the security of the underlying Amazon EMR infrastructure, network, and service operations, and customers implement appropriate security controls for their data generation pipelines. Consider the following key areas:
- Data protection – Enable encryption at rest and in transit using Amazon EMR security configurations, including Amazon S3 encryption and TLS certificates for inter-node communication.
- Network security – Deploy Amazon EMR clusters in private subnets with security groups following least privilege, and enable the Amazon EMR block public access feature.
- Access control – Implement AWS Identity and Access Management (IAM) roles with least privilege for Amazon EMR service roles, Amazon Elastic Compute Cloud (Amazon EC2) instance profiles, and runtime roles to isolate job access. Fine-grained table-level and column-level permissions can be controlled using AWS Lake Formation. Additional authentication options are available using Kerberos and LDAP.
Optimize Faker for petabyte-scale data generation
When generating synthetic data at petabyte scale, using Faker’s implementations can quickly lead to performance bottlenecks. To overcome these limitations, adopt a combination of different optimization approaches instead of the default setup. Some of the approaches we adopted in this scenario are discussed in this section.
Faker instance pooling
The following code creates multiple Faker instances to avoid contention when generating data in parallel:
Consistent seed management
The following code provides reproducible data generation across distributed executors:
Random access to Faker pool
The following code distributes load across multiple Faker instances to reduce contention:
Broadcast variables for reference data
The following code efficiently distributes reference data to all executors:
Batch generation of synthetic data
The following code generates fake data in batches rather than one-by-one:
ThreadPoolExecutor for parallel processing
The following code uses Python’s threading for parallel operations within executors:
Optimize Amazon EMR and Spark
When processing massive datasets with Spark on Amazon EMR, carefully tuning configurations can substantially enhance performance beyond the standard settings. In this section, we discuss ways to optimize the execution environment, so you can efficiently handle petabyte-scale workloads with synthetic data generation. By strategically using Spark’s advanced features and configuring Amazon EMR for your specific use case, you can improve throughput, reduce processing time, and maximize resource utilization.
Arrow configuration
The following code enables Apache Arrow for efficient data transfer between Python and JVM. The default value is false.
Enable this configuration when your PySpark application frequently converts data between Python and JVM, especially for large DataFrames or when using Pandas operations. Keep this setting disabled for pure Spark SQL workloads or when memory is constrained.
This optimization is most effective in the following scenarios:
- When processing large-scale datasets that require frequent conversion between Python and JVM.
- In a PySpark application where large DataFrame operations and Pandas integration are needed.
- With data science workloads that combine Python UDFs with Spark SQL operations.
Consider the following trade-offs:
- Arrow maintains in-memory columnar format, resulting in increased memory consumption.
- Not all data types are fully supported in older versions of Spark.
- It might introduce overhead for very small datasets where conversion costs outweigh the benefits.
Adaptive query execution
The following code allows Spark to dynamically optimize query execution plans. The default value is true in Spark 3.2 and later, and false in earlier versions.
This optimization is generally recommended to keep enabled for most workloads. Consider disabling only when you have highly optimized, predictable queries where the adaptive overhead isn’t beneficial, or when troubleshooting query performance issues.
This optimization is most effective in the following scenarios:
- Complex join operations with unknown or skewed data distributions.
- Multi-stage queries where initial plans might be suboptimal.
- When processing data with changing characteristics over time.
Consider the following trade-offs:
- You may experience additional overhead during the query planning phase.
- You might occasionally choose suboptimal plans for certain edge cases.
Parallelism configuration
The following code sets appropriate parallelism for distributed data processing based on the volume of data you’re generating. The default value for spark.default.parallelism is the total number of cores on all executor nodes or 2, whichever larger. The default value for spark.sql.shuffle.partitions is 200.
Adjust this configuration when the default of 200 shuffle partitions creates too many small tasks (increase data volume) or too few large tasks (decrease for smaller datasets). Generally, aim for partition sizes of 100–200 MB. Modify default.parallelism when your RDD operations need different parallelism than the CPU-based default.
This optimization is most effective in the following scenarios:
- When generating consistent volumes of synthetic data across multiple runs.
- When you have predictable resource requirements.
- When you need to precisely control executor utilization.
Consider the following trade-offs:
- Static configuration might not adapt well to varying data volumes.
- Too many partitions can lead to task scheduling overhead.
- Too few partitions might cause memory pressure on executors.
Memory management
The following code optimizes memory allocation for execution and storage. The default value for spark.memory.fraction is 0.6, and for spark.memory.storageFraction is 0.5.
Increase memory.fraction from 0.6 to 0.8 when your workload is memory-intensive and you’re not using the JVM heap for other purposes. Adjust storageFraction based on your caching vs. execution memory needs. Decrease to 0.3 if you do minimal caching but have complex computations, and increase to 0.7 or higher for cache-heavy workloads.
This optimization is most effective in the following scenarios:
- Workloads that are memory-intensive and need fine-grained control.
- Workloads that balance between execution memory and cached data.
- During synthetic data generation that has many interdependent fields.
Consider the following trade-offs:
- Incorrect memory configuration can lead to frequent spills to disk or out-of-memory (OOM) errors.
- You might need to change the configuration to suit different workload characteristics.
- The settings must be monitored and tuned for optimal performance.
Limited Python UDF usage
The following code uses Spark’s built-in functions where possible instead of Python user-defined functions (UDFs). No additional configuration is needed. This is a coding practice.
We recommend using Spark functions over Python UDFs when the same functionality can be achieved. Use Python UDFs only when complex business logic can’t be expressed using Spark’s built-in functions, or when integrating with specialized Python libraries.
This optimization is most effective in the following scenarios:
- Simple transformations that can be performed using Spark functions.
- High-throughput workloads where serialization overhead needs to be minimized.
Consider the following trade-offs:
- This approach is less flexible compared to customer Python-based transformations or functions.
- You might need to use complex expressions to accomplish certain data patterns.
- There is a potential learning curve to familiarize yourself with Spark functions.
DataFrame caching
The following code caches frequently used DataFrames to avoid regenerating data. The default behavior doesn’t use caching. DataFrames are recomputed on each action.
Use this optimization to cache DataFrames that are accessed multiple times in your application. Monitor memory usage and use MEMORY_AND_DISK storage level for large DataFrames. Uncache DataFrames when they’re no longer needed to free memory.
This optimization is most effective in the following scenarios:
- When reusing reference data across multiple operations (can result in performance gains).
- For workloads where the same data is processed on multiple occasions.
Consider the following trade-offs:
- Too much caching might lead to memory process.
- Planning is required to manage cache in environments where memory is scarce.
Optimal partitioning
By default, Spark determines partitioning based on input data and previous operations. The following code makes sure data is properly distributed across executors:
Use repartition() when you need to increase partitions for better parallelism or support even data distribution. Use coalesce() when reducing partitions to avoid small files. Generally, target 100–200 MB per partition for optimal performance.
This optimization is most effective in the following scenarios:
- When controlling data distribution and avoiding data skew is very important.
- Before executing an expensive operation that will benefit from balanced data distribution.
- When optimizing downstream consumption use cases.
Consider the following trade-offs:
- This option is more expensive than
coalesce(). For large datasets,repartition()can lead to large shuffle. - The approach requires trial and experimentation to determine the optimal partition count.
- There is no “one-size-fits-all” setting. Different applications or operations might gain performance with different partitioning.
Partition-aware writing
By default, data is written without partitioning. The following code organizes data for efficient storage and retrieval:
Partition data when you have predictable query patterns that filter on specific columns. Choose partition columns that are frequently used in WHERE clauses and have reasonable cardinality (avoid too many small partitions or too few large ones).
This optimization offers the following benefits:
- Allows for highly parallel write operation across multiple executors.
- Organizes the data that is close to real-world production data.
- Allows for partition pruning when querying the data.
Consider the following trade-offs:
- Excess partitioning or too fine-grained partitioning might result in small files.
- It might result in data skew because of hot partitions.
- You might encounter storage and metadata overhead because of excessive partitions.
Best practices
Through our journey from terabytes to petabytes, we’ve identified several best practices:
- Begin with a modest dataset and incrementally scale, allowing for identification of bottlenecks at each stage.
- Implement robust data validation checks to confirm synthetic data maintains expected properties at scale.
- Regularly review and adjust Amazon EMR configurations, using Spot Instances and right-sizing clusters.
- Develop parameterized job scripts that can adjust data volume, complexity, and cluster resources dynamically.
- Design your synthetic data schema and generation logic to quickly accommodate new fields or changing distributions over time.
Conclusion
Our journey from terabytes to petabytes of synthetic data generation demonstrates how Amazon EMR, combined with Spark and Faker, can effectively address large-scale testing needs. The architecture we explored in this post scales to meet demanding data generation requirements while maintaining data quality and cost-efficiency.
We showed how starting with a solid foundation at terabyte scale, then gradually expanding through Amazon EMR managed services and Spot Instances, helps organizations build robust synthetic data pipelines. The combination of efficient data generation techniques, proper validation, and continuous monitoring provides reliable results at scale.
To begin implementing your own synthetic data generation system, start small, test thoroughly, and scale incrementally. For implementation guidance, refer to Generate production-grade synthetic data at petabyte-scale using Apache Spark and Faker on Amazon EMR.
About the authors
Meet Amazon Redshift RG – AWS Graviton-based instances with an integrated data lake query engine delivering up to 2.4x better performance at 30% lower price than RA3
Post Syndicated from Ankit Sahu original https://aws.amazon.com/blogs/big-data/meet-amazon-redshift-rg-aws-graviton-based-instances-with-an-integrated-data-lake-query-engine-delivering-up-to-2-4x-better-performance-at-30-lower-price-than-ra3/
On May 12, 2026, we announced the general availability of Amazon Redshift RG instances, powered by AWS Graviton processors. RG instances are up to 2.2x as fast for data warehouse workloads and up to 2.4x as fast for data lake workloads, all at 30% lower price per vCPU compared to RA3 instances. RG instances support all data lake formats supported by RA3 and eliminate Amazon Redshift Spectrum’s per-TB scanning charges. RG instances feature a custom-built integrated vectorized query engine, making them a more performant and cost-effective foundation for unified analytics.
We are launching with two instance sizes: rg.xlarge and rg.4xlarge, with additional sizes coming later this year.
Why we built this
RG instances bring the power of AWS Graviton processors to Amazon Redshift Provisioned clusters for the first time, paired with a purpose-built vectorized query engine. By combining Graviton’s superior price-performance with the latest Amazon Redshift innovations, RG instances deliver a step-change improvement across two dimensions: significantly lower cost and meaningfully faster performance for both warehouse and data lake workloads using Apache Iceberg and Apache Parquet. We built RG to help you avoid choosing between performance and economics. Graviton costs less to operate, and we’re passing that benefit to you while simultaneously raising the performance bar. Equally important, we designed RG to maintain full feature parity with RA3, so you can modernize your existing clusters without rearchitecting workloads or sacrificing capabilities you depend on today.
This combination is also increasingly critical for agentic artificial intelligence (AI) workloads. AI agents operating at scale generate a new class of analytics demand: high volumes of unique, unpredictable queries that require fast, low-latency responses to keep agents productive. Traditional price-performance ratios make running these workloads at scale cost-prohibitive. RG instances address this head-on. Lower per-vCPU pricing makes sustained high-query volumes economically viable, while improved query performance makes sure agents get answers fast enough to remain effective. Together, this provides the foundation for AI-driven analytics at the scale and economics that agentic workloads demand.
What’s new
RG instances: Better performance, lower cost
RG instances run on AWS Graviton, Amazon’s custom-designed cloud processor built from the ground up to deliver superior price-performance and energy efficiency. This translates directly into RG instances offering more compute cores, higher memory bandwidth, and lower inter-process communication latency compared to RA3, with performance improvements across warehouse, data lake, and mixed workloads.
Graviton costs less to operate, and we’re passing that benefit directly to you. RG instances are priced at a 30% lower cost per vCPU compared to RA3. Reserved Instance pricing follows the same model, making RG Reserved Instances equally 30% less costly than RA3. For pricing details, visit the Amazon Redshift pricing page.
Performance results
RG instances deliver faster, more efficient analytics across your most demanding warehouse and data lake workloads, whether you’re querying structured data in Amazon Redshift Managed Storage (RMS), running analytics over Iceberg tables in Amazon Simple Storage Service (Amazon S3), or processing Parquet files at scale. Iceberg workloads see the most significant gains, delivering up to 2.4x faster query execution. Parquet workloads deliver up to 1.5x faster query execution, and RMS-based data warehouse workloads deliver up to 2.2x faster query execution. All performance improvements are measured using industry-standard TPC-DS and TPC-H benchmarks at 10 TB scale on rg.4xlarge instances.
When combined with RG’s 30% lower per-vCPU pricing compared to RA3, these performance gains translate to even greater price-performance improvements, delivering more analytics value for every dollar spent.
Built-in data lake query engine – no more Spectrum charges
With RA3, data lake queries were offloaded to a separate fleet of nodes called Amazon Redshift Spectrum, scanning data externally and returning results back to the cluster. This architecture introduced network overhead, added latency, and imposed a $5/TB scanning charge on every query. RG instances change this fundamentally with a custom-built vectorized data lake engine running directly inside the cluster, eliminating Spectrum scanning charges.
The purpose-built vectorized engine includes a highly optimized scan layer that implements the latest data pruning techniques, a purpose-built I/O subsystem, and a range of optimizations that use Graviton’s processing capabilities to make scanning Iceberg and Parquet data highly efficient. Beyond raw scan performance, the engine introduces JIT ANALYZE, a capability that automatically collects and uses statistics for data lake tables during query execution. This eliminates the need for manual statistics collection. The system uses intelligent heuristics to identify queries that will benefit from statistics, maintains lightweight sketch data structures, and builds high-quality table-level and column-level statistics, all transparently. Having up-to-date statistics on data lake tables can deliver orders-of-magnitude improvements in query performance, and with JIT ANALYZE, you get this benefit automatically without operational overhead.
What customers are saying
Sean Lynch, Vice President, Data and Architecture, Southwest Airlines:
“Amazon Redshift RG instances have the potential to deliver meaningful business impact for Southwest Airlines. Based on initial testing in our development environment, our data warehouse workloads run 50-60% faster, and data lake analytics are 45% faster, enabling teams to get insights sooner, respond to operational conditions faster, and make data-driven decisions with less latency. These early results are encouraging, and we are excited to validate and scale these improvements in production. All of this comes without per-terabyte Spectrum scanning charges, delivering 30% lower cost than RA3 at a time when fuel prices continue to pressure industry margins.”
Akshay Srinivasan, Data Engineer, tombola:
“The new Graviton-based Amazon Redshift RG instances delivered 1.8x-2x faster write throughput and up to 2.2x faster read speeds compared to RA3 across a diverse set of batch and analytical jobs, enabling us to process 40% more within the same window. Compressed ETL cycles, accelerated time-to-insight, and decision-making no longer bottlenecked by the pipeline. Together, these translated directly into fresher data reaching our analysts and business teams sooner. What made this even more compelling was a concurrent 30% reduction in compute spend alongside the gains. Delivering more for less is a rare outcome, and one worth highlighting. In a volume-heavy gaming industry at tombola, where query latency and cost compound at scale, this has been one of the more impactful platform decisions we’ve made this year.”
Modernizing your workloads to RG
Today, we are launching rg.xlarge and rg.4xlarge instance sizes, available now for you to modernize your existing Amazon Redshift provisioned workloads. RG instances support three migration paths, all accessible directly from the AWS Management Console:
- Elastic Resize (recommended): The fastest path for most customers migrating from RA3 or DC2, with only 10-15 minutes of downtime.
- Snapshot & Restore: Best for you if you need to make configuration changes as part of your migration.
- Classic Resize: Available for workloads that require a full cluster rebuild.
Before migrating your production workloads, we strongly recommend validating your queries and workloads on RG instances first. We’ve published an Upgrade Guide to help you right-size your cluster and plan your migration with confidence.
Getting started
You can start using the RG instances (rg.xlarge and rg.4xlarge) today in the following AWS Regions: US East (N. Virginia), US East (Ohio), US West (Oregon), US West (N. California), Canada (Central), South America (São Paulo), Europe (Ireland), Europe (Frankfurt), Europe (London), Europe (Paris), Europe (Stockholm), Europe (Milan), Europe (Spain), Asia Pacific (Tokyo), Asia Pacific (Seoul), Asia Pacific (Singapore), Asia Pacific (Sydney), Asia Pacific (Mumbai), Asia Pacific (Jakarta), Asia Pacific (Hong Kong), Asia Pacific (Osaka), Asia Pacific (Malaysia), Asia Pacific (Hyderabad), Asia Pacific (Taipei), and Asia Pacific (Melbourne).
You can launch new clusters or migrate existing clusters through the AWS Management Console, AWS Command Line Interface (AWS CLI), or AWS API.
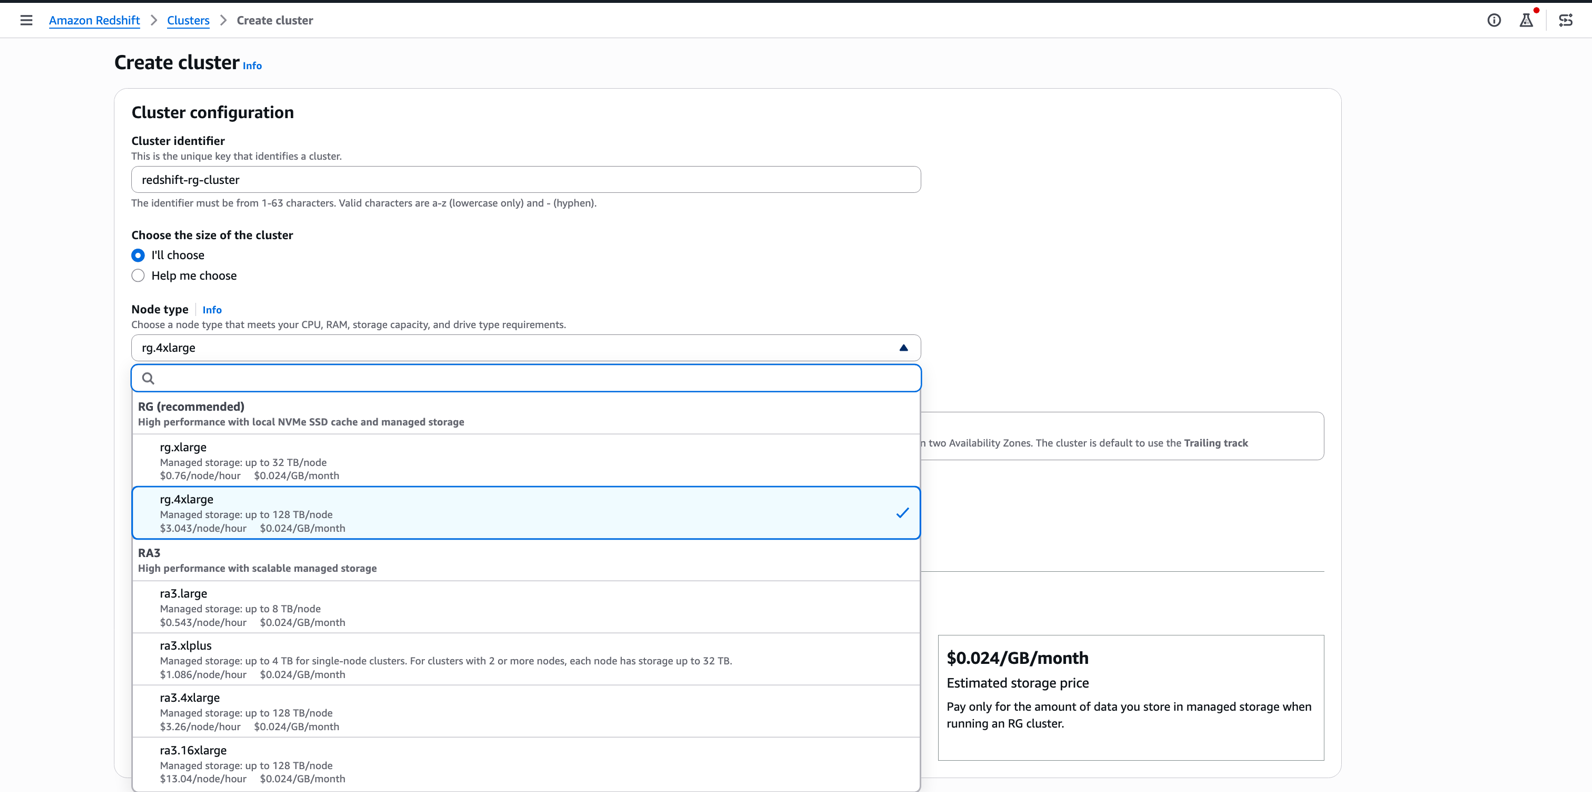
To create a new RG cluster in the Amazon Redshift console
- Review the Cluster and Nodes in the Amazon Redshift documentation.
- Choose Amazon Redshift on the AWS Management Console and choose Create Cluster.
- In the Create Cluster screen, choose the required RG node type.
To modernize from RA3 or DC2 in the Amazon Redshift console
- Review the Upgrade Guide in the Amazon Redshift documentation.
- Choose your migration path. Elastic Resize is the right starting point for most customers.
- Choose the required RG node type.
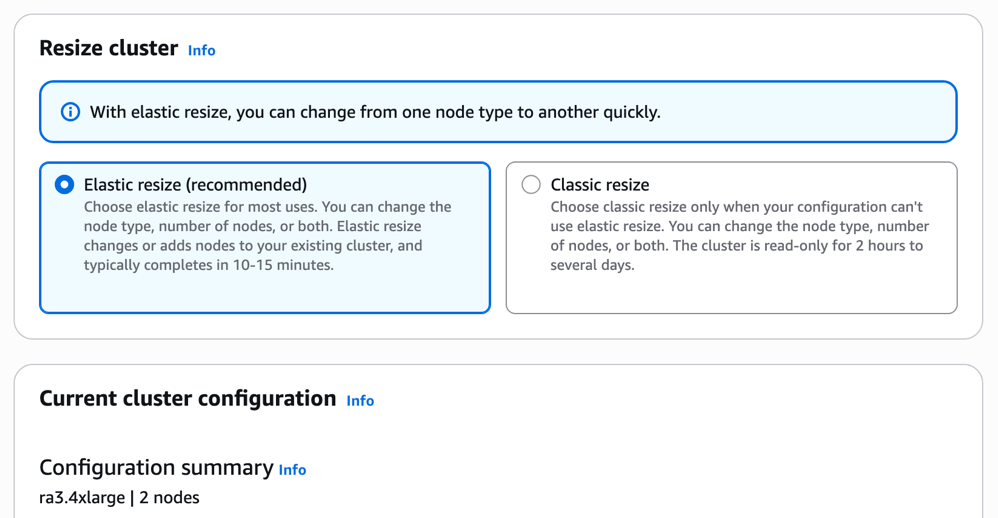
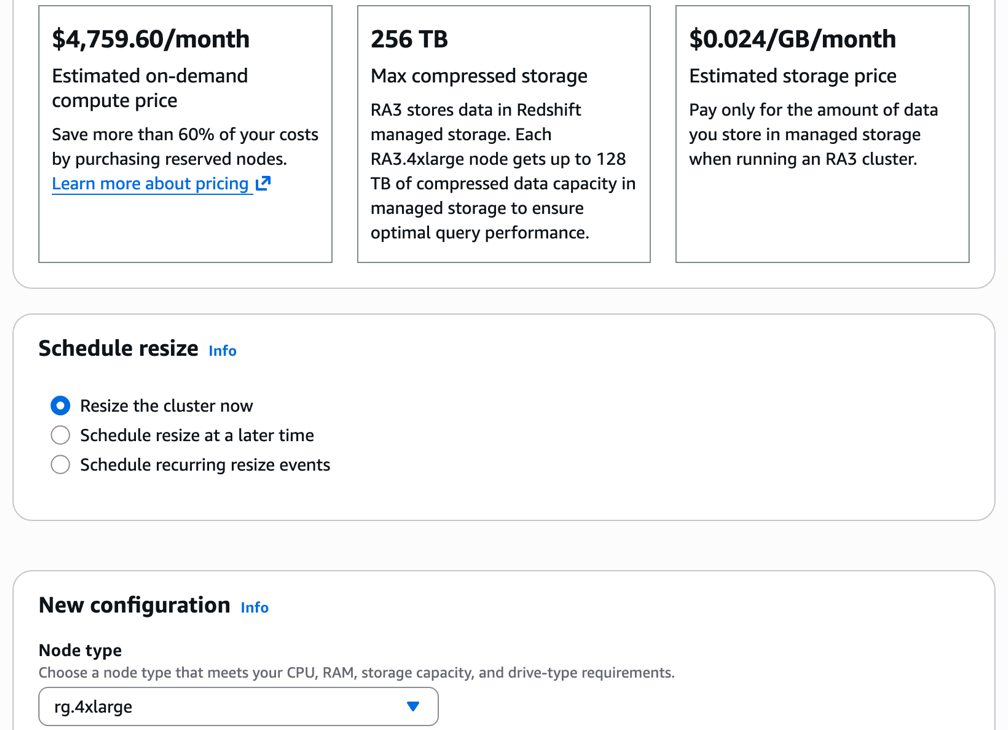
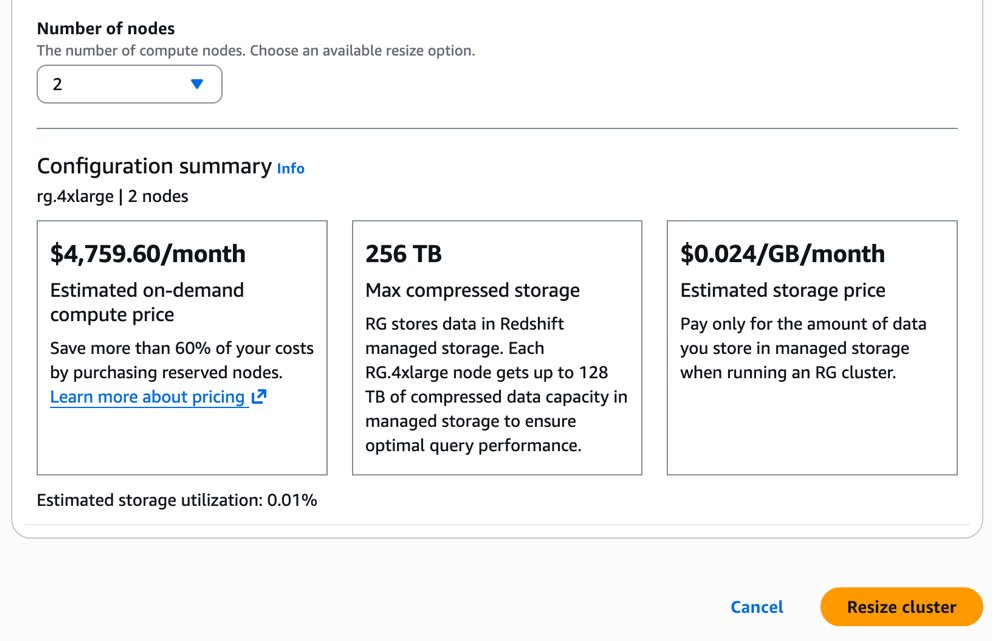
For pricing details, visit the Amazon Redshift pricing page.
Clean up
If you are evaluating RG instances in a test or development environment and do not wish to continue, you can delete your RG cluster directly from the AWS Management Console or by using the AWS CLI to avoid incurring additional charges. If you used Snapshot & Restore to create a test RG cluster alongside your existing RA3 cluster, make sure you delete the RG cluster and any associated snapshots you no longer need. If you are using Data Sharing during migration, remember to remove data shares and decommission your RA3 cluster after you have fully validated your workloads on RG.
Conclusion
Amazon Redshift RG instances represent a significant step forward for you if you run data warehouse and data lake workloads on AWS. By bringing AWS Graviton processors to Amazon Redshift Provisioned clusters for the first time, paired with a purpose-built vectorized native data lake engine, RG instances deliver up to 2.4x better performance on Iceberg workloads, up to 1.5x on Parquet, and up to 2.2x on RMS data warehouse workloads, all at 30% lower per-vCPU cost than RA3. The elimination of Amazon Redshift Spectrum scanning charges makes data lake query costs predictable for the first time.
To get started with RG instances, visit the Amazon Redshift RG documentation to assess your workload and plan your migration.
Resources
- Amazon Redshift RG Instance Documentation.
- Upgrade Guide.
- Amazon Redshift Pricing.
- AWS re:Post – Amazon Redshift Community.
Questions or feedback? Drop a comment or join the discussion on AWS re:Post.
About the authors
[$] openSUSE “terms of site” raise complaints about age restrictions
Post Syndicated from jzb original https://lwn.net/Articles/1072689/
Many people in the Linux community began using the operating system—and
contributing to open source—at a tender age, often well before
their 16th birthday. Thus, a recent change in openSUSE’s terms of site (ToS)
that required users of the project’s web site to be “at least 16
” in their jurisdiction has
years of age or the age of majority
raised objections. The terms have since been modified, though users
must still have parental approval to create accounts if they are
younger than 16.
Rapid7’s 2026 Global Cybersecurity Summit: Key Takeaways for Security Leaders
Post Syndicated from Emma Burdett original https://www.rapid7.com/blog/post/it-2026-global-cybersecurity-summit-key-takeaways-security-leaders
Security teams are working in an environment where speed, scale, and complexity are all increasing at the same time. Across the Rapid7 2026 Global Cybersecurity Summit, the focus was not just on how the threat landscape is evolving, but on how teams are adapting their approach to keep up.
The sessions brought together perspectives from across detection and response, exposure management, AI, and security operations, with a consistent emphasis on making better decisions earlier and with more confidence.
How modern attacks are starting across identity, cloud, and social engineering
Several sessions explored how initial access has shifted toward identity misuse, social engineering, and cloud misconfigurations. These entry points often blend into normal activity, making it harder for teams to distinguish between legitimate behavior and early-stage compromise.
Understanding how attacks begin has become a critical part of detection strategy. Rather than relying on a single signal, teams need to recognize how activity develops across multiple systems and how seemingly low-risk events can connect into something more serious.
What real incident response looks like inside modern MDR and SOC teams
The sessions focused on MDR and the SOC provided a closer look at how incidents unfold in practice. Investigations rarely follow a clean path, and analysts are constantly making decisions with incomplete information while attackers continue to move.
What stands out is how MDR extends the SOC beyond detection, combining continuous monitoring with human-led response to guide organizations through incidents as they happen. Alerts initiate the process, but outcomes depend on how teams interpret signals, prioritize actions, and manage tradeoffs under pressure across cloud, identity, and on-prem environments.
This view highlights the operational reality behind incident response, where coordination and judgment shape the outcome as much as the technology itself.
Why complexity is slowing security teams down
Security environments continue to expand, bringing more tools, more data, and more potential points of failure. Across the summit, speakers highlighted how fragmented visibility and unclear ownership can make it difficult to maintain a consistent view of risk.
The challenge is not eliminating complexity, but managing it in a way that allows teams to act effectively. Organizations that focus on clarity, ownership, and prioritization are better positioned to respond when signals start to converge.
How exposure management is reshaping risk prioritization
A recurring theme was the shift from vulnerability management toward exposure management. Vulnerability data provides insight into what exists, but it does not always reflect what creates meaningful risk.
Exposure management adds context by connecting vulnerabilities to assets, identities, and business impact. This allows teams to focus on what is reachable and relevant, helping them prioritize based on real-world risk rather than volume alone.
Frameworks like CTEM were highlighted as a practical way to structure this approach, creating a continuous process that connects discovery, validation, and response.
How AI is influencing both attacker behavior and defender workflows
AI is now influencing both sides of the security equation. Attackers are using it to scale reconnaissance and improve the effectiveness of social engineering, while defenders are applying it to reduce alert fatigue and accelerate analysis.
The discussion focused on how AI fits into real workflows, particularly in areas such as triage, enrichment, and investigation. Teams are finding the most value when AI is used to support decision-making rather than replace it, with transparency and oversight remaining central to adoption.
How security operations are shifting in practice
Across the summit, a clear direction emerged. Security operations are moving toward earlier action, more informed prioritization, and tighter integration between exposure, detection, and response.
This shift is reflected in how teams are building workflows that connect signals across environments and allow them to act before an incident escalates. It also reflects a broader move toward confidence in decision-making, where context and clarity are just as important as visibility.
Sound good? All sessions are available to catch up on, on demand here.
How ALS GeoAnalytics LITHOLENS ™ revolutionizes core logging through machine learning with Amazon EKS
Post Syndicated from Saransh Burman original https://aws.amazon.com/blogs/architecture/how-als-geoanalytics-litholens-revolutionizes-core-logging-through-machine-learning-with-amazon-eks/
In the mining industry, accurate geological analysis is required for improving mine design and development. Traditionally, this involved labor-intensive and time-consuming on-site inspections of drill core samples, often conducted in remote and challenging environments. ALS GeoAnalytics has streamlined this process through its LITHOLENS  platform, a machine learning (ML)-powered system that uses deep learning and machine vision to automate core logging. LITHOLENS significantly enhances data consistency, operational efficiency, and scalability while significantly reducing logging-related costs and lowering greenhouse gas emissions to support sustainable mineral extraction.
This post explores how ALS GeoAnalytics successfully deployed LITHOLENS with Amazon Elastic Kubernetes Service (Amazon EKS) to scale model training and inference while minimizing cost.
The challenge
Development of a new mine involves the creation of a 3D map of the ore body, known as a geological or resource model. This model drives all future design decisions and creating it requires drilling thousands of holes throughout the ore body to examine the structure and composition of the samples extracted. This process is subject to numerous challenges that affect both active and historical drilling campaigns. Challenges such as:
- Remote site access requiring geologists to travel long distances to visually inspect physical core boxes
- Subjective interpretations led to inconsistencies, with different experts often producing varying geological logs
- Underutilized historical imagery from past campaigns lacked standardized tools for meaningful analysis
- Lost or degraded physical samples made it difficult to revisit legacy data or validate past interpretations
- Limited transparency in logging and decision-making processes hindered collaboration and accountability
- Scheduling bottlenecks arose from reliance on a small pool of qualified experts
- Non-standardized data collection methods prevented effective scaling and cross-project comparison
These limitations not only delayed project timelines but also restricted the ability to generate reliable, high-resolution geological insights—ultimately impeding the speed and effectiveness of exploration strategies.
Machine learning at geological scale
ALS GeoAnalytics developed a comprehensive suite of machine learning and computer vision models to automate geological and geotechnical logging, transforming raw core imagery and data into actionable insights.
A machine learning pipeline formed the foundation for high-resolution visual analysis. It begins with the Color Extraction module, which scans each image to identify unique pixel colors and store the results in Amazon Simple Storage Service (Amazon S3). This data is fed into the Color Clustering module, where users can specify clustering parameters and choose from algorithms such as K-Means, which assigns pixels to clusters based on proximity to centroids, or the Gaussian Mixture Model (GMM), which uses probabilistic distributions to capture more complex variance structures within the color data. These methods effectively reduced image complexity and helped highlight mineralogical variation.
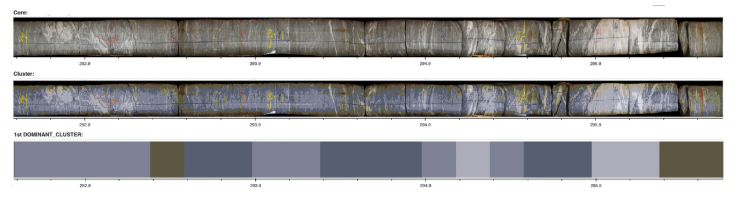
To quantify color composition along the core, the Percentage Report module was introduced. It segmented each image into user-defined sections (for example, 20 cm intervals) and calculated the proportional distribution of each color cluster, enabling spatial analysis of lithological patterns.
On the deep learning front, the team developed and deployed an advanced suite of models tailored for geological and geotechnical analysis. A highlight of this work was the development of RoQE Net, a state-of-the-art neural network designed for geotechnical parameter extraction. RoQE Net demonstrated exceptional accuracy in computing Rock Quality Designation (RQD) and extracting alpha angles, key metrics for assessing core integrity and rock mass quality. In parallel, VeinNet and CobbleNet were engineered to identify and map complex geological features such as veins, cobbles, and lithological structures with high precision. These models were benchmarked against industry standards and consistently outperformed traditional methods in terms of accuracy, reliability, and scalability.Together, these machine learning and deep learning components form the backbone of the LITHOLENS platform—delivering automated, scalable, and highly accurate geological intelligence that accelerates decision-making and enhances the efficiency of exploration and resource modeling workflows.
Solution architecture
ALS GeoAnalytics built LITHOLENS on AWS using a hybrid architecture that combines containerized workloads with serverless components. The system uses Amazon EKS for compute-intensive machine learning tasks, AWS Lambda for API operations, Amazon S3 for data storage, and Amazon Relational Database Service (Amazon RDS) for structured data management.
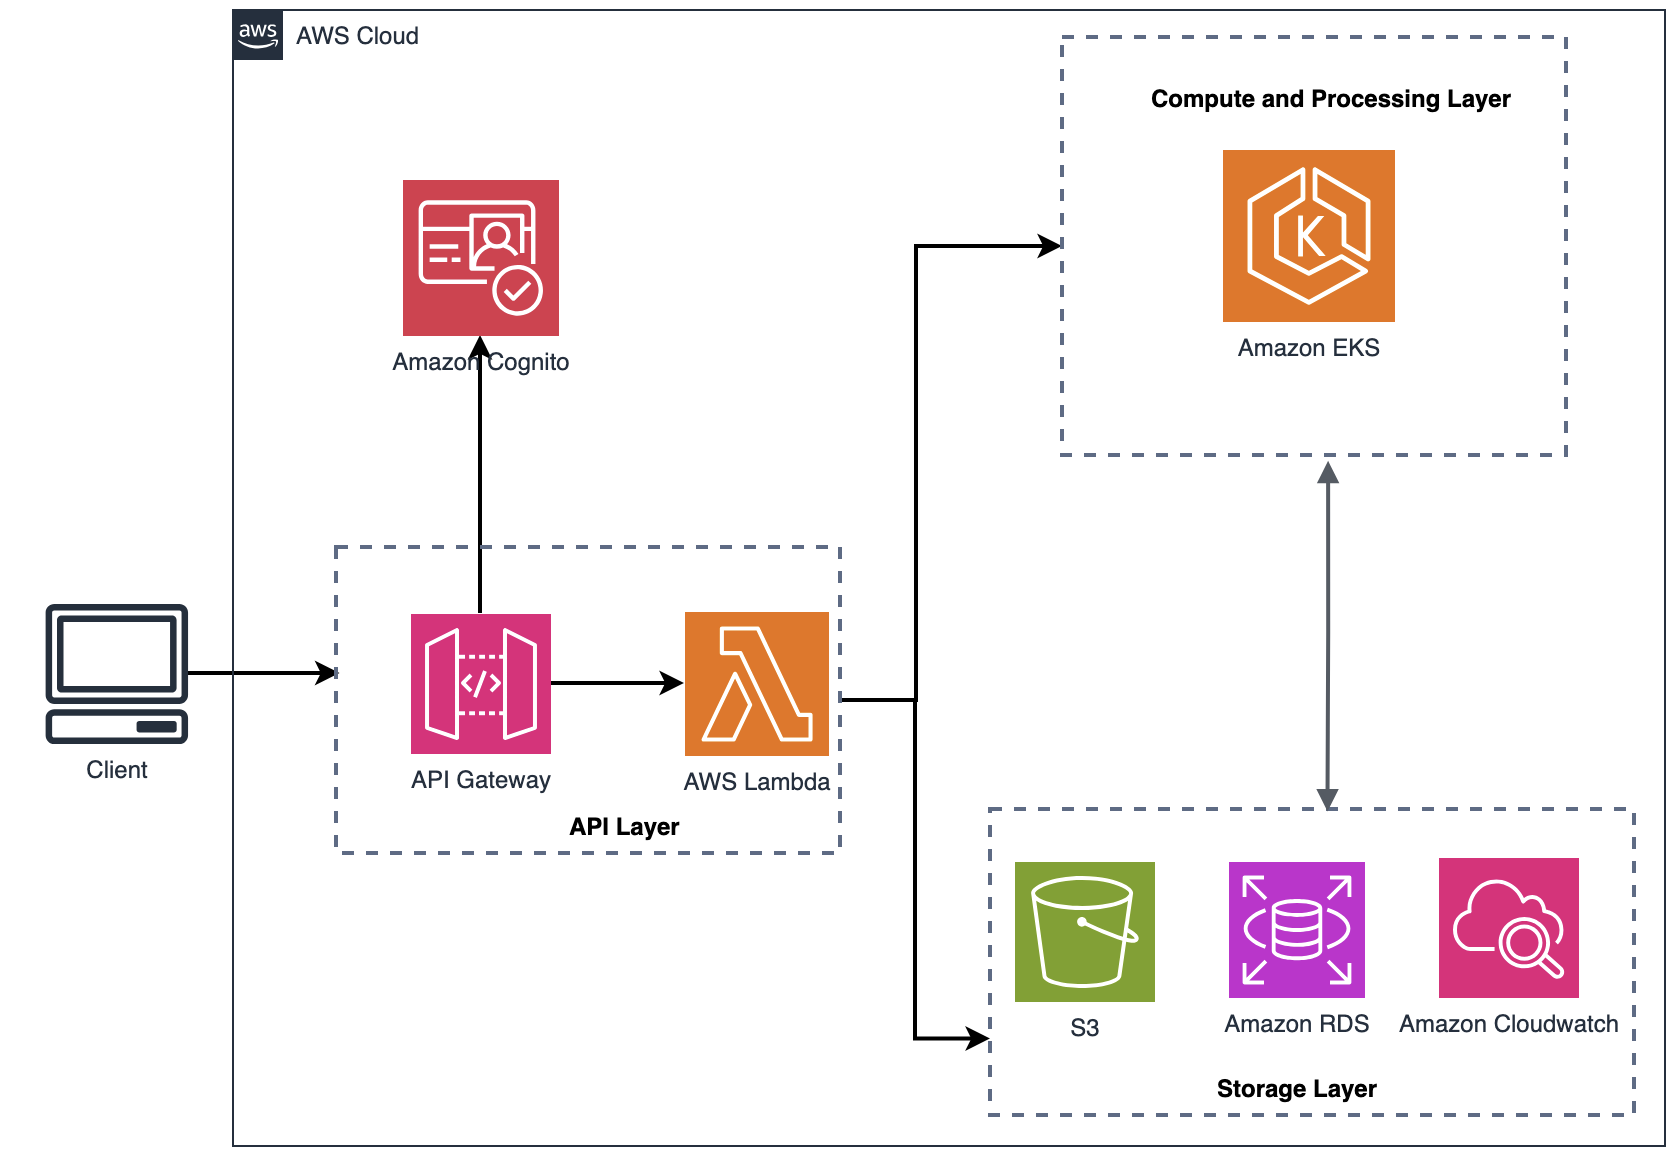
Figure 1: Architecture Diagram
LITHOLENS uses a unified API model to drive next-generation rock and mineral data analysis. This unified API created is a unified application programming interface that combines multiple services, data streams, and analytic capabilities into a single, powerful access point. Unlike traditional APIs—which might deliver basic, one-dimensional data—you can use the unified API to connect, analyze, and automate complex workflows across departments, vendors, and a wide variety of data sources all at once. With the unified REST API, users can submit geological analysis jobs, monitor progress, and retrieve results through a single interface. This API combines multiple services and data streams into one access point, so users can automate complex workflows across departments and data sources.
Architecture flow:
- Request Intake – Jobs are submitted through Amazon API Gateway with a payload specifying job parameters and EKS configuration.
- Job Orchestration – The API backend, running on AWS Lambda, provisions EKS containers with the appropriate configuration. User data scripts bootstrap each instance with required setup and execution commands.
- Execution and Data Flow
- Input data is retrieved from Amazon S3.
- Computation is performed on EKS pods using G6 instances.
- Logs and intermediate results are continuously tracked.
- Results are stored in S3 or persisted into RDS through dedicated API calls.
- Resource Management – Upon job completion, EKS containers instances automatically shut down, reducing costs.
Architecting for scale and efficiency
To handle variable workloads efficiently, ALS GeoAnalytics implemented a hybrid architecture that’s designed for both performance and cost. The system uses Amazon EKS for compute-intensive ML tasks while using AWS Lambda for lightweight API operations and job orchestration.
Key architectural decisions:
- Amazon EKS for ML Workloads – Deep learning model training and inference require sustained compute power with GPU acceleration. EKS provides the container orchestration needed to manage these workloads across G6 instances, with automatic scaling based on job queue depth.
- Lambda for API Gateway – Job submission, status checking, and result retrieval are handled through serverless functions. This removes the overhead of maintaining always-on API servers for sporadic client requests, reducing costs during low-usage periods.
- Pre-configured AMIs – Custom Amazon Machine Images contain all required dependencies and model artifacts, reducing container startup time from several minutes to under 30 seconds. This approach improves job throughput and reduces compute costs by minimizing idle time.
- Automated Resource Management -–EKS clusters scale down to zero when no jobs are queued, so compute resources are only consumed during active processing. Combined with S3 for data persistence and RDS for metadata, this creates a cost-effective architecture that scales with actual usage.
This design addresses the geological industry’s unpredictable workload patterns while maintaining the performance needed for complex computer vision tasks.
Business impact and results
LITHOLENS has seen success with 10 different mining companies on over 40 active projects, with substantially accelerated project completion and a standard analysis process used across all projects. This new approach has made mineral detection and classification more accurate while reducing the need for experts to visit sites. Teams can now trace how analysis decisions are made, grade minerals more consistently, and plan projects and assign resources more effectively. Real-time monitoring and reporting give managers up-to-the-minute information on how projects are progressing.
Conclusion
The massive scalability of Amazon EKS has allowed ALS GeoAnalytics to fundamentally transform how core logging and analysis is conducted. AWS suite of services enables LITHOLENS to efficiently implement computer vision and machine learning, bringing new operational capabilities to our customers and opening business opportunities throughout the mining industry. The success of LITHOLENS demonstrates how cloud computing and AI can help modernize a long-standing industry like mining, creating value through improved operational efficiency, accuracy, and scalability. ALS GeoAnalytics continues to evolve its platform on AWS, using cloud computing to push the boundaries of what’s possible, and looking to grow LITHOLENS in to promising applications in oil and gas, civil engineering, and even space exploration.
About the authors
How Synthesia optimizes generative AI video inference on Amazon EC2 G7e instances
Post Syndicated from Moises Hernandez original https://aws.amazon.com/blogs/architecture/how-synthesia-optimizes-generative-ai-video-inference-on-amazon-ec2-g7e-instances/
Synthesia, an enterprise-focused AI video platform, has transformed content creation, helping everyone to create video content without cameras or microphones. To achieve this, Synthesia allows its users to create video avatars that synthesize the likeness and voice of real people. Synthesia achieves this through a series of in-house developed models based on various architectures, including latent diffusion video generation models.
Customers like Synthesia often choose to host their models on Amazon Elastic Compute Cloud (Amazon EC2) instances because of the flexibility and control over the underlying hardware that the service provides, and among them they find the G7e instance family to be a cost-efficient option to serve GPU-memory intensive generative AI video models, giving customers access to NVIDIA RTX PRO 6000 Blackwell GPUs, with 96GB of GPU memory.
When generating videos using AI models with a Variational Auto Encoder (VAE) Decoder in the architecture, customers often find the GPU utilization is bottlenecked by the saving rate of the video frames to a file held on storage. This causes GPU stalls and reduces average GPU kernel utilization, which is the percentage of time the GPU is actively executing compute kernels rather than idle.
This post introduces a video decoding optimization technique that we have ideated in collaboration with Synthesia Research Engineering team, which we call Asynchronous Frame Generation Pipeline. Adopting this technique allows you to overlap GPU compute, device-to-host (D2H) data transfer, and host-side post-processing. In this post, we apply this technique to the VAE decoder of a Wan video generation model as an example, where our benchmarks on G7e show increased GPU kernel utilization from 82% to 99.9%, in turn leading to an 8.2% decrease in latency (and increase in throughput) for video decoding. We expect this technique to benefit any customer with a chunked video generation pipeline that transfers frames to host memory.
You can find an end-to-end example implementation of the Asynchronous Generation Pipeline applied to the Hugging Face Diffusers format of the Wan 2.2 14B Model in the associated GitHub repository.
In the following section, you will see how latent diffusion models generate video and why the traditional sequential decoding approach can lead to inefficient GPU utilization.
Understanding the sequential decoding bottleneck
Latent diffusion video generation models have emerged as powerful tools for generating temporally coherent video sequences. To reduce compute and memory requirements, these models perform the diffusion process in a compressed latent space of a variational auto-encoder (VAE), as depicted in the below figure, which has generally a much lower dimensionality than the originating video pixel space.
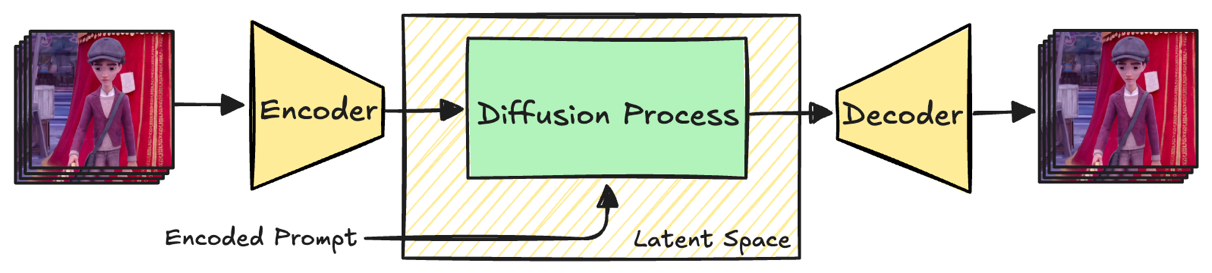
Fig. 1 High-level architecture of a VAE model. The depicted frames are taken from the Wan 2.2 repository sample video used in the example implementation in the next sections.
At inference time, a latent representation is initialized with noise and iteratively denoised via a Diffusion Process. To make sure that the output follows the text prompt, every denoising step is conditioned on the text input if present. After the final denoising step, the Diffusion Process yields a generated video that is still represented in the latent space of the VAE. The last step therefore consists in decoding the latent video back into a human-readable pixel video using the decoder part of the VAE.
Processing the whole latent or pixel video at once is usually too resource-intensive, even on large GPUs. It is therefore common to split the video along the temporal dimension and to decode video frames one latent frame at a time, resulting in a chunk of, for example, 4 consecutive pixel frames, as shown in Fig 2.
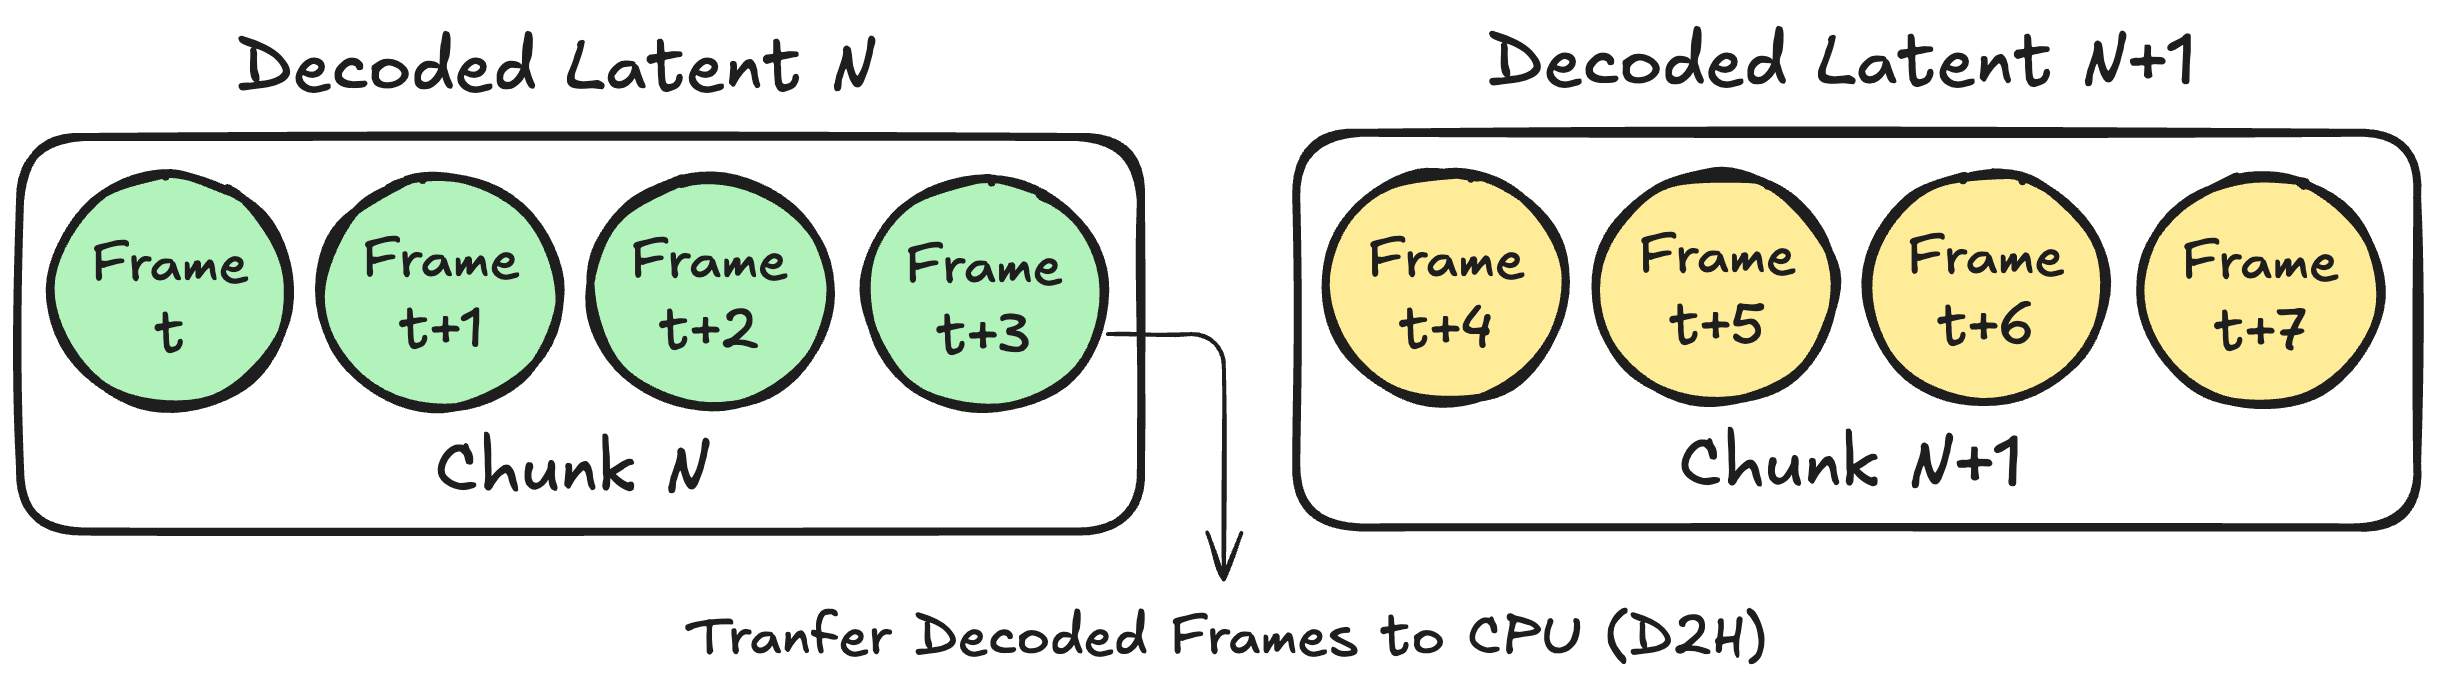
Fig.2 Decoding one latent results in a chunk of 4 time-consecutive pixel frames which are transferred from the GPU to the host.
Once a chunk has been decoded and processed on the GPU, the corresponding pixel frames must be transferred back to host (CPU) memory with a D2H transfer, so they can be written to a file or further processed. If you wait to transfer the video frames once the entire video has been decoded, the full decoded video must fit in GPU memory before being transferred, making this strategy hard to scale for arbitrarily long videos. A more memory-efficient alternative is to transfer the decoded frames every time a chunk is decoded, so that the GPU memory footprint of the decoder scales with the size of the chunk instead of the full video.
Traditionally, a newly generated set of frames in a chunk N is passed from GPU memory to CPU RAM synchronously, and it is committed to storage before the CPU can launch the CUDA kernels (referred to as kernels from now on) that process the N+1 chunk. This leads to systematic GPU stalls between chunks, as the copy from device to host prevents the GPU from immediately starting work on the next chunk, reducing overall hardware utilization, and in turn increasing processing time. We will refer to this synchronous process as Sequential Frame Generation Pipeline, which is depicted in Fig. 3.

Fig.3 Schematic representation of the Sequential Frame Generation Pipeline. Launching the kernels processing Chunk N+1 needs to wait for the full copy and storage of the frames in Chunk N.
In the following section, you will learn how to overcome this bottleneck using an asynchronous pipeline that overlaps GPU computation with data transfers and host-side processing.
Asynchronous Frame Generation Pipeline
To minimize GPU stalling, and in turn increase GPU utilization, you need to modify the Sequential Frame Generation Pipeline introduced in the previous section, so that all host-side CPU work (such as appending decoded frames to a file) runs in parallel with a stream of uninterrupted device-side kernels. This section shows you how to achieve this using as an example the implementation of an Asynchronous Wan VAE Decoder, which is implemented with PyTorch and you can find in the associated GitHub repository.
By default, PyTorch schedules work on a single (default) CUDA stream per device which executes the operations in issue order unless additional streams are explicitly created. To decouple compute and D2H copies, the implementation uses two CUDA streams so that the GPU is allowed to overlap compute kernels, which are enqueued on the default stream, and D2H copies on a dedicated copy stream. Compute kernels are enqueued on the default stream, which from now on can be referred to as Compute Stream, and D2H copies on a dedicated copy stream, namely the Copy Stream. In Fig. 4 you can find the full setup on a GPU accelerated instance (G7e in our example) depicted.
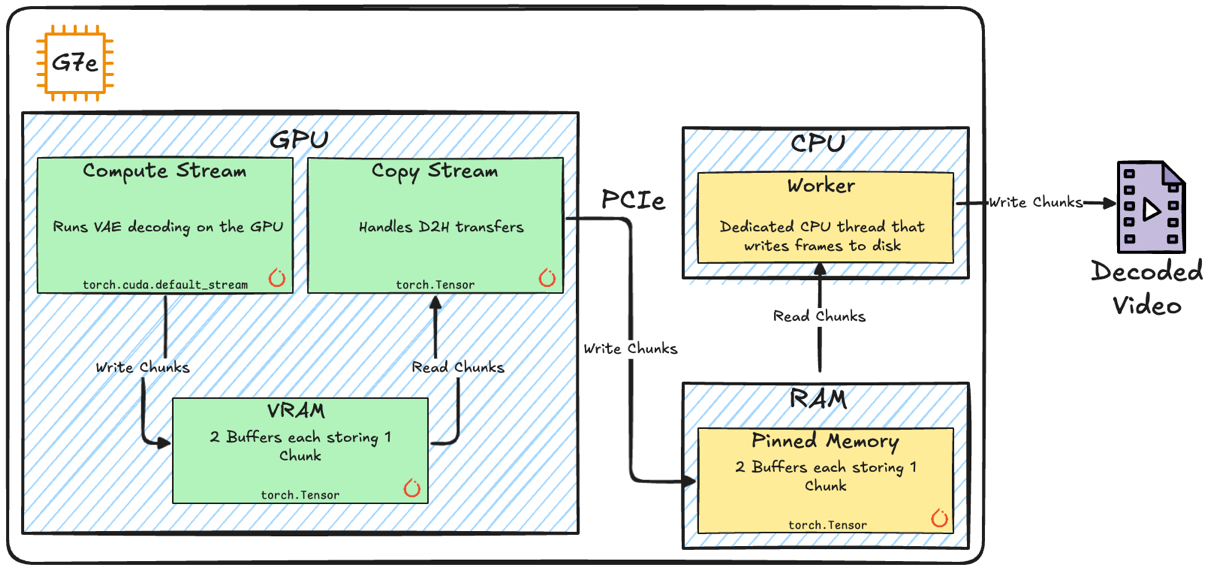
Fig. 4 High level diagram of the key components in our implementation of the Asynchronous Frame Generation Pipeline.
On the host side, kernel submissions are interleaved with D2H transfers and post-transfer processing and, to avoid host-side blocking calls and maximize GPU utilization the Asynchronous Frame Generation Pipeline introduces two mechanics:
- A dedicated Worker CPU thread responsible for reading chunks from Host Memory (RAM), and writing them to file, leaving the main Python thread to focus on launching kernels and scheduling D2H transfers.
- Two in-memory Buffers on the GPU Memory (VRAM), and on the Host Memory (RAM), and page-lock the required Host Memory buffers to make sure D2H copies are performed fully asynchronously.
Using a double-buffer strategy makes sure that for adjacent chunks the compute, D2H transfer, and host processing can overlap safely as they operate on distinct memory buffers.
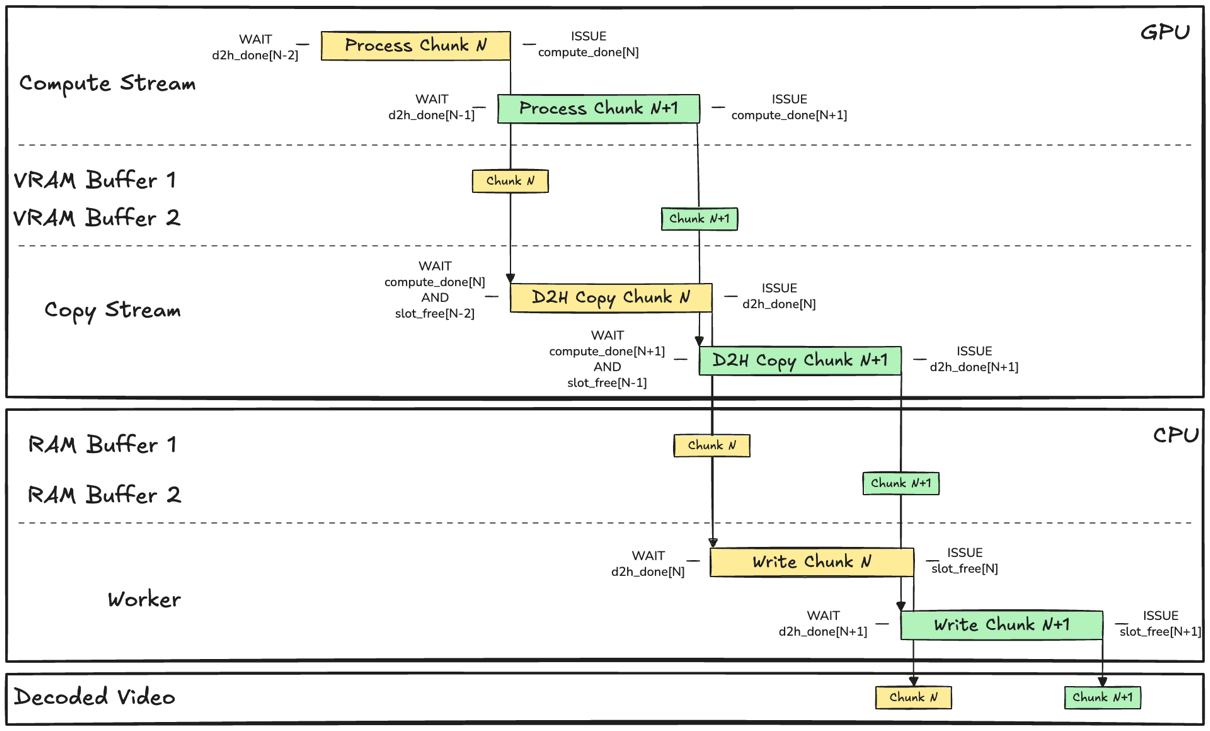
Fig. 5 Schematic representation of the interplay between Events, Streams, Buffers, and Worker component in the Asynchronous Frame Generation Pipeline implementation. Events are depicted as left and right conditions, expressing what the process WAITs for, and ISSUEs when it has completed. The size of the boxes representing operations has been scaled to fit the text, and therefore not representative of the actual processing time.
Since buffers can be accessed concurrently by different components, the implementation introduces a synchronization mechanism to avoid different kernels and threads corrupting data held in the buffer. This can be achieved using CUDA Events which are used as a barrier that clears if it can answer closed questions such as: Has decoding of chunk N completed? You can find the interplay between Streams, Threads and Events depicted in Fig. 5.
G7e benchmark results
To quantify the impact of the Asynchronous Frame Generation pipeline, you can benchmark the decoding of a single 41 latent-frames test video for both the Synchronous and Asynchronous pipeline on a g7e.2xlarge EC2 instance using this sample notebook. To have a common baseline, the benchmarks are based on the unoptimized Hugging Face Diffusers Wan 2.2 14B model, and, in both cases, the benchmarking loop performs an initial full decoding cycle to let CUDA and PyTorch initialize and allocate memory pools and cache. After warmup, the benchmarking session carries out 10 consecutive full video decoding cycles. We have run an end-to-end run as an example and present the results in Table 1.
| Metric | Synchronous (time s /video) | Asynchronous (time s / video) |
| min | 21.98 | 20.16 |
| mean | 21.99 | 20.17 |
| P99 | 22.01 | 20.20 |
Table. 1 Benchmark results for 10 consecutive decoding runs for the Synchronous and Asynchronous pipelines.
The example results show a speed gain of up to 8.2% on this benchmark, decreasing the Real Time Factor of the decoder from 3.21 to 2.95. Considering the g7e.2xlarge pricing as of writing this post ($3.36 per GPU on-demand in the Ohio region), this leads to an average saving of $896 for decoding 1,000 hours of video on a single GPU. This is a theoretical saving, calculated assuming that the underlying model operates at full computational efficiency without bottlenecks.
To have a qualitative understanding of how this performance boost is achieved, you can profile both the Synchronous and Asynchronous pipelines using this sample notebook. The results for an example run are reported in Fig. 6 and Fig. 7, showing the absence of GPU stalls in the Asynchronous pipeline as opposed to the Synchronous pipeline.
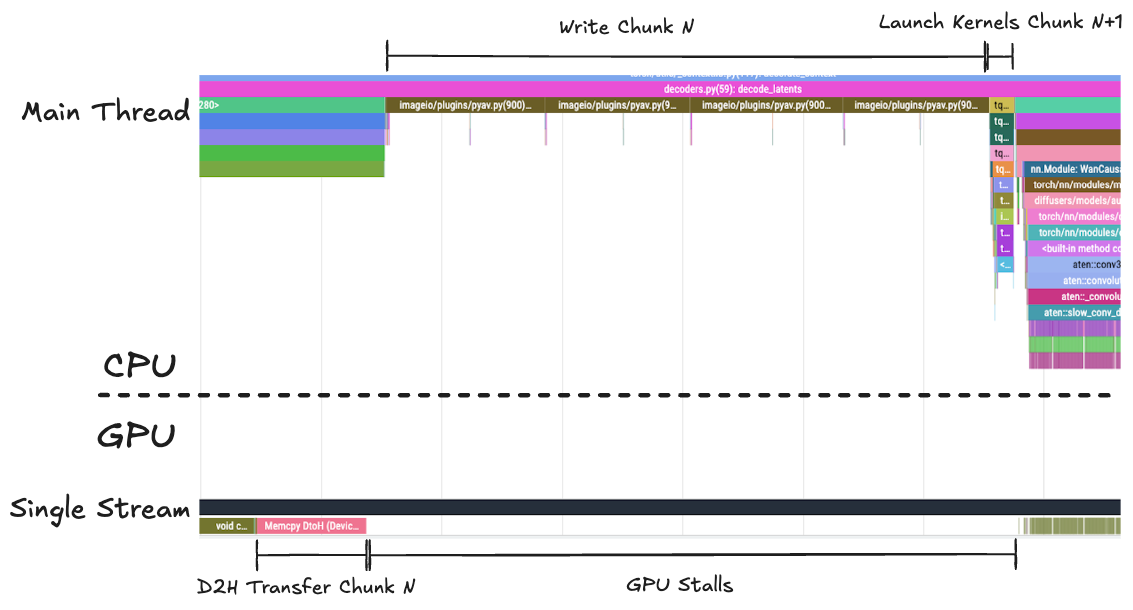
Fig. 6 Profile of the Synchronous pipeline single thread and stream. As the main CPU thread is writing Chunk N frames to disk, the GPU stream stalls, waiting for the CPU to launch the kernels needed to process Chunk N+1
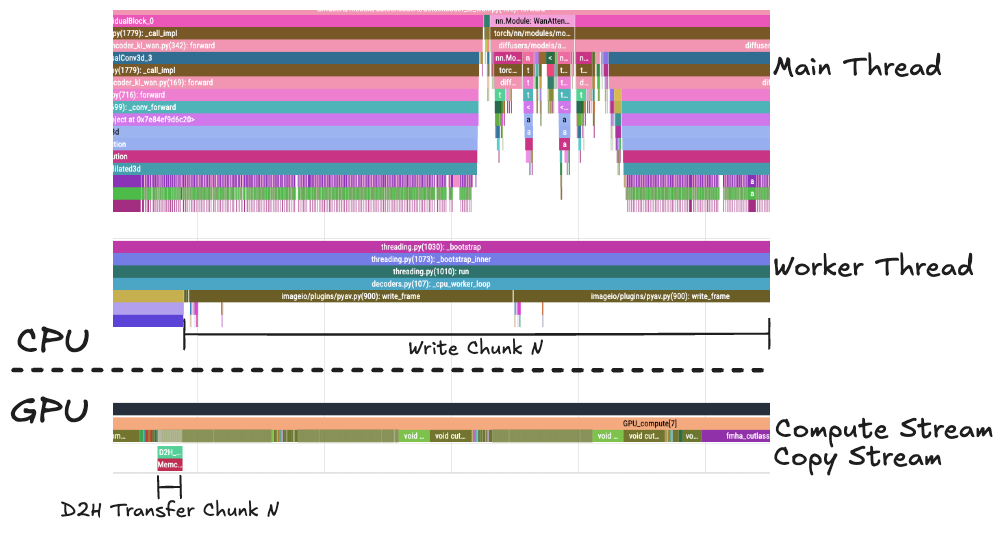
Fig.7 In the Asynchronous pipeline, the Compute Stream is not interrupted by the copying and writing of the frames to disk. The Main Thread is free to launch the processing kernels. This figure is displayed with a different zoom level than Fig. 6 to highlight the qualitative differences.
By focusing on the temporal axis for two consecutive chunks in the steady state, you can quantify the GPU kernel utilization increase, which, in our example run was 82% for the Synchronous case, increasing to 99.9% for the Asynchronous case.
Conclusion
In this post, we demonstrated how the Asynchronous Frame Generation Pipeline can improve GPU utilization when decoding latent videos on Amazon EC2 G7e instances. By decoupling GPU compute from device-to-host transfers and host-side I/O using dual CUDA streams, pinned memory buffers, and a dedicated worker thread, we eliminated the GPU stalls inherent in traditional synchronous decoding pipelines.
The sample benchmarks on the Wan 2.2 14B VAE decoder show an 8.2% reduction in decoding latency, translating to approximately $896 in savings per 1,000 hours of decoded video on a single GPU when considering the g7e.2xlarge pricing as of writing this post ($3.36 per GPU on-demand in the Ohio region). These gains come without any changes to model weights or inference quality, purely from better hardware utilization. We expect the kernel utilization gain to be even more impactful on optimized and compiled models, which make more efficient use of the GPU.
The techniques presented here are not specific to the Wan architecture, nor to the specific GPU utilized. Any chunked video generation pipeline that transfers frames to host memory can benefit from this approach. We encourage you to explore the associated sample implementation to experiment with how the Asynchronous Frame Generation Pipeline could be integrated into your own video generation workloads.
To get started with G7e instances for your generative AI video workloads, visit the Amazon EC2 G7e instance page.
About the authors
[$] In search of faster this_cpu operations
Post Syndicated from corbet original https://lwn.net/Articles/1073395/
The kernel’s this_cpu
operations are meant to speed access to per-CPU variables. They are
more optimal on some CPUs than others, though. During a
memory-management-track session at the 2026 Linux Storage,
Filesystem, Memory Management, and BPF Summit, Yang Shi proposed a
fundamental, and somewhat controversial, change to how these operations
work in order to provide better performance on a wider range of architectures.
[$] What’s brewing in CXL
Post Syndicated from corbet original https://lwn.net/Articles/1072858/
Compute
Express Link (CXL) is a technology intended to enable the provision of
“memory nodes” in data centers that provide (possibly shared) memory to
nearby CPUs. It has, Dan Williams said at the beginning of his
memory-management-track session on the topic at the 2026 Linux Storage,
Filesystem, Memory Management, and BPF Summit, “been making
“. He used the session to
memory-management problems worse since 2021
provide an overview of the ways in which CXL can be expected to extend that
record into the future.
THG Video Podcast: Counterfactuals – Paardeburg
Post Syndicated from The History Guy: History Deserves to Be Remembered original https://www.youtube.com/watch?v=TiSxiJwVEZw
[$] Improving the per-CPU memory allocator
Post Syndicated from corbet original https://lwn.net/Articles/1072840/
There are many places in the kernel where performance can be improved by
using per-CPU data. But, as it turns out, the kernel’s allocator for
per-CPU data has some performance problems of its own. Harry Yoo led a
session in the memory-management track of the 2026 Linux Storage,
Filesystem, Memory Management, and BPF Summit to explore ways to
address those problems and accelerate the allocation and initialization of
per-CPU data.
Security updates for Tuesday
Post Syndicated from corbet original https://lwn.net/Articles/1073542/
Security updates have been issued by AlmaLinux (libpng and nginx), Debian (erlang, netatalk, and nginx), Fedora (mod_md and SDL2_image), Mageia (perl-libwww-perl, perl-HTTP-Message, perl-WWW-Mechanize-Cached, perl-File-XDG, perl-Path-Tiny, perl-YAML-Syck, postgresql15, and rclone), SUSE (agama, alloy, cacti, cloud-init, dnsmasq, emacs, firefox, glibc, go1.25, go1.26, google-cloud-sap-agent, google-guest-agent, ibus-rime, librime, imagemagick, kernel, libsndfile, nginx, ongres-scram, ongres-stringprep, plexus-testing,, openexr, openssh, PackageKit, perl-Text-CSV_XS, php-composer2, php8, postgresql16, postgresql18, python-lxml, python-python-multipart, python3, python311-urllib3, rmt-server, rsync, tiff, tree-sitter, util-linux, and xen), and Ubuntu (linux, linux-aws, linux-aws-5.4, linux-aws-fips, linux-azure, linux-azure-5.4, linux-azure-fips, linux-bluefield, linux-fips, linux-gcp, linux-gcp-5.4, linux-gcp-fips, linux-hwe-5.4, linux-ibm, linux-ibm-5.4, linux-iot, linux-kvm, linux-oracle, linux-oracle-5.4, linux-xilinx-zynqmp, linux, linux-aws, linux-kvm, linux-lts-xenial, linux-nvidia-tegra, linux-nvidia-tegra-5.15, linux-raspi, and linux-xilinx-zynqmp).
Announcing Claude Managed Agents on Cloudflare
Post Syndicated from Mike Nomitch original https://blog.cloudflare.com/claude-managed-agents/
Cloudflare and Anthropic have collaborated to integrate Claude Managed Agents with Cloudflare Sandboxes. Our new integration gives you more control over your agent sandboxes, secures connections to private services, and improves observability.
In the past year, Cloudflare’s Developer Platform has expanded to give more developers the tools they need to run agents at scale. This includes:
-
Sandboxes for full stateful Linux microVMs at scale
-
Agents SDK, providing simple and customizable agent framework
-
Browser Run, which gives agents fully programmable and observable browsers
-
Dynamic Workers, allowing for dynamic sandboxed code execution at massive scale
Our goal is to make Cloudflare the simplest, most secure, and most programmable cloud for agents.
Integrating with Claude Managed Agents is another step in this direction. You can run your agent loop on the Claude Platform, while using Cloudflare to execute code, secure connections, and run custom tool calls.
To get going in just minutes, we’ve created a default deployment template that gives you the following:
-
Enhanced security – Run all agent traffic through customizable proxies. This allows you to securely inject credentials, prevent data exfiltration, and better observe how your agents interact with the outside world.
-
Sandbox control and observability – Get detailed sandbox metrics and logs. SSH into running machines. Customize sandbox images.
-
Lightweight sandboxes – Writing and executing untrusted code can be done in a traditional microVM or a lightweight isolate. This lets you hit massive scale, boot sandboxes in milliseconds, and minimize infrastructure spend.
-
Private service connectivity – Connect agents to private internal services without ever exposing them to the Internet.
-
Browser Control and Observability – Get an audit trail of every agent’s browser sessions, including session recording and human-in-the-loop flows.
-
Email – Give each of your agents its own email address and ability to send emails.
-
Custom tools – Extend your agents with tools without needing additional infrastructure. Just write functions and deploy.
You get all of this out of the box when deploying the integration, and you can easily customize if you need more.
Let’s take a brief look at Claude Managed Agents, see how to integrate a Cloudflare-based environment, then explore how to get the most out of Claude on Cloudflare.
Claude Managed Agents allow developers to easily define and run agents on the Anthropic platform. In these managed environments, Claude can read files, run commands, browse the web, and execute code. The harness supports built-in prompt caching, compaction, and various agent-first performance optimizations.
Until now, using Claude Managed Agents has meant running the entire stack on Anthropic-provided infrastructure. While this is great for some developers, others may need more control over their infrastructure choice, whether this is for security, compliance, or performance reasons. Self-managed environments for Claude Agents provide just that.
Anthropic describes this as “decoupling the brain from the hands.” The core agent loop runs in Anthropic (the “brain”), but the infrastructure for running and executing code (the “hands”) can be run anywhere, including Cloudflare.
Our new integration gives your agents a Cloudflare-based environment for running and executing code within minutes.
Follow the onboarding guide to get started. Then fork the repo and customize your integration as you see fit.
After setup, when a Claude Agent starts a session, it sends a message to your new Cloudflare-based control plane. The Workers-based control plane gives each agent session a sandboxed environment for executing code, developing applications, running CLI tools, and more. State is automatically persisted across session sleeps.
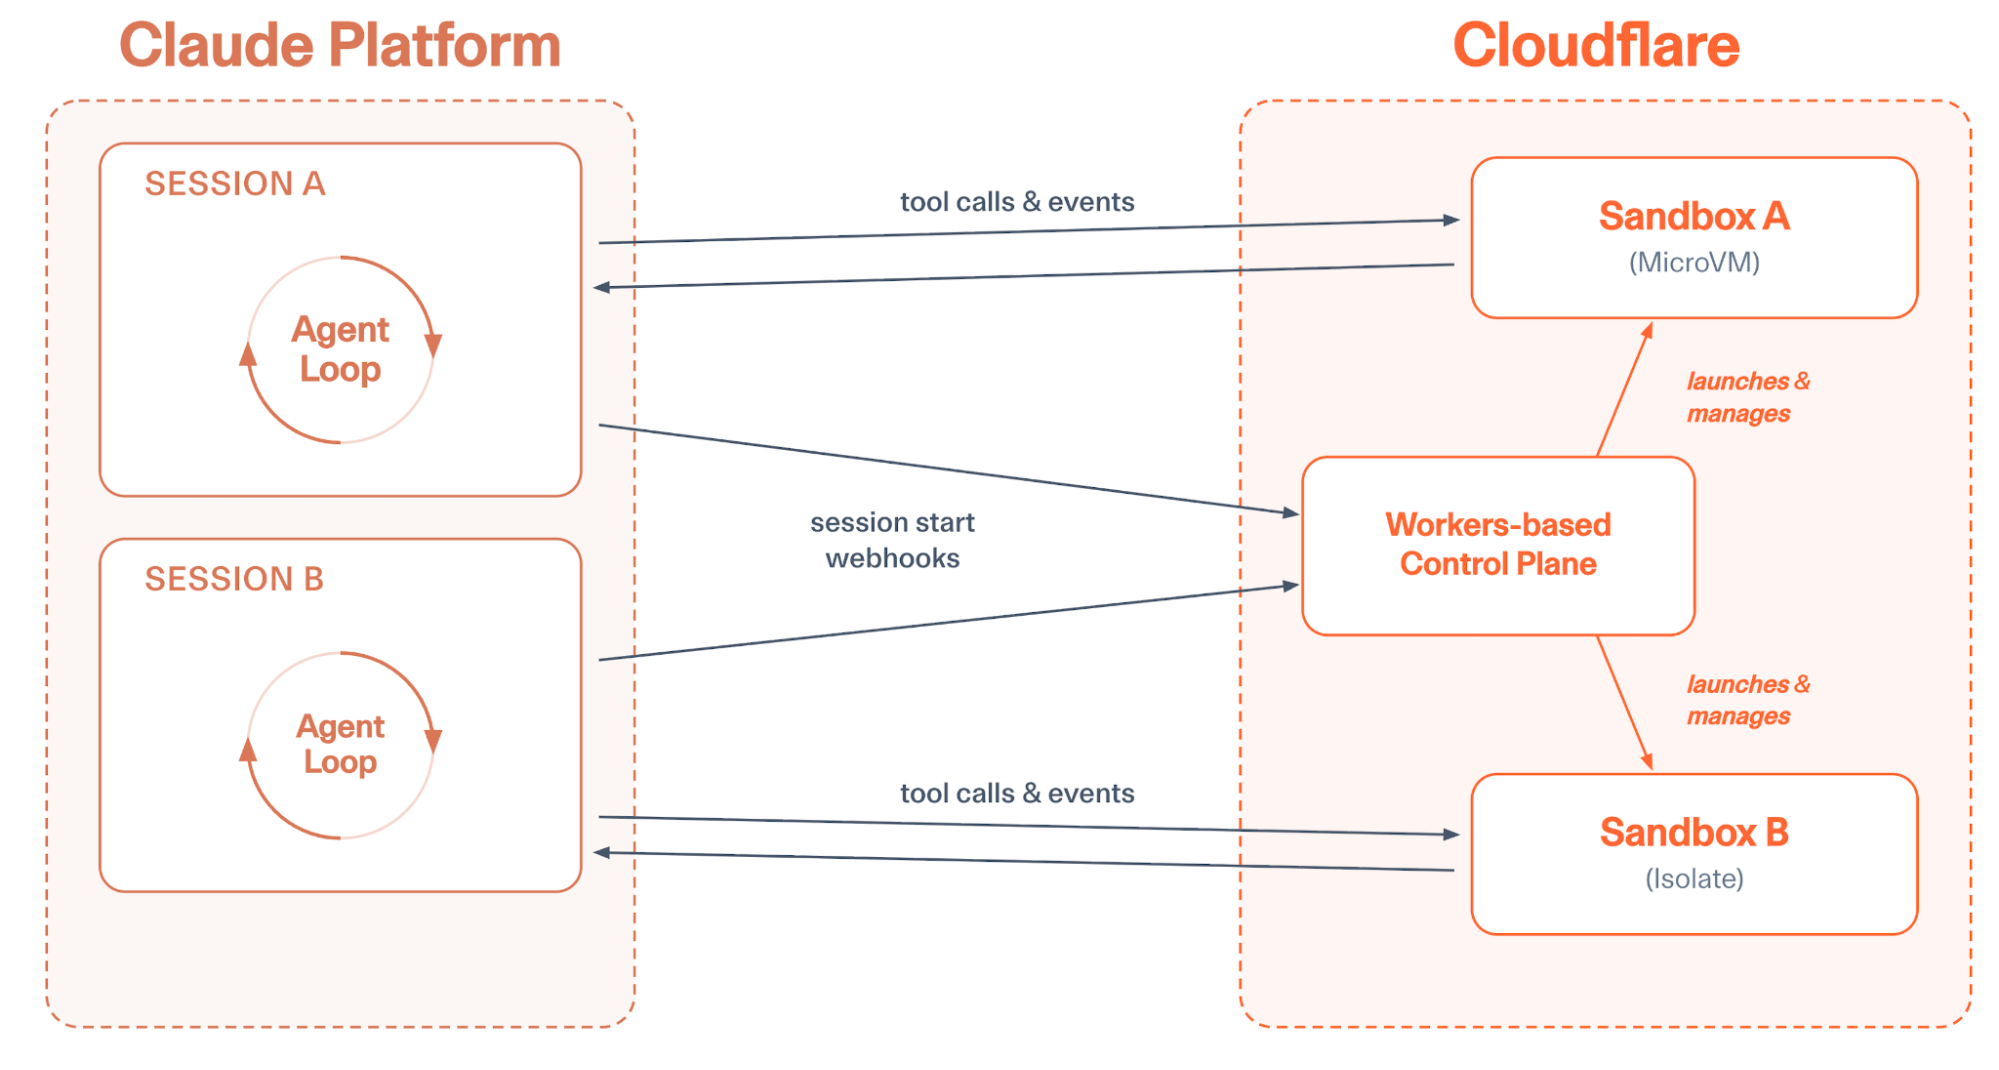
Sandboxes write files and execute code in response to the Claude-based Agent loop
You can optionally configure sandbox instance sizes or customize the container image that runs within VM-based sandboxes. Each sandbox can be observed in the Cloudflare dashboard, sandbox logs can be queried or shipped to external providers like Datadog or Splunk, and the control plane ships with a built-in UI, making it easy to track the state of sandboxes or SSH into specific machines.
Get interactive shell sessions into your agent’s sandbox
What if your agent backend booted in a few milliseconds, and you didn’t have to pay for the resources of a full VM when running the agent?
The industry needs a lightweight primitive for sandboxing as we adopt agents at scale, and we’re building just that.
But as models get better, we expect more and more workflows to be managed by agents. Each of your customers should be able to run many agents simultaneously; each of your employees should have tens of agents running at once. If we’re constantly running a full microVM per agent, we’ll be unnecessarily burning a ton of resources and money to enable this scale.
That’s why we’re providing a faster and cheaper sandbox for your Claude Agents. This sandbox is based on the AgentsSDK. You can execute arbitrary code in Dynamic Workers using Codemode, and you still get a file system, but your agent is doing all of this within a V8 isolate instead of a microVM.
If you need agents to act as a developer, building full applications and running Linux-based tools, you can still reach for a microVM-based sandbox. For this, we provide Cloudflare Containers, which Claude Managed Agents can also use.
But if you want a faster, cheaper, and more scalable alternative you can use isolates instead of microVMs easily. Just select “isolate” for backend type when setting up an Agent.
Setting up an “isolate” backend gives you a lightweight V8 isolate sandbox instead of a microVM
If you want to handle bursts of tens of thousands of concurrent agents or more, running with isolates will allow you to scale in a way that no VM-based solution allows.
Agents are far more powerful when they connect to your organization’s context. This usually means accessing private services and data.
As we’ve written before, sandboxed workloads on Cloudflare can use an outbound proxy for fully dynamic, customizable, and zero-trust authentication between sandboxes and external services. This lets you inject secrets into requests outside the sandbox, so the agent never has access to them. This protects against exfiltration attacks.
And sometimes internal services shouldn’t ever be exposed to the open Internet. We recently launched Cloudflare Mesh and Cloudflare Workers VPC to better connect to these private services, whether they’re running on a cloud provider like AWS or on-premises. This allows you to connect to internal services using post-quantum encrypted networking without a VPN or bastion host.
Claude Managed Agents can easily connect to private services with header injection or private VPC/Mesh tunnels. This is done via customizable outbound proxies. You can define egress policies that expose only the services you choose to the agent sandboxes that you choose. You can allowlist specific endpoints, perform zero-trust injection of encrypted credentials, access private services via Cloudflare Mesh, and even write custom proxy middleware.
The integration uses outbound Workers to handle egress however you see fit
You’re able to apply policies per tenant, per agent, or based on whatever metadata is useful. This gives you full control over how your agents connect to external services.
Agents need more than just a code execution environment. Cloudflare’s Developer Platform provides the tools you need by default to let your agents do more.
Sandboxes can make tool calls on Cloudflare and safely access external services.
Here are a few of the tools you’ll find most useful as you deploy agents on Cloudflare:
One of the most common tools agents need is a browser. While curl can get you pretty far, when you want an agent to act like a human, this often means interacting with the web like one: rendering JS-heavy applications, taking screenshots for QA validation, filling out forms, etc. Browser Run is Cloudflare’s tool to give agents browsers.
A Browser Run session recording lets you watch how your agents used a browser. One of many built-in tools.
The Claude Managed Agents integration ships with multiple browser-related tools that can be enabled immediately. These include browser_search, browser_execute, screenshot, browse, fetch_to_markdown, and a Cloudflare-specific implementation of web_fetch allows your agent to control a browser that runs on Cloudflare infrastructure. This not only lets your agent do more, but it also makes it easy to audit every action your agent’s browser is taking on the web, apply allowlists and denylist to browser sessions, and save recordings of browser sessions for future debugging.
The integration also comes with built-in support for email with the send_email, email_read, and email_list tools.
You can also kick off new sessions via email, or configure the agent to send emails using any domain and address configured with the Cloudflare Email Service. This allows the agent to act on your behalf when it needs to, reply to context in forwarded emails, and autonomously interact with others via email.
Other built-in tools include call_service, which uses Cloudflare Mesh or Workers VPC to connect to private services, and image_generate, which uses Workers AI to generate images on Cloudflare. This pairs well with Claude providing text-based inference.
Additionally, we encourage forking the repo to easily add customized tools. For example, you could add a custom tool to host a public file on Cloudflare’s R2 object storage. Just add the relevant binding in wrangler config, write a zod definition, and short function in custom-tools.js:
defineTool({
  name: "r2_host_file",
  description: "Upload from sandbox to R2 and get a public URL.",
  inputSchema: z.object({
    key: z.string().describe("Object key"),
    content: z.string().describe("UTF-8 file body"),
    contentType: z.string().describe("MIME type"),
  }),
  run: async ({ key, content, contentType }, { env }) => {
    await env.PUBLIC_BUCKET.put(
      key, content, { httpMetadata: { contentType }}
    );
    return `${env.PUB_R2_URL.replace(/\/$/, "")}/${encodeURI(key)}`;
  }
}),
The Cloudflare Developer Platform provides all sorts of possibilities for extending your agents: give each agent session a git-backed repo with Artifacts, run edge inference with Workers AI, host applications written on the fly with Dynamic Workers, and more.
You don’t have to worry about infrastructure or scaling – just write a few lines of code and hit deploy.
We’re excited to be working together with Anthropic to bring Cloudflare’s flexibility, scale, and security to more users. Whether you want to run tens of millions of agents using isolates, securely connect to private services with Workers VPC, or write custom tools that take advantage of all of Cloudflare, our new integration makes it easy.
See the Getting Started with Managed Agents guide to get Claude Managed Agents set up with Cloudflare in just minutes.
pgBackRest will continue
Post Syndicated from jzb original https://lwn.net/Articles/1073470/
In April, David Steele, maintainer of the popular pgBackRest backup and restore project for
PostgreSQL, announced that he had archived
the project and it would no longer be maintained due to lack of
sponsorship. On May 18, he announced
that a number of sponsors have stepped forward to ensure its continued
development:
Over the last few weeks, a coalition of sponsors has come together
to fund ongoing development. Their support means the project is no
longer reliant on a single sponsor, giving pgBackRest the stability it
needs for the long term.[…] I’m looking forward to getting back to work. There are
features and optimizations in the pipeline that I’m excited to share
in upcoming releases. Thank you to our sponsors for making this
possible, and thank you to the community for your patience and support
during this transition.
Thanks to Paul Wise for the tip.
Laurie Anderson Is Quoting Me
Post Syndicated from Bruce Schneier original https://www.schneier.com/blog/archives/2026/05/laurie-anderson-is-quoting-me.html
Not by name, but Laurie Anderson quotes me in one of the tracks of her new album:
My favorite quote is from a cryptologist who said “If you think technology will solve your problems, you don’t understand technology and you don’t understand your problems.”
Also in interviews:
“Of course, it’s ridiculous, outrageous, blah, blah, blah,” Anderson says about the ad. ‘But, I mean, my favorite quote on this is from a cryptologist who said, ‘If you think technology will solve your problems, you don’t understand technology  and you don’t understand your problems.’ And I think I’m completely on board with that.”
People are telling me that she has been reciting this quote in performances for years. (I lost track of her since college and her 1981 hit “”https://www.youtube.com/watch?v=Vkfpi2H8tOE”>O Superman.”)
The origins of the quote is from Roger Needham:
If you think cryptography can solve your problem, you don’t understand your problem and you don’t understand cryptography.
I modified the quote in the preface to my 2000 book Secrets and Lies:
A few years ago I heard a quotation, and I am going to modify it here: If you think technology can solve your security problems, then you don’t understand the problems and you don’t understand the technology.
I can’t tell you why me in 2000 didn’t credit Needham by name. I should have.
I have used the quote pretty consistently since then. Somewhere along the line I dropped “security” from the phrase, and now say it more like Anderson quotes me:
If you think technology will solve your problem, you don’t understand your problem and you don’t understand technology.
I sometimes use singular and sometimes use plural. Sometimes I say “the problem” and “the technology.” But I think the quote flows better ending with just the word “technology.”
Dell Tech World 2026: It’s All About Sovereign and On-Premises AI
Post Syndicated from Ryan Smith original https://www.servethehome.com/dell-tech-world-2026-its-all-about-sovereign-and-on-premises-ai/
Dell devoted its first day of its annual trade show to all things NVIDIA and all things AI. With a focus on sovereign AI and on-prem AI, Dell has assembled new ecosystems for both client and server AI
The post Dell Tech World 2026: It’s All About Sovereign and On-Premises AI appeared first on ServeTheHome.
How AI Can Concentrate Power
Post Syndicated from The Atlantic original https://www.youtube.com/shorts/myYATSimVzo
OpenSearch Agent Skills bring built-in intelligence to your agentic IDE
Post Syndicated from Bobby Mohammed original https://aws.amazon.com/blogs/big-data/opensearch-agent-skills-bring-built-in-intelligence-to-your-agentic-ide/
Today, we’re launching OpenSearch Agent Skills, a repository of open, composable skills that bring built-in intelligence to developer workflows with OpenSearch, directly inside your favorite agentic IDE. By embedding OpenSearch expertise into the developer’s existing workflow, Agent Skills reduce setup time, eliminate unnecessary tool-hopping, and let teams focus on building rather than configuring.
Developers today can go from idea to working prototype in minutes using agentic IDEs like Claude, Cursor, and Kiro. They can spin up applications, generate APIs, and build end-to-end workflows with a prompt. But whether you’re experimenting with a new idea, building a POC, or running production systems, the experience quickly becomes more complex. For example, improving relevance in OpenSearch still requires deep expertise in query Domain-Specific Language (DSL), ranking logic, and hybrid search tuning. Troubleshooting latency or cluster health issues often means manually piecing together signals from logs, traces, shards, and infrastructure metrics. Even migrations from Elasticsearch or Solr can become complex and time-consuming because of schema conversion, compatibility gaps, and performance optimization challenges. As AI agents become a primary interface for building and operating applications on OpenSearch, a deeper gap emerges. Translating high-level intent into query DSLs, index configurations, and multi-step workflows still requires significant expertise. At the same time, workflows remain fragmented across domains like search, logs, and observability, forcing teams into siloed tooling and disconnected reasoning. The result is repeated trial-and-error, lack of standardized approaches, and slower time-to-value, despite the promise of faster development.
What are Agent Skills?
Agent Skills, developed by Anthropic, are a lightweight, open format for extending AI agent capabilities with specialized knowledge and workflows. They’re supported by a growing number of AI tools and agentic clients, including Kiro, Claude Code, Cursor, VS Code, GitHub Copilot, Codex and others.
At their core, Agent Skills are pre-built intelligence you can call, extend, and reuse. Each skill encapsulates domain knowledge, execution logic with multi-step workflows, and guidance with explainability, so you not only get results but understand how they’re achieved. Instead of stitching together tools and writing custom logic, you can invoke a skill to handle an entire task, from analysis to recommendation to execution.
At launch, OpenSearch Agent Skills introduces three foundational skills designed to address some of the most common and complex developer workflows: Search, Logs, and Solr to OpenSearch Migrations.
Search skill
The Search Skill builds on the foundation introduced by OpenSearch Launchpad, and brings an agentic, intent-driven experience to building and optimizing search applications with OpenSearch. Developers can go from a simple requirement or sample document to a fully working search application in minutes, whether lexical, semantic, hybrid, or agentic, with no
deep OpenSearch expertise required.
What it does:
- Translates natural language requirements or sample data into search configurations.
- Automatically creates index mappings, ingest pipelines, and ML model integrations.
- Sets up keyword, semantic, and hybrid search capabilities out of the box.
Example
Build a semantic search application for product documentation
Output:
- Fully configured OpenSearch index with optimized mappings.
- Integrated embedding models and ingest pipeline.
- Working search experience (API + UI) ready to test and iterate.
The Search Skill builds on the foundation introduced by OpenSearch Launchpad, extending the same capabilities into an agent-native workflow. You can move from idea to a production-ready search application in minutes, eliminating manual setup and accelerating both prototyping and deployment in OpenSearch.
Logs skill
The Log Skill analyzes log data and investigates distributed traces directly within OpenSearch, bringing agentic intelligence to observability workflows. Instead of manually crafting PPL queries or piecing together trace data across services, developers can express their intent and let the skill
handle the complexity.
What it does:
- Queries and analyzes log data using PPL, including error patterns, log volume trends, and anomaly detection.
- Investigates distributed traces, identifying slow spans, error spans, service dependencies, and agent invocations.
- Correlates logs and traces using traceId to surface root causes across the full observability stack.
Example:
Investigate why my service is returning 500s and correlate with recent traces
Output:
- PPL query results surfacing error patterns and log volume anomalies.
- Trace analysis identifying slow or failing spans and service dependencies.
- Correlated view linking log errors to specific trace IDs for faster root cause analysis.
With the Logs Skill, you can move from a vague symptom to a pinpointed root cause in minutes without needing to master PPL syntax or manually navigate trace data.
Solr to OpenSearch migration skill
The Migration Skill streamlines the complex process of migrating from Solr to OpenSearch. Migrations typically involve cluster discovery, compatibility checks, schema translation, data movement, and validation. These steps often require deep expertise and manual coordination. The
Migration skill turns all these steps into a guided, automated workflow.
What it does:
- Discovers and analyzes source clusters, including indices, mappings, and configurations.
- Performs compatibility assessment and highlights breaking changes or required transformations.
- Translates schemas, index settings, and queries into OpenSearch-compatible formats.
Example:
How can I migrate from Solr to OpenSearch?
Output:
- Detailed migration plan with compatibility report and required changes.
- Translated index mappings and configurations ready for OpenSearch.
- Executed data migration pipeline with progress tracking.
- Validation report confirming data integrity and query parity between source and target.
With the Migration Skill, developers can move from a fragmented, high-risk migration process to a structured, automated workflow. This approach provides faster transitions, reduced downtime, and confidence in production readiness.
How it works
OpenSearch Agent Skills are organized as a tree of SKILL.md files, structured by domain category. Rather than one monolithic skill that loads everything, the repo is broken into focused, independently installable skills. Each skill is small enough to stay within a tight context window, but
complete enough to handle real end-to-end workflows.
The top-level structure currently groups skills into three categories:
- Search: opensearch-launchpad for building BM25, semantic, and hybrid search applications from scratch.
- Observability: log-analytics for PPL-based log querying and error analysis, and trace-analytics for distributed trace investigation and span analysis.
- Cloud: aws-setup for deploying to Amazon OpenSearch Service (managed) or Amazon OpenSearch Serverless, with separate manifests for each.
Each skill bundles everything the agent needs: step-by-step workflows, reference docs (like PPL syntax guides and CLI references), and executable scripts that run directly against your cluster.
When you say “build a hybrid search app” or “why is my service throwing 500 errors?”, the agent activates only the matching skill, follows its instructions, and executes the right OpenSearch APIs. It returns results alongside clear explanations of what was configured and why. Because skills load on demand, you can have the full collection installed without bloating your agent’s context window.
We’re continuously expanding the skill library. Categories like Dashboard and Migration are already on the roadmap, with more to come as the ecosystem grows.
Getting started
Getting started with OpenSearch Agent Skills is straightforward. No MCP server or extras are required. Skills are installed using npx skills and work directly with your existing agentic IDE.
Prerequisites:
- Python 3.11+ and uv.
- Docker installed and running.
- AWS credentials configured (optional, for cloud deployment).
Install all skills:
Or install a specific skill: (e.g. opensearch-launchpad)
Once installed, simply express your intent to your agent, for example, “I want to build a semantic search app with OpenSearch,” and the agent reads the skill instructions and runs the scripts automatically.
Skills can also be installed to a specific agent (-a claude-code), globally across all projects (-g), or to all detected agents (--all). Explore available skills before installing with --list.
Looking ahead
This is just the beginning. We’re actively expanding the OpenSearch Agent Skills ecosystem with new capabilities across advanced relevance tuning, cost-aware performance optimization, index lifecycle and schema evolution, and cross-domain workflows that unify search, logs, and analytics.
Over time, we see Agent Skills becoming a community-driven knowledge layer across OpenSearch domains where solving a complex problem once means everyone benefits. More importantly, Agent Skills mark a fundamental shift in how developers build and operate with OpenSearch: moving away from manual, fragmented workflows toward intelligent, reusable capabilities that guide, optimize, and accelerate development at every stage.
Get involved
OpenSearch Agent Skills is designed to be an open, evolving ecosystem, and we’re getting started. Here’s how you can participate:
- Try it in your workflow. Install the skills in Claude, Cursor, or Kiro and start interacting with OpenSearch using natural language. Build new applications, investigate issues, or run migrations, and see how far intent-driven workflows can go.
- Build and extend skills. Agent Skills are intentionally modular and extensible. Create your own skills to encode domain-specific workflows, internal best practices, or repeatable operational playbooks. Whether it’s a custom relevance tuning flow or a specialized observability pipeline, your contributions can become reusable intelligence for others.
- Contribute to the ecosystem. We welcome contributions across all levels, from improving documentation and fixing bugs to adding entirely new skills. If you’ve solved a complex problem with OpenSearch, consider turning it into a skill and contribute to the Git repo.
- Share feedback and ideas. Let us know what worked, what didn’t, and what capabilities you’d like to see next, whether it’s deeper integrations, new domains, or more advanced automation.
- Join the conversation. Engage with the OpenSearch community through GitHub discussions, community forums, and working groups. Collaborate with others building similar workflows and help define the future of agent-driven search and observability.
With OpenSearch Agent Skills, we’re moving toward a world where developers don’t only use tools but use shared intelligence. If that resonates with you, we’d love for you to be part of the journey.
Star and get involved in the OpenSearch Agent Skills repo. Join the conversation on the OpenSearch community forum and connect with us in the OpenSearch Slack channel.
Acknowledgments
We would like to extend our sincere gratitude to the following contributors for their valuable contributions to this project Arjun kumar Giri, Sarat Vemulapalli, Chenyang Li, Fen Qin, Janelle Arita, Kaituo Li, Krishna Kondaka, Owais Kazi, Peter Zhu and Zhichao Geng. Your dedication, expertise, and collaborative spirit have been instrumental in making this project successful. Thank you for your time and contributions.