In 12 months, thousands of customers migrated hundreds of thousands of servers, saved 1.6+ million hours, and processed 4.5+ billion lines of code with AWS Transform. Celebrating its 1-year anniversary, AWS Transform agents now available in Kiro, Claude, Cursor, and Codex, including the agent builder toolkit Kiro power for building customized transformation agents.
To learn what happened in 12 months, the four things we learned, and how that evolved our roadmap, visit the one-year anniversary blog post.
Last week’s launches Here are last week’s launches that caught my attention:
The general availability of Claude Platform on AWS – You can get direct access to Anthropic’s native Claude Platform experience, including APIs, console, and early-access beta features, directly through your existing AWS account, without managing separate accounts, billing, or tracking. Claude Platform on AWS is operated by Anthropic, and customer data is processed outside the AWS security boundary. To learn more, visit the deep dive blog post.
Amazon EC2 M3 Ultra Mac instances – These instances are built on Apple M3 Ultra Mac Studio computers featuring a 28-core CPU, 60-core GPU, 32-core Neural Engine, and 256GB of unified memory. Compared to EC2 M4 Max Mac instances, M3 Ultra Mac instances provide 2x the unified memory, 1.75x the CPU cores, 1.5x the GPU cores, and 2x the Neural Engine cores, giving Apple developers the headroom to run significantly more Xcode simulators in parallel and accelerate on-device ML workflows to improve product time to market.
Amazon Redshift RG instances powered by AWS Graviton – These instances deliver better performance, running data warehouse and data lake workloads up to 2.4x as fast as previous generation RA3 instances, at 30% lower price per vCPU. RG instances include Redshift’s custom-built vectorized data lake query engine that processes Apache Iceberg and Parquet data on your cluster nodes.
Amazon Bedrock Advanced Prompt Optimization – You can optimize your prompts for any model on Bedrock, while comparing your original prompts to your optimized prompts across up to 5 models simultaneously. You can also use this if you are migrating to a new model or just want to get better performance on your current model.
AWS Security Agent full repository code scanning (preview) – You can use a new capability in AWS Security Agent that performs deep, context-aware security analysis of your entire codebase. When vulnerabilities are found, the scanner generates code remediation—specific fixes tied to the exact file and line—enabling teams to remediate security vulnerabilities faster than ever before. This capability is available at no additional charge for existing AWS Security Agent customers during the preview.
AWS Interconnect – multicloud connectivity with Oracle Cloud Infrastructure (preview) – You can quickly provision resilient, scalable private connections to other cloud providers using AWS Interconnect – multicloud connectivity. OCI is the latest CSP to adopt the open specification that powers AWS Interconnect. This allows AWS to provide a consistent, simple experience to our customers on OCI (preview), Google Cloud (generally available), and Microsoft Azure (coming later in 2026).
Additional updates Here are some additional news items that you might find interesting:
Accelerate AI research and education with Build on Trainium program – Read how the next generation of AI researchers is using Amazon chips to accelerate discovery. AWS invested $110 million to give university researchers access to purpose-built AI chips. AWS Trainium is speeding up AI research at UC Berkeley, MIT, Carnegie Mellon, and more. All research is open source, meaning improvements flow back to the broader developer community.
A full list of AWS Community Days 2026 – There’s something different about an event where the speakers are your peers, the organizers are volunteers who do this out of passion, and the agenda was shaped by the community itself. That’s exactly what AWS Community Days are, and they’re happening in cities across every continent, every year.
The Kiro Startups Credit program is back – Thousands of founders applied in the first round, and now applications are open again. Apply to receive up to one year of Kiro Pro+ credits automatically applied to your organization’s AWS account.
For a full list of AWS blog posts, be sure to keep an eye on the AWS Blogs page.
Processing hundreds of thousands of events per second while maintaining sub-second latency is a challenge many organizations face when building real-time data-driven applications. When filter policy changes propagate in up to 15 minutes, dynamic event routing becomes impractical, forcing teams to over-consume events and discard over 90% after costly per-event lookups. Smartsheet, a work management solution serving millions of users and processing hundreds of thousands of events per second to power features like live collaboration, workflows, and real-time notifications, faced exactly this problem.
In this post, you learn how Smartsheet built a Real-time Dynamic Filtering (RDF) system on Amazon Managed Service for Apache Flink, cutting messaging costs by over $40,000 per month and improving live collaboration latency by 1.8x.
The challenge: Static filter policies in a dynamic world
The Smartsheet event-driven architecture publishes hundreds of thousands of events per second to an Amazon Simple Notification Service (Amazon SNS) topic. Internal teams subscribe to this topic, typically by creating an Amazon Simple Queue Service (Amazon SQS) queue with an associated SNS filter policy defined through infrastructure as code (IaC). These filter policies are typically static and specify the types of events a consumer wants to receive, such as “sheet row created,” “sheet row updated,” or “sheet row deleted.”
Although SNS supports programmatic changes to filter policies, the SNS documentation notes that changes can take up to 15 minutes to take effect. This eventual consistency window created a significant problem for Smartsheet live collaboration feature.
Live collaboration requires knowing, in real time, which sheets have active collaborators. When a user opens a sheet, the system needs to immediately start receiving events for that sheet. When they close it, the system should stop. With a 15-minute propagation delay on filter policy changes, dynamic per-sheet filtering through SNS was impractical.
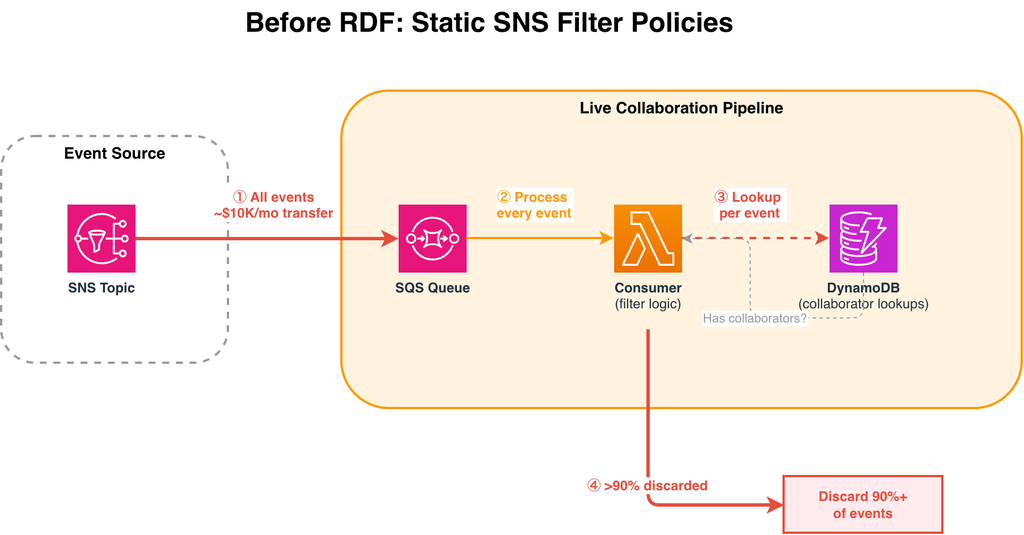
The workaround was brute force: subscribe to all events (hundreds of thousands per second), pull them into an SQS queue, and use compute to check each event against Amazon DynamoDB to determine whether the sheet had active collaborators. Over 90% of events were discarded after this lookup.
Figure 1: Before RDF — all events flow through SNS to SQS, with per-event DynamoDB lookups to filter. Over 90% of events are discarded after processing.
Every event published to the SNS topic is delivered to the SQS queue, regardless of whether any consumer needs it.
The consumer AWS Lambda reads every message from the SQS queue and must evaluate each one individually.
For each event, the consumer queries DynamoDB to check whether the sheet has active collaborators. This per-event lookup adds latency and DynamoDB read costs on the hot path.
After the DynamoDB lookup, over 90% of events are found to have no active collaborators and are discarded.
This approach had three compounding cost and performance problems:
SNS-to-SQS data transfer costs: approximately $10,000 per month to deliver all events to the queue
SQS costs: approximately $30,000 per month to receive, process, and delete the full event volume
DynamoDB costs and latency: per-event lookups to check collaborator status added load to DynamoDB and increased end-to-end data delivery latency
The solution: Real-time Dynamic Filtering with Apache Flink
To solve this, Smartsheet built a system called Real-time Dynamic Filtering (RDF) on Amazon Managed Service for Apache Flink. The core insight was to move the filtering logic into the stream processing layer itself, using Flink’s KeyedCoProcessFunction, a feature that joins and processes multiple streams by a shared key, to maintain dynamic filter policies in Flink state (RocksDB).
How it works
The RDF Flink application reads from two streams:
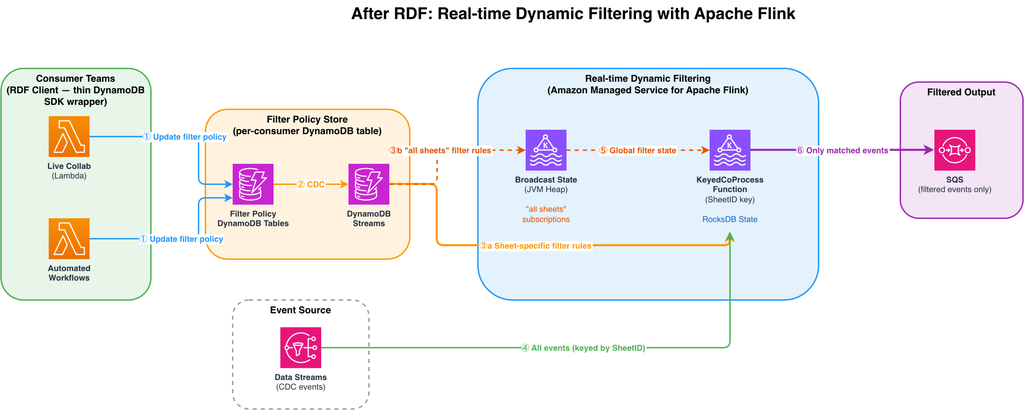
Filter policy stream, sourced from Amazon DynamoDB Streams. When a team calls the RDF client to change their filter policy (for example, “start receiving events for sheet X”), the change is written to a DynamoDB table and propagated through DynamoDB Streams to the Flink application.
Data stream, the stream of sheet events (creates, updates, deletes) that were previously delivered through SNS.
One challenge remained: some consumers need every event, regardless of sheet. When a consumer subscribes to all events, the system needs every parallel Flink task to know about it. The team solved this using Flink’s broadcast state, which replicates a small set of “subscribe to everything” policies across all tasks. Because only a handful of consumers use this mode, the memory overhead stays negligible.
Figure 2: After RDF — consumer teams update filter policies via client libraries. DynamoDB Streams propagates changes to the Flink application, which filters the data stream in real time using keyed state (RocksDB) for specific sheet subscriptions and broadcast state for “all sheets” subscriptions.
When a consumer team wants to start or stop receiving events for a specific sheet, it calls the RDF client, a thin wrapper over the DynamoDB SDK. The filter policy change is written to that consumer’s dedicated DynamoDB table. Each consumer has its own table, providing isolated permissions and preventing noisy neighbor issues.
DynamoDB Streams captures every filter policy change as a change data capture (CDC) record and streams it to the Flink application in real time.
Filter policy records
Filter policy records for specific sheets are routed to the KeyedCoProcessFunction, keyed by SheetID. This makes sure that filter state and event data for the same sheet are co-located in the same Flink parallel task. State is stored in the RocksDB backend, which uses memory when available and spills to disk when necessary, so the system to scale without JVM heap constraints.
Filter policy records where a consumer has called listenToAllEvents() are broadcast to all parallel Flink tasks via Flink’s broadcast state. Because broadcast state lives in JVM heap, it is used exclusively for these “all sheets” records (of which there are very few), keeping the heap footprint small.
The full stream of CDC events flows into the KeyedCoProcessFunction, partitioned by SheetID. Each parallel task receives only the events for the sheets it is responsible for and applies the corresponding filter state to decide whether to forward or drop each event.
The broadcast state (containing “all sheets” subscriptions) is made available to all parallel instances of the KeyedCoProcessFunction, so that consumers subscribed to all events are never filtered out regardless of which task processes their events.
Only events that match an active filter policy are forwarded to the consumer’s SQS queue. The result: sub-second filter policy propagation (p95 ≤1s), elimination of per-event DynamoDB lookups, and over $40,000/month in cost savings.
Critically, because the filter policy state is persisted in Flink’s RocksDB state backend, the application does not need to perform a DynamoDB lookup for every event. Within 1 second of a filter policy change, the Flink application reads the change from the DynamoDB Streams source, updates its internal state, and begins filtering the data stream accordingly.
Results
The impact of RDF was immediate and measurable across multiple dimensions:
Cost reduction
Cost category
Before RDF
After RDF
Monthly savings
SNS → SQS Data Transfer
~$10K/month
Eliminated
~$10K
SQS Event Ingestion
~$30K/month
~$2K
~$28K
DynamoDB Collaborator Lookups
Significant load
Eliminated (state in Flink)
Included in total
AWS Lambda
~$12K/month
~$5K/month
~$7K
Total
~$45K/month
Latency improvement
1.8x improvement in live collaboration data delivery latency. Users see changes from collaborators faster than before.
Filter policy propagation reduced from up to 15 minutes to a p95 of under 1 second
If your architecture follows a similar fan-out pattern where consumers discard a large percentage of events after per-event lookups, you could achieve comparable cost reductions by moving filtering into the stream processing layer. The savings scale with your event volume and the percentage of events currently discarded.
Key design decisions
Several architectural choices were critical to the success of this solution:
Keyed state with selective broadcast: Specific sheet subscriptions are stored in keyed state using the RocksDB state backend. The system scales to a large number of filter policies without JVM heap constraints. Flink’s broadcast state is used only for the small number of “all sheets” subscriptions, where every parallel task needs visibility. Because broadcast state is stored in JVM heap, limiting its use to these few records keeps the heap footprint manageable.
DynamoDB Streams as the filter policy source: Rather than building a custom control plane, the team used DynamoDB Streams to propagate filter policy changes. DynamoDB Streams gave the team durability, ordering guarantees, and a native Flink source connector integration.
RocksDB state backend: Persisting filter state in RocksDB eliminated the need for external lookups on the hot path, keeping per-event processing latency low even as the number of active filter policies grows.
Client library abstraction: Publishing internal Golang and Java clients lowered the adoption barrier. The client is a thin abstraction on top of the DynamoDB SDK. Each consumer has its own dedicated DynamoDB table and corresponding filter stream, which provides two benefits: it allows fine-grained AWS Identity and Access Management (AWS IAM) permissions per client, and it mitigates the noisy neighbor problem by isolating each consumer’s filter policy traffic. Teams don’t need to understand Flink internals. They interact with a simple API to manage their subscriptions.
Next steps
The live collaboration team was the first adopter of RDF, but the architecture was designed as a shared platform. Smartsheet is now expanding RDF to additional internal teams, including workflow automation and notification routing, where similar fan-out patterns exist. The team is also exploring automatic scaling policies to optimize Flink cluster costs during off-peak hours.
Conclusion
Smartsheet Real-time Dynamic Filtering system demonstrates how Amazon Managed Service for Apache Flink can solve problems that go beyond stream processing. By combining Flink’s broadcast state pattern with CoProcessFunction, Smartsheet replaced a costly and latency-bound SNS/SQS fan-out architecture with a sub-second dynamic filtering platform. The result: over $40,000 per month in savings, 1.8x improvement in live collaboration latency, and a reusable platform that multiple teams are now adopting.
If you process high-volume event streams and need to dynamically control which events reach specific consumers, this pattern can help you reduce costs and latency, whether for live collaboration, workflow automation, notification routing, or multi-tenant event delivery.
To learn more about the services used in this post, visit:
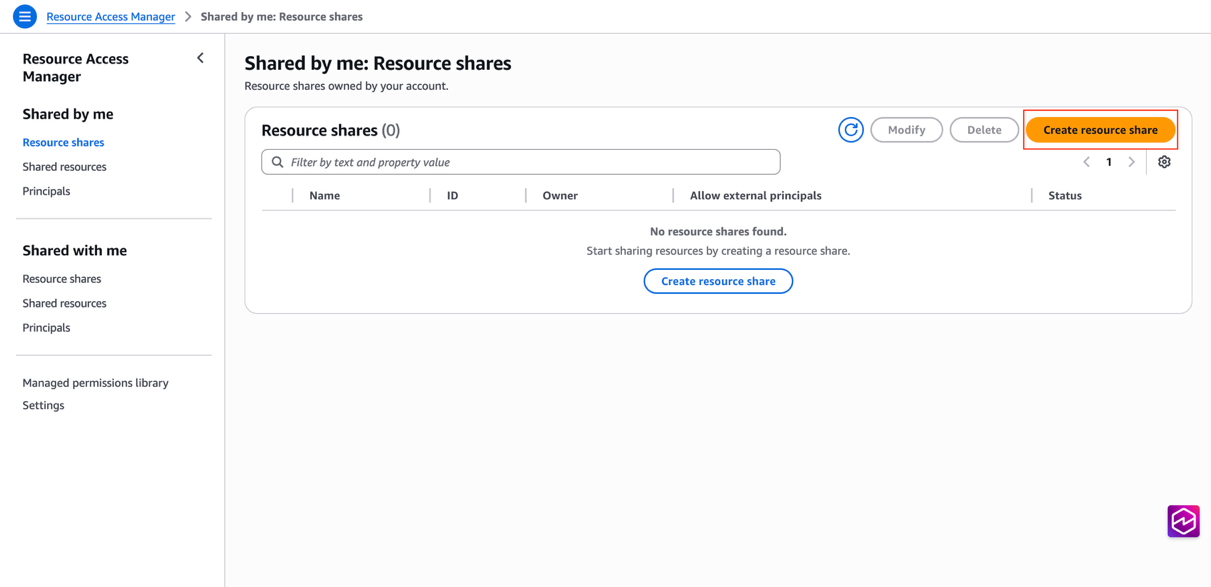
When your data science team reserves GPU instances for a two-week training job but completes it in four days, that capacity has the potential to sit unused while your computer vision team waits another week to start their project. Now you can eliminate this GPU waste and scheduling conflict by sharing Capacity Blocks for ML across your AWS Organization. This scheduling mismatch between teams creates bottlenecks that delay product launches, increase infrastructure costs, and slow your ability to deliver machine learning (ML) powered features to customers. With cross-account sharing for Amazon Elastic Compute Cloud (Amazon EC2) Capacity Blocks for ML, you can now distribute reserved graphics processing unit (GPU) capacity across teams based on actual demand rather than rigid scheduling predictions. This means your computer vision team can use the capacity as soon as the data science team is done.
In this post, we’ll show you how to configure cross-account sharing for Capacity Blocks for ML, set up monitoring for your shared resources, and optimize instance utilization through alerting. By increasing the utilization rates and reducing over-provisioning, you improve your resource efficiency and cost optimization for your organization.
You can reduce idle resources in your ML team’s account by sharing capacity with other teams waiting for GPUs. Additionally, you can maintain Capacity Blocks for ML centrally. This lets you control which teams have access to the capacity and helps you reduce waste and bottlenecks in your organization. Before starting into the tutorial, let’s review how Capacity Blocks for ML and AWS RAM work together.
Overview
Capacity Blocks for ML let you reserve GPU-based accelerated compute instances ahead of time for short duration ML workloads. When you launch instances in Capacity Blocks for ML, Amazon EC2 automatically places the instances in Amazon EC2 UltraClusters, giving you low-latency, petabit scale networking. UltraClusters provide the high performance networking your training workloads require.
You see exactly when GPU capacity is available and schedule your Capacity Blocks for ML to start when it makes sense for your project. You pay upfront for the entire reservation period. This makes Capacity Blocks for ML useful when you need GPUs for days to months. It provides predictable capacity without long-term commitments.
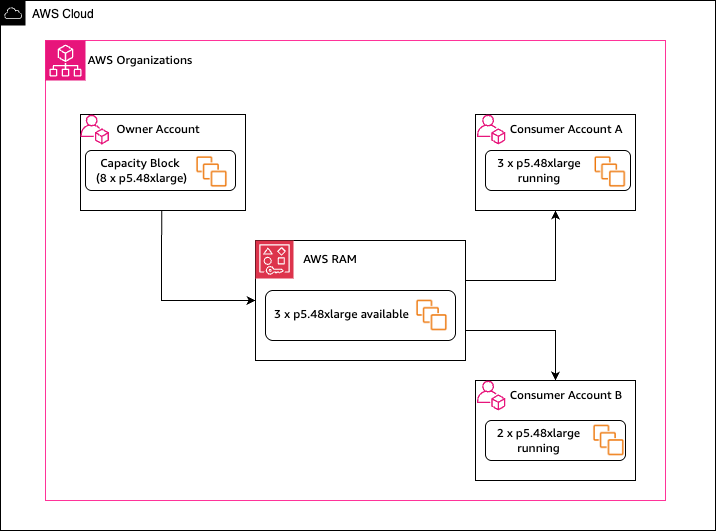
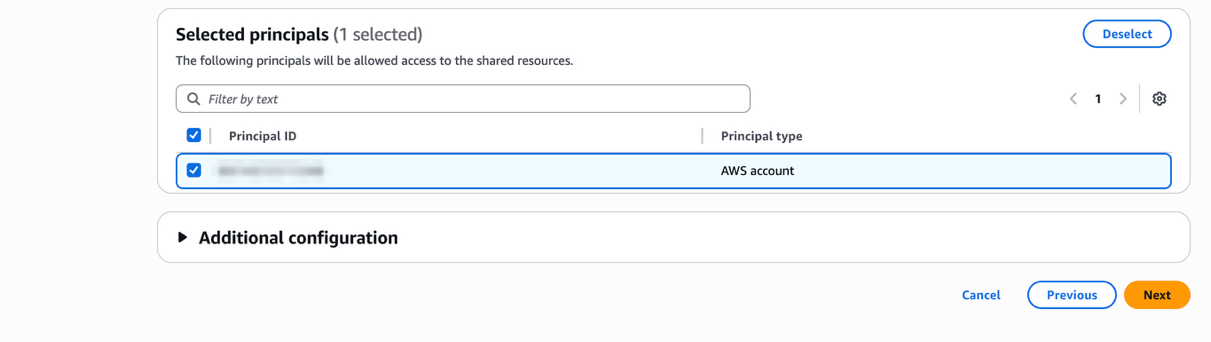
When you purchase Capacity Blocks for ML, you can share it with other accounts in your AWS Organization using AWS Resource Access Manager (AWS RAM). With AWS RAM, you can share AWS resources across accounts within your organization. When you share with other accounts, those accounts become consumer accounts that can launch instances using your capacity. As the owner account, you pay the upfront reservation cost and retain ownership. If you’re launching instances from a consumer account, you are responsible for additional costs such as operating system licensing charges. Capacity Blocks can be shared to multiple accounts simultaneously, with the entire Capacity Block reservation being shared on a first come, first served basis.
Figure 1: Capacity Block sharing using Resource Access Manager.
With the share feature, you benefit from flexible GPU capacity management when your priorities shift, or teams finish work at different times. Now, when your data science team completes experimentation early, your other teams can use that capacity for production training. If priorities shift mid-quarter, you can move capacity where it’s needed most.
In this tutorial, you’ll share a Capacity Block for ML across accounts and then create an alarm to monitor utilization when it drops below a threshold. Before you start, complete the following prerequisites.
Prerequisites
To share Capacity Blocks for ML, you must first find and purchase a Capacity Block. Only standard Capacity Blocks for ML can be shared using AWS RAM. UltraServer Capacity Blocks are not eligible for sharing.
You can share Capacity Blocks only within your AWS Organization. Verify the owner of the Capacity Blocks as well as the consumer(s) are within the same organization. For guidance, see Creating and configuring an organization.
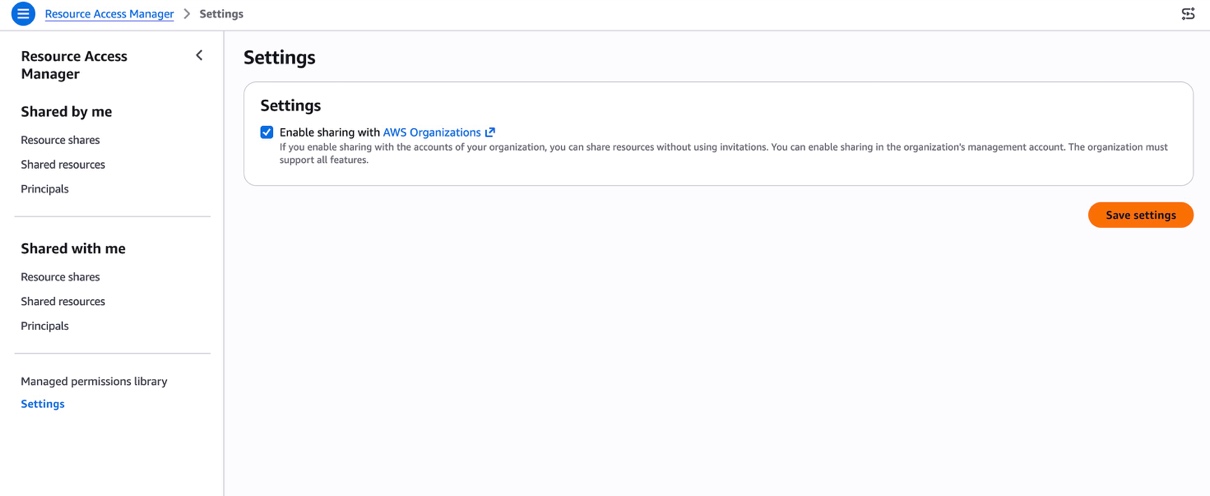
Before sharing Capacity Blocks, you must configure resource sharing with AWS Organizations. Only the management account with the following required AWS Identity and Access Management (IAM) permissions can enable resource sharing within an Organization:
Access and Launch shared Capacity Blocks (console)
After you add the Capacity Block to a resource share, your consumer accounts automatically gain access when you share the Capacity Block within the same AWS Organization.
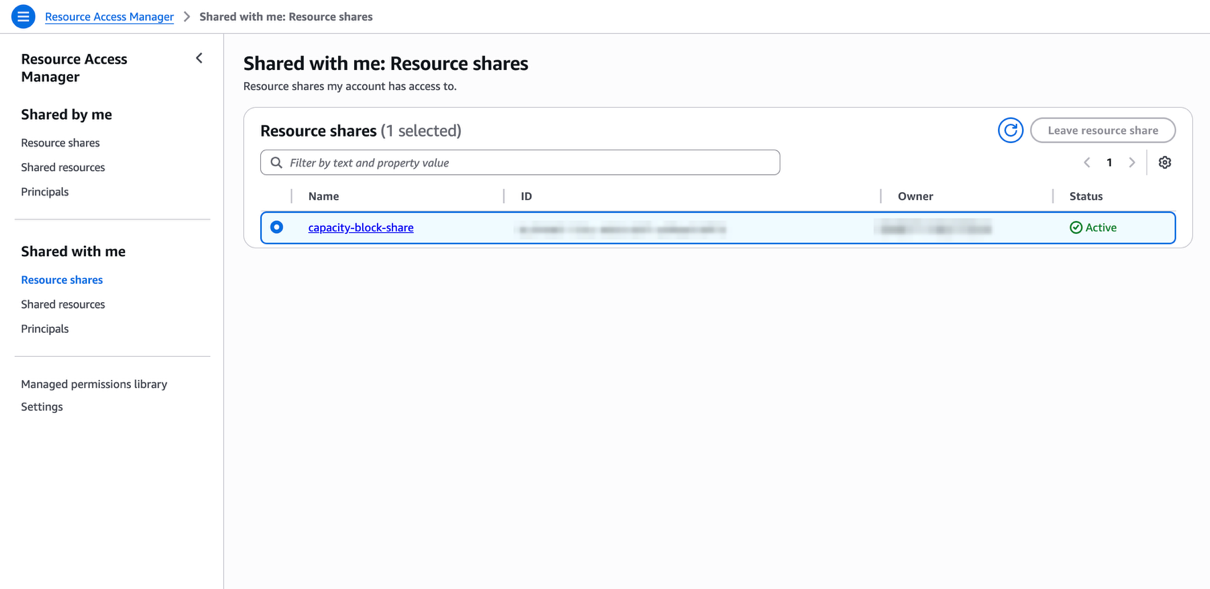
In the left navigation pane, choose Shared with me, Resource shares. Verify the Resource share is Active.Figure 6: In your consumer account, verify the resource share
Navigate to the Amazon EC2 console. In the left navigation pane, choose Capacity Reservations.
Confirm the shared Capacity Block appears and is in Active or Scheduled state. Because sharing is asynchronous, the Capacity Block may take a few moments to appear even after the resource share shows Active.
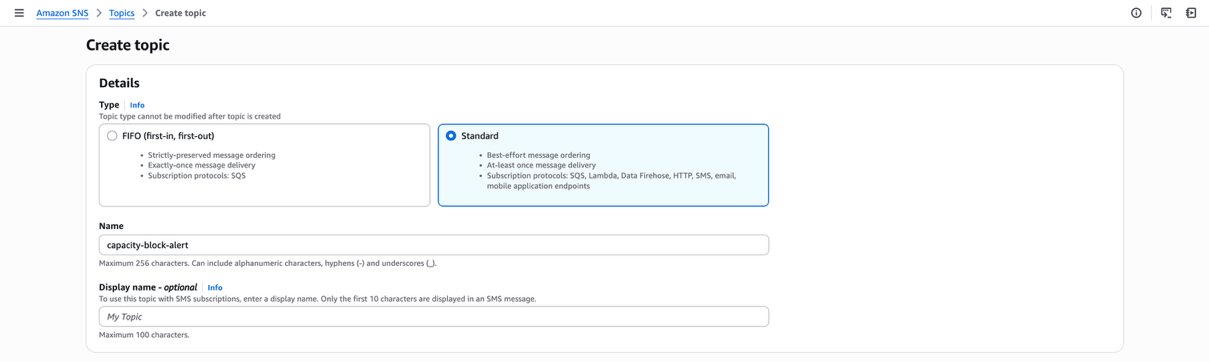
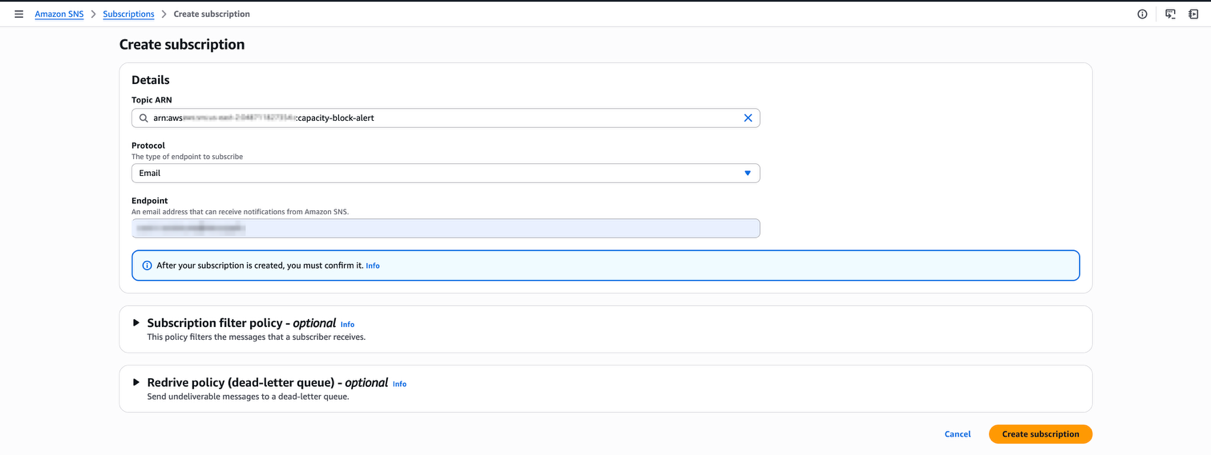
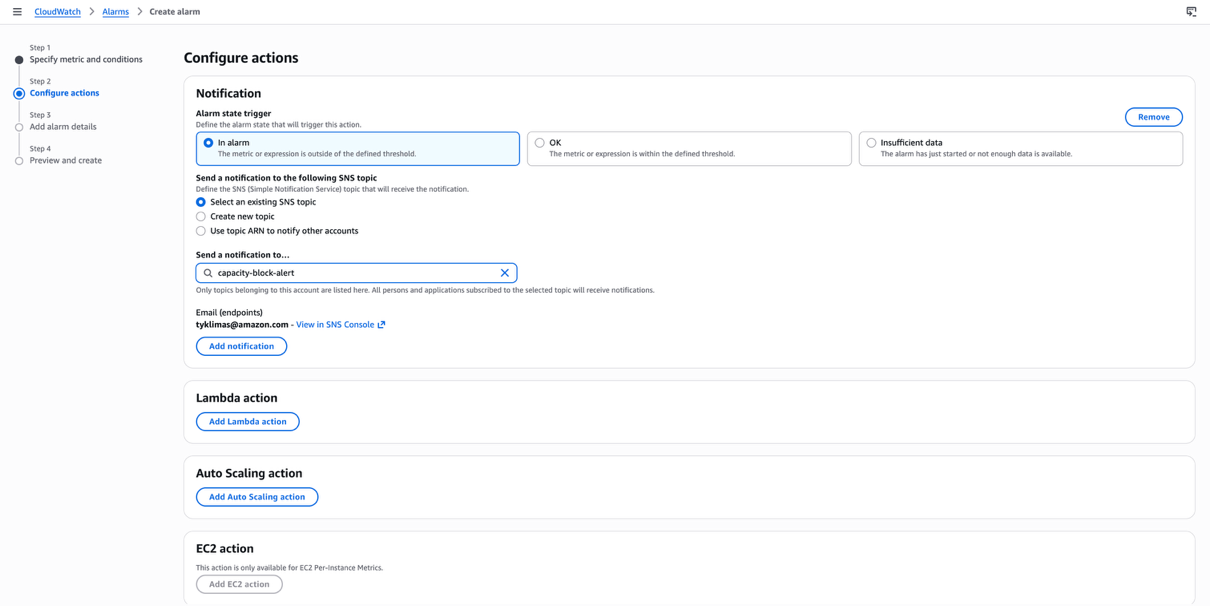
You can create Amazon CloudWatch alarms to proactively identify low utilization of your Capacity Block. This helps you to improve the usage of your capacity reservation. This section shows you how to create an Amazon Simple Notification Service (Amazon SNS) email notification when the number of running instances drops below a certain threshold.
In addition to monitoring usage, AWS CloudTrail logs capture API events related to your Capacity Block, including the CapacityReservationId. As the owner, you can see which accounts are consuming instances and when.
As the owner of the Capacity Block, you retain the ability to modify the resource share. However, owners cannot modify instances that consumers launch into Capacity Blocks they have shared. This section outlines how to clean up your previous work.
In this post, we showed you how to share Capacity Blocks for ML across your AWS Organization using AWS RAM. We covered configuring the AWS RAM integration with Organizations, creating resource shares, and accessing shared Capacity Blocks for ML from consumer accounts. Finally, we showed you how to monitor and alert on low instance utilization.
By sharing Capacity Blocks across your organization, you can reduce idle GPU capacity, eliminate scheduling bottlenecks between teams, and maximize the return on your reserved compute investment. To take this further, consider building dashboards in Amazon CloudWatch to track utilization trends across multiple Capacity Blocks.
Освен като спортен, туристически, културен и обществен феномен, българското домакинство на началото на колоездачното състезание Обиколката на Италия 2026 беше вълнуващо и от етимологична гледна точка. Заедно с големите емоции, които донесе в България, la Grande Partenza, или „Големият старт“, на т.нар. Corsa Rosa, или „Розовото състезание“¹, вкара и цяла шепа италиански думи в обращение както през официалните медийни съобщения, така и в ежедневния език на хората. Безсъмнено най-любопитната сред тях, която през последните седмици беше в устата на стотици хиляди българи, е думата giro. А на мен и вас тя предоставя възможност за един етимологичен тур от изток на запад и обратно, правейки кулинарни, исторически, научни и финансови отбивки.
Необяснимо за самата мен, когато преди няколко седмици за първи път чух словосъчетанието Giro d’Italia, рязко усетих чувство на глад, но не за (колоездачни) зрелища², а за хляб, и то съвсем буквално – за предпочитане под формата на питка, обвита около свинско месо, пържени картофи, домати и дзадзики. Разбира се, веднага побързах да отхвърля асоциацията, която мозъкът ми направи между италианското „джиро“ и гръцкия „гирос“ (въпреки че ми се стори доста забавна) като несъстоятелна и неблагонадеждна.
Оказва се обаче, че макар между италианската колоездачна обиколка и гръцкото ястие да няма концептуална връзка, те са съвсем директно свързани по семантична и етимологична линия. Всъщност, ако трябва да сме точни (и буквални), връзката не е линейна, а по-скоро кръгова. Защото както италианската дума giro (през латинската gȳrus), така и гръцката дума γύρος (където г-то се произнася по-скоро като й) произлизат от старогръцкото понятие γῦρος, тоест „кръг“. Ето как терминът giro се оказва изключително подходящ за обиколка, която се провежда на колела, а и неслучайно гръцкото наименование на велосипедното състезание е Γύρος της Ιταλίας (Gýros tis Italías).
Още по-изненадващ е фактът, че извън конкретния колоездачен и кулинарен контекст, в който двете думи са навлезли в българския, речниковите им дефиниции на практика са идентични: освен „кръг“, както giro, така и γύρος могат да бъдат преведени като ‘обиколка, тур, разходка’ и тем подобни.
Тези значения, разбира се, значително предхождат появата и на велосипедното състезание, и на апетитното ястие, които датират едва от началото на XX век.
Giro d’Italia се провежда за първи път през 1909 г., а гиросът навлиза в Гърция в началото на 20-те години, внесен от гръцките бежанци от Анадола
след Гръцко-турската война и последвалия обмен на население. Първоначално гиросът се нарича ντονέρ (ntonér) – наименование, взето от оригиналното турско название döner kebap, с което дюнерът е известен и в България и което произлиза от dönmek (‘въртя се, завивам, връщам се’) заради начина на печене на месото посредством въртящ се вертикален шиш³.
Впоследствие, в средата на миналия век, поради политическото напрежение между Гърция и Турция и като резултат от инициативата турцизмите да се премахнат от гръцкия език, турската заемка се подменя с гръцка калка, а именно γύρος. Заедно с това рецептата също се „погърчва“ и започва да включва свинско месо и дзадзики, докато ястието от тясно свързано с бежанските общности се превръща в национална кулинарна класика⁴.
През 1952 г., допълвайки концентричните кръгове с думи, произлизащи от най-вътрешния старогръцки – γῦρος (gûros), френският учен Леон Фуко (същият, който изобретява и дава името си на махалото) представя конструиран от него уред за измерване и поддържане на ориентацията. Комбинирайки вече познатия ни „кръг“ със старогръцката дума σκοπός (skopós, ‘наблюдател’), той нарича изобретението си gyroscope⁵.
Впоследствие, както обикновено става с научните термини, наименованието се разпространява на други езици, а произношението на началния му звук претърпява промени, подобно на г-то в името, което отпразнувахме на 6 май, само два дни преди началото на Джирото: Георги, Джорджо, Жорж, Йоргос и т.н. На български наименованието на инструмента запазва френското си произношение – „жироскоп“. На гръцки той се нарича γυροσκόπιο(gyroskópio), а на турски, освен като jiroskop, уредът е известен и като düzdöner (düz означава ‘плосък, равен, прав’, което прави думата донякъде оксиморонна).
Но да направим кръг обратно към италианското giro. Оказва се, че думата е навлязла в българския, движейки се от запад на изток, още в средата на XIX век –
доста преди близо 200-та състезатели в Giro d’Italia да щурмуват с велосипедите си територията на България, движейки се в обратната посока. Според Българския етимологичен речник думата „джиро“, определена като „остаряла“ и дефинирана като ‘паричен оборот; надпис върху полица за прехвърляне на сума’, е заета от италианския исъществува в българския от 1850 г. От нея произлиза и глаголът „джиросвам“, който, освен със значението ‘прехвърлям ценни книжа на друго лице чрез подпис’, според някои речници се използва и преносно – като ‘прехвърлям работа, отговорност и пр. на друго лице’ или ‘отървавам се, отпращам, премятам, препращам’.
А за да бъде кръгът наистина пълен, няма как да не отбележим още нещо. Италианското „джиро“, което наред с общите значения, изброени в началото на този текст, може да се отнася и за „оборот“ на двигател, е навлязло (обратно) – с подобаващи промени в произношението и транскрипцията – и в гръцкия, където думата τζίρος (tzíros) означава „оборот“ във финансовия смисъл на думата.
И понеже кръгът има свойството да е безкраен, ние също бихме могли да продължим (поне още малко): според речника една от турските думи за „оборот“ е dönme, която пък преведена обратно на български означава ‘въртене, конверсия, ротация; отстъпник, ренегат’. Думата е навлязла в българския и директно като „дьонме“, тоест ‘немюсюлманин, приел исляма’. „Дьонме“ се нарича и сектата, която изповядва криптоюдаизъм и е основана през втората половина на XVII век в Солун. Но тази история ще оставим за друг път.
За разлика от кръга, който продължава безкрай, този текст все пак трябва да има финал. Може обаче да намерим някаква утеха в кръговата му композиция. Както и във факта, че купата, която се връчва на победителя на Giro d’Italia, се нарича не как да е, а Trofeo Senza Fine, или „Безкрайният трофей“.
1 Прозвището Corsa Rosa, или „Розовото състезание“, с което е известно Giro d’Italia, произлиза от практиката лидерът в генералното класиране да носи розова фланелка – като препратка към спортния вестник La Gazzetta dello Sport, който организира състезанието и традиционно се печата върху розова хартия. Онлайн изданието на вестника също излиза на розов фон.
2 Фразата „хляб и зрелища“ се заражда в Древен Рим, а латинският ѝ оригинал panem et circenses буквално се превежда като „хляб и циркове“, като cirensis всъщност е прилагателно, описващо това, което се случва на арената, тоест circus, откъдето идва и думата „цирк“. Интересно е, че латинската дума circus, подобно на gȳrus, също произлиза от старогръцка дума за кръг, в случая κίρκος (kírkos). Макар и значенията им отчасти да се припокриват, двете думи не са синоними: докато κίρκος е свързанa с физически обект или място с формата на кръг, γῦρος се използва по-скоро във връзка с кръгообразно движение. Тяхна близка роднина е старогръцката дума κύκλος (kúklos), която също означава „кръг“ и се намира в корена на думата за „велосипед“ на много езици, заели я от френския първоизточник, bicyclette, а в българския присъства посредством „мотоциклет“. (Българската дума всъщност също е заета от френското vélocipède, вече остарял термин, който произлиза от латинските vēlōx (‘бърз’) и pēs (‘крак’).)
3 Смята се, че вертикално печеният döner kebab се ражда през XIX век в град Бурса, в тогавашната Османска империя. Впоследствие освен на северозапад, към Гърция и към Европа (der Döner, внесен от турски емигранти, които добавят пържени картофи, става хит в Германия през 70-те години на миналия век, a във Великобритания е известен като kebab), ястието мигрира и на югоизток, към арабския свят, където е известно като شاورما (shāwarmā). Наименованието е заето от турски – думата çevirme (oт çevir- ‘въртя се’) е навлязла и в българския като „чеверме“. Както знаем, тя има общ корен с турската дума за „превод“ – çeviri.
4 В някои райони на Гърция, например в Солун, наименованието γύρος се отнася само и конкретно за месото, печено на вертикален шиш, докато това, което ние разбираме под „гирос“, се нарича σάντουϊτς (sántouïts), тоест „сандвич“. (Тази дума също заслужава отделен текст.)
5 Жироскопът продължава да се използва изключително активно и до днес както в авиацията и корабоплаването, така и в дронове, роботи, в нашите смартфони и таблети. Имайки предвид темата на този текст обаче, сме длъжни да отбележим, че докато устройството подпомага стабилността на превозни средства като кораби, самолети, а даже и мотоциклети, в научни изследвания се установява, че жироскопичните сили, макар и да участват при карането без ръце, не играят важна роля в стабилността на велосипеда, където най-важният фактор – както видяхме и по време на Джирото – е трасето.
В рубриката „От дума на дума“ Екатерина Петрова търси актуални, интересни или новопоявили се думи от нашето ежедневие и проследява често изненадващия им произход, развитието на значенията им във времето и взаимовръзките им с близки и далечни езици.
The kernel’s swap subsystem is charged with managing anonymous pages in
secondary storage when those pages are (hopefully) not being used and the
memory they occupy is needed elsewhere. This long-unloved subsystem has
seen a resurgence of developer interest in recent times, so it is not
surprising that it was the topic of three separate sessions in the
memory-management track at the
2026 Linux Storage,
Filesystem, Memory Management, and BPF Summit. Two of those sessions
were concerned with improving the performance and maintainability of the
swap code, while one (shared with the storage track) was about how swapping
could be friendlier to solid-state storage devices.
We are excited to announce CDK Mixins, a feature of the AWS Cloud Development Kit (CDK) that fundamentally changes how you compose and reuse infrastructure abstractions. In this post, you will learn how to use CDK Mixins to apply sophisticated features to any construct – whether L1, L2, or custom – without being locked into specific implementations.
Background
The AWS Cloud Development Kit (CDK) is an open-source software development framework for defining cloud infrastructure in code and provisioning it through AWS CloudFormation. It contains pre-written, modular, and reusable cloud components known as constructs. Constructs are the basic building blocks representing one or more AWS CloudFormation resources and their configuration.
Traditionally, we organize CDK constructs into three levels. L1 constructs map directly to CloudFormation resources. L2 constructs offer higher-level abstractions with convenience methods, security defaults, and helper functions. L3 constructs (also known as patterns) combine multiple resources to solve specific use cases. However, this architecture creates a fundamental trade-off: you must choose between immediate access to new AWS features (L1) and sophisticated abstractions (L2/L3). Teams often need to customize L2 constructs, rebuilding entire construct libraries to meet their specific requirements.
CDK Mixins solve this problem by decoupling abstractions from construct implementations. Instead of bundling all features into monolithic L2 constructs, Mixins allow you to compose exactly the capabilities you need, apply them to any construct type, and maintain full access to underlying CloudFormation properties.
What are CDK Mixins?
CDK Mixins let you compose reusable abstractions and apply them to constructs after creation. You mix and match modular capabilities to build exactly the infrastructure you need. Unlike traditional L2 constructs that bundle all features together, Mixins give you fine-grained control over which abstractions apply.
Key benefits include:
Universal Compatibility: Apply the same abstractions to L1 constructs, L2 constructs, or custom constructs
Composable Design: Mix and match features without inheriting unwanted behaviors
Cross-Service Abstractions: Create custom mixins that work across different AWS services
Day-One Coverage: Access new AWS features immediately while keeping existing L2 or L3 constructs
Type Safety: Maintain compile-time guarantees and IDE support
Mixins and Aspects
CDK Aspects are a way to apply an operation to all constructs in a given scope, commonly used for validation, compliance, and tagging. Mixins and Aspects are complementary. Mixins apply features immediately to specific constructs, while Aspects enforce rules broadly across a scope during synthesis. A common pattern is to use Mixins to configure resources and Aspects to validate that the configuration is correct.
Using CDK Mixins
CDK Mixins ship with aws-cdk-lib, and you access service-specific mixins through the same imports you already use. They work across L1, L2, and L3 constructs:
import * as cdk from 'aws-cdk-lib/core';
import * as s3 from 'aws-cdk-lib/aws-s3';
import { CfnBucketPropsMixin } from '@aws-cdk/cfn-property-mixins/aws-s3';

// CDK Mixins can be used with L1s
new s3.CfnBucket(stack, "MixinsL1DemoBucket")
  // Use the fluent .with() syntax (available in JavaScript/TypeScript)
  // .with() silently skips unsupported constructs
  .with(new s3.mixins.BucketVersioning());

// ... or with L2s
new s3.Bucket(stack, "MixinsL2DemoBucket")
  // Cfn Property Mixins provide type-safe fallbacks for L2s
  // and configuration after initial creation
  .with(new CfnBucketPropsMixin({
    objectLockEnabled: true,
    objectLockConfiguration: {
      objectLockEnabled: "Enabled",
      rule: {
        defaultRetention: {
          mode: "COMPLIANCE",
          days: 30,
        },
      },
    },
  }));
You can also use Mixins.of() to apply Mixins in other languages or with more control over which constructs receive the mixin:
// Use Mixins.of() to apply Mixins in other languages
// This also gives you more options to apply only to certain constructs
cdk.Mixins.of(stack, cdk.ConstructSelector.byId('MixinsL1DemoBucket'))
  .apply(new s3.mixins.BucketAutoDeleteObjects());
Apply mixins at scale to entire construct trees or specific resource types:
// Apply your Mixins to the whole app
cdk.Mixins.of(app).apply(new MyDataRecovery());
// ... or only to some constructs
cdk.Mixins.of(app, cdk.ConstructSelector.resourcesOfType(s3.CfnBucket.CFN_RESOURCE_TYPE_NAME)).apply(new MyDataRecovery());
Creating Custom Mixins
Creating your own Mixins is straightforward; they are simple classes extending cdk.Mixin and implementing the IMixin interface. The supports() method determines which constructs the mixin can apply to, and applyTo() modifies the construct in place. Here’s a custom mixin that enables data recovery features across both Amazon Simple Storage Service (Amazon S3) buckets and Amazon DynamoDB tables:
// It's easy to develop your own Mixins
class MyDataRecovery extends cdk.Mixin implements IMixin {
  public supports(construct: any): construct is s3.CfnBucket | dynamodb.CfnTable {
    // Mixins can be cross-service and support different resources at once
    return s3.CfnBucket.isCfnBucket(construct) || dynamodb.CfnTable.isCfnTable(construct);
  }

  // applyTo modifies the construct in place (returns void)
  public applyTo(construct: IConstruct): void {
    if (s3.CfnBucket.isCfnBucket(construct)) {
      construct.versioningConfiguration = {
        status: 'Enabled',
      };
    }

    if (dynamodb.CfnTable.isCfnTable(construct)) {
      construct.pointInTimeRecoverySpecification = {
        pointInTimeRecoveryEnabled: true,
      };
    }
  }
}
Once defined, you can apply your custom mixin to resources:
// ... and to use them:
new s3.Bucket(stack, 'AcmeBucket');
new dynamodb.TableV2(stack, 'AcmeTable', {
  partitionKey: { name: 'id', type: dynamodb.AttributeType.STRING },
});

// Apply your Mixins to the whole app
cdk.Mixins.of(app).apply(new MyDataRecovery());
// ... or only to some constructs
cdk.Mixins.of(app, cdk.ConstructSelector.resourcesOfType(s3.CfnBucket.CFN_RESOURCE_TYPE_NAME)).apply(new MyDataRecovery());
This pattern enables organizations to create reusable abstractions that work across any construct type, ensuring consistent security and compliance policies throughout their infrastructure.
Mixin Behavior Control
Control how to apply Mixins with three distinct modes: graceful application, requireAll, and requireAny. The report getter lets you inspect which constructs were successfully modified and add custom assertions:
// Graceful: apply() silently skips unsupported constructs
const logGroup = new logs.CfnLogGroup(stack, 'LogGroup');
cdk.Mixins.of(logGroup).apply(new s3.mixins.BucketAutoDeleteObjects());

// requireAll: Throws if ANY selected construct is not supported by the mixin
cdk.Mixins.of(logGroup).apply(new s3.mixins.BucketAutoDeleteObjects()).requireAll();

// requireAny: Throws if NO selected construct is supported by the mixin
cdk.Mixins.of(stack).apply(new s3.mixins.BucketVersioning()).requireAny();
Use the report getter to inspect application results and the selectedConstructs getter to see which constructs matched the selector:
const applicator = cdk.Mixins.of(app, cdk.ConstructSelector.resourcesOfType(s3.CfnBucket.CFN_RESOURCE_TYPE_NAME));
const result = applicator.apply(new s3.mixins.BucketVersioning());

// See which constructs were matched by the selector
console.table(applicator.selectedConstructs.map(c => c.node.path));

// Inspect which constructs were successfully modified, grouped by construct
console.table(result.report.map(r => ({ construct: r.construct.node.path, mixin: util.inspect(r.mixin) })));
This flexibility allows you to choose the right behavior for your use case, whether you want to apply Mixins opportunistically, enforce that at least one construct matches, or require that every selected construct is supported.
ECS ClusterSettings mixin
The ClusterSettings mixin enables you to apply Amazon ECS cluster settings like enhanced Container Insights to both L1 and L2 clusters. It handles array merging intelligently, updating existing settings by name or appending new ones:
import * as ecs from 'aws-cdk-lib/aws-ecs';
import * as ec2 from 'aws-cdk-lib/aws-ec2';

// Works with L1 constructs
new ecs.CfnCluster(stack, 'L1Cluster', { clusterName: 'my-cluster' })
  .with(new ecs.mixins.ClusterSettings([
    { name: 'containerInsights', value: 'enhanced' },
  ]));

// Works with L2 constructs too
new ecs.Cluster(stack, 'L2Cluster', { vpc, clusterName: 'my-cluster' })
  .with(new ecs.mixins.ClusterSettings([
    { name: 'containerInsights', value: 'enhanced' },
  ]));
S3 mixins: PublicAccessBlock and BucketPolicyStatements
New S3 mixins provide fine-grained controls. The PublicAccessBlockMixin configures public access settings, and the BucketPolicyStatements lets you add bucket policy statements declaratively:
import * as s3 from 'aws-cdk-lib/aws-s3';

// Block all public access on S3 buckets
new s3.CfnBucket(stack, 'SecureBucket')
  .with(new s3.mixins.BucketBlockPublicAccess());

// Apply public access block across all S3 buckets in the app
cdk.Mixins.of(app, cdk.ConstructSelector.resourcesOfType(s3.CfnBucket.CFN_RESOURCE_TYPE_NAME))
  .apply(new s3.mixins.BucketBlockPublicAccess())
  .requireAll();
Vended logs and log delivery
Setting up vended log delivery in CloudFormation typically requires coordinating multiple resources – AWS::Logs::DeliverySource, AWS::Logs::DeliveryDestination, and AWS::Logs::Delivery to connect them – along with the correct IAM permissions for each destination type. You must repeat this boilerplate for every resource you want to deliver logs from, and it varies by service.
CDK Mixins collapse this complexity into a single .with() call. Because Mixins decouple the log delivery abstraction from any specific construct, the same pattern works across all 47 supported AWS resources – whether you’re using L1 or L2 constructs. While still in preview, this is one of the most compelling examples of why Mixins matter: you get a sophisticated, cross-service abstraction that would traditionally require dedicated L2 construct support for each of those 47 resources.
// NOTE: Vended log delivery mixins are still in @aws-cdk/mixins-preview
import * as wafv2Mixins from '@aws-cdk/mixins-preview/aws-wafv2/mixins';

// Set up vended log delivery to an S3 bucket
const bucket = new s3.Bucket(stack, 'LogBucket');
new wafv2.CfnWebACL(stack, 'WebAcl', { /* ... */ })
  .with(new wafv2Mixins.CfnWebACLAccessLogs().toS3(bucket));

// Same pattern, different destination - works identically
const logGroup = new logs.LogGroup(stack, 'LogGroup');
new wafv2.CfnWebACL(stack, 'WebAcl2', { /* ... */ })
  .with(new wafv2Mixins.CfnWebACLAccessLogs().toLogGroup(logGroup));
Without Mixins, adding vended log delivery to an L1 construct would mean either waiting for L2 support or manually wiring up the three CloudFormation resources and permissions yourself. Mixins let you bring this L2-quality abstraction to any construct immediately.
For cross-account centralized logging, the toDestination() method sends logs to a pre-created delivery destination, so you can aggregate logs in a shared account without granting direct access to the destination resource:
CDK Mixins core functionality – including cdk.Mixins, cdk.ConstructSelector, and the .with() syntax – is included in aws-cdk-lib. You access service mixins through standard service imports (e.g. s3.mixins, ecs.mixins). CloudFormation property mixins for type-safe L1 property overrides come from the separate @aws-cdk/cfn-property-mixins package.
CDK Mixins represent a fundamental shift in how we think about infrastructure abstractions. By decoupling capabilities from construct implementations, Mixins give you the freedom to compose exactly the infrastructure you need whether you are using L1 constructs for access to new CloudFormation resources, L2 constructs for convenience, or custom constructs for enterprise requirements.
Since the initial developer preview, the ecosystem has grown rapidly: log delivery mixins for 47 resources, EventBridge event pattern helpers for 26 services, ECS cluster settings, S3 security mixins, and resource policy traits that bring L2-style permissions to L1 constructs. We refined the API with requireAll/requireAny for precise behavior control and application reporting.
We are excited to see what the community builds with CDK Mixins. Share your feedback, create custom Mixins, and help shape the future of infrastructure as code with AWS CDK.
Engineering teams build internal command-line interface (CLI) tools because repetitive operational tasks such as generating reports, auditing infrastructure, and checking service health are faster and more reliable when automated behind a consistent interface. A well-built CLI replaces ad-hoc scripts with structured commands, standardized error handling, and composable workflows that any team member can run. However, building these tools follows a predictable development lifecycle. The developer sets up a package, writes commands, handles errors, and ships it, then spends the next six months as its sole maintainer. Meanwhile, requests for new commands, custom report formats, and one-off integrations pile up as other teams across the organization discover the tool is useful for their workflows too. Frameworks like Click and Typer reduce the friction, but every new command still needs to be written, tested, and deployed manually.
Tools that generate their own capabilities on demand offer a different approach. Instead of writing each command manually, users can describe what is needed in natural language, and the tool writes the code, loads it, and makes it available at runtime without requiring a restart or redeployment. This is called meta-tooling, a repeatable pattern for giving applications the ability to create their own tools dynamically. For teams that maintain growing collections of internal utilities, this eliminates the bottleneck of having a single developer write every new feature.
In this post, we will walk through one implementation of this pattern, a CLI generator called CLI Creator. CLI Creator combines three technologies into a mechanism that organizations can adapt for their own use cases:
Amazon Bedrock, a fully managed service for building generative AI applications with foundation models, with Anthropic’s Claude Opus 4.6 for AI-powered code generation.
Strands Agents SDK, an open-source Python framework for building AI agents with tool use, for dynamic tool creation, loading, and execution at runtime.
Model Context Protocol (MCP), an open standard for connecting AI applications to external data sources and tools, for automatically discovering API servers that give generated tools additional knowledge.
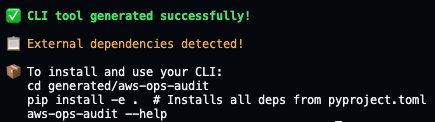
The result is a development workflow where new CLI capabilities go from request to working command in minutes instead of days, without manual coding. By the end of this post, a single natural language prompt will have produced a complete, installable CLI. That CLI can extend itself with new tools, refine them iteratively, and discover relevant MCP servers through an interactive selection workflow.
II. Solution Overview
The Challenge
As an example, consider a platform engineering team that produces weekly operations reports for leadership. Every Monday morning, stakeholders expect a summary of their AWS footprint, including which Amazon DynamoDB tables are running hot, which Amazon Simple Storage Service (Amazon S3) buckets are growing fastest, and who made significant infrastructure changes last week. The AWS CLI can list tables and buckets, but it cannot produce these reports.
Each report is a multi-step workflow that involves calling several APIs, joining the data, computing derived metrics like estimated monthly cost or growth rate, and formatting the output for a specific audience. The team ends up writing Python scripts for each report, and every new report request means another script by a developer.These are each their own small project, often requiring a hundred lines of Python to pull multiple APIs, compute derived metrics, and format output before you even think about error handling. Requirements shift weekly, so each change means modifying source code, testing, and redeploying. The tooling never converges; the team ends up with a folder of disconnected scripts, each with its own argument parsing, error handling, and output formatting. Any team that builds small, purpose-built utilities faces the same friction, and operations reporting is the example we use to illustrate the meta-tooling pattern.
The Solution
Prerequisites
To follow along with this post, you will need:
Python 3.12 or later
An AWS account with Amazon Bedrock access enabled for Anthropic Claude models in us-west-2
AWS credentials configured locally (via `aws configure` or environment variables)
Git installed (for tool version tracking)
The source code is available on GitHub. Installation instructions are in the repository README.
Walkthrough
Instead of writing report scripts manually, organizations describe what they need in natural language.
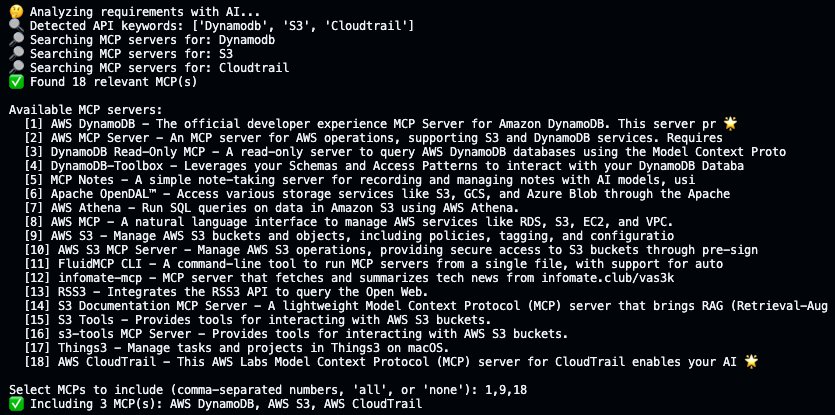
MCP servers are discovered automatically, wherein the system detects keywords like “DynamoDB”, “S3”, and “CloudTrail” in the description, searches the MCP registry for relevant API servers, and presents an interactive selection prompt for choosing which servers to include.
Once the user confirms, the system generates complete Python code for each command. These are not stubs or placeholders that users may typically see within generated code, but working implementations with validated AWS SDK for Python (Boto3) calls, error handling, and type hints.
Finally, the output is packaged as an installable Python project with a pyproject.toml file and entry points configured.
Most importantly, the generated CLI includes a tool command group that enables self-extension at runtime. After installation, users can ask the CLI to create entirely new reporting tools and iteratively refine them without touching source code. This is the repeatable part of the pattern because any generated tool inherits the ability to extend itself. This mechanism is built into every generated CLI, so each one is immediately capable of growing beyond its original scope.
III. Technical Implementation
Strands Agents SDK Integration
The Strands Agents SDK is the backbone of the meta-tooling pattern. It provides three features that make self-extending tools possible, and these features are not specific to CLI generation. Any Python application can use them to dynamically create and manage capabilities at runtime.
The @tool Decorator
When a user asks a generated CLI to create a new tool, Claude Opus 4.6 on Amazon Bedrock produces Python code that uses the Strands @tool decorator. This decorator registers the function with Strands’ tool system, making it immediately discoverable and executable:
from strands import tool

@tool
def list_s3_buckets_with_costs() -> List[Dict[str, Any]]:
The @tool decorator registers the function’s signature, type hints, and docstring as a tool specification that the Strands Agent can reason about and invoke.
Runtime Tool Loading
The Strands Agents SDK includes a tool loading system that can discover and import @tool-decorated functions from Python files at runtime. Tools do not need to be registered at application startup. They can be created, saved to a directory, and made available to the agent dynamically.In our implementation, generated tools are saved as standalone Python files in a directory called `tools/`. Each time a CLI command runs, the application scans this directory, loads any @tool-decorated functions it finds, and adds them to the agent’s tool collection without requiring a restart.The self-extending pattern works because of this scan-on-invocation approach. A user can create a tool, execute it, decide it needs changes, update it, and execute again without any rebuild or reinstall step since each CLI invocation discovers and loads whatever tools exist on disk.
Agent Orchestration with BedrockModel
The Strands Agent class ties everything together. It connects to Amazon Bedrock via BedrockModel and manages a collection of tools:
from strands import Agent
from strands.models import BedrockModel

agent = Agent(
    model=BedrockModel(
        model_id=""
    ),
    tools=[shell_tool, editor_tool] + loaded_tools,
    system_prompt="You are a tool creation assistant..."
)
When the agent receives a tool creation request, it calls Amazon Bedrock to generate the implementation and saves it as a Python file in the tools/ directory. The next CLI command automatically discovers and loads the new tool.
Amazon Bedrock Integration
CLI Creator connects to Anthropic’s Claude through Amazon Bedrock’s cross-region inference profile. Amazon Bedrock serves two distinct roles in the system.
Role 1: CLI Requirements Analysis with Structured Output
When you run cli-creator create, the first step is analyzing the natural language description and extracting a structured specification. Instead of parsing raw text from the model, we use the Strands Agents SDK’s structured output feature with Pydantic models to guarantee the response conforms to our schema:
from pydantic import BaseModel, Field
from strands import Agent
from strands.models import BedrockModel

class CommandSpec(BaseModel):
    name: str = Field(description="Command name in kebab-case")
    description: str = Field(description="What this command does")
    arguments: Optional[List[str]] = Field(default_factory=list)
    options: Optional[List[CommandOption]] = Field(default_factory=list)

class CLIRequirements(BaseModel):
    cli_name: str = Field(description="CLI name in kebab-case")
    description: str = Field(description="One-line description")
    commands: List[CommandSpec] = Field(description="Commands to generate")
    dependencies: List[str] = Field(default_factory=list)

# Create agent and invoke with structured output
agent = Agent(
    model=BedrockModel(model_id="us.anthropic.claude-opus-4-6-v1"),
    system_prompt="You are an expert CLI designer..."
)

result = agent(
    f"Analyze this CLI description: {description}",
    structured_output_model=CLIRequirements
)

# Access the validated Pydantic model — no JSON parsing needed
requirements: CLIRequirements = result.structured_output
By passing the structured_output_model, the Strands Agent constrains the model’s response to match the Pydantic schema. The result is a validated Python object where if the model’s first attempt does not conform to the schema, Strands automatically sends the validation errors back to the model and retries, producing a correct response without manual intervention. This approach eliminates malformed JSON, missing fields, wrong types, and hallucinated structure.
Role 2: Complete Command Generation with AI Functions
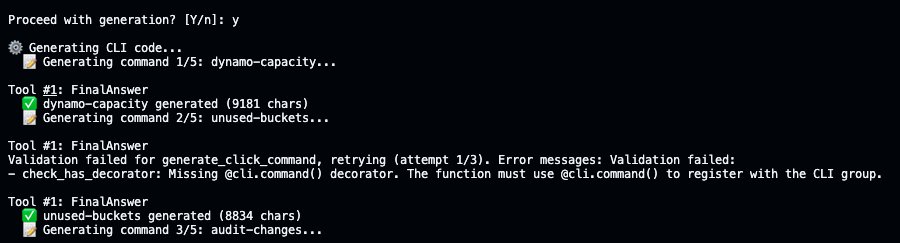
The second Amazon Bedrock role is generating complete command implementations. Direct integration of AI agents in code generation workflows is often avoided because of the model’s non-deterministic nature. There is no guarantee that generated code will compile, follow the expected structure, or avoid common pitfalls like empty error handlers. Strands AI Functions addresses this through runtime post-condition checking. AI Functions is a Python library for building reliable AI-powered applications through a new abstraction of functions that behave like standard Python functions but are evaluated by reasoning AI Agents. You decorate a function with @ai_function, write its prompt as a docstring with curly-brace placeholders, and attach post-conditions that the output must satisfy. If any post-condition fails, AI Functions automatically initiates a self-correcting loop, sending the specific error back to the model and retrying until all conditions pass or the maximum attempts are reached.
We use AI Functions to build a self-correcting code generation pipeline. Each generated command must pass three post-conditions before it is accepted:
from ai_functions import ai_function, PostConditionResult

def check_syntax(response: str) -> PostConditionResult:
    try:
        compile(response, '<generated>', 'exec')
        return PostConditionResult(passed=True)
    except SyntaxError as e:
        return PostConditionResult(
            passed=False,
            message=f"Python syntax error on line {e.lineno}: {e.msg}. Fix: {e.text}"
        )

def check_has_decorator(response: str) -> PostConditionResult:
    if '@cli.command' in response:
        return PostConditionResult(passed=True)
    return PostConditionResult(
        passed=False,
        message="Missing @cli.command() decorator."
    )

@ai_function(
    post_conditions=[check_syntax, check_has_decorator, check_no_empty_try],
    max_attempts=3
)
def generate_click_command(command_name: str, description: str, ...) -> str:
    """
    Generate a complete Click CLI command function in Python.

    Use @cli.command() decorator. Include needed imports using 'from X import Y' style.
    Always use 'import click' and reference as click.echo(), click.style().

    Command: {command_name}
    Description: {description}
    """
The @ai_function decorator turns the function’s docstring into a prompt template. Curly-brace placeholders like {command_name} are filled from the function arguments at call time. Each post-condition receives the model’s response and returns a PostConditionResult. When a condition fails, AI Functions sends the error message back to the model and retries automatically, up to max_attempts. The model sees the specific failure (“syntax error on line 42”, “missing @cli.command decorator”, “empty try/except block detected”) and corrects it on the next attempt.
The prompt embedded in the docstring still enforces coding conventions (use import click rather than from click import, use from X import Y for all other imports) to prevent import conflicts. Post-conditions catch what the prompt misses, making the pipeline significantly more reliable than prompt engineering alone.
MCP Server Discovery and Integration
The Model Context Protocol adds automatic discovery of external API knowledge to the pattern. When your tool description mentions AWS services, the system searches for MCP servers that can provide domain-specific tooling. Generated tools can tap into live, structured API knowledge beyond what Amazon Bedrock knows at generation time.
How Discovery Works
The system uses Amazon Bedrock to extract API keywords dynamically. The api_keywords field is part of the same CLIRequirements Pydantic model used for structured output, so keyword detection happens in the same call that extracts commands and dependencies at zero additional cost:
class CLIRequirements(BaseModel):
    cli_name: str = ...
    commands: List[CommandSpec] = ...
    dependencies: List[str] = ...
    api_keywords: List[str] = Field(
        default_factory=list,
        description="API/service keywords to search for MCP servers"
    )
When the model returns keywords like ["dynamodb", "s3", "cloudtrail"], the system uses a Strands Agent with the http_request tool from Strands Agents Tools to search the MCP registry for each keyword. Results are merged and deduplicated.
Interactive MCP Selection
After discovering relevant MCPs, the system presents them to the user for selection:
Selected MCPs are configured in the generated CLI’s .mcp.json file, and a bridge module is copied to the output project. This bridge connects to MCP servers at runtime, extracts their tool metadata, and converts them into Strands @tool functions that the Agent can invoke.
After MCP selection, CLI Creator generates each command sequentially using AI Functions. Here, the unused-buckets command initially fails the check_has_decorator post-condition for missing the @cli.command decorator, and AI Functions automatically retries generation with the error fed back to the model, producing valid code on the second attempt. All commands go through this process before having an installable CLI.
The Meta-Tooling Workflow: Create, Update, Revert
The most distinctive feature of the pattern is the iterative tool refinement workflow. This is where meta-tooling becomes practical, and it is the part most easily adapted to domains beyond CLI generation.
Step 1: Install and verify the generated CLI
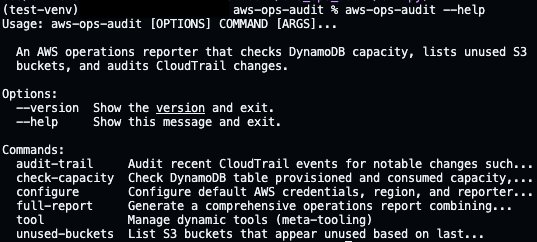
After generation completes, install the CLI and verify it works:
Each command is fully implemented. Here is unused-buckets pulling live S3 data:
After installation, the CLI is ready to use. Each subcommand supports --help for detailed parameter information.
Step 2: Create a new reporting tool at runtime
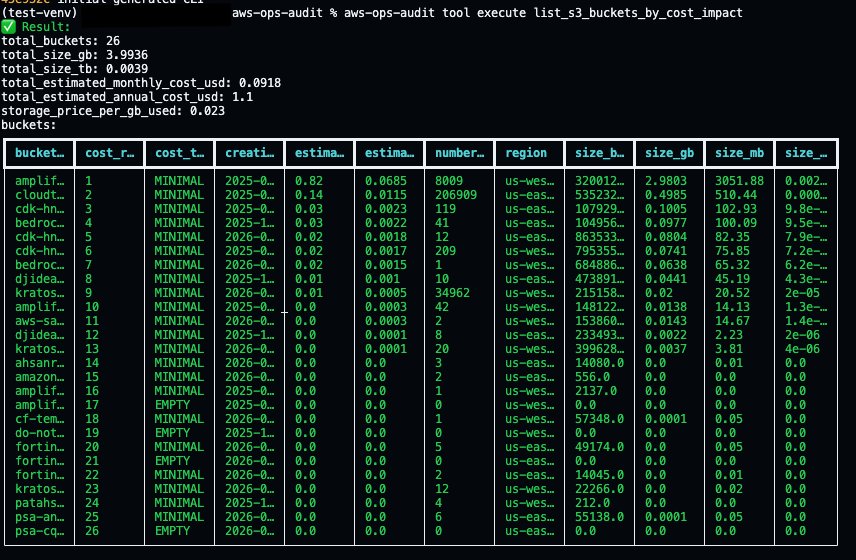
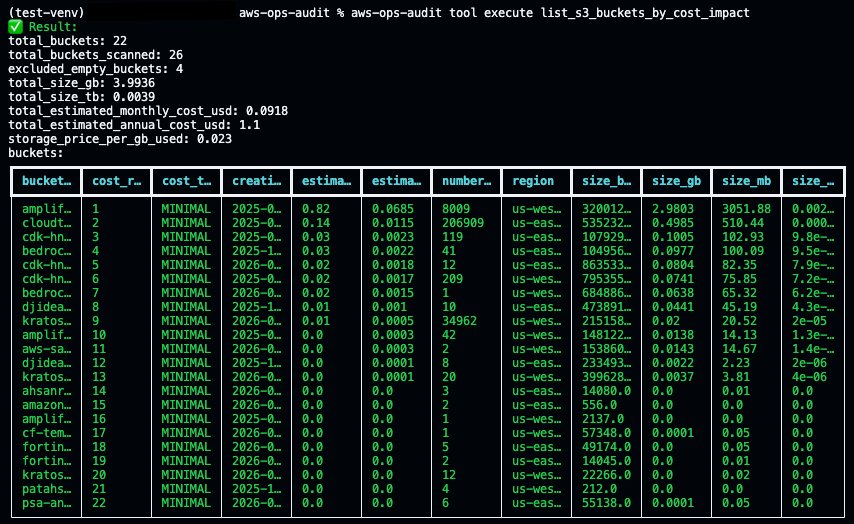
Consider a scenario where leadership requests a new report that was not part of the original CLI, such as a summary of all Amazon S3 buckets with their sizes, sorted by cost impact. Instead of modifying source code, use the built-in tool create command:
Amazon Bedrock generates a complete Strands tool, saves it to `tools/`, and commits it to git. The next CLI command automatically discovers and loads the new tool from disk, so you can execute it right away:
Output is automatically formatted based on data type, so lists of dictionaries render as tables, single dictionaries display as key-value pairs, and everything else falls back to JSON.
Step 3: Update and review changes
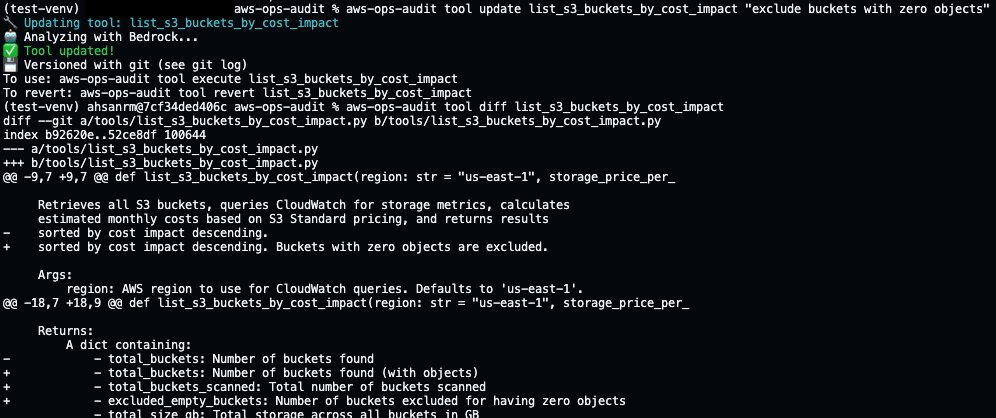
Suppose the initial output needs adjustment. Leadership wants the report to exclude buckets with an object count of zero. The user describes this change in natural language using the tool update command.
CLI Creator commits the current version to git before overwriting, then generates a new version. The tool diff command shows exactly what changed. Now execute the updated tool to see the improvements:
The same update workflow applies regardless of what the tool does, whether it is an Amazon S3 cost report, an Amazon DynamoDB capacity analyzer, or a Salesforce data exporter.
Step 4: Revert if needed
If the update didn’t work as expected, tool revert restores the previous version from git:
The git log shows the full history of create, update, and revert operations, all tracked automatically.
Under the hood, tool create, tool update, and tool revert are convenience wrappers around git. Each operation commits to the repository, so the version history is standard git and works with any existing workflow. The tool diff and tool revert commands exist so that someone iterating conversationally can see changes and undo them without switching context to git commands, but git log, git diff, and git revert work just as well. Git-based versioning and one-command reverts make it safe to experiment.
Step 5: Output formats
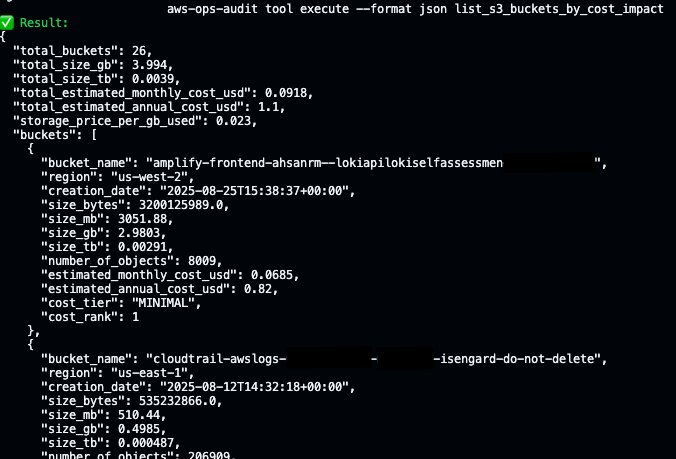
Reports often need to be consumed in different ways. The --format flag lets you control how output is rendered:
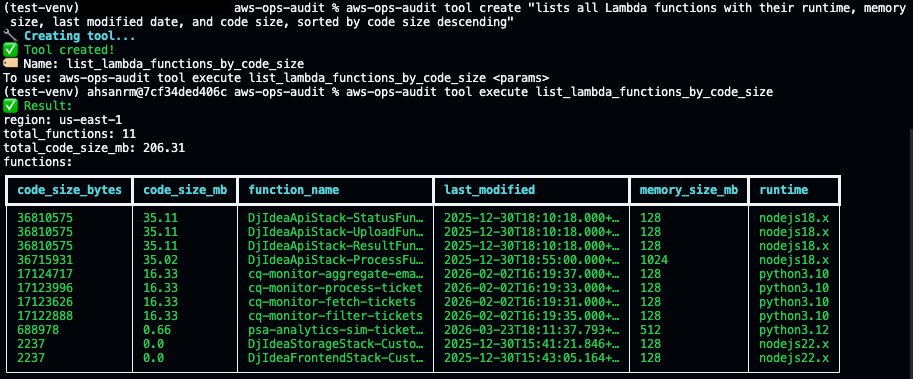
The formatter attempts to use the Rich library for colored tables when available and falls back to an ASCII table implementation when it is not installed. Here is a new AWS Lambda tool stored in `tools/`, rendering as a table by default:
IV. Conclusion
The meta-tooling pattern demonstrated here combines Amazon Bedrock for code generation, the Strands Agents SDK for runtime tool management, and Model Context Protocol for external API discovery into a system where CLIs extend themselves through natural language. The implementation has clear limitations today. Generated code still requires human review before production use; post-conditions catch structural errors but cannot verify business logic correctness, and the MCP ecosystem is young enough that server coverage is uneven across domains.
V. Next Steps
CLI tools are a natural starting point because they have a well-defined structure and fast feedback loops, but the same mechanism applies to any software that could benefit from generating and refining small, composable units of functionality at runtime. Infrastructure-as-code modules, data pipeline transformations, API integration adapters, and compliance policy checks are all domains where the creation pattern is repetitive, and the validation criteria are expressible as post-conditions. To explore the pattern:
– Start with Amazon Bedrock for foundation model access.
Learn how AWS Transform custom can help migrate Excel VBA applications to modern Python code while overcoming context window limitations, preserving functional equivalence, and enabling cloud-native deployment—turning weeks of manual rewriting into hours of AI-guided transformation.
Introduction
Many organizations maintain dozens of Excel VBA applications built over decades, containing business-critical logic trapped in workbooks—budget planning tools, demand planning, inventory management, financial modeling, and engineering calculations. Manual migration typically costs thousands of dollars per workbook and takes weeks, while traditional AI tools fail on large codebases that exceed context windows.
This post demonstrates how you can migrate VBA to Python using AWS Transform custom, addressing three key challenges: processing large codebases through intelligent chunking, converting legacy code to maintainable Python while preserving functionality, and validating equivalence through automated testing. You can reuse the transformation across similar projects or apply it to entire portfolios.
With AWS Transform custom, you can accelerate migration timelines, eliminate transcription errors, and scale from single applications to enterprise portfolios.
Solution Overview
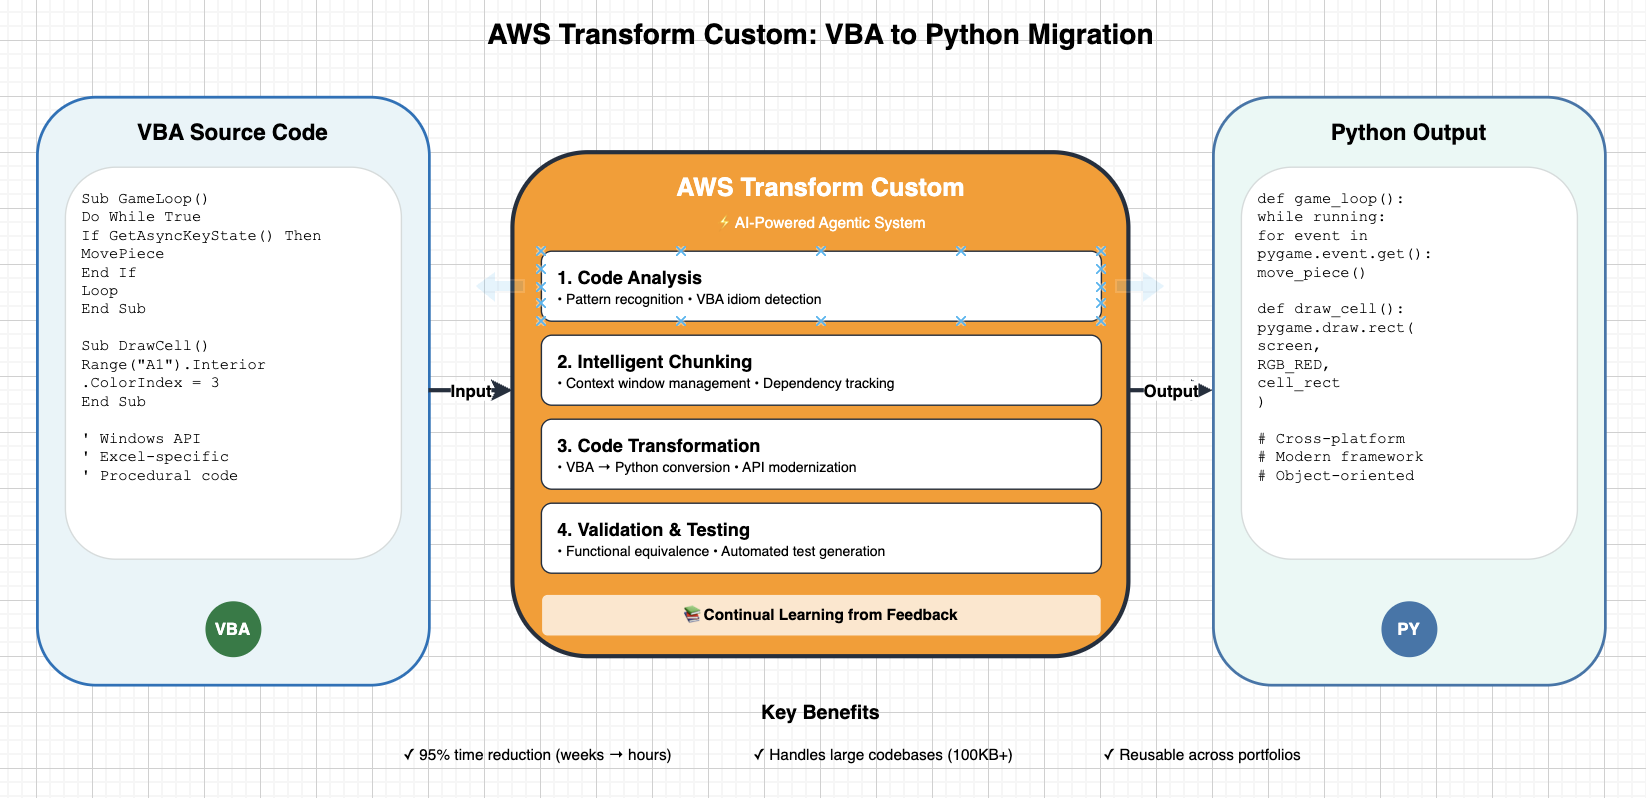
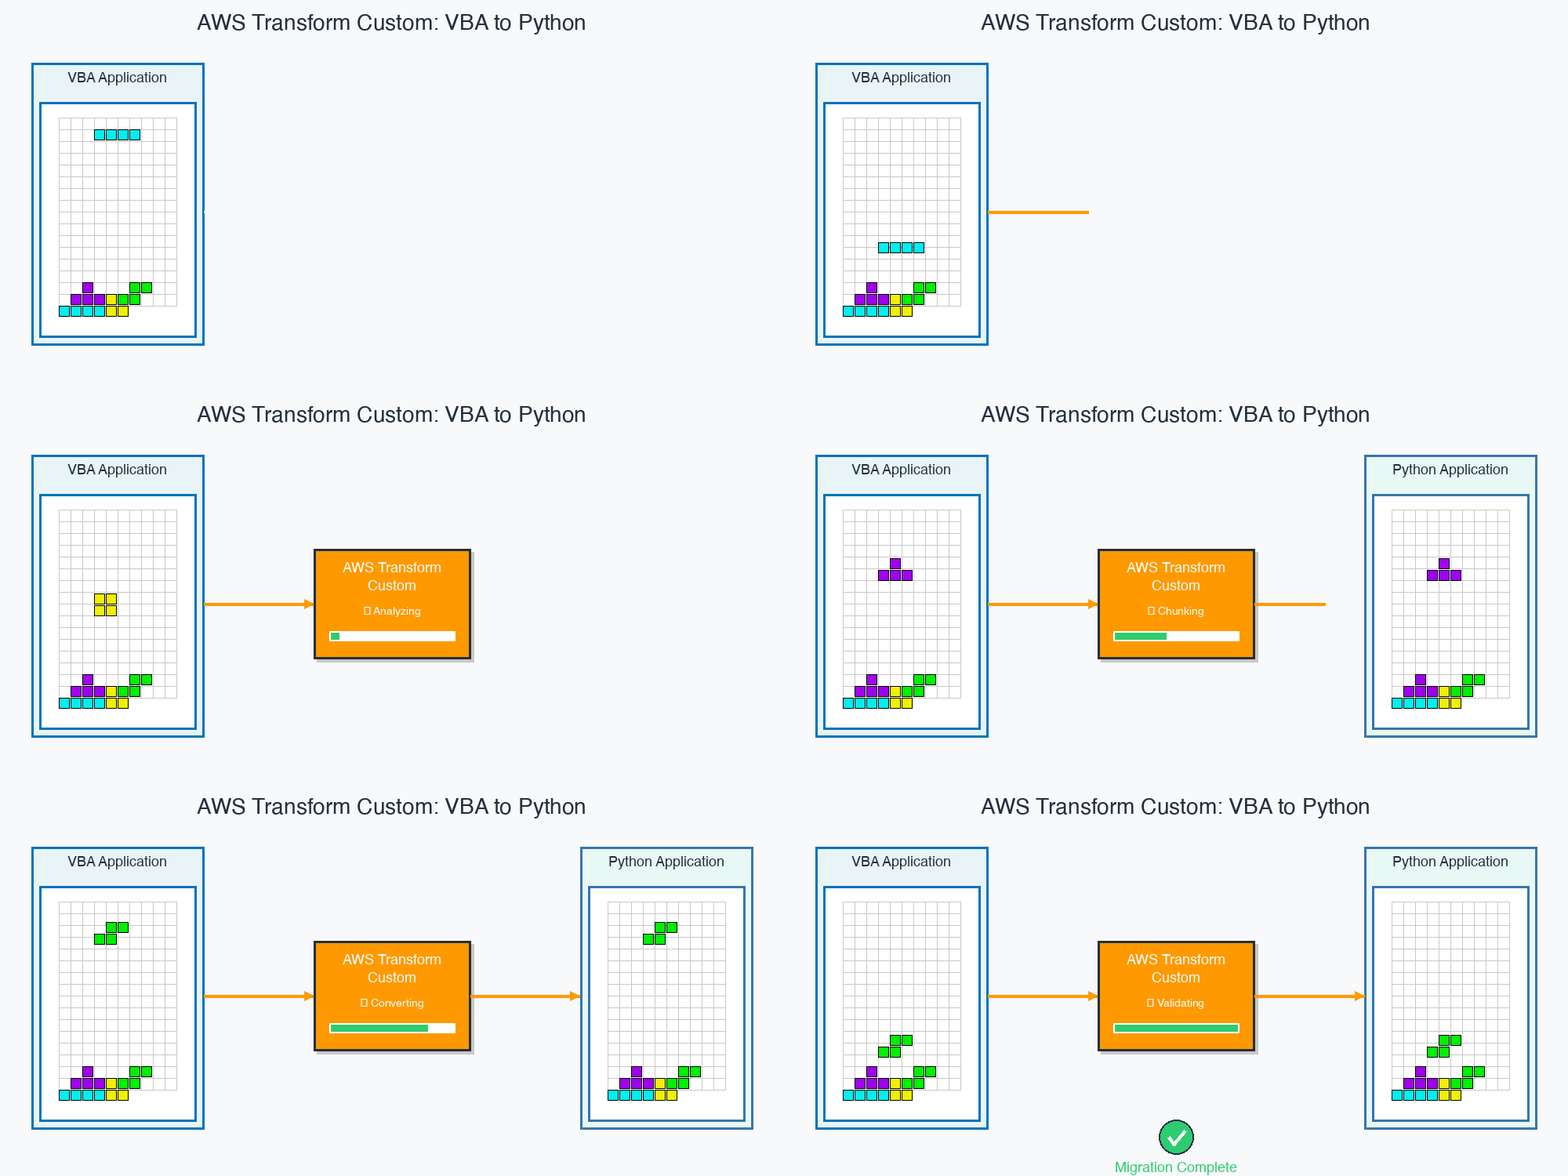
The following diagram illustrates how AWS Transform custom migrates VBA source code to Python output through a four-step process powered by an AI agentic system.
Figure1:AWS Transform custom VBA to Python migration architecture
AWS Transform custom provides an interactive workflow where you describe your migration requirements. The system interprets your intent and iteratively refines the transformation definition until it meets your specifications. As the system processes your code, it improves the quality of each subsequent run. Once you finalize a transformation, you can publish it to a registry so your team can reuse it across multiple projects without starting from scratch.
Migration Approach
The migration follows a three-phase process that takes you from defining your transformation through execution and validation and finally scaling across your portfolio.
In the first phase, transformation definition creation, you start an interactive session with AWS Transform custom to describe your migration requirements. You can reference your VBA code, API documentation, and target framework guides as context. The system uses these inputs to automatically generate transformation rules and patterns, which you can iteratively refine through build validation until the definition accurately captures your migration logic.
In the second phase, execution and validation, AWS Transform custom applies the transformation to your codebase. It intelligently chunks large codebases into logical modules and processes them in dependency-aware order, so cross-module references remain intact. Throughout execution, the system continuously validates builds and tests, automatically detecting and correcting errors as they arise.
In the third phase, scale and reuse, you publish your finalized transformation to the registry, making it available for your team to apply across similar projects. You can run campaign-based bulk executions across multiple repositories, extract knowledge items for continuous improvement, and integrate the transformation into your CI/CD pipelines.
Key capabilities
AWS Transform custom addresses the core challenges you face when migrating large VBA codebases to Python.
For context window management, the system automatically segments your codebase into logical modules, tracks cross-module dependencies, preserves interface contracts across chunks, and maintains state throughout the transformation. This means you can process codebases that far exceed standard AI context window limits without losing coherence between modules.
For intelligent code restructuring, AWS Transform custom recognizes VBA idioms and maps them to Python equivalents. It refactors procedural code into object-oriented designs, replaces Windows-specific APIs with cross-platform libraries, and applies proper encapsulation and separation of concerns. The result is a clean, maintainable Python that follows modern coding standards.
For functional equivalence preservation, the system generates automated tests based on the original VBA behavior and runs regression testing after each transformation step. It benchmarks performance metrics such as timing and resource usage and validates edge cases to confirm that your transformed Python code produces the same results as the original VBA application.
Prerequisites
Before you begin, you need an AWS account with the appropriate permissions to use AWS Transform custom. Start by configuring authentication and setting up the AWS CLI for your environment.
VBA application source code (Excel workbook with macros or exported .bas files)
Git repository initialized in source directory
Build/test commands defined (if applicable)
Target Environment Setup (for Python migration)
Python 3.8 or higher installed
Virtual environment tool (venv or virtualenv)
Target framework dependencies (e.g., pygame for game applications, tkinter/PyQt6 for GUI, pandas for data processing, openpyxl for spreadsheet operations)
Walkthrough: VBA to Python Migration
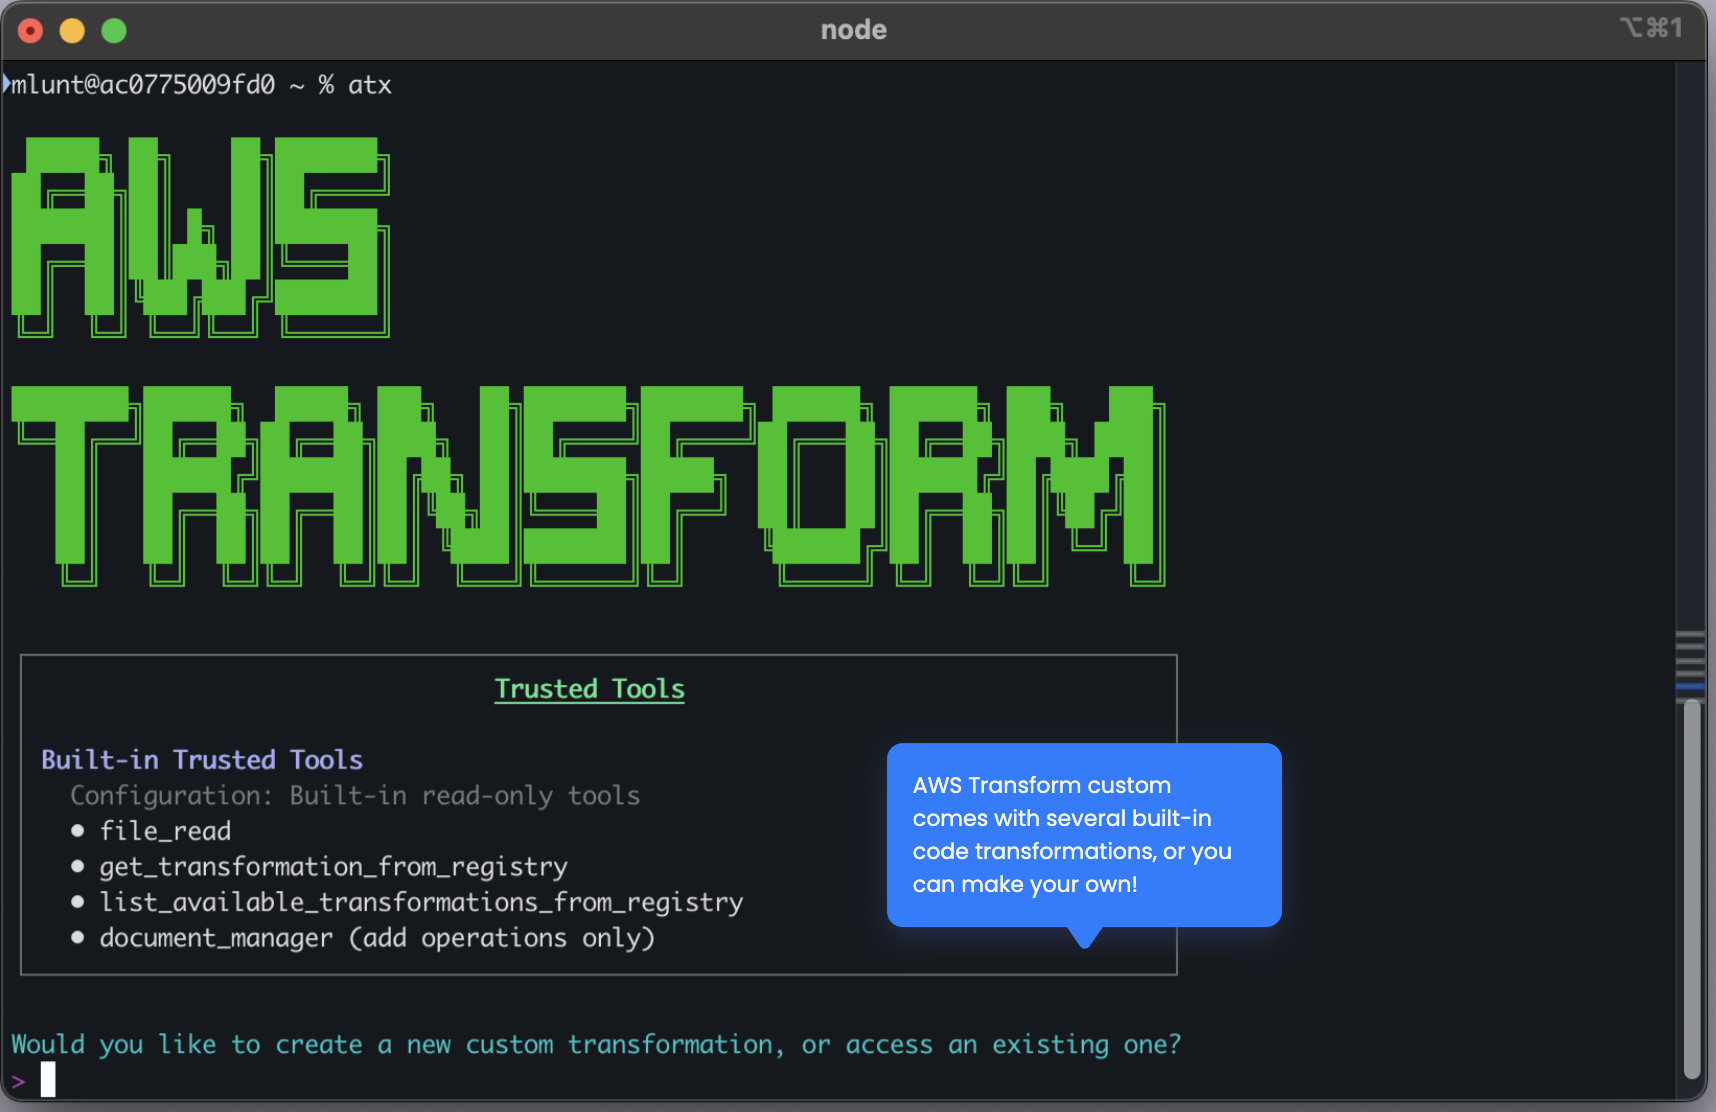
Figure2:AWS Transform custom CLI executing a VBA to Python transformation
Step 1: Prepare Your VBA Application
Initialize Git Repository
AWS Transform Custom requires your code to be in a Git repository. If your code isn’t already in Git:
Figure3:AWS Transform custom interactive session with migration context
When you start the interactive session, provide a natural language description of your migration goal, such as “Migrate VBA application to Python.” Specify the target framework you want to use, for example, pygame for GUI applications or pandas for data processing. You should also include document references to give the system the context it needs — this includes your VBA code files, Python framework documentation, and any API migration guides relevant to your project.
Example conversation:
User: I want to migrate a VBA application to Python. AWS Transform: I’ll help you create a transformation definition. Let me analyze the VBA patterns and generate Python equivalents…
Define Scope and Entry Criteria
Before creating your transformation, review your existing codebase to understand its structure, patterns, and dependencies. Identify the code type and technology stack you are working with, such as an Excel VBA game that uses Windows API calls. Check the transformation registry for existing similar transformations to avoid duplicating work. From there, define a clear objective and scope for your transformation, and document the entry criteria that determine what code qualifies. Outline detailed implementation steps with specific technical mappings, establish validation and exit criteria for measuring success, and name your transformation appropriately so your team can discover and reuse it.
Iterative Refinement
After you provide your migration context, AWS Transform custom generates an initial transformation definition.You can review this definition at: ~/.aws/atx/custom/<session-id>/artifacts/tp-staging/transformation_definition.md.
Examine the generated rules and provide feedback on patterns, edge cases, or missing scenarios. AWS Transform custom incorporates your feedback and regenerates the definition, allowing you to iterate until the transformation accurately captures your migration logic.
Key Patterns to Address
During the transformation definition process, you should account for the common patterns that differ between VBA and Python. AWS Transform custom maps VBA ColorIndex values to standard RGB tuples and converts Range objects to Python data structures such as lists and arrays. Do While loops in VBA translate to event-driven loops in Python. The transformation replaces Windows API calls with cross-platform libraries that provide portable alternatives. VBA UserForms map to Python GUI frameworks like tkinter or PyQt6, where form controls become Python widgets. VBA Property Get/Let constructs convert to Python @property and @setter decorators. Finally, VBA’s 1-based array indexing must be adjusted to Python’s 0-based indexing throughout your codebase.
When you run the transformation, AWS Transform custom begins with agent planning. It analyzes your codebase structure, identifies all VBA components and their dependencies, and generates a step-by-step transformation plan with logical ordering — for example, data models first, then business logic, then UI. Each step in the plan has a clear scope and validation criteria.
Next, the system performs automatic code chunking. It analyzes your codebase size and complexity, then segments the code into logical modules such as constants, game logic, rendering, and controller. These chunks are processed in dependency order based on the plan, and the system manages the context window by focusing on one module at a time.
Throughout execution, AWS Transform custom tracks dependencies by mapping relationships between VBA subroutines, verifying that dependent code references remain valid, and maintaining interface contracts across modules.
The transformation proceeds incrementally, converting one module at a time. After each module is transformed, the system validates the build. If a failure occurs, it automatically rolls back and retries the transformation for that module before moving on.
Sample Output:
Analyzing codebase structure...
Identified 4 logical modules: constants, core_logic, rendering, main_controller
Transforming module 1/4: constants
 - Converting VBA Enums to Python IntEnum
 - Mapping ColorIndex values to RGB tuples
 - Generating color constants
 ✓ Build validation passed
Transforming module 2/4: core_logic
 - Converting collision detection subroutines
 - Refactoring global variables to class attributes
 - Translating VBA arrays to Python lists
 ✓ Build validation passed
Transforming module 3/4: rendering
 - Replacing Range object manipulation with pygame rendering
 - Converting cell-based drawing to pixel-based graphics
 - Implementing screen update logic
 ✓ Build validation passed
Transforming module 4/4: main_controller
 - Converting Do While loop to pygame event loop
 - Replacing GetAsyncKeyState with pygame.event.get()
 - Implementing game state management
 ✓ Build validation passed
Transformation complete! Generated 5 Python modules.
Review Transformed Code
After the transformation completes, check the generated Python files to verify the output. You can review the transformation logs at ~/.aws/atx/custom/<conversation-id>/logs/ to understand the decisions the system made during each step. Examine the build validation results to confirm that the transformed code compiles and passes all checks.
Step 4: Validate Functional Equivalence
Automated Test Generation
AWS Transform generates validation tests based on original VBA behavior:
test_validation.py – Verifies core logic:
# Example generated test (conceptual)
def test_collision_detection():
 """Verify collision logic matches VBA behavior"""
 # Test cases extracted from VBA code analysis

def test_scoring_calculation():
 """Ensure scoring algorithm is preserved"""

def test_state_transitions():
 """Validate game state changes"""
As you refine your transformation, you may encounter a few common issues. Here is how you can address them and provide feedback to AWS Transform custom.
Timing and performance differences can occur when the Python application runs faster or slower than the VBA original. To fix this, adjust timing constants and frame rate limiters. For example, if you notice the game runs too fast because VBA used Sleep(500) for piece drops, you can provide that feedback. AWS Transform custom corrects this by replacing time.sleep() with pygame.time.Clock.tick(60).
Color rendering mismatches happen when colors in the Python output don’t match the VBA version. This is typically caused by incorrect RGB mappings for VBA ColorIndex values. If you notice that ColorIndex 3 should be pure red (255,0,0) but is showing as dark red, provide that feedback. AWS Transform custom updates the COLOR_MAP dictionary with accurate RGB values.
Collision detection bugs may appear when pieces move through walls or other pieces. This requires refining boundary checking and collision logic. For instance, if rotation near walls allows pieces to go out of bounds, you can report this issue. AWS Transform custom adds boundary validation before rotation commits to resolve it.
Continual learning in action
Each time you provide a correction, AWS Transform custom captures it as a knowledge item. Future transformations automatically incorporate these fixes, so the same issues don’t recur. With each execution, the system improves quality for similar migrations across your portfolio.
By using AWS Transform custom, you can reduce tech debt and accelerate enterprise modernization at scale. The service supports diverse transformation use cases beyond VBA to Python, adapting to the specific needs of your codebase and target platform. With continual learning and improvement, each transformation builds on the corrections and knowledge items from previous runs, delivering higher quality results over time. Once you define a transformation, you can apply it everywhere — across similar projects, teams, and entire application portfolios — without recreating the migration logic from scratch.
Architecture Evolution
Before migration, your legacy VBA application is constrained to a Windows-only execution environment, tightly coupled to the Excel runtime. The code follows a procedural style with a global state, and testing and deployment are manual processes.
After migration with AWS Transform custom, your application follows a modular architecture with clean separation of concerns across constants, logic, rendering, and controller layers. The code uses object-oriented design with proper encapsulation and runs cross-platform on Windows, macOS, and Linux. The transformed application is cloud-ready, with a structure that supports containerization through Dockerfile generation, serverless adaptation with decoupled logic and rendering, and standard Python packaging through requirements.txt and setup.py. It also integrates with modern DevOps workflows, including automated testing with pytest, CI/CD pipeline compatibility, and version control through Git.
You can deploy the transformed application in several ways: containerized with Docker and Kubernetes for scalable web applications, serverless with AWS Lambda for event-driven processing, as a standalone desktop executable with PyInstaller, or as a web application with FastAPI or Flask wrappers for browser access.
The following screenshot shows the transformed Tetris application running as a Python pygame application.
Figure4:Transformed Tetris game running as a Python pygame application
Transformation definition creation
When creating your transformation definition, provide comprehensive context by including your VBA code, target framework documentation, and migration guides. Focus on documenting application behavior by describing what the application does functionally, not just its code structure. Identify platform-specific dependencies such as Windows APIs, Excel features, and ActiveX controls that require special handling during migration. Define clear success criteria including performance targets, functional requirements, and test coverage expectations. Be explicit about construct mappings in your transformation definition — the more specific you are, the more consistent the output.
Execution strategy
Start with a pilot project by testing your transformation on a smaller, representative application before applying it broadly. Validate incrementally by reviewing each module transformation before proceeding to the next. Capture corrections as feedback by documenting issues and fixes so the system can incorporate them through continual learning. Iterate on edge cases to refine the transformation for corner cases and error conditions that may not surface during initial runs.
Quality assurance
Generate comprehensive automated test suites from the original VBA behavior to verify functional equivalence. Run performance benchmarking to confirm that non-functional requirements match the original application. Conduct manual validation through user acceptance testing to verify UI and UX consistency. After any refinements, run the full test suite for regression prevention to ensure that fixes in one area haven’t introduced issues elsewhere.
Scaling across your portfolio
When you are ready to scale, categorize your applications by similarity — for example, data processing, UI-heavy, or calculation-focused workbooks. Create transformation variants with customized definitions for each category. Use campaigns for bulk execution to process multiple applications in parallel. Monitor and aggregate results across your portfolio to track success rates, identify common issues, and measure time savings.
Cleanup
Archive Conversation Logs
# Conversation logs are in ~/.aws/atx/custom/<conversation-id>/
# Archive for future reference before cleanup
tar -czf vba-migration-logs.tar.gz ~/.aws/atx/custom/<conversation-id>/
Remove Temporary Files
# Remove conversation data and transformation session artifacts (kept for 30 days automatically)
rm -rf ~/.aws/atx/custom/<conversation-id>

# Remove draft transformations (if not needed)
atx custom def delete --name "VBA-to-Python-Migration-Draft"
Manage Published Transformations
# List your transformations
atx custom def list

# Delete transformations no longer needed
atx custom def delete --name "VBA-to-Python-Migration-Old-Version"

# Update transformation tags for organization
atx custom def tag --transformation-name "VBA-to-Python-Migration" \
  --tags "team:platform-engineering,language:python,status:production"
In this post, you learned how AWS Transform custom can help you migrate Excel VBA applications to Python at scale. With AWS Transform custom, you can reduce weeks of manual migration work to hours. Intelligent chunking handles large codebases that exceed standard AI context window limits, while continuous validation and automated testing preserve functional equivalence throughout the process. Because transformations are reusable, and the system learns from each execution, you gain compound efficiency with every subsequent migration. The transformed applications are cloud-ready, supporting containerization, serverless deployment, and modern DevOps workflows.
AWS Transform custom is a strong fit when you are modernizing a portfolio of dozens or hundreds of similar legacy applications, when functional equivalence must be guaranteed for quality-critical migrations, or when you have repeatable migration patterns across multiple projects.
Next Steps
The transformation demonstrated in this post — VBA to Python migration with context window management, automated restructuring, and functional validation — is a template you can apply to other modernization challenges, such as mainframe COBOL to Java, Progress ABL to Spring Boot, or .NET Framework to .NET Core. The principles remain consistent: intelligent code analysis, dependency-aware processing, continuous validation, and transformation reuse.
In today’s cloud-native landscape, ensuring the integrity and authenticity of your serverless functions is critical for maintaining security and compliance. Organizations face increasing challenges in preventing the execution of tampered or malicious code in their AWS Lambda functions. These challenges intensify as deployment pipelines become more complex and distributed.
AWS Lambda code signing provides a robust security mechanism that guarantees only trusted, unmodified code executes in your Lambda functions. By implementing digital signatures, you can verify code integrity and authenticate the source, creating a secure foundation for your serverless applications.
This post shows you how to implement AWS Lambda code signing using Terraform, creating an automated, end-to-end security framework that prevents unauthorized code execution while maintaining operational efficiency.
Solution overview
This solution creates a comprehensive code signing pipeline that automatically signs Lambda deployment packages and enforces signature validation at runtime. The implementation uses AWS Signer with the SHA384-ECDSA algorithm for cryptographic security, combined with Terraform automation for consistent deployments across environments.
Figure 1: Architecture diagram of AWS Lambda signing with AWS Signer
The architecture includes:
AWS Signer: Creates signing profiles and jobs with strong cryptographic algorithms
Amazon S3: Stores original and signed Lambda code with versioning enabled
AWS Lambda: Deployed with code signing enforcement in a VPC environment
AWS KMS: Provides encryption for CloudWatch logs and SQS dead letter queue
VPC Configuration: Isolates Lambda execution in private subnets with VPC endpoints
Walkthrough
This walkthrough demonstrates how to deploy a secure Lambda function with code signing enabled using Terraform, a popular infrastructure as code.
The deployment process includes these key steps:
Set up AWS Signer signing profile with cryptographic configuration
Create S3 bucket with versioning for code storage
Configure automated code signing jobs
Secure Lambda deployment
Implement security best practices including KMS encryption and VPC isolation
For this walkthrough, you should have the following prerequisites:
– An AWS account with appropriate permissions for AWS Signer, Lambda, S3, and VPC services
– Terraform >= 1.0 installed on your local machine
– AWS CLI configured with credentials that have necessary service permissions
– Basic understanding of AWS Lambda, Terraform, and infrastructure as code concepts
1. Setup AWS Signer Signing Profile
The foundation of our code signing implementation starts with creating an AWS Signer signing profile. This profile is the identity that defines the cryptographic algorithm and signature validity period.
1.1 Define the signing profile resource in your Terraform configuration:
   resource "aws_signer_signing_profile" "lambda_signing_profile" {
     platform_id = "AWSLambda-SHA384-ECDSA"
     name        = "${replace(var.name, "-", "_")}_lambda_signing_profile_${random_string.suffix.result}"
     signature_validity_period {
       value = 135
       type  = "MONTHS"
     }
   }
We use the AWSLambda-SHA384-ECDSA platform, which provides strong cryptographic security with SHA-384 hashing and ECDSA (Elliptic Curve Digital Signature Algorithm).
1.2 Configure the code signing configuration that enforces security policies:
The untrusted_artifact_on_deployment = "Enforce" policy ensures that Lambda rejects any unsigned or improperly signed code.
2. Create S3 bucket with versioning for code storage
Before the code can be signed, it needs to be packaged and stored in a versioned S3 bucket. AWS Signer requires S3 versioning to uniquely identify the source artifact for each signing job.
The archive_file data source zips the contents of the lambda_function/ directory, and the aws_s3_object uploads it to the versioned bucket. The depends_on ensures versioning is active before the upload, so the object gets a version_id that the signing job can reference.
3. Configure automated Code Signing jobs
The next step creates an automated signing job that processes your Lambda code and generates signed artifacts.
3.1 Upload your Lambda code and configure the signing job:
The s3_bucket and s3_key reference the signed artifact produced by the signing job. Terraform resolves aws_signer_signing_job.build_signing_job.signed_object[0].s3[0] to the output location where AWS Signer wrote the signed package in step 3. This ensures Lambda always deploys the signed version, never the unsigned source.
The code_signing_config_arn ties the Lambda function to the code signing configuration from step 1. At deploy time, Lambda validates the artifact’s signature against the allowed publishers in that configuration. If the signature is missing, expired, or from an untrusted profile, the deployment is rejected.
5. Implement Security Best Practices
This implementation includes additional security layers beyond code signing to create a comprehensive security framework.
5.1 Create a KMS key with automatic key rotation and a least-privilege policy:
The enable_key_rotation = true setting enables automatic annual key rotation, a recommended security practice. The policy uses aws_iam_policy_document instead of inline JSON for better readability and validation. Each statement is scoped to a specific principal: the root account gets administrative access with enumerated actions (not kms:*), CloudWatch Logs can only use the key for the specific log group via the kms:EncryptionContext:aws:logs:arn condition, and Lambda access is constrained to the specific function name and region. This ensures no service can use the key beyond its intended scope.
5.2 Configure VPC with private subnets for Lambda isolation:
The Lambda function uses an SQS dead letter queue and hence requires the SQS endpoint. The private_dns_enabled setting allows the Lambda function to reach these services using their standard endpoints without any code changes. For the complete networking configuration including security groups and route tables, see the GitHub repository.
These security measures create defense in depth, combining code signing with encryption, network isolation, and secure communication channels.
6. Deploy the Infrastructure
With all the resources defined, initialize and deploy the complete infrastructure:
terraform init
terraform plan
terraform apply
The terraform init command downloads the required providers. The terraform plan command previews all the resources that will be created, and terraform apply provisions the entire stack — signing profile, S3 bucket, signing job, Lambda function, and all supporting infrastructure — in the correct dependency order.
Verification
After the deployment completes, verify that the signing profile, signing job, and Lambda code signing configuration are correctly set up.
Each command should return results confirming the resources are active and properly configured. If any command returns empty results, review the Terraform output for errors during deployment.
Cleaning Up
To avoid incurring future charges, delete the resources created in this walkthrough using the command:
terraform destroy
This command removes all resources including the Lambda function, S3 bucket, VPC components, and KMS keys. This command also deletes the signing profile and code signing configuration.
Conclusion
In this post, you learned how to implement AWS Lambda code signing using Terraform to create a secure, automated deployment pipeline. This solution ensures code integrity, prevents unauthorized modifications, and helps meet compliance requirements while maintaining operational efficiency through infrastructure as code.
The implementation demonstrates defense-in-depth security practices including cryptographic signing, encryption at rest, network isolation, and comprehensive monitoring. By automating the entire process with Terraform, you can consistently deploy secure Lambda functions across multiple environments and maintain security standards at scale.
It’s nasty, but it requires physical access to the computer:
The exploit, named YellowKey, was published earlier this week by a researcher who goes by the alias Nightmare-Eclipse. It reliably bypasses default Windows 11 deployments of BitLocker, the full-volume encryption protection Microsoft provides to make disk contents off-limits to anyone without the decryption key, which is stored in a secured piece of hardware known as a trusted platform module (TPM). BitLocker is a mandatory protection for many organizations, including those that contract with governments.
Slashdot thread. And here’s Nightmare-Eclipse’s GitHub account.
Поводът за разговора е изложбата „Кирил Златков. Рисунки“ в СБХ на „Шипка“ 6, в която за първи път се показват непознати досега рисунки на художника. Изложбата, създадена от кураторския тандем Свобода Цекова и Антон Стайков (студио формат.бг), обхваща впечатляващо разнообразие от техники и материали, а единственият превод на образите е музиката, избрана и предоставена специално за събитието от норвежкия тромпетист и композитор Нилс Петер Молвер. По време на срещата ни Кирил говори за рисуването като узнаване, процес, при който конкретни лица, спомени и впечатления изплуват на листа, без художникът да ги е търсил съзнателно. Той разсъждава и за бездарието на съвременната реалност, за защитата на буквата като антропологична кауза и за възпитанието чрез личен пример. Изложбата може да бъде видяна до 28 май с произведения и на допълнителни места в София – в Софийския университет, книжарница „Махала“, „Център 24“ и „Дюкян Меломан“.
Георги Господиновпише, че Вашите картини имат „тихо и деликатно излъчване и спотаени истории“. Възможно ли е днес именно тихото изкуство да се окаже най-радикално, защото отказва да крещи, да продава себе си и да се превръща в шум?
Не само е възможно, а силно се надявам да е така. Това е най-шумното време от всички до момента. Всеки личен глас се появява паралелно със задължението да се изяви и шумът идва от само себе си. Дори понякога наистина ни пречи да чуем нещо стойностно. Тишината е избор, но не може да е самоцелна, трябва да е част от материята. А това се овладява с възрастта, с последователни, често ежедневни усилия. В един момент тишината започва да се прокрадва като част от естественото излъчване на работите.
В много от рисунките човешкото лице е едновременно маска, рана и пейзаж. Какво може да разкаже едно лице, което думите вече не успяват да изрекат?
Всичко може да внуши човешкото лице. Не непременно с портрет, който търси конкретна прилика, но със сигурност с богатството на излъчването си. Особено напоследък то ми се струва ключов материал, който до голяма степен е като музиката, защото не се нуждае от преводи, не се нуждае от обяснения и има силата да приковава и да отваря по-дълбоки пространства.
Ръка пред лицето I, 2024; Конска глава II, 2024
В текстовете за изложбата се говори за „изкуство без обяснения“. Живеем обаче във време, което непрекъснато настоява всичко да бъде обяснено и позиционирано. Може ли мълчанието на една рисунка да бъде форма на съпротива?
В моите рисунки мълчанието вероятно се е получило от само себе си. Рисунката е най-непосредственото общуване на художника с всичко около него. Когато е вглъбен и изолиран от средата, той е потопен в тишина, но тя не е формална. В главата му бушува, напира нещо, което трябва да добие форма. Тишината е обертон, елемент от амалгамата на всичко, което представлява едно произведение. А хубавото на рисунката е, че не е затворена, всяка може да даде начало на нещо следващо, на по-голям формат, на произведение с друга техника. Тя маркира нещо съществено.
Тоест във всяка рисунка по презумпция има нещо обнадеждаващо?
Точно така. Може да изглежда завършена, но маркира етап. Дори изложена в рамка и фиксирана, тя е нещо много повече от физическото си присъствие.
Работите Ви носят усещане за вътрешна тревога, но и за деликатност към човека. Как се рисува човешкото, без да се изпадне нито в цинизъм, нито в сантименталност?
Циничното ме изкушава, по-точно казано красноречивото и оригиналното, защото имам опит в изкуството на плаката, където сарказмът е добре дошъл. Но в тези рисунки съм се старал да не мисля. Няма формулиран замисъл, това е пренасяне на образи, които изплуват в съзнанието. Рисуването е точно това.
Нещо дълбинно, интуитивно?
Да. В работите няма хумор, няма цинизъм. Те отнякъде са се появили, но не знам откъде. Имат най-различни влияния, често съвсем конкретни лица, които остават из мозъка. Седнеш да рисуваш – и си кажеш впоследствие, че това прилича на дадена актриса, че тук има черти на едно момиче, че това прилича на спомените ми за един приятел. Но докато съм рисувал, не съм си мислил за него…
Рисуването като узнаване?
Да. Това е красотата на материята. Върху чертите се отразяват неща, които са направили впечатление на художника, а той си дава сметка едва когато завърши рисунката. Или доста време след това. Понякога дори животни, които рисувам, приличат на хора. А ако седнеш да засилиш някоя прилика нарочно, най-често не се получава. Както казва Пикасо, „аз не рисувам жена, аз рисувам картина“.
Кипариси II (Патра), 2024
Ако трябваше да нарисувате духа на 2026-та само с един образ, как би изглеждал той?
Това е задача за плакатист, какъвто безспорно бях, но такова обобщение ми е трудно дори за осмисляне. Предпочитам някой куратор да отговори с работи на съвременни художници. Цялото Венецианско биенале като сбор от образи вероятно е нещо такова.
Работил сте върху корици на книги на Марин Бодаков, Хармс, Бруно Шулц, Кржижановски – все автори, при които реалността винаги е тревожна и сънувана. Имате ли чувството, че самата реалност днес прилича на литература от ХХ век, която някога сме смятали за алегория?
Да. Но литературните произведения са нещо сериозно, а образът на реалността днес, за да е адекватен, трябва да бъде нещо несериозно, неталантливо, грубо, нелепо, бездарно даже. Ако възложите на човек, който владее изкуството си, да пресъздаде реалността, той ще поеме по пътя на изкуството и ще сбърка. Изкуството е осмисляне, не констатация, трябва дистанция. А реалността е все по-нелепа и все по-тъжна. Бяхме достатъчно красиво оглупели през последните десетилетия, а през последните пет-шест години абсурдът се намести на мястото на разума. Но изкуството има нужда от пауза, ако ще произведе трайни стойности. Виждам художници и музиканти да реагират на всичко, но не съм сигурен, че това е най-полезното за хората.
Вие мислите едновременно за образа, буквата и шрифта. Какво се случва с човешкото внимание в епоха, в която и образите, и думите се консумират с такава скорост?
По-важна за мен е не скалата бързо–бавно, а внимателно–невнимателно. Сега сме затънали в невнимателното, в повърхностното. Но не искам да слагам етикет на това – наши близки, а и самите ние сме част от същата тенденция.
В изложбата музиката на Нилс Петер Молвер е своеобразен превод на рисунките. Какво може музиката да отключи в образа, което рисунката не може да понесе сама?
Молвер има излъчване, което винаги ми е било близко – хладен, не особено комуникативен, но пропит с вътрешна топлина от емоции и чувства. Звукът му е много богат и ангажира вниманието. Помага и за потапянето в една благородна атмосфера, което в залите понякога е трудно да бъде усетено. Най-добре е в тишина, но понякога тишината резонира твърде силно и затова музиката настройва, опъва струни, подобни на моите визуални структури.
Вие сте и родител. Какво е да отглеждаш дете във време на постоянна тревожност, войни и климатична несигурност? На какво най-много Ви се иска да научите едно дете?
Най-устойчивите неща, които децата запомнят, не са онези, които успяваме вербално да формулираме. Възпитаваме с личен пример, с поведение, с вкус, с нещата, които четем и слушаме, с местата, които посещаваме, с времето и вниманието, което отделяме за музеи и църкви, за разходки в природата. В това виждам единствената надежда за някакви хармонични същества, които да дойдат след нас.
Има ли етична отговорност в самия акт на рисуване; важно ли е не само какво изобразяваш, а и как гледаш към света, към другия човек?
Със сигурност, но това е базова предпоставка за каквото и да е изкуство. Материята на произведението трябва да е убедителна, а това се учи и овладява. Не е достатъчен наивен флирт с изкуството. Без сериозно владеене на формата произведението не може да бъде убедително. Във всяко изкуство е така.
Част от рисунките изглеждат, сякаш са намерени в междинен свят, между съня и документа, между личното и общочовешкото. Интересува ли Ви рисунката като свидетелство?
Рисунката би могла да е като щракване на снимка или хайку, но за мен е малко по-бавна и по-устойчива. Много ми харесва как го определихте – „междинен свят“. Определено е така. Тя притежава една крехкост, която при по-сериозни техники и по-дълго работене понякога се губи. Старал съм се да не бягам от тази крехкост.
Все едно, ако се дръпне една нишка от рисунката, всичките линии ще се разпилеят.
Всяка линия си има роля, която не се поддава на конкретно описание, но е част от ансамбъл. Един да сгреши – и веднага се чува.
Фигури пред бяла стена, 2024; Бор, ангел III, 2025
Кои са любимите Ви рисувачи?
Пикасо, най-необятният рисувач, рисувал постоянно и по много. Всичките, които харесвам, са рисували така, художникът трябва да рисува постоянно. И Кете Колвиц ми е особено любима. Нейните неща са пример за единство между крехкостта на рисунката и овладяната форма. Това единство е първата крачка, която привлича вниманието на зрителя. След нея той може да бъде убеден във всичко друго, което иска да каже художникът.
Вие сте свързан с каузата за българската кирилица. Какво означава за Вас защитата на буквата, културна кауза ли е, или вече и антропологична?
Определено и антропологична. Отдалечаваме се от буквата с всеки изминал ден. Пишем все по-малко и все по-малко разбираме смисъла на красивия знак, нуждата от него. Влиянието на писмеността върху духа на човека е от най-сложните неща, затова тя е много консервативна област, но и много сложна. Старая се това знание да не стане жертва на ентропията. Всяка добре направена буква е стъпка в тази посока на устояване.
Има ли нещо, което сте искали да нарисувате, но поради една или друга причина никога не сте?
Има много такива неща. Трудно рисувам архитектура, а понякога много ми се иска. Това е черта на специфичния талант. Но човек не знае, може в следващия момент да се появи и нещо такова на листа.
For the last few months, we’ve been testing a range of security-focused LLMs on our own infrastructure. These LLMs help identify potential vulnerabilities in our own systems, so we can fix them – and they also show us what attackers are going to be able to do with the latest models.
None of these LLMs has captured more attention than Mythos Preview, from Anthropic. A few weeks ago, we were invited to use Mythos Preview as part of Project Glasswing. We soon pointed it at more than fifty of our own repositories – to see what it would find, and to see how it works.
This post shares what we observed, what the models did well and what they didn’t, and how the architecture and process around them needs to change, so they can be used at scale.
What changed with Mythos Preview
Mythos Preview is a real step forward, and it’s worth saying that plainly before getting into anything else. We’ve been running models against our code for a while now, and the jump from what was possible with previous general-purpose frontier models to what Mythos Preview does today is not just a refinement of what came before.
It’s a different kind of tool doing a different kind of work, and that makes a clean apples-to-apples comparison to earlier models difficult. So rather than trying to benchmark Mythos Preview against general-purpose frontier models, it’s more useful to describe what it can actually do, and two features that stood out across the work we did with Mythos Preview:
Exploit chain construction – A real attack rarely uses one bug. It chains several small attack primitives together into a working exploit. For instance, it might turn a use-after-free bug into an arbitrary read and write primitive, hijack the control flow, and use return-oriented programming (ROP) chains to take full control over a system. Mythos Preview can take several of these primitives and reason about how to combine them into a working proof. The reasoning it shows along the way looks like the work of a senior researcher rather than the output of an automated scanner.
Proof generation – Finding a bug and proving it’s exploitable are two different things, and Mythos Preview can do both. It writes code that would trigger the suspected bug, compiles that code in a scratch environment, and runs it. If the program does what the model expected, that’s the proof. If it doesn’t, the model reads the failure, adjusts its hypothesis, and tries again. The loop matters as much as the bugs it finds, because a suspected flaw without a working proof is speculation, and Mythos Preview closes that gap on its own.
Some of what we describe above is not entirely unique to Mythos Preview. When we ran other frontier models through the same harness, they found a fair number of the same underlying bugs, and in some cases they got further than we expected on the reasoning side too. Where they fell short was at the point of stitching the pieces together. A model would identify an interesting bug, write a thoughtful description of why it mattered, and then stop, leaving the actual chain unfinished and the question of exploitability open. What changed with Mythos Preview is that a model can now take those low-severity bugs (which would traditionally sit invisible in a backlog) and chain them into a single, more severe exploit.
Model refusals in legitimate vulnerability research
The Mythos Preview model provided by Anthropic, as part of Project Glasswing, did not have the additional safeguards that are present in generally available models (like Opus 4.7 or GPT-5.5).
Despite this, the model organically pushes back on certain requests – much like the cyber capabilities that made it useful for vulnerability hunting, the model has its own emergent guardrails that sometimes cause it to push back on legitimate security research requests. But as we found, these organic refusals aren’t consistent – the same task, framed differently or presented in a different context, could produce completely different outcomes as illustrated in the examples below.
Example of Mythos Preview pushing back on building a working proof of concept
For example, the model initially refused to do vulnerability research on a project, then agreed to perform the same research on the same code after an unrelated change to the project’s environment. Nothing about the code being analyzed had changed.
In another case, the model found and confirmed several serious memory bugs in a codebase, and then refused to write a demonstration exploit. The same request, framed differently, got a different answer, and even the same request can produce different outcomes across runs due to the probabilistic nature of the model. Semantically equivalent tasks can produce opposite outcomes depending on how and when they’re presented to the model.
This matters because while the model’s organic refusals/guardrails are real, they aren’t consistent enough to serve as a complete safety boundary on their own. That’s precisely why any capable cyber frontier model made generally available in the future must include additional safeguards on top of this baseline behavior – making it appropriate for broader use outside of a controlled research context like Project Glasswing.
The signal-to-noise problem
One of the hardest parts of triaging security vulnerabilities is deciding which bugs are real, which are exploitable, and which need fixing now. This was a hard problem even in the pre-AI world. AI vulnerability scanners and AI-generated code have made it worse, and at Cloudflare we’ve built multiple post-validation stages to deal with it.
Two factors dominate the noise rate:
Programming language – C and C++ give you direct memory control and, with it, bug classes – buffer overflows, out-of-bounds reads and writes – that memory-safe languages like Rust eliminate at compile time. We saw consistently more false positives from projects written in memory-unsafe languages.
Model bias – A good human researcher tells you what they found and how confident they are. Models don’t. Ask a model to find bugs, and it will find them, whether the code has any or not. Findings come back hedged with “possibly,” “potentially,” “could in theory,” and the hedged findings vastly outnumber the solid ones. That’s a reasonable bias for an exploratory tool. It’s a ruinous one for a triage queue, where every speculative finding spends human attention and tokens to dismiss, and that cost compounds across thousands of findings.
Mythos Preview represents a clear improvement here, particularly in its ability to chain primitives – combining multiple vulnerabilities into a working proof of concept rather than reporting them in isolation. A finding that arrives with a PoC is a finding you can act on, and it means far less time spent asking “is this even real?”
Our harnesses are deliberately tuned to over-report, so we see more (and miss less), which comes with a lot more noise. But at triage time, Mythos Preview’s output has noticeably higher quality: fewer hedged findings, clearer reproduction steps, and less work to reach a fix-or-dismiss decision.
Why pointing a generic coding agent at a repo doesn’t work
When we first started AI-assisted vulnerability research last year, our instinct was the obvious one: point a generic coding agent at an arbitrary repository and ask it to discover vulnerabilities. This approach works, in the sense that the model will produce findings, but it doesn’t work in producing meaningful coverage of a real codebase and identifying findings of value. There are two main reasons for this:
Context – Coding agents are tuned for one focused stream of work: building a feature, fixing a bug, writing a refactor. They ingest a lot of source code, hold a single hypothesis at a time, and iterate against it. That’s exactly the wrong shape for vulnerability research, which is narrow and parallel by nature. A human researcher picks one specific thing to look at and investigates it thoroughly. That one thing might be a single complex feature, transitions across security boundaries, or a specific vulnerability class like command injections, where attacker input ends up being run as a shell command. Then they do it again, for a different feature, security boundary, or vulnerability class, several thousand times across the codebase. A single agent session (even with subagents) against a hundred-thousand-line repository can cover maybe a tenth of a percent of the surface in a useful way before the model’s context window fills up and compaction kicks in – potentially discarding earlier findings that would have mattered.
Throughput – A single-stream agent does one thing at a time, but real codebases need many hypotheses against many components at once, with the ability to fan out further when something interesting turns up. You can drive a single agent harder, but at some point you stop being limited by the model and start being limited by the shape of the interaction itself. Using the model directly in a coding agent turns out to be fine for manual investigation when a researcher already has a lead and wants a second pair of eyes. However, it’s the wrong tool for achieving high coverage. Once we accepted that, we stopped trying to make Mythos Preview do the wrong job and started building the harness around it instead.
What a harness actually fixes
Four lessons came out of running the work at scale, and each one pointed to the need for a harness that manages the overall execution:
Narrow scope produces better findings – Telling the model “Find vulnerabilities in this repository” makes it wander. Telling it “Look for command injection in this specific function, with this trust boundary above it, here’s the architecture document and here’s prior coverage of this area” makes it do something much closer to what a researcher would actually do.
Adversarial review reduces noise – Adding a second agent between the initial finding and the queue – one with a different prompt, a different model, and no ability to generate its own findings – catches a lot of the noise that the first agent would miss if it just checked its own work. It turns out that putting two agents in deliberate disagreement is way more effective than just telling one agent to be careful.
Splitting the chain across agents produces better reasoning – Asking “Is this code buggy?” and “Can an attacker actually reach this bug from outside the system?” are two different questions, and the model is better at each one when you ask them separately, because each question is narrower than the combined version.
Parallel narrow tasks beat one exhaustive agent – Coverage improves when many agents work on tightly scoped questions and we deduplicate the results afterward, rather than asking one agent to be exhaustive.
Each of those observations is about model behavior, and put together they describe something that isn’t a chat interface anymore. It’s a harness that helps you achieve the final outcomes. The first steps to building a harness are simple, as you can ask the model to help, which is what we did. We used Mythos Preview to build on, tailor, and improve our original harnesses to suit its strengths.
An example of what a harness looks like in practice is described below.
Our vulnerability discovery harness
Here’s what our vulnerability discovery harness looks like, stage by stage. It was used to scan live code across our runtime, edge data path, protocol stack, control plane, and the open-source projects we depend on.
Stage
What it does
Why it matters
Recon
An agent reads the repository from the top down, fans out to subagents responsible for each subsystem, and produces an architecture document covering build commands, trust boundaries, entry points, and likely attack surface. It also generates the initial queue of tasks for the next stage.
Gives every downstream agent shared context. Cuts the wander problem.
Hunt
Each task is one attack class paired with a scope hint. Hunters (the agents that actually look for bugs) run concurrently, typically around fifty at once, each fanning out to a handful of exploration subagents. Each hunter has access to tools that compile and run proof-of-concept code in a per-task scratch directory.
This is where most of the work happens. Many narrow tasks in parallel, not one exhaustive agent.
Validate
An independent agent re-reads the code and tries to disprove the original finding. It uses a different prompt and has no ability to emit new findings of its own.
Catches a meaningful fraction of the noise the hunter wouldn’t catch when reviewing its own work.
Gapfill
Hunters flag areas they touched but didn’t cover thoroughly. Those areas get re-queued for another pass.
Counteracts the model’s tendency to drift toward attack classes it has already had success with.
Dedupe
Findings that share the same root cause collapse into a single record.
Variant analysis is a feature, not a way to inflate the queue with duplicates.
Trace
For each confirmed finding in a shared library, a tracer agent fans out (one instance per consumer repository), uses a cross-repo symbol index, and decides whether attacker-controlled input actually reaches the bug from outside the system.
Turns “there is a flaw” into “there is a reachable vulnerability.” This is the stage that matters most.
Feedback
Reachable traces become new hunt tasks in the consumer repositories where the bug is actually exposed.
Closes the loop. The pipeline gets better as it runs.
Report
An agent writes a structured report against a predefined schema, fixes any validation errors against that schema itself, and submits the report to an ingest API.
Output is queryable data, not free-form prose.
What this means for security teams
The loudest reaction to Mythos Preview from other security leaders has been about speed – scan faster, patch faster, compress the response cycle. More than one team we have spoken with is now operating under a two-hour SLA from CVE release to patch in production. The instinct is understandable: when the attacker timeline shortens, the defender timeline has to shorten with it. Faster is not going to be enough, and we think a lot of teams are about to spend a lot of time, effort, and money learning that the hard way.
Patching faster does not change the shape of the pipeline that produces the patch. If regression testing takes a day, you cannot get to a two-hour SLA without skipping it, and the bugs you ship when you skip regression testing tend to be worse than the bugs you were trying to patch. We learned a version of this when we tried letting the model write its own patches and watched a few go out that fixed the original bug while quietly breaking something else the code depended on.
The harder question is what the architecture around the vulnerability should look like. The principle is to make exploitation harder for an attacker even when a bug exists, so that the gap between when a vulnerability is disclosed and when it is patched matters less. That means defenses that sit in front of the application and block the bug from being reached. It means designing the application so that a flaw in one part of the code cannot give an attacker access to other parts. It means being able to roll out a fix to every place the code is running at the same moment, rather than waiting on individual teams to deploy it.
We also recognize this topic cuts both ways. The same capabilities that helped us find bugs in our own code will, in the wrong hands, accelerate the attack side against every application on the Internet. Cloudflare sits in front of millions of those applications, and the architectural principles described above are exactly the ones our products are built to apply on behalf of customers. We will share more on what that means for customers in the weeks ahead.
If your team is doing similar work and would like to compare notes, reach out to us at [email protected].
Our research with Mythos Preview was conducted in a controlled environment against our own code; every vulnerability surfaced through this work was triaged, validated, and remediated where action was needed under Cloudflare’s formal vulnerability management process.
This work was a team effort. Thanks to Albert Pedersen, Craig Strubhart, Dan Jones, Irtefa Fairuz, Martin Schwarzl, and Rohit Chenna Reddy for their contributions to the research, engineering, and analysis behind this blog post.
To provide the best experiences, we use technologies like cookies to store and/or access device information. Consenting to these technologies will allow us to process data such as browsing behavior or unique IDs on this site. Not consenting or withdrawing consent, may adversely affect certain features and functions.
Functional
Always active
The technical storage or access is strictly necessary for the legitimate purpose of enabling the use of a specific service explicitly requested by the subscriber or user, or for the sole purpose of carrying out the transmission of a communication over an electronic communications network.
Preferences
The technical storage or access is necessary for the legitimate purpose of storing preferences that are not requested by the subscriber or user.
Statistics
The technical storage or access that is used exclusively for statistical purposes.The technical storage or access that is used exclusively for anonymous statistical purposes. Without a subpoena, voluntary compliance on the part of your Internet Service Provider, or additional records from a third party, information stored or retrieved for this purpose alone cannot usually be used to identify you.
Marketing
The technical storage or access is required to create user profiles to send advertising, or to track the user on a website or across several websites for similar marketing purposes.
 Just a year ago, we launched AWS Transform for .NET, Mainframe and VMware workloads, the first agentic AI service purpose-built for modernizing enterprise applications at scale. At re:Invent 2025, we introduced AWS Transform custom, which enables organizations to modernize and transform code at scale using AWS-managed and custom transformations. You can upgrade language versions, migrate frameworks, optimize performance, and analyze code bases using transformations that are ready to use or can be customized to meet your organization’s specific requirements. We also introduced full-stack Windows modernization capabilities and Reimagine capabilities and automated testing functionality for mainframe.