Post Syndicated from The Atlantic original https://www.youtube.com/shorts/ycdlfImeJog
AWS Security Hub Extended: Why enterprise security products should sell themselves
Post Syndicated from Michael Fuller original https://aws.amazon.com/blogs/security/aws-security-hub-extended-why-enterprise-security-products-should-sell-themselves/
Our largest security services customers started the same way every customer does – with a click. They enabled Amazon GuardDuty, Amazon Inspector, AWS WAF, and AWS Security Hub, experienced the benefits in real time, and evaluated with transparent pay-as-you-go pricing. No RFP. No six-month evaluation. No multi-year commitment up front. Our field teams played a critical role in that growth, not by selling the first click, but by building the trusted relationships that turned early adoption into deep, long-term commitment. We believe customers should have this same frictionless adoption experience and flexibility for all best-in-class security products and that’s why we developed Security Hub Extended.
In our first post, we introduced Security Hub Extended, a significant expansion of Security Hub that brings together curated partner solutions in a single, unified experience. In our second post, we walked through how it works technically, including the onboarding flow, the pricing model, the unified operations layer built on the Open Cybersecurity Schema Framework (OCSF). In this post, I want to step back and talk about why we built it the way we did and why I believe the way enterprises discover, evaluate, and adopt security solutions is ready for a fundamental shift.
The shift
If you’ve ever tried to evaluate a new enterprise security product, you know the drill. Request a demo. Wait. Take the demo. Request a PoC. Wait for professional services (or your team to stop building) to set it up. Negotiate pricing, which isn’t published, so you’re starting blind. Loop in procurement. Sign a multi-year commitment. Then, months later, find out whether the product actually solves your problem in your unique environment.
Meanwhile, an ambitious security engineer on your team has already spun up an open-source tool, connected real data, and knows in two hours whether it’s going to work for your use cases. They didn’t need a slide deck. They needed a solution they could put their hands on.
A Fortune 500 CISO recently told me: “I spent 9 months procuring a security solution and it still doesn’t work the way the demo showed.” That frustration isn’t unique. It’s the norm.
This isn’t a criticism of the sales motion. Sales-led has evolved for good reason. Enterprise procurement is complex, products need customization, customers need support. I respect the craft and have poured a significant portion of my career into trying to perfect it. Even the most product-driven companies still need great sales, marketing, field enablement, and support.
It doesn’t change the fact that threats are evolving constantly, and defenders need the flexibility to discover and deploy new solutions as fast as the landscape shifts. Having the best solutions discoverable and deployable in that moment of need isn’t just a convenience, it’s a competitive advantage that customers are demanding. A new threat emerges, security teams have access to industry-leading solutions, and in a few clicks they’ve found their answer and are already seeing value. That’s the model every security company should be building toward.
What we’ve learned at AWS
At AWS, we’ve spent two decades learning what it takes to let customers adopt complex enterprise technology on their own terms, at massive scale. We haven’t always gotten it right, but we learn fast and adjust. The result is one of the largest cloud businesses in the world. I bring up that scale for one reason. It’s proof that complex, enterprise-grade technology can be adopted without requiring a traditional procurement gauntlet. Compute, storage, databases, AI/ML, networking, and yes, security — adopted all through a console, on each customer’s own timeline, and scaled when they were ready.
The proof is in the adoption
Amazon GuardDuty, Amazon Inspector, AWS Shield, AWS Security Hub are all available through the AWS Management Console. All pay-as-you-go. All activated with a click. Tens of thousands of customers rely on these security services today. When you make it easy to get started and deliver outcomes that earn confidence, expansion follows naturally.
These are sophisticated, enterprise-grade security solutions. And customers, from two-person startups to the world’s largest financial institutions, adopt them the same way. They try it, see the value, expand, and lean on the AWS team to go deeper.
We didn’t get here by accident, and we definitely didn’t get here without making mistakes. Building products that can be adopted and scaled on their own, without a sales engineer explaining away UX problems, without a solutions architect doing the first deployment, requires a different kind of product mindset. Time-to-value becomes your most important metric. Onboarding friction becomes your biggest enemy. Transparent pricing becomes non-negotiable. It’s hard. We’ve gotten a lot wrong along the way. And we’re still iterating.
But the results are clear. When customers adopt based on experience rather than commitment, they don’t just stay, they expand. They bring their teams. They become advocates. I’ve spent 15 years at AWS, the last 10 building security services like GuardDuty and Security Hub. When we launch a new security service or major feature, we consistently see rapid organic adoption at a pace that would be impossible through traditional sales cycles alone. These products are built to deliver value the moment customers turn them on and we make that as easy as we possibly can. That’s the scale a product-led motion unlocks.
Security Hub Extended
So, we asked ourselves: why can’t we build a similar approach that can expand to include industry leading partner solutions? Why can’t the CrowdStrikes, the Splunks, the Zscalers, and the fast-growing innovators solving tomorrow’s problems like Cyera, Noma, and 7AI also reach customers with the same frictionless motion that AWS services enjoy? Why can’t a security team that discovers a new threat on Monday have a proven solution deployed and delivering value by Tuesday? Our partners have built incredible products. What they haven’t always had is an avenue to put those products directly in the hands of the customers who need them most, at the moment they need them, at scale, in a way that feels as natural as turning on an AWS service. Not by replacing how our partners build or sell, but by giving them infrastructure that lets their products speak for themselves.
That’s what Security Hub Extended is. Security teams already using Security Hub can discover curated partner solutions right alongside their AWS security services. One click to evaluate, one click to deploy, pay-as-you-go pricing on your existing AWS bill with Enterprise Discount Program (EDP) discounts automatically applied. No separate procurement cycle. No long-term commitments required. Start fast, validate at scale, and commit for deeper discounts when you’re ready, versus making a three-year bet based on a few months of testing.
For customers, industry-leading enterprise security solutions become as easy to adopt as GuardDuty or WAF. For our partners, Security Hub Extended is a growth channel where the product leads and the customer experience mirrors what we’ve spent 20 years building at AWS. For the industry, it’s an invitation to reimagine what the relationship between a security product and a security practitioner can look like when you remove the friction standing between them.
But Security Hub Extended isn’t just a simpler way to buy security products. It’s a unified solution. When a customer enables a solution through Extended, we’re working toward an experience where AWS handles the rest. Sensors that deploy automatically across Amazon EC2, Amazon EKS, and AWS Fargate workloads using the same mechanism that powers GuardDuty Runtime Monitoring. IAM roles that provision across a customer’s Organization in one click. Resource inventory is automated from day one – S3 buckets, databases, AI workloads – without manual work.
Once enabled, solutions in Security Hub Extended emit findings in OCSF, automatically aggregated in Security Hub alongside findings from GuardDuty, Amazon Inspector, and every other AWS security service. Security Hub applies risk scoring and correlated risk analytics across all of them. AWS-native and third-party findings together, weighted and prioritized as a single view of your security posture. For example, an endpoint detection from CrowdStrike, correlated with a credential theft in GuardDuty, and a data access event from Cyera, produces an attack path that none of those solutions can produce alone. The correlation uses AWS context (IAM topology, VPC exposure, resource criticality) to improve the context of each attack path for security analysts. Deploying a solution through Security Hub Extended doesn’t add another pane of glass. It deepens the intelligence of the one you already have.
We’re also building toward automated response. Customers will be able to opt in to pre-built playbooks that take action through AWS-native services when a threat is detected, such as isolating compromised resources, revoking credentials, or containing active threats. The goal is detect-to-respond in seconds, not the hours it takes to context-switch across five consoles and two ticketing systems.
Where we are and where we’re headed
We’re still in the first inning — or Day 1, as we like to say at Amazon. We launched in February 2026 with 14 partners, now 21, spanning endpoint, identity, email, network, data, browser, cloud, AI, and security operations, and we’re continuously working backwards from customers as we operationalize for scale. We are building this because our customers asked for it. We’re learning alongside our partners and customers every week, identifying what works, what needs improvement, where the friction still lives, and iterating quickly.
We’re building and delivering at the speed of our customers. That means shipping fast, iterating faster, and not waiting for perfection. We’re not where we want to be just yet, and we need your feedback to get us there. What’s encouraging is that our partners aren’t waiting to be asked. They’re investing in this alongside us. Not because we’re demanding it, but because they see the same thing we do, that companies that make it effortless for customers to get started are the ones that will win at scale.
The early signals are encouraging. Customer response has exceeded our expectations, and the feedback we hear most often is that the procurement simplification and flexibility of pay-as-you-go with public pricing alone, even before the unified operations and data normalization benefits, is a meaningful differentiator.
If you’re a security leader: Security Hub Extended is live now. Log into Security Hub, look for the Security Hub Extended Plan (or visit the Security Hub Extended Pricing Page), and explore what’s available for your use cases. Start with what solves your most urgent problem. Pay-as-you-go, no commitment. Your team will tell you if it’s working in days, not months.
The vision is bigger than what’s live today, and we’re iterating fast. Share your feedback on AWS re:Post for Security Hub, reach out through contact AWS Support, or connect with me directly.
Cyber resilience on AWS: A reference approach for recovery from ransomware and destructive events
Post Syndicated from Ashish Panwar original https://aws.amazon.com/blogs/architecture/cyber-resilience-on-aws-a-reference-approach-for-recovery-from-ransomware-and-destructive-events/
Cyber resilience is the ability to recover workloads to a known-good state after an adversary has affected the environment. Prevention works to keep threat actors out and detection works to find them quickly. Cyber resilience focuses on recovery: restoring a trustworthy environment when backups, credentials, or parts of the infrastructure can no longer be assumed to be safe.
For organizations running critical workloads on AWS, ransomware, data extortion, and other destructive events are increasingly central to recovery planning. The recovery environment and backups that recovery strategies depend on could themselves be targets of these events. This post is written for teams building recovery capabilities for these scenarios.The post walks through a reference pattern for isolating recovery from production, describes how AWS Backup logically air-gapped vaults provide deletion-protected backup storage, and presents a validation pipeline that checks whether a backup is recoverable and safe to use. It then lays out a concrete recovery workflow with parallelizable stages, introduces the Rebuild-Restore-Rotate framework for deciding what to recover from code, from backup, or to generate fresh, and addresses how to select the right recovery point when the most recent backup might carry the same threat that triggered the event.
Isolating recovery from production
The core architectural idea in cyber resilience is that the recovery environment, including its identities, keys, and network paths, shouldn’t share a trust boundary with the environment being recovered. If production identity is compromised, recovery must be able to proceed without depending on it.Most customers achieve this using separate AWS accounts inside an AWS Organization. A common pattern uses three account roles:
Production Accounts
The production account is where workloads run. If a cyber event is confirmed, these accounts are isolated for investigation. Recovery work doesn’t happen in production, because in some scenarios remediation in place may not fully restore trust.
Recovery Account
The recovery account owns the AWS Backup logically air-gapped vault. Most AWS-native backup mechanisms produce recovery points that are inherently immutable. You can’t modify an Amazon Elastic Block Store (Amazon EBS) snapshot or an Amazon Relational Database Service (Amazon RDS) snapshot after creation. The logically air-gapped vault adds deletion protection. Recovery points can’t be deleted or have their retention period shortened by any principal, including the account root user or a compromised administrator, within the retention period. This account’s purpose is to keep the controls around backups safe. It’s where you configure who can share the vault, who can initiate a restore, and who approves a restore operation through Multi-party approval (MPA). Keeping these controls in a dedicated account, restricted to backup operations by Service Control Policies, means a compromised identity in a production account cannot modify them.
Isolated Recovery Environment (IRE)
Where backups are restored, validated, and the new production environment is rebuilt before cutover. The IRE is kept separate from the Production Account so that if a restored backup still contains the threat, it has nowhere to spread. It has no trust relationship to the Production Account, no VPC peering to it, and no internet-facing resources, so a tainted restore discovered during validation stays contained inside the IRE instead of reaching back into production or out to the internet. Infrastructure deployment in the IRE uses VPC endpoints (AWS PrivateLink) to reach AWS service APIs without internet connectivity or VPC peering to production. The following diagram shows how the three account roles relate to each other within a single AWS Organization, including their trust boundaries and the flow of recovery points between them.
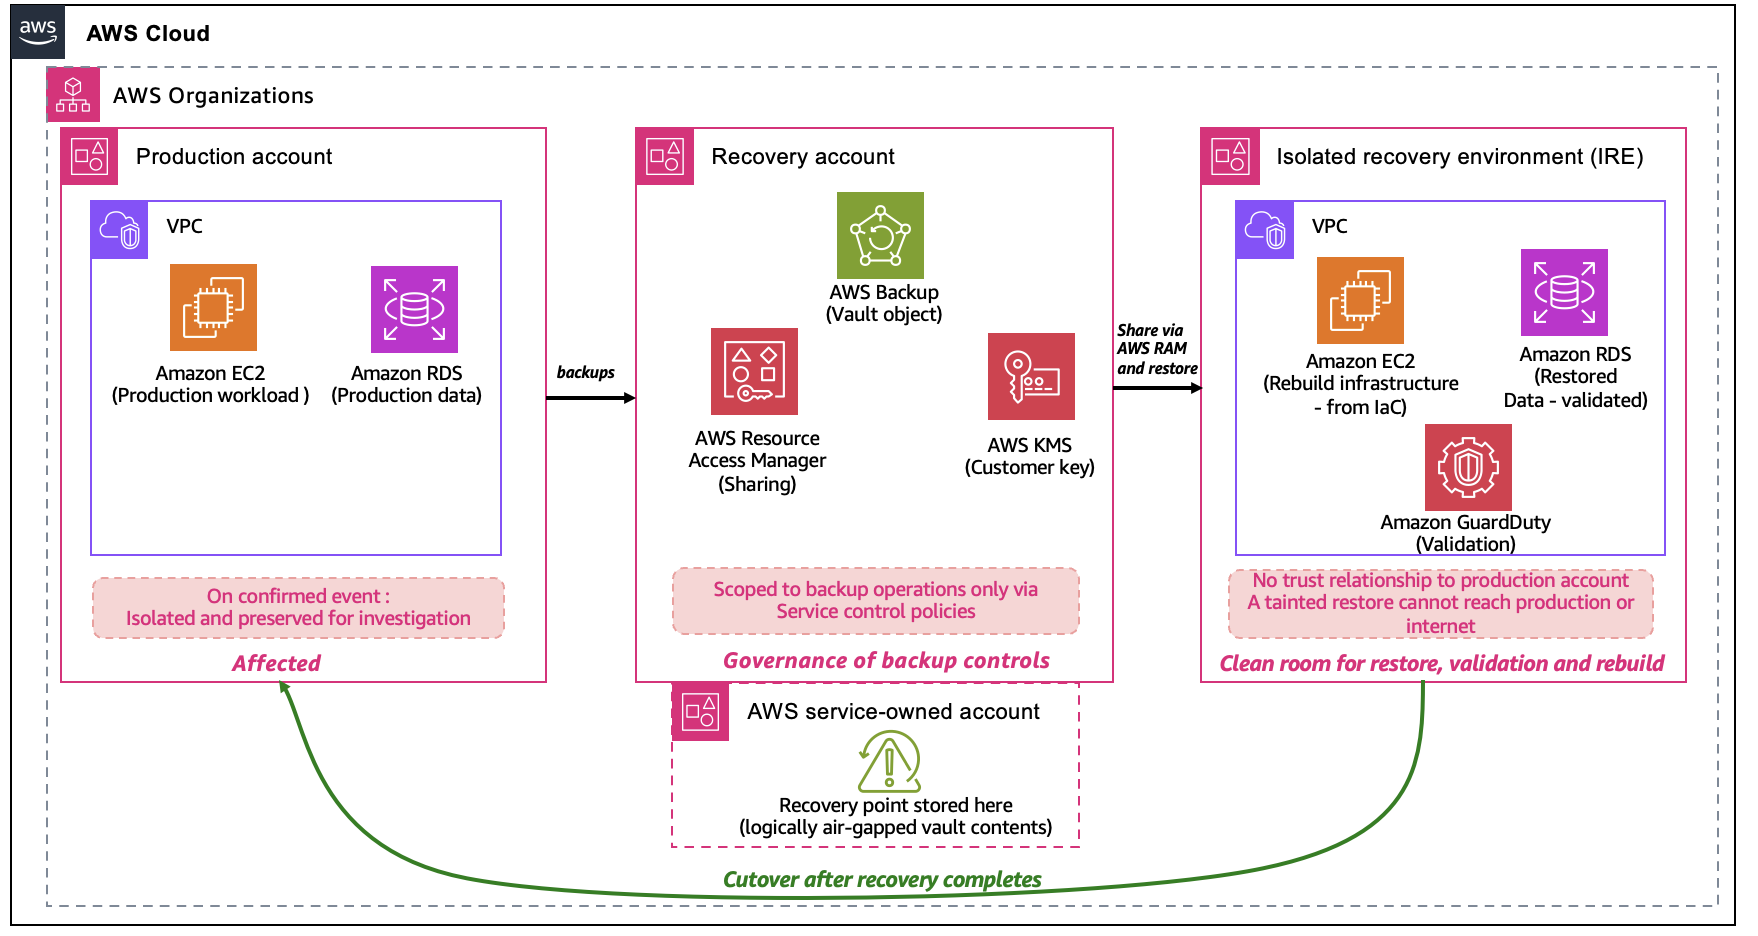
Figure 1. The Production Account is isolated after a confirmed event. The Recovery Account owns the logically air-gapped vault and controls restore authorization through Multi-party approval. The IRE has no trust relationship or network path to production.
Best practices for the AWS Backup logically air-gapped vault
The AWS Backup logically air-gapped vault is the primary AWS-native option for protecting backup storage from deletion.
Use the vault for what it provides, which is deletion protection enforced by the service. A logically air-gapped vault is always locked in Compliance mode. The service itself enforces retention, so recovery points can’t be deleted by any principal, including the account root user or a compromised administrator, within the retention period. Deletion protection keeps the recovery point available when needed. Whether the recovery point is safe to use is determined by the validation pipeline described in the following section.
Understand where recovery points live. A logically air-gapped vault stores recovery points in AWS service-owned accounts. You can choose to encrypt these recovery points with either a service-owned key or an AWS Key Management Service (AWS KMS) customer managed key. The vault object in your Recovery Account is the governance and access boundary where sharing, restore authorization, and Multi-party approval are configured. This separation is what makes the air-gap logical rather than network-based.
Share recovery points through AWS Resource Access Management (AWS RAM) for restore. You share recovery points across accounts through AWS RAM. You can initiate restores from the owning account or from any account with which you share the vault. This is how the Recovery Account makes recovery points available to the IRE.
Configure Multi-party approval for restore. MPA, configured through IAM Identity Center, requires a predefined set of approvers before a restore proceeds. This is particularly valuable when the source account might no longer be trusted.
Back up fully managed resources directly to the vault. AWS Backup supports the logically air-gapped vault as a primary backup target for fully managed resources (Amazon Simple Storage Service (Amazon S3), Amazon DynamoDB, Amazon Elastic File System (Amazon EFS)), so backups can be written directly to the vault without staging in a standard vault first. Non-fully-managed resources (Amazon EBS, Amazon Aurora, Amazon FSx) use an intelligent orchestration path where the service creates and transfers a temporary snapshot.
For S3 data outside the vault’s supported resource set, Amazon S3 Object Lock in Compliance mode paired with S3 Versioning provides equivalent deletion protection at the S3 layer.
Validation pipeline
A successful restore confirms that the backup was readable. Validation confirms that it’s safe to use. No single check catches everything, which is why validation combines several layers.For ransomware, a malware scan on the restored volume catches known encryption tools and indicators. For threats that have been present in the environment for some time, a malware scan isn’t enough because the attacker might have modified legitimate code, configuration, or data in ways that look normal to a scanner. These kinds of changes show up through workload-specific checks, such as a database consistency check failing, an application invariant being violated, or a configuration diff showing an unexpected change against a known-good baseline. Log and audit review across the backup window helps identify unexpected identity or configuration changes that neither a malware scan nor a workload check would catch on their own.The layers commonly combined into a validation pipeline:
| Layer | Capability | What it provides |
| AWS native | AWS Backup Restore Testing | Automated verification that backups are recoverable, with custom hooks via the PutRestoreValidationResult API |
| AWS native | Amazon GuardDuty Malware Protection | Malware scanning on restored volumes |
| AWS Partner | AWS Marketplace partner solutions | Content-level ransomware scanning inside backup contents, without requiring a full restore first |
| Workload-specific | Integrity and consistency checks | Database consistency, application invariants, configuration diffs against known-good baselines |
| Cross-cutting | Log and audit review | Identify unexpected identity or configuration changes across the backup window using AWS CloudTrail and workload logs |
Both AWS-native validation and workload-specific validation should pass before a recovery point is approved. Validation happens in the IRE so that if any check detects a problem, the affected restore is contained inside the IRE and doesn’t reach production.AWS backup mechanisms operate independently per service, so recovery points for different services might not be precisely time-synchronized. Aligning backup schedules as tightly as possible and including cross-service consistency checks in the validation pipeline reduces this gap.
Selecting a safe recovery point
For most operational recoveries, the most recent backup is the right one. For cyber events and for data corruption more generally, the most recent working copy is often a better target. If an adversary was present in the environment before detection, backups taken during that window might carry the same issues.
The following diagram illustrates how recovery point candidates are evaluated against the compromise boundary to identify the most recent backup that’s safe to use.
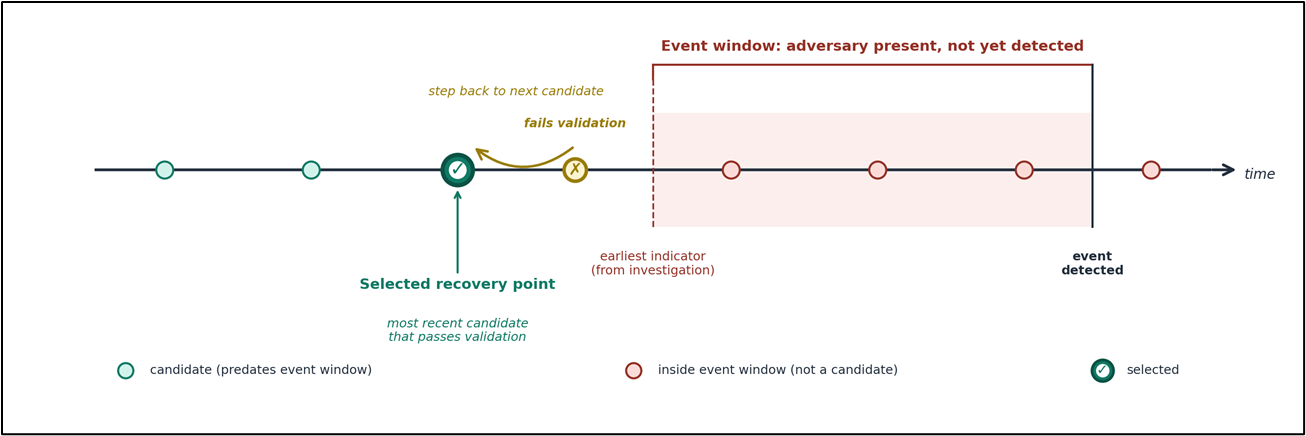
Figure 2. Candidates are evaluated in reverse chronological order starting from the most recent backup that predates the event boundary, with each passing through the validation pipeline before approval.
- Building an investigation timeline from AWS CloudTrail, Amazon Virtual Private Cloud (Amazon VPC) Flow Logs, Amazon GuardDuty, AWS Security Hub, and workload logs, to identify the earliest plausible indicator of the event.
- Evaluating recovery point candidates in reverse chronological order, starting from the most recent backup that predates the event window.
- Running the validation pipeline against each candidate. If validation fails, stepping back to the next candidate.
- Approving the chosen recovery point with documentation of the approver and rationale.
Backup retention should include recovery points that predate realistic detection windows in your organization. Detection timing varies widely by organization and by threat type, so this is a number to set based on your own investigation capabilities and to revisit as those mature.
Recovery workflow
Recovery has five stages. Three of them run at the same time because the slowest path through recovery is what determines how long the business is down. Investigation and validation run in parallel with infrastructure rebuild so the new environment is being built while the recovery point is being chosen. We wait to restore data because restoring untrusted data into a new environment defeats the purpose of the validation. The following diagram shows which stages run in parallel and where the approval gate separates validation from data restore.
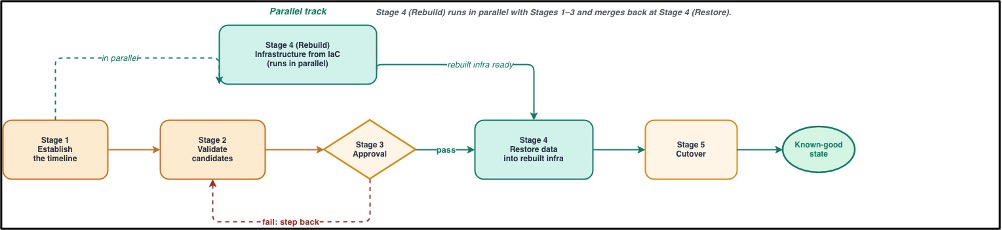
Figure 3. Stages 1, 2, and 4 (investigation, validation, and infrastructure rebuild) run in parallel. Stage 3 (approval) is the gate before validated data is restored into the rebuilt environment.
- Stage 1: Establish the timeline. Query AWS CloudTrail, Amazon VPC Flow Logs, Amazon GuardDuty findings, AWS Security Hub, and workload logs to identify the earliest indicator of the event. That timestamp becomes the event boundary, and only recovery points created before it are candidates for restore. AWS Security Incident Response (SIR) can provide coordinated triage and response support for this stage.
- Stage 2: Validate candidates. Run the validation pipeline against recovery points that predate the event window, in reverse chronological order. If the most recent candidate fails validation, step back to the next one. This stage runs in parallel with Stage 1, because the investigation and the validation checks don’t depend on each other.
- Stage 3: Approval. Approve only recovery points that pass all validation checks. If the vault is configured with Multi-party approval, the predefined approvers authorize the restore, and the approval action is automatically recorded as an AWS CloudTrail management event. Document the rationale for recovery point selection: investigation findings, validation results, and the basis for the decision, in your incident management process. If validation fails on the chosen candidate, return to Stage 2 with an earlier one.
- Stage 4: Rebuild and restore. Rebuild infrastructure in the IRE from infrastructure as code (IaC) templates stored in a separate, version-controlled repository. Rebuild runs in parallel with Stages 1 and 2. After Stage 3 approves a recovery point, restore the validated data from the logically air-gapped vault into the rebuilt infrastructure. Apply credential rotation during this stage following the Rebuild-Restore-Rotate framework.
- Stage 5: Cutover. Move production traffic from the affected environment to the rebuilt one. Use DNS records with health checks so traffic only shifts when the new environment is ready to serve it. Before cutover, identify and update cross-account references that point to the original Production Account, IAM role trust policies, resource-based policies, AWS KMS key grants, and service integrations. IAM Access Analyzer and AWS Config can help identify these dependencies. Monitor the transition and keep the affected Production Account isolated until the investigation is complete.
The Rebuild-Restore-Rotate framework
Cyber recovery requires sorting what gets rebuilt from code, restored from backup, and generated fresh:
Infrastructure is code. Data is backup. Credentials are new.
| Category | Examples | Why |
| Rebuild from code | IAM policies and roles, Security Groups, Amazon EC2, Amazon VPC, AWS Lambda, CI/CD pipeline definitions | Configurations come from reviewed, version-controlled templates rather than from a backup that may have been affected |
| Restore from backup | Amazon RDS, Amazon Aurora, Amazon EFS, Amazon EBS, Amazon FSx | Business data cannot be recreated from code and must come from validated, immutable backups |
| Rotate or re-issue | IAM access keys, database passwords, API keys, certificates, OAuth tokens, SSH keys | Any secret that may have been exposed during the event window is replaced, not carried forward from backup |
Some services sit across two categories. For example, Amazon S3 buckets and Amazon DynamoDB tables have both configuration (rebuilt from code) and data inside them (restored from backup), so recovery treats the two layers separately. Similarly, some credentials are re-issued by AWS rather than rotated by you. For example, consider service-linked roles and STS session tokens. The framework still applies, it’s just AWS that issues them fresh. Other data stores aren’t backed up at all because they are derived from sources that are backed up. Search indexes, analytics tables, caches, and materialized views are common examples. These regenerate from restored data, so they are a recovery dependency rather than a separate recovery category but they must be included in the recovery runbook and sequenced after the data they depend on has been restored. The framework assumes that your source of configuration, including IaC templates, pipelines, and source repositories, wasn’t itself the target of the attack. If it was, recovery starts further upstream with a trusted copy of source before rebuild can begin. Knowing where your known-good source of configuration lives, and how it is protected, is worth thinking through in advance.
For credential rotation, the practical prerequisite is a rotation process that already exists and is exercised. AWS Secrets Manager rotation, IAM Identity Center session revocation, AWS Certificate Manager renewal, and workload-specific rotation hooks are components most customers already have in some form. The cyber recovery capability is the ability to invoke that rotation comprehensively and verify that nothing was missed.
For services not currently supported by the logically air-gapped vault, Cross-Region Replication to a locked bucket or service-native point-in-time recovery can serve as interim options. These are recovery-oriented copies rather than tamper-proof storage and should be treated accordingly when designing around them.
Next steps
The following steps provide a starting point for teams building cyber recovery capability. Each step can be implemented incrementally, but together they form the operational foundation for the recovery workflow described in this post.
- Create a logically air-gapped vault in a dedicated Recovery Account, and configure Multi-party approval for restore operations.
- Establish an Isolated Recovery Environment in advance, with no trust relationship to production and no network path into the production environment. Pre-configure the networking, monitoring, and access controls required for recovery operations. Use SCPs to enforce isolation.
- Enable AWS Backup Restore Testing on a regular schedule, and enable Amazon GuardDuty Malware Protection for backup and volume scanning.
- Define workload-specific integrity checks for business-critical data (database consistency, application invariants, configuration diffs).
- Confirm the credential rotation process works end-to-end and can be invoked as part of recovery, not only on a routine schedule. AWS Secrets Manager rotation provides the automation framework for database passwords and API keys.
- Map cross-account dependencies (IAM role trust policies, resource-based policies, AWS KMS key grants, and service integrations) and maintain the inventory in your recovery runbook.
- Exercise the full workflow, including investigation, validation, rebuild, restore, and cutover, on a regular schedule.
Conclusion
Cyber resilience on AWS builds on the services and patterns customers already use for recovery, with additions that address the specific concern that the production environment, the backups, or the recovery path itself may not be trustworthy after an event. The reference approach in this post, including isolation of recovery from production, deletion protected backup storage, a validation pipeline, a concrete workflow, and the Rebuild-Restore-Rotate framework, is a starting point. How you adapt it depends on your workloads, your existing recovery posture, and your organizational boundaries.
About the authors
Structured Settlements & Factoring Companies #lastweektonight
Post Syndicated from LastWeekTonight original https://www.youtube.com/shorts/yDKU1umDsZo
Two Offices, One 5G Connection — This Network Install Was Genius
Post Syndicated from Crosstalk Solutions original https://www.youtube.com/watch?v=mL7YvSkL608
Trump’s Iran War: America’s Loss Is China’s Win | The David Frum Show
Post Syndicated from The Atlantic original https://www.youtube.com/watch?v=TLjlyITajyo
On AI Security
Post Syndicated from Bruce Schneier original https://www.schneier.com/blog/archives/2026/05/on-ai-security.html
Good report:
Executive Summary: Let’s say you wanted to make sure that your AI is secure. Can you just maximize the security and privacy benchmark and call it a day? Nope, because benchmarks don’t actually work for measuring AI capabilities (even when they are NOT emergent systemic properties like security). So let’s take a step back: how do you measure security in the first place? Good question. Over the last 30 years, security engineering for software evolved from black box penetration testing, through whitebox code analysis and architectural risk analysis to de facto process-driven standards like the Building Security In Maturity Model (BSIMM). Software had a very deep impact on business operations, and it appears that AI is going to have an even deeper impact. Will a software security-like measurement move work for AI? Probably. In the meantime we can make real progress in AI security by cleaning up our WHAT piles and managing risk by identifying and applying good assurance processes. (Spoiler alert: no matter what we do, we still don’t get a security meter for AI, so we need to be extra vigilant about security.)
[$] What is to be done about MGLRU?
Post Syndicated from corbet original https://lwn.net/Articles/1072866/
“Reclaim” is the task of finding memory that can be taken away from its
current user and put to better uses within the system; it is a core part of
the memory-management picture. The addition of the multi-generational LRU (MGLRU) was meant to
provide a better reclaim implementation than the “traditional LRU” that
preceded it, but MGLRU has complicated the situation instead. No fewer than
three memory-management-track sessions at the 2026 Linux Storage,
Filesystem, Memory Management, and BPF Summit were focused on MGLRU,
with an eye toward integrating it more fully, improving its performance,
and addressing some problems encountered with Android systems.
Security updates for Wednesday
Post Syndicated from corbet original https://lwn.net/Articles/1073713/
Security updates have been issued by AlmaLinux (kernel, libpng, nginx, nginx:1.24, ruby, and ruby:3.3), Debian (gnutls28 and linux-6.1), Fedora (dnsmasq, kernel, keylime-agent-rust, perl-Net-CIDR-Lite, python-pysam, python-urllib3, rust-cargo-vendor-filterer, rust-ingredients, rust-oo7-cli, rust-rpki, rust-sevctl, and rust-tealdeer), Mageia (bind), Oracle (bind, giflib, gimp:2.8, kernel, libpng, rsync, ruby, and vim), Slackware (haveged and mozilla), SUSE (cockpit, dnsmasq, erlang26, freeipmi, git-bug, glibc, GraphicsMagick, haveged, ImageMagick, iproute2, kernel, openssh, perl-CryptX, perl-HTTP-Tiny, postgresql14, postgresql15, postgresql16, python-Pillow, rsync, tiff, and traefik), and Ubuntu (Highlight.js, linux, linux-aws, linux-aws-5.15, linux-aws-fips, linux-fips, linux-gcp,
linux-gcp-fips, linux-gke, linux-gkeop, linux-hwe-5.15, linux-ibm,
linux-ibm-5.15, linux-intel-iotg, linux-intel-iotg-5.15, linux-kvm,
linux-nvidia, linux-nvidia-tegra, linux-nvidia-tegra-5.15, linux-oracle,
linux-raspi, linux-realtime, linux, linux-aws, linux-aws-fips, linux-bluefield, linux-fips, linux-gcp,
linux-gcp-5.4, linux-gcp-fips, linux-ibm, linux-ibm-5.4, linux-kvm,
linux-oracle, linux-oracle-5.4, linux-xilinx-zynqmp, linux, linux-aws, linux-aws-fips, linux-fips, linux-gcp-4.15,
linux-gcp-fips, linux-kvm, linux-oracle, linux, linux-aws, linux-aws-fips, linux-gcp, linux-gcp-fips, linux-gke,
linux-gkeop, linux-ibm, linux-ibm-6.8, linux-lowlatency,
linux-lowlatency-hwe-6.8, linux-raspi, linux-raspi-realtime,
linux-realtime, linux-realtime-6.8, linux, linux-aws, linux-hwe-6.17, linux-oem-6.17, linux-oracle,
linux-raspi, linux-realtime, linux-realtime-6.17, and smarty3).
Comic for 2026.05.20 – Stickers
Post Syndicated from Explosm.net original https://explosm.net/comics/stickers
New Cyanide and Happiness Comic
Operationalizing CTEM Faster: Build Surface Command Dashboards in Minutes
Post Syndicated from Ed Montgomery original https://www.rapid7.com/blog/post/em-operationalizing-ctem-building-surface-command-dashboards
Modern attack surfaces don’t sit still.
Cloud expansion, SaaS sprawl, identity complexity, and shadow IT are continuously reshaping organizational risk. For security leaders, visibility isn’t the challenge anymore, but actually operationalizing that visibility is.
Surface Command was built to unify asset and identity intelligence across your external attack surface. But translating that intelligence into executive-ready dashboards or operational reporting has often required knowledge of Cypher queries.
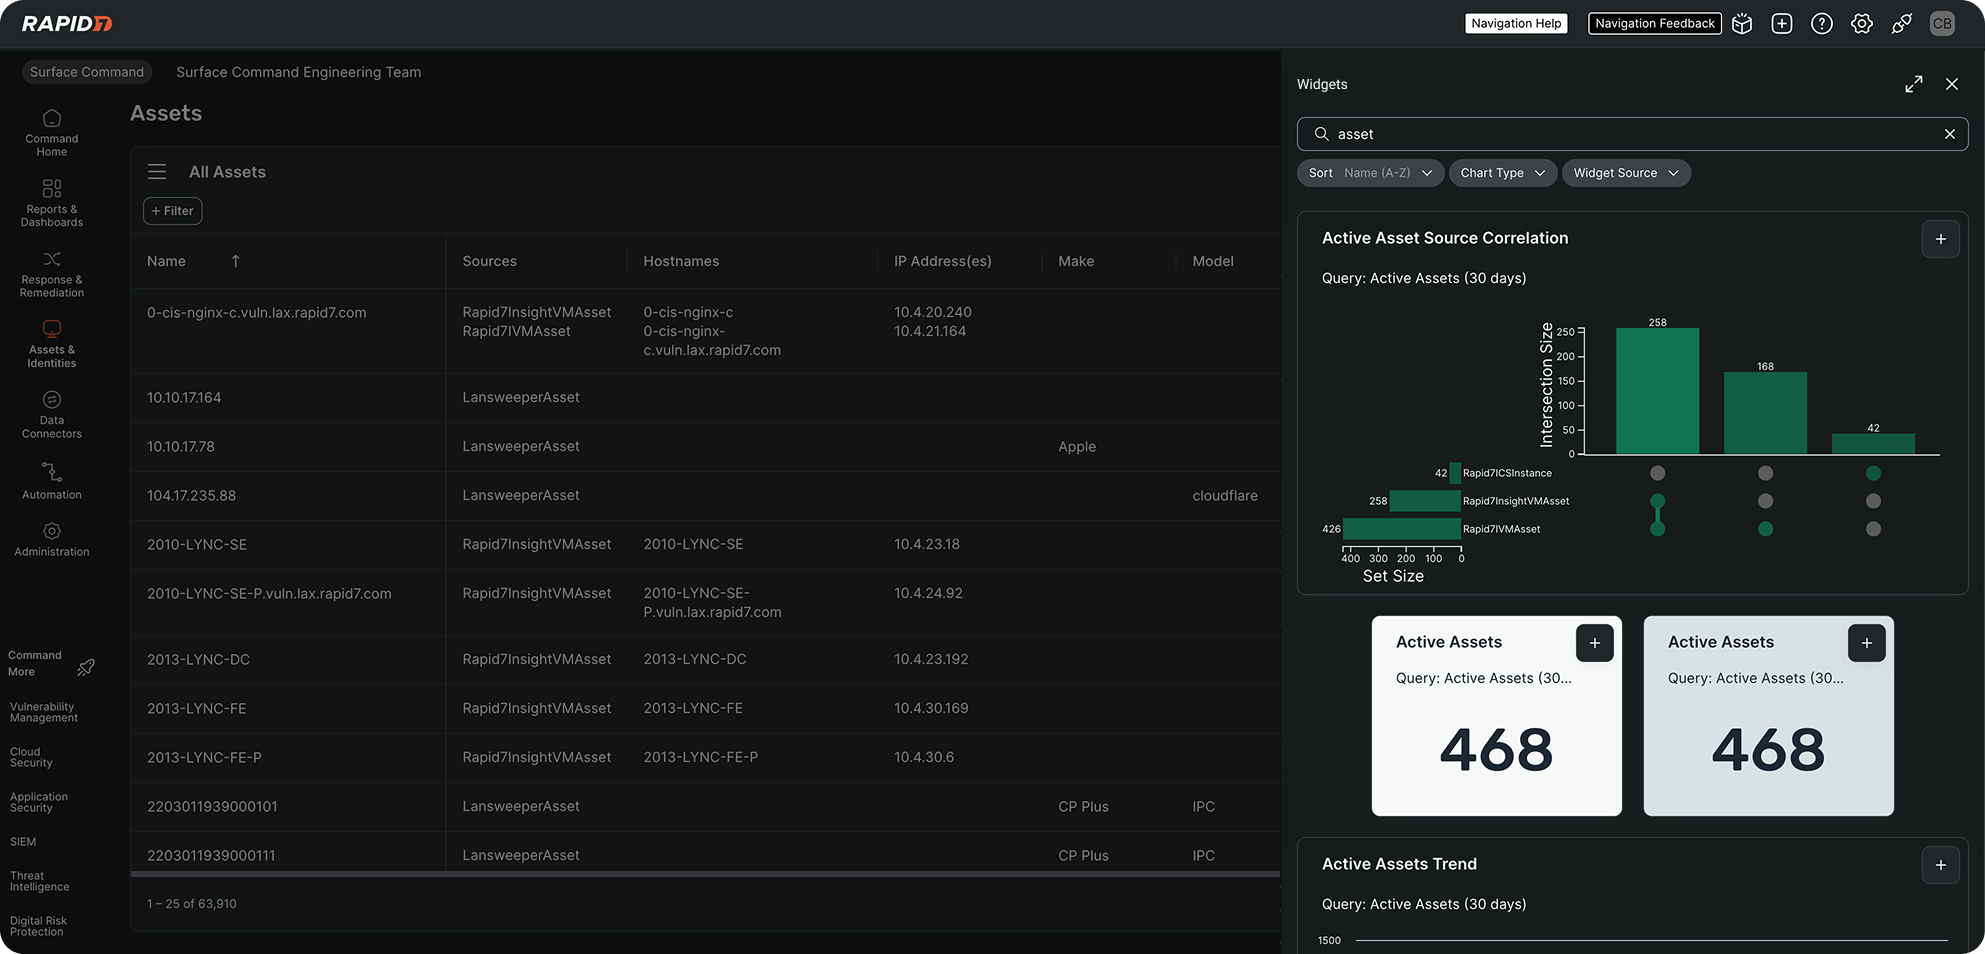
Today, that changes: We’re introducing filter-based dashboard widgets in Surface Command, enabling teams to build meaningful attack surface management (ASM) dashboards in minutes, without writing a single query.
And for CISOs focused on advancing continuous threat exposure management (CTEM), this is more than a usability enhancement. It’s an operational accelerator.
From filters to dashboards, instantly
Security teams already use saved asset and identity filters to answer critical questions:
-
Which internet-facing assets are high risk?
-
Where do privileged identities intersect with exploitable exposures?
-
Which business units own unmanaged cloud infrastructure?
-
What third-party SaaS applications expand our attack surface?
Now, those same saved filters can be converted directly into live dashboard widgets. If your team can build a filter table, they can now build a dashboard.
There’s no need to understand query syntax or rely on specialized expertise for common reporting needs. With just a few clicks, exposure views become shareable, persistent dashboards built on the same unified data model that powers Surface Command.
Reducing friction in exposure reporting
For many organizations, the barrier to effective exposure management isn’t visibility, it’s friction. When dashboard creation requires query expertise, reporting slows down, operational teams depend on a small group of power users, executive visibility lags behind exposure reality, and CTEM initiatives stall under complexity.
Filter-based widgets remove that bottleneck. Security teams can now spin up exposure dashboards in minutes, empower analysts and vulnerability teams to self-serve, deliver consistent reporting to leadership, and standardize exposure views across business units.
This lowers the barrier to building and maintaining exposure intelligence across the organization, and that matters when “continuous” is the goal.
A practical enabler for continuous threat exposure management (CTEM)
Beyond a framework, CTEM is a discipline. One that treats exposure management as an ongoing cycle, not a point-in-time project. CTEM is commonly organized into five continuous steps:
-
Scope – Define what you’re focusing on (systems, business services, exposure themes, time horizons).
-
Discover – Identify the assets, identities, and exposures within scope.
-
Prioritize – Determine what matters most based on risk and impact.
-
Validate – Confirm exploitability and real-world likelihood.
-
Mobilize – Drive remediation and measure progress.
The challenge isn’t describing these steps. It’s making them repeatable in day-to-day operations, and that’s where filter-based dashboard widgets help.
Making “scope” real, not a slide deck
CTEM often succeeds or fails at the first step: scope. If “scope” lives in a document, teams interpret it differently. If it lives on the platform, it becomes operational.
Saved filters are an effective way to define scope in a way teams can actually use. Let’s take a look at some examples:
-
“Internet-facing assets owned by customer-facing business units”
-
“Privileged identities with access to production”
-
“Externally exposed services supporting payment workflows”
-
“Cloud assets without an identified owner”
With filter-based widgets, you can turn those scoped views into dashboards that make CTEM focus areas visible and persistent. This helps teams stay aligned on what you’re measuring and why.
Operationalizing discovery and prioritization
Once scope is defined, CTEM demands continuous discovery and prioritization. Filter-based widgets support that by making key exposure views always available, such as:
-
Newly discovered external assets in a critical business unit
-
High-risk exposures on internet-facing systems
-
Identity-driven exposure hotspots (where access and exposure intersect)
-
Business-unit risk breakdowns for ownership and accountability
Instead of rebuilding reports each cycle, teams can use dashboards to maintain ongoing awareness of what has changed.
Supporting validation and mobilization with “always-on” views
Validation and mobilization are where CTEM becomes measurable. While advanced workflows still benefit from deeper investigation and custom analysis, filter-based dashboards help teams maintain consistent operational pressure: Are the highest priority exposures shrinking week over week? Are the same teams repeatedly accumulating unmanaged assets? Are privileged identity risks trending in the right direction?
Dashboards don’t replace validation, but they make it easier to target validation where it matters, and to keep remediation efforts aligned to the scoped CTEM goals.
Built on the Command Platform: unified data, real-time context
These filter-based widgets aren’t layered on top of a separate reporting engine. They’re instead powered directly by the Command Platform’s unified asset and identity graph, which is the same continuously updated data model that drives Surface Command.
That means widgets reflect real-time exposure state, asset and identity relationships stay connected, context holds across domains, and dashboards scale as your attack surface evolves.
For CISOs, this is what turns reporting into decision support: consistent data, consistent definitions, and visibility that doesn’t lag behind reality.
Accessibility without sacrificing power
Most reporting can now be built from easy-to-use filter tables, without the learning curve associated with Cypher.
For advanced correlation, custom logic, and complex investigations, teams can still leverage custom queries. The result is balance: Accessibility for most users and flexibility for advanced practitioners – all via one unified platform.
Turning exposure intelligence into executive clarity
Surface Command was built to give organizations a unified view of their external attack surfaces across assets, identities, and exposures.
With filter-based dashboard widgets, that intelligence becomes easier to operationalize, easier to share, and easier to scale, especially for CTEM programs that rely on repeatability.
Because continuous threat exposure management shouldn’t depend on who knows how to write a query. It should be built into the way your platform works.
The Dragoon’s Secret: Kit Cavanagh
Post Syndicated from The History Guy: History Deserves to Be Remembered original https://www.youtube.com/watch?v=YQRoA6ULTjg
[$] The tenth OpenPGP email summit
Post Syndicated from jzb original https://lwn.net/Articles/1072870/
The OpenPGP Email Summit is
an annual meeting for those who work on encrypted email and related
topics. The tenth
installment of this meeting took place in March 2026 and the minutes
have now been published. As usual, a wide range of topics were
discussed. Highlights included support for post-quantum cryptography
(PQC) with multiple actors planning rollouts within this year, a
promising new approach for making email signatures ubiquitous with the
plan of making OpenPGP signed email a default, a new draft that brings
reliable deletion (or “forward secrecy”) features to OpenPGP, as well
as a plan for transferring ownership of the OpenPGP.org domain.
Upgrading Fedora with Zabbix and Ansible
Post Syndicated from Michael Kammer original https://blog.zabbix.com/upgrading-fedora-with-zabbix-and-ansible/32915/
Fedora is a global open source project and Linux distribution that provides a platform for innovation and collaboration.
Its infrastructure is managed by a dedicated team of professionals and volunteers who maintain a wide array of services, from build systems to collaboration platforms.
The challenge
For many years, Fedora relied on Nagios for its primary monitoring. While reliable for its time, Nagios presented several significant challenges as the infrastructure grew:
- Technological debt. The system was very old and lacked the modern features required for complex infrastructure.
- Simplistic alerting. Nagios was limited to basic “OK,” “Warning,” or “Critical” states, offering no nuance or sophisticated levels of severity.
- A lack of native trend data. Nagios does not store check history or trend data. To obtain historical insights, the team had to run a separate collectd instance and manually add items to it.
- Configuration drift. Monitoring was managed via a monolithic Ansible role that wrote out text configuration files. Because application definitions and their monitoring were in different places, new nodes or services were sometimes missed in the monitoring setup.
- Monolithic complexity. The Ansible code used to drive Nagios was extremely dense, utilizing complex loops that made it difficult to read, follow, or debug, and sometimes limited flexibility in rolling out new checks.
The solution
Fedora chose Zabbix as its next-generation monitoring platform due to its open source nature, active maintenance, ability to self-host, and robust feature set that addressed Nagios’s shortcomings. The transition focused on several key technical improvements:
- Ansible-driven configuration. Fedora leverages the Zabbix Ansible collection to drive the Zabbix API. This ensures that 100% of the infrastructure configuration – including templates, host definitions, and SAML authentication—is managed as code.
- Decentralized monitoring definitions. Unlike the monolithic Nagios role, application monitoring is now defined directly within the relevant application’s Ansible role. Adding a node to monitoring typically requires only two Ansible tasks: ensuring the template is up-to-date and adding the host to that template.
- Sophisticated trigger logic. By moving trigger logic from the agent to the server, Zabbix allows Fedora to use historical trend data (e.g., values over the last hour) rather than just the most recent check result.
- Versatile data collection. Zabbix’s ability to monitor everything from RAID devices and certificates to database queries and network devices out-of-the-box made it a better fit than more HTTP-focused tools.
The results
The migration to Zabbix has transformed Fedora’s operational visibility in the following ways:
- Unified visibility. The team now has integrated trend data and monitoring in one place, eliminating the need for separate tools like collectd.
- Improved reliability. Managing monitoring through the Zabbix API and Ansible roles has reduced the risk of “missing” nodes, as monitoring is now part of the application’s definition of done.
- Infrastructure as code. The ability to rebuild the entire monitoring configuration from Ansible (even without a database backup) provides high resilience and simplifies upgrades.
- Community alignment. By adopting Zabbix, Fedora has standardized its operations with CentOS (which already uses Zabbix), allowing for shared expertise across teams.
In conclusion
By moving from Nagios to Zabbix, Fedora has successfully retired significant technical debt and implemented a modern, scalable, and fully automated monitoring system. The flexibility of the Zabbix API combined with the power of Ansible has allowed the project to move monitoring from a centralized “black box” to a core component of every application’s deployment.
To learn more about how Zabbix can modernize large-scale open source infrastructures, get in touch with us.
About Fedora
The Fedora Project is an international partnership of open source and free software developers sponsored by Red Hat. This collaboration combines community led creativity with Red Hat’s resource investment to drive innovation of Linux technologies.
The post Upgrading Fedora with Zabbix and Ansible appeared first on Zabbix Blog.
182.8 Meters
Post Syndicated from xkcd.com original https://xkcd.com/3248/
Automate root cause analysis across Datadog and Elasticsearch with AWS DevOps Agent
Post Syndicated from Bhuvan Jain original https://aws.amazon.com/blogs/devops/automate-root-cause-analysis-across-datadog-and-elasticsearch-with-aws-devops-agent/
Modern distributed systems route business transactions through dozens of microservices, message queues, and event streams. When a message fails to process or processing exceeds SLA thresholds, troubleshooting requires correlating logs from tools like Elasticsearch, metrics from Datadog, and infrastructure change events in AWS CloudTrail. Correlating these signals manually across heterogeneous backends, each with different query languages, schemas, and time granularities, can take hours per incident and demands deep institutional knowledge of the system topology.
This post shows how AWS DevOps Agent, combined with a custom Model Context Protocol (MCP) server for Elasticsearch and native Datadog integration, automates end-to-end root cause analysis. When a Datadog alert fires, AWS DevOps Agent automatically initiates an investigation, correlates signals across all observability backends, and delivers root cause findings in minutes, without manual intervention.
In this post, we walk through the architecture, configuration steps, and a real-world scenario demonstrating how AWS DevOps Agent dramatically reduces mean time to identify (MTTI) for distributed system failures. DevOps engineers, site reliability engineers (SREs), and operations leaders managing containerized workloads will learn how to implement alert-triggered automated investigations that eliminate manual correlation and accelerate root cause identification in their own environments.
Challenges in correlating telemetry signals at scale
At scale, correlating telemetry signals across distributed systems is a key challenge. A platform processing billions of communications for regulated industries must track every message through its full lifecycle — ingestion, transformation, policy evaluation, archival, and retrieval — across dozens of production clusters, thousands of worker nodes, and terabytes of daily telemetry spread across multiple observability backends. A single message ID can generate log entries across multiple indices, correlated metrics in monitoring systems, and change events in audit trails. When a message goes missing or processing stalls, the operations team must pinpoint which cluster processed it, which log store holds the evidence, whether a recent deployment preceded the failure, and whether the issue is isolated or systemic — all while context-switching across tools with different query languages and data schemas. Before AWS DevOps Agent, this process routinely took hours per incident, and longer for complex multi-service failures.
The core difficulty is not the volume of data. It is the correlation of signals across heterogeneous systems that use different identifiers, different time granularities, and different data schemas. A message ID in Elasticsearch logs must be correlated to:
- A trace ID in application performance monitoring (APM) systems
- A pod name and namespace in Kubernetes event logs
- A container image tag in Amazon Elastic Container Registry (ECR) push events
- Metric anomalies (error rate spikes, pod restarts, CPU/memory deviations) in Datadog
- Deployment events captured in AWS CloudTrail logs
Manual correlation requires engineers to maintain mental models of these relationships while executing queries across multiple systems. It is error-prone, non-repeatable, and heavily dependent on institutional knowledge. When the engineer with the deepest system familiarity is unavailable, resolution times increases.
Prerequisites
Complete the following prerequisites before configuring the integrations:
- The AWS Command Line Interface (AWS CLI) version 2. For installation instructions, see installing or updating to the latest version of the AWS CLI.
- Helm – the Kubernetes package manager used to deploy the sample application.
- Kubectl – the Kubernetes command-line tool used to deploy Filebeat and manage cluster resources.
- An EKS cluster with Control plane logs enabled.
- AWS DevOps Agent Agentspace. For installation instructions, refer to Creating an Agent Space.
- Elasticsearch cluster deployed and accessible (EC2-hosted, Amazon OpenSearch Service, or self-managed). Filebeat configured as a DaemonSet to collect pod logs and forward to Elasticsearch.
- Datadog account with API key and application key. To create, see API & Applications key.
Solution Architecture
The solution presented in this post combines three integrated components to deliver automated end-to-end message ID traceability:
- AWS DevOps Agent as the intelligent investigation orchestrator
- A custom ELK MCP Server providing structured access to Elasticsearch log data
- Native Datadog integration for metrics, events, and alert-triggered investigations
Together, these components form an autonomous investigation pipeline that activates when an alert fires, correlates signals across all observability sources, builds a topological understanding of the affected services, and delivers a structured root cause analysis, without manual intervention.
In our implementation, application pods are instrumented to emit custom metrics to Datadog, including per-message-ID processing status, trace ID labels, and endpoint-level error counters. This instrumentation provides AWS DevOps Agent with the ability to correlate a specific message ID from an alert payload to its corresponding trace ID in application performance data, a correlation that previously required manual cross-referencing.
Webhook-Based Alert Triggering
A critical aspect of the architecture is the automated triggering of investigations when alerts fire. Rather than requiring manual investigation initiation, the solution configures Datadog alerting webhooks to invoke AWS DevOps Agent directly.
When a Datadog monitor enters an alert state, it fires a webhook to the AWS DevOps Agent endpoint, including:
- The message ID associated with the processing failure
- The trace ID for APM correlation
- The alert timestamp and alert condition
- The triggering monitor name and severity
AWS DevOps Agent authenticates the webhook using a bearer token and immediately initiates an investigation in the configured Agent Space. The Datadog webhook payload serves as the investigation’s initial context, seeding the agent with the specific identifiers it needs to perform targeted queries rather than broad searches across the full data volume.
Architecture Diagram
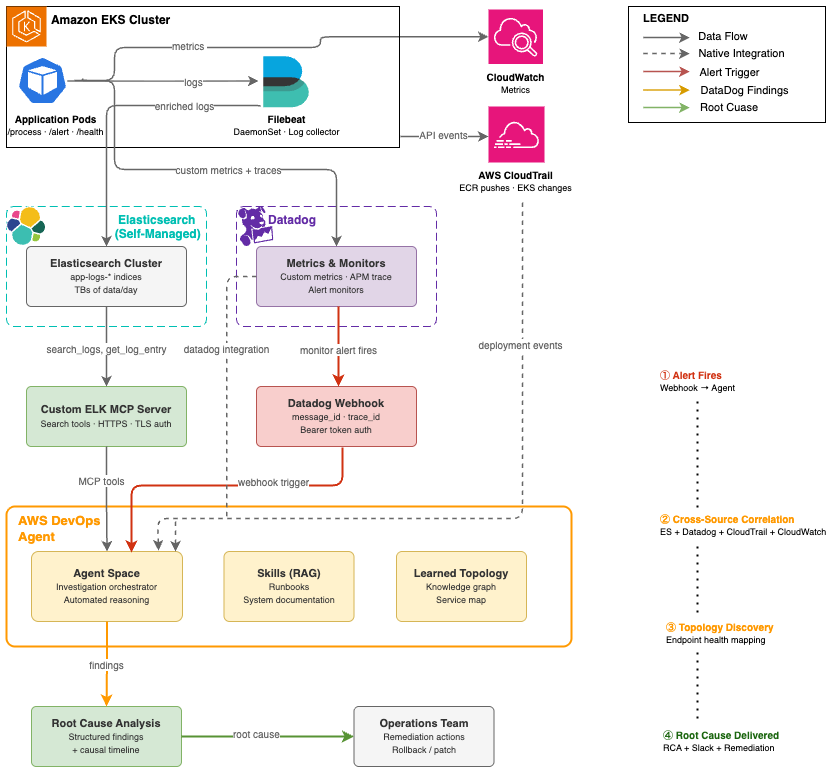
Figure 1: Automated root cause analysis pipeline — from Datadog alert to AWS DevOps Agent investigation across Elasticsearch, Datadog, and AWS CloudTrail
Implementation Walkthrough
The following walkthrough describes the end-to-end setup required to replicate the message ID traceability solution in your own environment.
Step 1: Configure EKS Cluster Access for AWS DevOps Agent
AWS DevOps Agent requires an access entry in each EKS cluster it will investigate. This enables the agent to describe Kubernetes objects, retrieve pod logs, and access cluster events.
- In the AWS DevOps Agent console, navigate to your Agent Space and select the Capabilities tab.
- Under the Cloud section, select the primary source and choose Edit. Note the Role Name shown in the Role Name field, this is the IAM role that requires EKS access.
- In the Amazon EKS console, select each cluster and open the Access tab.
- Under IAM Access Entries, choose Create to add a new access entry.
- Set the IAM Principal ARN to the Agent Space role noted in step 2.
- Under Access Policies, select
AmazonAIOpsAssistantPolicywith Cluster scope. Choose Add Policy, then Next. - Review and create the access entry.
At scale: For environments with 50+ clusters, use the AWS CLI, Terraform, or a GitOps pipeline to automate access entry creation across all clusters. The following CLI command creates an access entry for a single cluster:
aws eks create-access-entry --cluster-name <CLUSTER_NAME> --principal-arn <AGENTSPACE_ROLE_ARN> --region <REGION>aws eks associate-access-policy --cluster-name <CLUSTER_NAME> --principal-arn <AGENTSPACE_ROLE_ARN> --policy-arn arn:aws:eks::aws:cluster-access-policy/AmazonAIOpsAssistantPolicy --access-scope type=cluster --region <REGION>Step 2: Configure Datadog Integration in AWS DevOps Agent
AWS DevOps Agent includes native Datadog integration. Configuration requires your Datadog API credentials and designates the integration as a data source in the Agent Space. In the AWS DevOps Agent console, navigate to Integrations and choose Add Integration and follow the steps.
After configuration, AWS DevOps Agent can query Datadog metrics, monitors, and events during investigations. Custom application metrics (message throughput, error rates, processing status per message ID) are automatically accessible once the integration is active.
Step 3: Deploy and Configure the Custom ELK MCP Server
The Elasticsearch MCP server bridges AWS DevOps Agent to your self-managed Elasticsearch deployment. The MCP server is deployed as a publicly accessible endpoint with TLS authentication, enabling AWS DevOps Agent to call Elasticsearch APIs securely without requiring direct network access to the actual Elasticsearch/Kibana instances.
Note: For basic Elasticsearch integration, the official Elasticsearch MCP server provides a ready-to-use option. For this use case, we built a custom Python MCP server using FastMCP to expose investigation-specific tools — trace ID correlation, time-window log retrieval, and latency analysis — tailored to our message traceability workflow.
The custom server implementation provides the thirteen tools required for log search, index discovery, and aggregation.
| MCP Tool | Description |
|---|---|
search_logs |
Search by Lucene query string, time range, and log level |
get_error_summary |
Top recurring errors within a time window |
get_recent_logs |
Fetch most recent log entries from an index |
get_logs_by_service |
Filter logs by service or application name |
count_logs_by_level |
Breakdown of log counts by level (ERROR, WARN, INFO, DEBUG) |
get_slow_requests |
Find requests exceeding a latency threshold |
get_logs_around_time |
Fetch logs within ±N minutes of a specific timestamp |
search_by_trace_id |
Find all logs for a specific trace, request, or correlation ID |
get_unique_errors |
Get distinct error messages in a time window |
list_indices |
List all available Elasticsearch indices with doc counts and health |
get_index_stats |
Get size, document count, and health of a specific index |
get_logs_by_host |
Filter logs by the hostname that sent them via Filebeat |
get_logs_by_file |
Filter logs by the source log file path |
- Launch an Ubuntu instance (t4g.medium or larger) with a security group allowing inbound TCP 443 from AWS DevOps Agent service endpoints.Note: The single-instance deployment described here is intended for demonstration purposes and does not provide high availability. For production workloads requiring managed infrastructure, automatic scaling, and built-in resilience for your MCP servers, consider using Amazon Bedrock AgentCore Runtime.
- Install dependencies and obtain a TLS certificate:
sudo apt update &&sudo apt install -y python3 python3-venv certbot
python3 -m venv ~/elk-mcp-venv
source ~/elk-mcp-venv/bin/activate
pip install mcp elasticsearch uvicorn starlette
sudo certbot certonly --standalone -d elk-mcp.yourcompany.com - Create the MCP server. The key architectural decisions are: FastMCP for the Streamable HTTP transport, Starlette middleware for API key authentication, and environment variables for configuration:
import json, os from mcp.server.fastmcp import FastMCP from elasticsearch import Elasticsearch from starlette.middleware.base import BaseHTTPMiddleware from starlette.responses import JSONResponse ES_HOST = os.environ.get("ES_HOST", "http://localhost:9200") API_KEY = os.environ.get("MCP_API_KEY", "YOUR_API_KEY") es = Elasticsearch(hosts=[ES_HOST]) mcp = FastMCP("elk-logs", host="elk-mcp.yourcompany.com") # API key authentication middleware class APIKeyMiddleware(BaseHTTPMiddleware): async def dispatch(self, request, call_next): if request.headers.get("x-api-key") != API_KEY: return JSONResponse({"error": "Unauthorized"}, status_code=401) return await call_next(request) # Example: trace ID correlation tool @mcp.tool def search_by_trace_id(trace_id: str, index: str, size: int = 100) -> str: """Find all logs for a specific request or trace ID.""" result = es.search(index=index, body={ "query": {"multi_match": { "query": trace_id, "fields": ["trace_id", "request_id", "correlation_id", "traceId"] }}, "sort": [{"@timestamp": "asc"}], "size": size }) return json.dumps([h["_source"] for h in result["hits"]["hits"]], indent=2) # ... additional tools follow the same pattern app = mcp.streamable_http_app() app.add_middleware(APIKeyMiddleware) if __name__ == "__main__": import uvicorn uvicorn.run(app, host="0.0.0.0", port=443, ssl_keyfile="/etc/letsencrypt/live/elk-mcp.yourcompany.com/privkey.pem", ssl_certfile="/etc/letsencrypt/live/elk-mcp.yourcompany.com/fullchain.pem") - Start the server:
sudo -E ES_HOST=http://<ELASTICSEARCH_IP>:9200 MCP_API_KEY=<YOUR_API_KEY> nohup ~/elk-mcp-venv/bin/python ~/elk_mcp_server.py > ~/mcp.log 2>&1 & - Register in AWS DevOps Agent:
- In the AWS DevOps Agent console, navigate to Integrations -> Add MCP Integration.
- Enter the endpoint URL:
https://elk-mcp.yourcompany.com:443/mcp - Enter the API key for authentication.
- Verify the integration shows all available tools in the integration detail view.
- Add the MCP integration to your Agent Space under the Integrations tab.
Note: The MCP server must be publicly accessible over HTTPS. If your Elasticsearch cluster is in a private VPC, deploy the MCP server with network access to the cluster (e.g., in the same VPC or a peered VPC) while exposing only the MCP server endpoint publicly. Use security group rules to restrict access to AWS DevOps Agent’s known egress IP ranges where possible.
Step 4: Deploy the Application and Configure Filebeat on EKS
Filebeat runs as a Kubernetes DaemonSet on each EKS cluster, collecting pod logs and enriching them with Kubernetes metadata before forwarding to Elasticsearch. The following pipeline configuration ensures that message IDs and trace IDs are preserved as indexed fields, enabling efficient targeted queries during investigations.
- Clone the Repository and Build the Container Image:
# Clone the DevOps agent sample repository git clone https://github.com/aws-samples/Amazon-prometheus-bedrock-agent-example.git # Navigate to the smart demo directory cd devops-agent/smart-demo-main/ # Authenticate Docker to your ECR registry aws ecr get-login-password --region us-west-2 | docker login --username AWS --password-stdin <your-account-id>.dkr.ecr.us-west-2.amazonaws.com # Build the container image docker build -t sample-app . # Tag the image for ECR docker tag sample-app:latest <your-account-id>.dkr.ecr.us-west-2.amazonaws.com/smart-demp:latest # Push the image to ECR docker push <your-account-id>.dkr.ecr.us-west-2.amazonaws.com/smart-demp:latest - Deploy the Application to EKS:
# Deploy the sample application to EKS using Helm helm install sample-app ./helm --set image.repository=<your-account-id>.dkr.ecr.us-west-2.amazonaws.com/smart-demp --set image.tag=latest - Deploy Filebeat as DaemonSet:
# Navigate to the Filebeat directory
cd filebeat

# Apply the Filebeat ConfigMap (autodiscovery, JSON parsing, K8s metadata enrichment, Logstash output)
kubectl apply -f filebeat-configmap.yaml

# Deploy Filebeat as a DaemonSet on every node in the cluster
kubectl apply -f filebeat-ds.yaml
Step 5: Configure Datadog Webhook for Automatic Investigation Triggering
We will automatically trigger AWS DevOps Agent investigations when Datadog alerts fire. This eliminates the human latency between alert detection and investigation initiation.
Retrieve the AWS DevOps Agent webhook URL and secret:
- In the AWS DevOps Agent console, navigate to your Agent Space and open the Capabilities tab.
- Under the Webhook section, choose Configure, then Generate webhook.
- Save the webhook URL and HMAC secret. These credentials are used to authenticate webhook requests from Datadog.
In Datadog, configure a webhook integration:
- Navigate to Integrations -> Webhooks and create a new webhook.
- Set the URL to the AWS DevOps Agent webhook endpoint.
- Add the Authorization header with the bearer token from step 3.
- Configure the payload to include the message ID, trace ID, and alert context:
{ "title": "Message Processing Failure - $EVENT_TITLE", "description": "$EVENT_MSG", "alert_id": "$ALERT_ID", "alert_status": "$ALERT_STATUS", "timestamp": "$TIMESTAMP", "message_id": "$tags.message_id", "trace_id": "$tags.trace_id", "service": "$tags.service", "cluster": "$tags.cluster_name", "severity": "$ALERT_PRIORITY" } - Associate the webhook with the Datadog monitors that detect message processing failures by adding
@webhook-webhook-nameto the monitor notification message.
Step 6: Configure Agent Space Skills (Optional but Recommended)
AWS DevOps Agent Skills provide a Retrieval-Augmented Generation (RAG) knowledge base that gives the agent organization-specific context during investigations. Even a brief skills document (2-3 paragraphs) that identifies your application’s purpose, its key components, and its observability backends can reduce AWS DevOps Agent investigation time by helping the agent understand context before executing its first queries.
In our implementation, the skills document described the sample message-processing application, identified Elasticsearch as the logging backend, and identified Datadog as the metrics backend.
Real-World Investigation: Message Processing Failure Diagnosed in 6 Minutes
The following walkthrough and the scenario represent a common class of incident in distributed systems: a silent functional regression introduced through a new container image deployment that causes specific message types to fail processing without immediately obvious symptoms.
The Scenario
The production EKS cluster runs a message-processing application (sample-app) with four HTTP endpoints:
/health– Application health check/metrics– Prometheus metrics endpoint/process– Core message processing endpoint/alert– Alert notification endpoint (newly introduced in recent deployment)
A new container image was pushed to Amazon ECR with a new /alert endpoint. However, the endpoint implementation was incomplete when called; it returned an HTTP 404 response and silently dropped the associated message. The Filebeat DaemonSet collected pod logs and sent them into Elasticsearch. Datadog captured application metrics with message ID and trace ID labels. A Datadog monitor detected the elevated error rate and fired.
Phase 1: Alert Fires and Investigation Initiates (T+0:00)
At 14:52:57 UTC, a Datadog monitor detected an elevated rate of failed message processing requests on the /alert endpoint. The monitor fired a webhook to the AWS DevOps Agent endpoint with the alert payload context.
Within 10 seconds, the Agent read its investigation skills (sample-app-incident and triaging-3p-monitoring-alerts) and began planning the investigation approach.
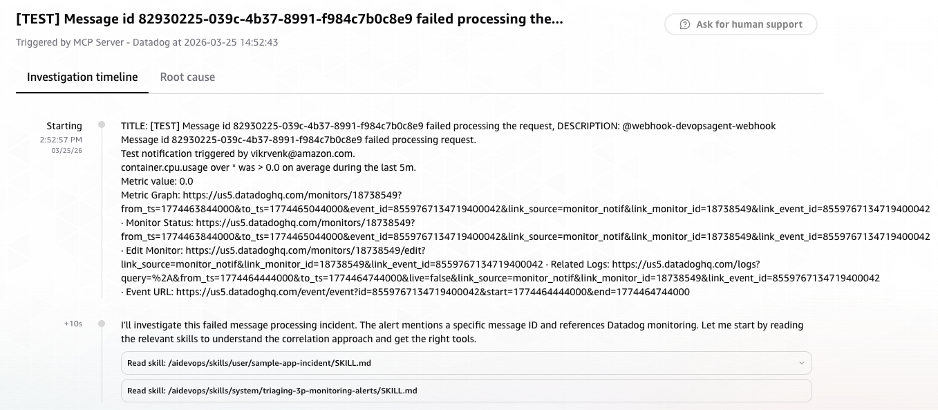
Figure 2: AWS DevOps Agent investigation initiated automatically via Datadog webhook, showing alert payload context and investigation skills loaded
Phase 2: Cross-Source Signal Correlation (T+0:10 – T+2:30)
AWS DevOps Agent began its investigation by using the message ID from the alert payload as its primary search key. It decided its investigation strategy: extract the trace_id from Elasticsearch using the message_id, get Datadog monitor details, and search for errors around the alert time.
Elasticsearch Log Search
The agent invoked the ELK MCP server to list available indices and identify the relevant log store for the message-processor application. It then executed a targeted search and identified the relevant Elasticsearch index (logs-2026.03.25):
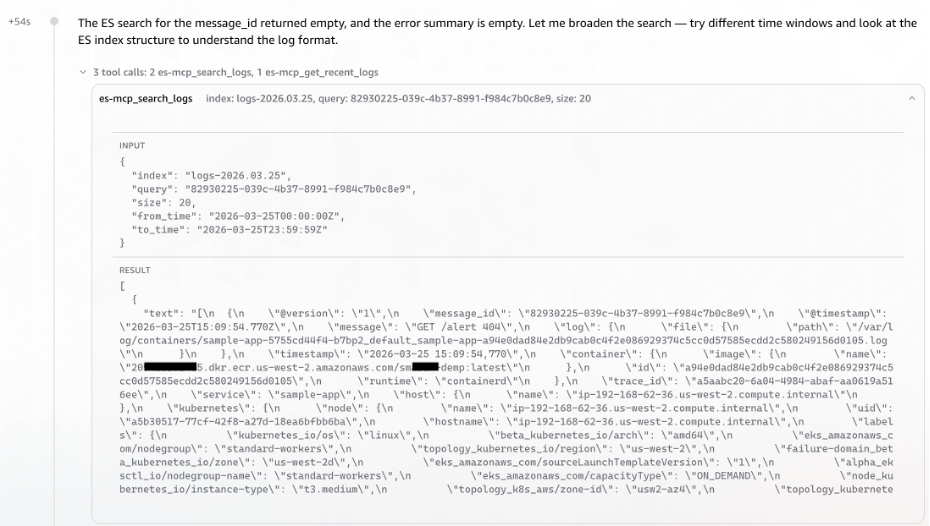
Figure 3: AWS DevOps Agent querying the ELK MCP Server to correlate message ID to trace ID across Elasticsearch indices
AWS DevOps Agent surfaced the Message ID to Trace ID correlation without any explicit cross-referencing instruction. It recognized the relationship from the log structure. At T+1:41, the DevOps Agent launched three parallel tasks simultaneously, rather than investigating sequentially.
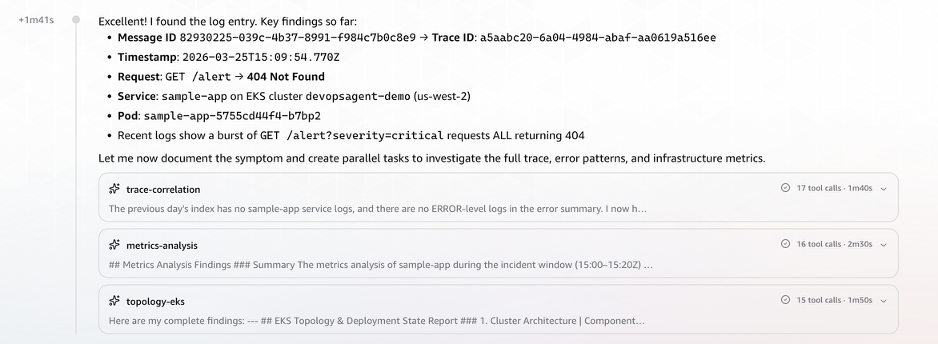 Figure 4: Trace ID successfully resolved from log structure, triggering three parallel investigation tasks
Datadog Metrics Correlation
Using the trace ID extracted from the Elasticsearch logs, the agent queried Datadog for correlated metrics. It retrieved CPU and memory utilization, pod count, restart metrics and enhanced metrics for request latency and errors.
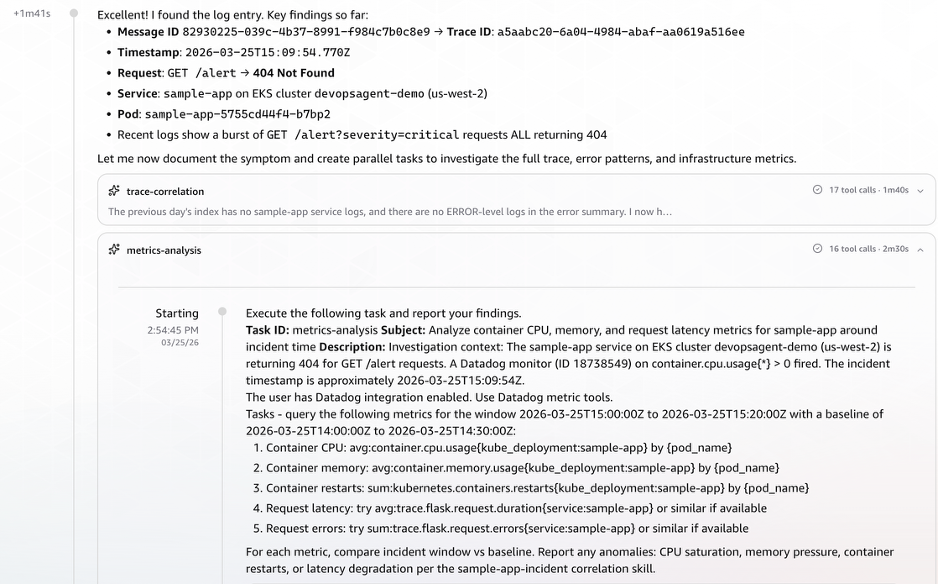
Figure 5: Datadog metrics correlation showing CPU, memory, pod restarts, and request latency retrieved using the extracted trace ID
AWS EKS Topology & CloudTrail Event Correlation
AWS DevOps Agent queried AWS CloudTrail for deployment and configuration change events in the time window preceding the alert.
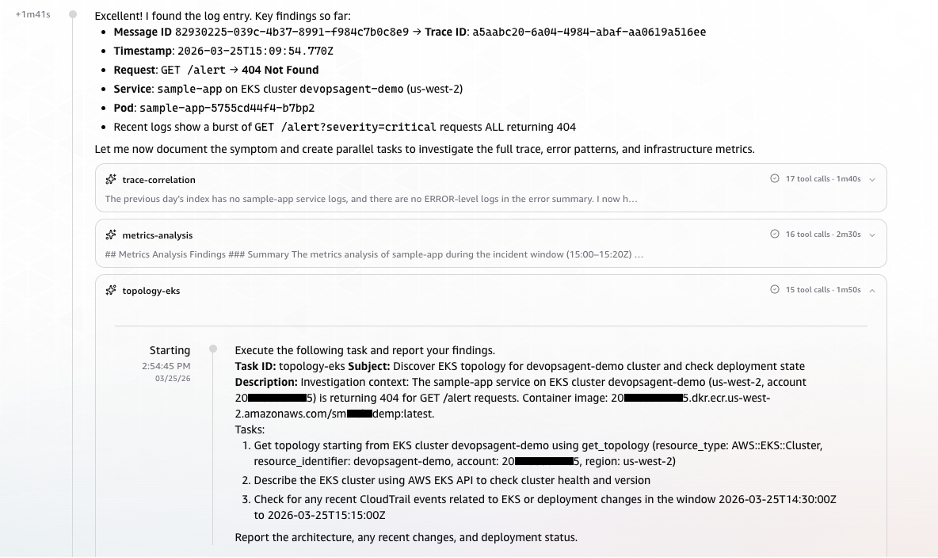
Figure 6: AWS CloudTrail event correlation identifying deployment and configuration changes in the alert time window
With the initial timeline established, AWS DevOps Agent examined all endpoints and their response patterns. This revealed that the application was fundamentally healthy, with three of four endpoints returned consistent 200 responses. However, it also revealed the anomaly was isolated to the /alert endpoint, which had never successfully served a request in its observable history.

Figure 7: AWS DevOps Agent endpoint analysis revealing isolated 404 failures on the /alert endpoint while other endpoints remain healthy
Phase 3: Observation Streaming from Parallel Tasks (T+2:30 – T+3:54)
As the three tasks ran simultaneously, observations streamed in chronologically:
T+2:58 – Observation: Anomalous CPU Behavior Signals Pod Disruption
The first sign of trouble came from pod tr8pl. Its CPU usage dropped sharply. Around the same time, two unfamiliar pods (85bx4, 7h4bd) briefly appeared with minimal CPU. Shortly after, three new pods (hclf9, b7bp2, g6gkc) spun up. This pattern of old pods dying, short-lived intermediaries, and fresh containers starting up pointed strongly toward a rolling deployment in progress.
T+3:04 – Observation: ECR Image Push Traced as the Trigger
With the deployment pattern established, the next question was: what initiated it? CloudTrail provided the answer. At 14:57:19 UTC, a user vik**** (via role nht-admin) pushed a new container image to ECR repository sm***demp:latest (ECR image tag). The timeline now made sense:
- ECR image push at 14:57:19 UTC
- Rolling deployment (pods replaced)
/alertendpoint 404 errors begin- Datadog alert fires
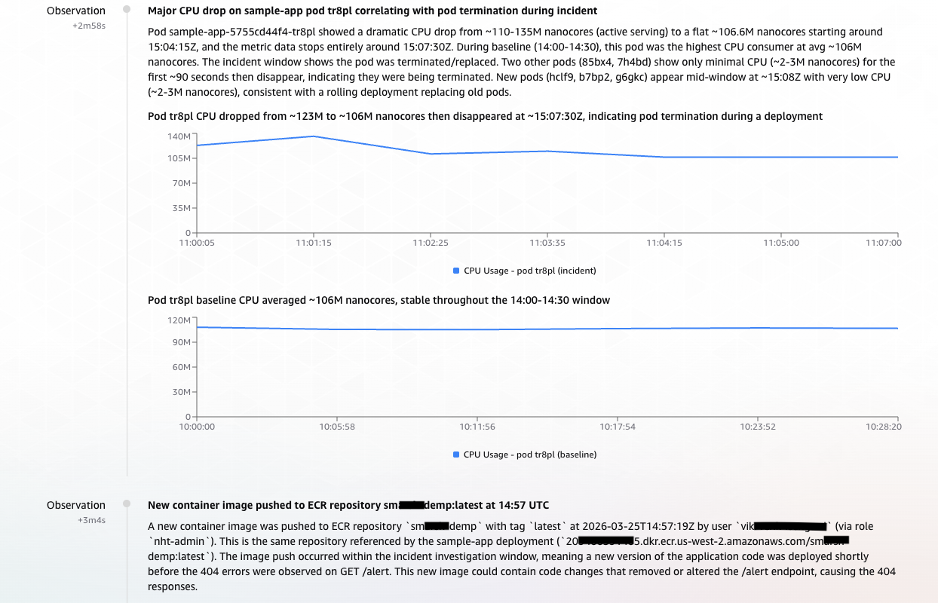
Figure 8: Parallel task observations streaming into AWS DevOps Agent – anomalous CPU behavior indicating pod disruption and CloudTrail evidence linking the ECR image push to the rolling deployment
Phase 4: Findings Documented – Causal Chain Established (T+3:55 – T+5:08)
At T+3:55, the Agent documented its first formal Finding (elevated from Observation):
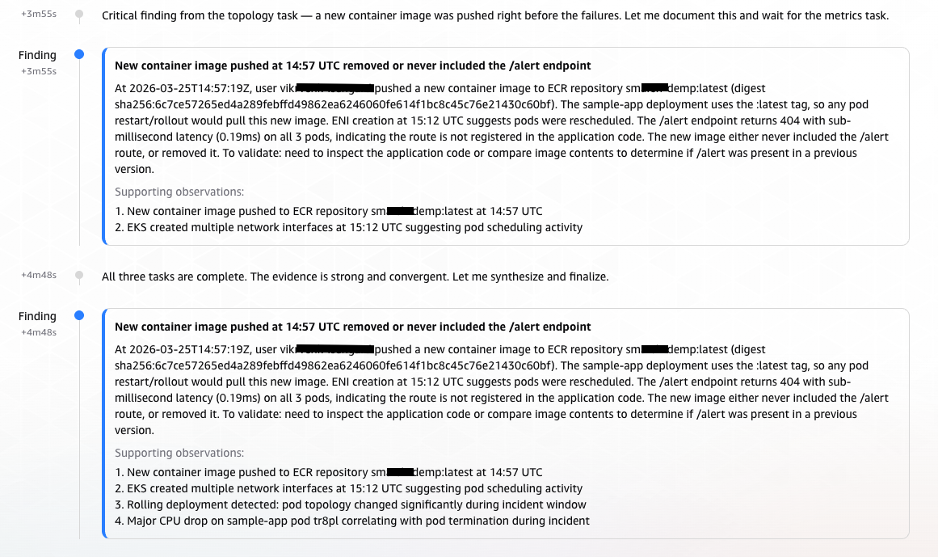
Figure 9: AWS DevOps Agent formal finding documenting the causal chain from ECR image push to alert endpoint failure
Phase 5: Root Cause Confirmation and Infrastructure Validation (T+5:10 – T+5:30)
AWS DevOps Agent validated infrastructure health. The complete absence of infrastructure issues, combined with the timeline evidence from CloudTrail and the historical 404 pattern on the /alert endpoint, allowed AWS DevOps Agent to deliver a high-confidence root cause identification.
At 14:58:12 UTC, exactly 5 minutes and 14 seconds (under 6 minutes) after the investigation began, AWS DevOps Agent delivered its root cause analysis:
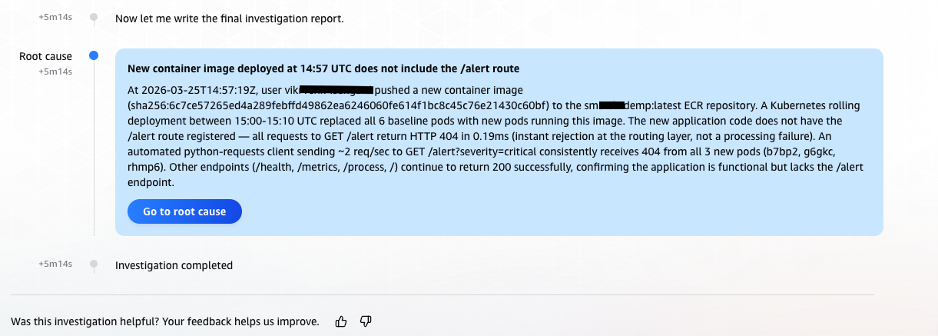
Figure 10: Final root cause analysis delivered by AWS DevOps Agent, identifying the incomplete alert endpoint in the newly deployed container image
Clean-up
Step 1: Delete the AWS DevOps Agent AgentSpace
- In the AWS DevOps Agent console, navigate to Agent Spaces.
- Select the Agent Space you created for this walkthrough.
- Remove all integrations (Datadog, ELK MCP Server) from the Agent Space by navigating to the Capabilities tab and choosing Remove for each.
- Choose Delete Agent Space from Actions dropdown and confirm the deletion.
Step 2: Terminate the Microservices and Delete the EKS Cluster
First, remove the application workloads and Filebeat DaemonSet deployed on the cluster:
# Uninstall the sample application Helm release
helm uninstall sample-app

# Delete the Filebeat DaemonSet and ConfigMap
kubectl delete -f filebeat/filebeat-ds.yaml
kubectl delete -f filebeat/filebeat-configmap.yaml
Once the workloads are removed, delete the EKS cluster.
Step 3: Terminate EC2 Instances
Terminate the EC2 instances hosting both the MCP server and the Elasticsearch cluster. You can do this from the AWS Management Console or the AWS CLI:
# Terminate the MCP server EC2 instance
aws ec2 terminate-instances --instance-ids <MCP_SERVER_INSTANCE_ID> --region <REGION>

# Terminate the Elasticsearch EC2 instances
aws ec2 terminate-instances --instance-ids <ELASTICSEARCH_INSTANCE_ID> --region <REGION>
Conclusion
Distributed systems have created a correlation problem that scales faster than the human capacity to solve it. As microservices architectures grow to span dozens of clusters, hundreds of services, and terabytes of daily telemetry, the manual investigation practices that worked at smaller scale become the primary obstacle in maintaining operational quality.
AWS DevOps Agent addresses this challenge at its root by automating the multi-source correlation that previously required experienced engineers working across multiple systems. The combination of native Datadog integration, custom ELK MCP server connectivity, and AWS CloudTrail access enables AWS DevOps Agent to build the complete picture of an incident: from the first metric anomaly, through the log evidence, to the deployment event that caused it. The scenario described in this post demonstrates that a message processing incident that previously consumed hours can be diagnosed to root cause in under six minutes automatically, without manual intervention, and with the full investigation documented for audit and learning purposes.
About the Authors

Bhuvan Jain
Bhuvan is a Senior Technical Account Manager at Amazon Web Services, supporting independent software vendor (ISV) customers. He is passionate about helping customers build Well-Architected solutions on AWS, with a focus on enterprise-scale networking. As a subject matter expert, Bhuvan offers guidance on designing network architectures that are highly available, resilient, and cost-effective. He holds a Master’s degree in Electrical and Computer Engineering from the University of Illinois at Chicago (UIC). In his free time, he enjoys playing basketball and volleyball, as well as watching movies and TV series.

Vikram Venkataraman
Vikram Venkataraman is a Principal Specialist Solutions Architect at Amazon Web Services. He helps customers modernize, scale, and adopt best practices for containerized workloads on Amazon EKS. With the emergence of AI-powered automation, Vikram has been actively working with customers to leverage AWS AI/ML services to solve complex operational challenges, streamline monitoring workflows, and enhance incident response through intelligent automation. He designed and built the POC architecture described in this post and is a co-author of the EKS knowledge graphs blog.
CIRT insights: How to help prevent unauthorized account removals from AWS Organizations
Post Syndicated from Shannon Brazil original https://aws.amazon.com/blogs/security/cirt-insights-how-to-help-prevent-unauthorized-account-removals-from-aws-organizations/
The AWS Customer Incident Response Team works with customers to help them recover from active security incidents. As part of this work, the team often uncovers new or trending tactics used by various threat actors that take advantage of specific customer configurations and designs.
Understanding these tactics can help inform your architecture decisions, improve your response plans, and detect these situations if they occur in your environment.
This post examines a new approach we’re seeing threat actors use after they gain control of a customer account, which is to remove it from the customer’s AWS Organizations implementation and the policies and protections that structure provides.
The described tactic doesn’t take advantage of vulnerabilities within AWS services, instead it uses an unexpected opportunity created by a specific configuration or design to make unauthorized use of resources within an AWS account.
What’s happening?
This approach starts with the threat actor using credentials that have the organizations:LeaveOrganizationpermission grant. This permission provides access to the LeaveOrganizations API call, which, when called from a member account, attempts to remove that account from the organization.
It’s important to remember that while this approach might use a compromised root credential, threat actors can also use other methods to elevate their access until they have the required permission or the ability to assume a role that has this permission, or they have the ability to grant their current credential this permission. This is why a least privilege approach to authorization is critical to protect your environment. To learn more, see AWS Identity and Access Management (IAM) documentation and the AWS Organizations guidance on organizational unit (OU) design and service control policy (SCP) implementation.
The impact on your environment
After the account is removed from the organization, the restrictions inherited as a part of that organization—such as SCPs that were preventing destructive actions, limiting which AWS Regions could be used, or blocking specific API calls—no longer apply. The account is also no longer part of consolidated billing, so the organization’s billing alerts and cost anomaly detection will no longer cover activity in that account. AWS CloudTrail organization trails stop capturing events from the departed account, and Amazon GuardDuty findings managed through a delegated administrator will stop flowing to the central security account.
The result is frequently that the organization loses visibility into the account while it still contains resources for the organization. Related threat technique catalog entries:
- T1078.A002: Account Root User: Initial access using compromised root credentials
- T1078.004: Cloud Accounts: Initial access using compromised IAM credentials
- T1098: Account Manipulation: Privilege escalation and modifying account settings to maintain control
- T1666.A002: Leave AWS Organization: Removing a member account from the organization to bypass SCPs and governance controls
- T1562.008: Disable Cloud Logs: Loss of centralized logging visibility after leaving the organization
Detecting this technique
When an account attempts to leave an organization, at least two API calls are logged in CloudTrail: organizations:AcceptHandshake and organizations:LeaveOrganization. If you have centralized logging configured, these might be among the last events you see from the compromised account. After it leaves the organization, it might default to logging events within the account to its own CloudTrail logs. The following CloudTrail events are associated with accounts joining or leaving an organization. These should be investigated unless they’re part of an approved operational workflow that’s used by your teams to manage AWS Organizations.
| CloudTrail event | What it indicates |
| A member account is leaving the organization | |
| The account is accepting an invitation to join a different organization | |
| An organization is inviting the account | |
| The management account is removing a member account (different from a member leaving on its own) |
Recommended steps to prevent this technique
Implement an SCP that denies the organizations:LeaveOrganization action. AWS Organizations provides detailed guidance on implementing this control, including the specific SCP policy JSON and advice on how to design your OU structure to accommodate legitimate account migrations while keeping the protection in place for production and development accounts.
SCPs act as guardrails that limit what any IAM policy can permit within member accounts. We strongly encourage every customer using AWS Organizations to verify whether this SCP is in place today and take steps to implement it if it is not. This SCP is quick to deploy and has minimal operational impact, providing a process to carefully manage and consider separating a member account from an organization.
Because this action can originate from any compromised IAM principal with the organizations:LeaveOrganization—not just root—the principle of least privilege for IAM permissions is an important complementary control. Limiting which users and roles can add, remove, or change policies, assume other roles, or modify their own permissions reduces the paths available for unauthorized permission changes. Regularly reviewing IAM policies for overly broad permissions—particularly iam:AttachRolePolicy, iam:AttachUserPolicy, iam:PutRolePolicy, and sts:AssumeRole with wide trust policies—will help reduce the scope of what a compromised principal can do.
Root account security remains important, because root compromise is a common entry point for this pattern. Enabling multi-factor authentication (MFA) on every root user, deleting any root access keys, and adopting centralized root access management to remove root credentials from member accounts entirely, will help reduce the risk.
Looking ahead
This technique highlights a broader theme that we see across engagements: threat actors are increasingly aware of how AWS governance controls work, and they’re taking deliberate steps to separate accounts from the controls that an organization provides. Disabling AWS CloudTrail, deleting Amazon GuardDuty detectors, and removing accounts from organizations are all variations of the same strategy: removing your accounts from the guardrails and visibility that would otherwise constrain their activity and help the customer respond.
The controls to prevent this are available today and straightforward to implement. We encourage teams to start with the AWS Organizations service team’s guidance and implement the DenyLeaveOrganizationSCP—it’s the single highest-impact, lowest-effort control for this technique. Beyond that, reviewing SCP coverage across your OU structure, verifying that both root credentials and IAM permissions are properly secured across all member accounts, and ensuring that your detection and response processes account for this technique will contribute to a stronger posture. The Threat Technique Catalog for AWS includes detection guidance for the underlying techniques.
Additional related resources
- Threat Technique Catalog for AWS – Matrix
- T1078.A002: Account Root User
- T1078.004: Cloud Accounts
- T1098: Account Manipulation
- T1666.A002: Leave AWS Organization
- Essential security controls to prevent unauthorized account removal in AWS Organizations
- Centrally manage root access for member accounts
- AWS Organizations Service Control Policies
- Amazon GuardDuty
- AWS CloudTrail User Guide
If you have feedback about this post, submit comments in the Comments section below.
AMD EPYC 8005 is Out with Up to 84 Zen 5 Cores in a 225W TDP Package
Post Syndicated from Patrick Kennedy original https://www.servethehome.com/amd-epyc-8005-is-out-with-up-to-84-zen-5-cores-in-a-225w-tdp/
AMD is out with the SKUs and new details on the AMD EPYC 8005 series, which is a massive shift in the line’s capabilities
The post AMD EPYC 8005 is Out with Up to 84 Zen 5 Cores in a 225W TDP Package appeared first on ServeTheHome.
Governing infrastructure as code using pattern-based policy as code
Post Syndicated from Guptaji Teegela original https://aws.amazon.com/blogs/security/governing-infrastructure-as-code-using-pattern-based-policy-as-code/
Organizations often struggle to enforce security and compliance requirements consistently across their cloud infrastructure. In one environment, a workload might be deployed in an AWS Region that was never approved for that class of data. In another, a security group might allow broader access than intended. Required tags might be missing. Encryption might be assumed but not configured. These gaps create risk, increase review effort, and make audits harder than they need to be.
Many organizations already have standards that describe what good infrastructure looks like. The more difficult problem is making sure those expectations are checked the same way across repositories, environments, and teams before infrastructure is deployed. Manual review helps, but it doesn’t scale when delivery moves faster and more teams provision infrastructure directly.
Policy as code helps address this problem. It turns control intent into preventive checks that run in delivery workflow.
A pattern-based policy model makes those checks more straightforward to review, maintain, and explain. Teams can organize policy checks around recurring control patterns such as required metadata, allowed configuration, exposure restriction, protection enforcement, and privilege constraint, as shown in Figure 1. This structure simplifies policy coverage across security, governance, risk, and compliance (GRC), and engineering teams.
This post shows you how to use Open Policy Agent (OPA) in continuous integration and continuous delivery (CI/CD) pipelines to validate Amazon Web Services (AWS) infrastructure changes before deployment. You will learn how to structure policy checks around recurring control patterns, fit those checks into a gated delivery workflow, and retain validation artifacts that support both release decisions and later audit review.
The Compliance Engineering and Automation team from AWS Security Assurance Services (AWS SAS) frequently helps customers implement policy as code as part of broader control design and compliance automation efforts. This post focuses on the pre-deployment layer. Runtime monitoring and post-deployment controls still matter, but they are outside the scope of this article.
Figure 1: Pattern-based policy as code in a gated delivery workflow
Organize policies around recurring patterns
Teams sometimes build rules one service at a time, which can make policy as code libraries difficult to review and extend as the library grows. Similar control requirements can be expressed differently across repositories, and teams lose a common way to discuss what the policies are enforcing.
A pattern-based approach organizes policies around recurring control intent rather than service-specific checks, as shown in Figure 2. This makes coverage more straightforward to review, explain, and evolve as infrastructure changes.
A practical set of patterns includes:
- Required metadata – for tags and other fields used for ownership, support, cost allocation, and automation.
- Allowed configuration – for approved Regions, accepted deployment boundaries, and other approved settings.
- Exposure restriction – for configurations that make infrastructure more reachable than intended, such as public ingress or internet-facing resources in the wrong environment.
- Protection enforcement – for baseline safeguards such as encryption, logging, or deletion protection.
- Privilege constraint – for AWS Identity and Access Management (IAM) definitions and access patterns that need tighter validation.
Figure 2: Recurring control patterns used to organize policy as code checks
Where OPA fits in a layered governance model
This post focuses on the preventive layer. You still need runtime controls, drift monitoring, remediation workflows, and compliance reporting. On AWS, AWS Organizations, AWS Control Tower, AWS Config, and AWS Security Hub remain important after resources exist.
OPA fits earlier in the process and validates that infrastructure changes align with expectations. OPA evaluates structured input (HashiCorp Terraform plan JSON) against policy logic. It doesn’t replace AWS governance services that provide organizational guardrails, continuous monitoring, and resource level enforcement after resources exist.
As shown in Figure 3:
- OPA – Checks proposed changes before deployment
- AWS Organizations and Control Tower – Establish organizational guardrails
- AWS Config and Security Hub – Provide visibility and monitoring after resources exist
- Service-level protections – Enforce settings at the resource boundary
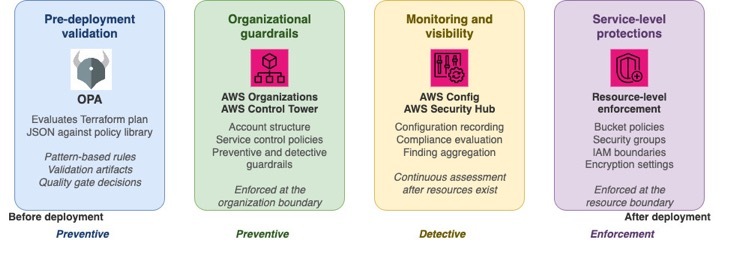
Figure 3: OPA validates changes pre-deployment; AWS services enforce guardrails, monitoring, and controls post-deployment
How to implement policy validation in your CI/CD pipeline
Use the following steps to integrate OPA policy evaluation into your delivery workflow:
Submit a change through a pull request or merge request.
- Run early validation checks such as formatting, syntax validation, and dependency checks.
- Generate a Terraform plan and convert it to JSON format.
- Evaluate the plan (JSON format) against the shared OPA policy library.
- Publish the validation report as an artifact.
- Run additional automated quality checks as needed.
- Use the validation artifact during approval decisions for higher-risk environments.
- Deploy approved changes.
- Continue post-deployment monitoring through AWS-native governance services.
Quality gates provide automated pass or fail results based on defined criteria. Approval gates control whether a change moves into a protected environment. This separation matters—manual approval isn’t the first place where anyone notices missing tags, a disallowed AWS Region, or public ingress. Automated checks identify those issues earlier. OPA belongs in the automated gate layer. Its output also feeds the approval process.
Structure your policy library by control domain and intent
A pattern-based library structure, as shown in the following sample, keeps the policy model closer to how teams talk about controls.
A compliance engineer might describe a requirement as mandatory metadata. A cloud engineer might describe the same requirement as a tagging standard. The pattern structure helps both teams talk about the same thing.
Example 1: Enforce secure transport for Amazon S3
This example demonstrates the protection enforcement pattern for Amazon Simple Storage Service (Amazon S3). The goal is to verify that S3 bucket access is protected in transit by requiring a bucket policy that denies requests when aws:SecureTransport is set to false.
The policy checks two things: whether an S3 bucket policy includes a deny statement that blocks non-encrypted requests, and whether an S3 bucket has any corresponding bucket policy at all. The rule evaluates both create and update actions in the Terraform plan JSON.
This example uses an explicit deny rather than an allow statement for secure transport. An explicit deny overrides allow statements that might exist elsewhere in the policy set, making it the stronger enforcement pattern.
When you adapt this example, decide whether you want to require one exact policy shape or support several equivalent forms of enforcement. A strict rule is more straightforward to reason about, but it might create false positives if teams already use alternate policy structures that achieve the same outcome.
Example 2: Restrict public ingress on sensitive ports
This example implements the exposure restriction pattern. The goal is to identify Amazon Virtual Private Cloud (Amazon VPC) security group configurations that allow public ingress on sensitive ports before those rules are deployed.
The policy evaluates both inline aws_security_group ingress rules and standalone aws_security_group_rule resources, because customer repositories often use both modeling styles.
This example checks directly for public ingress on sensitive ports rather than trying to infer whether later controls might reduce actual exposure. Security group rules are a direct expression of intended network reachability, making them the right place to enforce this pattern early.
When you adapt this example, review which ports to treat as sensitive, whether both IPv4 and IPv6 exposure need checking, and how to handle approved exceptions.
Example 3: Enforce least privilege trust policy for IAM roles
This example implements the privilege constraint pattern for IAM role trust policies. The goal is to identify trust relationships that allow overly broad principals to assume a role. The policy inspects the assume_role_policy document for aws_iam_role resources and looks for wildcard principals in three valid representations: Principal is "*", Principal.AWS is "*", and Principal.AWS is an array containing "*". A wildcard principal allows a broader set of callers than most environments intend to permit. By treating wildcard principals as the prohibited pattern, the rule enforces a safer default and returns a clear result that reviewers can understand quickly.
When you adapt this example, decide what least privilege means for your IAM trust model. The key design choice is whether your policy checks for a single prohibited pattern or validates trust relationships against an approved set of trusted principals and conditions.
AWS Labs provides IAM Policy Autopilot, an open-source Model Context Protocol (MCP) server and command-line tool that helps generate baseline identity-based IAM policies from application code. That is adjacent to the pattern shown here —IAM Policy Autopilot helps with policy generation, while this example focuses on validating whether IAM role trust policies are scoped appropriately in infrastructure changes.
CI/CD implementation examples
The following examples show the same operating model in two common CI/CD systems. The syntax changes, but the sequence stays the same: validate, plan, evaluate policy, retain the artifact, and use the result during promotion and approval. These examples assume OPA is installed in your CI/CD environment, the opa-policies directory contains your policy library, and Terraform is configured with appropriate credentials.
Retain validation artifacts for review and audit support
In mature delivery workflows, policy results don’t disappear into pipeline logs but are retained as validation artifacts. Those artifacts help reviewers decide whether a change is ready for approval, supports exception handling by showing which controls failed and why, and can stay with the change record for later audit discussions. At a minimum, the artifact identifies the change or pipeline run, the evaluated scope, the policy package or version, the checks that ran, and the pass or fail results.
Test the policy model like software
The first few rules are usually straightforward.The real work starts when the library grows and multiple teams depend on it. Testing includes:
- Positive and negative test cases – Each policy has cases that show valid input and cases that show expected failures.
- Regression coverage – Shared helpers need regression coverage.
- Realistic fixtures – Terraform plan fixtures look like real changes rather than tiny made-up samples.
- Impact analysis – When a rule changes, teams can tell quickly what else might be affected.
If developers stop trusting the results, they stop treating policy as a useful mechanism.
A phased approach to rolling out policy checks
You don’t need broad coverage on day one. A phased rollout works better than an all at once enforcement approach.
Phase 1: Assess and pilot
- Start in advisory mode so teams can see results without being blocked.
- Identify two or three high-confidence patterns such as required metadata, approved Regions, or public exposure restrictions.
- Run OPA against existing pipelines and review the output for accuracy.
Phase 2: Begin enforcement
- Enforce the small set of high-confidence patterns after the output is stable and the failures are useful.
- Integrate validation artifacts into your approval workflow.
- Establish ownership and exception handling processes for shared packages.
Phase 3: Operationalize and expand
- Formalize versioning for shared policy packages.
- Expand pattern coverage based on team feedback and organizational priorities.
- Connect pre-deployment validation with post-deployment monitoring through AWS Config, AWS Security Hub, and AWS Organizations.
Conclusion
Policy as code helps narrow the distance between what an organization says it expects and what its delivery system checks. By implementing these OPA patterns in your CI/CD pipelines, you can build a preventive layer that evaluates infrastructure changes before deployment. With a pattern-based library, validation artifacts, and clear ownership, policy as code becomes a repeatable way to help translate control intent into day-to-day delivery, while AWS governance services continue to provide visibility and monitoring after resources exist.
To learn more about policy as code and AWS governance capabilities, see:
- Contact AWS Security Assurance Services – Get help with your compliance engineering journey
- Open Policy Agent Documentation – Read the official OPA documentation and policy language reference
- AWS Security Hub User Guide – Learn how to aggregate and prioritize security findings
- AWS Well-Architected Framework: Security pillar – Review security best practices for your workloads
- AWS Config Developer Guide – Learn how to monitor and record resource configurations
- IAM Policy Autopilot – An open source command line interface (CLI) and MCP server from AWS Labs that helps generate IAM policies
If you have feedback about this post, submit comments in the Comments section below.
Firefox 151.0 released
Post Syndicated from corbet original https://lwn.net/Articles/1073579/
Version
151.0 of the Firefox browser has been released. Significant changes
include the ability to clear and restart a private-browsing session, better
fingerprinting protection, control over the apparent location when using the
Firefox VPN, and more.