Offset lag metric for Amazon MSK as an event source for Lambda

Post Syndicated from Eric Johnson original https://aws.amazon.com/blogs/compute/offset-lag-metric-for-amazon-msk-as-an-event-source-for-lambda/

This post written by Adam Wagner, Principal Serverless Solutions Architect.

Last year, AWS announced support for Amazon Managed Streaming for Apache Kafka (MSK) and self-managed Apache Kafka clusters as event sources for AWS Lambda. Today, AWS adds a new OffsetLag metric to Lambda functions with MSK or self-managed Apache Kafka event sources.

Offset in Apache Kafka is an integer that marks the current position of a consumer. OffsetLag is the difference in offset between the last record written to the Kafka topic and the last record processed by Lambda. Kafka expresses this in the number of records, not a measure of time. This metric provides visibility into whether your Lambda function is keeping up with the records added to the topic it is processing.

This blog walks through using the OffsetLag metric along with other Lambda and MSK metrics to understand your streaming application and optimize your Lambda function.

Overview

In this example application, a producer writes messages to a topic on the MSK cluster that is an event source for a Lambda function. Each message contains a number and the Lambda function finds the factors of that number. It outputs the input number and results to an Amazon DynamoDB table.

Finding all the factors of a number is fast if the number is small but takes longer for larger numbers. This difference means the size of the number written to the MSK topic influences the Lambda function duration.

Example application architecture

Example application architecture

  1. A Kafka client writes messages to a topic in the MSK cluster.
  2. The Lambda event source polls the MSK topic on your behalf for new messages and triggers your Lambda function with batches of messages.
  3. The Lambda function factors the number in each message and then writes the results to DynamoDB.

In this application, several factors can contribute to offset lag. The first is the volume and size of messages. If more messages are coming in, the Lambda may take longer to process them. Other factors are the number of partitions in the topic, and the number of concurrent Lambda functions processing messages. A full explanation of how Lambda concurrency scales with the MSK event source is in the documentation.

If the average duration of your Lambda function increases, this also tends to increase the offset lag. This lag could be latency in a downstream service or due to the complexity of the incoming messages. Lastly, if your Lambda function errors, the MSK event source retries the identical records set until they succeed. This retry functionality also increases offset lag.

Measuring OffsetLag

To understand how the new OffsetLag metric works, you first need a working MSK topic as an event source for a Lambda function. Follow this blog post to set up an MSK instance.

To find the OffsetLag metric, go to the CloudWatch console, select All Metrics from the left-hand menu. Then select Lambda, followed by By Function Name to see a list of metrics by Lambda function. Scroll or use the search bar to find the metrics for this function and select OffsetLag.

OffsetLag metric example

OffsetLag metric example

To make it easier to look at multiple metrics at once, create a CloudWatch dashboard starting with the OffsetLag metric. Select Actions -> Add to Dashboard. Select the Create new button, provide the dashboard a name. Choose Create, keeping the rest of the options at the defaults.

Adding OffsetLag to dashboard

Adding OffsetLag to dashboard

After choosing Add to dashboard, the new dashboard appears. Choose the Add widget button to add the Lambda duration metric from the same function. Add another widget that combines both Lambda errors and invocations for the function. Finally, add a widget for the BytesInPerSec metric for the MSK topic. Find this metric under AWS/Kafka -> Broker ID, Cluster Name, Topic. Finally, click Save dashboard.

After a few minutes, you see a steady stream of invocations, as you would expect when consuming from a busy topic.

Data incoming to dashboard

Data incoming to dashboard

This example is a CloudWatch dashboard showing the Lambda OffsetLag, Duration, Errors, and Invocations, along with the BytesInPerSec for the MSK topic.

In this example, the OffSetLag metric is averaging about eight, indicating that the Lambda function is eight records behind the latest record in the topic. While this is acceptable, there is room for improvement.

The first thing to look for is Lambda function errors, which can drive up offset lag. The metrics show that there are no errors so the next step is to evaluate and optimize the code.

The Lambda handler function loops through the records and calls the process_msg function on each record:

def lambda_handler(event, context):
    for batch in event['records'].keys():
        for record in event['records'][batch]:
            try:
                process_msg(record)
            except:
                print("error processing record:", record)
    return()

The process_msg function handles base64 decoding, calls a factor function to factor the number, and writes the record to a DynamoDB table:

def process_msg(record):
    #messages are base64 encoded, so we decode it here
    msg_value = base64.b64decode(record['value']).decode()
    msg_dict = json.loads(msg_value)
    #using the number as the hash key in the dynamodb table
    msg_id = f"{msg_dict['number']}"
    if msg_dict['number'] <= MAX_NUMBER:
        factors = factor_number(msg_dict['number'])
        print(f"number: {msg_dict['number']} has factors: {factors}")
        item = {'msg_id': msg_id, 'msg':msg_value, 'factors':factors}
        resp = ddb_table.put_item(Item=item)
    else:
        print(f"ERROR: {msg_dict['number']} is >= limit of {MAX_NUMBER}")

The heavy computation takes place in the factor function:

def factor(number):
    factors = [1,number]
    for x in range(2, (int(1 + number / 2))):
        if (number % x) == 0:
            factors.append(x)
    return factors

The code loops through all numbers up to the factored number divided by two. The code is optimized by only looping up to the square root of the number.

def factor(number):
    factors = [1,number]
    for x in range(2, 1 + int(number**0.5)):
        if (number % x) == 0:
            factors.append(x)
            factors.append(number // x)
    return factors

There are further optimizations and libraries for factoring numbers but this provides a noticeable performance improvement in this example.

Data after optimization

Data after optimization

After deploying the code, refresh the metrics after a while to see the improvements:

The average Lambda duration has dropped to single-digit milliseconds and the OffsetLag is now averaging two.

If you see a noticeable change in the OffsetLag metric, there are several things to investigate. The input side of the system, increased messages per second, or a significant increase in the size of the message are a few options.

Conclusion

This post walks through implementing the OffsetLag metric to understand latency between the latest messages in the MSK topic and the records a Lambda function is processing. It also reviews other metrics that help understand the underlying cause of increases to the offset lag. For more information on this topic, refer to the documentation and other MSK Lambda metrics.

For more serverless learning resources, visit Serverless Land.

New – Amazon EC2 R6i Memory-Optimized Instances Powered by the Latest Generation Intel Xeon Scalable Processors

Post Syndicated from Danilo Poccia original https://aws.amazon.com/blogs/aws/new-amazon-ec2-r6i-memory-optimized-instances-powered-by-the-latest-generation-intel-xeon-scalable-processors/

In August, we introduced the general-purpose Amazon EC2 M6i instances powered by the latest generation Intel Xeon Scalable processors (code-named Ice Lake) with an all-core turbo frequency of 3.5 GHz. Compute-optimized EC2 C6i instances were also made available last month.

Today, I am happy to share that we are expanding our sixth-generation x86-based offerings to include memory-optimized Amazon EC2 R6i instances.

Here’s a quick recap of the advantages of the new R6i instances compared to R5 instances:

  • A larger instance size (r6i.32xlarge) with 128 vCPUs and 1,024 GiB of memory that makes it easier and more cost-efficient to consolidate workloads and scale up applications
  • Up to 15 percent improvement in compute price/performance
  • Up to 20 percent higher memory bandwidth
  • Up to 40 Gbps for Amazon Elastic Block Store (EBS) and 50 Gbps for networking which is 2x more than R5 instances
  • Always-on memory encryption.

R6i instances are SAP Certified and are an ideal fit for memory-intensive workloads such as SQL and NoSQL databases, distributed web scale in-memory caches like Memcached and Redis, in-memory databases, and real-time big data analytics like Apache Hadoop and Apache Spark clusters.

Compared to M6i and C6i instances, the only difference is in the amount of memory that is included per vCPU. R6i instances are available in ten sizes:

Name vCPUs Memory
(GiB)
Network Bandwidth
(Gbps)
EBS Throughput
(Gbps)
r6i.large 2 16 Up to 12.5 Up to 10
r6i.xlarge 4 32 Up to 12.5 Up to 10
r6i.2xlarge 8 64 Up to 12.5 Up to 10
r6i.4xlarge 16 128 Up to 12.5 Up to 10
r6i.8xlarge 32 256 12.5 10
r6i.12xlarge 48 384 18.75 15
r6i.16xlarge 64 512 25 20
r6i.24xlarge 96 768 37.5 30
r6i.32xlarge 128 1024 50 40
r6i.metal 128 1024 50 40

Like M6i and C6i instances, these new R6i instances are built on the AWS Nitro System, which is a collection of building blocks that offloads many of the traditional virtualization functions to dedicated hardware, delivering high performance, high availability, and highly secure cloud instances.

As with all sixth generation EC2 instances, you may need to upgrade your Elastic Network Adapter (ENA) for optimal networking performance. For more information, see this article about migrating an EC2 instance to a sixth-generation instance in the AWS Knowledge Center.

R6i instances support Elastic Fabric Adapter (EFA) on r6i.32xlarge and r6i.metal instances for workloads that benefit from lower network latency, such as HPC and video processing.

Availability and Pricing
EC2 R6i instances are available today in four AWS Regions: US East (N. Virginia), US West (Oregon), US East (Ohio), Europe (Ireland). As usual with EC2, you pay for what you use. For more information, see the EC2 pricing page.

— Danilo

Expanding cross-Region event routing with Amazon EventBridge

Post Syndicated from James Beswick original https://aws.amazon.com/blogs/compute/expanding-cross-region-event-routing-with-amazon-eventbridge/

This post is written by Stephen Liedig, Sr Serverless Specialist SA.

In April 2021, AWS announced a new feature for Amazon EventBridge that allows you to route events from any commercial AWS Region to US East (N. Virginia), US West (Oregon), and Europe (Ireland). From today, you can now route events between any AWS Regions, except AWS GovCloud (US) and China.

EventBridge enables developers to create event-driven applications by routing events between AWS services, integrated software as a service (SaaS) applications, and your own applications. This helps you produce loosely coupled, distributed, and maintainable architectures. With these new capabilities, you can now route events across Regions and accounts using the same model used to route events to existing targets.

Cross-Region event routing with Amazon EventBridge makes it easier for customers to develop multi-Region workloads to:

  • Centralize your AWS events into one Region for auditing and monitoring purposes, such as aggregating security events for compliance reasons in a single account.
  • Replicate events from source to destinations Regions to help synchronize data in cross-Region data stores.
  • Invoke asynchronous workflows in a different Region from a source event. For example, you can load balance from a target Region by routing events to another Region.

A previous post shows how cross-Region routing works. This blog post expands on these concepts and discusses a common use case for cross-Region event delivery – event auditing. This example explores how you can manage resources using AWS CloudFormation and EventBridge resource policies.

Multi-Region event auditing example walkthrough

Compliance is an important part of building event-driven applications and reacting to any potential policy or security violations. Customers use EventBridge to route security events from applications and globally distributed infrastructure into a single account for analysis. In many cases, they share specific AWS CloudTrail events with security teams. Customers also audit events from their custom-built applications to monitor sensitive data usage.

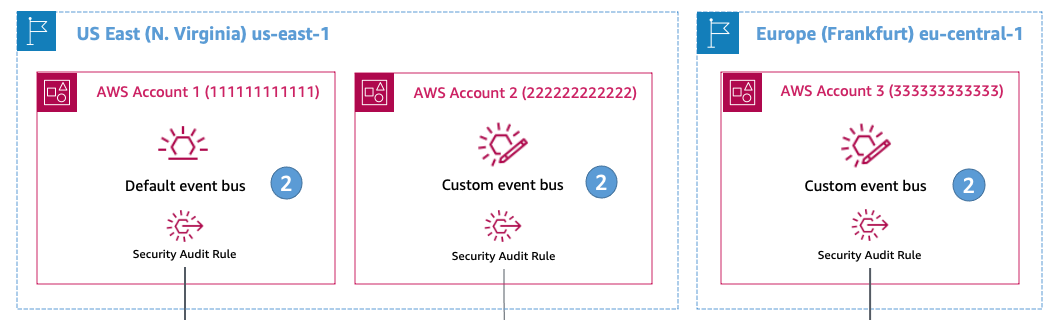
In this scenario, a company has their base of operations located in Asia Pacific (Singapore) with applications distributed across US East (N. Virginia) and Europe (Frankfurt). The applications in US East (N. Virginia) and Europe (Frankfurt) are using EventBridge for their respective applications and services. The security team in Asia Pacific (Singapore) wants to analyze events from the applications and CloudTrail events for specific API calls to monitor infrastructure security.

Reference architecture

To create the rules to receive these events:

  1. Create a new set of rules directly on all the event buses across the global infrastructure. Alternatively, delegate the responsibility of managing security rules to distributed teams that manage the event bus resources.
  2. Provide the security team with the ability to manage rules centrally, and control the lifecycle of rules on the global infrastructure.

Allowing the security team to manage the resources centrally provides more scalability. It is more consistent with the design principle that event consumers own and manage the rules that define how they process events.

Deploying the example application

The following code snippets are shortened for brevity. The full source code of the solution is in the GitHub repository. The solution uses AWS Serverless Application Model (AWS SAM) for deployment. Clone the repo and navigate to the solution directory:

git clone https://github.com/aws-samples/amazon-eventbridge-resource-policy-samples
cd ./patterns/ cross-region-cross-account-pattern/

To allow the security team to start receiving accounts from any of the cross-Region accounts:

1. Create a security event bus in the Asia Pacific (Singapore) Region with a rule that processes events from the respective event sources.

ap-southest-1 architecture

For simplicity, this example uses an Amazon CloudWatch Logs target to visualize the events arriving from cross-Region accounts:

 SecurityEventBus:
  Type: AWS::Events::EventBus
  Properties:
   Name: !Ref SecurityEventBusName

 # This rule processes events coming in from cross-Region accounts
 SecurityAnalysisRule:
  Type: AWS::Events::Rule
  Properties:
   Name: SecurityAnalysisRule
   Description: Analyze events from cross-Region event buses
   EventBusName: !GetAtt SecurityEventBus.Arn
   EventPattern:
    source:
     - anything-but: com.company.security
   State: ENABLED
   RoleArn: !GetAtt WriteToCwlRole.Arn
   Targets:
    - Id: SendEventToSecurityAnalysisRule
     Arn: !Sub "arn:aws:logs:${AWS::Region}:${AWS::AccountId}:log-group:${SecurityAnalysisRuleTarget}"

In this example, you set the event pattern to process any event from a source that is not from the security team’s own domain. This allows you to process events from any account in any Region. You can filter this further as needed.

2. Set an event bus policy on each default and custom event bus that the security team must receive events from.

Event bus policy

This policy allows the security team to create rules to route events to its own security event bus in the Asia Pacific (Singapore) Region. The following policy defines a custom event bus in Account 2 in US East (N. Virginia) and an AWS::Events::EventBusPolicy that sets the Principal as the security team account.

This allows the security team to manage rules on the CustomEventBus:

 CustomEventBus: 
  Type: AWS::Events::EventBus
  Properties: 
    Name: !Ref EventBusName

 SecurityServiceRuleCreationStatement:
  Type: AWS::Events::EventBusPolicy
  Properties:
   EventBusName: !Ref CustomEventBus # If you omit this, the default event bus is used.
   StatementId: "AllowCrossRegionRulesForSecurityTeam"
   Statement:
    Effect: "Allow"
    Principal:
     AWS: !Sub "arn:aws:iam::${SecurityAccountNo}:root"
    Action:
     - "events:PutRule"
     - "events:DeleteRule"
     - "events:DescribeRule"
     - "events:DisableRule"
     - "events:EnableRule"
     - "events:PutTargets"
     - "events:RemoveTargets"
    Resource:
     - !Sub 'arn:aws:events:${AWS::Region}:${AWS::AccountId}:rule/${CustomEventBus.Name}/*'
    Condition:
     StringEqualsIfExists:
      "events:creatorAccount": "${aws:PrincipalAccount}"

3. With the policies set on the cross-Region accounts, now create the rules. Because you cannot create CloudFormation resources across Regions, you must define the rules in separate templates. This also gives the ability to expand to other Regions.

Once the template is deployed to the cross-Region accounts, use EventBridge resource policies to propagate rule definitions across accounts in the same Region. The security account must have permission to create CloudFormation resources in the cross-Region accounts to deploy the rule templates.

Resource policies

There are two parts to the rule templates. The first specifies a role that allows EventBridge to assume a role to send events to the target event bus in the security account:

 # This IAM role allows EventBridge to assume the permissions necessary to send events
 # from the source event buses to the destination event bus.
 SourceToDestinationEventBusRole:
  Type: "AWS::IAM::Role"
  Properties:
   AssumeRolePolicyDocument:
    Version: 2012-10-17
    Statement:
     - Effect: Allow
      Principal:
       Service:
        - events.amazonaws.com
      Action:
       - "sts:AssumeRole"
   Path: /
   Policies:
    - PolicyName: PutEventsOnDestinationEventBus
     PolicyDocument:
      Version: 2012-10-17
      Statement:
       - Effect: Allow
        Action: "events:PutEvents"
        Resource:
         - !Ref SecurityEventBusArn

The second is the definition of the rule resource. This requires the Amazon Resource Name (ARN) of the event bus where you want to put the rule, the ARN of the target event bus in the security account, and a reference to the SourceToDestinationEventBusRole role:

 SecurityAuditRule2:
  Type: AWS::Events::Rule
  Properties:
   Name: SecurityAuditRuleAccount2
   Description: Audit rule for the Security team in Singapore
   EventBusName: !Ref EventBusArnAccount2 # ARN of the custom event bus in Account 2
   EventPattern:
    source:
     - com.company.marketing
   State: ENABLED
   Targets:
    - Id: SendEventToSecurityEventBusArn
     Arn: !Ref SecurityEventBusArn
     RoleArn: !GetAtt SourceToDestinationEventBusRole.Arn

You can use the AWS SAM CLI to deploy this:

sam deploy -t us-east-1-rules.yaml \
  --stack-name us-east-1-rules \
  --region us-east-1 \
  --profile default \
  --capabilities=CAPABILITY_IAM \
  --parameter-overrides SecurityEventBusArn="arn:aws:events:ap-southeast-1:111111111111:event-bus/SecurityEventBus" EventBusArnAccount1="arn:aws:events:us-east-1:111111111111:event-bus/default" EventBusArnAccount2="arn:aws:events:us-east-1:222222222222:event-bus/custom-eventbus-account-2"

Testing the example application

With the rules deployed across the Regions, you can test by sending events to the event bus in Account 2:

  1. Navigate to the applications/account_2 directory. Here you find an events.json file, which you use as input for the put-events API call.
  2. Run the following command using the AWS CLI. This sends messages to the event bus in us-east-1 which are routed to the security event bus in ap-southeast-1:
    aws events put-events \
     --region us-east-1 \
     --profile [NAMED PROFILE FOR ACCOUNT 2] \
     --entries file://events.json
    

    If you have run this successfully, you see:
    Entries:
    - EventId: a423b35e-3df0-e5dc-b854-db9c42144fa2
    - EventId: 5f22aea8-51ea-371f-7a5f-8300f1c93973
    - EventId: 7279fa46-11a6-7495-d7bb-436e391cfcab
    - EventId: b1e1ecc1-03f7-e3ef-9aa4-5ac3c8625cc7
    - EventId: b68cea94-28e2-bfb9-7b1f-9b2c5089f430
    - EventId: fc48a303-a1b2-bda8-8488-32daa5f809d8
    FailedEntryCount: 0

  3. Navigate to the Amazon CloudWatch console to see a collection of log entries with the events you published. The log group is /aws/events/SecurityAnalysisRule.CloudWatch Logs

Congratulations, you have successfully sent your first events across accounts and Regions!

Conclusion

With cross-Region event routing in EventBridge, you can now route events to and from any AWS Region. This post explains how to manage and configure cross-Region event routing using CloudFormation and EventBridge resource policies to simplify rule propagation across your global event bus infrastructure. Finally, I walk through an example you can deploy to your AWS account.

For more serverless learning resources, visit Serverless Land.

AWS Security Profiles: J.D. Bean, Sr. Security Solutions Architect

Post Syndicated from Maddie Bacon original https://aws.amazon.com/blogs/security/aws-security-profiles-j-d-bean-sr-security-solutions-architect/

JD Bean AWS Security Profile
In the week leading up to AWS re:Invent 2021, we’ll share conversations we’ve had with people at AWS who will be presenting, and get a sneak peek at their work.


How long have you been at AWS, and what do you do in your current role?

I’m coming up on my three-year anniversary at AWS. Which, as I say it out loud, is hard to believe. It feels as if the time has passed in the blink of an eye. I’m a Solutions Architect with a specialty in security. I work primarily with AWS Strategic Accounts, a set of companies at the forefront of innovation. I partner with my customers to help them design, build, and deploy secure and compliant cloud workloads.

How did you get started in security?

Security began as a hobby for me, and I found it came quite naturally. Perhaps it’s just the way my brain is wired, but I often found security was a topic that consistently drew me in. I leaned into security professionally, and I really enjoy it. AWS makes security its top priority, which is really exciting as a security professional. I’m the kind of person who loves to understand how all the pieces of a system fit together, and AWS Security has been an incredible opportunity, letting me carry my depth of expertise to all sorts of interesting new technical areas such as IoT, HPC, and AI/ML.

How do you explain your job to non-tech friends?

I often say that I work as an AWS Solutions Architect, which means I work with AWS customers to help design their cloud environments and projects, and that I specifically focus on security. If they’re interested in hearing more, I tell them AWS offers a wide array of services customers can configure and combine in all sorts of different ways to fit their needs. If they’re anything like me, I use the analogy of my own experience at hardware stores. In a way, part of what I do is to act like that helpful person at the hardware store who understands what all the tools and equipment do, how to use them correctly, and how they interact with one another. I partner with AWS customers to learn about their project requirements and help them work backwards from those requirements to determine the best approach for achieving their goals.

What are you currently working on that you’re excited about?

I’m working with my customers on a bunch of exciting projects for establishing security, governance, and compliance at scale. I’ve also been returning to my roots and spending more time focusing on open-source software, which is a big passion area for me both personally and professionally.

You’re presenting at AWS re:Invent this year—can you give readers a sneak peek at what you’re covering?

I’m presenting two sessions this year. The first session is a builder session called Grant least privilege temporary access securely at scale (WPS304). We’ll use AWS Secrets Manager, AWS Identity and Access Management (IAM), and the isolated compute functionality provided by AWS Nitro Enclaves to allow system administrators to request and retrieve narrowly scoped and limited-time access.

My second session is the Using AWS Nitro Enclaves to process highly sensitive data workshop (SEC304). AWS Nitro Enclaves allow customers to create an isolated, hardened, and highly constrained environment to host security-critical applications. A lot of work has gone in to building this workshop over the past few months, and I’m excited to share it at re:Invent.

The workshop gives attendees an opportunity to get hands-on, practical experience with AWS Nitro Enclaves. Attendees will get experience launching enclave applications, using the Nitro Enclaves secure local channel for communication. Attendees will also work with Nitro Enclaves’ included cryptographic attestation features and integration with AWS Key Management Services. After putting all these elements together, attendees will be able to see how you can be sure that only your authorized code in your Nitro Enclave is able to access sensitive material.

For those who won’t be able to join the re:Invent workshop session in person, the AWS Nitro Enclaves Workshop is available online and can be completed in your own account at any time.

What are you hoping the audience will take away from the session(s)?

I hope attendees will come away from the session with a sense of how approachable and flexible AWS Nitro Enclaves are, and start to formulate ideas for how they can use Nitro Enclaves in their own workloads.

From your perspective, what’s the biggest thing happening in confidential computing right now?

Over the last year I’ve seen a big increase in interest from customers around confidential computing. This is how we’ve been approaching the design of the AWS Nitro System for many years now. The Nitro System, the underlying platform for all modern Amazon EC2 instances, already provides confidential computing protections by default.

More recently, AWS Nitro Enclaves has offered a new capability for customers to divide their own workloads into more-trusted and less-trusted components. The isolation of workload components in AWS Nitro Enclaves is powered by the specialized hardware and associated firmware of the Nitro System.

What’s your favorite Leadership Principle at Amazon and why?

My favorite Amazon Leadership principle is Learn and Be Curious. I think I’m at my best when I’m learning, growing, and pushing outward at the edges. AWS is such an incredible place to work for people who love to learn. AWS is constantly innovating and inventing for our customers, and learning is central to the culture here.

What’s the best career advice you’ve ever received?

One piece of advice I’ve held close from an early age is just how important it is to be comfortable saying “I don’t know”—ideally followed by “but I’d like to find out.” This has served me well in life, both professionally and personally.

Another is “lead with trust.” Being willing to be vulnerable and assume the best of others goes a long way. At Amazon, one of our leadership principles is Earn Trust. I’ve found how important it is to set an example of offering trust to others. Most people tend to rise to a challenge. If you enter new interactions with a default expectation of trusting others, more often than not, your trust ends up being well-placed.

If you had to pick any other job, what would you want to do?

It’s funny you ask that. I still think of my current role as the “other job” I daydream about. I began my professional life in the legal field. Admittedly, my work was primarily focused around open-source software, so it wasn’t entirely unrelated to what I do now, but I really do feel like being a Solutions Architect is a second phase in my career. I’m enjoying this new chapter too much to give doing anything else much thought.

If you were to really press me, I’d say that my wife, who’s a psychologist, tells me I missed my calling as a therapist. I take that as a real compliment.

Author

J. D. Bean

J.D. is a senior security specialist Solutions Architect for AWS Strategic Accounts based out of New York City. His interests include security, privacy, and compliance. He is passionate about his work enabling AWS customers’ successful cloud journeys. J.D. holds a Bachelor of Arts from The George Washington University and a Juris Doctor from New York University School of Law.

Author

Maddie Bacon

Maddie (she/her) is a technical writer for AWS Security with a passion for creating meaningful content. She previously worked as a security reporter and editor at TechTarget and has a BA in Mathematics. In her spare time, she enjoys reading, traveling, and all things Harry Potter.

Provide data reliability in Amazon Redshift at scale using Great Expectations library

Post Syndicated from Faizan Ahmed original https://aws.amazon.com/blogs/big-data/provide-data-reliability-in-amazon-redshift-at-scale-using-great-expectations-library/

Ensuring data reliability is one of the key objectives of maintaining data integrity and is crucial for building data trust across an organization. Data reliability means that the data is complete and accurate. It’s the catalyst for delivering trusted data analytics and insights. Incomplete or inaccurate data leads business leaders and data analysts to make poor decisions, which can lead to negative downstream impacts and subsequently may result in teams spending valuable time and money correcting the data later on. Therefore, it’s always a best practice to run data reliability checks before loading the data into any targets like Amazon Redshift, Amazon DynamoDB, or Amazon Timestream databases.

This post discusses a solution for running data reliability checks before loading the data into a target table in Amazon Redshift using the open-source library Great Expectations. You can automate the process for data checks via the extensive built-in Great Expectations glossary of rules using PySpark, and it’s flexible for adding or creating new customized rules for your use case.

Amazon Redshift is a cloud data warehouse solution and delivers up to three times better price-performance than other cloud data warehouses. With Amazon Redshift, you can query and combine exabytes of structured and semi-structured data across your data warehouse, operational database, and data lake using standard SQL. Amazon Redshift lets you save the results of your queries back to your Amazon Simple Storage Service (Amazon S3) data lake using open formats like Apache Parquet, so that you can perform additional analytics from other analytics services like Amazon EMR, Amazon Athena, and Amazon SageMaker.

Great Expectations (GE) is an open-source library and is available in GitHub for public use. It helps data teams eliminate pipeline debt through data testing, documentation, and profiling. Great Expectations helps build trust, confidence, and integrity of data across data engineering and data science teams in your organization. GE offers a variety of expectations developers can configure. The tool defines expectations as statements describing verifiable properties of a dataset. Not only does it offer a glossary of more than 50 built-in expectations, it also allows data engineers and scientists to write custom expectation functions.

Use case overview

Before performing analytics or building machine learning (ML) models, cleaning data can take up a lot of time in the project cycle. Without automated and systematic data quality checks, we may spend most of our time cleaning data and hand-coding one-off quality checks. As most data engineers and scientists know, this process can be both tedious and error-prone.

Having an automated quality check system is critical to project efficiency and data integrity. Such systems help us understand data quality expectations and the business rules behind them, know what to expect in our data analysis, and make communicating the data’s intricacies much easier. For example, in a raw dataset of customer profiles of a business, if there’s a column for date of birth in format YYYY-mm-dd, values like 1000-09-01 would be correctly parsed as a date type. However, logically this value would be incorrect in 2021, because the age of the person would be 1021 years, which is impossible.

Another use case could be to use GE for streaming analytics, where you can use AWS Database Migration Service (AWS DMS) to migrate a relational database management system. AWS DMS can export change data capture (CDC) files in Parquet format to Amazon S3, where these files can then be cleansed by an AWS Glue job using GE and written to either a destination bucket for Athena consumption or the rows can be streamed in AVRO format to Amazon Kinesis or Kafka.

Additionally, automated data quality checks can be versioned and also bring benefit in the form of optimal data monitoring and reduced human intervention. Data lineage in an automated data quality system can also indicate at which stage in the data pipeline the errors were introduced, which can help inform improvements in upstream systems.

Solution architecture

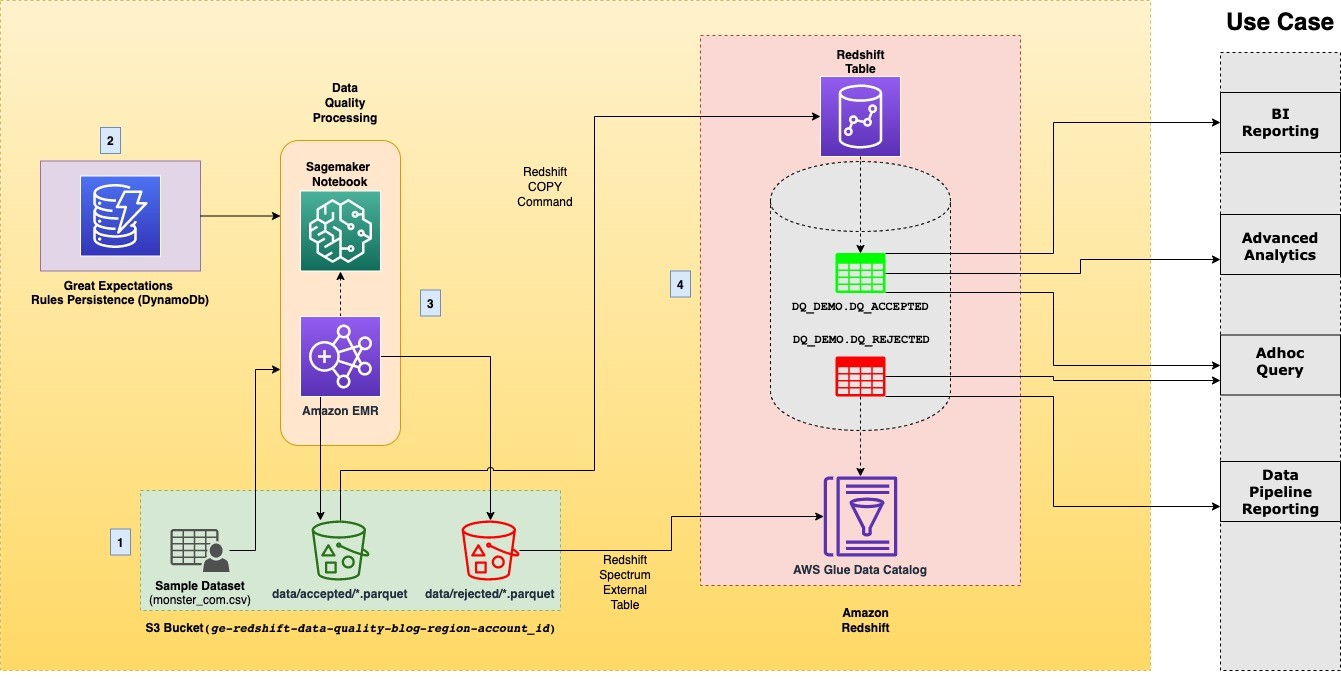
This post comes with a ready-to-use blueprint that automatically provisions the necessary infrastructure and spins up a SageMaker notebook that walks you step by step through the solution. Additionally, it enforces the best practices in data DevOps and infrastructure as code. The following diagram illustrates the solution architecture.

The architecture contains the following components:

  1. Data lake – When we run the AWS CloudFormation stack, an open-source sample dataset in CSV format is copied to an S3 bucket in your account. As an output of the solution, the data destination is an S3 bucket. This destination consists of two separate prefixes, each of which contains files in Parquet format, to distinguish between accepted and rejected data.
  2. DynamoDB – The CloudFormation stack persists data quality expectations in a DynamoDB table. Four predefined column expectations are populated by the stack in a table called redshift-ge-dq-dynamo-blog-rules. Apart from the pre-populated rules, you can add any rule from the Great Expectations glossary according to the data model showcased later in the post.
  3. Data quality processing – The solution utilizes a SageMaker notebook instance powered by Amazon EMR to process the sample dataset using PySpark (v3.1.1) and Great Expectations (v0.13.4). The notebook is automatically populated with the S3 bucket location and Amazon Redshift cluster identifier via the SageMaker lifecycle config provisioned by AWS CloudFormation.
  4. Amazon Redshift – We create internal and external tables in Amazon Redshift for the accepted and rejected datasets produced from processing the sample dataset. The external dq_rejected.monster_com_rejected table, for rejected data, uses Amazon Redshift Spectrum and creates an external database in the AWS Glue Data Catalog to reference the table. The dq_accepted.monster_com table is created as a regular Amazon Redshift table by using the COPY command.

Sample dataset

As part of this post, we have performed tests on the Monster.com job applicants sample dataset to demonstrate the data reliability checks using the Great Expectations library and loading data into an Amazon Redshift table.

The dataset contains nearly 22,000 different sample records with the following columns:

  • country
  • country_code
  • date_added
  • has_expired
  • job_board
  • job_description
  • job_title
  • job_type
  • location
  • organization
  • page_url
  • salary
  • sector
  • uniq_id

For this post, we have selected four columns with inconsistent or dirty data, namely organization, job_type, uniq_id, and location, whose inconsistencies are flagged according to the rules we define from the GE glossary as described later in the post.

Prerequisites

For this solution, you should have the following prerequisites:

  • An AWS account if you don’t have one already. For instructions, see Sign Up for AWS.
  • For this post, you can launch the CloudFormation stack in the following Regions:
    • us-east-1
    • us-east-2
    • us-west-1
    • us-west-2
  • An AWS Identity and Access Management (IAM) user. For instructions, see Create an IAM User.
  • The user should have create, write, and read access for the following AWS services:
  • Familiarity with Great Expectations and PySpark.

Set up the environment

Choose Launch Stack to start creating the required AWS resources for the notebook walkthrough:

For more information about Amazon Redshift cluster node types, see Overview of Amazon Redshift clusters. For the type of workflow described in this post, we recommend using the RA3 Instance Type family.

Run the notebooks

When the CloudFormation stack is complete, complete the following steps to run the notebooks:

  1. On the SageMaker console, choose Notebook instances in the navigation pane.

This opens the notebook instances in your Region. You should see a notebook titled redshift-ge-dq-EMR-blog-notebook.

  1. Choose Open Jupyter next to this notebook to open the Jupyter notebook interface.

You should see the Jupyter notebook file titled ge-redshift.ipynb.

  1. Choose the file to open the notebook and follow the steps to run the solution.

Run configurations to create a PySpark context

When the notebook is open, make sure the kernel is set to Sparkmagic (PySpark). Run the following block to set up Spark configs for a Spark context.

Create a Great Expectations context

In Great Expectations, your data context manages your project configuration. We create a data context for our solution by passing our S3 bucket location. The S3 bucket’s name, created by the stack, should already be populated within the cell block. Run the following block to create a context:

from great_expectations.data_context.types.base import DataContextConfig,DatasourceConfig,S3StoreBackendDefaults
from great_expectations.data_context import BaseDataContext

bucket_prefix = "ge-redshift-data-quality-blog"
bucket_name = "ge-redshift-data-quality-blog-region-account_id"
region_name = '-'.join(bucket_name.replace(bucket_prefix,'').split('-')[1:4])
dataset_path=f"s3://{bucket_name}/monster_com-job_sample.csv"
project_config = DataContextConfig(
    config_version=2,
    plugins_directory=None,
    config_variables_file_path=None,
    datasources={
        "my_spark_datasource": {
            "data_asset_type": {
                "class_name": "SparkDFDataset",//Setting dataset type to Spark
                "module_name": "great_expectations.dataset",
            },
            "spark_config": dict(spark.sparkContext.getConf().getAll()) //Passing Spark Session configs,
            "class_name": "SparkDFDatasource",
            "module_name": "great_expectations.datasource"
        }
    },
    store_backend_defaults=S3StoreBackendDefaults(default_bucket_name=bucket_name)//
)
context = BaseDataContext(project_config=project_config)

For more details on creating a GE context, see Getting started with Great Expectations.

Get GE validation rules from DynamoDB

Our CloudFormation stack created a DynamoDB table with prepopulated rows of expectations. The data model in DynamoDB describes the properties related to each dataset and its columns and the number of expectations you want to configure for each column. The following code describes an example of the data model for the column organization:

{
 "id": "job_reqs-organization", 
 "dataset_name": "job_reqs", 
 "rules": [ //list of expectations to apply to this column
  {
   "kwargs": {
    "result_format": "SUMMARY|COMPLETE|BASIC|BOOLEAN_ONLY" //The level of detail of the result
   },
   "name": "expect_column_values_to_not_be_null",//name of GE expectation   "reject_msg": "REJECT:null_values_found_in_organization"
  }
 ],
 "column_name": "organization"
}

The code contains the following parameters:

  • id – Unique ID of the document
  • dataset_name – Name of the dataset, for example monster_com
  • rules – List of GE expectations to apply:
    • kwargs – Parameters to pass to an individual expectation
    • name – Name of the expectation from the GE glossary
    • reject_msg – String to flag for any row that doesn’t pass this expectation
  • column_name – Name of dataset column to run the expectations on

Each column can have one or more expectations associated that it needs to pass. You can also add expectations for more columns or to existing columns by following the data model shown earlier. With this technique, you can automate verification of any number of data quality rules for your datasets without performing any code change. Apart from its flexibility, what makes GE powerful is the ability to create custom expectations if the GE glossary doesn’t cover your use case. For more details on creating custom expectations, see How to create custom Expectations.

Now run the cell block to fetch the GE rules from the DynamoDB client:

  1. Read the monster.com sample dataset and pass through validation rules.

After we have the expectations fetched from DynamoDB, we can read the raw CSV dataset. This dataset should already be copied to your S3 bucket location by the CloudFormation stack. You should see the following output after reading the CSV as a Spark DataFrame.

To evaluate whether a row passes each column’s expectations, we need to pass the necessary columns to a Spark user-defined function. This UDF evaluates each row in the DataFrame and appends the results of each expectation to a comments column.

Rows that pass all column expectations have a null value in the comments column.

A row that fails at least one column expectation is flagged with the string format REJECT:reject_msg_from_dynamo. For example, if a row has a null value in the organization column, then according to the rules defined in DynamoDB, the comments column is populated by the UDF as REJECT:null_values_found_in_organization.

The technique with which the UDF function recognizes a potentially erroneous column is done by evaluating the result dictionary generated by the Great Expectations library. The generation and structure of this dictionary is dependent upon the keyword argument of result_format. In short, if the count of unexpected column values of any column is greater than zero, we flag that as a rejected row.

  1. Split the resulting dataset into accepted and rejected DataFrames.

Now that we have all the rejected rows flagged in the source DataFrame within the comments column, we can use this property to split the original dataset into accepted and rejected DataFrames. In the previous step, we mentioned that we append an action message in the comments column for each failed expectation in a row. With this fact, we can select rejected rows that start with the string REJECT (alternatively, you can also filter by non-null values in the comments column to get the accepted rows). When we have the set of rejected rows, we can get the accepted rows as a separate DataFrame by using the following PySpark except function.

Write the DataFrames to Amazon S3.

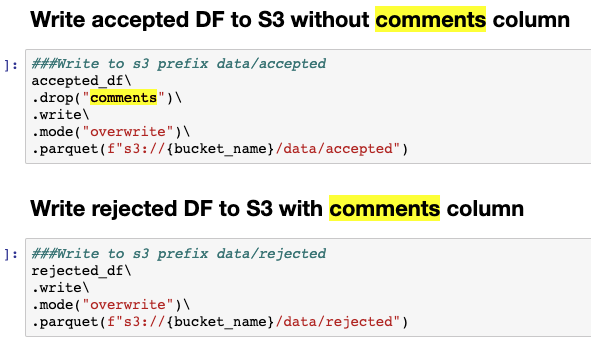
Now that we have the original DataFrame divided, we can write them both to Amazon S3 in Parquet format. We need to write the accepted DataFrame without the comments column because it’s only added to flag rejected rows. Run the cell blocks to write the Parquet files under appropriate prefixes as shown in the following screenshot.

Copy the accepted dataset to an Amazon Redshift table

Now that we have written the accepted dataset, we can use the Amazon Redshift COPY command to load this dataset into an Amazon Redshift table. The notebook outlines the steps required to create a table for the accepted dataset in Amazon Redshift using the Amazon Redshift Data API. After the table is created successfully, we can run the COPY command.

Another noteworthy point to mention is that one of the advantages that we witness due to the data quality approach described in this post is that the Amazon Redshift COPY command doesn’t fail due to schema or datatype errors for the columns, which have clear expectations defined that match the schema. Similarly, you can define expectations for every column in the table that satisfies the schema constraints and can be considered a dq_accepted.monster_com row.

Create an external table in Amazon Redshift for rejected data

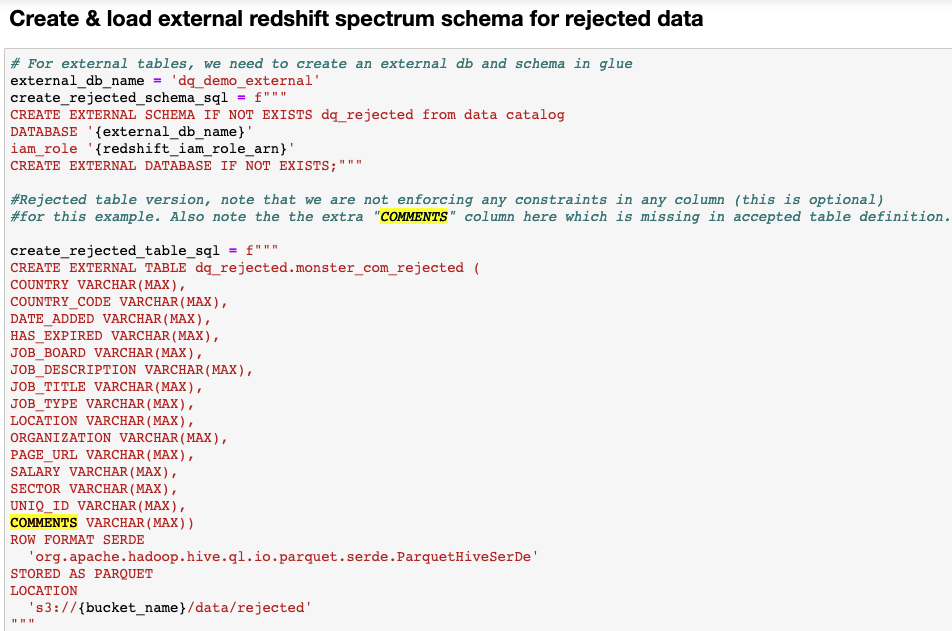
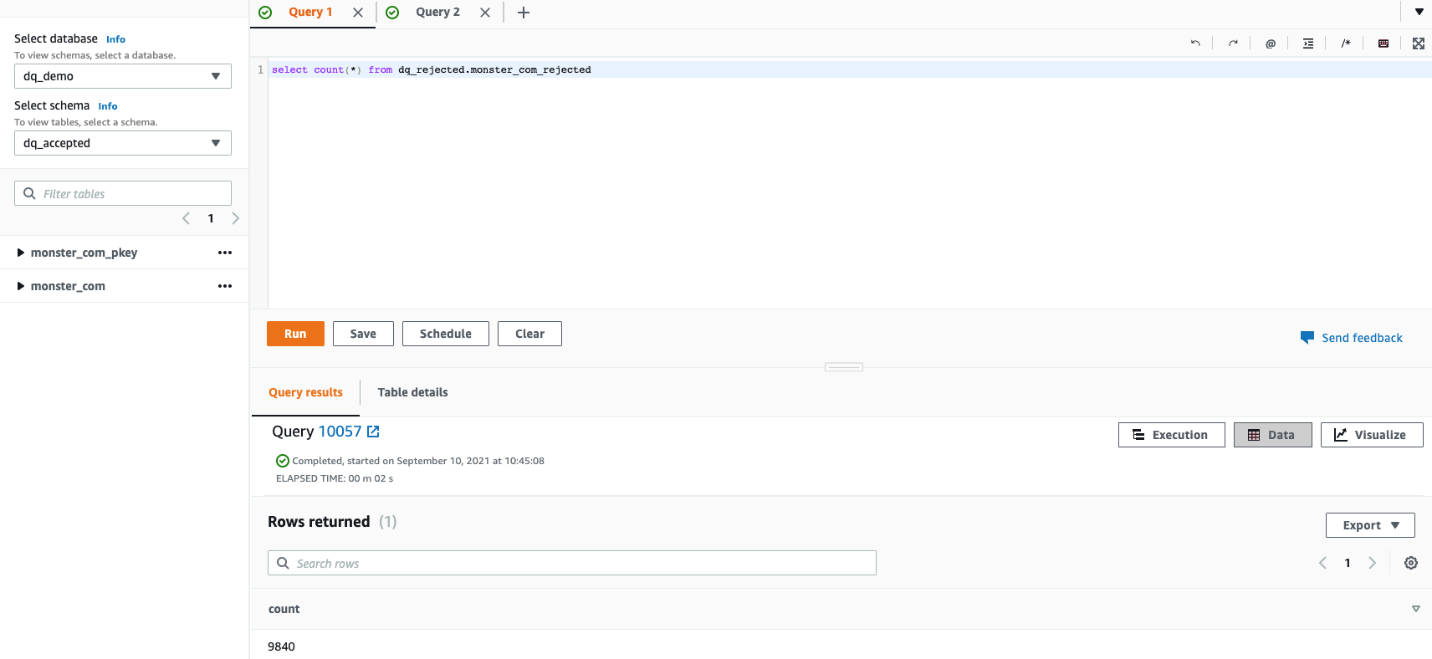
We need to have the rejected rows available to us in Amazon Redshift for comparative analysis. These comparative analyses can help inform upstream systems regarding the quality of data being collected and how they can be corrected to improve the overall quality of data. However, it isn’t wise to store the rejected data on the Amazon Redshift cluster, particularly for large tables, because it occupies extra disk space and increase cost. Instead, we use Redshift Spectrum to register an external table in an external schema in Amazon Redshift. The external schema lives in an external database in the AWS Glue Data Catalog and is referenced by Amazon Redshift. The following screenshot outlines the steps to create an external table.

Verify and compare the datasets in Amazon Redshift.

12,160 records got processed successfully out of a total of 22,000 from the input dataset, and were loaded to the monster_com table under the dq_accepted schema. These records successfully passed all the validation rules configured in DynamoDB.

A total 9,840 records got rejected due to breaking of one or more rules configured in DynamoDB and loaded to the monster_com_rejected table in the dq_rejected schema. In this section, we describe the behavior of each expectation on the dataset.

  • Expect column values to not be null in organization – This rule is configured to reject a row if the organization is null. The following query returns the sample of rows, from the dq_rejected.monster_com_rejected table, that are null in the organization column, with their reject message.
  • Expect column values to match the regex list in job_type – This rule expects the column entries to be strings that can be matched to either any of or all of a list of regular expressions. In our use case, we have only allowed values that match a pattern within [".*Full.*Time", ".*Part.*Time", ".*Contract.*"].
  • The following query shows rows that are rejected due to an invalid job type.

Most of the records were rejected with multiple reasons, and all those mismatches are captured under the comments column.

  • Expect column values to not match regex for uniq_id – Similar to the previous rule, this rule aims to reject any row whose value matches a certain pattern. In our case, that pattern is having an empty space (\s++) in the primary column uniq_id. This means we consider a value to be invalid if it has empty spaces in the string. The following query returned an invalid format for uniq_id.
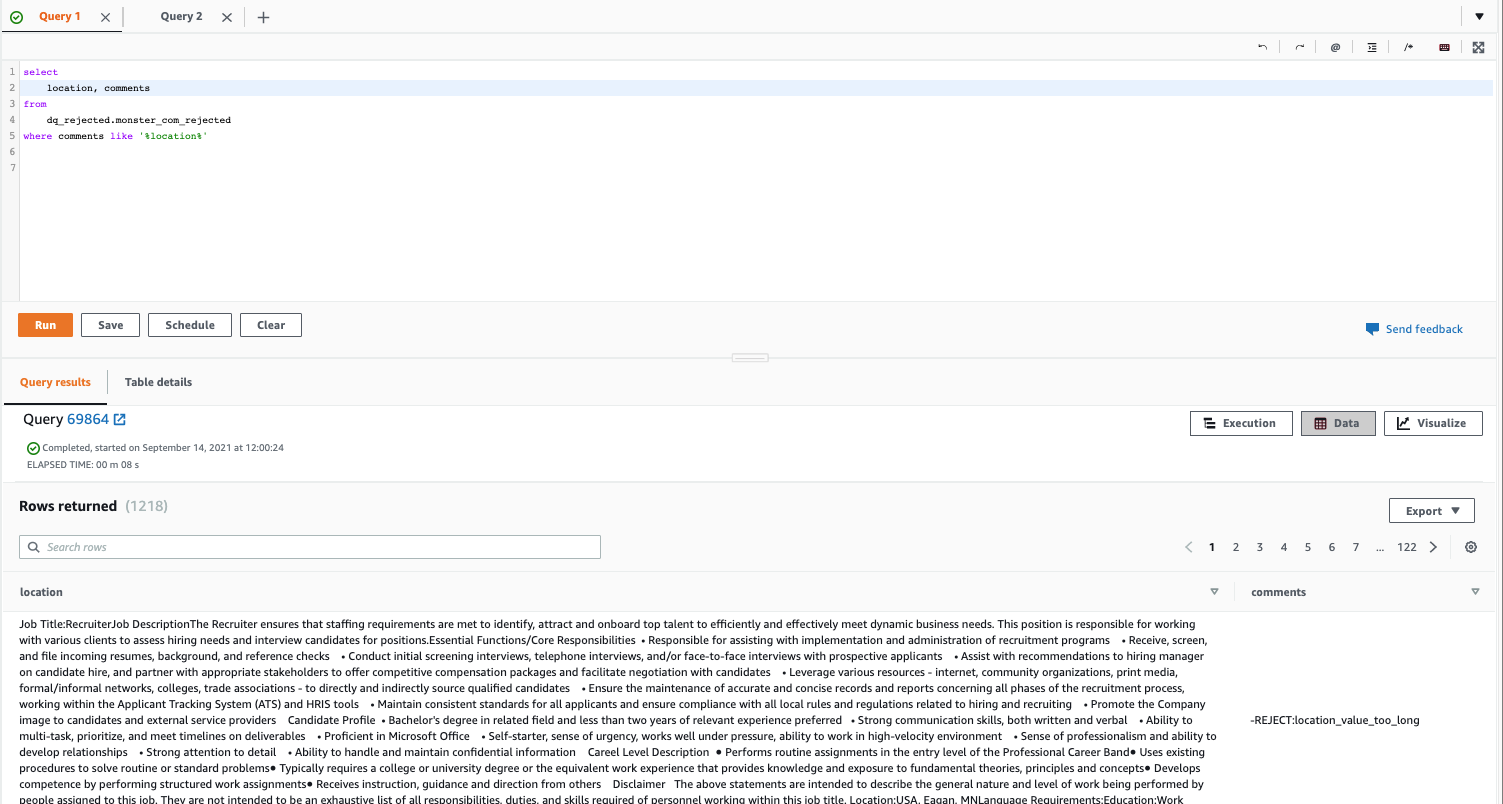
  • Expect column entries to be strings with a length between a minimum value and a maximum value (inclusive) – A length check rule is defined in the DynamoDB table for the location column. This rule rejects values or rows if the length of the value violates the specified constraints. The following
  • query returns the records that are rejected due to a rule violation in the location column.

You can continue to analyze the other columns’ predefined rules from DynamoDB or pick any rule from the GE glossary and add it to an existing column. Rerun the notebook to see the result of your data quality rules in Amazon Redshift. As mentioned earlier, you can also try creating custom expectations for other columns.

Benefits and limitations

The efficiency and efficacy of this approach is delineated from the fact that GE enables automation and configurability to an extensive degree when compared with other approaches. A very brute force alternative to this could be writing stored procedures in Amazon Redshift that can perform data quality checks on staging tables before data is loaded into main tables. However, this approach might not be scalable because you can’t persist repeatable rules for different columns, as persisted here in DynamoDB, in stored procedures (or call DynamoDB APIs), and would have to write and store a rule for each column of every table. Furthermore, to accept or reject a row based on a single rule requires complex SQL statements that may result in longer durations for data quality checks or even more compute power, which can also incur extra costs. With GE, a data quality rule is generic, repeatable, and scalable across different datasets.

Another benefit of this approach, related to using GE, is that it supports multiple Python-based backends, including Spark, Pandas, and Dask. This provides flexibility across an organization where teams might have skills in different frameworks. If a data scientist prefers using Pandas to write their ML pipeline feature quality test, then a data engineer using PySpark can use the same code base to extend those tests due to the consistency of GE across backends.

Furthermore, GE is written natively in Python, which means it’s a good option for engineers and scientists who are more used to running their extract, transform, and load (ETL) workloads in PySpark in comparison to frameworks like Deequ, which is natively written in Scala over Apache Spark and fits better for Scala use cases (the Python interface, PyDeequ, is also available). Another benefit of using GE is the ability to run multi-column unit tests on data, whereas Deequ doesn’t support that (as of this writing).

However, the approach described in this post might not be the most performant in some cases for full table load batch reads for very large tables. This is due to the serde (serialization/deserialization) cost of using UDFs. Because the GE functions are embedded in PySpark UDFs, the performance of these functions is slower than native Spark functions. Therefore, this approach gives the best performance when integrated with incremental data processing workflows, for example using AWS DMS to write CDC files from a source database to Amazon S3.

Clean up

Some of the resources deployed in this post, including those deployed using the provided CloudFormation template, incur costs as long as they’re in use. Be sure to remove the resources and clean up your work when you’re finished in order to avoid unnecessary cost.

Go to the CloudFormation console and click the ‘delete stack’ to remove all resources.

The resources in the CloudFormation template are not production ready. If you would like to use this solution in production, enable logging for all S3 buckets and ensure the solution adheres to your organization’s encryption policies through EMR Security Best Practices.

Conclusion

In this post, we demonstrated how you can automate data reliability checks using the Great Expectations library before loading data into an Amazon Redshift table. We also showed how you can use Redshift Spectrum to create external tables. If dirty data were to make its way into the accepted table, all downstream consumers such as business intelligence reporting, advanced analytics, and ML pipelines can get affected and produce inaccurate reports and results. The trends of such data can generate wrong leads for business leaders while making business decisions. Furthermore, flagging dirty data as rejected before loading into Amazon Redshift also helps reduce the time and effort a data engineer might have to spend in order to investigate and correct the data.

We are interested to hear how you would like to apply this solution for your use case. Please share your thoughts and questions in the comments section.


About the Authors

Faizan Ahmed is a Data Architect at AWS Professional Services. He loves to build data lakes and self-service analytics platforms for his customers. He also enjoys learning new technologies and solving, automating, and simplifying customer problems with easy-to-use cloud data solutions on AWS. In his free time, Faizan enjoys traveling, sports, and reading.

Bharath Kumar Boggarapu is a Data Architect at AWS Professional Services with expertise in big data technologies. He is passionate about helping customers build performant and robust data-driven solutions and realize their data and analytics potential. His areas of interests are open-source frameworks, automation, and data architecting. In his free time, he loves to spend time with family, play tennis, and travel.

Security updates for Monday

Post Syndicated from original https://lwn.net/Articles/876655/rss

Security updates have been issued by Debian (firebird3.0, libmodbus, and salt), Fedora (js-jquery-ui and wordpress), Mageia (arpwatch, chromium-browser-stable, php, rust, and wireshark), openSUSE (barrier, firefox, hylafax+, opera, postgresql12, postgresql13, postgresql14, and tomcat), SUSE (ardana-ansible, ardana-monasca, crowbar-openstack, influxdb, kibana, openstack-cinder, openstack-ec2-api, openstack-heat-gbp, openstack-heat-templates, openstack-horizon-plugin-gbp-ui, openstack-keystone, openstack-neutron-gbp, openstack-nova, python-eventlet, rubygem-redcarpet, rubygem-puma, ardana-ansible, ardana-monasca, documentation-suse-openstack-cloud, openstack-ec2-api, openstack-heat-templates, python-Django, python-monasca-common, rubygem-redcarpet, rubygem-puma, firefox, kernel, postgresql, postgresql13, postgresql14, postgresql10, postgresql12, postgresql13, postgresql14, postgresql96, and samba), and Ubuntu (libreoffice).

The End of the Cybersecurity Skills Crisis (Maybe?)

Post Syndicated from Amy Hunt original https://blog.rapid7.com/2021/11/22/the-end-of-the-cybersecurity-skills-crisis-maybe/

The End of the Cybersecurity Skills Crisis (Maybe?)

In just 4 years, you can learn to be fluent in Mandarin.

In 2 years, NASA can get you through astronaut training.

But the cybersecurity skills gap? It’s dire and dead-stuck in its fifth straight year of zero progress.

Globally, 3.5 million cybersecurity jobs remain unfilled, and of those candidates who do apply for open jobs, only 25% are qualified. Industry news and conferences are full of hot takes about XDR and how it will change everything in, say, another 5 years. The question is, who has that kind of time?

And don’t count on artificial intelligence to save the day: While it will be used to combat attacks with something like a “digital immune system,” the bad guys will use AI to enable attacks, too. We’ll always need humans and machines to collaborate, each doing what they do best.

Why the answer can’t be (and isn’t) another 5 years away

You know digital transformation and cloud migration are straining traditional security tools. Most enterprises are cobbling together a (sort of) full picture, running an average of 45 different cybersecurity-related tools on their networks. Most have arduous deployments, long ramp-ups, and heavy configurations. When all that’s done, they’re still tracking multiple threat intelligence feeds, drowning in alerts, and processing them manually. (ISC)2 is piloting a new, entry-level cybersecurity certification for fresh talent. Can anyone really train for all that?

But right now, today, a number of Rapid7 customers are achieving XDR efficiency and outcomes with InsightIDR. It’s reducing workloads, simplifying operations, easing staffing requirements, and preventing burnout. (If you haven’t yet, take a look at InsightIDR’s origin story, and you’ll understand exactly how and why.)

XDR is here, helping analysts at every level operate like experts

InsightIDR – a cloud-native, SaaS-delivered, unified SIEM and XDR – gives you contextualized intelligence from the clear, deep, and dark web, along with expertly vetted detections and the guided automation teams need. It fundamentally changes data analysis, investigation, threat hunting, and response.

Teams get curated detections out of the box, as well as a prescriptive approach to attacks. Expect automated response recommendations and prebuilt workflows for activities like containing threats on an endpoint, suspending user accounts, and integrating with ticketing systems like Jira and ServiceNow. Wizard guides help even the greenest analyst know where to go next.

InsightIDR also opens up end-to-end automation opportunities. You can automate common security tasks that reduce noise from alerts, directly contain threats such as malware or stolen credentials, integrate with ticketing and case management tools, and more.

Analysts handle anomalies quickly and well with intuitive search and query language, attribution of data to specific users, detailed correlation across events, and visualizations. InsightIDR lightens the workload and gives analysts a big jump start on the things that matter most.

A prediction

The day is coming (and who knows — it might be here) when cybersecurity job candidates will want to know exactly what technology they’ll be working with at your company. They’ll expect XDR. And they’ll have their own interview questions:

  • Are the more mundane, repetitive tasks automated yet?
  • Are you still tab-hopping, multi-tasking, and working distracted?
  • What’s your signal-to-noise ratio these days?
  • What’s the stress level like? Is it really a 40-hour week?

Millennials (ages 25-40) and Gen Z (recently in the job market and our future) are the most tech-savvy generations yet; Gen Z in particular is off the charts. Both put work-life balance above any other job characteristic — including pay and advancement opportunities. Techvalidate just asked InsightIDR customers if the platform ushered in better work-life balance. Almost 40% said yes.

The workplace is already trying to adjust, culturally and otherwise.

Both Millennials and Gen Z experience more anxiety and stress than older workers and their bosses. And while Millennials hope and angle for good work-life balance, Gen Z demands it rather assertively. They’ll ask for “mental health days” from time to time. No job gets to make their personal lives shambolic — it’s just not worth it. And the #1 source of job information they turn to? Your current and former employees.

If you have a band of stressed-out burnouts posting on Glassdoor, think about how that looks to a potential candidate. How you and your current staff are doing matters.

Here’s the thing — and forgive the rose-colored glasses

Cybersecurity is important, pioneering work that makes a difference. You protect companies, our economy, our country, and individual human beings. Security professionals do daily battle with criminal organizations, adversarial nation-states, and everyday duplicity. And it’s a job that didn’t even exist when most entry-level applicants were born.

Forrester analyst Allie Mellen believes in humanizing security operations, “taking away all the boring minutia we hate to do, and just leaving the really cool, creative stuff for us.” Mellen said, “XDR is definitely pushing down that path.” We think that’s an adventure anyone would line up for, as good as anything NASA has.

Start by downloading our eBook: “4 Ways XDR Levels Up Security Programs.”

Burkina Faso Internet shutdown

Post Syndicated from João Tomé original https://blog.cloudflare.com/burkina-faso-internet-shutdown/

Burkina Faso Internet shutdown

Burkina Faso Internet shutdown

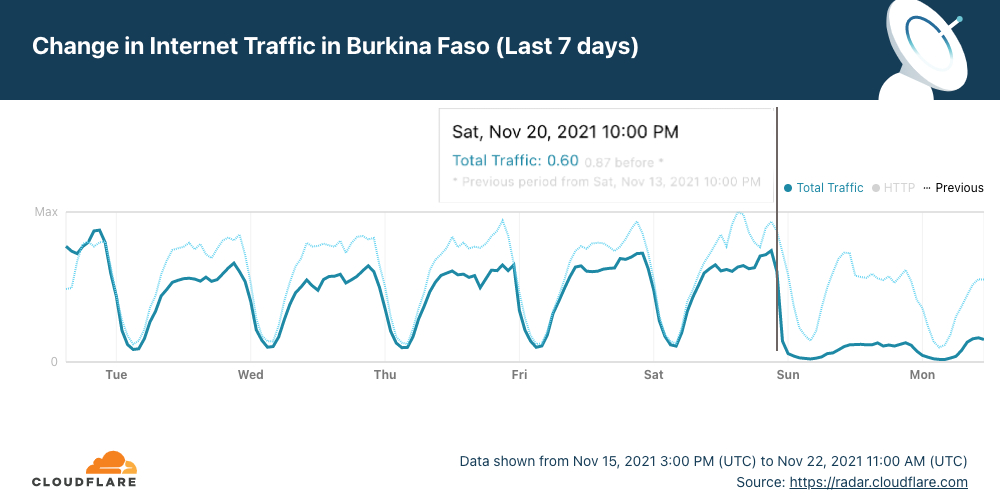
A few days after Sudan restored access to the Internet, people living in Burkina Faso are facing an Internet shutdown. On Saturday, Cloudflare Radar shows that after 22:00 UTC (the same local time) Internet traffic went down significantly, something that has happened in the context of social tensions in the country that started on November 14, 2021, and after this Saturday’s shooting of protesters that tried to block a French military convoy.

Burkina Faso Internet shutdown

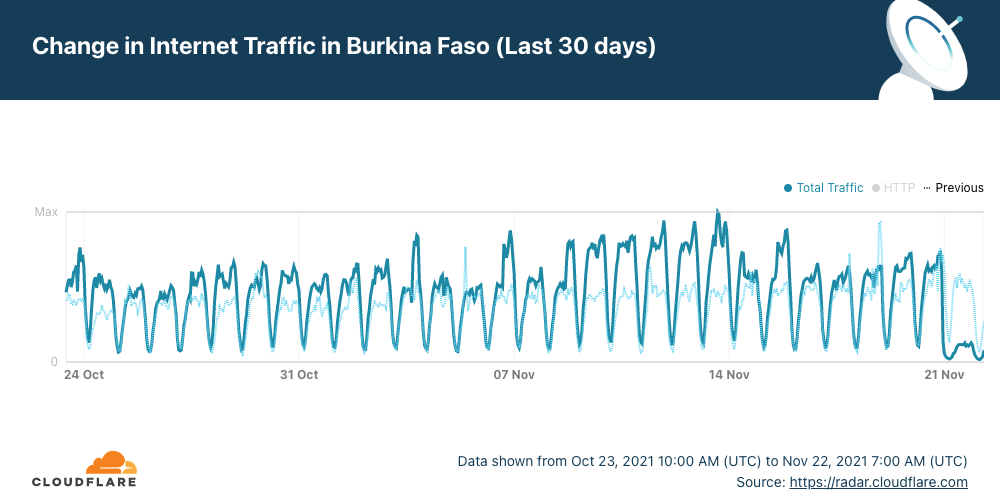
It is clear when we look at the last 30 days, that Sunday and today, Monday, November 22, are days almost without Internet traffic in Burkina Faso.

Burkina Faso Internet shutdown

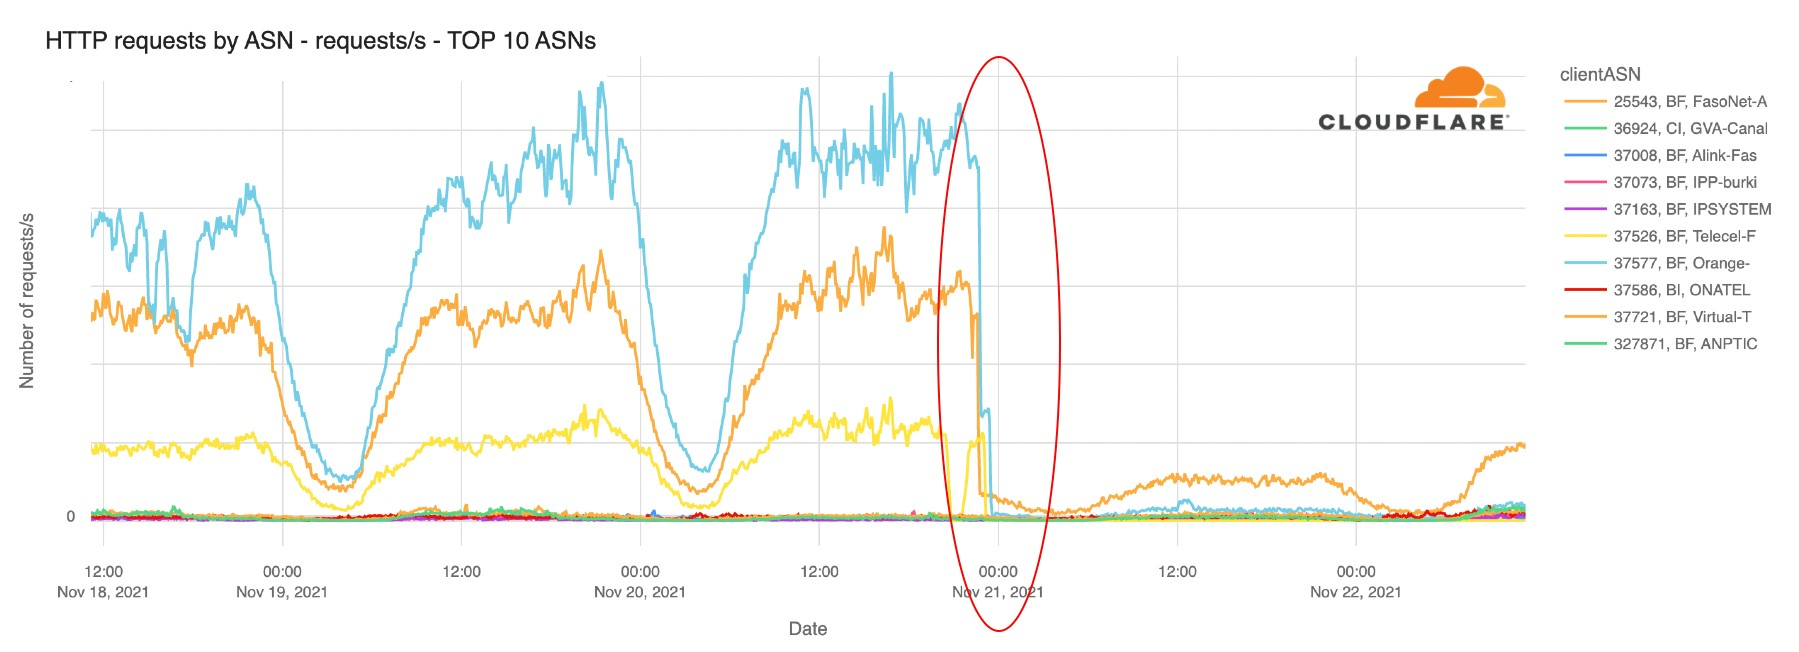
All the Internet Service Providers (ISP) of the country were significantly affected by what we could see in our data. That is evident when we look at HTTP traffic by ASN (Autonomous System Number). Orange, FasoNet and Telecel are the three most used ISPs in the country and this chart clearly shows how they were impacted.

Burkina Faso Internet shutdown

Mobile traffic affected

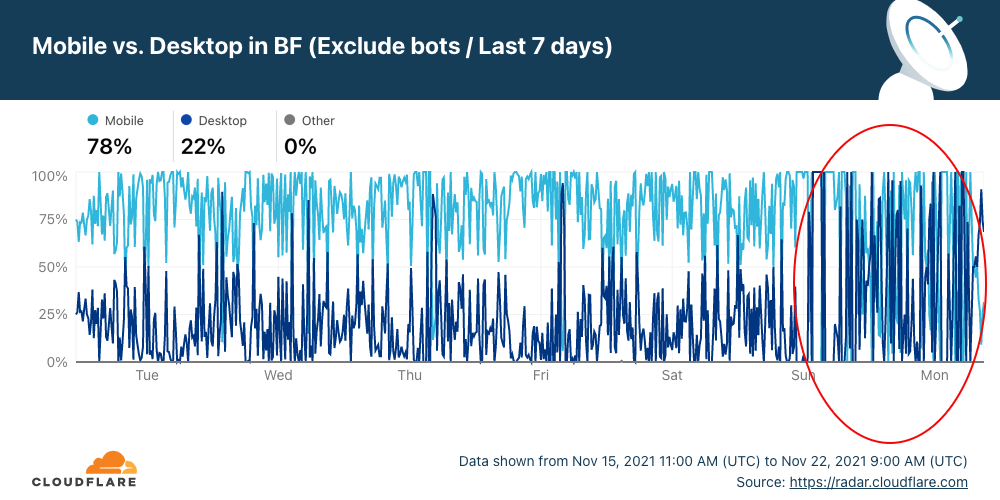
Burkina Faso is a mobile-first country because mobile is the main way of accessing the Internet — in the last 30 days the mobile traffic percentage represented 77% of the total Internet traffic in the country.

We can also see in Cloudflare Radar that desktop traffic percentage went up after Saturday night (the dark blue line in the chart), something that indicates that mobile networks were the main focus of the shutdown.

Burkina Faso Internet shutdown

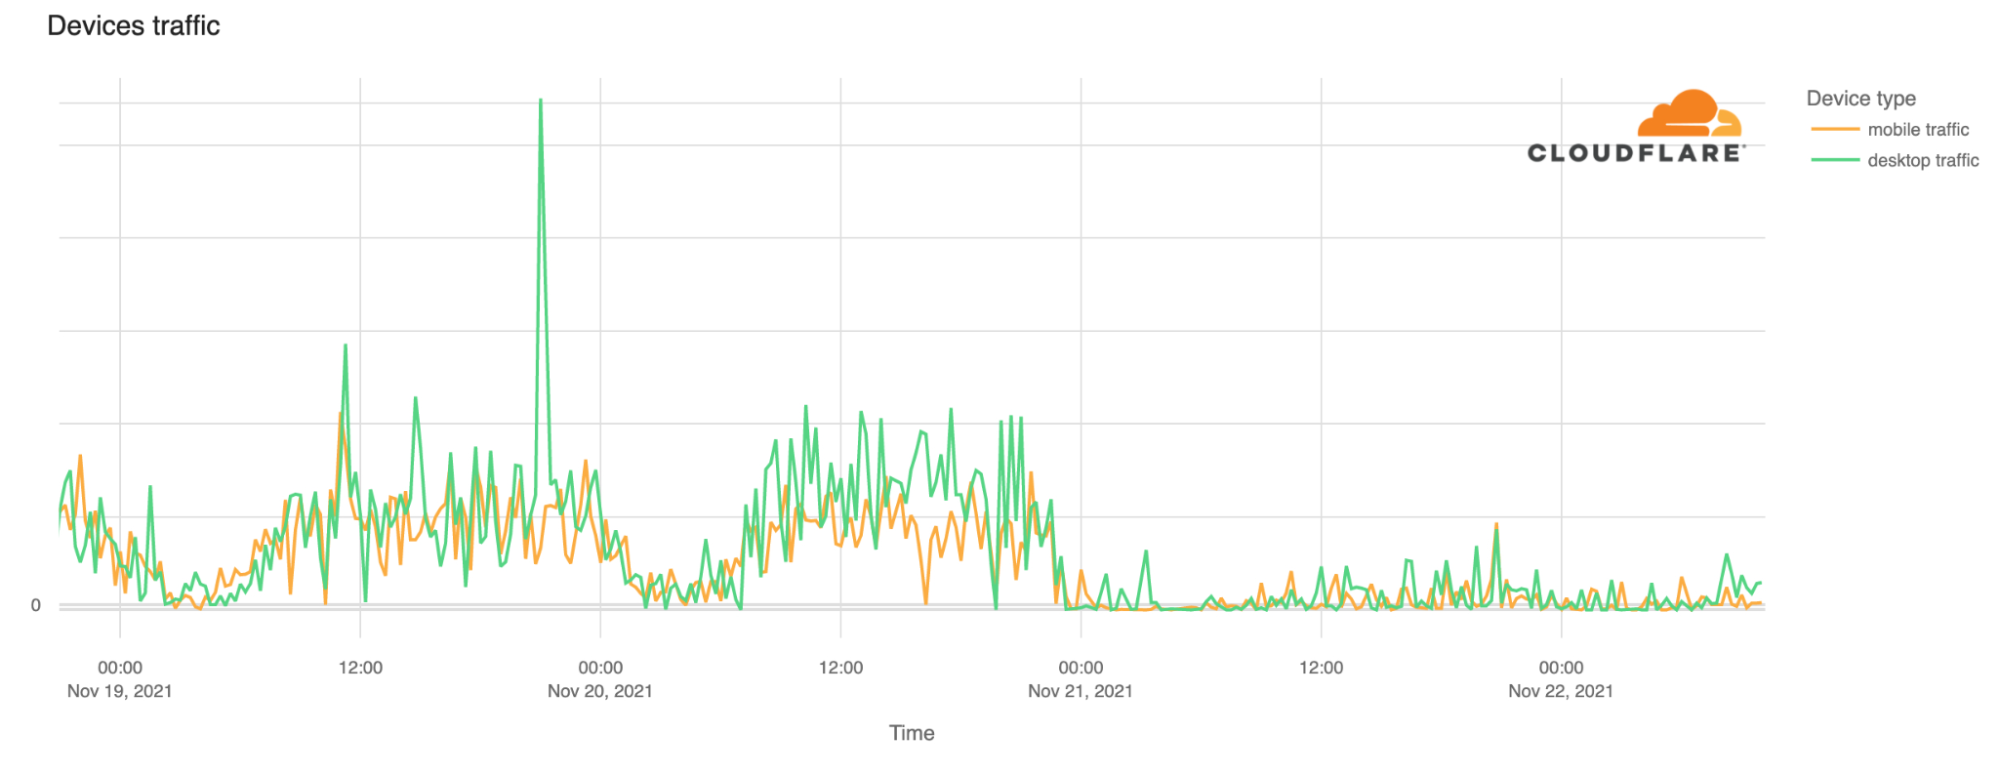
Looking at the number of requests we get a better ‘picture’ of the situation and how the desktop traffic percentage started to take over compared to mobile traffic in the last few days.

Burkina Faso Internet shutdown

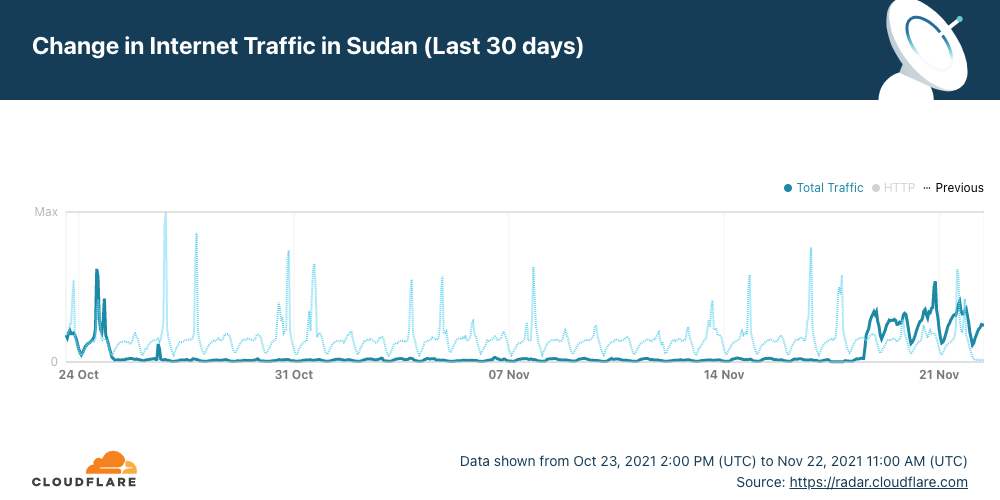
In the case of Sudan, the Internet shutdown went on for 25 days. You can keep an eye on Cloudflare Radar to monitor how the Burkina Faso situation evolves, but also you can see the Internet traffic globally and in every country.

Sudan was cut off from the Internet for 25 days

Post Syndicated from João Tomé original https://blog.cloudflare.com/sudan-internet-back-25-days/

Sudan was cut off from the Internet for 25 days

Sudan was cut off from the Internet for 25 days

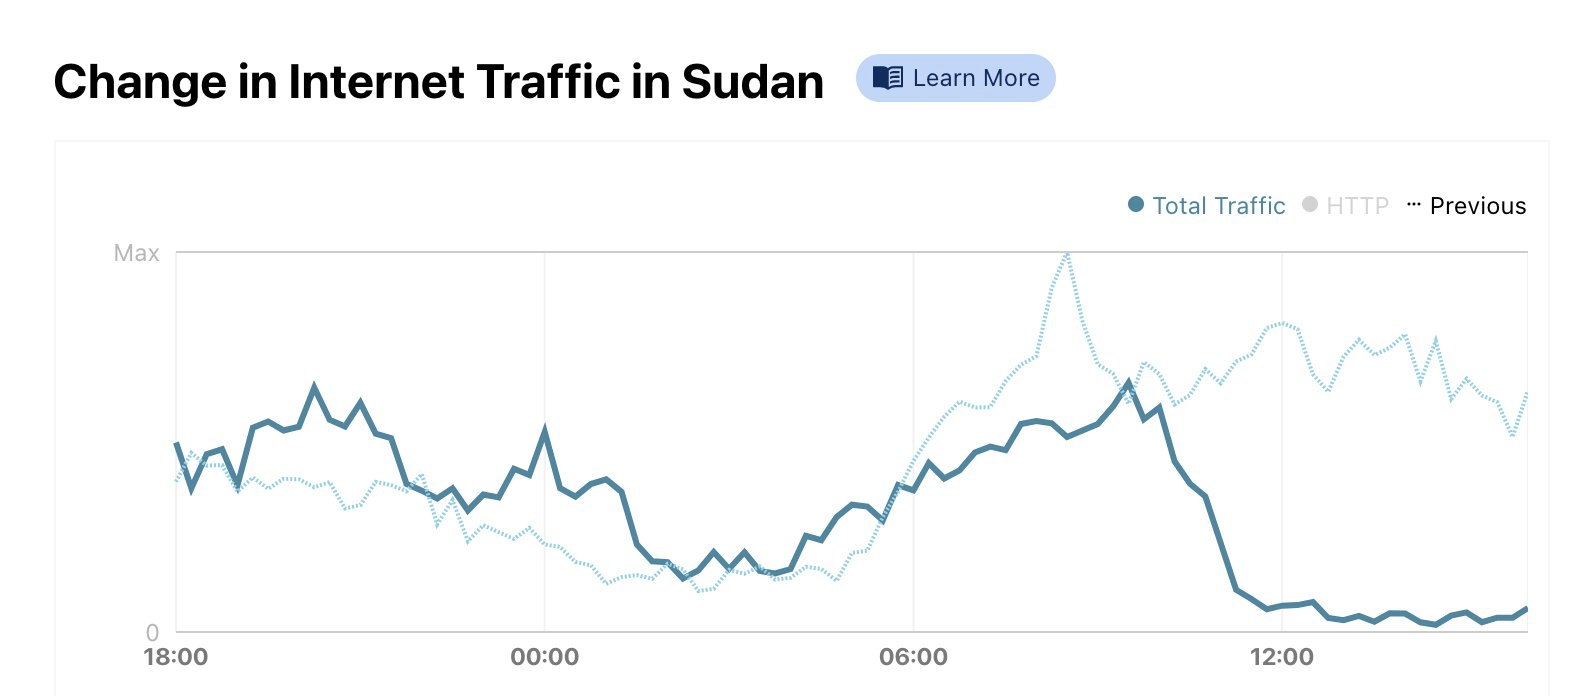
Internet traffic started to come back in Sudan (with limitations) on Thursday, November 18, 2021. This happened after 25 days of an almost complete shutdown that affected the whole country. It’s a simple line going up on a chart for us, but for a country that also meant that Internet access was (at least in part) back on with all of what comes with it for businesses, communities, families and society as a whole.

You can see that trend on Cloudflare Radar, in particular after 13:00 UTC (15:00 local time). After that Internet traffic went up like we haven’t seen at all in the previous three weeks.

Sudan was cut off from the Internet for 25 days

Internet access was mostly cut off on October 25, 2021, after a political turmoil in the country. A Sudanese court previously ordered the restoration of Internet access on November 9, but until last Thursday, November 18, there were no signs of services returning to normal. The biggest Internet access shutdown in recent history in the country was back in 2019 — for a full 36 days.
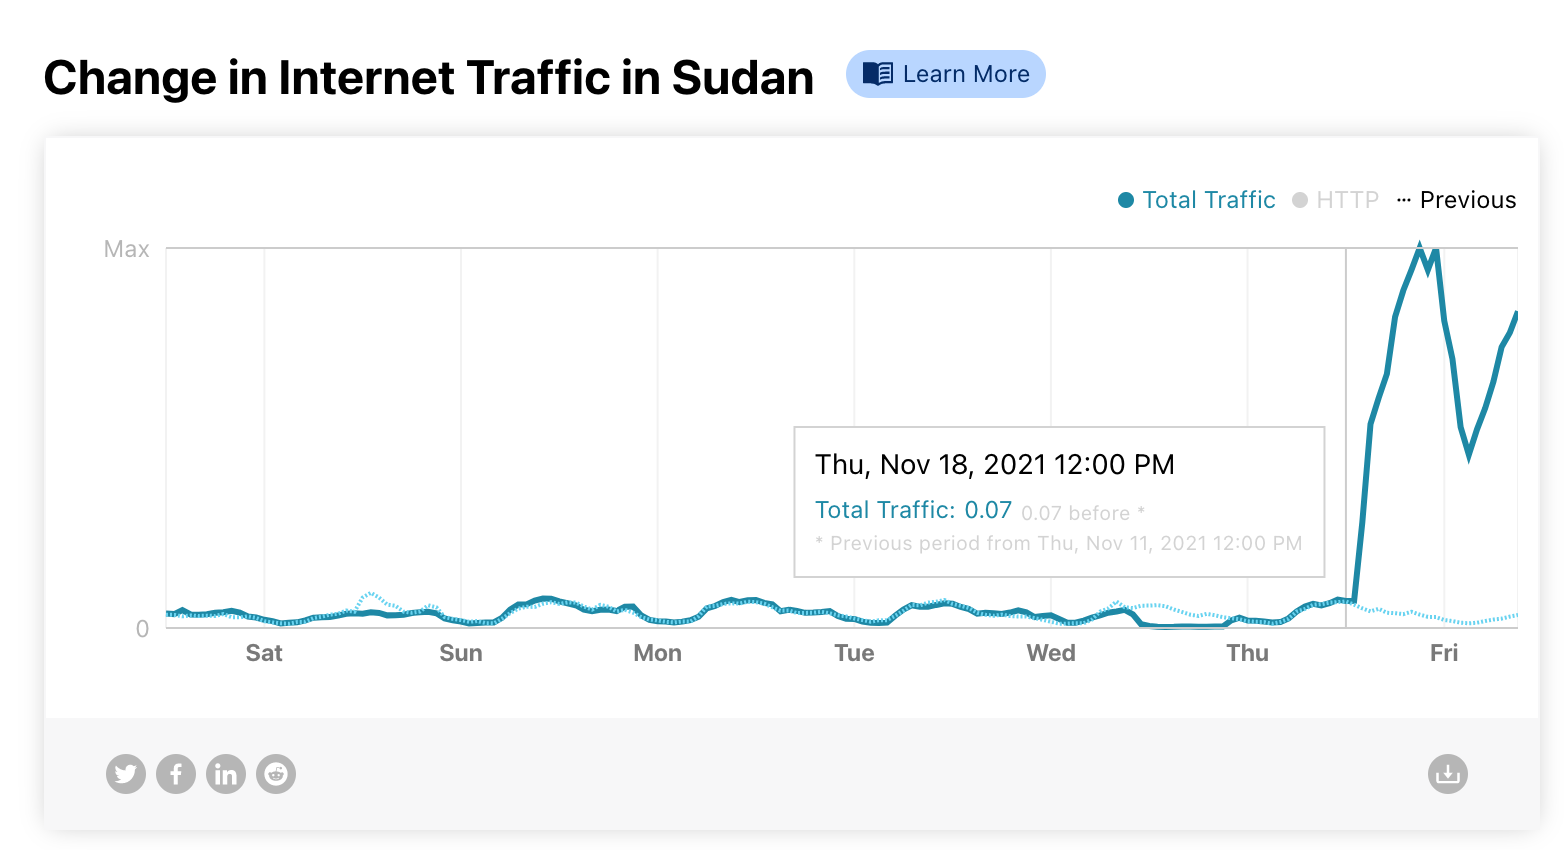
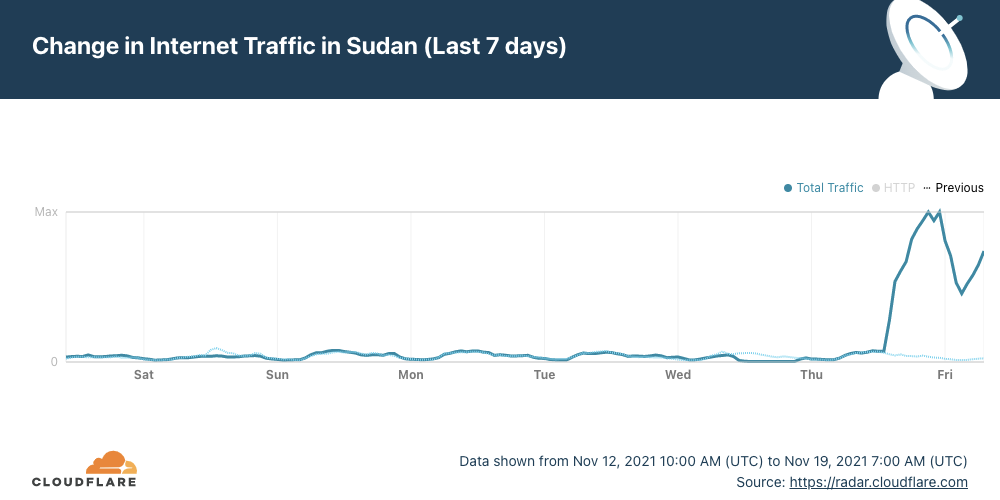
Looking back at the last 30 days Cloudflare Radar shows very distinctively a big difference from what was previously normal in the country.

Sudan was cut off from the Internet for 25 days

On Wednesday, November 17, (around 11:00 UTC) we saw a further drop in traffic getting Internet traffic in the country close to zero.

Sudan was cut off from the Internet for 25 days

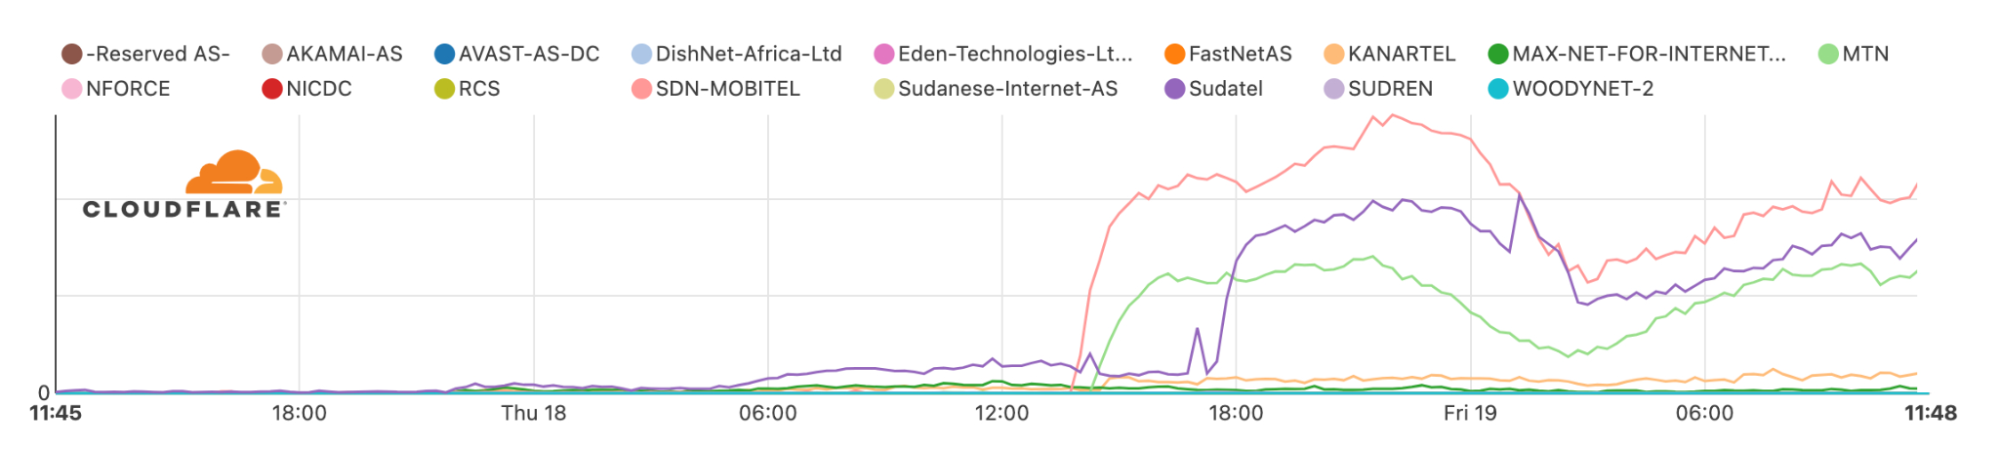
Now our data shows that the Internet in Sudan picked up firstly thanks to two ISPs, Mobitel and MTN. One of the largest in the country, Sudatel (purple line) for a few hours was also still mostly down, but it came back later in the evening (~18:00 UTC).

Sudan was cut off from the Internet for 25 days

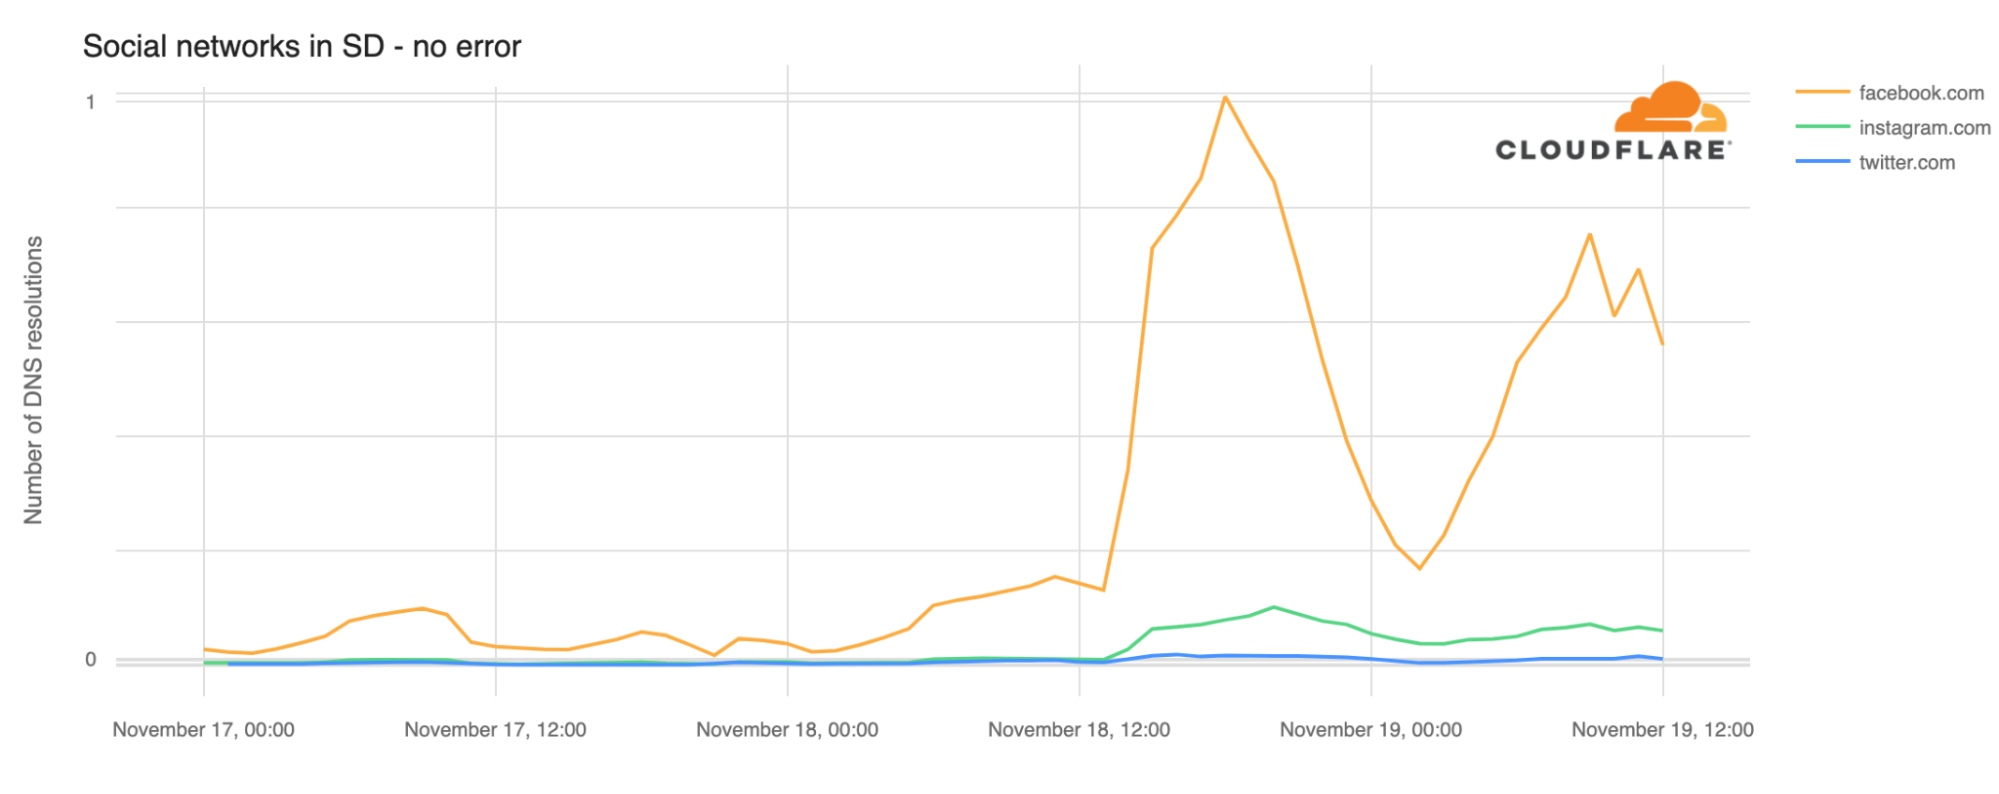
In terms of social media, our data also shows that especially Facebook traffic went up at the same time Internet access was beginning to pick up but went down a few hours later. According to local reports, there could be restrictions to social media on mobile networks in the country.

Sudan was cut off from the Internet for 25 days

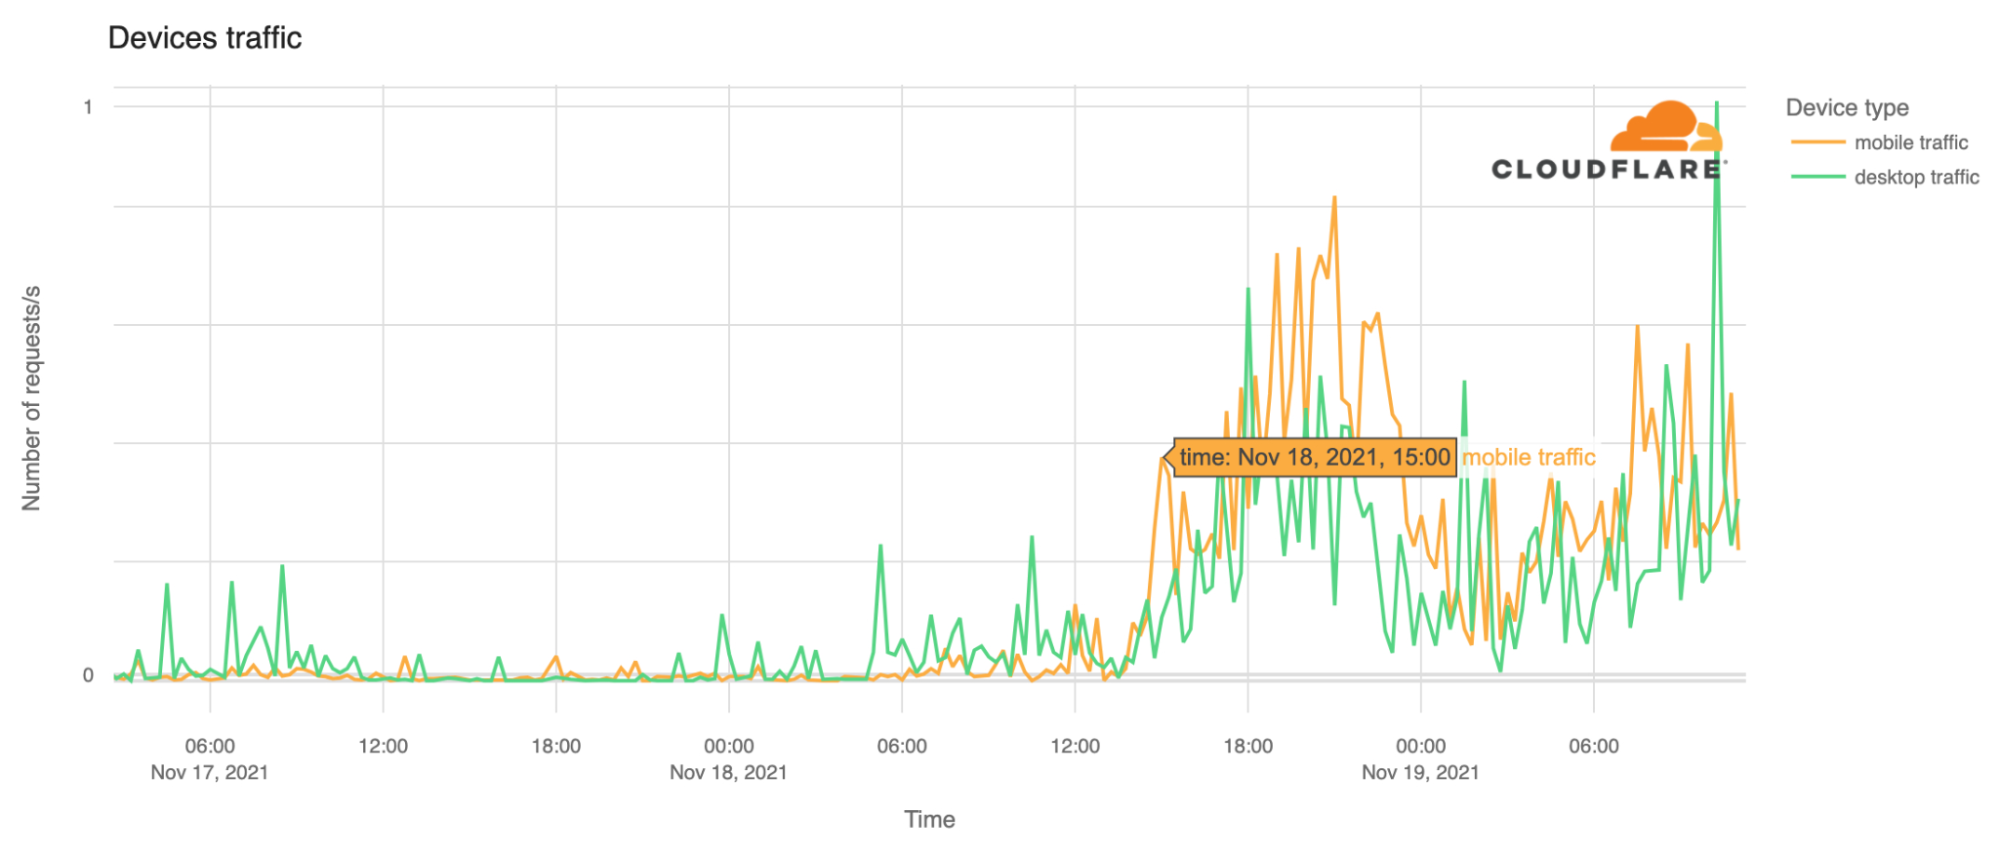
Mobile traffic saw a big increase, especially after 14:00 UTC. That is normal behaviour in a country where mobile traffic is king (back in October we showed in our blog post about mobile traffic how Sudan was one of the countries in the world with a large percentage of mobile traffic — 83%).

Sudan was cut off from the Internet for 25 days

Internet shutdowns are not that rare

We’ve said it before here in our blog, but it is always good to emphasize: Internet disruptions, including shutdowns and social media restrictions, are common occurrences in some countries and Sudan is one where this happens more frequently than most countries according to Human Rights Watch.

In our June 22, 2021, blog, we talked about Sudan when the country decided to shut down the Internet to prevent cheating in exams, but there were situations in the past more similar to this days-long shutdown — something that usually happens when there’s political unrest.

The country’s longest recorded network disruption was back in 2018, when Sudanese authorities cut off access to social media (and messaging apps like WhatsApp) for 68 consecutive days from December 21, 2018, to February 26, 2019. After that, there was a full mobile Internet shutdown reported from June 3 to July 9, 2019, that lasted 36 days.

This time, in 2021, it was 25 days when the Internet access was reduced to just a trickle of traffic getting through.

You can keep an eye on Cloudflare Radar to monitor how we see the Internet traffic globally and in every country.

Избран съм за народен представител

Post Syndicated from Bozho original https://blog.bozho.net/blog/3884

ЦИК обяви резултатите. Избран съм за народен представител.

Благодаря на всички за подкрепата. За мен лично, за Демократична България и за посоката на промяна.

Няма да спестя клишето, че тя е задължаваща. И че гледам на депутатството не като „награда“, а като на отговорност.

Ще работя за модернизация на държавата. И за това всички затлачвани дейности и замитани проблеми да бъдат поправени.

Не самоцелно, а за да не бъде държавата в тежест на гражданите и бизнеса, да не пилее парите ни с неефективността си.

Ще приемам предложения, ще приемам и критики. Ще опитвам да обяснявам решенията си и политиките, които прокарвам. Ще опитам да бъда „представител“ в истинския смисъл.

И ще се постарая да имаме перспективно, прозрачно и добро управление, което да бъде в ярък контраст с предишните.

Още веднъж – благодаря.

Материалът Избран съм за народен представител е публикуван за пръв път на БЛОГодаря.

The collective thoughts of the interwebz