The news that interested me the most last week was the DuckLabs acquisition. AWS has signed a definitive agreement to acquire DuckLabs, the Amsterdam-based company behind DuckDB, the popular open source analytical database that runs in-process and executes SQL directly against files like Parquet, CSV, and JSON. DuckDB stays open source under its independent foundation and the MIT license, and over time AWS plans to combine its speed at everyday queries with the enterprise scale of services like Amazon S3, Amazon Redshift, and Amazon Athena. Co-founded by Hannes Mühleisen and Mark Raasveldt, DuckDB runs locally or on Amazon S3, which makes it remarkably fast for the everyday queries (a terabyte or less) that make up the bulk of real-world analytics. It also happens to pair beautifully with AI agents, which “poke” and experiment their way through data much like humans do. The co-founders will continue leading its technical direction while AWS combines DuckDB’s speed with analytics services like Amazon EMR, AWS Glue, and Amazon SageMaker. For the bigger picture on why this matters, Andy Warfield, Vice President and Distinguished Engineer shared his thoughts on the post DuckDB and the changing physics of analytics on All Things Distributed.
Now, let’s get into this week’s AWS news…
Last week’s launches Here are some launches and updates from this past week that caught my attention:
Amazon ECS now automatically detects and recovers container instances that lose agent connectivity – Amazon ECS now continuously monitors agent connectivity to the control plane and surfaces a new AGENT_CONNECTIVITY health event across AWS Fargate, Amazon ECS Managed Instances, and Amazon ECS on EC2. On Fargate and Managed Instances, ECS handles recovery automatically, draining tasks, launching replacements, and deregistering the impaired instance. On EC2, you can wire the event into your own workflow. Available at no additional cost in all AWS Commercial and AWS GovCloud (US) Regions.
AWS Lambda introduces public preview runtimes, starting with Node.js 26 and Python 3.15 – You can now test upcoming Lambda runtimes before they reach general availability. Preview runtimes use the same identifier as the eventual GA version, so your functions graduate automatically with no action required. Third-party tools and deployment frameworks can also validate compatibility ahead of GA. Not meant for production yet (breaking changes are possible), but a great way to get ahead of your next upgrade. Available in all AWS commercial, AWS GovCloud (US), and China Regions.
AWS IoT Core adds a native InfluxDB rule action – You can now route time-series data from your IoT devices straight into InfluxDB (Amazon Timestream-managed or self-hosted) without writing custom code or standing up an intermediate service. IoT Core formats data into InfluxDB’s line protocol and supports device-side and server-side batching. Available in all AWS Regions where Amazon Timestream for InfluxDB is offered.
Amazon GameLift Servers now includes enhanced DDoS protection – Your game servers now get automatic protection against network and transport layer (layers 3 and 4) DDoS attacks – UDP reflection, SYN floods, and similar vectors – with nothing to enable or opt into. Built on top of AWS Shield Standard with gaming-optimized traffic shaping, it turns on the moment your servers start running (Server SDK 5) at no extra cost. It’s available in all supported GameLift Servers Regions except China (Beijing) and China (Ningxia).
Amazon SageMaker HyperPod expands support for Ray – You can now run Ray workloads on SageMaker HyperPod with built-in observability, resilient training, and accelerated inference. Create and manage Ray clusters from Amazon SageMaker Studio, attach JupyterLab or your local IDE so a multi-node cluster behaves like a local dev environment, and get auto-provisioned Grafana dashboards. Node auto recovery, hung job detection, and tiered checkpointing keep large training runs healthy, while Ray Serve adds a tiered KV cache for inference. Your existing open source Ray code runs unchanged. Available for HyperPod clusters orchestrated by Amazon EKS.
For a full list of AWS announcements, be sure to keep an eye on the What’s New with AWS page.
Other AWS news Here are some additional posts and resources that you might find interesting:
Happy 20th birthday, Amazon EC2! – Amazon EC2 turns 20. Channy Yun looks back at how EC2 grew from a single m1.small instance type in one Region to more than 1,200 instance types across 39 Regions, along with the custom silicon journey from the first Graviton to Graviton5 and Trainium3. A fun and worthwhile read on the service that still underpins so much of AWS – including Amazon ECS, Amazon EKS, AWS Lambda, Amazon SageMaker, and Amazon Bedrock.
Agentic Resource Discovery (ARD): an open specification for agent discovery – As organizations scale up agents, tools, and MCP servers, those resources end up scattered across clouds, on-premises infrastructure, and SaaS platforms – each with its own registry and metadata. ARD is a new open specification (Apache 2.0) that defines a common way to describe and discover agentic resources, so publishers “describe once” and consumers “discover everywhere” – think DNS, but for agents. AWS contributed feedback but doesn’t own the spec, and it complements the AWS Agent Registry by letting you federate across catalogs without migrating.
Get started with the Agent Toolkit for AWS in the AWS CLI – A single AWS CLI command (aws configure agent-toolkit) now equips AI coding agents like Kiro, Claude Code, Codex, and Cursor with curated, up-to-date AWS knowledge and a secure connection to thousands of AWS APIs through the AWS MCP Server. If you build with an AI coding assistant, this helps it choose the right services, use modern APIs, and follow security best practices – so it gets AWS code right more often the first time.
Upcoming AWS events Check your calendar and sign up for upcoming AWS events:
AWS Summits – Free in-person events where builders come together to learn, connect, and explore the latest in cloud and AI. Upcoming stops include Zurich (September 2), São Paulo (September 3), Tel Aviv (September 10), and Dubai (September 30). Can’t attend in person? You can stream sessions through the Global Livestream and On-Demand Hub. I’ll be presenting two sessions on generative AI and Amazon Bedrock at the São Paulo Summit – if you’re there, come say hello.
Join the AWS Builder Center to connect with builders, share solutions, and access content that supports your development. Browse here for upcoming AWS-led in-person and virtual events and developer-focused events.
That’s all for this week. Check back next Monday for another Weekly Roundup!
— Daniel Abib
This post is part of our Weekly Roundup series. Check back each week for a quick roundup of interesting news and announcements from AWS!
The Netdev 0x1A conference was
held in Rome, Italy from July 13 through July 16. Conference organizer
Jami Hadi Salim has let us know that the videos and slides for all sessions are now
available. Topics include Linux QUIC, shared memory socket transport, eBPF-based
DDoS protection, and more.
By the time Linus Torvalds released
7.3-rc1 and closed the merge window for this release, 15,267 non-merge
changesets had been pulled into the mainline repository. That is the
second-highest commit count for an -rc1 release in the kernel’s history;
only the 6.7-rc1 release, which included nearly 3,000 commits of bcachefs
history, had more. About 13,000 of those commits entered the mainline
after the first 7.3 merge-window summary
was written so, needless to say, there are a lot of changes to cover.
Modern bot threats are increasingly driven by determined, sophisticated attackers. Often it is not even one person, but a group trading techniques with each other or a commercial service sold to anyone willing to pay. For many of them, getting past bot detection is a full-time job they genuinely enjoy. Block them and they get to work, finding a workaround. AI has simplified this further, making it even easier to set up complex configurations for attackers, lowering the overhead of an attack.
This shift puts defenders at an economic disadvantage. Responding and adapting to new attacks takes care, evidence, and effort to ensure efforts to block attackers don’t impact real users on the way. Attackers have no such concerns and are primarily constrained by their time and their pool of proxies, and ensuring their infrastructure providers don’t shut down their accounts.
Their advantage is the cost of adaptation. Attackers can adapt as often and continuously as they need, while most defenses are deployed in discrete, managed releases. Cloudflare analyzes more than a trillion requests a day for signs of automated abuse, so we see how fast attackers change tactics. That gap in responsiveness is widening.
The inconvenient truth: bot detection across the industry often rests on a hopeful assumption that if you make the wall tall enough, attackers stay out. In reality, a determined attack always finds a way through. The question is not whether a determined attacker can get through. They will. The question is what happens when they do.
Today we are launching Adaptive Intelligence, a new bot detection engine that starts from the opposite idea. Rather than betting on a wall that keeps every attacker out, Adaptive Intelligence makes getting through so slow and costly that the attack stops being worth running.
We believe that no other bot detection works this way.
One attacker, many disguises
Not every attack is obvious to spot. The most sophisticated ones are built to disappear into ordinary traffic.
An attacker can spread requests across a large residential proxy network, keep the rate from each address low, and move patiently through a login, checkout, or account-recovery flow. Every request comes from a different address, often with a fresh user agent or a new bot fingerprint, so each one looks like a new visitor. No single source ever crosses a rate limit.
This is what makes the shape so hard to stop. Tighten the thresholds too far and real customers are turned away, which is the outcome you are trying hardest to avoid. The attack lives in the space between one request and the next, and a defense that studies each request on its own will never see it.
The flaw of deterministic detection
The challenge with rule-based systems is that they hand the attacker a stationary target. They iterate in days while the model waits months for its next update, so by the time it catches up, the tooling has already moved on.
Bot detection has always answered a new attack technique by writing a rule to catch it. That works, until the attacker studies the signal, learns how to circumvent it, and forces another rule to be written. Some of the most advanced attackers have even created tooling to semi-automate this process. The defender appears permanently disadvantaged.
This kind of detection is “deterministic”, meaning that the same input always produces the same output. A defense that never changes teaches the attacker how to beat it and indirectly drives bot operators to build more capable automated attacks. Against a deterministic defense, automated probes return a clean yes or no, and over enough attempts that feedback teaches an attacker exactly where the edges of the system are. The economics are in the attacker’s favor.
Changing the economics of attack
Adaptive Intelligence aims to reverse the economics and put them back in the defender's favor.
A defense that keeps changing flips that calculation, but only if two things are true at once. First, it has to cost the defender less to react than it costs the attacker to work around it. Second, attackers must be starved of the feedback they use to adapt, so they cannot simply learn their way back in. Get both right and the attacker's own loop turns against them: nothing they learned stays true, and each new attempt costs more than the last, until the attack is no longer worth running.
Part of that is giving an attacker less to learn from. Adaptive Intelligence can recognize a bot from a signal without visibly reacting to it, so the attacker keeps relying on a tell they do not realize we can see. And it treats detection as a statistical judgment rather than a fixed rule. That makes it non-deterministic. It weighs many signals at once, so there is no single piece of logic for an attacker to isolate and beat.
A new detection engine
Your bot score already comes from several detection methods working together: machine learning, behavioral validation, JavaScript fingerprinting, a library of heuristics, and checks that recognize known, verified bots like search crawlers.
Adaptive Intelligence is a brand new bot detection engine that sits behind bot score. Where every other system is built to keep attackers out by accumulating rules, Adaptive Intelligence is built with the assumption that attackers will eventually get in, and makes that attempt as costly as possible.
Below, we explain three components our Adaptive Intelligence detection engine will have, that are unique when compared to traditional models: improving itself, disposable rule generation, and learning from the traffic it protects. Launching today is its first component: the machine learning at the center of your bot score, now retraining continuously instead of shipping as a fixed version. It aggregates network signals from across Cloudflare's network and measures the probability of automated abuse for every request. Where a fixed model sits still, Adaptive Intelligence keeps moving. The second and third components explained below are soon to follow.
1. Improving itself
The engine retrains continuously on live traffic. As new bypass tools and bot frameworks appear, it learns from them and folds that knowledge into the model behind your bot score, without waiting for a scheduled release. A technique that shows up this week is one the engine can recognize this week. The score you already build on stays close to what attackers are actually doing, rather than drifting further from reality between updates.
2. Disposable rule generation
A disposable rule is a rule that we expect the attacker to adapt to, but doesn’t improve the attacker's bot in the process. Adaptive Intelligence is designed to create disposable rules aimed at a specific attack, deploy and retire them at random intervals, and never leave them in place long enough to become a fixed target. Because the rules keep appearing and vanishing, they inject noise into the very signal an attacker relies on to train against us, so an attacker never gets the steady yes-or-no that a static defense leaks. No single rule has to be perfect or unbeatable. It only has to last long enough to do its job, then make way for the next one. By the time an attacker has reverse-engineered a specific pattern, the engine has already moved on, rendering their engineering effort worthless.
3. Learning from the traffic it protects
Adaptive Intelligence will also learn from the patterns it sees across millions of sites. When a customer flags a real visitor we scored incorrectly, or our own measurement catches a miss, that correction becomes a training signal. Over time the engine tunes to the problems Cloudflare's customers are actually facing, so the protection you get reflects the current threat landscape instead of a snapshot of an older one.
How it works
Adaptive Intelligence runs in a loop: observe, train, deploy, validate. The range of signals it draws on keeps growing as we connect more of the network into it.
Cloudflare has run this kind of automated loop against DDoS attacks for years: sample traffic, TLS fingerprint the patterns behind an attack, push protections out across the network, and keep measuring so they can be adjusted or retired as the traffic changes. Bots are a harder version of the problem, because the signals are quieter and the story only shows up over time. Any one signal can look perfectly normal on its own. It is the relationships between them, and the company they keep, that reveal a bot hiding in normal traffic.
Adaptive Intelligence evaluates traffic over several time windows at once. A short window catches a sudden burst as it develops. A longer window reveals the behavior that repeats across thousands of addresses, clients, and sessions that have no reason to behave alike, and ties those scattered requests back to a single source. The same engine that spots an obvious scraping spike also surfaces a slow, distributed credential-stuffing attack sending only a handful of requests from each address.
Building new detections automatically
As the next parts of Adaptive Intelligence come online, mining systems will search recent, labeled traffic for combinations of signals that separate an emerging attack from real users.
Often, a useful detection comes from the relationship between signals we already know, rather than a signal we have never seen before. A client might claim to be one browser while producing the network or JavaScript signals of another. A request might look normal on its own but form an odd sequence alongside the rest of the session. Automated mining lets us test many of these combinations and turn the strongest into candidate detections.
These candidates are deliberately narrow. They do not need to catch every bot on the Internet, or even every request in the current attack. That makes them quick to build and easy to replace when an attack changes tactics.
It remembers
Attackers do not attack once. They pause, retool, and come back. Retiring a detection does not mean forgetting the pattern behind it. The engine keeps a memory of past attacks even after their detections stop firing, so an attacker cannot escape just by flipping between two profiles and betting the second one looks new.
That memory gives the system a head start when a familiar attack returns or a related one appears. A detection can expire when it stops earning its place, while the evidence behind it stays available to build the next one. Nothing piles up as stale rules in production, and the system never has to learn an old attack from scratch.
The result is one automated loop that can react to an obvious spike or quietly gather evidence on a patient, distributed attack that stays under traditional thresholds.
Deploying safely
Constant change only helps if every change is safe, and the bar is high. Customers can live with the occasional bot slipping through, but a real visitor wrongly turned away is the failure that actually costs. That is the worry that makes teams cautious about automatic updates, so a new detection has to earn its place before it affects anyone.
We test each candidate against recent real traffic and measure how much known automation it catches and how often it would flag a genuine visitor by mistake. It rolls out gradually as an input to your bot score while we watch score distributions, challenge outcomes, and customer feedback, and we can pause or roll it back before it reaches your whole network. Every update has to prove it is at least as good as the one it replaces, on the measures that matter for this kind of system, precision and recall among them.
One vision: Adaptive Intelligence and Precursor
This engine does not work alone. Last month we introduced Precursor, a continuous behavioral validation engine for bot management built with privacy in mind, which measures automated abuse based on how a visitor behaves once they reach the browser: the timing, the movement, the small human signals that automation struggles to fake. Precursor and Adaptive Intelligence were built as two parts of one idea to detect malicious automation. Precursor does so through measuring continuous session-behavior; Adaptive Intelligence learns from bot detection signals across the whole network, and the signals from one make the other harder to fool.
It also reflects how we think about the problem: the bot detection engine should shrink what gets through, and keep adapting faster than the attacker on the other side.
What's coming next
Continuous retraining is the foundation, and more of the engine comes online from here. We are expanding automatic detection generation for bots, connecting more of what Cloudflare sees across the network, the challenge, and the browser into a single view of a session, and giving you more ways to act on what the engine finds.
Knowing that no defense will keep every determined attacker out lets us aim for something more useful: making each attempt short-lived while costing the attacker more than it will ever return. Adaptive Intelligence reacts faster to new techniques, and gives attackers less to learn from each time it makes a change. The attacker who never quits now faces a defense that is different each time they return, so their persistence stops paying off.
Getting started
Enterprise customers should turn on "Auto Update Machine Learning" in the Bot Management dashboard. With it on, you get Adaptive Intelligence automatically, with no version to migrate and nothing to configure, and the bot score you already build on keeps working unchanged. If you are not sure it is enabled, check now so you are covered from day one.
Running workloads on Amazon Elastic Kubernetes Service (Amazon EKS) can involve managing failures like OOMKilled or IP exhaustion. Engineers must repeatedly collect pod logs, trace events, and check node logs—a process that slows at night/weekends, with critical data lost when pods are deleted or nodes become unhealthy. This collection phase is pure overhead on mean time to resolution (MTTR): the incident stays open while an engineer gathers data that a machine could have captured the moment the failure occurred. Automating it shortens MTTR and lets the on-call engineer start at the analysis step instead of the data-gathering step.
Existing AI tools have limitations: K8sGPT only analyzes current resource state, and Amazon Bedrock Agents requires manual tool integration and pipeline setup. Neither provides end-to-end automated incident investigation.
AWS DevOps Agent addresses these gaps—a frontier agent that connects code repositories, observability tools, CI/CD pipelines, and skills to autonomously analyze root causes. This post shows how to build an automated incident response pipeline using the DevOps Agent Operator, a Kubernetes Operator that detects EKS failures and triggers DevOps Agent investigations automatically.
Solution overview
AWS DevOps Agent provides powerful incident analysis. However, it does not detect pod failures inside an EKS cluster on its own. To start an investigation, an external source must trigger DevOps Agent through a webhook. When this trigger occurs, two conditions must be met:
Immediate failure detection: You must detect the failure before the pod is rescheduled or deleted.
Sufficient context: You must send the data that the analysis needs, such as the manifest, logs, events, and node information.
The DevOps Agent Operator is a Kubernetes Operator that meets both conditions automatically.
Why use an Operator?
DevOps Agent runs only when something calls it through a webhook or a manual trigger. In 24/7 operations, doing this manually is not practical. Kubernetes keeps events for only about an hour, restarted containers overwrite their logs, and deleted pods lose them entirely. If you do not collect data right after a failure, the key evidence is gone for good.
DevOps Agent can already run describe and logs with kubectl, and tools like Datadog can detect failures and trigger it.
A separate Operator still adds value for three reasons:
Proactive preservation of volatile data: The Operator detects state changes in milliseconds via watch and preserves data to S3/CloudWatch instantly—before external tool delays (metric collection, alert evaluation, webhook delivery) let evidence disappear.
Selective collection of node-level data: kubectl exposes only container-level and event data, but root causes often live deeper in the node—for example, OOMKilled traces to node dmesg, and IP exhaustion details are in IPAMD introspection. Because the Operator knows the real-time pod-to-node mapping, it collects only what each failure type needs from the exact node.
Encoding operational knowledge in code: The Operator pattern captures human expertise in code, applying different strategies per failure type—dmesg/memory for OOMKilled, previous logs/restart history for CrashLoopBackOff, IPAMD/ENI mappings for IP exhaustion—directly improving analysis accuracy.
In short, the Operator captures evidence at the failure site before it disappears and collects data beyond the reach of kubectl, giving DevOps Agent the best possible material to analyze.
Note: If data collection or an upload to Amazon S3 or CloudWatch Logs fails, the reconcile returns an error and the pod is requeued with exponential backoff rather than dropped, and throttled AWS API requests are retried automatically. The Operator also runs a single reconcile worker and marks each pod with a processed annotation, so a mass failure—for example, 100 replicas crashing at once—is handled one pod at a time and each pod is reported only once. For noisy clusters, WEBHOOK_MIN_SEVERITY and WEBHOOK_SKIP_CATEGORIES let you narrow which failures trigger an investigation.
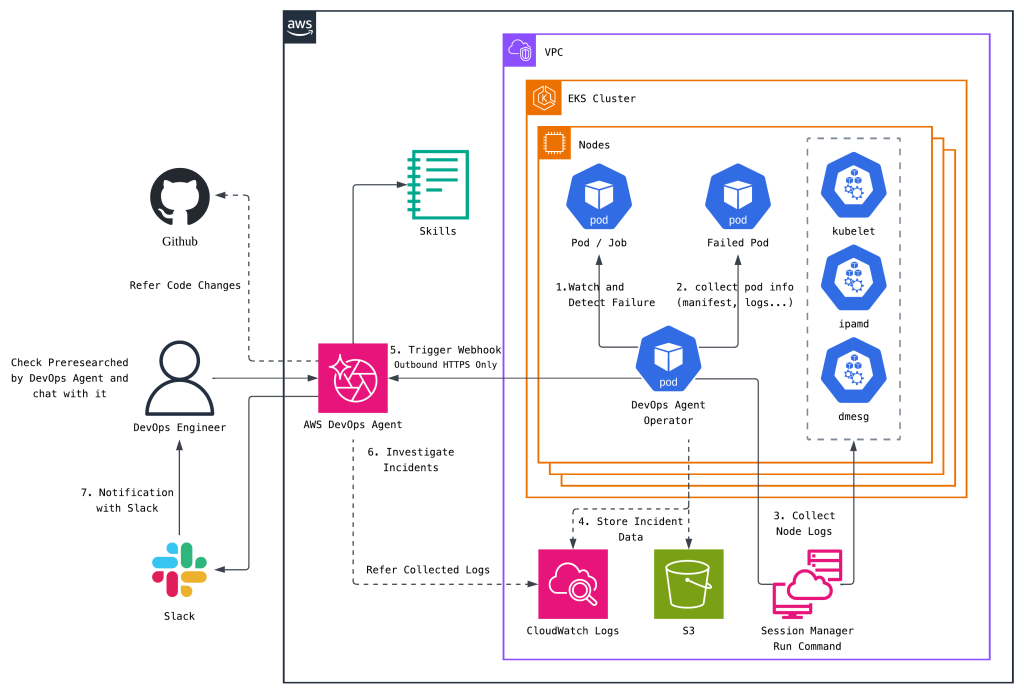
Architecture
Figure 1. End-to-end flow from failure detection to investigation.
The preceding diagram shows the full flow. The DevOps Agent Operator detects a failure inside the EKS cluster and sends the context to AWS DevOps Agent.
Getting started
Prerequisites
Region availability: AWS DevOps Agent is available in six AWS Regions—US East (N. Virginia), US West (Oregon), Europe (Frankfurt), Europe (Ireland), Asia Pacific (Sydney), and Asia Pacific (Tokyo). Create your Agent Space in one of these Regions.
Node type: Node-level log collection uses AWS Systems Manager Run Command against the EC2 instance that ran the failed pod, so it requires Amazon EKS managed node groups or self-managed EC2 nodes. On AWS Fargate, the Operator still collects Kubernetes-level data—the pod manifest, events, and container logs—but node-level data such as dmesg output and IPAMD introspection is not available.
Systems Manager registration: Attach the AmazonSSMManagedInstanceCore policy to your node group’s IAM role so the nodes appear as managed nodes. Without it, node-level collection is skipped and only Kubernetes-level data is collected.
Setting up this solution involves two steps.
The first step is to configure the Agent Space for DevOps Agent. You connect the sources that DevOps Agent needs to analyze an incident, such as code repositories and observability tools. You also set up a generic webhook to receive failure information from the Operator.
The second step is to deploy the DevOps Agent Operator to the EKS cluster. When the Operator detects a pod failure, it collects the context and sends it automatically to the webhook that you set up in the first step.
After you complete these steps, you have an end-to-end pipeline. When a pod failure occurs, DevOps Agent starts an investigation automatically.
Step 1: Configure the Agent Space for DevOps Agent
Configure the webhook
DevOps Agent supports two types of webhooks:
Integration-specific webhooks: Created automatically when you set up an integration with an external solution, such as Slack or Datadog.
Generic webhooks: Created manually to trigger an investigation from sources that an external integration does not cover.
The DevOps Agent Operator uses a generic webhook. It maintains security through HMAC-SHA256 authentication.
For detailed setup instructions, see the following documentation. This post creates a generic webhook as an example.
You connect GitHub or GitLab so that DevOps Agent can track deployment events and correlate code changes with failures.
Register GitHub or GitLab at the AWS account level.
Connect the repositories that you want to monitor to the Agent Space.
With this connection, DevOps Agent can analyze the recent deployment history and code changes when a failure occurs. DevOps Agent currently supports GitHub and GitLab. For GitLab, you can use both the managed instance and a self-managed instance that is reachable from outside.
For detailed setup instructions, see the following documentation. This post uses GitHub as an example.
DevOps Agent joins your team’s existing communication channels to share its investigation activity. When you connect Slack, you can follow the full process in real time, from failure detection to completed analysis.
For detailed setup instructions, see the following documentation. This post uses Slack as an example.
Note: To keep this example readable, the policy allows ssm:SendCommand on EC2 instances in the account. In production, restrict it to your cluster’s nodes with an IAM condition key—for example, a StringEquals condition on ssm:resourceTag/eks:cluster-name in a statement that targets only the instance ARN—so that the Operator cannot run commands on unrelated instances. Keep the AWS-RunShellScript document ARN in a separate statement without the condition, because a document carries no instance tags and a single combined statement would deny the call.
Next, create the policy from this file.
aws iam create-policy \
    --policy-name devops-agent-operator-policy \
    --policy-document file://devops-agent-operator-permission.json
aws iam create-role \
    --role-name devops-agent-operator-role \
    --assume-role-policy-document file://devops-agent-operator-trust-policy.json

aws iam attach-role-policy --role-name devops-agent-operator-role --policy-arn=arn:aws:iam::<aws-account-id>:policy/devops-agent-operator-policy
1.4. Associate Pod Identity
EKS Pod Identity associates Kubernetes service accounts directly with IAM roles, enabling pods to access AWS services like Amazon CloudWatch under the principle of least privilege. For more information, see Learn how EKS Pod Identity grants pods access to AWS services.
Pod Identity requires the eks-pod-identity-agent add-on, which is not installed on existing clusters by default. If your cluster does not have it yet, add it first:
Because the Operator is a reference implementation, the sample provides source code only—no prebuilt container image. Build the image with the Dockerfile at the following location and push it to a registry that you control, which also keeps the image that runs in your cluster inside your own supply chain. Then use that image to deploy the Operator. Building the image locally requires Go 1.25 or later. The Operator is built against the Kubernetes 1.35 client libraries and uses only the core Pod, Node, and Event APIs.
The following steps are based on the example YAML files for the DevOps Agent Operator. Download the repository, or run the following command to download the files, and then continue.
Open the 05-deployment.yaml file, and then change the following variables to values that match your environment.
containers:
- name: manager
    # Use the image that you built in step 2
    image: <operator-image>:latest
    ...
    env:
    # Required settings
    - name: DEVOPS_AGENT_WEBHOOK_URL
        value: "<devops-agent-webhook-url>"
    ...
    - name: EKS_CLUSTER_NAME
        value: "<eks-cluster-name>"
    - name: AWS_REGION
        value: "<aws-region>"
    - name: AWS_ACCOUNT_ID
        value: "<aws-account-id>"
    # Optional settings
    - name: ENABLE_SSM_COLLECTION
        value: "true"
    - name: CLOUDWATCH_LOG_GROUP
        value: "<cloudwatch-log-group-name>"
Also change the 04-configmap.yaml file to values that match your environment.
data:
  # Comma-separated list of namespaces to watch (empty = all namespaces)
  WATCH_NAMESPACES: ""
  # Comma-separated list of namespaces to exclude
  EXCLUDE_NAMESPACES: "kube-system,kube-public,kube-node-lease"
  # Enable AWS SSM node log collection (requires IAM permissions)
  ENABLE_SSM_COLLECTION: "true"
  # AWS region for SSM and S3
  AWS_REGION: "<aws-region>"
  ...
In a shared or multi-tenant cluster, set WATCH_NAMESPACES to the namespaces that your team owns so that the Operator does not collect data from other teams’ workloads. If you leave it empty, the Operator watches every namespace except those listed in EXCLUDE_NAMESPACES.
Note: DevOps Agent references the collected data only while it investigates the incident, so you do not need to retain it long-term. Keeping a short retention period on the CloudWatch log group—and a matching S3 Lifecycle expiration rule on the bucket—keeps the storage cost of this solution minimal.
# Expire the incident logs in CloudWatch Logs after 14 days
aws logs put-retention-policy \
    --log-group-name <cloudwatch-log-group-name> \
    --retention-in-days 14

# Expire the incident objects in Amazon S3 after 14 days
aws s3api put-bucket-lifecycle-configuration \
    --bucket <s3-bucket-name> \
    --lifecycle-configuration '{"Rules":[{"ID":"expire-incident-data","Status":"Enabled","Filter":{"Prefix":"incidents/"},"Expiration":{"Days":14}}]}'
3.2. Create the webhook secret
Edit the 06-webhook-secret.yaml file:
stringData:
  webhook-secret: "<webhook-secret>"
3.3. Deploy the Kubernetes resources
kubectl apply -f .
The example deployment runs a single replica with leader election enabled, so you can raise the replica count for availability without two Operators processing the same failure.
3.4. Verify the deployment
# Check the pod status
kubectl get pods -n devops-agent-operator-system

# Check the logs
kubectl logs -f deployment/devops-agent-operator \
  -n devops-agent-operator-system
When the Operator works correctly, it produces the following logs:
Use case: Automated analysis of an OOMKilled failure
The following scenario shows how the DevOps Agent Operator and DevOps Agent work together. In this environment, Slack is connected as the notification channel for DevOps Agent, and GitHub is connected as the pipeline.
Scenario
In this scenario, a developer pushed a code change to add a new feature to the web-python service and built a new container image. The developer then updated the running web-python deployment in the EKS cluster with the newly built image.
After the new version rolled out successfully, the developer verified that other services were unaffected. Shortly after, a Slack notification arrived. DevOps Agent reported that the pod that was just deployed had terminated with an OOMKilled status, and that it was investigating the related incident.
kubectl get pods -o custom-columns='NAME:.metadata.name,READY:.status.containerStatuses[*].ready,STATUS:.status.phase,RESTARTS:.status.containerStatuses[*].restartCount,IMAGE:.spec.containers[*].image'
NAME READY STATUS RESTARTS IMAGE
web-python-56b9874b88-tdljd true Running 0 <your-registry>/web-python:sha-96cd2b0

# Deploy the new version
kubectl get pods -o custom-columns='NAME:.metadata.name,READY:.status.containerStatuses[*].ready,STATUS:.status.phase,RESTARTS:.status.containerStatuses[*].restartCount,IMAGE:.spec.containers[*].image'
NAME READY STATUS RESTARTS IMAGE
web-python-645b4f7867-lvqgr true Running 0 <your-registry>/web-python:sha-15d1398
The following steps describe what happens after the pod with the new image is deployed.
Step-by-step flow
1. Failure detection
The kubelet detects the OOM termination of the web-python container and updates the pod status. The informer in the DevOps Agent Operator receives this change in real time. It detects the change from the previous state (Running) to the current failure state (OOMKilled).
As soon as the Operator detects the failure, it collects Kubernetes-level data including pod manifests, pod logs, previous crash logs, and OOM-related event timelines.
3. Node-level data collection
It then gathers node-level data such as kubelet, containerd, and ipamd logs, disk/memory/network usage, and the kernel OOM killer log from dmesg output.
4. Data storage
Based on your configuration, the Operator stores the collected data in CloudWatch Logs and Amazon S3. DevOps Agent can reference the data in CloudWatch Logs during the investigation when it needs to.
5. DevOps Agent trigger
The Operator sends a webhook request that includes an HMAC-SHA256 signature to DevOps Agent. The payload includes investigation instructions for the AI agent.
The DevOps Agent Operator handles steps 1 through 5. You can also see these steps in the logs of the Operator pod.
# 1. Failure detection
2026-05-30T07:24:05Z INFO Failure detected {"controller": "pod", ... "pod": {"name":"web-python-645b4f7867-lvqgr","namespace":"default"}, "failureType": "OOMKilled", "container": "web-python", "exitCode": 137}

# 2-3. Data collection
2026-05-30T07:24:06Z INFO ssm-collector Collecting node logs via SSM {"node": "ip-192-168-1-10.ec2.internal", "instanceID": "i-0123456789abcdef0"}
...

# 4. Data storage
2026-05-30T07:24:08Z INFO cloudwatch CloudWatch Logs upload completed {"logGroup": "cw-log-group-devops-agent-operator", "logStream": "incidents/2026-05-30T07-24-05Z/default/web-python-645b4f7867-lvqgr", "eventsCount": 13}
...

# 5. DevOps Agent trigger
...
2026-05-30T07:24:08Z INFO webhook Webhook request with S3 reference successful {"incidentId": "2026-05-30T07-24-05Z/default/web-python-645b4f7867-lvqgr", "status": 200}
6-7. DevOps Agent Investigation
As DevOps Agent starts the investigation, it shares the incident and its investigation status in the Slack channel that you configured for communication. Through this notification, the engineer can open the Agent Space and follow the investigation in real time.
Figure 2. DevOps Agent announces the OOMKilled incident in Slack.
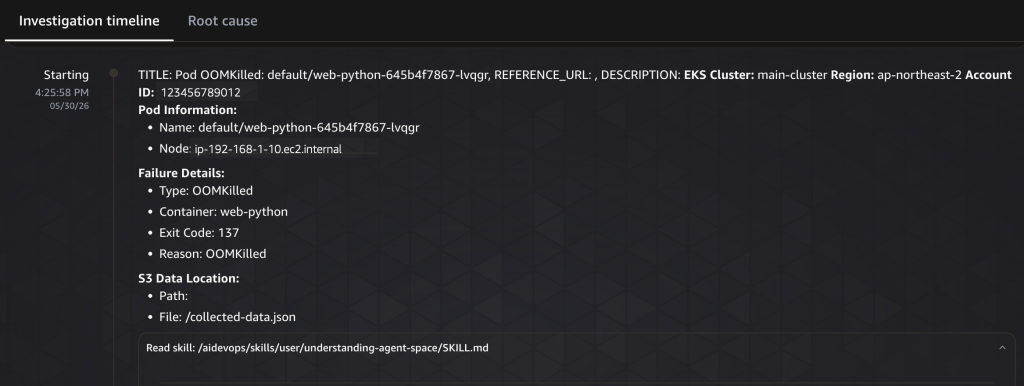
Skill-based investigation: DevOps Agent automatically selects the skill that matches the incident type. Following the OOMKilled skill, it systematically performs the steps to check the memory configuration, analyze usage patterns, and review the code change history.
Figure 3. The investigation timeline opens with the payload the Operator sent.
Correlation analysis: In addition to the troubleshooting data that it receives, DevOps Agent connects the following sources for its analysis:
GitHub: Checks recent code changes for memory-related modifications.
CloudWatch: Checks memory usage trends in Container Insights.
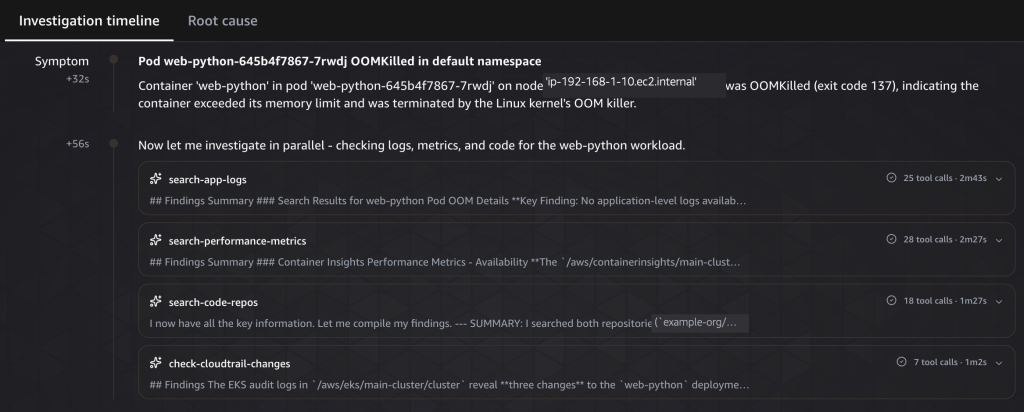
In this scenario, you can see that DevOps Agent starts its analysis from the data that the Operator uploaded to CloudWatch Logs, as the skill specifies.
Figure 4. DevOps Agent runs four investigation tasks in parallel.
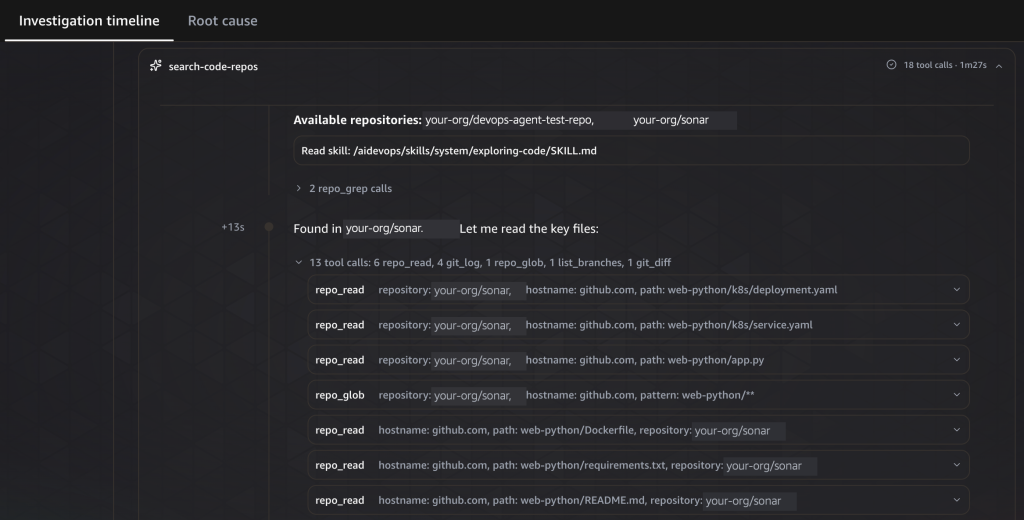
Figure 5. DevOps Agent reads the manifest and application code from the connected repository.
The skill also specifies the relationship between the GitHub repository that you connected as a pipeline and the container image. DevOps Agent uses this information to review the code changes that occurred recently.
This information helps DevOps Agent identify the root cause of the incident.
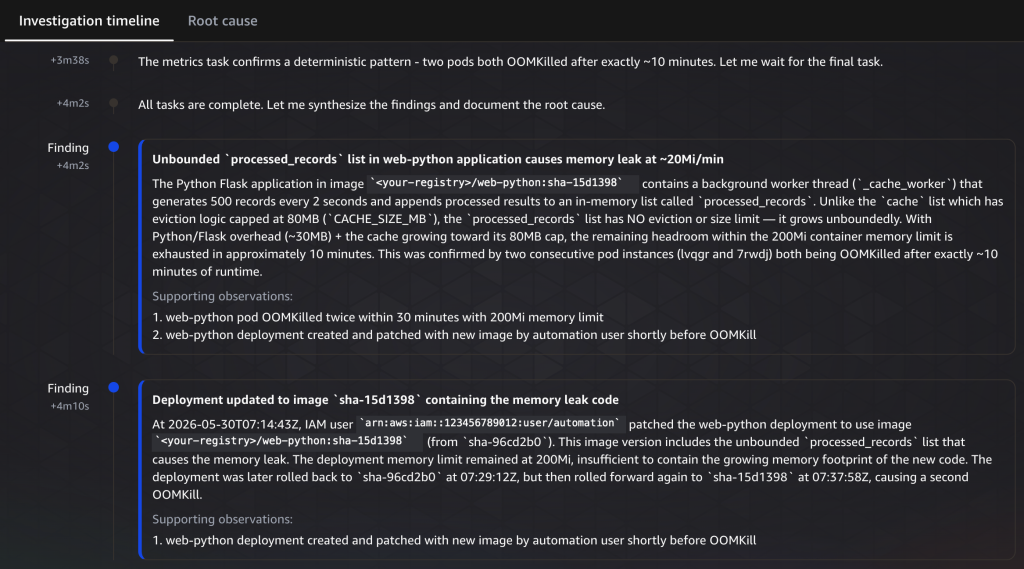
Figure 6. Two findings: the unbounded list and the deployment that introduced it.
8. Analysis results
DevOps Agent organizes the analysis results:
Investigation Timeline: This tab shows the agent’s investigation steps—which skills it referenced and what data it analyzed. This view helps you optimize the skill to guide investigations more efficiently.
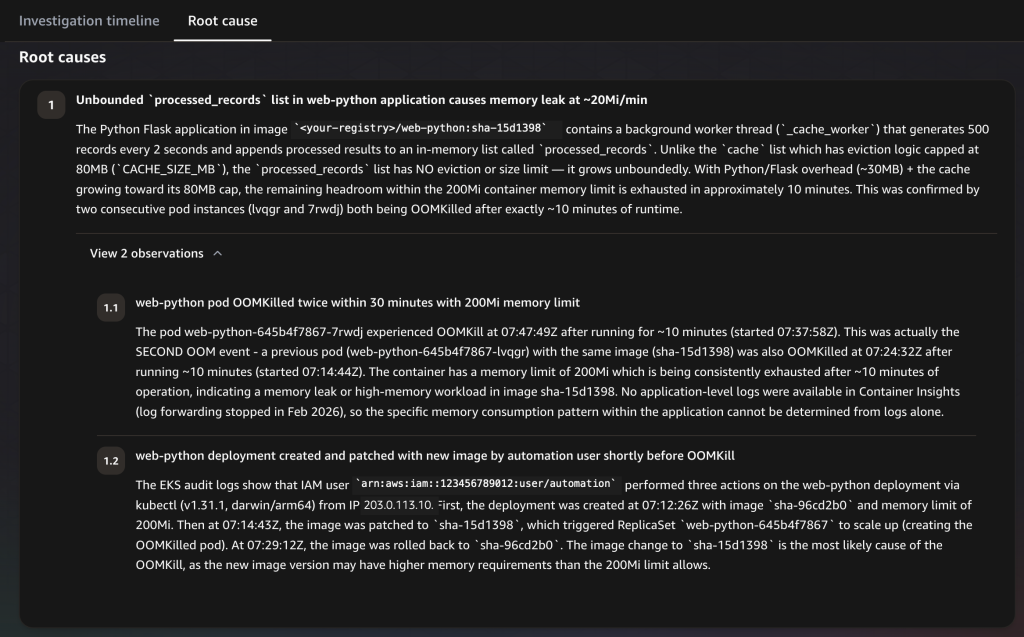
Root causes: This section summarizes the root cause from the overall investigation.
Unbounded `processed_records` list in web-python application causes memory leak at ~20Mi/min
The Python Flask application in image `<your-registry>/web-python:sha-15d1398` contains a background worker thread (`_cache_worker`) that generates 500 records every 2 seconds and appends processed results to an in-memory list called `processed_records`. Unlike the `cache` list which has eviction logic capped at 80MB (`CACHE_SIZE_MB`), the `processed_records` list has NO eviction or size limit — it grows unboundedly. With Python/Flask overhead (~30MB) + the cache growing toward its 80MB cap, the remaining headroom within the 200Mi container memory limit is exhausted in approximately 10 minutes. This was confirmed by two consecutive pod instances (lvqgr and 7rwdj) both being OOMKilled after exactly ~10 minutes of runtime.
With the investigation from DevOps Agent, the engineer can identify the cause of the problem.
In the preceding example, you can see how the agent identifies a critical memory leak in the recently changed service code. It then reasons about the cause of the OOM event together with the commit ID.
Figure 7. The Root cause tab with its supporting observations.
9. Analysis and mitigation plan through chat
The engineer reviews the results and, when needed, can ask DevOps Agent follow-up questions:
“Check whether other services show a similar memory growth pattern.”
“Will fixing it with approach A help solve the problem?”
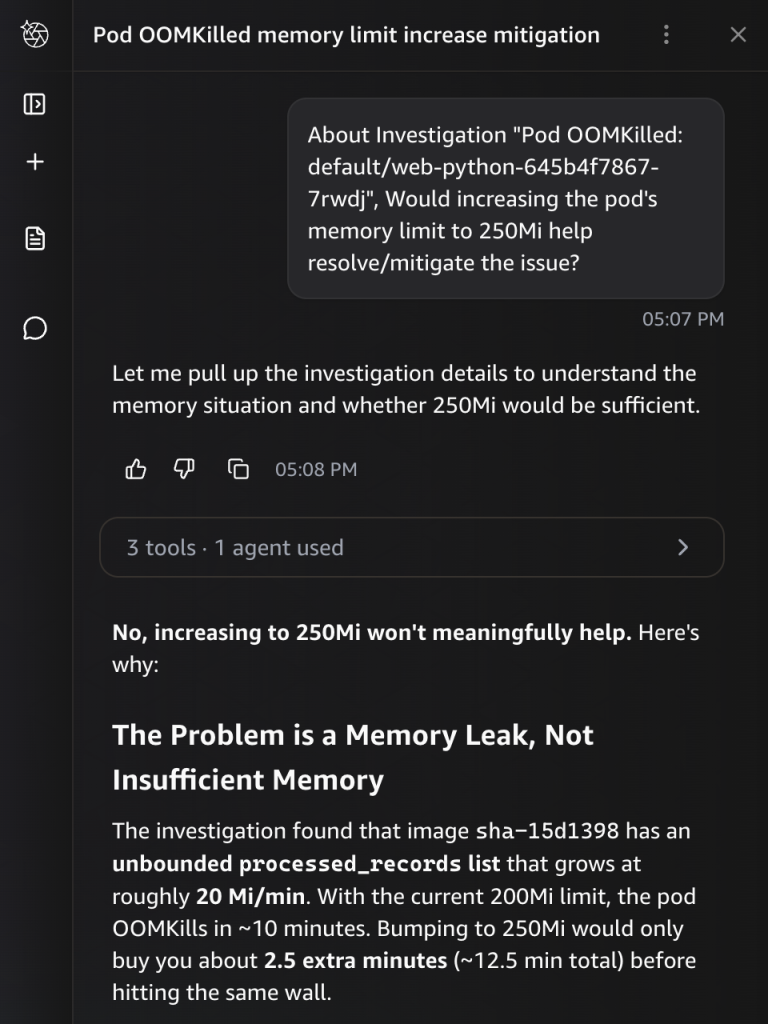
In the following example, the engineer asks whether increasing the pod memory limit will help solve the problem. The agent responds based on its investigation.
Figure 8. Follow-up chat on whether a higher memory limit would help.
As this shows, DevOps Agent goes beyond simple problem analysis. It uses the context that it accumulated during the investigation to respond to the engineer’s follow-up questions with detailed explanations.
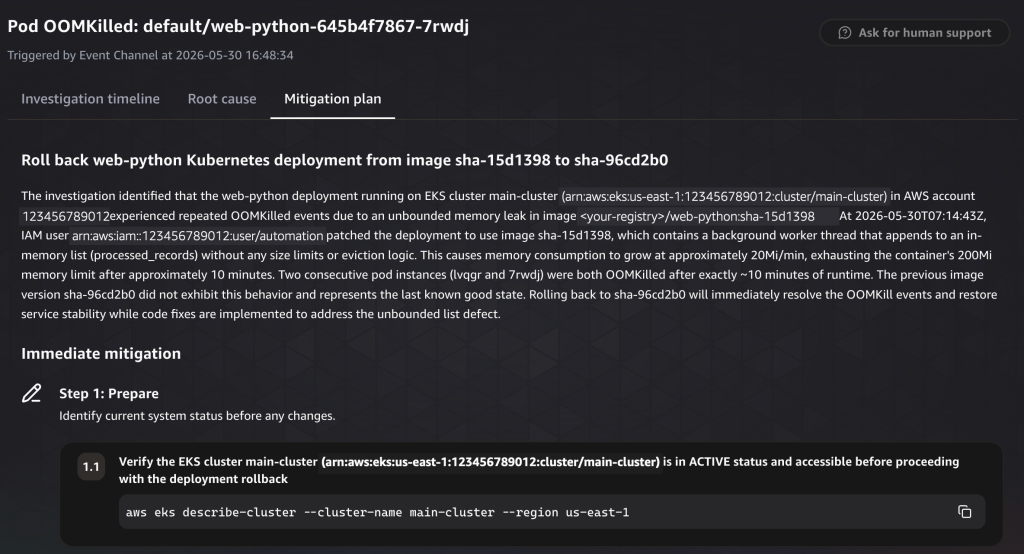
In this scenario, the problem is a logic issue in the source code. For that reason, DevOps Agent could not provide a clear plan at the Kubernetes or AWS infrastructure level. However, based on the root cause, you can receive a mitigation plan related to a rollback.
Figure 9. The Mitigation plan tab proposes a rollback.
Conclusion
In this post, we introduced the DevOps Agent Operator – a Kubernetes Operator that automatically detects EKS workload failures, collects diagnostic data, and triggers AWS DevOps Agent for root cause analysis.
By combining these two tools, engineers gain the following benefits:
Faster response: Automatic data collection and analysis as soon as a failure occurs, even during nights and weekends.
No loss of information: Immediate preservation of all troubleshooting data before a pod is rescheduled or deleted.
Comprehensive analysis: DevOps Agent analyzes code repositories, observability tools, and CI/CD pipelines together to trace root causes that are hard to find with a single tool.
Organizational knowledge: Through skills, the solution reflects your team’s operational knowledge, enabling incident response with consistent quality.
Continuous improvement: Proactive recommendations based on accumulated incident data help prevent future incidents.
Looking ahead, there are several ways to extend this solution:
Support for more resource types: Extend monitoring beyond pods to Job, CronJob, Deployment, and StatefulSet.
MCP server integration: DevOps Agent supports Model Context Protocol (MCP) servers, enabling advanced workflows such as querying additional resources during analysis or performing pattern analysis on past incidents.
Proactive pattern analysis: As incident data accumulates in Amazon S3 and CloudWatch Logs, DevOps Agent can identify recurring patterns – such as “OOMKilled repeats every Monday morning” – and recommend preventive measures.
The DevOps Agent Operator project is open source on GitHub. It is a reference implementation rather than a supported product: use it as a working example of how to encode your own detection conditions and collection strategy for the failures your team actually sees.
To try it yourself, clone the repository, follow the deployment steps in this post, and point the Operator at your own Agent Space webhook. Start with a non-production cluster and a narrow WATCH_NAMESPACES list, then widen the scope once you see the investigations that DevOps Agent produces.
Linus has released 7.3-rc1 and closed the
merge window for this release. “Nothing really stands out – except for
the fact that it’s big. It’s not the biggest rc1 we’ve ever had, but it’s
certainly up there, at least in number of commits.” He pulled 15,267
commits during this merge window, making it the second busiest ever; only
6.7 has exceeded it.
NVIDIA has announced a new entry-level edge AI board, the Jetson Orin Nano 2. The upgraded Nano is not only twice as fast as its predecessor, but unexpectedly, features an outright new Orin SoC at its heart
ДАНС предлага скандални законови промени – за овладяване, централизиране, прикриване, безконтролност на службите.
Вече разбирам защо в правителствената програма имаше само „Реформа в службите“ без никаква конкретика. Защото конкретиката е вредна и опасна. Ще се спра само на най-скандалните промени.
През „преходни и заключителни разпоредби“ изтърбушват Закона за защита на класифицираната информация. Но не в посока на намалява на прекомерното класифициране, заради което отказват дори статистически данни, а в обратната посока.
1. Вечни тайни. В момента максималният срок за „строго секретно“ е 60 години – сега ДАНС предлага безкрайно удължаване, ако „националните интереси налагат това“. На кои ли тайни им изтичат сроковете и биха били разкрити?
2. Бързо и безконтролно унищожаване на информация – в момента, след изтичане на срока на защита (от гриф „поверително“, „секретно“ или „строго секретно“) документите става достъпни при поискване за определен срок. ДАНС предлага да може да ги унищожава веднага по собствена преценка. Без разрешение от ДКСИ и без съдебен контрол, каквито са налице в момента – предлага се всичко това да отпадне и ДАНС да си решава. Припомням, че много от исканията за подслушване и следене са класифицирана информация и ще могат да бъдат зачиствани бързо.
3. Кадрово овладяване – усъвършенстван е инструментариума за кадрово овладяване на ДАНС – въвеждане на повишаване без конкурс по субективна преценка на председателя; удвояване на изпитателния срок с цел по-дълго държане в кадрова зависимост; премахване на длъжностната характеристика от служебното досие на служителите; премахване изцяло на държавните служители по общия ред – т.е. дори деловодителят ще трябва да е служител по специалния ред за ДАНС (с 15 заплати и др.); улесняване на ад-хок разместването на служители и дори премахване на вътрешните правила за него; дори вътрешната структура на ДАНС вече няма да се определя нито от закона, нито от Министерския съвет, а от председателя на ДАНС – което е инструмент за пълно кадрово овладяване. И нещо дребно – вече и служителите на трудов договор ще имат безплатен градски транспорт, така че и те да бъдат обгрижени с привилегии.
4. Централизация на разрешенията за достъп до класифицирана информация – към момента достъп до „поверително“ може да се дава след проучване от служителя по сигурността на информацията (ССИ) към съответното ведомство. ДАНС предлага вече всички да минава през тях и нито ССИ, нито Държавната комисия по сигурността на инфорамцията да могат да издават разрешения за достъп. Това е допълнителен инструмент за централизиран кадрови контрол през ДАНС.
5. И един куриозен текст – „предвижда се несъвместимост да не е налице и в случаите на осъществяване на психологическо консултиране и психотерапия, което ще позволи на психолозите в Агенцията да развиват своите умения в областта“. Т.е. на служлите на ДАНС е забранено да правят всичко, освен да преподават в унисерситет и да са психолози и психотерапевти. Значи, отивате на психотерапевт, но той може да е служител на ДАНС и в изпълнение на ЗДАНС да започне да води оперативна разработка във връзка със споделеното. Но тук има и друга хипотеза – текстът да е нужен, за да могат психолозите на ДАНС да участват в новоприетите тестове за почтеност на държавни служители. Т.е. още един механизъм за кадрови контрол в цялата администрация.
Част от тези промени ДАНС опита да пробута и по времето на верния на Пеевски Главчев – тогава обществената реакция ги спря, но сега Пламен Тончев е с нов кредит на доверие от новата власт и явно е решил, че службите ще си правят каквото си искат.
Реформата на службите трябва да е в обратна посока – адекватен външен контрол, преустановяване на злоупотреби с класифицирана информация, СРС и тайни сътрудници, фокусиране върху контраразузнавателните дейности и националната сигурност (която ДАНС системно проспива – при взривове, пране на пари, радикализация, стратегически обекти със сламени собственици и какво ли още не).
Засега е публикувано на обществено обсъждане – докато стигне в парламента има време, но заявката е ясна – централизация, кадрово овладяване, прикриване и замитане на информация, вечни тайни – неща, присъщи за тоталитарни режими.
To provide the best experiences, we use technologies like cookies to store and/or access device information. Consenting to these technologies will allow us to process data such as browsing behavior or unique IDs on this site. Not consenting or withdrawing consent, may adversely affect certain features and functions.
Functional
Always active
The technical storage or access is strictly necessary for the legitimate purpose of enabling the use of a specific service explicitly requested by the subscriber or user, or for the sole purpose of carrying out the transmission of a communication over an electronic communications network.
Preferences
The technical storage or access is necessary for the legitimate purpose of storing preferences that are not requested by the subscriber or user.
Statistics
The technical storage or access that is used exclusively for statistical purposes.The technical storage or access that is used exclusively for anonymous statistical purposes. Without a subpoena, voluntary compliance on the part of your Internet Service Provider, or additional records from a third party, information stored or retrieved for this purpose alone cannot usually be used to identify you.
Marketing
The technical storage or access is required to create user profiles to send advertising, or to track the user on a website or across several websites for similar marketing purposes.