At the 2026 All Systems Go!
conference, systemd maintainers Luca Boccassi and Zbigniew Jędrzejewski-Szmek
delivered the traditional “state of the project” session with an overview of the
systemd project’s accomplishments in the past year. That was followed by a
maintainer round table where Boccassi, Jędrzejewski-Szmek, Daan De Meyer, and
project leader Lennart Poettering fielded questions about systemd’s size,
health, and if it might replace Kubernetes. (It will not.)
Modern reinforcement learning (RL) systems rely on thousands of rollout environments running in parallel. For large language model (LLM) training using Verifiable Rewards (RLVR) each rollout environment runs in a tightly isolated sandbox so state never leaks between environments.
The faster you can recycle sandboxes, the more training steps you can run per hour. That means higher rollout density per host which directly lowers your cost per step.
But density is a tuning knob with two failure modes. Push it too high and you hit a tail latency cliff. Play it too safe and you overprovision, leaving money on the table. The sweet spot depends on your instance type, workload profile, and how your training algorithm amplifies stragglers.
This post shows how to find that setting. We walk through the tunables that control density on Amazon EC2 metal. We then introduce labsweep, a measurement harness for mapping your latency and density curve. Throughout the post, we draw on lessons learned from production deployments with customers. The post is written for readers familiar with Kernel-based Virtual Machine (KVM), Firecracker, and container orchestration.
Background: EC2 metal, Nitro, and Firecracker
The AWS Nitro System offloads networking, storage, and security to dedicated hardware. Amazon EC2 instances expose a stable CPU topology you can inspect and pin workloads against. On Amazon EC2 metal, applications run directly on the underlying hardware.
Firecracker is a lightweight virtual machine monitor (VMM) designed for high density workloads. Each microVM boots quickly, runs its own Linux kernel, and has a small memory footprint.
Running Firecracker on Amazon EC2 metal combines direct access to underlying hardware with lightweight virtualization to support high density sandboxing. The key question is how far you can increase density before tail latency hurts the RL training loop.
Solution overview
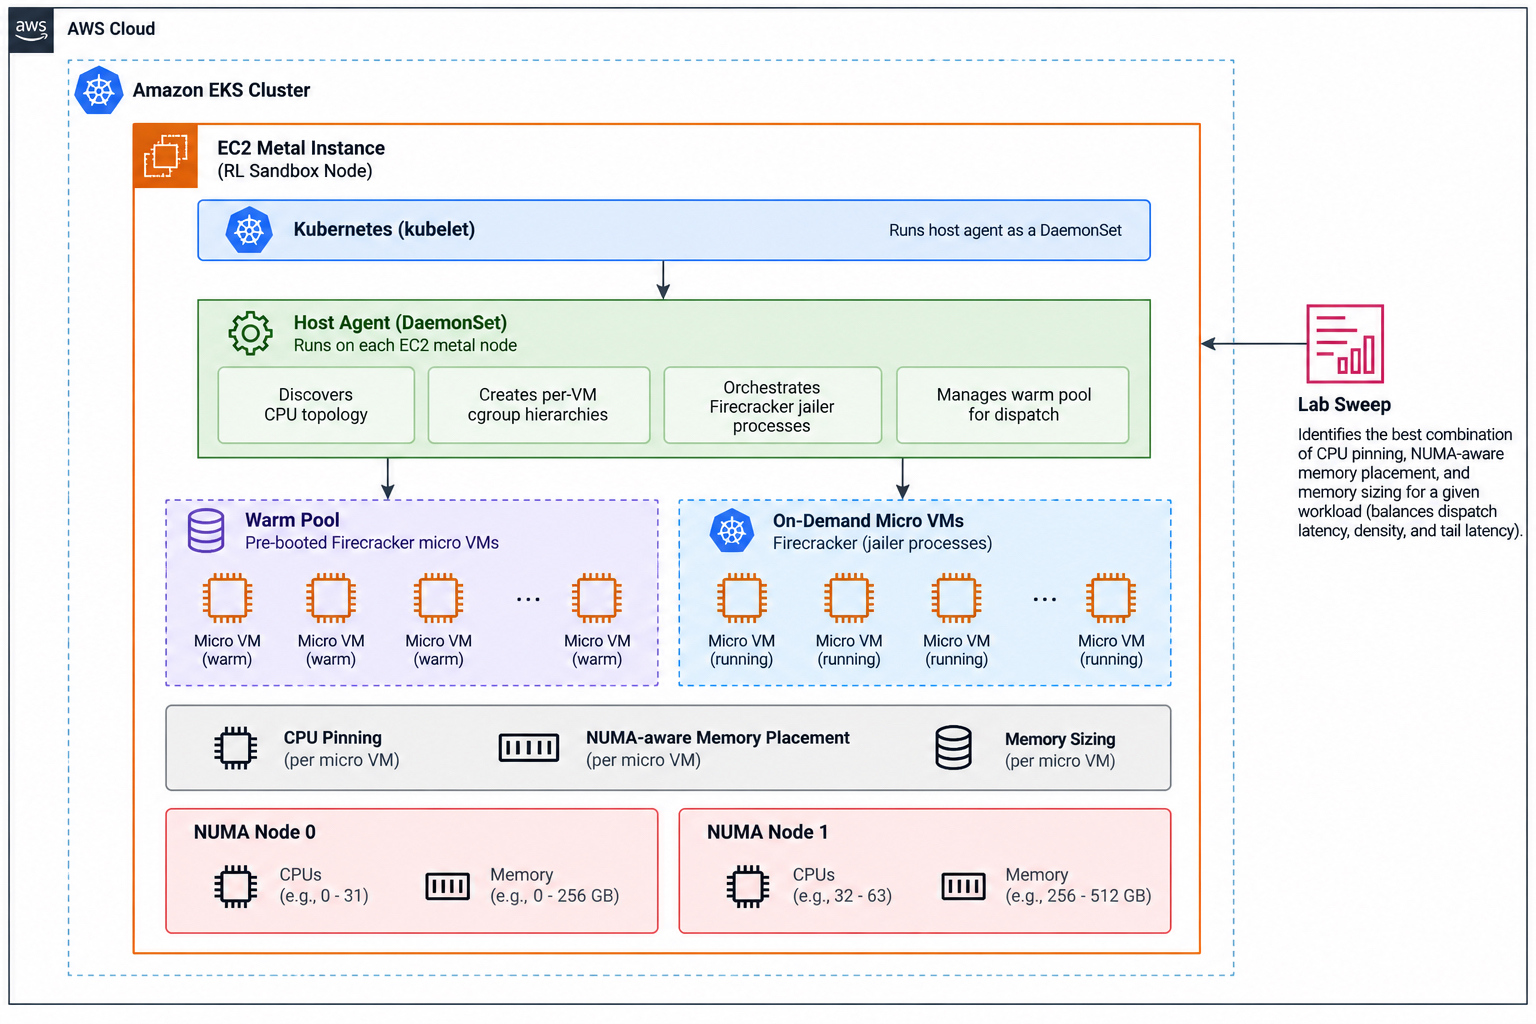
The following diagram shows the reference architecture of a production RL sandbox node. This architecture serves as the foundation for the rest of the post. An Amazon EC2 metal instance runs a host agent that manages Firecracker microVMs, CPU pinning, non-uniform memory access (NUMA)-aware memory placement, and the warm pool used for dispatch.
Reference architecture of a production RL sandbox node showing host agent orchestration of Firecracker microVMs, resource preparation, warm pool management, workload dispatch, and telemetry collection on Amazon EC2 metal
The host agent runs as a DaemonSet on each Amazon EC2 metal node in the Kubernetes cluster. At startup, it discovers the CPU topology, creates per-microVM cgroup hierarchies, and orchestrates Firecracker jailer processes throughout the microVM lifecycle.
To reduce dispatch latency, the system maintains a warm pool of pre-booted microVMs. The host agent applies CPU pinning, NUMA-aware memory placement, and memory sizing on a per-microVM basis. labsweep identifies the combination of these settings that best balances dispatch latency, density, and tail latency for a given workload.
Prerequisites
Amazon EC2 metal instance (for example, we tested m8i.metal-48xl, m8a.metal-48xl, and m8g.metal-48xl).
Linux kernel 6.2+ (required for cgroup partition isolated mode).
Firecracker 1.7+ and the Firecracker jailer.
Go 1.22+ (to build labsweep).
AWS CDK v2 with Python 3.11+ (to deploy the accompanying stack).
Guest rootfs image (a builder script is included in the accompanying repository).
Scope note: this post focuses on CPU and memory placement for Firecracker microVMs. Other system variables including storage architecture (Amazon Elastic Block Store (Amazon EBS), local SSD) and network latency to the LLM endpoint were held constant to isolate the effects of CPU and memory placement.
Density tunables on EC2 metal
Your density ceiling depends on tunables whose availability varies by instance type. Not every knob exists on every instance type, and where a knob does exist its underlying mechanism can differ. The following table shows which tunables are available across the three metal instance types this post considers: m8i, m8a, and m8g. You can derive availability and mechanism from each instance type’s published CPU topology. The measured latency and throughput results later in the post currently cover m8i and m8a, with m8g results to follow.
Tunable
m8i.metal-48xl
m8a.metal-48xl
m8g.metal-48xl
What it does
Core pinning (cpuset.cpus)
✓
✓
✓
Dedicates a physical core to each microVM. Eliminates scheduler-induced tail latency
NUMA node confinement (cpuset.mems)
✓
✓
✓ (2 NUMA nodes on the 48xl)
Keeps memory allocations local. The remote-node latency penalty varies by instance type. Check the NUMA distance matrix for your instance before pinning
SMT state (smt/control)
✓ (on/off)
N/A (no SMT)
N/A (no SMT)
Doubles vCPUs when on. Workload-dependent: helps I/O-bound sandboxes, hurts compute-bound loops
L3 cache domain pinning
✓ (place workloads within NUMA-aligned cache domains)
✓ (24 domains, 8 cores each)
✓ (single shared L3 per socket. Pin on NUMA/socket boundary)
Reduces cache contention for working sets above 4 MiB per microVM
cgroup partition (isolated)
✓
✓
✓
Removes kernel workqueue interference from pinned cores. Requires kernel 6.2+
Guest memory size
✓
✓
✓
Primary cost driver. Determines how much of your memory-to-core budget each guest consumes; M-series gives 4 GiB per vCPU
Key observation: different instance types expose different optimization opportunities. Among the instances evaluated, simultaneous multithreading (SMT) is available on m8i but not on m8a or m8g. Cache-local placement also differs by instance type: some present many discrete L3 domains, some a shared L3 that is effectively partitioned along NUMA boundaries, and some a single mesh-shared L3 per socket where the meaningful locality boundary is the NUMA/socket rather than a cache-domain count. Each instance type’s L3 layout is described in its own row of the table above and in its published CPU topology. As a result, the set of tunables and their impact on density vary by instance type. This is why measuring your own configuration matters more than following generic engineering best practice lists.
To make this concrete, here is what configuring one tunable looks like in practice: a cpuset pin that dedicates a single physical core to one microVM.
# Create an isolated cgroup for one microVM on core 12
mkdir -p /sys/fs/cgroup/microvm/vm-012
echo "12" > /sys/fs/cgroup/microvm/vm-012/cpuset.cpus
echo "0" > /sys/fs/cgroup/microvm/vm-012/cpuset.mems
# Launch the jailer into this cgroup
firecracker-jailer --id vm-012 \
  --exec-file /usr/bin/firecracker \
  --parent-cgroup microvm/vm-012 \
  --uid 1000 --gid 1000
From tunables to measurement: labsweep
These tunables interact in ways that depend on your workload and instance type. You cannot predict their combined effect from the specification sheet alone. You must measure the resulting system behavior.
labsweep is the test harness we built to do exactly that. It is a Go tool that:
Discovers your host topology through sysfs (cores, NUMA nodes, L3 domains).
Plans a matrix of configurations and densities.
Launches jailed Firecracker microVMs at each density with bounded concurrency.
Runs the workload in every guest concurrently and records per-microVM latency.
Outputs raw samples, percentile aggregates, and variance data with full host provenance.
Methodology note: each experiment is performed at fixed microVM density. Dynamic churn is outside the scope of this evaluation.
The following command launches a typical labsweep run on an m8a.metal-48xl:
Each run produces percentile latencies for every configuration, variance across repeated trials, and raw samples for recomputing any statistics. Results include full provenance (instance type, CPU model, kernel version, and Firecracker versions) making runs reproducible and comparable over time. If a microVM fails to respond, the harness reports failed samples instead of silently omitting them. This prevents failures from biasing the reported results.
The accompanying repository includes everything needed to reproduce these experiments: the labsweep harness, guest agent, rootfs builder, and the CDK application that deploys the complete stack on an Amazon EC2 metal instance (github.com/aws-samples/sample-firecracker-microvm-density-lab).
Results on representative workloads
Using labsweep we benchmarked workloads representative of the execution patterns in production RL systems: short-lived verification tasks (run a test suite, check the result), build-heavy tasks (compile and link), full 14-turn replayed RL episodes, and a synthetic compute loop as a control. Across all evaluated instance types, we collected more than 100,000 samples across 500+ configurations.
The 1.0x ratio rule
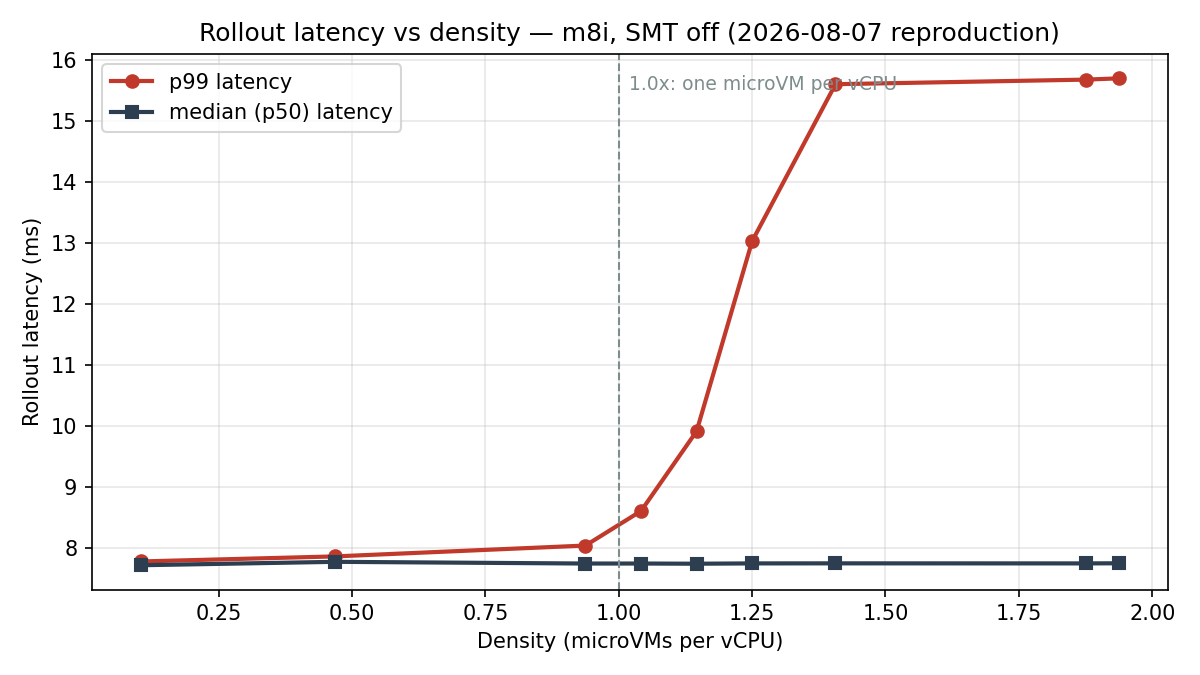
Tail latency remains flat as density increases until the workload reaches one microVM per vCPU. Beyond that threshold, p99 latency rises sharply over the next 15% increase in density before reaching a new plateau while median latency remains essentially unchanged. Expressing density as microVMs per vCPU rather than as an absolute microVM count makes this threshold portable across instance types. The latency cliff occurs at the same 1.0x density threshold regardless of instance size. Only the maximum number of microVMs scales with available vCPUs. The complete per-density measurements supporting this figure are provided in the appendix.
Rollout latency versus density (microVMs per vCPU): the p99 latency cliff occurs at approximately 1.0x density while median latency remains stable.
Core pinning reduces the tail latency for most real workloads
On the synthetic compute loop, core pinning made no measurable difference at equal density. On real sandbox workloads however, core pinning measurably tightened the tail: it reduced the p99/p50 ratio toward roughly 1.1x. The p99/p50 ratio measures tail spread by dividing the 99th-percentile latency by the median. Lower values indicate a tighter, more predictable latency distribution. The advantage grows with density, so pinning matters most where you are pushing the host hardest.
Why does this matter when choosing the right density? If you run Group Relative Policy Optimization (GRPO), every gradient step waits for the slowest rollout in the group. At a group size G=64, a p99 event affects ~47% of gradient steps. The effect becomes more pronounced as deployment density increases.
Density / cores
G=8
G=16
G=64
0.94x
1.01x
1.01x
1.04x
1.04x
1.01x
1.03x
1.13x
1.15x
1.01x
1.04x
1.32x
Past the 1.0x ceiling the amplification climbs steadily, and by the time you are well above it a p99 event can dominate the group’s completion time. Median-focused dashboards do not surface this because the median stays flat. Core pinning keeps the p99/p50 ratio low across density, holding tail latency amplification far closer to flat than an unpinned configuration even at a group size of 64. Oversubscription can appear to provide spare capacity until tail latency amplification dominates training time. Set the density to the highest value where the amplification factor remains flat.
SMT depends on your workload
The optimal SMT setting depends on the workload:
I/O-bound workloads: SMT-on provides higher throughput. At high density it delivers 1.49x throughput because the vCPU count stays above the 1.0x ratio.
Compute-bound workloads: SMT-off produces more predictable tail latency, with a markedly tighter p99 spread than SMT-on.
Most RL sandbox workloads are I/O-bound, spending much of their time waiting on file operations, process creation, or git operations. For these workloads, keep SMT enabled. With SMT enabled, you can place more microVMs before reaching the 1.0x ratio, for higher density without crossing the latency cliff.
Configuration matters as much as hardware
Hardware selection is only one factor affecting performance. Configuration choices produce measurable differences. To isolate the effect of configuration, we compare identical workloads on the same m8i instance with SMT enabled and disabled. The results show that changing a single configuration parameter measurably affects peak throughput per host.
The table below shows how enabling and disabling SMT affects peak throughput across a representative set of RL workloads, expressed as the SMT-on to SMT-off throughput ratio. The workloads were selected to represent the major execution patterns encountered in RL systems. Collectively, they cover short-lived verification tasks, interactive sessions, and full RL episodes.
Workload
Throughput gain from SMT
Verification task
1.14x
Build task
1.13x
Replayed RL episode
1.17x
The optimal SMT configuration depends on the density at which the workload is intended to run. With SMT enabled, the host exposes more vCPUs, which supports higher microVM densities before reaching the 1.0x microVM per vCPU threshold. This increases throughput at higher densities by delaying the onset of the tail latency cliff. At densities at or below one microVM per vCPU, SMT disabled delivers slightly better per-task performance and tighter tail latency. These results demonstrate that no single SMT configuration is universally optimal. The best choice depends on the target operating density. You should therefore determine the optimal configuration through measurement rather than assuming it in advance.
When memory becomes the limiting resource
We ran all experiments on M-series metal instances, which provide 4 GiB of memory per vCPU. At this memory-to-vCPU ratio, every workload we tested remained vCPU-bound. We exhausted vCPUs before memory. If your workloads require a higher memory-to-vCPU ratio, the bottleneck shifts from vCPUs to memory. In that case, a memory-optimized instance family may be the better choice. It provides more memory per vCPU but fewer vCPUs per host. As a result, the maximum sandbox density is lower. Consider this trade-off when selecting an instance family.
Reproduce these results on your own workloads
You do not need to take these numbers on faith. With labsweep, you can reproduce them on your own workloads. Clone the accompanying repository and deploy the CDK stack on the instance type you plan to run in production. Build a rootfs from your real workload. Sweep across densities below and above your expected level so you can see where expected performance drops off (the -densities flag in the preceding example is a reasonable start). Repeat each configuration a few times using the -repeats flag so you can see the variance, then read the p99/p50 ratio and the amplification table for your group size. Tune your system based on the curve you measure for your own workloads. That is more reliable than tuning to synthetic benchmarks.
Clean up
If you deployed the accompanying CDK stack for labsweep, tear down these resources when you are done:
Delete the CDK stack (cdk destroy).
Terminate any running Amazon EC2 metal instances.
Remove the guest rootfs images from Amazon Simple Storage Service (Amazon S3) (if uploaded).
Delete the Amazon CloudWatch log groups created by the harness.
Conclusion
Sandbox density on Amazon EC2 metal is determined by a small set of tunables whose optimal values depend on both the workload and the underlying instance type. Because those values vary across workloads, there is no single density setting or configuration that is optimal for every deployment. Instance type specifications give you a starting point but only measurement can identify the right operating point for your workload. labsweep is designed to make that measurement straightforward so you can optimize against your own production workloads.
Full per-density measurements behind the tail-latency chart in “The 1.0x ratio rule.” Conditions: m8i, SMT off, 96 physical cores, config A (unpinned). Amplification columns give the GRPO group-completion factor (group max over rollout p50) at group sizes G=8, G=16, and G=64.
Let’s
Encrypt, the nonprofit that provides free TLS certificates for millions of
sites, has announced that
it will be moving to certificates with 64-day lifetimes on February 10,
2027:
This means that any certificate we issue or renew on and after that date will
have a 64 day validity period, and we expect the last 90-day certificate to
expire on May 11, 2027. We will not revoke valid certificates as a part of this
process.
This is the second stage of Let’s Encrypt’s plan, announced in 2025,
to move to 45-day certificate lifetimes as required by the the CA/Browser
Forum Baseline Requirements. In 2028, Let’s Encrypt will switch to 45-day certificates.
Understanding why an application is using more resources than expected, whether that is CPU or memory, can be challenging. Logs and aggregate metrics can only get you so far. Thankfully there is a better way: CPU or memory profiling can show you the exact function where your application is using CPU or allocating memory.
Today we are happy to announce support for CPU and memory profiling of Workers and Durable Objects. From the Workers Observability page, you can now request an on-demand CPU or memory profile of an active Worker, inspect it as an interactive flamegraph, and download the profile file for further analysis.
This method of profiling gives you a useful perspective into what your code is doing and how you can improve it in a real-world setting. That’s because the best way to understand your application is to profile it in production.
To try this on one of your Workers, you have a choice of using the CLI or the Cloudflare Dashboard.
To use the dashboard, head to the Cloudflare dashboard and then access the list of Workers on your account by navigating through Build → Compute → Workers & Pages.
Select your Worker and navigate to its Observability tab. You can then use the drop down to select “Flamegraph”:
You can then request both CPU and memory profiles for your Worker on this page. The duration determines how long the profiler should run for on your Worker. You can also select different versions of your Worker to be profiled. Your Worker needs plenty of traffic to be successfully profiled, so make sure you choose a version that has enough traffic.
Once you click the Capture Profile button, the profiler will run for the duration that you have selected, and you will then see a flamegraph representing the results of the profile being rendered. Each rectangle in the flamegraph represents a function call, with the width representing the amount of CPU time or memory being used by that function. You can click on different functions to focus on and hover to see more details about them:
Don’t be afraid to capture a couple of profiles, then look for the widest functions to determine what is using the most resources in your Worker. You might also find that the table view is useful to get a quick sense of which functions are most commonly seen in the profile.
We have already seen multiple teams at Cloudflare using CPU and memory profiling to identify opportunities for optimizing memory and CPU usage, fixing out-of-memory (OOM) errors, and improving performance. Below are some examples of this.
Using CPU profiling to find optimizations
Let’s look at a real example of how you can use CPU profiling to optimize your Workers. We will look at a CPU profile of the Worker that implements the R2 binding. This Worker receives a lot of traffic and so eliminating even the smallest amount of wasted CPU cycles can have a massive impact on its performance.
We set up the profiler to capture CPU traces, with a duration of 50 seconds. Once we received the rendered profile, we saw this:
As mentioned previously, the widest boxes are those which are using up most of the CPU time. Some of them aren’t surprising, for example decryptBlock is R2 decrypting object data on the way out, and fillResponse is just moving bytes. There weren’t any clear ways to optimize these functions.
As some of the boxes are less visible, it can be a good idea to take a look at the table view. Sorting by Samples points us at genericR2JsonReplacer:
This function represented over 5% of the CPU time, but what caught our attention was the function calling itself recursively. This looked like wasted work, and it was.
Even though the replacer was being called by JSON.stringify on every node in the JSON tree, the replacer itself was also walking the tree. This meant that a value nested five levels deep was processed five times. Fixing this enabled us to eliminate the duplicate work and make the genericR2JsonReplacer function 2.7x faster.
The second candidate in the profile that we looked at was a duplicate call to metrics.
When looking at the code, we saw something close to this:
The metrics call was heavy enough that just one call represented 1% of the CPU time in the profile. So storing the result of the first call in a variable and then not calling it again saved us a fair chunk of CPU time.
How we used Worker profiling internally to fix memory problems
Internally we had a Worker with a memory problem. P999 memory sat around 133 MB against the 128 MB Worker memory limit. This caused the Worker to be evicted frequently with an “Exceeded Memory” error.
The image above shows a screenshot of the “Errors by invocation status” graph, with the number of “Exceeded Memory” errors clearly dropping as a result of the fixes identified through profiling.
What was hard to work out was what was causing these errors. The errors and metrics pointed at memory as the source of the problem, but it didn’t explain which part of the code caused it.
The team took a heap profile of one of the Workers running in production and opened it with pprof. They saw that their Prometheus code accounted for roughly 66.7% of allocations in the profile. This code was supposed to be disabled, but enough of it was still running that it created a problem. Because it was instrumenting a lot of the code paths in the Worker, it ended up using a lot of its memory, even though the collected data never actually left the Worker.
This code wasn’t suspected as a culprit of the memory issues, because it was thought to have been disabled. The profiler showed that the code was only partially disabled, with the memory cost still being paid as if it was fully enabled.
The team removed the Prometheus code path completely. This quickly improved the memory usage of the Worker:
Percentile
Before (MB)
After (MB)
P50
70
54
P90
94
79
P99
113
97
P999
133
118
This gave the P999 about 10 MB of headroom below the 128 MB limit.
Following a profiling request to the edge
Workers have supported local profiling through Chrome DevTools for a while, but it has not been possible to start a profiling session on Workers running in production. While profiling a Worker locally is useful, the Worker does not receive the same kinds nor number of requests as one does in production. So how do we profile a Worker or a Durable Object running there?
One of the best features of Workers is that their requests are routed to the data center that is nearest to the requesting client. This reduces latency, but it does mean that Workers must be replicated across different data centers and metals (physical servers). In addition, when a Worker is receiving a lot of requests in a particular data center, it can be replicated in a particular metal multiple times to handle all the traffic.
Durable Objects add another layer of indirection: they can be placed dynamically and can move.
This and a few other features of Workers means that before we can start a profiling session, we need to first answer a few questions:
Which version does the developer want to profile?
In which data center has that version run recently?
Is the Worker’s isolate still loaded in that data center?
Does the isolate belong exclusively to the requesting account?
For a Durable Object, where is the exact live primary actor?
A few of these questions are answered by the client making the profiling request. In most cases this will be the dashboard, but you can also send these requests yourself (or have your coding agent do it for you). An example request might look something like this:
Notably, this specifies both the script name and version that should be profiled as part of the request URL.
Right now, a new isolate is not started to produce a profile, because the goal is to observe real production execution. This means that if your Worker is receiving very little traffic, you may find that it is hard to profile. So it’s important you pick a version of your Worker that is deployed.
Profiling an isolate without stopping the Worker
A profile is useful only if the application can continue to execute while samples are collected. The Workers Runtime therefore holds the isolate lock only for profiler lifecycle operations. For a CPU profile, the process looks like this:
Acquire the isolate and its lock.
Create a V8 CPU profiler and begin sampling at a one millisecond interval.
Release the lock so normal requests can run.
Wait for the requested duration.
Reacquire the lock and stop profiling.
Release the lock and serialize the result outside the critical section.
Holding the lock through the duration of the profile would prevent JavaScript execution from continuing, which would make the profile useless.
Durable Objects
Durable Objects are different from Workers. Regular Workers are stateless: no one Worker is special or different from the rest, and we pick a running isolate of the requested Worker at random. Durable Objects are stateful, and they have a name. That provides us with the very helpful ability to grab a profile of a specific isolate and a specific object anywhere in the world. When profiling a Durable Object, you can choose by name which object to profile. The runtime will then route the profiling request to the right metal that owns the specific actor and provide a profile of the specific isolate running that object.
What’s next?
On-demand profiling is just the start. It enables you to explore your Workers performance in ways that have not been possible before. But it does have some limitations worth noting:
You must explicitly start the profiling session. This can mean that you miss important time periods in which your Worker is misbehaving, and where you would like to see a profile to understand what went wrong.
The memory profiler can only show you allocations that occurred during the profiling window. So if your Worker is allocating a lot during start-up, you will not see it.
In order to resolve this we are already working on something new: continuous profiling. The idea is that we will capture profiling samples for your Worker automatically, so that you can simply explore the profiles in the dashboard. This should make it easier to capture more rare events.
To learn more about profiling in Workers, including the feature presented in this blog post, check out our documentation.
Special thanks to the Workers Control Plane team and the Cloudflare Observability Platform team, in particular William Perron, who helped with dashboard implementation for this project.
The Deno team is joining Cloudflare to radically simplify self-hosting Workers and Durable Objects so developers can use the same primitives in more places.
For what this means and how it came about, here’s the story from Ryan Dahl, Senior Principal Engineer, and Kenton Varda, Distinguished Engineer.
стана ясен още на четвъртия ден. В ежедневно публикуваната във фестивалния вестник класация
„Черната топка“ литна напред с оценка 9,4 от 10 и вече нямаше не само кой да го изпревари, но и да го доближи.
„На първия ни спектакъл в залата имаше 15 души“, казаха авторите му, познати с общия прякор Лос Хавис (Хавиер Амброси и Хавиер Калво, театрални и телевизионни режисьори), докато на закриването на сансебастианския фестивал приемаха наградата на публиката. Същия уикенд филмът им – който спечели приза за режисура в Кан през май, а през септември взе най-голямото отличие в Торонто и беше избран да представлява Испания на Оскарите – тръгна по испанските кина и с над 600 000 зрители отвя блокбастъра „Одисея“.
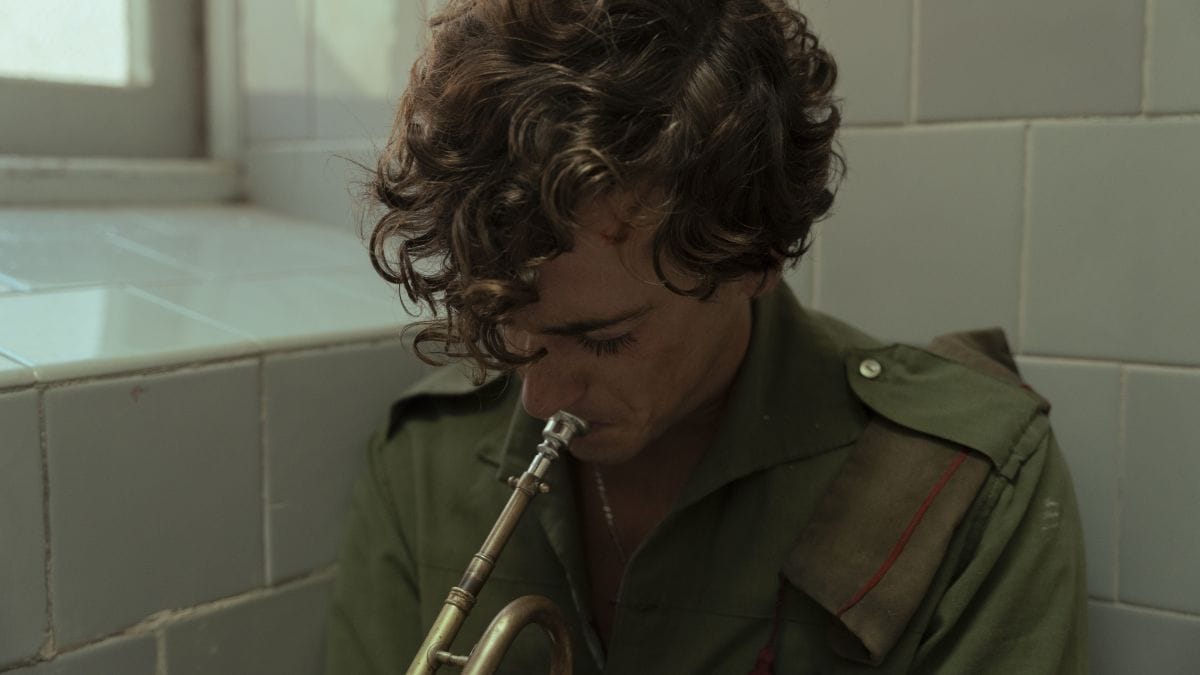
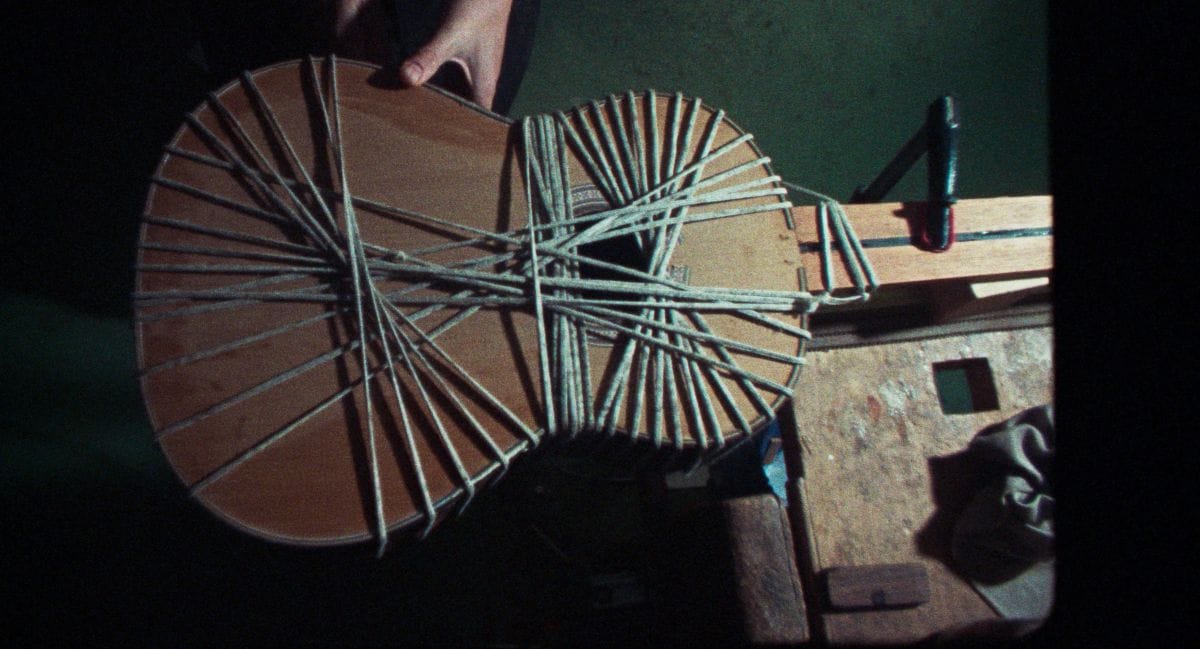
„Черната топка“ e „любовна история“, разхвърляна в три исторически момента (1932, 1937 и 2017 г.) и куп стилове и настроения. В нея има и впечатляващи визуални попадения, и страхотна игра на епизодици, и средняшко присъствие на водещи персонажи, и любопитни хрумвания, и досадни пренавивания. В двата часа и половина зрелище ще се намери по нещо, което да зарадва и да подразни мнозина: я сърцераздирателната сцена с детето, което поздравява по фашистки, или шеметното камео на Пенелопе Крус, я палуващите войници, разголени като в кадър от „Зулендър“, или неубедителната главна роля на самоукия музикант Алваро Лафуенте.
„Черната топка“ е заглавието на последната, недописана пиеса на Федерико Гарсия Лорка, чиито четири начални страници са онагледени в най-ранната сюжетна линия на филма – членовете на малко затворено общество в Гранада гласуват с топки дали младият Карлос да се присъедини към тях. Белите са „за“, а черните – „против“ и наброяват много повече, понеже Карлос е гей в хомофобски времена. Втората сюжетна линия „инсценира“ по-скоро волно пиесата „Черен камък“ на Алберто Конехеро¹, в която драматургът си представя срещата между юношата франкист Себастиан и обречения на разстрел републиканец Рафаел Родригес Рапун (реалния последен любим на Лорка). Третата линия е съвременна, но заедно с плодотворния контраст вкарва и допълнителна порция шум… („Страхливец“ на Люкас Донт, за който вече говорихме, е далеч по-изпипан етюд на тема любов/война от реколтата „Кан 2026“ – заслужава си „Черната топка“ да се гледа успоредно с него за сравнение.)
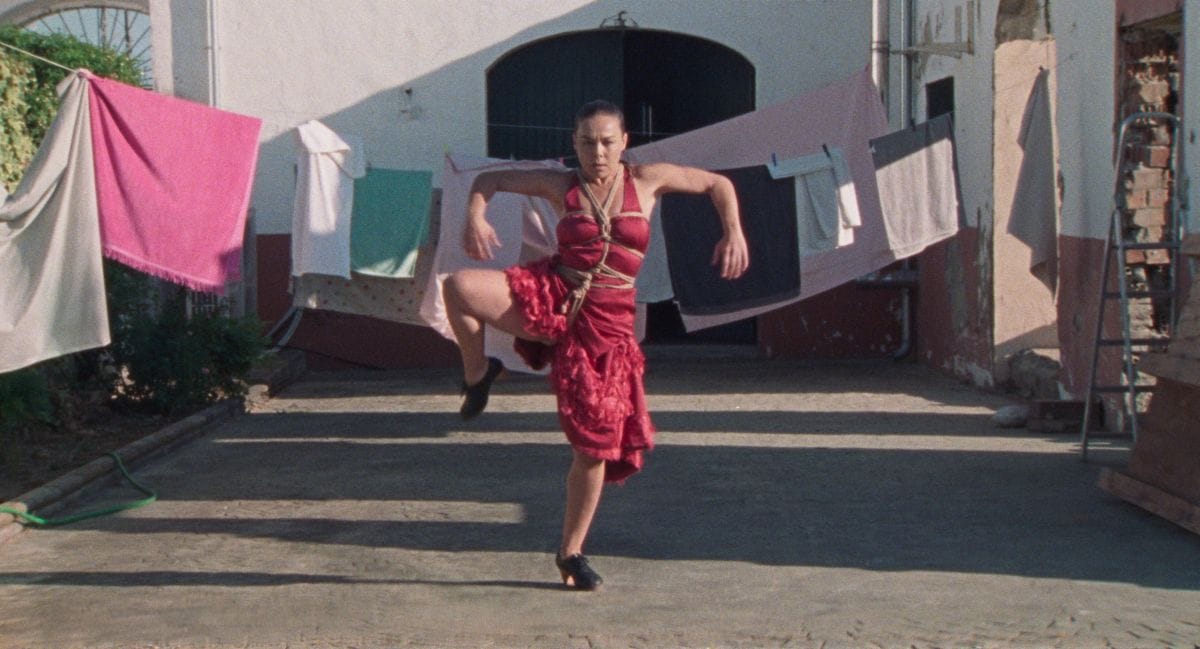
Jaleos: Росио Молина, байлаора (танцьорка на фламенко) / Кадър от Jaleos на Исаки Лакуеста
„Трябва да се живее!“,
изкрещява един от „Комедиантите“ на Марио Камус (1963) и избухва в неистов танц, цитиран в Jaleos, първа част от документален диптих за корените, контекста, представителите и същината на фламенкото, включена във фестивалния раздел за експерименти „Отворено пространство“.
Битува представата, че фламенкото е нещо много старо и много нашенско, но истината е, че то е доста ново и се е формирало от стичането на милион обстоятелства с най-разнообразен произход,
каза авторът. Филмът е прелюбопитен обзор на не особено познати факти: какво танцува Карменсита от Алмерия (първата жена, снимана за киноекрана през 1894 г. в студиото на изобретателя Томас Едисън); защо на испански flamenco е „фламенко“, „фламинго“ и „фламандец“; как така „Саета“ на Майлс Дейвис се причислява към най-доброто в жанра…
Началото на Jaleos (дума, ползвана за типичните за фламенкото окуражителни възклицания към изпълнителите) еархивен откъс с хубава жена, която ритмично тропа с токове, докато съвременни коментатори обсъждат зад кадър: фламенко – друг път… нищо общо с Испания… виж я как си тътри краката… ух, какъв скован кръст. Жената, оказва се, е Лени Рифенщал, прочутата режисьорка на нацистката пропаганда по Хитлерово време, тук – в ролята на фатална южнячка. Филмът ѝ „Низината“ е по едноименната пиеса на каталонеца Анджел Гимера̀ от ХIХ век, а 120-те фигуранти в същия този филм – роми, изведени за целта от два концентрационни лагера. Докато Лени монтира произведението си години по-късно, над 100 от тях вече са убити в Аушвиц… Ето, значи, само един от многото детайли в Jaleos, които разкриват цели бездни: статистите на Рифенщал са лагерници, а днес, за да се използват кадри с техните лица и движения, се плащат авторски права на нейните наследници.
„Фламенко“, режисьор Карла Симон
Институтът за външна търговия ICEX е орган на испанското Министерство на икономиката и се грижи да популяризира местните производители, изобретатели и предприемачи така, че светът да ги опознае и хареса. Една от най-новите му инициативи поощрява аудио-визуалния сектор, за да покаже красивото многообразие на made in Spain чрез авторски късометражки по характерни теми. Тази година резултатът са три творби, чийто дебют се състоя в Кан. А една от тях – „Фламенко“ на Карла Симон, получи номинация за предстоящите „Грами“ (латино) в категорията „Най-добро дългоформатно видео“. Отварям дума не само защото „Фламенко“ дели с Jaleos предмет и участници и го гледах в Сан Себастиан, а и защото неовладяно заблазявам на всички държави, способни да ангажират за общата кауза истински таланти и да им позволят да постигнат подобно качество.
Марианхел Вийегас и Даниела Марин Наваро във „Винаги съм твоето майчино животно“ / Росио Гусман и Дарана Алварес в мексиканския филм „Тъжни момичета“ / „Илюзията за безкрайно лято“: Гилермина и Белинда
Три по две от Латинска Америка
От дузината селектирани през 2026 г. в „Латинохоризонти“ специално внимание заслужават три чудни филма с непрофесионални изпълнителки: две сестри, две приятелки, две братовчедки.
Дебютът на Валентина Маурел (Коста Рика) „Сънувам електрически сънища“ разказваше в необичаен ключ за едно артистично семейство в разпад и особено за отношенията баща–дъщеря – с поезия, лутане и вулканични чувства. Вторият, чието заглавие е заето от стихотворение на майката на режисьорката и буквално означава „Винаги съм твоето майчино животно“, следва сходен модел и привлича същите магнетични изпълнители на две от главните роли, но не успява да „лумне“ като предишния, при все че нито доскучава, нито фалшиви. Персонажите са в криза и пред отпътуване, градът и музиката са с присъствието на действащи лица, а вниманието този път е обърнато към най-младите. Но Маурел трудно може да бъде обобщена, което, струва ми се, е един от най-хубавите комплименти.
„Тъжни момичета“ на Фернанда Товар (Мексико) е за фантастичната сила на тийнейджърските приятелства и за „специфично женската тъга“ от определени житейски дадености, която никоя от нас не успява да избегне дори в най-безгрижните си години, както отбеляза авторката. Две млади състезателки по плуване се носят из басейна и из града и неспирно бърборят – чувстват се безсмъртни и докато не става ясно, че не са, всъщност наистина изглеждат такива: неземни, окрилени, легендарни, щастливи. Един от визуално най-красивите филми в програмата, в който има десетки възможности за любуване.
„Мълнията търси белите животни и блестящите неща“, обяснява възрастна жена в „Илюзията за безкрайно лято“ – прощъпулник в киното на фотографката от „Магнум“ Алесандра Сангуинети, която в Сан Себастиан спечели наградата в раздела „Латинохоризонти“ и приза на младежкото жури (150 души между 18 и 25 години, които имаха да избират измежду 21 заглавия). Някъде през 1998-ма в дълбоката аржентинска провинция Алесандра започва да снима своите десетинагодишни съседки Гийермина и Белинда: те играят, пеят, скитат, изразяват схващания за света, започват работа, стават млади майки, за първи път отиват в чужбина. Четвърт век в 80 часа суров материал, сведени до 90 минути есенция – семпли, но същевременно богати и изненадващи като живота. „Искам да съм пеперуда – казва едното дете, – защото те живеят само ден. Така ще се раждам отново и отново.“
Валерия Върбанова в „Обувките на баща ми“ / Част от екипа на „Обувките на баща ми“: Христо Симеонов, Катя Тричкова, Валерия Върбанова, Веселин Христов
Чий е човек?
Този объркващ въпрос ни принуждава да си зададем пълнометражният дебют на Христо Симеонов. „Обувките на баща ми“ беше избран заедно с още 13 заглавия за конкурсния раздел с първи и втори филми „Нови режисьори“, с победа в който преди 12 години започнаха фестивалния си път Кристина Грозева и Петър Вълчанов. В ядрото му е реално събитие: три жени, отдавна изоставени от един мъж, получават мъртвото му тяло и докато уреждат погребението му, започват да се чудят дали това е същият човек. Доколко познаваме ключовите фигури в живота си? Има ли близостта давност?
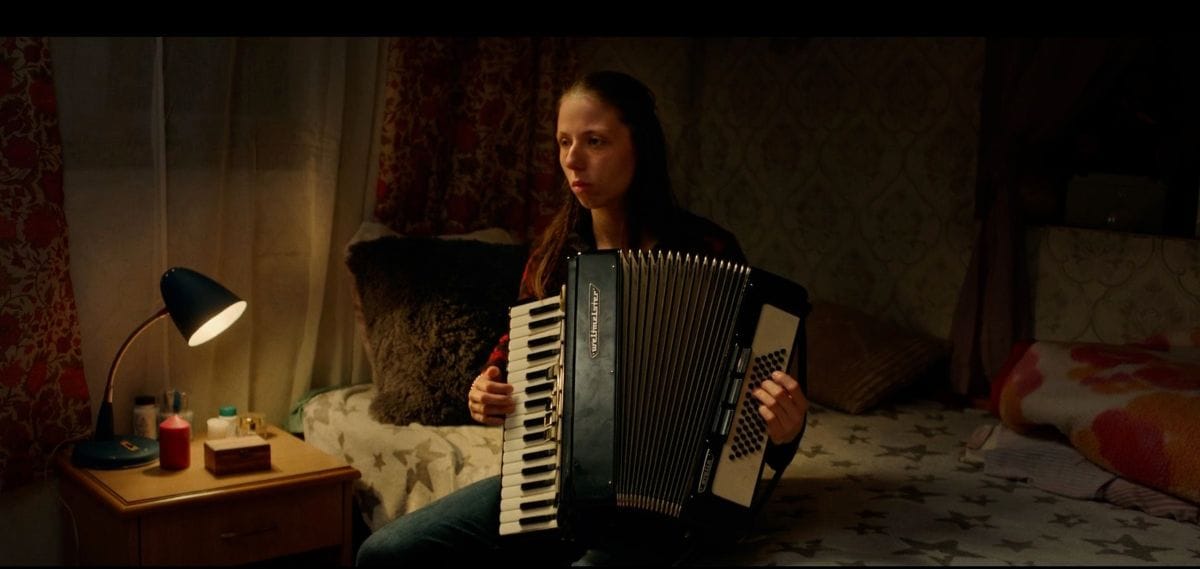
Валерия Върбанова (дъщерята), Таня Шахова (майката) и Вяра Коларова (сестрата) са триото, което трябва да преодолее ситуацията, и изборът на Симеонов на типажи с различна гъвкавост и ритъм е много подходящ: топлота, инат и твърдост влизат в интересни сблъсъци. „Дано да е момиче“ е освежаващо неочаквана фраза от екрана, нищо че като цяло диалозите са най-бледата част от цялото… „Обувките на баща ми“ понякога оставя едно усещане за тук могат, но невинаги смеят, но то като цяло не препъва удоволствието от нетипичната за новото българско кино нежност в повествованието, от умението на оператора Веселин Христов, съобразителността на композитора Милен Апостолов и много още.
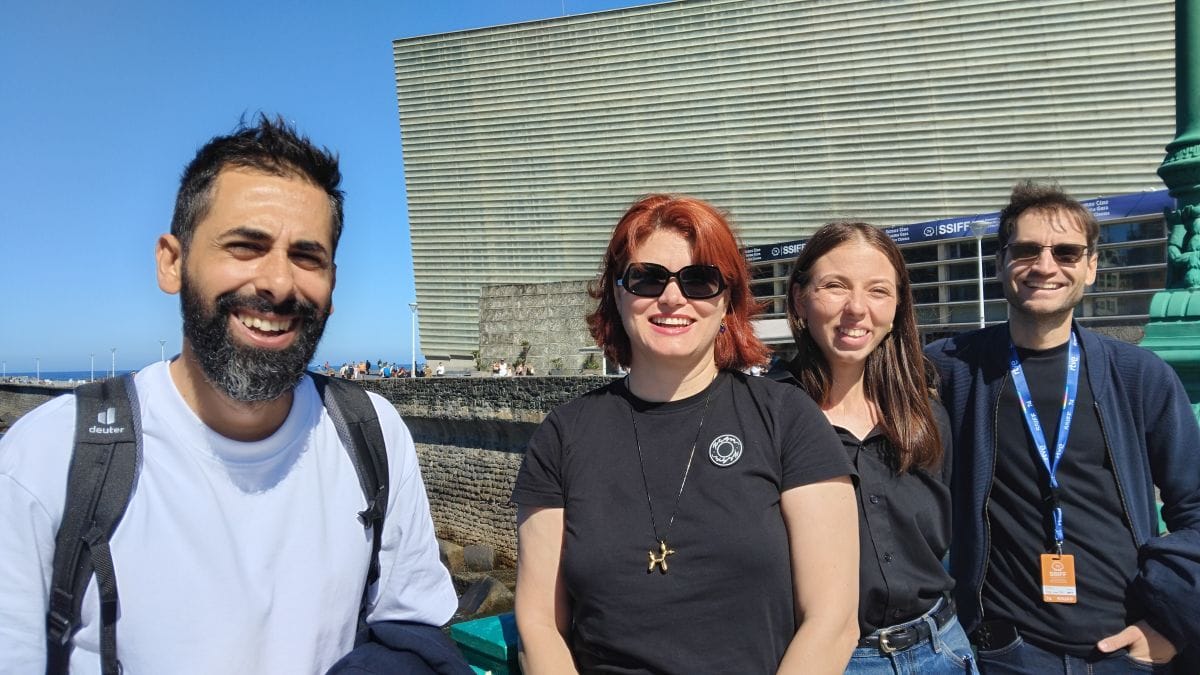
В Сан Себастиан авторът Христо Симеонов беше така любезен да ни отговори на няколко бързи въпроса.
Как решихте да се занимавате с кино и как избирате какво да разказвате?
Покрай филмите на Кен Лоуч, и то след гимназията. Реших, че трябва да правя силно социално кино. Семейството ми е от работническата класа и идеята за изкуство и за професията на режисьора за мен беше твърде абстрактна. Та в киното се впуснах наивно. Сестра ми, бог да я прости, ме окуражи – на нея го дължа. Защото за майка ми и баща ми мисълта, че киното може да се учи и от него да се изкарва прехрана, беше чужда… Първото, което тръгнах да разказвам и от което се вълнувах, беше свързано с неща от детството. Това се промени с времето и в един момент, като изгубих желание да говоря за него, сякаш изчезна и желанието ми за социалната форма. Сега ми се разказва за семейството ми, за формиращи и травмиращи неща, с които човек трябва да се справя. Замислям един проект, свързан с баба ми Васила, много добра жена, ужасно търпелива. Тя и дядо ми са в основата. В него ще се разказва за влашките роми, които бяха много по нашия край. И тъй като не мога да си представя, че ще го снимам на български, реших, че трябва да е на езика, който говорят копанарите в България, за да бъде автентично за мен поне – да взема роми, които много често живеят в катуни извън селата.
Какво според вас е нужно на един филм, за да бъде разбран?
Аз лично, ако усетя, че не съм докрай честен със себе си, знам, че това ще бъде пречка за зрителя. Но кой зрител? Не можем да слагаме под общ знаменател всичките. Така че аз си избирам по-критичния. И се питам: окей, той ще разбере ли тук компромиса? Ще усети ли, че съм фейкнал?
Как дойде идеята за „Обувките на баща ми“?
По истински случай, който ми разказа една дознателка от Видин. Куриозна ситуация, която в реалността, за разлика от филма, завършва неоптимистично. Първата ми идея беше за късометражка, но вече не ми се правят късометражки. Трябваше ми доста време да разбера, да усетя какво всъщност искам от тази история. Отначало имахме вариант, който се развива през погледа на дознателя и завършва без надежда за героите. И той като текст беше супер. Но чак в последния вариант на сценария, примерно месец или два преди да започнем да снимаме, си дадох сметка, че за мен е много важно да се погрижа за тях и да не ги третирам просто като част от сюжета. В моето семейство се случи нещо, което много ме разтърси, и то ми даде емоционалното разбиране за героите – какъв ключ да търся извън анекдота. И тогава всичко се обърна и героите станаха главни. Извън абсурда дойде и този слой, но за целта вероятно е трябвало първо да получа някакво лично знание.
Кога сте най-щастлив, докато правите кино?
Снимачният период е най-пълнокръвен за мен. Работата на терен. Да пробваме неща с актьорите, с оператора, да експериментираме, да импровизираме. Да виждам как се случват нещата, да хвърля сценария в кофата.
От кое сте най-удовлетворен след прожекцията на „Обувките на баща ми“ в Сан Себастиан?
Колкото и критично да го гледам, аз все още се вълнувам от него. Има моменти, които ме оставят безразличен и си казвам: лошо. Те са просто регистрирани и то се усеща. Но има и такива, в които усещам искреност и че нещата са станали, че са живи. Конкретни сцени, където всичко е пълнокръвно и меко, носи настроение. Меко. Това винаги ми е било целта. Да намеря баланса, при който да не се натрапвам на зрителя, но и да не го оставям безразличен. В някои сцени се е получило много добре, в други – не.
1 Превод на „Черен камък“ на български е на разположение на читателите на „Тоест“ в сайта на Нева Мичева.
Лесно е да показваш патриотизъм, който не изисква особена политическа смелост, тъй като е свързан с миналото. Трудно е да отстояваш българското национално достойнство в настоящето, когато това означава да назовеш агресор и да заемеш позиция, която струва повече от всички патриотични речи.
Само за четири дни българските управляващи се придвижиха от единия полюс до другия. Демонстрираха смелост пред историята с пренасянето на тленните останки на цар Самуил в днешна България и се свиха смълчани и предпазливи пред заплахата, ударила два кораба в изключителната икономическа зона в Черно море. Бившият президент Румен Радев, овладял изпълнителната власт със своята „Прогресивна България“, наложи комбинацията от патриотична реторика и снишаване пред Русия още в първите месеци на управлението си.
Самуил е мъртъв повече от хилядолетие, но властта е готова да защитава неговите царски достойнства и да се перчи пред Скопие. Съпротивата му срещу една империя е повод за национална гордост днес, но днешната заплаха от друга имперска сила не среща Самуиловата решителност.
Управляващите, подкрепени от лидера на ГЕРБ Борисов, не назоваха Русия като заплаха за сигурността ни, макар че ЕС и НАТО – съюзите, към които принадлежим, отдавна я определиха по този начин. На Консултативния съвет за национална сигурност (КСНС), свикан неохотно от президентката Илияна Йотова, Радев и назначените от него министри и шефове на служби не събраха смелост да посочат извършителя на атаките. Избегнаха го и при взривовете, избухнали преди около месец в склад – собственост на оръжейната фирма ЕМКО и Емилиян Гебрев.
Руският интерес към българската оръжейна индустрия не е новина. Още през 2021 г. българската прокуратура посочи шестима руски граждани, свързани с военното разузнаване ГРУ, като заподозрени за четири взрива в оръжейни складове.
Но през 2026-та КСНС настоя да бъдат събрани доказателства, за да бъде установен извършителят на атаките с дронове срещу двата кораба в Черно море, а премиерът увери, че няма непосредствена заплаха за националната сигурност. Допусна, че логиката сочи Русия, но без доказателства не може да я обвини. Така България остана без отговор кой е атакувал корабите, но с уверението, че няма от какво непосредствено да се страхува.
Когато говорим за национална сигурност, ние не можем да работим с хипотези,
заяви Радев. И е прав, че за установяването на извършителя на конкретно нападение са необходими доказателства.
Украинският президент Володимир Зеленски обаче заяви още на 6 октомври, че украинските военноморски сили са се свързали с българските си колеги и след уточняване на информацията е установено, че става въпрос за комбинирана руска атака с морски и въздушни дронове.
Радев отрече такава комуникация, позовавайки се на докладите на министъра на отбраната и службите пред КСНС. Ден по-късно обаче външната ни министърка Велислава Петрова-Чамова заяви, че българските служби поддържат постоянен контакт с украинските си колеги, но няма потвърждение от българска страна за руска атака.
Така остава неизяснено не само кой е изпратил дроновете, но и каква информация е обменена между София и Киев. И защо при толкова категорично твърдение на Зеленски българските власти не са изяснили публично противоречието.
Но едно е да не си сигурен кой е изпратил дроновете, друго е да избягваш оценката за държавата, която води война в Черно море и чиито действия застрашават сигурността на региона. За първото е нужно разследване, но за второто България разполага с достатъчно факти, както и с оценките на съюзниците си.
Вместо да постави пред Москва въпроса за рисковете, които руската война създава за гражданското корабоплаване, и да използва наличните дипломатически инструменти, КСНС поиска от ЕС и НАТО засилване на мерките за сигурност в Черно море.
По предложение на Радев Европейската агенция по морска безопасност (EMSA) е изразила готовност безвъзмездно да изследва останките на потъналия кораб за следи от дронове.
Но същността на онова, което Йотова огласи след заседанието на КСНС, беше призивът за дипломатически усилия за прекратяване на войната в Украйна и за постигане на мир. Призивът за мир обаче не казва кой e започнал агресията и кой трябва да я прекрати. Така Русия и Украйна се оказват поставени на една плоскост, което се прави не за първи път, а въпросът за отговорността се заменя с пожелание за прекратяване на военните действия.
Избирателният суверенитет
Националното достойнство има различна цена според това срещу кого трябва да бъде отстоявано. Пред Скопие България говори от позицията на историческата правота, пред Москва предпочита дипломацията на васал и оставя на съюзниците да назовават заплахите.
Атаките край България и Румъния ще бъдат обсъдени на Европейския съвет на 15 и 16 октомври като част от ескалацията на руските хибридни действия. Това потвърждава говорител на Европейския съвет пред Клуб Z.
Властта мобилизира армията, Православната църква и институциите, за да посрещне с невиждани държавни почести останките на средновековен цар – символ на българската държавност. Самуил, воювал почти непрекъснато с Византия, беше представен като образец на държавническа доблест и съпротива срещу чуждото господство. Двойки изтребители МиГ-29 и F-16 ескортираха военнотранспортния „Спартан“ с останките му, прозвучаха 21 артилерийски салюта, а премиерът Радев говори за национално единство.
Днес ние посрещаме неговия дух, неговата непримиримост, неговата безпределна вяра в Отечеството и завета му да пазим България.
На площад „Княз Александър I“ на 3 октомври обаче посрещачите бяха значително по-малко от 25-те хиляди, дошли заради DARA. Въпреки осигуреното от БДЖ безплатно пътуване до София церемонията не предизвика очакваното масово въодушевление. Държавата беше вложила повече усилия в организирането на патриотичния спектакъл, но сякаш гражданите не показаха реципрочно желание да участват в него.
Няколко дни след тържественото посрещане на останките на Самуил България се оказа изправена пред съвсем различен тест за държавност. Сирия поиска обяснение защо е прекратено издирването на моряците, девет от които са сирийски граждани, от потъналия за три минути ALFA WATAN. България вече обяви, че то няма да бъде подновено, нито ще бъде извършен подводен оглед на останките. Последното означава, че ще се разчита на ΕΜSA да търси следи от дронове. Но Дамаск настоява за независимо разследване и изясняване на обстоятелствата около прекратената спасителна операция.
Турският президент Реджеп Тайип Ердоган постави въпроса за сигурността на гражданското корабоплаване в Черно море директно пред Владимир Путин. Анкара поддържа отношения и с Москва, и с Киев, но това не ѝ пречи да разговаря с руския президент за рисковете от войната.
Атаките срещу търговски кораби застрашават износа на Украйна, оскъпяват транспорта и застраховките и създават рискове за пристанищата и търговията на черноморските държави, особено на Турция, която контролира достъпа до Черно море през Босфора и Дарданелите.
Суверенитетът обаче не е само правото да вземаш самостоятелни решения, а и способността да ги отстояваш пред по-силните от теб. Той не се измерва с непрекъснатите уверения на Радев и подчинените му, че България води „независима външна политика“, когато в действителност следва линията на Москва, прикривайки я зад апели за мир и дипломатическо уреждане на конфликта.
Всъщност дори не я прикрива особено.
През 2022 г. България изгони 70 руски дипломатически служители, след като службите ги идентифицираха като работили срещу националните ѝ интереси. Решението предизвика остра реакция от Москва, но показа, че София разполага с дипломатически инструменти, когато реши да ги ползва.
В представите на Радев независимата външна политика се проявява най-вече като право да не се съгласяваш с Брюксел. Спрямо Русия обаче тази независимост омеква.
Получава се особен вид суверенитет. България държи да не ѝ диктуват от Брюксел, но си налага ограничения, когато трябва да възрази на Москва. И колкото по-често властта говори за независимост, толкова по-видима става границата, отвъд която не смее да я упражни.
Tomáš Šedovič is a program manager at the Rust Foundation. He co-leads the
goals team, which helps
organize the Rust project’s
overall goals, including making sure that the people
who have agreed to work on one have the support they need.
At Kangrejos 2026, he provided an overview of the Rust project’s goal processes
aimed at ensuring that the Rust for Linux developers were aware of how the
project organizes, tracks, and amends goals.
The
Rust for Linux project
has inspired several current project goals, so he thought that getting an inside
view of the process might be helpful.
The kernel’s swap layer has undergone some
significant changes over the course of the last year and a number of
longstanding problems have been addressed. One problem that has not
yet been solved in the mainline is the direct tie between slots in the swap
cache and space in persistent swap files, which can cause highly
inefficient resource use. There are two competing solutions for this
problem, neither of which has, as yet, reached readiness for merging; a
lengthy discussion on possible paths forward shows ongoing disagreement
over the best path forward.
The new Xsight Labs E1L DPU brings lower core counts (8-22 Arm Neoverse N2 cores), plenty of PCIe Gen5 and 200Gbps networking into a lower power form factor
Radar provides a real-time view into global Internet trends, powered by Cloudflare’s global network. We support Cloudflare’s mission to help build a better Internet by making web data visible, clear, and actionable for everyone. Since launching in 2020, Radar has found a natural audience amongst expert users with technical backgrounds, such as network operators and academic researchers who rely on Radar data to observe industry trends and global events.
But Radar also has the potential to be a more regular, self-serve resource for journalists, human rights advocates and policymakers, and everyday users. Making Radar accessible to a wider audience is a core part of our vision, so we knew it was time to reevaluate the user experience: How could we make Radar more approachable to broader audiences, while preserving the depth and rigor that we currently have?
In this blog post, we’ll introduce the redesigned Radar, share our design process, and outline our broader vision for the platform’s future.
Challenges with the previous design
While the previous landing page was successful at showing the breadth of Radar’s data, the way that information was presented made it difficult to parse. The bento box layout gave everything similar visual weight, the vertical cards disrupted natural reading patterns, and the styling felt disconnected from Cloudflare’s broader brand.
We heard this from users. One external user mentioned that one of his biggest frustrations with Radar was that it was difficult to show to his students. That feedback reinforced the problem that Radar could feel intimidating to people encountering it for the first time. With this in mind, we wanted to create a landing page experience that shaped a clearer path through the content, instead of asking users to interpret everything at once.
But making Radar more accessible wasn’t only about reorganizing the content. It was also about making the experience feel more connected to Cloudflare. For external users, consistency directly affects trust and usability. A more cohesive Cloudflare experience helps signal that Radar is an authoritative source, while familiar layout patterns reduce the effort required to move through complex information.
Introducing Radar’s new landing page
The new and improved Radar uses a visual reference that users of all backgrounds will have a familiarity with — a map. Even though in many ways the Internet operates outside the concept of national borders, its relevance to everyday life is often best understood through geography.
The top section focuses on traffic and outages. We lead with outages as they are one of the most concrete, timely, and salient data points about the state of the Internet. Traffic, meanwhile, communicates the scale and breadth of Radar’s data. The map also acts as a navigation point into the insights below, guiding users from the global view into specific countries, trends, and data stories.
Below the map, we turned the old bento box chart widgets into a tabbed flow that helps users move through the data more deliberately. The tabs provide summary statistics to give the user a sense of Radar’s capabilities, while also giving them a call to action to explore the data in depth. The tabbed structure creates a clearer hierarchy, keeps the page from feeling overwhelming, and previews the range of information Radar provides.
From concept to reality
Developing Radar’s design language
To develop Radar’s design language, we looked across Cloudflare’s content ecosystem, which exist in these three pillars:
Marketing pages (like cloudflare.com)
Content experiences, like the Cloudflare Blog and Developer Docs
Product experiences
Where does Radar fit?
Ultimately, we decided that Radar sits at the intersection of all three. At its core, Radar is a data product, but it’s also public-facing and inherently content-rich. The strategy blends design aspects of all three: approachable like marketing, structured and navigable like content, and maintainable by migrating to Kumo components used by Cloudflare’s product system.
What we tried along the way
From the outset, we knew the landing needed to communicate Radar’s global perspective. Because Radar helps people understand Internet activity across countries and regions, a map felt like the clearest way to make that scope immediately visible.
The map went through many rounds of iteration as we tried to strike the right balance between data richness and approachability. Early versions were too dense — we were trying to convey credibility through data-heavy visuals. Later versions moved too far toward marketing-style visuals; they felt more approachable, but risked making Radar’s fresh data feel static or overly summarized. The current direction sits between those two poles: it has the feel of live data, but it’s easier to read.
The Radar vision and evolution
Because Cloudflare sits in front of roughly 20% of all web traffic, Radar has the opportunity to tell unique and compelling stories about the Internet. To unlock that value, we want to empower every user with real-time insights across security, performance, and traffic.
This redesign is a foundational step in that direction. Moving forward, Radar will continue to focus on tools, visualizations, and storytelling frameworks that remove friction for new audiences while doubling down on our deep data infrastructure. By pairing our technical rigor with a cleaner, human-centered experience, we are ensuring that more people can explore, understand, and share the state of the Internet.
Help us make Radar better
This redesign is our first step toward a more intuitive, scannable Radar. But we're just getting started, and we need your input. What’s working? What isn’t? What insights are still hard to uncover?
To provide the best experiences, we use technologies like cookies to store and/or access device information. Consenting to these technologies will allow us to process data such as browsing behavior or unique IDs on this site. Not consenting or withdrawing consent, may adversely affect certain features and functions.
Functional
Always active
The technical storage or access is strictly necessary for the legitimate purpose of enabling the use of a specific service explicitly requested by the subscriber or user, or for the sole purpose of carrying out the transmission of a communication over an electronic communications network.
Preferences
The technical storage or access is necessary for the legitimate purpose of storing preferences that are not requested by the subscriber or user.
Statistics
The technical storage or access that is used exclusively for statistical purposes.The technical storage or access that is used exclusively for anonymous statistical purposes. Without a subpoena, voluntary compliance on the part of your Internet Service Provider, or additional records from a third party, information stored or retrieved for this purpose alone cannot usually be used to identify you.
Marketing
The technical storage or access is required to create user profiles to send advertising, or to track the user on a website or across several websites for similar marketing purposes.