Post Syndicated from Емилия Милчева original https://www.toest.bg/oshte-edna-tuhla-v-stenata/
Защо този човек не ни пусна?
Петгодишният Елиас задава въпроса на майка си, след като двамата са спрени още на входа на басейн в Луковит. Обяснението е, че местата са запълнени, но докато стоят отвън, други хора продължават да влизат и излизат. Майката Ирена е убедена, че причината е ромският им произход и по-тъмната кожа. По-късно пред друг басейн детето се разплаква от страх, че отново няма да бъде допуснато. Ирена подава жалба до Комисията за защита от дискриминация, а организацията Romalo, разказала за случая, не получава отговор от собствениците на басейна.
Елиас вече е научил един от първите уроци на сегрегацията – че има места, до които може да не бъде допуснат заради това как изглежда. Децата от другата страна на входа също научават, че разделянето на хората по етнически признак е нещо обичайно, което не изисква нито обяснение, нито възражение. Така предразсъдъците се възпроизвеждат по-лесно.
Същият механизъм действа и в образованието. Когато ромските и българските деца растат и учат отделно, едните губят достъп до по-добра езикова и образователна среда, а другите – възможността да познават свои връстници извън наследените стереотипи.
Именно в училище започват да се натрупват последиците от това разделение. Те не се изчерпват с различните сгради или квартали. Сегрегацията влияе върху езиковото развитие на децата, върху очакванията от тях, върху качеството на преподаването и в крайна сметка – върху шансовете им за образование и професионална и житейска реализация. Това са процеси, които се наслагват и трудно могат да бъдат преодолени по-късно.
Разговорът с експерта Огнян Исаев от „Тръст за социална алтернатива“ очертава четири от най-важните препятствия пред децата в сегрегираните училища: езиковата бариера, ниските очаквания от учениците, неподготвеността на системата да работи в многоезична среда и липсата на последователна държавна политика за десегрегация.
Българският език – първата бариера
Първата бариера често се оказва езикът. Много ромски и турски деца тръгват на училище с желанието да учат, но още от първия учебен ден трябва същевременно да усвояват нов език, защото българският не им е майчин, и нови знания чрез него. Ако тази разлика не бъде преодоляна навреме, тя започва да се натрупва година след година.
„Езиковата компетентност има няколко измерения – казва Огнян Исаев. – Първото е чисто комуникативното: да можеш да си поръчаш вода, кафе, да попиташ къде е тоалетната… След това идва функционалното ниво – да владееш езика дотолкова, че да учиш чрез него, да разбираш понятията. И чак накрая – да можеш да възпроизвеждаш знания чрез езика.“
Тоест не става дума само да говориш български, а да можеш да мислиш, да разбираш и да учиш чрез него. Детето може спокойно да разговаря с приятелите си на български, но да не разбира условието на задачата по математика или текста в учебника по природни науки. Така то започва да изостава не защото няма способности, а защото още не владее добре езика, на който се преподава.
„До 2020–2021 г. този проблем изобщо не беше в радара на МОН и ние положихме доста усилия, за да влезе“, казва Исаев. Учителите се подготвят да преподават на деца, които вече владеят български език, а не на такива, за които е втори. Когато след войната в Украйна в училищата влязоха хиляди украински деца, проблемът, че системата ни не може да интегрира никого, стана видим. Трудности срещат и децата от български произход, които се завръщат от чужбина.
Според Исаев езиковата подкрепа не може да се изчерпва с часовете по български език. Тя трябва да присъства във всеки предмет, защото всяка нова дума в учебника по история, биология или математика е едновременно езиково и учебно предизвикателство. А когато тази подкрепа липсва, всяка следваща учебна година увеличава изоставането.
Проблем е отношението към майчиния език на детето. Вместо да бъде възприеман като езиков капитал, ромският или турският в повечето случаи се разглеждат като пречка. Ако някой каже „български като втори език“, националисти инструментализират проблема с цел политически дивиденти.
Изследвайки образователния процес на децата от ромски произход в Европа и в България в периода 1945–1990 г., проф. Христо Кючуков пише, че през 50-те и 60-те години на миналия век сегрегираните училища ограмотяват децата на официалните езици на страните, където живеят, и „подпомагат установяване на своеобразна международна ромска интелигенция“. Но той отбелязва и че започват процеси на насилствена асимилация в Европа, а и в България.
За ромските деца няма часове по ромски език като майчин, както това е осигурено за децата от други малцинства. В България до 1972 г. турските и арменските деца са имали право да изучават майчиния си език по 4 часа седмично… Вестниците на ромски език, ромският театър, открит през 50-те години, са закрити през 60-те.
В първите години след демократичните промени обаче Кючуков е поканен в МОН, за да разработи всичко необходимо за въвеждането на ромския език като майчин в българската училищна система. През 1993 г. е публикуван ромски буквар в 100 000 екземпляра. По това време, по данни на проф. Кючуков, общият брой на ромските деца от I до VIII клас в българските училища е бил 123 000 (сега всички деца, родени в България през изминалата година, са повече от два пъти по-малко). Близо 10 000 от тях са изучавали ромски език.
Докато двуезичието обаче се възприема като проблем, а не като ресурс, българското образование ще продължава да губи част от потенциала на децата от етносите.
„Да танцуват и играят – повече не могат“
Езиковите бариери са началото. След тях идва друг, много по-трудно преодолим проблем – ниските очаквания, не само на учителите, но и на самите деца.
Изкарали сме ниски оценки – ами изкарали сме толкова, толкова си можем. Има я и стигмата върху самите учители – това са циганските учители, циганското училище и така нататък. И учителите, и директорите интернализират това, а през тях и децата: „Могат да танцуват и играят, повече не могат.“
Така Огнян Исаев описва нагласата, която често се изгражда у ромските ученици още в началното училище. Те отрано разбират какво се очаква от тях – не да кандидатстват в езикови гимназии, да станат лекари, юристи, инженери, а най-много да покажат талант в песните и танците на училищния празник.
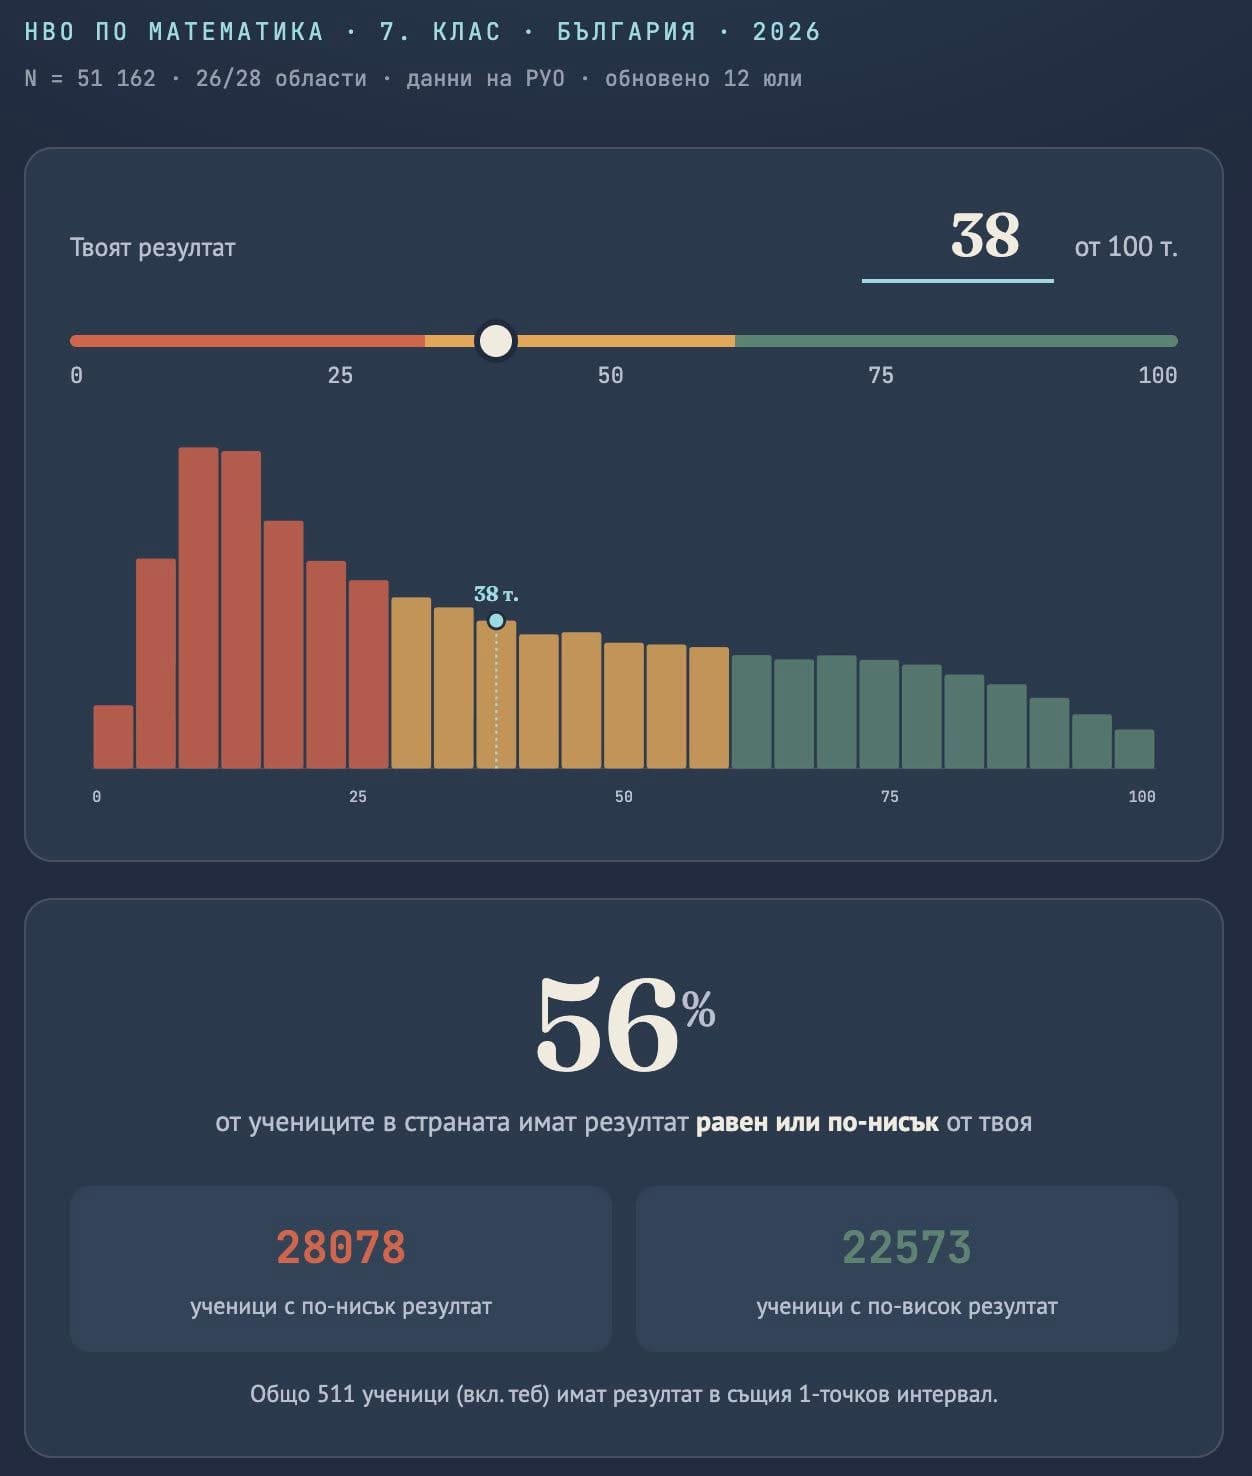
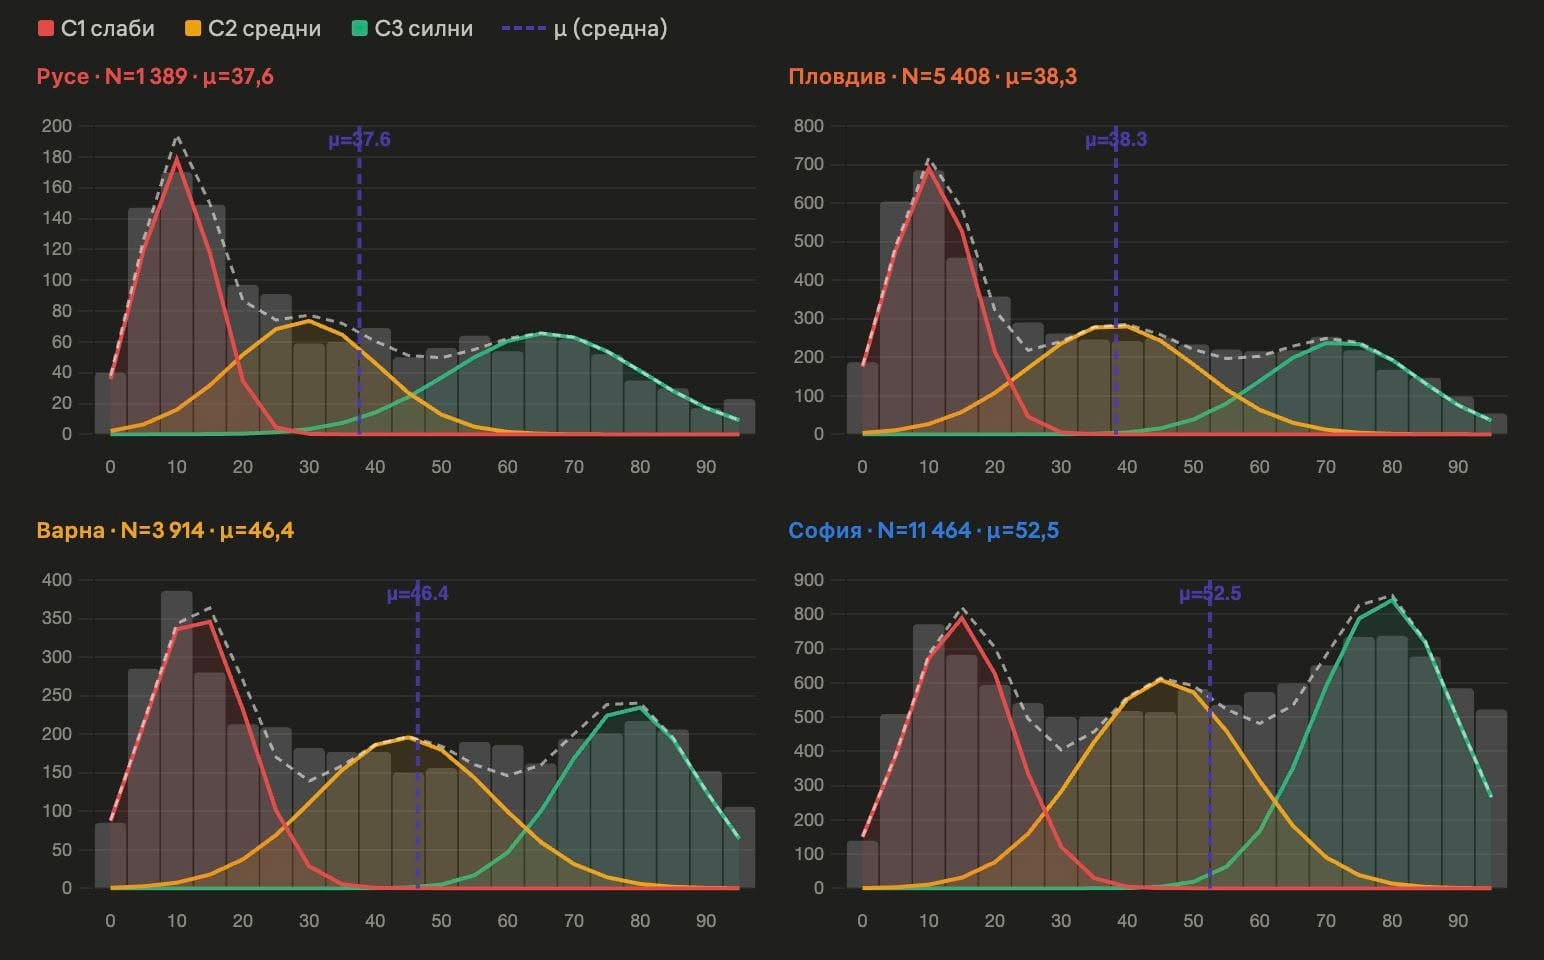
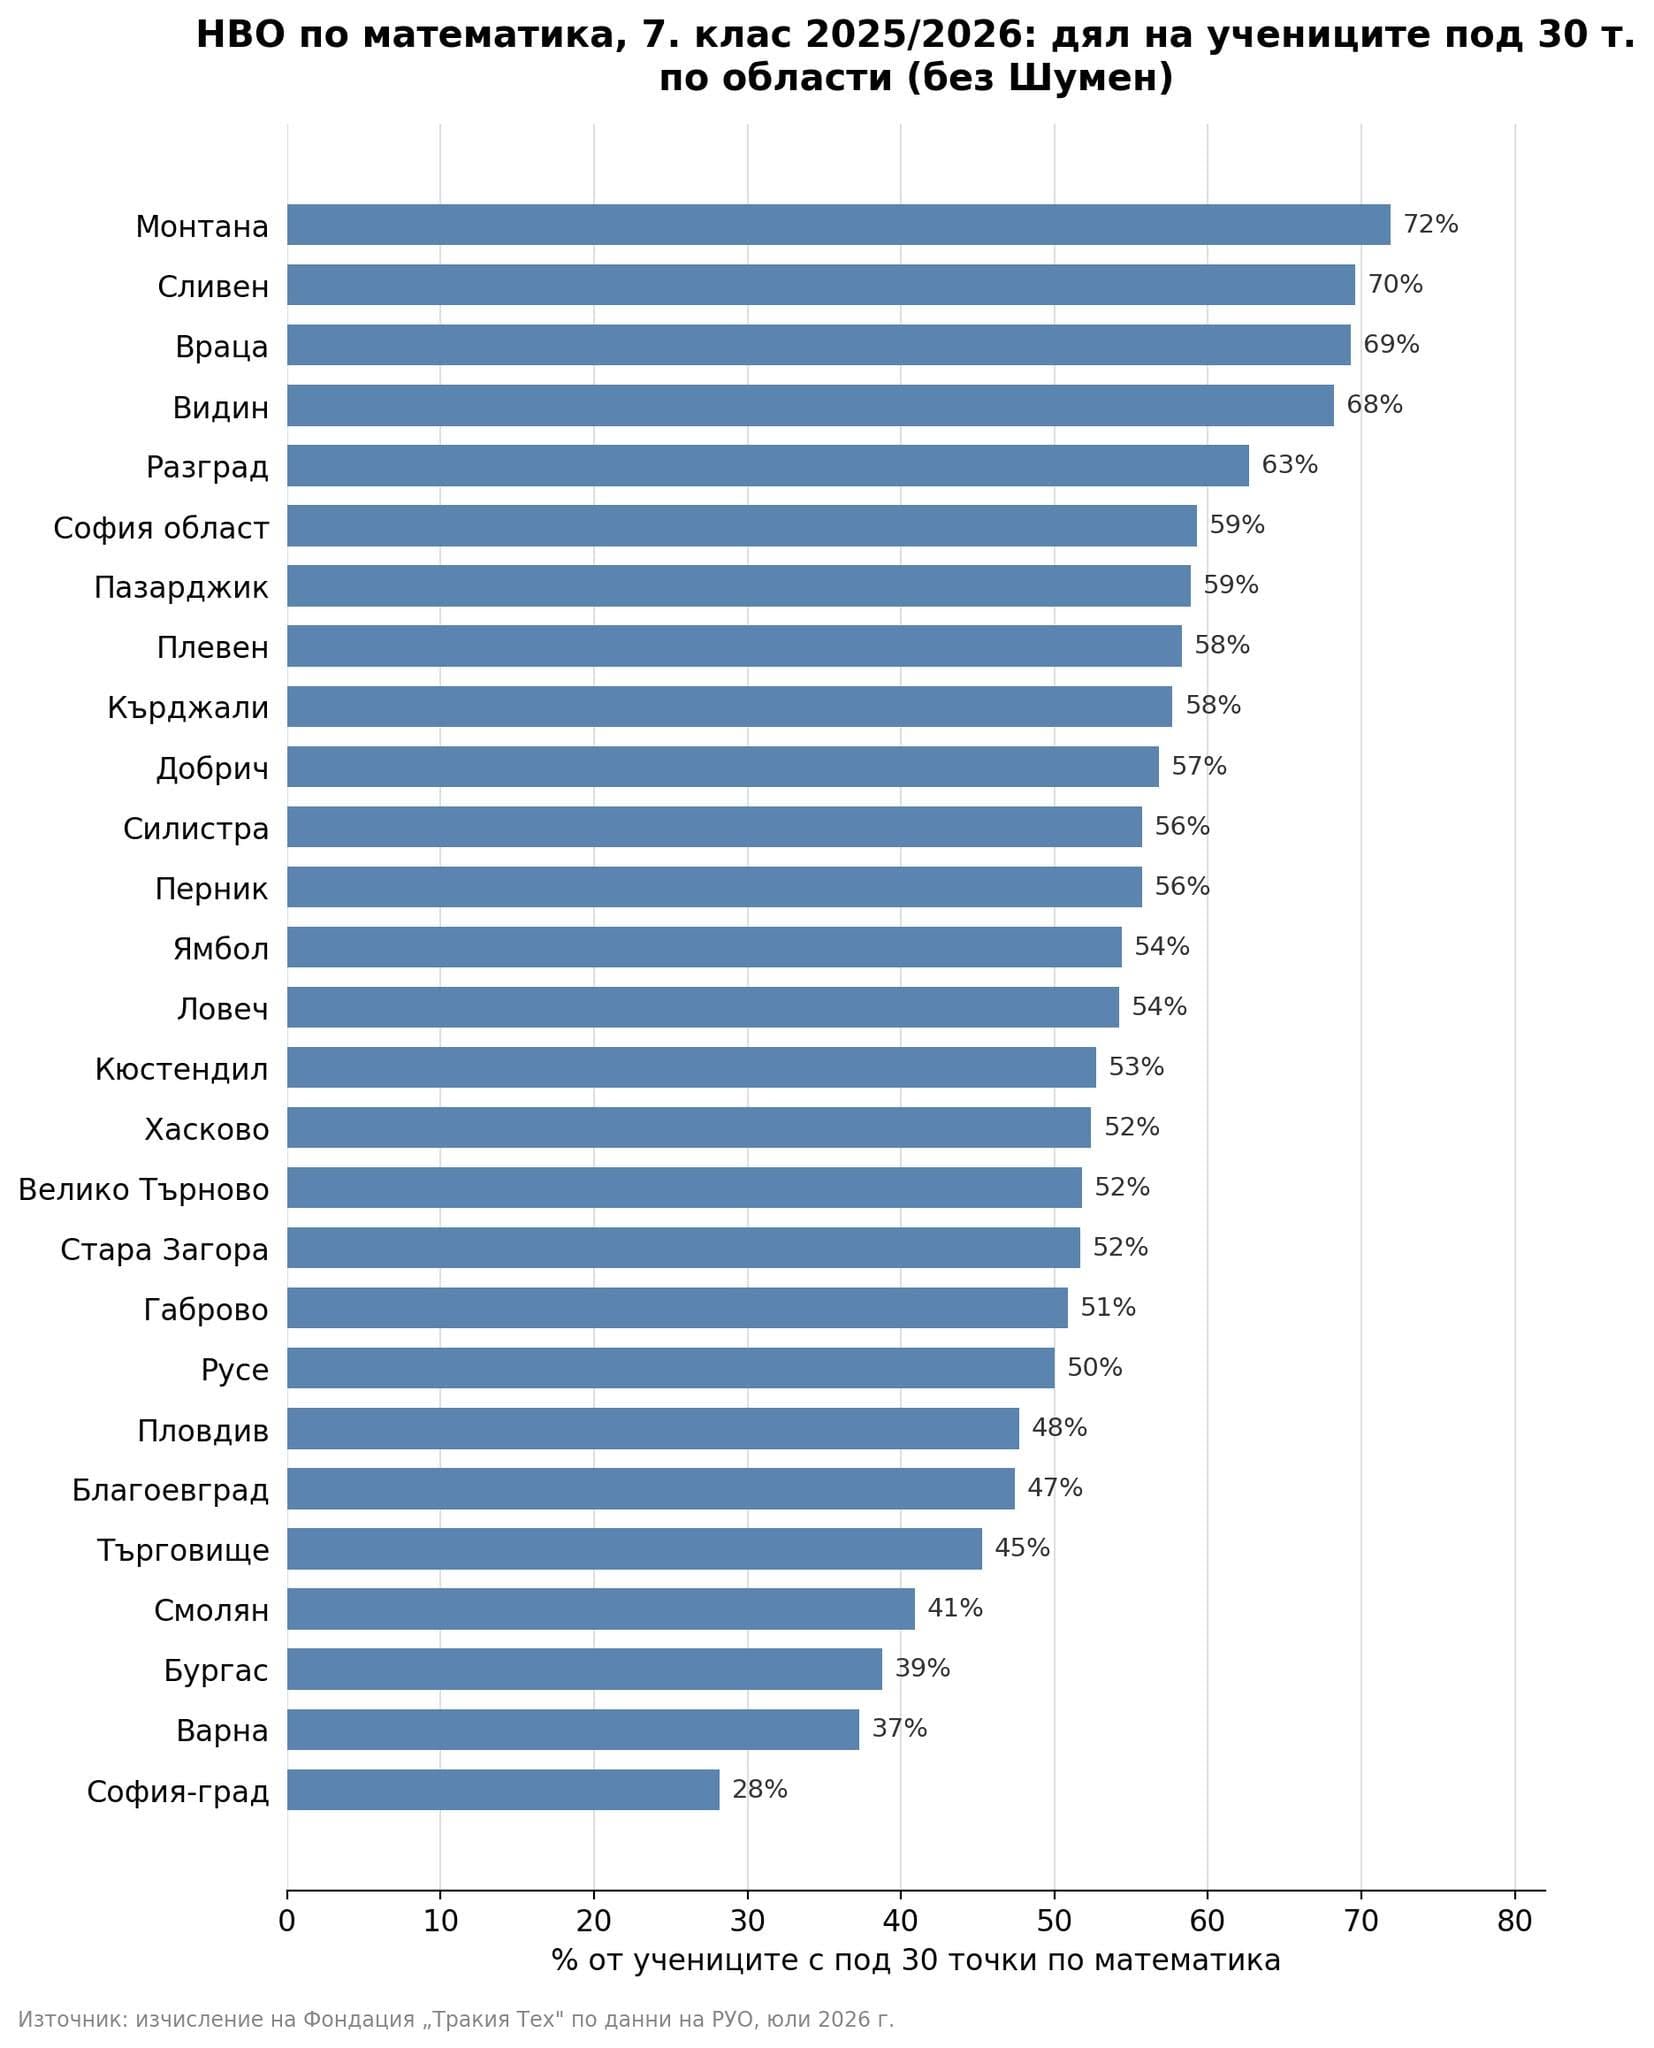
Тези очаквания рядко се изричат директно. Те личат в примирението със слабите резултати от националното външно оценяване (НВО) – последици от сегрегацията.
В училищата, в които учат предимно ромски деца, средният резултат на НВО в VII клас е едва между 9 и 12 точки по математика и между 10 и 15 точки по български език и литература от максимални 100 точки. За сравнение, средните резултати за страната са около 40 точки по математика и около 50 по български език.
Сходна картина показва и международното изследване PISA. Учениците от семейства с по-нисък социално-икономически статус изостават средно с две до три години в знанията и уменията си по математика, природни науки и функционална грамотност спрямо своите връстници.
Според Огнян Исаев обаче тези данни често се тълкуват погрешно. Самото понятие „социално-икономически статус“ не означава само ниски доходи. То включва и фактори като образованието на родителите, езиковата среда у дома и достъпа до културни ресурси. „Децата не изостават заради майчиния си език или заради своя етнос – подчертава той. – Те тръгват на училище с различен социален и културен капитал.“
Този капитал не се измерва само с пари. Той включва книгите вкъщи, разговорите с родителите, това дали детето чува български език всеки ден, дали има човек, който да му помогне с домашните, дали вижда хора като себе си в учебниците и в училищната среда. Именно тези натрупани предимства или липсата им започват да влияят още преди първия учебен ден.
Детето постепенно започва да вижда себе си през очите на възрастните. Ако никой не очаква от него високи резултати, след време и то самото престава да ги очаква.
Според Исаев това е една от най-тежките последици на сегрегацията. Тя не само ограничава достъпа до качествено образование, но и стеснява хоризонта на възможното. Когато около едно дете няма хора с висше образование, лекари, адвокати, инженери или предприемачи, то трудно може да си представи, че самото то би могло да стане такова. Мечтите му не изчезват изведнъж – те просто постепенно се смаляват.
Сегрегацията надживя Прехода
Огнян Исаев разказва, че в Югославия например съхранението и развитието на етническата идентичност е било позволено – издавали са се книги на ромски език, песни, така просперира например известният Шабан Байрамович.
В първите години след демократичните промени обаче има някакво развитие по темата за ромското образование. След 1989 г. известният като Мануш Романов, но роден като Мустафа Алиев основател на Демократичен съюз „Рома“ е избран за депутат във Великото народно събрание и е един от 39-мата, които не подписват новата Конституция. Романов, режисьор и фолклорист, настоява училищата в гетата да бъдат закрити въпреки възраженията на ромите.
„Казвал е, че няма значение, че ромските родители ги искат тези училища; само и само да угодим на ромските родители, не трябва да осакатяваме децата“, обяснява Исаев. По думите му родителите често използват аргументи като „то ни е близо, то ни е в махалата, къде ще ходи сега“, а и някои от тях се страхуват, че детето им ще бъде подложено на тормоз и насилие, ако бъде записано в училище извън махалата.
Те на първо място слагат сигурността на детето, но не виждат, че го лишават от базова възможност да се социализира и да върви напред заедно с връстниците си. Макар че познавам няколко случая на роми, мигрирали в чужбина, защото децата им са били тормозени. Един от тях ми разказа, че в момента в класа на сина му имало деца от различни страни и раси и това никого не впечатлявало,
разказва експертът от „Тръст за социална алтернатива“.
В годините на Прехода първите опити за десегрегация идват не от държавата, а от граждански организации с подкрепата на Фондация „Отворено общество“. Началото е поставено във Видин, където деца от квартал „Нов път“ започват да учат в училища в града, като получават транспорт и допълнителна подкрепа, за да наваксат пропуските си. Моделът по-късно е приложен и в Стара Загора, Пазарджик, Пловдив, Плевен и други градове и доказва, че работи. В навечерието на Десетилетието на ромското включване държавата създава към МОН Център за образователна интеграция на децата и учениците от етническите малцинства, но така и не превръща десегрегацията в последователна национална политика.
Според Огнян Исаев една от причините е, че десегрегацията не е възприета като дългосрочен процес, а постиженията са плод на ентусиазма и усилията на неправителствени организации и активисти. Много от сегрегираните училища са сред най-големите в страната – с по над 1000 ученици и съответно с най-големи бюджети. „Не можеш просто да преместиш 1000 деца в училища в центъра на града“, казва той.
Решението не е само в транспорта, а и в повишаването на качеството на образованието в тези училища, така че те да станат привлекателни и за деца извън квартала.
Готово ли е Просветното министерство да се промени за различните деца, да обучава на емпатия учителите, за да приемат различната култура – или се съпротивлява?
Майчиният език, етносът, мястото, където живееш, не са неща, които децата избират, но въпреки това са наказвани заради тях.
Според Огнян Исаев промяната няма да дойде само с преместването на деца от едно училище в друго. Тя изисква различна подготовка на учителите, повече езикова подкрепа, повече емпатия към различните култури и готовност училището да се променя според нуждите на учениците, а не учениците да бъдат принуждавани да се нагодят към една система, която не ги вижда. Именно с тази идея организацията му е обучила над 1000 учители по програмата „Заедно в пъстър свят!“, разработена след войните в бивша Югославия за работа в мултикултурна среда.
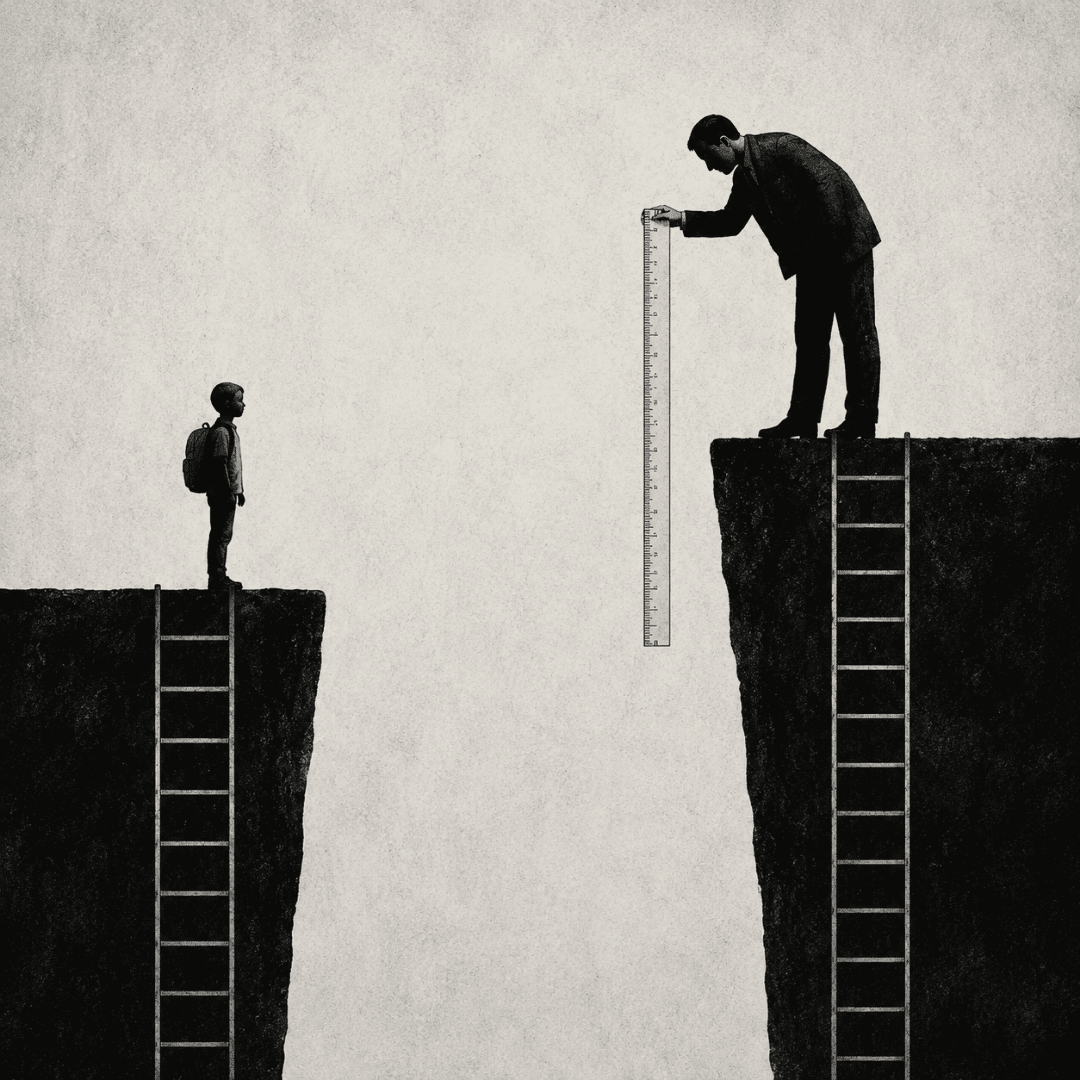
Сегрегацията не започва с отказа на входа на басейна и не свършва с ниските резултати на матурите. Тя започва с очакванията, които обществото има от едно дете, още преди да е прекрачило училищния праг. И ще продължи, докато образователната система приема различието като проблем.
![[Dan Williams in May 2026]](https://lwn.net/images/conf/2026/lsfmm/DanWilliams-sm.png "Dan Williams")