As firewall rule sets grow in complexity, security teams face a common challenge: manual log analysis is used to determine which rules are actively matching traffic and which are consuming capacity without being triggered. This lack of visibility creates operational and compliance gaps. Organizations with governance policies that require removal of dormant rules after a defined period have no mechanism to identify them. Teams responsible for compliance frameworks such as Payment Card Industry (PCI) 4.0 and Digital Operational Resilience Act (DORA) can’t provide evidence that specific controls are actively functioning. Central teams managing firewalls on behalf of multiple business units have no way to determine which rules are unused or need updating.
In this post, you learn how a new AWS Network Firewall capability—rule hit count—addresses these challenges by providing traffic match data for stateful rules across both custom and managed rule groups. With this data, you can identify and remove unused rules, accelerate incident response, and validate security control effectiveness for compliance.
How it works
Rule hit counts track how often each stateful rule matches network traffic. The hit counter increments only when a rule match results in an alert log being created. This means any rule with an alert, drop, or reject action will increment the hit counter, because these actions generate alert logs. However, rules configured with a pass action don’t generate alert logs by default, meaning they won’t appear in the rule hit count metric.
To gain visibility into traffic matching pass rules, you can include the alert keyword within the pass rule. This generates an alert log while still permitting the traffic to its intended destination. The following Suricata rule demonstrates this approach:
pass tls $HOME_NET any -> $EXTERNAL_NET 443 (msg:"Pass and Log HTTPS traffic"; alert; sid:1000001; rev:1;)
This rule passes HTTPS traffic to its destination while also generating an alert log, making sure the rule appears in the hit count metric.
The rule hit count feature adds the following metadata to each alert log. Metadata is included by default and doesn’t require additional configuration:
The alert log data in the preceding example is the source for rule hit count metrics. Network Firewall pushes these alert logs to your Amazon CloudWatch Logs or Amazon Simple Storage Service (Amazon S3). To identify the specific rule that generated an alert, you can search using the combination of the sid (signature ID) and resource_arn fields. The firewall monitoring dashboard uses these fields to generate hit counts for each rule, so you can review rule activity directly on the dashboard without querying logs.
You can also access and analyze this data by querying those logs directly using CloudWatch Logs Insights for logs stored in CloudWatch, or Amazon Athena for logs stored in Amazon S3.
Getting started
Network Firewall rule hit count is enabled by default, so you don’t need to perform any additional configuration to start tracking rule hits on your firewall policies. This means that as soon as you deploy your firewall rules, you can begin to monitor which rules are being triggered, helping you gain visibility into your traffic patterns and identify potential security concerns.
Alert log delivery must be configured: The firewall must have alert logging enabled. Note that rule hit count metadata is captured regardless of log destination; however, the native dashboard feature requires logs to be sent to CloudWatch Logs or Amazon S3.
Firewall monitoring must be enabled: To see the dashboard widget shown in figure 1, you must enable detailed monitoring through the firewall’s logging configuration or the Monitoring tab in the AWS Management Console for AWS Network Firewall. However, if you have a custom dashboard solution, the metadata required for rule hit count analysis is automatically included in the firewall logs regardless of whether detailed monitoring is enabled—so you can build your own visualizations using the log data directly.
Pass rules must include the alert keyword to appear in hit count metrics: Rules configured with a pass action don’t generate alert logs by default. To track pass rule activity in the hit count metric, include the alert keyword in your pass rules, as demonstrated in the How it works section of this post.
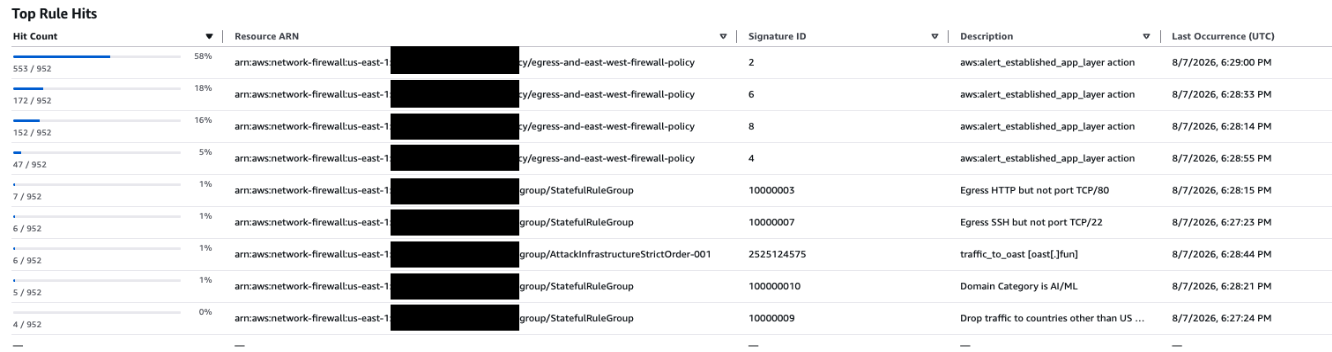
The Top Rule Hits dashboard shows aggregated hit counts per firewall across all Availability Zones within the AWS Region where that firewall is deployed. To view rule hit count metrics, open the Network Firewall console and select your firewall. Navigate to the Monitoring and observability section. Under Topanalysis, you will see the Top Rule Hits metric. Select a lookback period to view rule activity within that timeframe.
Figure 1: Rule hit count from the dashboard
Figure 1 shows the Top Rule Hits panel from the AWS Network Firewall console, displaying the most frequently triggered stateful rules. It includes columns for Hit Count (with bar chart and fraction), percentage of total hits, Resource ARN, Signature ID, Description (the msg field from the Suricata rule), and Last Occurrence (UTC).
Signature IDs 2, 4, 6, and 8 are system-generated signatures corresponding to the firewall policy’s strict order default actions. Because these signatures originate from the policy rather than a rule group, the resource_arn field displays the firewall policy Amazon Resource Name (ARN) instead of a rule group ARN. They appear in the Top Rule Hits when the policy has default actions such as Drop established, Alert established, or their application-layer variants configured. These signatures fire on established connection packets that don’t match any explicit rule, enforcing the policy’s default deny posture.
The following examples demonstrate how rule hit counts help you address common operational challenges.
Identifying unused rules: Figure 1 shows all rule signature IDs and their descriptions (the msg field from the Suricata rule) that actively matched traffic during the selected lookback period. Any rule in your firewall policy whose signature ID doesn’t appear in this metric hasn’t matched any traffic during the specified timeframe. These rules are either stale or not ordered correctly within your rule group.
Accelerating incident response: Figure 1 shows signature ID 2525124575 (traffic_to_oast [oast[.]fun]) with six hits and a last occurrence of August 7, 2026, at 6:28:44 PM UTC. This rule is detecting traffic to an out-of-band application security testing (OAST) domain, which could indicate an attacker attempting to exfiltrate data or validate a vulnerability in your environment. By filtering the top rule hits metric to the timeframe of a suspected incident, your team can quickly identify this type of suspicious activity and scope the impact without manually parsing thousands of log entries.
Validating a newly added rule: Figure 1 shows signature ID 100000010 (Domain Category is AI/ML) with five hits and a last occurrence of August 7, 2026, at 6:28:21 PM UTC. After adding this rule to monitor or restrict traffic to AI/ML related domains, the hit count confirms the rule is actively matching traffic as intended. Similarly, signature ID 100000009 (Drop traffic to countries other than US) shows four hits, validating that the geofencing rule is functioning and blocking outbound connections to destinations outside the United States. These hit counts provide security teams with concrete evidence that newly deployed controls are working.
Pricing
Rule hit counts are included with Network Firewall at no additional cost. However, standard charges apply for storing and querying log data. If you configure log delivery to CloudWatch Logs, CloudWatch pricing applies. If you store logs in Amazon S3 and query them with Athena, standard Amazon S3 storage and Athena query charges apply. For complete pricing details, see AWS Network Firewall pricing.
Considerations
Keep the following in mind when you use rule hit counts:
To manage costs, review your log utilization and configure log filtering or retention policies.
Rule hit counts apply to stateful rules. Stateless rules don’t support hit count tracking at this time.
Rule hit counts are available in all AWS Regions where AWS Network Firewall is supported, except Middle East (UAE) and Middle East (Bahrain).
Conclusion
In this post, you learned how rule hit counts in AWS Network Firewall give you visibility into your firewall rule utilization and effectiveness. By tracking how frequently each rule matches traffic, you can identify unused or redundant rules, optimize rule ordering, validate security controls for compliance, and respond faster during security investigations. For more information, see AWS Network Firewall.
If you have feedback about this post, submit comments in the Comments section below.
OpenAI presented details of its AI’s model’s cyberattack on Hugging Face at Black Hat last week. Simon Willison details the timeline. It’s really interesting to read through—and really impressive cyberoffense work.
OAuth makes delegated access possible. It lets applications act on a user’s behalf without asking them to handle long-lived credentials or hand over a password. That model works well when an application can describe its access needs with a small set of scopes.
Developers use OAuth for SaaS integrations, internal tools, CLIs, and agents. Our permission model has become more granular over time to support better scoping of these different workflows. That is great for security, but it makes a purely all-or-nothing consent screen hard to justify.
Cloudflare OAuth already allows clients to request a subset of their configured scopes. But once the client made that request, the user could not narrow it any further on the consent screen. For the user on the consent screen, the experience was still an all-or-nothing one. If an application requested more access than a user was comfortable granting, their only options were to approve the full request, or deny outright.
MCP servers are a good example of this. An MCP server might request a broad set of permissions, because in theory an agent could use all of them. But most users would not want an agent to have that much access. Before this feature, the only way to handle this was for the app developer to build a custom scope selection screen before sending the user to our consent flow.
Today, we’re introducing OAuth scope customization. Client owners can mark specific scopes as optional when configuring an OAuth client, giving users the ability to grant a narrower subset of an application’s requested access at authorization time.
The OAuth spec already allows authorization servers to grant a narrower set of scopes than what was requested. We built on top of that flexibility to make this work cleanly for every existing app.
More control, without overwhelming users
Our goal with introducing scope selection is to give security conscious users more flexibility to make the right choices for their use case, without turning the consent screen into a long scope checklist.
With scope customization:
Developers can mark specific scopes on an OAuth client as required or optional
At authorization time, users can deselect optional scopes from the requested set
Required and optional scopes are evaluated against the scopes requested for that authorization flow
If no optional scopes are requested, the consent experience stays the same
By default, the consent screen still grants the full requested scope set.
Scoping to the authorization request
One important detail is that required and optional scopes are evaluated only against the scopes requested in a specific authorization flow, not every scope configured on the client. That matters because OAuth clients do not always request their full configured scope set.
For example, a client might be configured with user-details.read, workers-scripts.write, workers-kv-storage.write, and zone.read, while marking workers-kv-storage.write and zone.read as optional. If that client starts an authorization flow requesting all four scopes, the consent screen will evaluate all four. In that case, user-details.read and workers-scripts.write remain required, while the user can choose whether to grant workers-kv-storage.write and zone.read.
But if the client later requests only workers-scripts.write and zone.read, then only those two scopes are considered for that authorization flow. user-details.read and workers-kv-storage.write would not be shown or enforced, because they were not requested.
This keeps the consent screen focused on the task at hand, rather than every capability the application could request. It also means existing OAuth clients keep their current behavior by default: if a client does not opt into optional scopes, the consent flow remains unchanged.
Configuring an OAuth client to use optional scopes
Developers can opt into scope customization when configuring an OAuth client. Scopes continue to be configured as they are today, and clients can now additionally specify which of those scopes are optional:
In the example above, the client can request all four scopes, but the user may only opt out of the workers-kv-storage.write and zone.read scopes during consent. user-details:read and workers-scripts.write remain required if they are included in the authorization request.
If the client later requests only workers-scripts.write and zone.read, then only those two scopes are considered for that authorization flow. user-details.read and workers-kv-storage.write would not be shown or enforced because it was not requested.
Building with partial grants in mind
When a user deselects any optional scopes and completes the authorization flow, the generated access token will only contain the scopes they consented to. For developers, this means you need to check the granted scope set after exchanging the authorization code, rather than assuming the full requested set of scopes was approved.
An app that handles a narrower grant gracefully, for example an agent that operates within whatever subset of permissions it receives, is one that users feel comfortable authorizing. Requesting only the permissions needed and marking the rest as optional is a good sign to users that your app respects their access decisions.
Scopes for every Product
Over the next few weeks, we will be expanding our account & zone-level role surface to cover nearly every Cloudflare product. That means more API token roles, account membership options, and OAuth scopes, giving customers the tools to secure workloads with the right level of access.
Build with Optional Scopes
Allowing developers and users to better restrict access through optional OAuth scopes is an important step toward a more flexible and trustworthy consent experience on Cloudflare. With optional scopes, developers can build more nuanced authorization flows, and users gain more control over what they approve.
To get started with Third Party OAuth, take a look at our documentation or jump straight to the OAuth apps page in the dashboard and create your first OAuth app.
Thank you to our amazing interns
This feature is one of the many that we built with the help of our 1,111 interns. Congratulations to Miller Vargas and José Enrique Rodriguez on your high impact contributions here. Miller is a senior at the University of Texas – Austin studying computer science and math; and José is a senior at Universidad Panamericana studying engineering, data intelligence, and cybersecurity.
Organizations running machine learning (ML), analytics, and generative AI workloads on Amazon SageMaker Unified Studio domains and projects face a common cost governance challenge. System tags (AmazonDataZoneDomainId and AmazonDataZoneProject) are automatically propagated to all underlying project resources. However, custom tags such as CostCenter, Team, or Environment are not propagated to dynamic resources created through the Studio UI. This creates a gap when you need to report project costs grouped by custom tags.
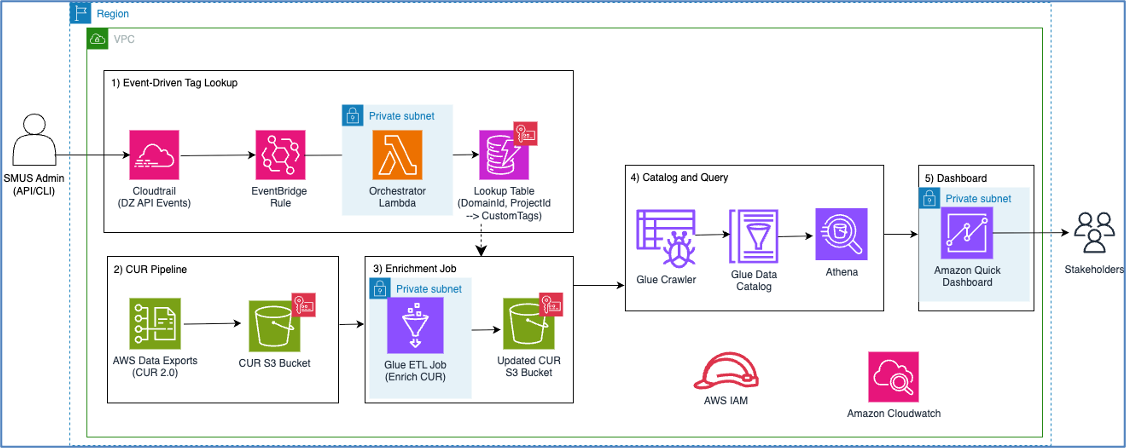
In this post, we walk through a serverless solution that bridges this gap by enriching AWS Cost and Usage Report (CUR) data with custom project tags. By the end of this post, you can build an Amazon Quick Sight dashboard to filter and analyze Amazon SageMaker Unified Studio project costs by any custom tag dimension that you define. This gives your team the visibility to make informed spending decisions.
Solution overview
The solution consists of three automated subsystems:
Event-driven tag lookup management – An Amazon EventBridge rule captures Amazon DataZone project lifecycle events (Create, Update, Delete) and triggers an AWS Lambda function. The function maintains an Amazon DynamoDB lookup table that maps each project’s DomainId and ProjectId to its custom tags.
CUR enrichment pipeline – An AWS Glue extract, transform, and load (ETL) job reads CUR 2.0 Parquet data from Amazon Simple Storage Service (Amazon S3). The job joins each billing line item with the DynamoDB lookup table using the system tags (DomainId, ProjectId), appends the custom tag values as new columns, and writes the enriched data back to Amazon S3.
Cost visualization – An Amazon Quick Sight dashboard backed by a custom SQL dataset over Amazon Athena provides interactive cost and consumption analytics filtered by custom tags.
Architecture
The following diagram shows the end-to-end architecture:
Figure 1: SageMaker Unified Studio project custom tag cost reporting
The workflow is as follows:
An Amazon SageMaker Unified Studio administrator creates or updates a project with custom tags.
AWS CloudTrail captures the API call.
Amazon EventBridge matches the event.
The Lambda orchestrator writes the tag mapping to DynamoDB.
Separately, AWS Data Exports delivers CUR data to Amazon S3.
The AWS Glue ETL job enriches CUR line items with custom tags from DynamoDB.
The AWS Glue Crawler catalogs the enriched data.
Amazon Quick Sight visualizes costs by custom tags.
Prerequisites
Before deploying this solution, you need:
An Amazon SageMaker Unified Studio domain (you create projects after deployment).
AWS Cloud Development Kit (AWS CDK) CLI installed.
Python 3.12+.
Amazon Quick Sight Enterprise edition enabled in your account.
An AWS Identity and Access Management (IAM) user or role with permissions to deploy AWS CloudFormation stacks.
Step 1: Configure custom tags on your project profile
You configure custom tags on project profiles through the Amazon DataZone API. First, enable custom tags on your project profile:
Important: The AmazonSageMakerProvisioning-<domainAccountId> role needs an inline policy that permits your custom tag keys. Without this, project environment deployment fails.
The following is the inline policy that’s used for the custom tags shared in this post:
Note: The solution uses serverless components (Lambda, DynamoDB on-demand, AWS Glue, Amazon Quick Sight), so you only pay for what you use. The primary cost drivers are AWS Glue ETL job execution time and Amazon Quick Sight SPICE storage.
Step 4: Configure CUR delivery
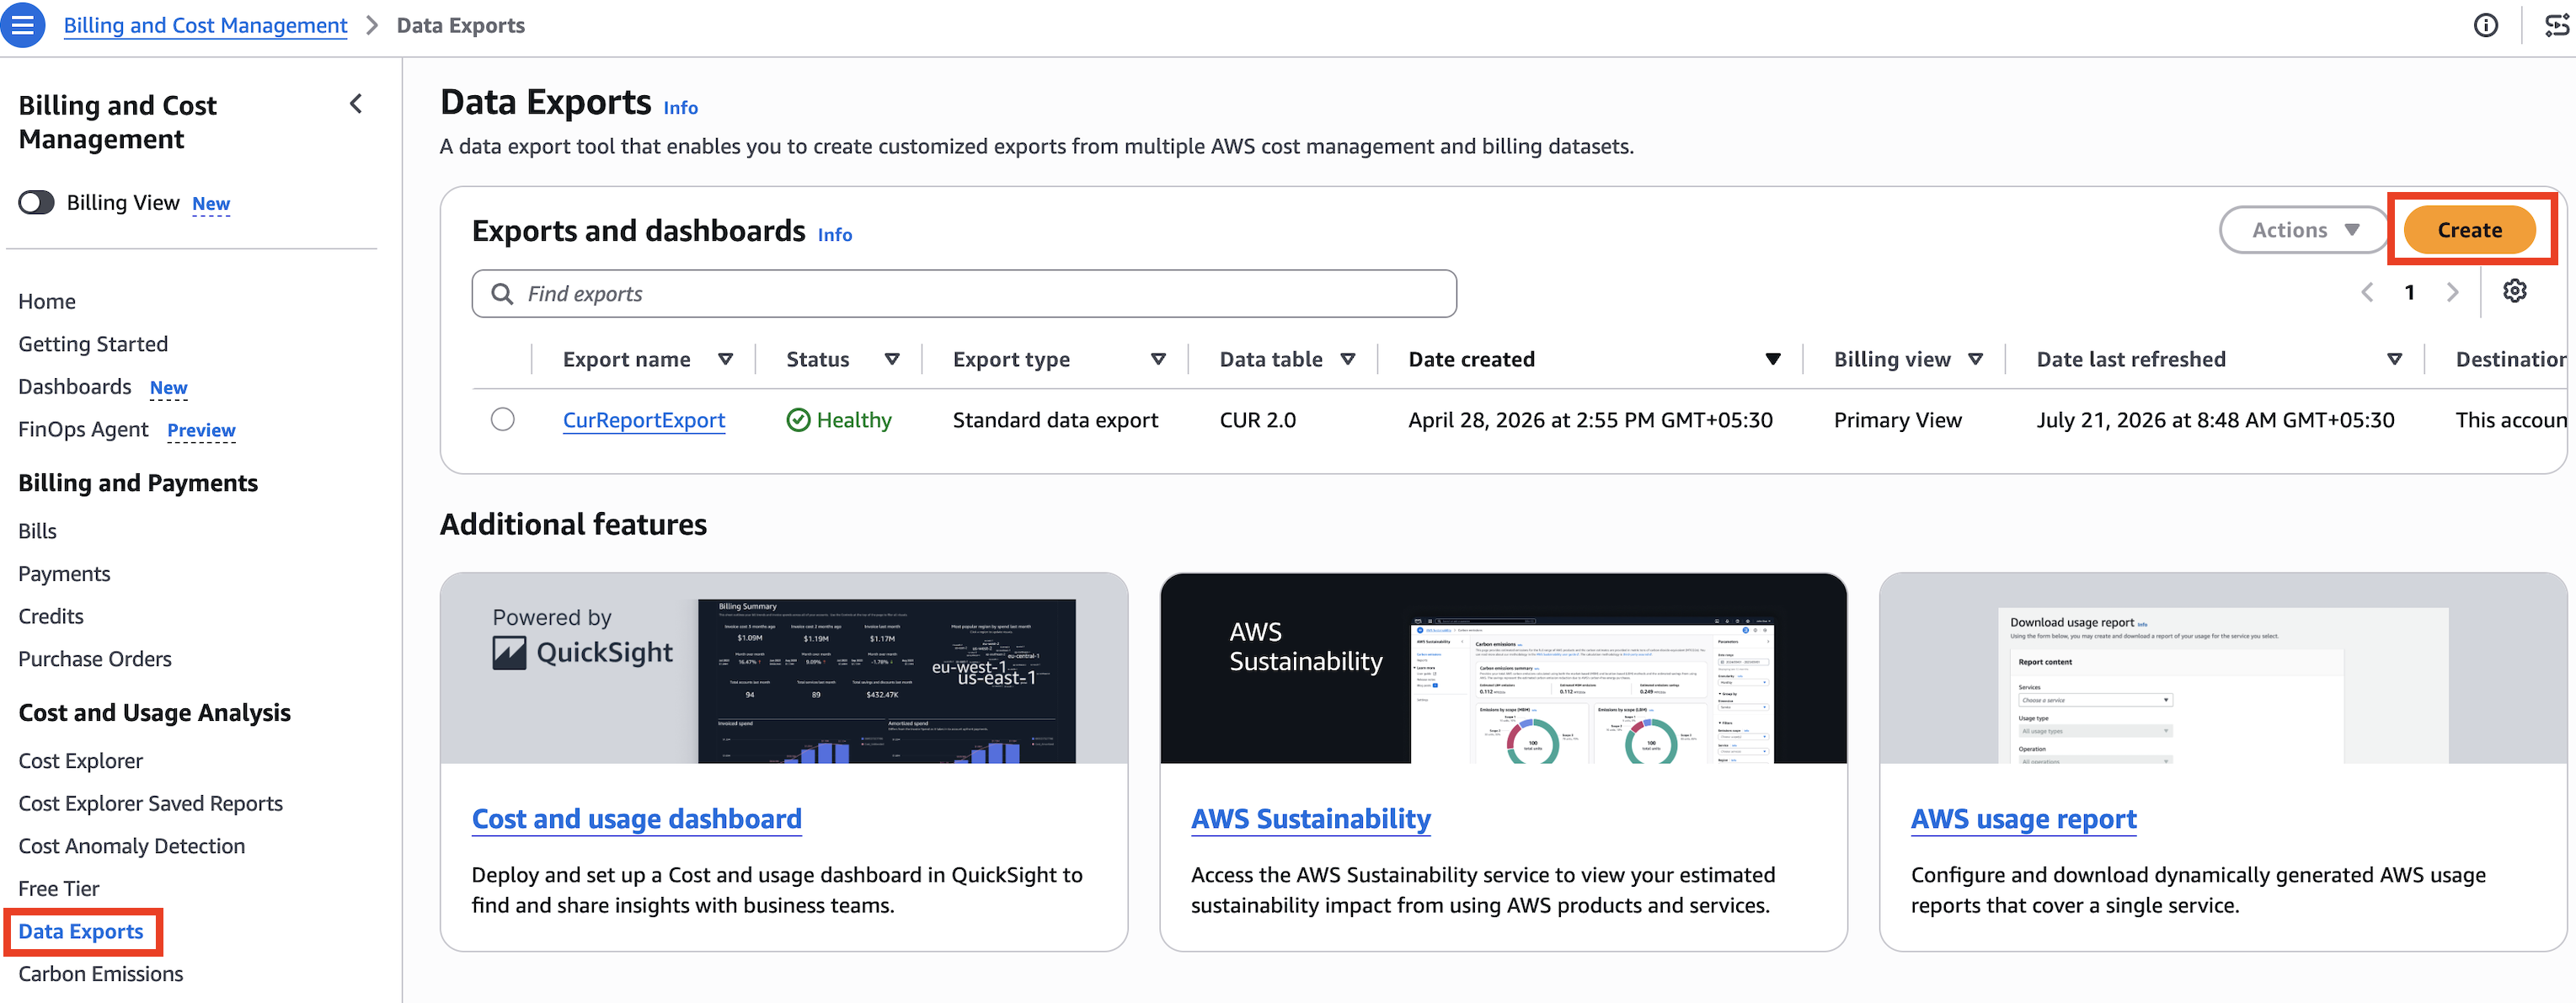
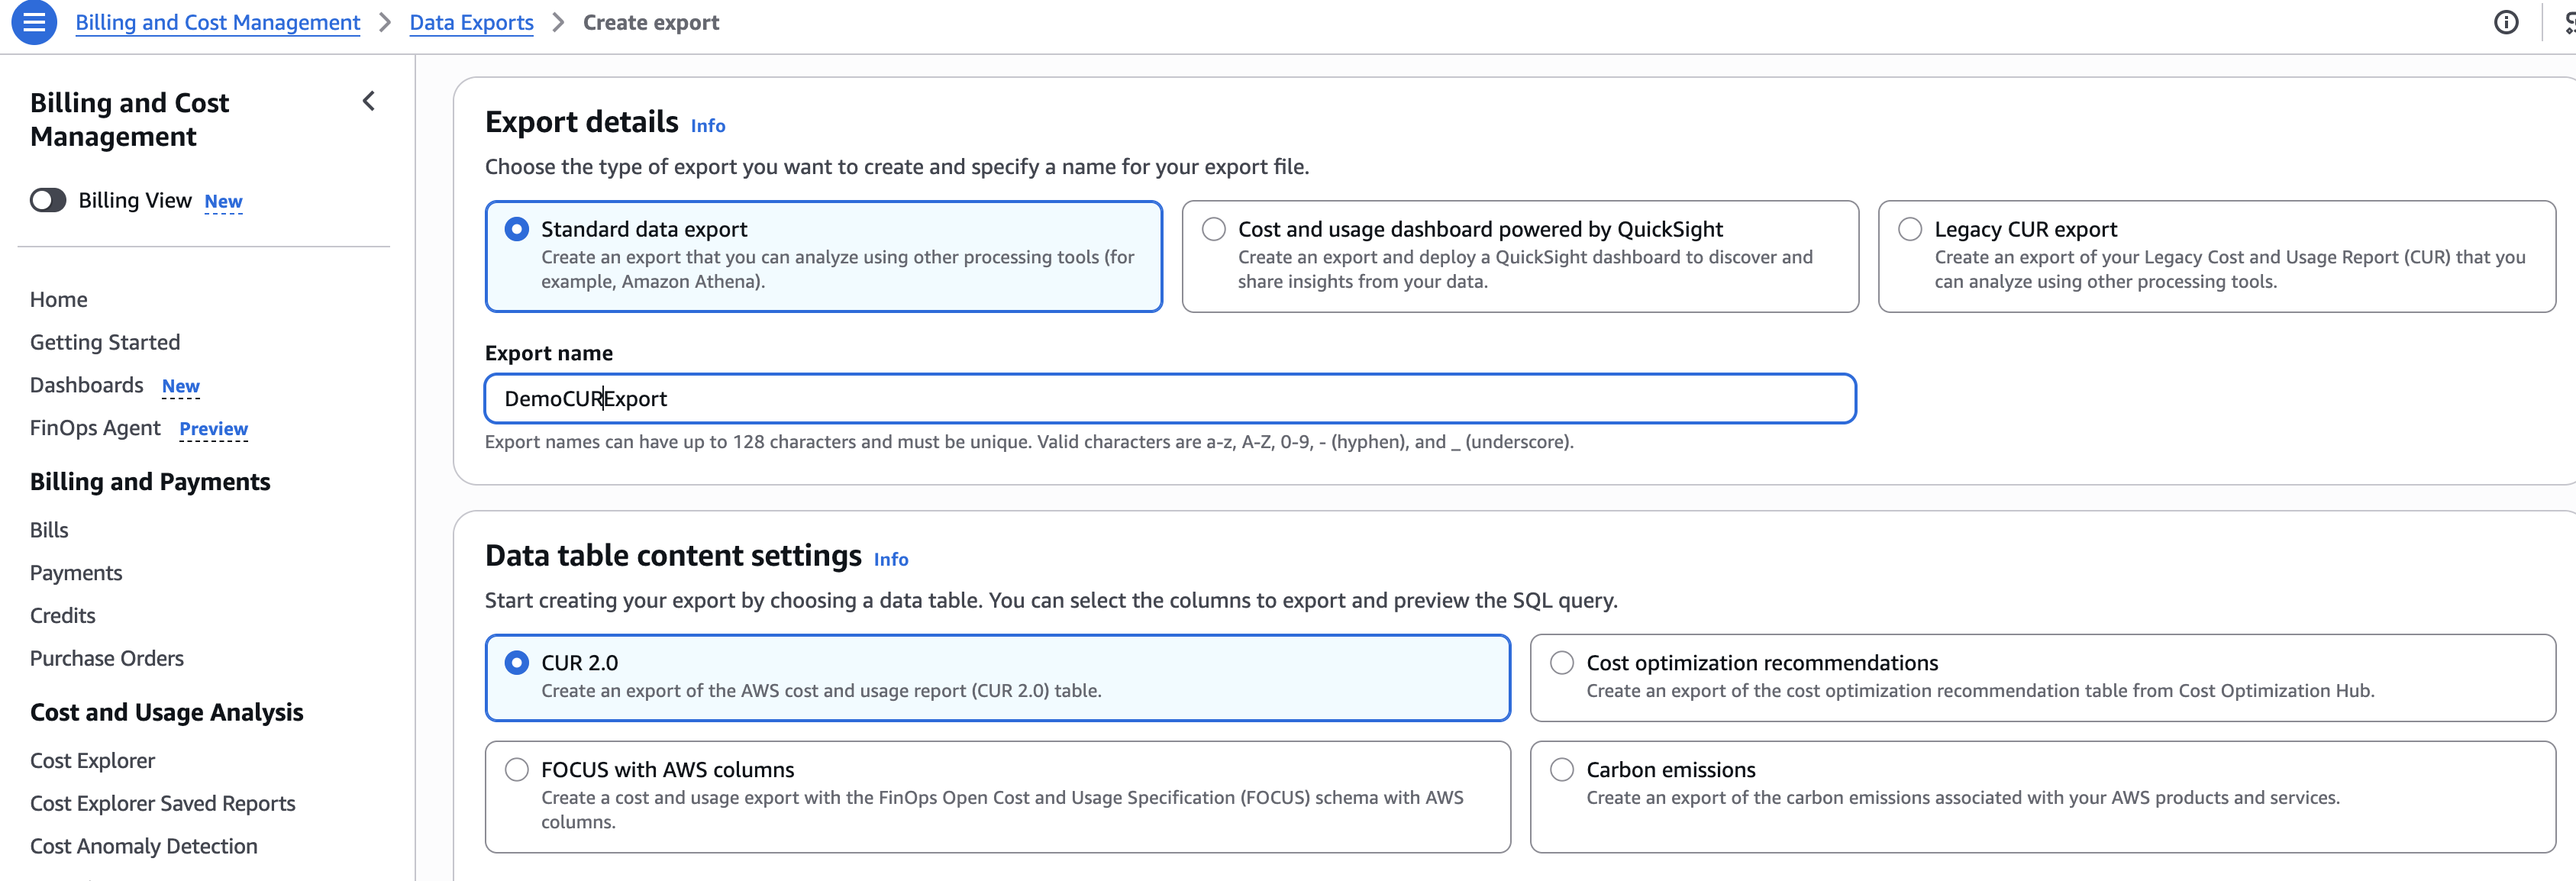
Create a CUR 2.0 export through AWS Data Exports that delivers Parquet files to the CUR S3 bucket created by the stack. The following screenshots show the complete configuration process in the AWS Billing and Cost Management console.
To create the export, follow these steps:
Go to AWS Billing and Cost Management and then choose Data Exports.
Choose Create in the upper right corner of the Exports and dashboards page. The Data Exports console shows any existing exports, their status, export type, data table, and last refresh date.
On the Create export page, under Export details, select Standard data export and enter an export name. Under Data table content settings, select CUR 2.0.
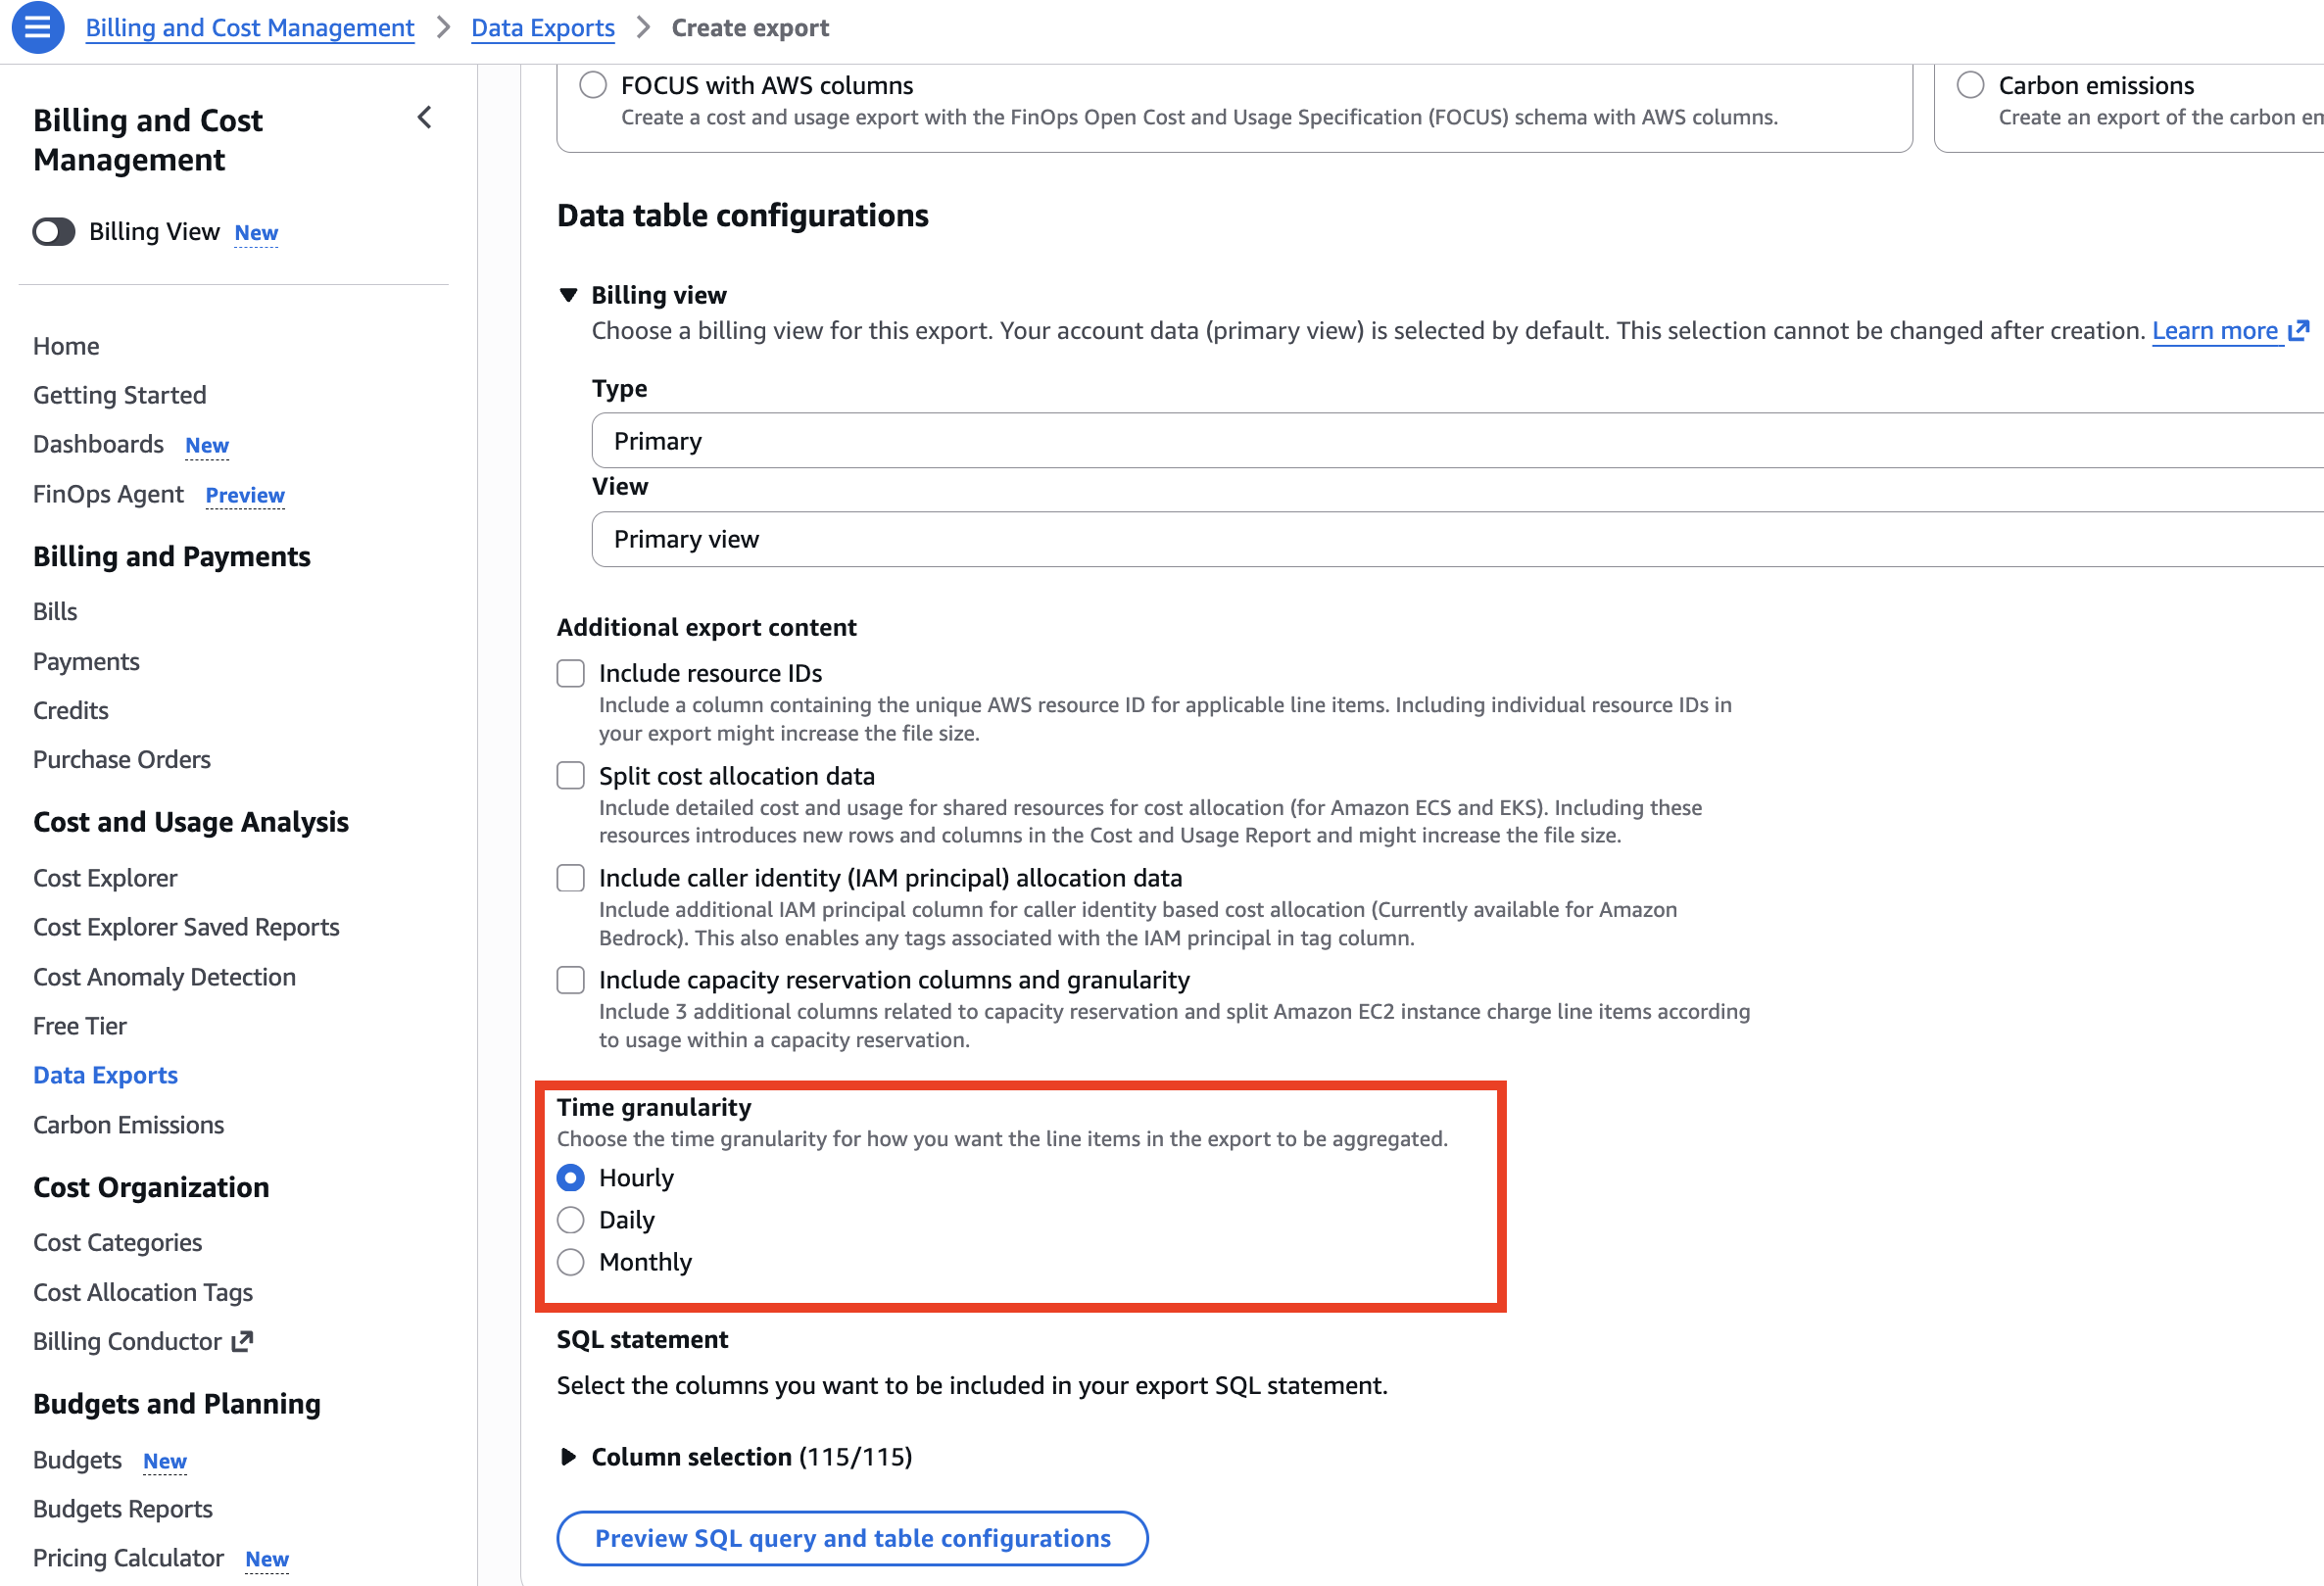
Under Data table configurations, set Time granularity to Hourly. The configuration page also lets you choose additional export content options such as including resource IDs, split cost allocation data, caller identity allocation data, and capacity reservation columns.
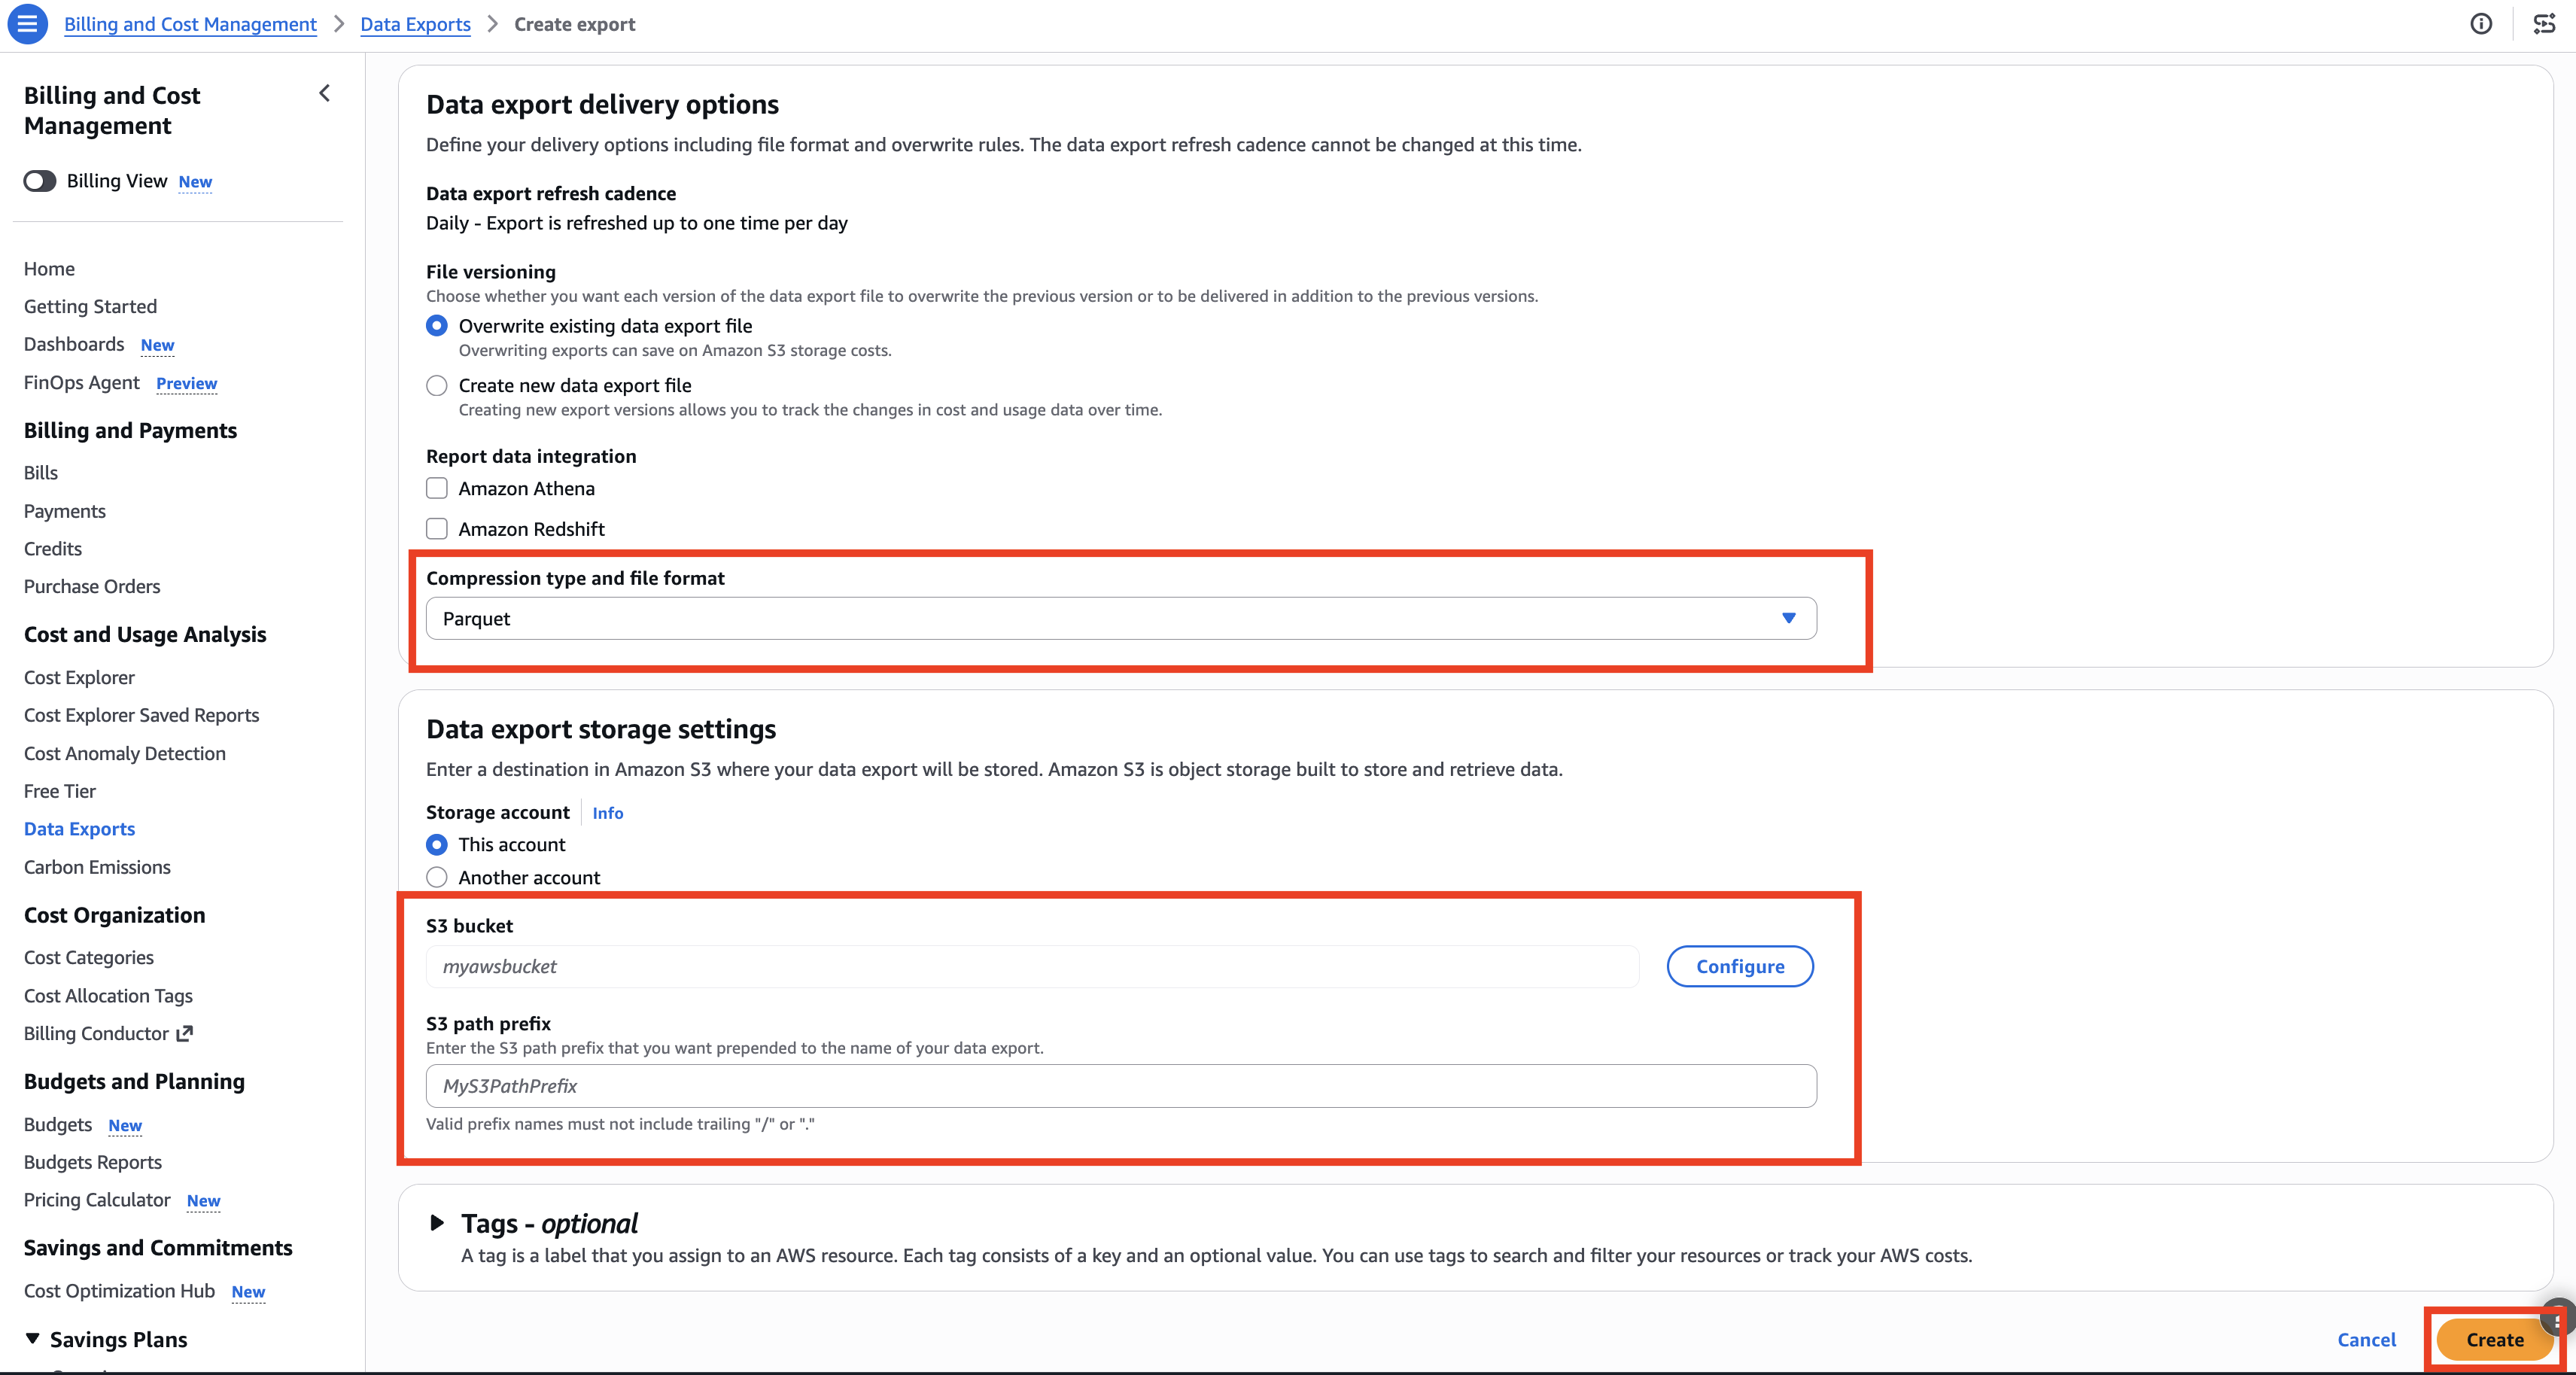
Under Data export delivery options, set Compression type and file format to Parquet. Under Data export storage settings, configure the S3 bucket to: smus-cur-report-{account-id}-{region} and set the S3 path prefix as needed. Choose Create to finish.
Figure 2: Data Exports page listing existing exports
Figure 3: Create export page with Standard data export and CUR 2.0 selected
Figure 4: Data table configurations with time granularity set to Hourly
Figure 5: Data export delivery options with Parquet format and S3 storage settings
Step 5: How the event-driven tag capture works
When a project is created or updated in Amazon SageMaker Unified Studio (through the Studio UI or API), the following happens automatically:
CloudTrail logs the Amazon DataZone API call.
Amazon EventBridge matches the event.
Amazon EventBridge invokes the Lambda function.
The Lambda extracts custom tags from the CloudTrail event payload.
The Lambda writes a record to DynamoDB with the DomainId, ProjectId, and all custom tag key-value pairs.
The Lambda function reads tags directly from the responseElements.resourceTags field of the CloudTrail event rather than making a separate GetProject API call. This avoids a race condition where GetProject might return empty tags while the project is in the UPDATING state.
def _extract_tags_from_event(detail):
    tags = {}
    response_elements = detail.get("responseElements") or {}
    for tag_entry in response_elements.get("resourceTags", []):
        if isinstance(tag_entry, dict) and "key" in tag_entry:
            tags[tag_entry["key"]] = tag_entry["value"]
    request_params = detail.get("requestParameters") or {}
    req_tags = request_params.get("resourceTags", {})
    if isinstance(req_tags, dict):
        tags.update(req_tags)
    return tags
Step 6: How the CUR enrichment works
The AWS Glue ETL job runs on a schedule (after each CUR delivery):
Reads CUR Parquet files from the CUR S3 bucket.
Reads all records from the DynamoDB lookup table.
Performs a left outer join on DomainId and ProjectId.
Appends custom tag columns (CostCenter, Team, Environment, and so on) to each CUR line item.
Writes enriched Parquet to the enriched S3 bucket.
Line items without a matching project in the lookup table retain all original columns with NULL custom tag values. No data is dropped.
Cost by Custom Tag (CostCenter) – horizontal bar chart.
Cost by Project – horizontal bar chart.
Daily Cost Trend – line chart.
Cost by Service per Project – stacked bar chart.
Usage by Project & Service – summary table.
And six interactive list filters: Domain, Project, CostCenter, Team, Environment, Service.
The custom SQL includes a CASE statement for service categorization:
SELECT
  line_item_usage_start_date,
  line_item_product_code,
  line_item_usage_amount,
  line_item_unblended_cost,
  resource_tags_user_amazondatazone_domain_id AS domain_id,
  resource_tags_user_amazondatazone_project AS project_id,
  costcenter, team, environment,
  CASE
    WHEN line_item_product_code = 'AmazonSageMaker' THEN 'SageMaker'
    WHEN line_item_product_code = 'AmazonS3' THEN 'S3'
    WHEN line_item_product_code = 'AWSGlue' THEN 'Glue'
    ELSE line_item_product_code
  END AS service_category
FROM "smus_cost_reporting"."enriched_cur"
WHERE line_item_unblended_cost > 0
Step 8: Verifying the solution
After deploying the infrastructure and setting up the dashboard, verify that each component of the pipeline is functioning correctly.
8.1 Verify Amazon EventBridge is capturing project events
Open the Amazon EventBridge console.
In the navigation pane, choose Rules.
Select the rule created by the CDK stack (for example, SmusCostReporting-ProjectTagRule).
Choose the Monitoring tab.
Confirm that the invocations are being recorded in the metrics.
Create or update an Amazon SageMaker Unified Studio project with custom tags using the following command:
Wait for the next CUR delivery (hourly if configured as described in Step 4).
Wait for the subsequent AWS Glue job execution.
Open the AWS Glue console.
In the navigation pane, choose ETL Jobs.
Confirm the job completed successfully (status: Succeeded).
Query the enriched data in Amazon Athena to confirm custom tag columns are populated:
SELECT
  line_item_usage_start_date,
  line_item_product_code,
  line_item_unblended_cost,
  costcenter,
  team,
  environment
FROM "smus_cost_reporting"."enriched_cur"
WHERE costcenter IS NOT NULL
LIMIT 10;
You should see rows with your custom tag values populated in the costcenter, team, and environment columns.
8.4 Verify the Amazon Quick Sight dashboard displays enriched data
Open the Amazon Quick Sight console and navigate to the dashboard created by the setup script.
Confirm that:
The Cost by Custom Tag (CostCenter) bar chart displays cost data grouped by your CostCenter values.
The list filters for CostCenter, Team, and Environment contain selectable values.
Selecting a filter value correctly narrows the displayed data.
If the dashboard shows no data, verify that:
The AWS Glue Crawler has run after the ETL job (check the crawler’s last run status in the AWS Glue console).
The SPICE dataset has been refreshed. In the Amazon Quick Sight console, navigate to Datasets, select the dataset, and then choose Refresh now.
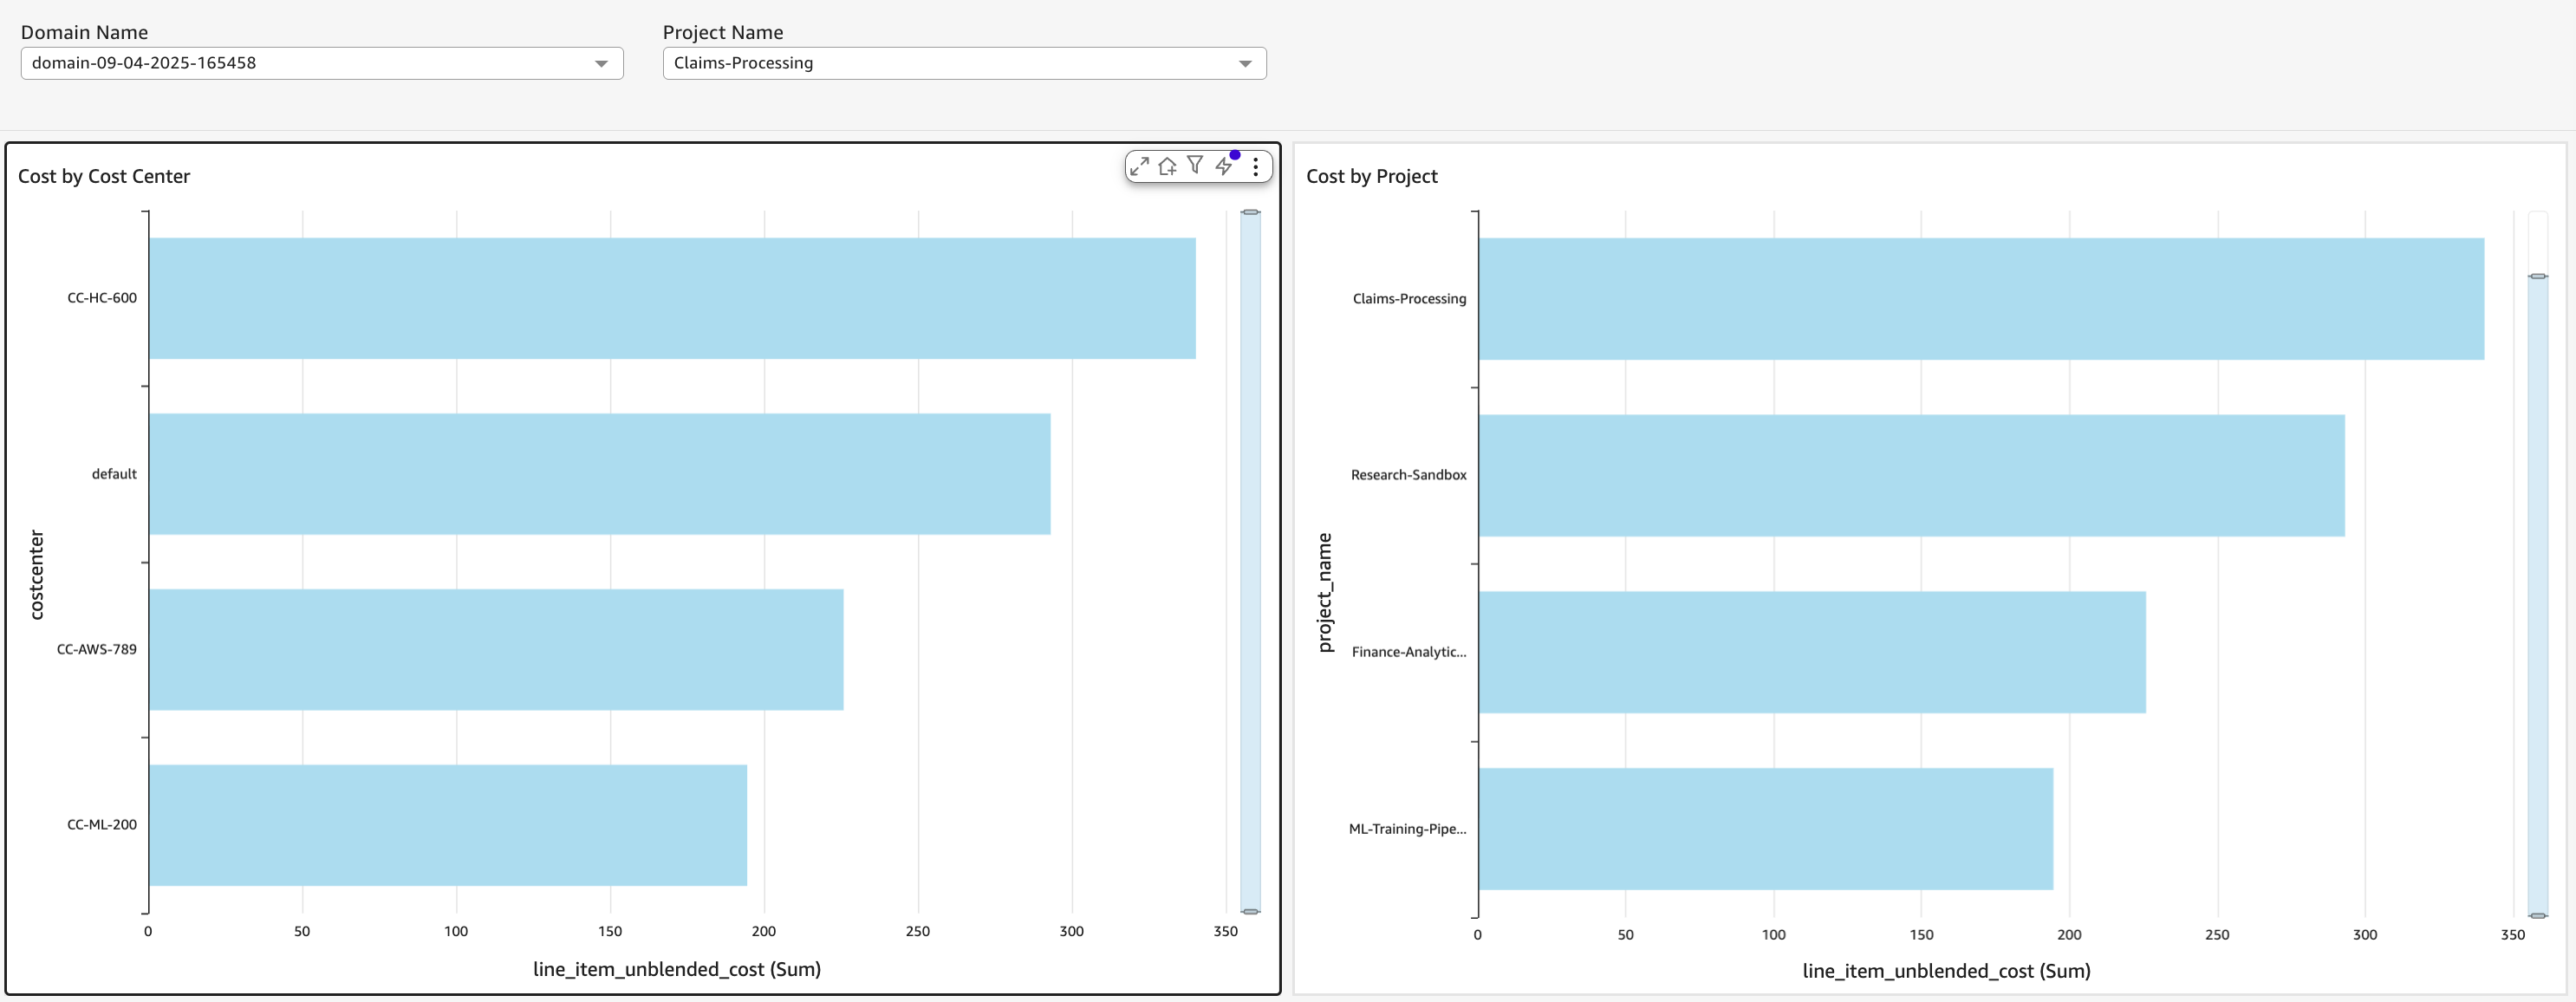
Figure 6 shows the Amazon Quick Sight dashboard with two side-by-side horizontal bar charts: Cost by Cost Center and Cost by Project. Domain Name and Project Name list filters appear at the top.
Figure 6: Amazon Quick Sight dashboard showing cost data by custom tags, including Cost by Cost Center and Cost by Project bar charts with Domain Name and Project Name filters
Note: The first end-to-end cycle can take up to 48 hours depending on CUR delivery timing. After the initial cycle completes, subsequent updates will flow automatically on the configured schedule.
Operational considerations
Monitoring: The Amazon SNS topic smus-cost-reporting-alerts receives notifications when the AWS Glue ETL job fails or the Lambda orchestrator encounters repeated errors. Subscribe an email address or Slack webhook to stay informed. For instructions on how to create a subscription, see Subscribing to an Amazon SNS topic.
Cost: The solution uses serverless components (Lambda, DynamoDB on-demand, AWS Glue, Amazon Quick Sight, SPICE) so you only pay for what you use. The primary cost drivers are AWS Glue ETL job execution time and Amazon Quick Sight SPICE storage.
Scaling: The DynamoDB table uses on-demand capacity and can scale to accommodate your projects. You can scale the AWS Glue ETL job by increasing the number of workers for larger CUR datasets. For more information, see Managing throughput capacity automatically with DynamoDB auto scaling.
New tag keys: When you add new custom tag keys to projects, the ETL automatically picks them up as new columns. The AWS Glue Crawler’s UPDATE_IN_DATABASE policy adds new columns to the catalog table without manual intervention.
Cleanup
Warning: The following cleanup steps will permanently delete all CUR data, project tag mappings, and Amazon Quick Sight dashboards.
In this post, we showed how to build an end-to-end cost reporting solution for Amazon SageMaker Unified Studio projects using custom tags. This solution combines tag capture driven by Amazon EventBridge, CUR enrichment through AWS Glue ETL, and visualization in Amazon Quick Sight. With it, organizations can track and attribute costs by CostCenter, Team, Environment, or any custom dimension. This works even for resources created through the Studio UI that don’t receive custom tag propagation.
This solution serves as an extension to the custom tag propagation feature and reports cost for all project resources. The architecture is fully serverless, automated, and can be deployed to any AWS account using the provided CDK application.
Version 26.08 of
the KDE Gear
collection of applications has been released. Notable changes in this release
include improvements in the signing
features of Okular, improved file-grouping
features in the Dolphin file
manager, and a number of enhancements to the Kdenlive video editor. See the changelog for
a full list of updates, enhancements, and bug fixes.
The Rust blog reports
on a malicious crate, called proc-macro1, that was uploaded to the
crates.io repository.
Furthermore, we discovered that the popular arrayref crate
had recently been republished and made to depend on this crate,
with the most recent versions yanked. We have removed the malicious
version and unyanked the maliciously-yanked versions. Other crates
by that author (internment, append-only-vec) were
also affected so we have done the same for those, and locked the
account as a precaution. We do not believe the author of arrayref to be acting maliciously, but their computer or
credentials are likely compromised, and we are attempting to
contact them.
Version 6.1.0 of the RPM Package Manager has been released. Notable
changes include the ability to provide modifiers to RPM macros at definition
time, improved build and verification error handling, support for signing files
with PKCS11 tokens using rpmsign, as well as
the addition of several new man pages. The 6.1.0 release also debuts a new release model
inspired by the Linux kernel’s.
As of this writing, 2,346 non-merge changesets have been pulled into the
mainline repository for the 7.3 kernel release. That, clearly, is a mere
down payment on the flood that is to come. Even so, those early pulls
brought in some noteworthy changes, including (but not limited to) a
significant reworking of how group scheduling works on multiprocessor
systems.
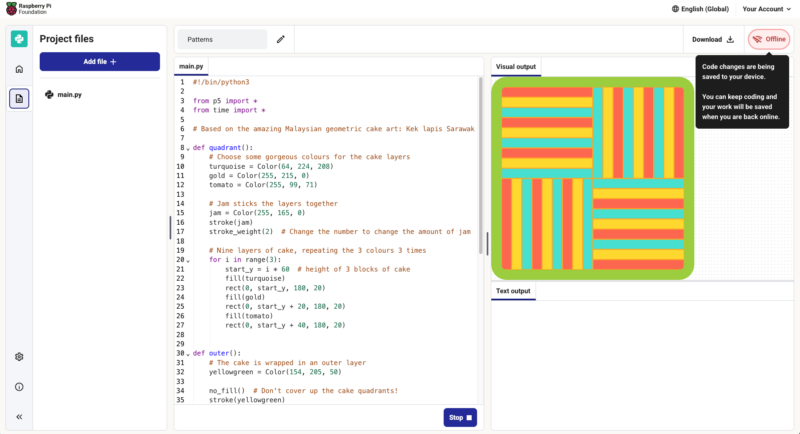
Our free, browser-based Code Editor now keeps working when your internet connection doesn’t. If your connection breaks in the middle of a lesson or a project, you can carry on writing and running your code without disruption, even if the page is reloaded.
Why we built this
An unstable internet connection is a minor annoyance when you’re reading a web page, but it’s a much bigger problem when you’re 20 minutes into creating a program.
Until now, losing your connection while using the Code Editor could mean losing your work: if you refreshed the page at the wrong moment, you might have seen a blank screen or a browser error instead of your program.
Better offline support means the Code Editor can be more useful for learning and teaching.
When we wanted to understand better what learners and educators around the world need from the Code Editor, we carried out research in countries including India, Kenya, and South Africa. One topic we explored was the availability and reliability of internet connections in metropolitan and rural areas. While it was no surprise that internet access is often slow, unreliable, or expensive in rural areas, we learned that issues related to electricity supply, such as load-shedding and brownouts, are also prevalent in metropolitan areas. All this shapes what is realistically possible in a programming activity using an online editor.
And connectivity issues can occur in any school computing lab where 30 learners are all accessing the same WiFi at once, or for a Code Club running off a mobile hotspot in a community centre, or for someone finishing their homework on patchy mobile data.
That’s why it became a priority for us to improve the Code Editor’s offline support by making it resilient to disconnection.
As we describe in our recently shared draft principles for safe and responsible education technology, one of our commitments is to design for diverse needs, abilities, and contexts — including not to assume constant internet connectivity. This Code Editor update is a small, practical piece of that commitment.
What this means for learners and teachers
The Code Editor was built with resilience in mind from the start, for example running code in your browser rather than on a server, and saving your project locally on your device as you go.
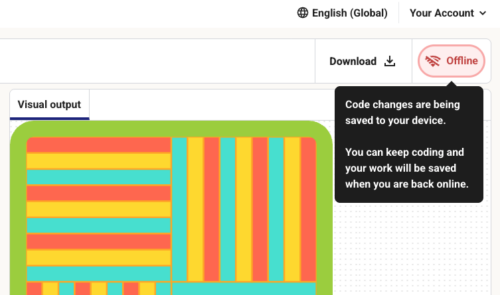
Our recent additions ensure that once you’ve opened the Code Editor while online, your browser holds on to even more of the parts you need to keep coding without a connection. Now if you go offline midway through using the Editor:
You’ll see a clear message in the Editor flagging that you’re offline
A full page refresh won’t result in a connection error or blank screen
If you’re logged in, everything you do in the Editor while offline is saved to your account automatically once you’re back online
You can still download your code using the ‘download’ button, in case you know you’re going to be offline for a while and need to save your program file on your computer or a storage device
A message shows in the Editor when the internet connection is down.
How it works, in brief
This update is built on a service worker, a script your internet browser runs in the background. When you first load the Code Editor, the service worker stores the files the Editor needs in your browser’s cache. If the network connection then breaks, the service worker serves those stored files instead of trying and failing to fetch them. When you come back online, it automatically refreshes the cache so you’re not left running old files.
What is not possible at the moment
The Code Editor isn’t a full offline app that you install. It’s a browser-based app that we have now upgraded to better cope with losing its internet connection, which means:
You need to have loaded the Code Editor at least once while online, in the browser and on the device you’re going to use
When you go offline, you can’t open projects you haven’t already loaded
If you clear your browser data while offline, any changes you’ve made to projects will disappear
You can’t log into or out of your account while offline, and saving to your account pauses until you’re back online
Any feature that needs the network, such as sharing projects with students in Code Classroom, won’t be available until you reconnect
We’ll keep working to extend what parts of the Editor work offline.
Try it and tell us how you get on
The Code Editor works in your browser with no setup and will always be free for educators and learners. We hope this update makes it more useful for people in lots of different settings.
The update is one of those features some people will never notice, which is rather the point: it should feel like nothing went wrong. If your connection is unreliable and you try out the updated Code Editor, we’d love you to tell us whether or not it works well for you.
We would like to thank Cisco for the generous funding that made this work possible.
A usage policy for Flock license plate reader cameras tells police not to talk about the cameras:
When cops use Flock to arrest someone in Wapello County, Iowa, they don’t want them to know. A usage policy for the automated license plate reader cameras in the county tells police, in no uncertain terms, to keep them a secret: “DO NOT MENTION ALPR USAGE TO THE OCCUPANTS OF THE VEHICLE,” the policy document reads. “DO NOT MENTION ALPR USAGE IN YOUR REPORT OR COMPLAINT UNLESS ABSOLUTELY NECESSARY.”
This reminds me of IMSI-catchers (Stingray was the most popular) a couple of decades ago. Police would go to even more extremes to hide their usage.
In this post, you learn how AgentFlo built intelligent sales agents that convert conversations into completed purchases. We show you how AgentFlo improved revenue performance in early deployments using Amazon Bedrock AgentCore and the Strands Agents SDK.
AgentFlo, the agentic commerce service by Salesflo, helps merchants deploy always-on AI sales, support, and ordering agents across channels like WhatsApp. These agents understand intent, connect to commerce systems, recommend products, create carts, and convert conversations into completed transactions. Today, AgentFlo serves eCommerce merchants managing over $300 billion in annual transacted value, according to Salesflo, across services including Shopify, WooCommerce, Magento, and SAP.
This is Part 1 of a two-part series covering the five pillars of production-grade AI agents. Part 1 covers Velocity, Standardization, and Scalability. Part 2 covers Trust, Reliability, and Business results.
The challenge: customer intent without assistance
Cart abandonment hovers around 70% industry-wide, representing trillions in unrealized revenue annually. For merchants operating on messaging platforms like WhatsApp, the gap widens further:
Cart abandonment: Customers abandon carts because a single question goes unanswered.
Generic product discovery: Ranked listings replace recommendations tailored to each customer.
Missed messaging conversations: Inbound chat volume exceeds staffing capacity across time zones and languages.
No personalized guidance: Most merchants can’t afford 1:1 assistance for every interaction.
Limited outbound engagement: Teams lack bandwidth for proactive sales motions.
Peak traffic spikes: Flash sales and seasonal campaigns can spike traffic 10–50x beyond normal capacity.
Rule-based chatbots can’t handle nuanced sales conversations. Human agents can’t scale across geographies, languages, and time zones. Merchants need specialized AI sales agents that understand customer context, run complex workflows, and operate autonomously 24/7.
What makes an agent?
At its simplest, an agent combines a model, instructions, tools, context, and memory. The model reasons over a user’s request. The instructions define the agent’s role and the limits of what it should do. Tools let the agent take action in the real world. Context grounds it in business-specific data. Memory keeps the conversation coherent across turns.
In AgentFlo, those abstract components map to concrete pieces of the platform:
Component
What it does in AgentFlo
Model
Understands user intent and decides what to do next
System prompt / persona
Defines whether the agent behaves like a sales agent, restaurant agent, support agent, or receptionist
Tools
Allow the agent to search products, check inventory, create carts, place orders, raise tickets, or trigger follow-ups
Knowledge
Grounds responses in merchant-specific data such as product catalogs, menus, policies, promotions, and FAQs
Memory / state
Maintains conversation history, cart state, customer preferences, and previous actions
Channels
Connects the agent to WhatsApp, SMS, RCS, web chat, and voice
Guardrails / Policy
Prevents unsafe, unauthorized, or incorrect actions
Observability
Tracks cost, performance, conversions, and conversation quality
Building a demo agent is straightforward. Building one that runs a business safely, repeatably, and at scale requires a different approach. AgentFlo organizes this approach around five pillars.
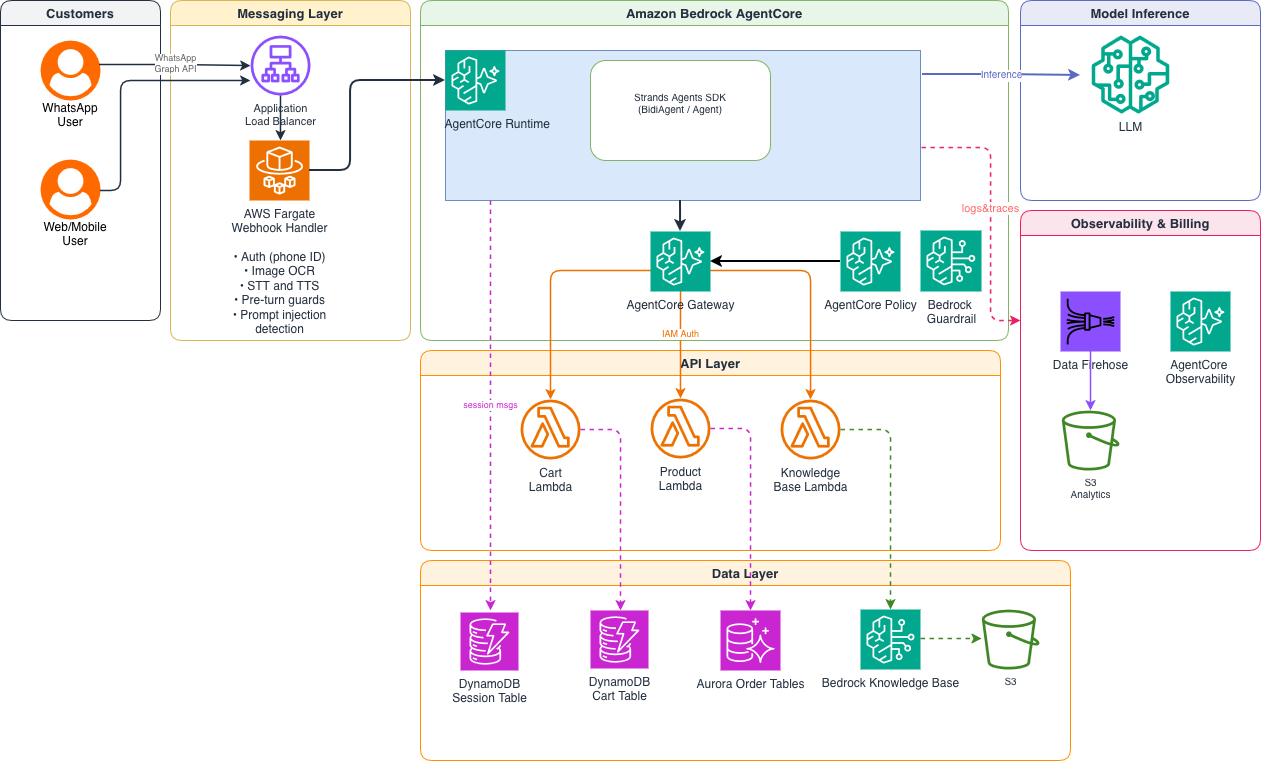
Figure 1: AgentFlo’s production architecture on AWS.
Customer messages arrive through WhatsApp Graph API or web/mobile channels and pass through an Application Load Balancer into the AWS Fargate messaging layer. It handles authentication, image optical character recognition (OCR), speech-to-text/text-to-speech, pre-turn guardrails, and prompt injection detection. Validated requests flow into AgentCore runtime, a capability of Amazon Bedrock AgentCore, where the Strands Agents SDK orchestrates an agent that streams model inference to an external large language model (LLM). AgentCore Gateway, a capability of Amazon Bedrock AgentCore, brokers tool calls, with IAM-based authorization, to an API layer of AWS Lambda functions (Cart, Product, and Knowledge Base). It persists state across a data layer comprising Amazon DynamoDB session and cart tables, Amazon Aurora order tables, and an Amazon Bedrock Knowledge Base backed by Amazon S3. Policy in Amazon Bedrock AgentCore enforces deterministic access control independently of model reasoning. Amazon Bedrock Guardrails can also be embedded in Policy to filter prompt attacks, harmful content, and sensitive information on both requests and responses. On the observability side, logs and traces feed into AgentCore Observability, a capability of Amazon Bedrock AgentCore, while Amazon Data Firehose captures every interaction into Amazon S3 for cost and revenue analytics.
AgentFlo evaluated several hosting options before selecting Amazon Bedrock AgentCore. Three capabilities made the difference:
Stateful sessions for long-running commerce conversations.
Agent runtime: each agent session runs in its own lightweight virtual machine, providing hardware-level security boundaries between tenants.
Native MCP integration: Model Context Protocol (MCP) is an open standard that allows AI agents to connect securely to external data sources and tools through a unified interface. AgentCore Gateway supports MCP natively for standardized tool connectivity.
Pillar 1: Velocity: from merchant idea to live agent in minutes
Speed to market determines whether merchants can capture emerging opportunities. AgentFlo addresses this with a streamlined deployment model.
The challenge
Merchants want to launch agents quickly, but each has unique workflows, tone, tools, languages, products, and business rules. Generic chatbot templates are too shallow. Custom-building each agent doesn’t scale.
Recipe-based deployment
AgentFlo uses a recipe-based agent deployment model. Merchants select from pre-configured recipes, each shipping with persona, language, tone, tool sets, prompt templates, knowledge sources, response packs, and business rules. Available recipes include:
Sales agent.
Restaurant ordering agent.
Clinic receptionist.
Support agent.
B2B reorder agent.
Cart recovery agent.
Merchants fine-tune a few choices in the AgentFlo Portal. The rest is automated.
How it works
AgentFlo chose Strands Agents SDK as its agent framework. Strands Agents SDK uses a model-driven architecture: you define tools as Python functions, write a system prompt, and let the model handle orchestration. No rigid workflow graphs or hand-coded state machines.
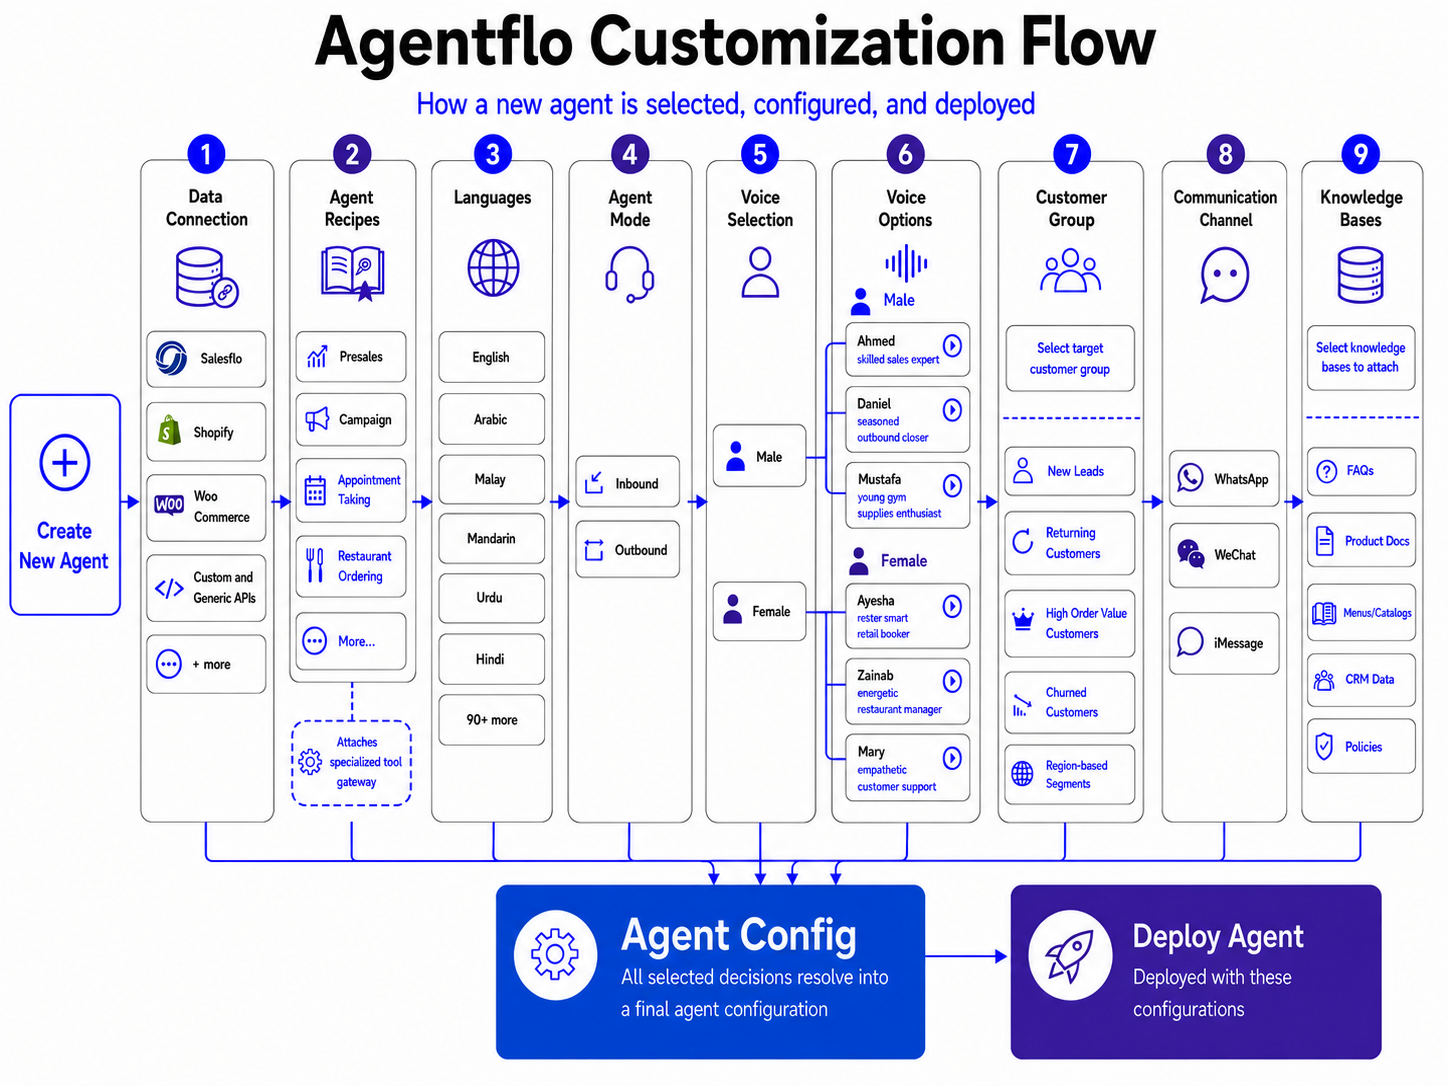
From the merchant’s perspective, agent creation is entirely no-code. Here’s an example of the agent customization flow:
Figure 2: Agent customization workflow
This approach makes the recipe model work. Adding a new capability (like loyalty program enrollment) means writing a new tool function and updating the system prompt. No orchestration layer rewiring is needed.
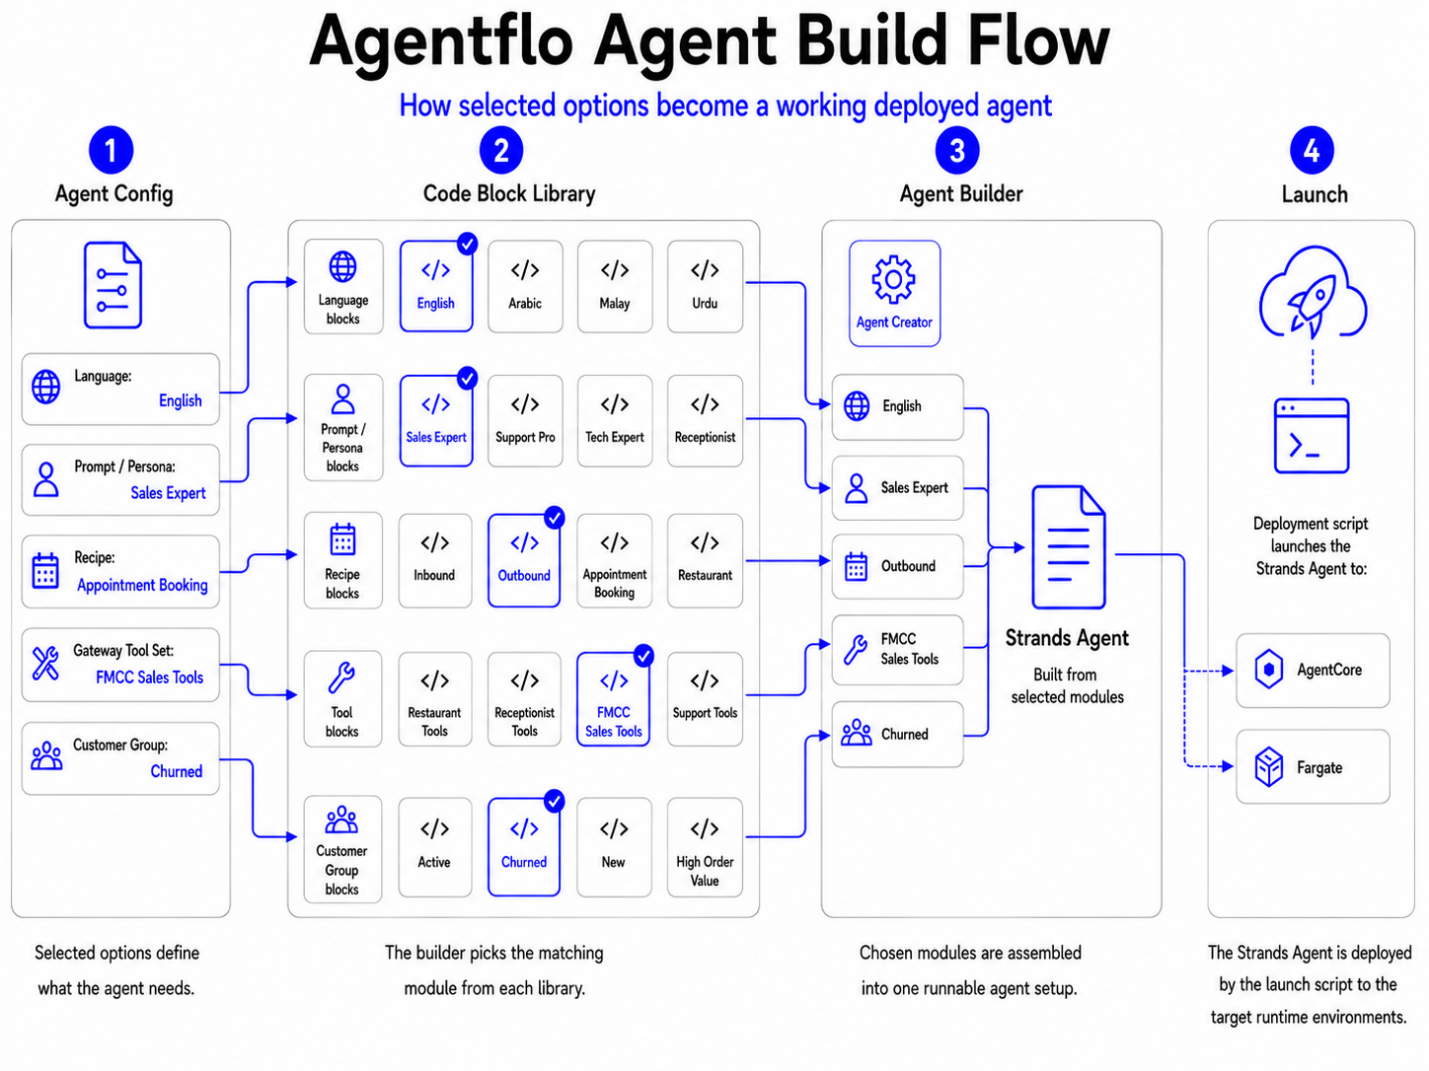
Behind the scenes, one selection triggers an automated pipeline:
The portal generates a Strands agent configuration from the recipe template.
GitHub Actions packages the agent (tools, prompts, context) into a container.
The container deploys to AgentCore runtime with appropriate Gateway policies.
The agent goes live on WhatsApp within minutes.
Figure 3: How to build a customized agent under hook workflow
Each agent is a Strands Agent instance with tool definitions mapped to AgentCore Gateway endpoints. Extending an agent’s capabilities is a code change, not an architectural one.
Results
This recipe-based approach delivers faster merchant onboarding, rapid experimentation with new agent behaviors, and quick addition of new capabilities platform-wide. It also means lower engineering effort per deployment and a tighter feedback loop between customer conversations and product iteration.
Pillar 2: Standardization: reusable recipes, tools, and commerce workflows
Consistency across deployments speeds iteration and reduces maintenance burden. AgentFlo achieves this through shared building blocks.
The challenge
As AgentFlo expanded across industries, fragmentation threatened to slow the team down. Every merchant has unique catalog structures, ERP setups, system configurations (Shopify, WooCommerce, Magento), pricing rules, languages, promotions, and support processes. Without standardization, every deployment becomes a custom project, and custom projects don’t scale to hundreds of merchants.
Repeatable building blocks
AgentFlo standardizes around several core components: agent recipes (domain-specific templates), a tool marketplace (reusable capabilities), MCP-based connectors (standardized integrations), integration contracts (consistent interfaces). Additional components include prompt and context packs (reusable templates), conversation review loops (continuous improvement), and a shared semantic layer (unified product understanding). Merchant-specific complexity is pushed to the system edges. The core remains consistent.
Single-agent architecture with domain expertise
We learned early on that a single agent with domain-specific knowledge and a curated tool set outperforms multi-agent architectures for most customer interactions. Each AgentFlo deployment configures a distinct persona, voice, language, and specialized tool set tailored to the business domain (sales agent, restaurant agent, clinic receptionist). It ships with curated contexts, prompt templates, and response packs. Merchants deploy these domain-specific agents through the self-service portal.
A single focused agent maintaining unified context converts better than multiple generalists coordinating with each other. Multi-agent capabilities remain available where valuable. For example, when conversations transition from sales to support, context hands off cleanly to the specialist agent.
Tool routing through AgentCore Gateway
Centralized tool management routes agent requests to dedicated AWS Lambda functions. When a customer asks about product availability, the agent queries the product catalog. When they’re ready to buy, it handles cart operations. For personalized recommendations, it retrieves data from Amazon Bedrock Knowledge Bases, the fully managed Retrieval Augmented Generation (RAG) capability, backed by merchant data stored in Amazon S3. Sales intelligence APIs provide additional context for each interaction.
OAuth tokens and platform credentials live in the Gateway, not in agent sessions. Policy in AgentCore sits alongside the Gateway, enforcing fine-grained, Cedar-based access control rules that operate independently of model reasoning. Cedar is an open-source policy language developed by AWS that allows fine-grained, verifiable authorization decisions.
Policies define which agent sessions can invoke which tools. For example, a sales agent can’t call customer-support-only APIs.
For standardization, this means every new tool added to the platform (payment integration, shipping provider, loyalty system) becomes available to every applicable recipe through the same mechanism. Tools aren’t re-implemented per merchant.
AgentCore Gateway as the integration backbone
AgentFlo integrates with dozens of eCommerce services: Shopify, WooCommerce, Magento, SAP, payment processors, shipping providers, and loyalty systems. Each integration is defined as an MCP server connector, with Gateway handling discovery, authentication, and routing. Furthermore, AgentFlo has many different agent recipes, each with their own specialized tool packs to provide that functionality. To make these connections modular and efficient, AgentFlo uses AgentCore Gateway.
From the agent’s perspective, the full Gateway tool surface is reachable in a few lines:
from strands import Agent
from strands.models import BedrockModel
from strands.tools.mcp.mcp_client import MCPClient
from mcp.client.streamable_http import streamablehttp_client

def create_transport():
    return streamablehttp_client(
        GATEWAY_URL,
        headers={"Authorization": f"Bearer {access_token}"},
    )

mcp_client = MCPClient(create_transport)

with mcp_client:
    # Discover every tool registered on the Gateway in one call.
    # cart, product catalog, knowledge base, shipping, loyalty, etc.
    tools = mcp_client.list_tools_sync()

    agent = Agent(
        model=BedrockModel(model_id="us.anthropic.claude-sonnet-5-20260630"),
        tools=tools,
        system_prompt=SALES_AGENT_PROMPT,
    )

    response = agent("Do you have the red leather wallet in stock?")
Connecting a Strands agent to AgentCore Gateway. A single list_tools_sync() call gives the agent every integration registered on the Gateway: cart, product catalog, knowledge base, shipping, loyalty. Onboarding a new service for a merchant is a Gateway change, not an agent change.
Key capabilities:
MCP-native tool connectivity: Each platform or tool set integration is a standard MCP server connector.
OAuth and credential management: Platform API keys and OAuth tokens are managed centrally in Gateway, never exposed to individual agent sessions.
Code simplicity: The code is cleaner, shorter, and more modular, which simplifies configuration for scale. The alternative is extensive local code for each connection or tool set.
Because each new service integration and recipe-specific tool set is defined as an MCP server connector in AgentCore Gateway, expansion is modular and quick. Adding a new service or tool set requires a connector definition, not a re-architecture.
Conversation reviews as a standardization loop
Standardization also comes from learning. AgentFlo continuously reviews real conversations to understand how customers ask for products, where they drop off, which recommendations convert, when handoff is needed, and how local language affects buying behavior.
These reviews feed back into recipes, prompts, and tool definitions. Standardization is something the platform earns over time, not something declared at launch.
Results
Every deployment improves future deployments, and new integrations become reusable across the merchant base. Agent behavior stays consistent across recipes and merchants, and workflows become repeatable across industries. The service becomes harder to replicate because it learns from real commerce behavior, not generic templates.
Commerce conversations are unpredictable in volume and duration. AgentFlo’s architecture handles both dimensions without manual intervention.
The challenge
During flash sales, product launches, or restaurant rush hours, customer conversations can spike 10–50x. Human teams can’t scale that fast. AgentFlo must also support many merchants and concurrent customer sessions simultaneously. One merchant’s surge can’t affect another’s experience.
AgentFlo’s serverless architecture
AgentFlo uses a serverless architecture. Message ingestion, agent execution, tool execution, state, analytics, and billing each scale independently. Each layer absorbs its own spikes without requiring the rest of the system to over-provision.
AgentCore runtime properties for scale
Several AgentCore runtime properties specifically support scale:
Isolated microVM execution: Each agent session runs in its own environment with dedicated CPU, memory, and filesystem. The environment is sanitized on termination. One merchant’s sessions never interfere with another’s.
Stateful sessions up to eight hours: Long-running conversations don’t lose context. A customer browsing in the morning can continue the same assisted session that evening.
Framework-agnostic: AgentCore runs Strands Agents natively but also supports any containerized agent framework, giving AgentFlo flexibility to evolve the agent architecture over time.
How it works
The architecture is built end-to-end on AWS:
Messaging layer (AWS Fargate): An Application Load Balancer routes incoming WhatsApp messages to a Fargate application that handles authentication, voice message conversion (Opus OGG to MP3 transcription with fuzzy matching for product name recognition). The application also runs pre-turn security guards. AWS End User Messaging provides an alternative channel option for broader reach.
Agent orchestration (Amazon Bedrock AgentCore runtime): Each customer session spawns an isolated agent instance running the Strands Agents SDK. Sessions are stateful for up to eight hours and isolated through microVM architecture, where each session runs in its own lightweight virtual machine. They are persistent, with filesystem access for intermediate results and cached product catalogs. microVM isolation keeps merchants completely separated.
This is the entire bridge between Strands SDK agent code and a production-ready endpoint on AWS:
from strands import Agent
from bedrock_agentcore.runtime import BedrockAgentCoreApp

app = BedrockAgentCoreApp()

agent = Agent(
    tools=tools,  # from the Gateway, per snippet above
    system_prompt=SALES_AGENT_PROMPT,
)

@app.entrypoint
def invoke(payload, context):
    """One AgentCore session per customer conversation."""
    user_message = payload.get("prompt")
    session_id = getattr(context, "session_id", None)  # stable for up to 8 hours
    result = agent(user_message)
    return {"result": result.message}

if __name__ == "__main__":
    app.run()
This is all the glue between a Strands agent and AgentCore Runtime. BedrockAgentCoreApp wraps the agent in the standard /invocations contract, and AgentCore handles microVM provisioning, session isolation, scaling, and stateful sessions up to eight hours. Two CLI commands take it from a local file to a live endpoint on AWS. No Dockerfile, no API routing, no web framework to maintain.
Tool execution (Amazon Bedrock AgentCore Gateway): Tool calls scale separately from agent reasoning, so a sudden burst of cart operations doesn’t slow down the agent loop itself.
Results
The architecture handles peak traffic without pre-provisioning capacity and supports long-running conversations that survive across visits. It provides strong multi-merchant isolation with lower operational overhead than traditional always-on infrastructure, resulting in a better customer experience during high-intent moments like product launches or flash sales.
What’s next
In Part 2 of this series, we explore:
Pillar 4: Trust. Guardrails for autonomous commercial action and real-time visibility into agent operations.
Pillar 5: Reliable. Data foundation that ensures agents act on reliable, up-to-date information to complete tasks with precision.
Business results: Measurable impact across the customer lifecycle.
Future roadmap: Voice agents, server-side tool execution, and integration expansion.
Summary
In this post, we explored three of the five pillars for building production-grade AI agents:
Velocity: How recipe-based deployment allows merchants to launch AI sales agents in minutes using the model-driven architecture of the Strands Agents SDK.
Standardization: How reusable building blocks and centralized tool management through Amazon Bedrock AgentCore create consistency across hundreds of deployments.
Scalability: How AgentFlo handles elastic, stateful commerce conversations at scale through Amazon Bedrock AgentCore and AWS Fargate.
Amazon SageMaker Unified Studio is a single data and AI development environment that brings together data preparation, analytics, and machine learning (ML) development in one place. By unifying these workflows, it saves teams from managing multiple tools and makes it straightforward for data scientists, analysts, and developers to build, train, and deploy ML models while collaborating. In Amazon SageMaker Unified Studio, a domain is the organizing entity for connecting your assets, users, and their projects. With Amazon SageMaker unified domains, you have the flexibility to reflect the data and analytics needs of your organizational structure. You can create a single unified domain for your enterprise or multiple domains for different business units.
Some enterprises, especially those in regulated industries, might require limiting access to trusted networks (such as VPN CIDRs) or to managed devices that meet compliance standards through device attestation.
In this post, we demonstrate how to integrate SageMaker Unified Studio as a custom SAML application and apply conditional access policies for enforcing device compliance, IP-based restrictions, or multi-factor authentication (MFA). For this post, we use Okta as the identity provider (IdP).
Solution overview
This solution demonstrates how to integrate Amazon SageMaker Unified Studio (SMUS) with external SAML identity providers such as Okta. The integration enforces enterprise security controls, including trusted network access, device compliance, and multi-factor authentication. With this integration, organizations in regulated industries can maintain strict access controls while providing single sign-on for their data science and AI development teams. By using SAML 2.0 federation with conditional access policies, you can help make sure that only authenticated users on compliant devices from trusted networks gain access. This access applies to your SageMaker Unified Studio domains and the associated data and AI workloads.
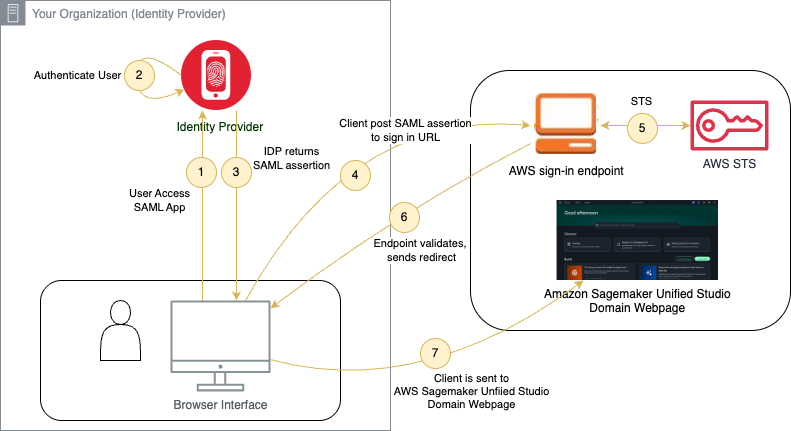
Authentication flow for accessing SageMaker Unified Studio through SAML
The architecture diagram illustrates the secure authentication flow for accessing SageMaker Unified Studio through SAML integration:
Users typically initiate access from corporate-managed devices through VPN or trusted network connections.
The IdP authenticates the user and evaluates conditional access policies defined by your organization. Based on these policies, it checks for trusted devices, approved source IP ranges, and MFA completion. If any policy fails, the login is rejected. Otherwise, authentication proceeds.
Upon successful authentication and policy validation, the IdP generates a digitally signed SAML assertion containing user attributes and group memberships, securely delivering it to the user’s browser through HTTP POST binding.
The client browser automatically posts the SAML assertion to the AWS Security Token Service (AWS STS) sign-in endpoint. There, the AWS IAM Identity Provider validates the trust relationship with your corporate IdP through pre-configured SAML federation settings.
AWS STS validates the SAML assertion signature and authenticity. It then maps the user attributes to a specifically configured IAM role with SageMaker Unified Studio permissions, including the datazone:GetIamPortalLoginUrl permission required for domain access.
AWS STS confirms successful role assumption and generates temporary AWS credentials with a defined session duration. It then issues an HTTP redirect that returns the browser to the SageMaker Unified Studio domain with authenticated session tokens.
Users gain access to the unified environment for data preparation, analytics, and machine learning development. All activities are governed by the assumed IAM role permissions and logged for comprehensive audit trails.
Walkthrough
In this walkthrough, you create a SAML application in Okta, connect it to AWS, and configure a SageMaker Unified Studio domain to use it for authentication.
Prerequisites
Before you get started, make sure you have the following:
Familiarity with Amazon SageMaker Unified Studio.
A basic understanding of SAML 2.0.
AWS Identity and Access Management (IAM) permissions to create a domain in Amazon SageMaker Unified Studio.
Access to your SAML IdP (such as Okta or Entra ID) to create and configure a SAML application.
Step 1: Create an application in Okta
The first step is to set up a new SAML application in Okta that manages authentication for SMUS.
In Okta, go to Applications → Create App Integration, and choose SAML 2.0.
Provide an App name.
Set the Single sign-on URL to https://signin.aws.amazon.com/saml.
Set Name ID format to Persistent.
Set the Audience URI (SP Entity ID) to https://signin.aws.amazon.com/saml.
Choose Next, and finish creating the application.
Once created, copy the Metadata URL and Sign On URL. You need these in later steps.
Step 2: Create an identity provider in IAM
Now, let’s connect Okta to AWS by creating an IAM identity provider. This allows AWS to trust authentication responses from Okta.
Replace <REGION>, <ACCOUNT-ID>, and <DOMAIN-ID> with the corresponding values from your SageMaker Unified Studio domain ARN (arn:aws:sagemaker:<REGION>:<ACCOUNT-ID>:domain/<DOMAIN-ID>). You can find the domain ARN in the SageMaker console under Domains.
Step 4: Configure SAML assertions
To make sure AWS understands who is signing in, configure the SAML assertions in Okta.
Finally, let’s set up the SMUS domain and tie it all together.
Note: Creating a SageMaker Unified Studio domain incurs charges. For pricing details, see the Amazon SageMaker pricing page.
Open the Amazon SageMaker console.
Choose Create domain.
Choose Manual setup (this allows for SAML integration).
Enter a domain name, then choose Create.
In Configure SSO user access, select SAML, then choose Next.
Set the IdP SSO URL to the Sign On URL from Step 1.
Select Do not require assignments. (Access is instead managed by your IdP team through Okta or Entra.)
Choose Next, then choose Save.
To verify the integration works, open your SMUS domain and choose Sign in with SSO. You are redirected to Okta, and conditional access policies such as VPN, device attestation, or MFA apply automatically.
Open your SMUS domain URL in a browser.
Choose Sign in with SSO.
Confirm that you are redirected to Okta for authentication.
Sign in with your Okta credentials.
Verify that you are redirected back to the SMUS domain with access to your projects.
Step 6: Assign users to the Okta application
Before users can authenticate through Okta to access SMUS, you must assign them to the application.
In Okta, navigate to your SAML application.
Go to the Assignments tab.
Choose Assign, and select Assign to People or Assign to Groups.
Select the users or groups who need access to SMUS.
Choose Save and Go Back, then choose Done.
Step 7: Apply conditional access policies
Up to Step 5, we configured SMUS with an external SAML IdP. At this point, anyone assigned to the new application in your IdP can sign in and access the SMUS domain.
This is where conditional access policies come into play. Based on your organization’s governance model, you can add policies in your IdP to further control how and when users gain access. For example:
Restricting access to specific corporate IP address ranges (for example, only through VPN).
Enforcing device compliance so that only managed or secure devices can connect.
Adding MFA requirements for sensitive actions.
Applying device attestation to help assess whether the endpoint conforms to security baselines.
Most major IdPs, including Okta and Entra ID, support conditional access. You can find more details in their documentation:
These policies allow you to enforce the right level of protection, from something as simple as requiring users to connect through corporate networks to something as advanced as verifying device attestation across your fleet.
Clean up
To avoid incurring ongoing charges, delete the resources you created during this walkthrough:
Delete the Amazon SageMaker Unified Studio domain from the SageMaker console.
Delete the IAM role you created for Okta.
Delete the IAM identity provider.
Delete the SAML application in Okta.
Important: Deleting the SMUS domain permanently removes all projects, assets, and data within it. Back up any important work before proceeding.
Conclusion
By integrating SMUS with an external IdP through SAML, you can help enforce modern access controls based on your organization’s security requirements. This post walked through how to configure SMUS with a custom SAML application and pointed you toward resources for setting up conditional access policies.
With conditional access in place, you can decide, based on your organization’s needs, whether access should be limited to trusted users on trusted networks, trusted devices, or both. This approach can help provide a more secure and compliant login experience that aligns SMUS access with your company’s broader identity and security strategy.
To provide the best experiences, we use technologies like cookies to store and/or access device information. Consenting to these technologies will allow us to process data such as browsing behavior or unique IDs on this site. Not consenting or withdrawing consent, may adversely affect certain features and functions.
Functional
Always active
The technical storage or access is strictly necessary for the legitimate purpose of enabling the use of a specific service explicitly requested by the subscriber or user, or for the sole purpose of carrying out the transmission of a communication over an electronic communications network.
Preferences
The technical storage or access is necessary for the legitimate purpose of storing preferences that are not requested by the subscriber or user.
Statistics
The technical storage or access that is used exclusively for statistical purposes.The technical storage or access that is used exclusively for anonymous statistical purposes. Without a subpoena, voluntary compliance on the part of your Internet Service Provider, or additional records from a third party, information stored or retrieved for this purpose alone cannot usually be used to identify you.
Marketing
The technical storage or access is required to create user profiles to send advertising, or to track the user on a website or across several websites for similar marketing purposes.